structure, fluidity and phase behavior of supported lipid ... · pdf filemoleku¨len und...
TRANSCRIPT

Structure, Fluidity and Phase Behavior
of Supported Lipid Membranes:
An Investigation by X-ray Reflectivity and
Fluorescence Microscopy
Christian Reich
Department für Physik
Ludwig-Maximilians-Universität
München, Mai 2007

Structure, Fluidity and Phase Behavior
of Supported Lipid Membranes:
An Investigation by X-ray Reflectivity and
Fluorescence Microscopy
Dissertation
der Fakultät für Physik
der Ludwig-Maximilians-Universität
vorgelegt von
Christian Reich
aus Kronstadt in Siebenbürgen / Rumänien
München, 29. Mai 2007

LUDWIG-MAXIMILIANS-UNIVERSITÄT MÜNCHEN
Erstgutachter: Prof. Dr. Joachim O. Rädler
Zweitgutachter: Prof. Dr. Thomas Bein
Tag der mündlichen Prüfung: 31. Juli 2007

Contents
Zusammenfassung iii
Summary vii
1 Introduction 1
2 A microfluidic setup for studies of solid-liquid interfaces using X-rayreflectivity and fluorescence microscopy 52.1 X-ray reflectivity . . . . . . . . . . . . . . . . . . . . . . . . . . . 62.2 Fluorescence microscopy at the synchrotron . . . . . . . . . . . . . 102.3 Quantitative fluorescence microscopy: Continuous bleaching . . . . 112.4 Membrane preparation . . . . . . . . . . . . . . . . . . . . . . . . 13
3 Supported lipid membranes on polymer substrates 173.1 Lipid membranes on a thermoplastic substrate . . . . . . . . . . . 183.2 Lipid membranes on dielectric polymer multilayers . . . . . . . . . 21
4 Structure and dynamics of crystalline protein layers bound to sup-ported lipid bilayers 25
5 Condensation, stretching and asymmetry: GM1 and cholesterol insingle supported lipid bilayers 31
A Publications 39A.1 Full text of Ref. [1] . . . . . . . . . . . . . . . . . . . . . . . . . 39A.2 Full text of Ref. [2] . . . . . . . . . . . . . . . . . . . . . . . . . 49A.3 Full text of Ref. [3] . . . . . . . . . . . . . . . . . . . . . . . . . 59A.4 Full text of Ref. [4] . . . . . . . . . . . . . . . . . . . . . . . . . 67A.5 Full text of Ref. [5] . . . . . . . . . . . . . . . . . . . . . . . . . 77
B Continuous bleaching: Data evaluation and program description 109
Bibliography 115

ii Inhaltsverzeichnis

Zusammenfassung iii
Zusammenfassung
Die Zellmembranen von Saugetieren haben eine hochgradig heterogene Struk-tur und bestehen aus einer Vielzahl von Lipidmolekulen und Proteinen, die inder zellularen Lipiddoppelschicht angeordnet sind. Ein Verstandnis von Mem-branprozessen, wie z.B. Lipid-Protein Wechselwirkungen, erfordert einen Einblickin die molekulare Struktur der Zellmembran. Solche Angstrøm-Auflosung wirdermoglicht durch Rontgenstreutechniken, die auf die Elektronendichteverteilungin Makromolekulen sensitiv sind. Modell-Lipidmembranen imitieren die Zusam-mensetzung von naturlichen Zellmembranen und werden fur Forschungszwecke be-nutzt. Eine besondere Klasse von biomimetischen Lipidmembranen sind substrat-gestutzte Lipiddoppelschichten, die mit oberflachensensitiver Rontgenreflektivitatstudiert werden konnen. Hochgradig brilliante Rontgenstrahlen von modernen Syn-chrotronquellen ermoglichen detaillierte Strukturuntersuchungen auf Angstrøm-Skala von Lipiddoppelschichten an fest-flussig Grenzflachen.Fur diese Doktorarbeit wurde ein neuartiger Aufbau zur Studie von einzelnenbiomimetischen Lipidmembranen an fest-flussig Grenzflachen anhand von Reflek-tivitat mit Rontgenstrahlen entwickelt. Der Aufbau ist ausserdem fur quantitativeFluoreszenzmikroskopie ausgerichtet und erlaubt es, die Strukturforschungen mitMikroskopiestudien zur Lipiddynamik in der Lipiddoppelschicht zu komplettieren.Dieses Konzept wendet zwei experimentelle Charakterisierungstechniquen auf eineeinzelne Probe an und erlaubt einen ganzheitlichen Blick auf die biophysikalis-chen Eigenschaften von biomimetischen Lipidmembranen, wie molekulare Struk-tur, Lipidfluiditat und Phasenzustand der Lipiddoppelschicht.Zunachst wurden Lipiddoppelschichten auf verschiedenen Substraten charakter-isiert, um die Eignung solcher Membran-Grenzflachen-Systeme fur biologische undbiotechnologische Anwendungen bewerten zu konnen. Die Oberflachenchemieeines zugrundeliegenden Substrats kann die strukturellen und dynamischen Eigen-schaften einer Lipidmembran betrachtlich beeinflussen. Die Materialeigenschaftendes thermoplastischen Kunststoffs 2-norbornene ethylene (Topas), wie optischeTransparenz, hohe chemische Bestandigkeit und Moglichkeiten fur laterale Struk-turierung, machen diese Verbindung zu einem interessanten Substrat fur Lipid-membranen. Lipiddoppelschichten auf Topas zeigten eine hohe Homogenitat, aberauch eine reduzierte Lipidfluiditat (∼50 %) im Vergleich zu Lipiddoppelschichtenauf hydrophilem Siliziumoxid. Auf Topas wurde eine um 20 % reduzierte Dop-pelschichtdicke gemessen, welche auf eine Doppelschichtkonformation mit en-tweder aufgewickelten oder ineinander verflochtenen Alkylketten zuruckgefuhrtwerden kann. Eine weitere Vorlage fur biosensorische Anwendungen sind Mul-tischichten aus Polyelektrolyten, welche als Dielektrikum zwischen Lipidmembra-nen und Halbleitersubstraten fungieren konnen, wie z.B. silicon-on-insulator Bau-gruppen (SOI). Homogene Lipiddoppelschichten auf alternierenden Polyanion- undPolykation Schichten wurden untersucht und die Welligkeit der Doppelschicht in
iv Zusammenfassung
Abhangigkeit von der Anzahl der unterliegenden Polyelektrolytschichten charakter-isiert.Des weiteren wurde untersucht wie membrangebundene Proteine und Rezeptor-molekule die Membranstruktur und Lipidfluiditat beeinflussen. Die Bindung desProteins Streptavidin an Biotinmolekule hat eine starke nichtkovalente Affinitatund wird weitreichend in biotechnologischer Forschung angewendet. Die Bildungeiner Streptavidin/Avidin Schicht auf einer substratgestutzten Lipiddoppelschichtmit biotinylierten Lipiden wurde charakterisiert. Eine wohldefinierte Wasserschichtvon 8 A konnte aufgelost werden, welche das Protein von der Lipiddoppelschichtsepariert; des weiteren wurde kein Einfluss des Proteins auf die Doppelschicht-struktur beobachtet. Die Lipidfluiditat wurde anhand kontinuierlichen Bleichensvor und nach der Proteinbindung quantifiziert und eine kleine Minderung der Lipid-diffusionskonstante um 10-15 % nach der Proteinbindung wurde beobachtet. Dieseparierende Wasserschicht ermoglicht es offenbar der Lipiddoppelschicht ihre lat-erale Fluiditat und strukturelle Integritat zu bewahren.Zum Abschluss wurden biomimetische Membranen mit komplexen Mixturen un-tersucht, welche naherungsweise mit der Lipidkomposition von Zellmembranen inSaugetieren ubereinstimmen. Bei diesen Lipidmembranen mit vielfachen Kompo-nenten einschliesslich Cholesterin konnen sich kondensierte und nicht-kondensierteLipidphasen auftrennen. Kondensierte Lipiddomanen haben eine hohere Ordnungals ihre Umgebung und lokalisieren Membranrezeptoren. Der MembranrezeptorGM1 ganglioside wurde in substratgestutzten Lipiddoppelschichten mit Cholesterinund ternarer Komposition untersucht; es wurde Membrankondensation beobachtetdie durch die Prasenz des Rezeptors ausgelost wurde. Anhand der hohen struk-turellen Auflosung von Synchrotronreflektivitat wurde bestimmt, dass diese rezep-torinduzierte Kondensation asymmetrisch sein kann und auf die Lipideinzelschichtbeschrankt ist, in welcher GM1 anwesend ist. Die Membranfluiditat wurde durchdie Prasenz von GM1 signifikant reduziert (∼50 %) und laterale Segregation inmikroskopische Domanen (∼5 µm) wurde mit Fluoreszenzmikroskopie beobachtet.
In dieser Doktorarbeit wurden komplementare experimentelle Methoden angewen-det um die Struktur von biomimetischen Lipidmembranen auf Angstrøm-Skalaund ihre Diffusionseigenschaften zu untersuchen. Systematische Studien wurdendurchgefuhrt um den Einfluss von der Substratchemie, lipidgebundenen Makro-molekulen und der Lipidanordnung auf die Struktur und die Fluiditat von Lipid-doppelschichten zu erfassen und zu quantifizieren. Der vorliegende Mikrofluidikauf-bau kann verwendet werden um andere komplexe Lipidmembransysteme zu unter-suchen, mit dem Ziel unser physikalisches Verstandnis von der Lipidmembran-Grenzflache zu verbessern.

Summary v
Summary
The structure of mammalian cell membranes is highly heterogeneous and consistsof numerous lipid and protein molecules, which are organized into the cellular lipidbilayer. Understanding membrane processes such as lipid-protein interactions re-quires an insight into the molecular structure of the cell membrane. Such angstrømresolution is offered by X-ray diffraction techniques, which are sensitive to the elec-tron density distribution within macromolecules. Model lipid membranes mimic thecomposition of natural cell membranes and are used for facilitating experimentalinvestigations. A special class of biomimetic lipid membranes are substrate sup-ported lipid bilayers, which can be studied by surface sensitive methods such asX-ray reflectivity. Using highly brilliant X-rays at modern synchrotron sourcesallows to obtain detailed structural information on lipid bilayers at solid-liquid in-terfaces.For this thesis, a novel microfluidic setup for high resolution X-ray reflectivity stud-ies of single biomimetic lipid membranes at solid-liquid interfaces was developed.The setup is also designed for quantitative fluorescence microscopy, which allows usto complement our structural studies with investigations on lipid dynamics withinthe lipid bilayer. Our approach unifies two experimental characterization techniqueson a single sample and offers an integrated view on the biophysical properties ofbiomimetic lipid membranes, such as molecular structure, lipid fluidity and phasestate of the lipid bilayer.We have characterized lipid bilayers on different solid supports to assess the suit-ability of these membrane/interface systems for biological and biotechnologicalapplications. The surface chemistry of an underlying substrate may considerablyinfluence the structural and dynamical properties of a lipid membrane. The mate-rial properties of the thermoplastic polymer 2-norbornene ethylene (Topas), suchas optical transparency, high chemical resistivity and ease for lateral structuring,make this compound an interesting candidate as a substrate for lipid membranes.Model lipid bilayers on Topas showed a high homogeneity, though a reduced lipidfluidity (∼50 %) as compared to lipid bilayers supported on hydrophilic silicon ox-ide. We also observed on Topas a reduced bilayer thickness of about 20 %, whichwe ascribe to a bilayer conformation with either coiled or interdigitated acyl chains.Another template for biosensoric applications are polyelectrolyte multilayers, whichcan act as a dielectric between lipid bilayers and semiconductor substrates, suchas silicon-on-insulator devices (SOI). We studied homogeneous lipid bilayers onalternating polyanion/polycation layers and characterized the corrugation of thebilayer depending on the number of underlying polyelectrolyte layers.Further, we studied how protein and receptor molecules bound to lipid membranesinfluence their structure and lipid fluidity. The binding of the protein streptavidinto biotin molecules has a strong noncovalent affinity and is widely used in biotech-nological research. We characterized the formation of a streptavidin/avidin layer

vi Summary
bound to a supported lipid bilayer containing biotinylated lipids. We resolved awell-defined water layer of 8 A separating the protein and lipid bilayer and showedthat the bilayer structure was not affected by the presence of the protein. The lipidfluidity was quantified using continuous bleaching before and after protein bindingand we observed a small reduction of 10-15 % of the lipid diffusion constant afterprotein binding. We propose that the separating water layer allows the lipid bilayerto retain its lateral fluidity and structural integrity.Finally, we studied biomimetic membranes with complex mixtures that approxi-mate the lipid composition in mammalian cell membranes. Such lipid membraneswith multiple components including cholesterol are capable of phase separationinto condensed and non-condensed lipid phases. Condensed lipid domains aremore ordered than their environment and localize membrane receptors. We stud-ied the membrane receptor GM1 ganglioside in supported lipid bilayers of ternarycompositions including cholesterol and observed membrane condensation, whichwas induced by the presence of the receptor. Using the high structural resolutionavailable with synchrotron reflectivity, we determined that this receptor-inducedcondensation can be asymmetric and is restricted to the bilayer leaflet in whichGM1 is present. The membrane fluidity was significantly reduced (∼50 %) by thepresence of GM1 and we observed lateral segregation into microscopic domains(∼5 µm) with fluorescence microscopy.
In this thesis, complementary experimental techniques were applied to investigatethe angstrøm scale structure and diffusion properties of biomimetic lipid mem-branes. We systematically studied how substrate chemistry, lipid-bound macro-molecules and lipid ordering influence the structure and fluidity of lipid bilayers.The present microfluidic setup can be used to study other complex lipid membranesystems to improve our physical understanding of lipid membrane interfaces.

Chapter 1
Introduction
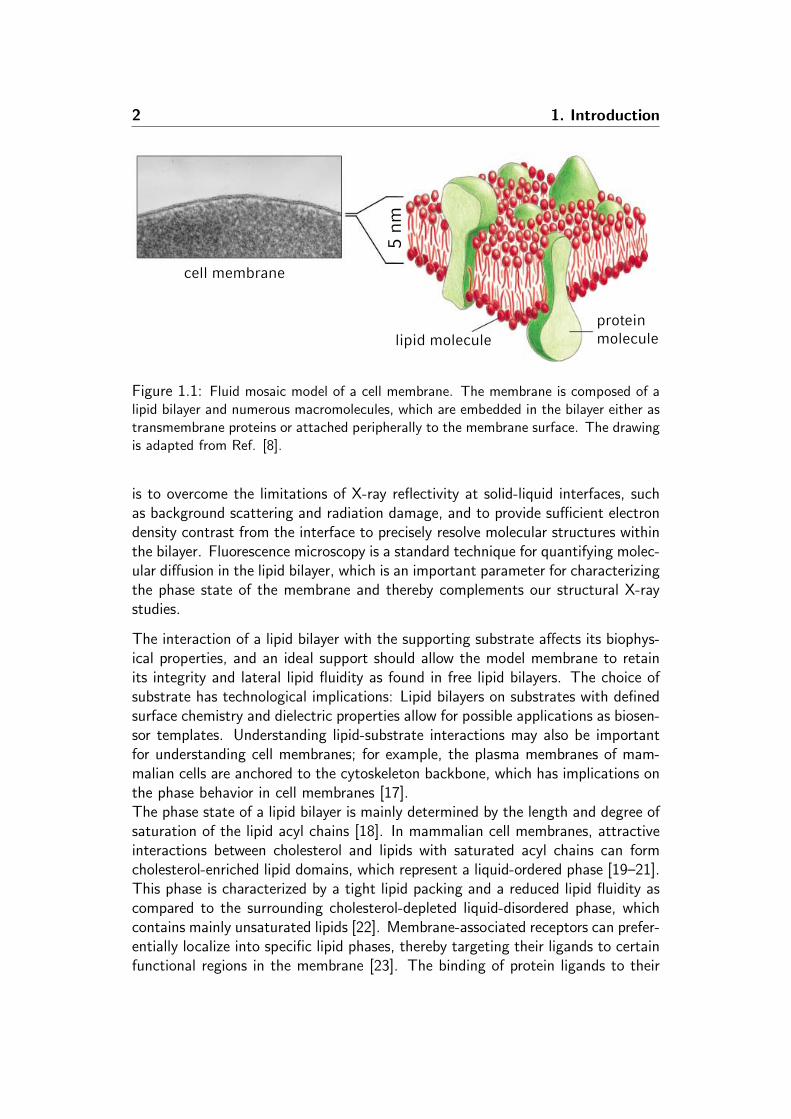
The plasma membrane of mammalian cells is a heterogeneous and structurallyasymmetric lipid bilayer, wherein a variety of proteins are embedded. Thesemolecules are free to diffuse laterally, but remain confined to a two dimensional lipidmatrix surrounded by an aqueous environment (Fig. 1.1). This concept was origi-nally established as the ’fluid mosaic model’ [6] and is being continuously revised, asmolecular interactions confer structural heterogeneity to the membranes, and lipidsand proteins can self-organize to form functional domains. These domains alter thephysical and biochemical properties of the lipid bilayer and influence the diffusion ofmolecules [7]. Understanding biological processes at the cell membrane interface,such as protein binding and receptor localization into membrane domains, requiresa molecular insight into the membrane structure. The complex architecture of cellmembranes often complicates a direct investigation using cells and well-defined andisolated model lipid membranes are necessary for systematic experimental studies.Such biomimetic model lipid bilayers can be engineered with multiple componentsand lipid asymmetry across the leaflets, mimicking the structure and function ofcell membranes. Solid supported lipid bilayers are a special class of biomimetic lipidmembranes [9] and allow for the application of surface sensitive techniques, suchas atomic force microscopy [10, 11], fluorescence microscopy [12, 13], and X-rayand neutron reflectivity at solid-liquid interfaces [14–16]. The best resolution canbe obtained with X-ray diffraction, which is sensitive to the electron density dis-tribution within biomolecules. Modern synchrotron sources provide highly brilliantX-rays which give access to detailed electron density profiles of lipid bilayers withan accuracy of several angstrøm.
The key motivation for this thesis was to develop a better understanding of lipid-lipid, lipid-protein, and lipid-substrate interactions in single supported lipid bilayers,using high resolution X-ray reflectivity and fluorescence microscopy (Fig. 1.2). Sin-gle lipid bilayers are more representative model systems for cell membranes thanmultilamellar bilayers or lipid monolayers, since surface protein binding and molec-ular asymmetry across separate bilayer leaflets can be studied. A major challenge
2 1. Introduction
lipid moleculeproteinmolecule
5 nm
cell membrane
Figure 1.1: Fluid mosaic model of a cell membrane. The membrane is composed of alipid bilayer and numerous macromolecules, which are embedded in the bilayer either astransmembrane proteins or attached peripherally to the membrane surface. The drawingis adapted from Ref. [8].
is to overcome the limitations of X-ray reflectivity at solid-liquid interfaces, suchas background scattering and radiation damage, and to provide sufficient electrondensity contrast from the interface to precisely resolve molecular structures withinthe bilayer. Fluorescence microscopy is a standard technique for quantifying molec-ular diffusion in the lipid bilayer, which is an important parameter for characterizingthe phase state of the membrane and thereby complements our structural X-raystudies.
The interaction of a lipid bilayer with the supporting substrate affects its biophys-ical properties, and an ideal support should allow the model membrane to retainits integrity and lateral lipid fluidity as found in free lipid bilayers. The choice ofsubstrate has technological implications: Lipid bilayers on substrates with definedsurface chemistry and dielectric properties allow for possible applications as biosen-sor templates. Understanding lipid-substrate interactions may also be importantfor understanding cell membranes; for example, the plasma membranes of mam-malian cells are anchored to the cytoskeleton backbone, which has implications onthe phase behavior in cell membranes [17].The phase state of a lipid bilayer is mainly determined by the length and degree ofsaturation of the lipid acyl chains [18]. In mammalian cell membranes, attractiveinteractions between cholesterol and lipids with saturated acyl chains can formcholesterol-enriched lipid domains, which represent a liquid-ordered phase [19–21].This phase is characterized by a tight lipid packing and a reduced lipid fluidity ascompared to the surrounding cholesterol-depleted liquid-disordered phase, whichcontains mainly unsaturated lipids [22]. Membrane-associated receptors can prefer-entially localize into specific lipid phases, thereby targeting their ligands to certainfunctional regions in the membrane [23]. The binding of protein ligands to their

3
Figure 1.2: Schematic of a supported lipid bilayer with proteins bound to receptor lipidsembedded within the membrane. The molecular structure is resolved by the electrondensity profile obtained with X-ray reflectivity. Lateral structures and diffusion of lipidsand protein molecules at the membrane surface are assessed by fluorescence microscopy.The illustration was created by Patrick Bober.
receptors in the cellular membrane can locally rearrange the lipid environment andthereby modify the lipid bilayer structure and fluidity [24].
In order to systematically investigate these different molecular interactions in sin-gle model membranes, an experimental setup for X-ray reflectivity and fluorescencemicroscopy studies was designed as a part of this thesis. We combine the com-plementary results from these experimental techniques to obtain a comprehensiveunderstanding of specific molecular processes in model lipid membranes.This thesis is organized as follows: The microfluidic X-ray chamber is introducedin chapter 2, together with a brief description of the synchrotron and fluorescencemicroscopy measurements, and methods for membrane preparation. In chapter3, we report our studies of supported lipid bilayers on the thermoplastic polymer2-norbornene ethylene (Topas) and on a polyelectrolyte system composed of alter-nating polyanion and polycation layers. The influence of the polymer substrates onthe structure and fluidity of the lipid bilayers is investigated in terms of suitabilityas solid supports for biotechnological applications. In the following chapters, weshow how molecules bound to the membrane and within the lipid bilayer can beresolved and characterized with X-ray reflectivity and fluorescence microscopy. In
4 1. Introduction
chapter 4, we model receptor-ligand interactions in cellular membranes by bindingthe proteins streptavidin and avidin to biotin receptors embedded in supported lipidbilayers. The implications of protein binding on lipid bilayer fluidity and stabilityare quantified and discussed. In chapter 5, we study the membrane receptor GM1
ganglioside in supported lipid bilayers composed of complex mixtures mimickingthe approximate compositions of mammalian cell membranes. The phase behaviorof separate bilayer leaflets is investigated and the influence of GM1 on lipid bilayercondensation and leaflet asymmetry is discussed.
Part of this work has been published or submitted for publication [1–5]. The fulltext articles are attached in Appendices A.1 to A.5.

Chapter 2
A microfluidic setup for studies ofsolid-liquid interfaces using X-rayreflectivity and fluorescencemicroscopy
Part of the work described in this chapter has been published [1]. The full articleis attached in Appendix A.1.
Solid-liquid interfaces cannot be easily characterized by X-rays due to strong in-coherent interactions with the aqueous environment, which give rise to significantbeam attenuation and background scattering. Furthermore, biological interfacesusually consist of ’light’ molecules such as carbon and hydrogen with a small atomicnumber, offering minimal scattering contrast for X-rays.Due to these limitations, the investigation of solid-liquid interfaces by means ofdiffraction techniques has traditionally been a domain of neutron reflectivity. Ther-mal neutrons (λ ∼ 1.8 A) interact with the atomic cores of molecules according tothe specific scattering length of the isotope. This offers the advantage of contrastvariation: Neutrons distinguish between isotopes such as hydrogen and deuterium,and substituting hydrogen with deuterium at selected atomic positions within abiomolecule strongly increases scattering contrast. Significant restrictions of thistechnique are the notoriously low flux available at neutron sources, limiting thedepth resolution to several nanometer, and the need for large samples with areadimensions of several cm2.A major goal of this thesis was to develop an experimental setup to facilitate theapplication of X-ray reflectivity for the study of biological interfaces, in particularsolid supported membranes. The main motivation is to utilize highly brilliant X-raybeams offered by modern synchrotron sources to potentially achieve subnanometer-resolution with X-ray reflectivity. Furthermore, the experimental setup should con-
6 Setup for X-ray reflectivity and fluorescence microscopy
200
µm( )
( )n
m
X-ray beam substrate
microscope
channel
buffer or water
foil
SiO2
lipid bilayer Topas COC
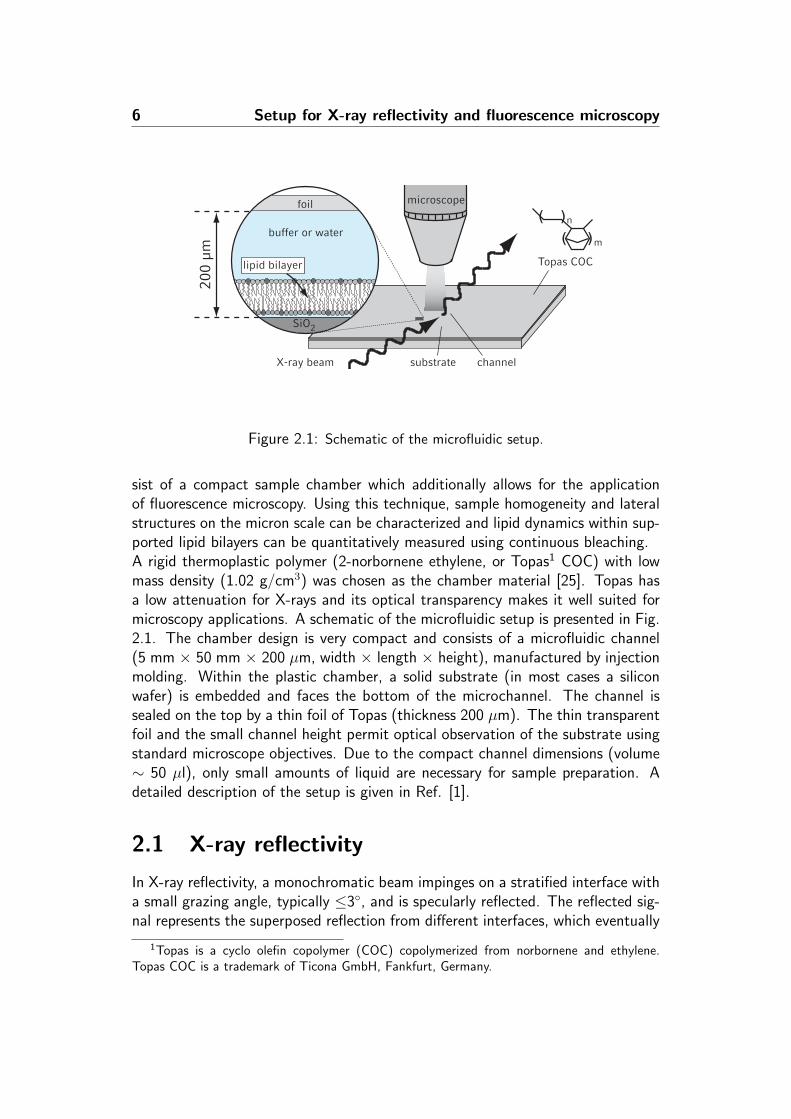
Figure 2.1: Schematic of the microfluidic setup.
sist of a compact sample chamber which additionally allows for the applicationof fluorescence microscopy. Using this technique, sample homogeneity and lateralstructures on the micron scale can be characterized and lipid dynamics within sup-ported lipid bilayers can be quantitatively measured using continuous bleaching.A rigid thermoplastic polymer (2-norbornene ethylene, or Topas1 COC) with lowmass density (1.02 g/cm3) was chosen as the chamber material [25]. Topas hasa low attenuation for X-rays and its optical transparency makes it well suited formicroscopy applications. A schematic of the microfluidic setup is presented in Fig.2.1. The chamber design is very compact and consists of a microfluidic channel(5 mm × 50 mm × 200 µm, width × length × height), manufactured by injectionmolding. Within the plastic chamber, a solid substrate (in most cases a siliconwafer) is embedded and faces the bottom of the microchannel. The channel issealed on the top by a thin foil of Topas (thickness 200 µm). The thin transparentfoil and the small channel height permit optical observation of the substrate usingstandard microscope objectives. Due to the compact channel dimensions (volume∼ 50 µl), only small amounts of liquid are necessary for sample preparation. Adetailed description of the setup is given in Ref. [1].
2.1 X-ray reflectivity
In X-ray reflectivity, a monochromatic beam impinges on a stratified interface witha small grazing angle, typically ≤3, and is specularly reflected. The reflected sig-nal represents the superposed reflection from different interfaces, which eventually
1Topas is a cyclo olefin copolymer (COC) copolymerized from norbornene and ethylene.Topas COC is a trademark of Ticona GmbH, Fankfurt, Germany.

2.1 X-ray reflectivity 7
Fresnel reflectivity with roughness 3 Å
critical angle of total reflection
0.0 0.1 0.2 0.3 0.4 0.5 0.610-11
10-10
10-9
10-8
10-7
10-6
10-5
10-4
10-3
10-2
10-1
100
nor
mal
ized
in
ten
sity
[a.u
.]
qz [Å-1]
2π / d
Kiessig fringes
α α
layer 2 (substrate)
layer 1
reflectionfrom layer 1
Incidencebeam
reflectionfrom layer 2qz
n1n2
n3
(a) (b)
Figure 2.2: (a) Schematic of the scattering geometry for a substrate with a single surfacelayer. An incoming X-ray beam is reflected from the different interfaces dependingon their respective refractive indices (n1,2,3). The superposition of multiple reflectionsresults in interference in the reflectivity signal [28]. (b) Calculated reflectivity for abare substrate at the silicon-water interface (dark line) and for a substrate with a singlesurface layer of d = 40 A (gray line). A uniform interface roughness of 3 A is includedin the calculation. The periodicity of the Kiessig fringes is related to the layer thicknessby ∆q = 2π/d.
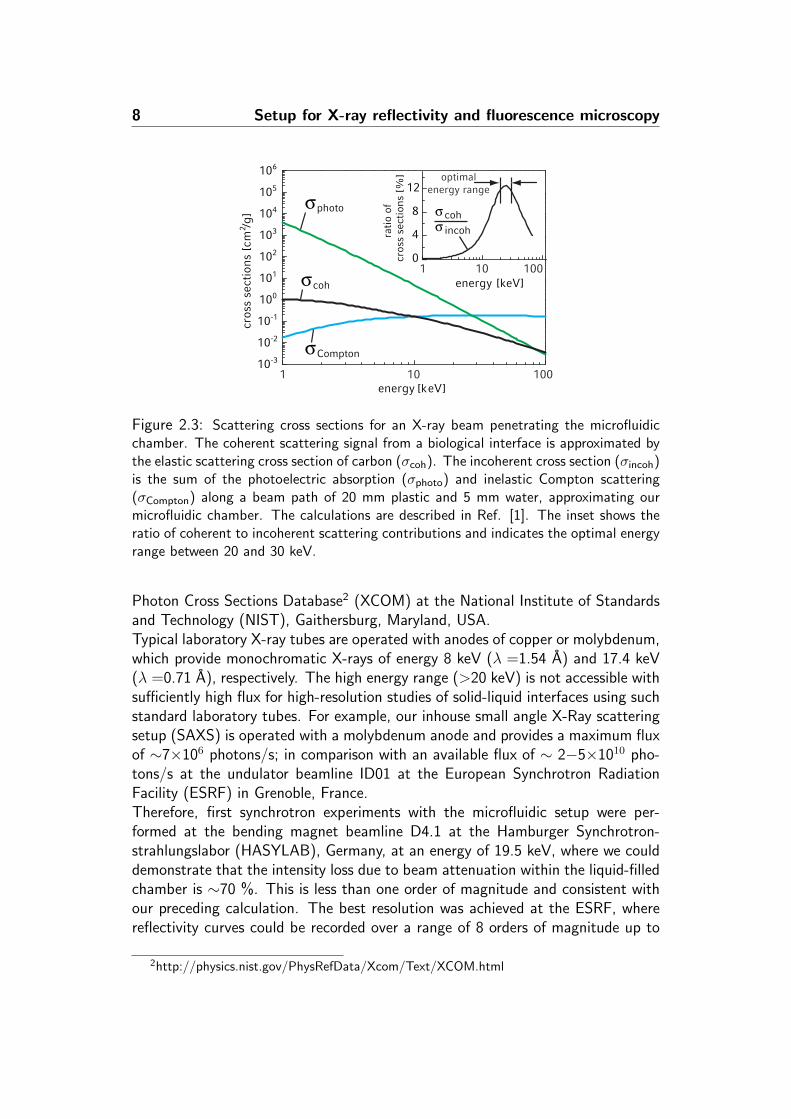
exhibits characteristic oscillations, often termed Kiessig fringes (Fig. 2.2). Thefirst comprehensive theory of reflectivity based on Fresnel optics has been given byL. G. Parratt [26] and extensions to the theory to account for interface roughnesseshave been subsequently developed by L. Nevot and P. Croce [27]. A detailed andthorough description of the experimental technique and modern approaches fordata analysis are given in Ref. [28].In order to choose a favorable X-ray energy for our experiments, the different con-tributions to the X-ray cross section were examined (Fig. 2.3). The main processesthat govern the material- and energy-dependent interactions of X-rays with matterare (1) coherent elastic scattering, which we consider as the relevant signal fromthe interface, and then attenuation processes such as (2) photoelectric absorp-tion and (3) incoherent Compton scattering. Increasing the X-ray energy primarilyreduces photoelectric absorption and thereby minimizes radiation damage and in-coherent background. However, the elastic scattering signal is reduced as wellat higher energies and Compton scattering becomes the dominating interaction.Thus, the choice for the optimal energy depends on the chamber material, thechamber dimensions, and the chemical composition of the interface. For the spe-cific case of our compact liquid-filled microfluidic chamber, we have calculated anoptimal ratio of coherent to incoherent scattering of 0.12 within an energy rangeof 20-30 keV. The cross sections presented in Fig. 2.3 were obtained from the
8 Setup for X-ray reflectivity and fluorescence microscopy
10-3
10-2
10-1
100
101
102
103
104
105
106
0
4
8
12
cros
s se
ctio
ns [
cm2 /g
]
energy [keV]
energy [keV]
rati
o of
cros
s se
ctio
ns [
%]
σcoh
σCompton
optimalenergy range
σphoto σ cohσ incoh
1 10010
1 10010
Figure 2.3: Scattering cross sections for an X-ray beam penetrating the microfluidicchamber. The coherent scattering signal from a biological interface is approximated bythe elastic scattering cross section of carbon (σcoh). The incoherent cross section (σincoh)is the sum of the photoelectric absorption (σphoto) and inelastic Compton scattering(σCompton) along a beam path of 20 mm plastic and 5 mm water, approximating ourmicrofluidic chamber. The calculations are described in Ref. [1]. The inset shows theratio of coherent to incoherent scattering contributions and indicates the optimal energyrange between 20 and 30 keV.
Photon Cross Sections Database2 (XCOM) at the National Institute of Standardsand Technology (NIST), Gaithersburg, Maryland, USA.Typical laboratory X-ray tubes are operated with anodes of copper or molybdenum,which provide monochromatic X-rays of energy 8 keV (λ =1.54 A) and 17.4 keV(λ =0.71 A), respectively. The high energy range (>20 keV) is not accessible withsufficiently high flux for high-resolution studies of solid-liquid interfaces using suchstandard laboratory tubes. For example, our inhouse small angle X-Ray scatteringsetup (SAXS) is operated with a molybdenum anode and provides a maximum fluxof ∼7×10⁶ photons/s; in comparison with an available flux of ∼ 2−5×10¹⁰ pho-tons/s at the undulator beamline ID01 at the European Synchrotron RadiationFacility (ESRF) in Grenoble, France.Therefore, first synchrotron experiments with the microfluidic setup were per-formed at the bending magnet beamline D4.1 at the Hamburger Synchrotron-strahlungslabor (HASYLAB), Germany, at an energy of 19.5 keV, where we coulddemonstrate that the intensity loss due to beam attenuation within the liquid-filledchamber is ∼70 %. This is less than one order of magnitude and consistent withour preceding calculation. The best resolution was achieved at the ESRF, wherereflectivity curves could be recorded over a range of 8 orders of magnitude up to
2http://physics.nist.gov/PhysRefData/Xcom/Text/XCOM.html
2.1 X-ray reflectivity 9
0.0 0.1 0.2 0.3 0.4 0.5 0.6 0.710-8
10-7
10-6
10-5
10-4
10-3
10-2
10-1
100
0.0 0.1 0.2 0.3 0.4 0.5 0.6
10-1
100
no
rmal
ized
ref
lect
ivit
y
qz [Å-1]
no
rmal
ized
refl
ecti
vity
(R
/RF)
raw data
background
8 or
ders
of
mag
nitu
de
SOPCon silicon oxide
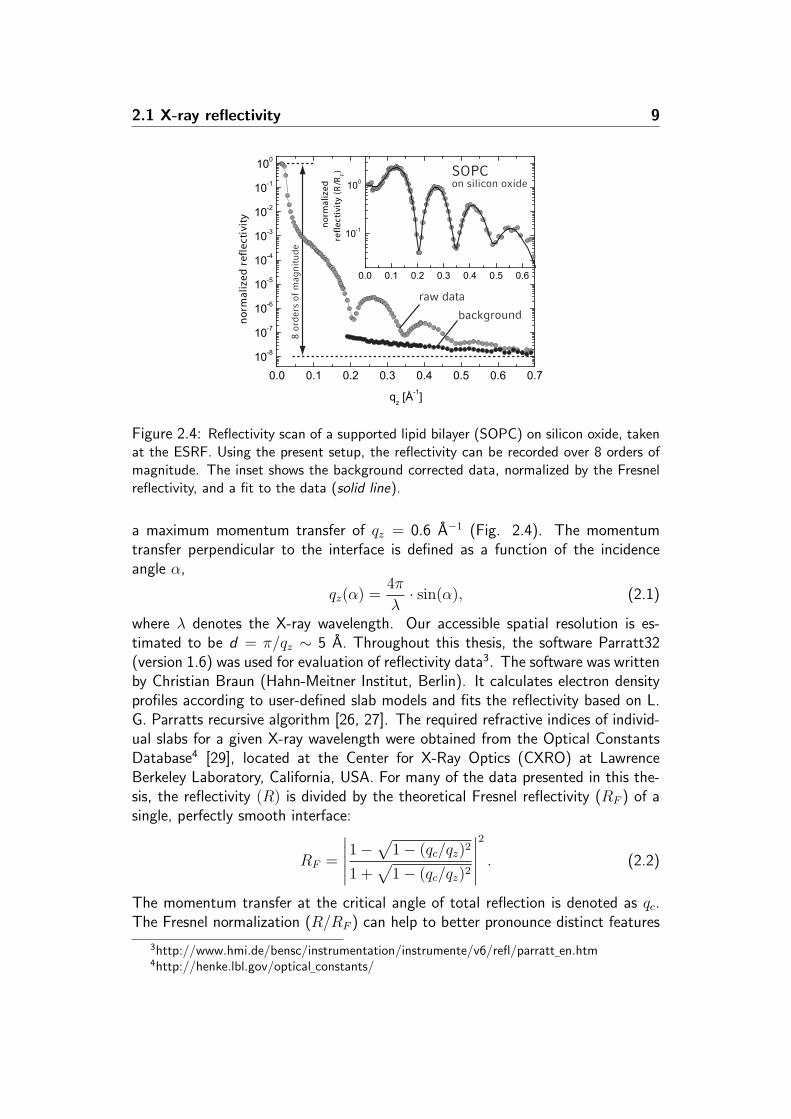
Figure 2.4: Reflectivity scan of a supported lipid bilayer (SOPC) on silicon oxide, takenat the ESRF. Using the present setup, the reflectivity can be recorded over 8 orders ofmagnitude. The inset shows the background corrected data, normalized by the Fresnelreflectivity, and a fit to the data (solid line).
a maximum momentum transfer of qz = 0.6 A−1 (Fig. 2.4). The momentumtransfer perpendicular to the interface is defined as a function of the incidenceangle α,
qz(α) =4π
λ· sin(α), (2.1)
where λ denotes the X-ray wavelength. Our accessible spatial resolution is es-timated to be d = π/qz ∼ 5 A. Throughout this thesis, the software Parratt32(version 1.6) was used for evaluation of reflectivity data3. The software was writtenby Christian Braun (Hahn-Meitner Institut, Berlin). It calculates electron densityprofiles according to user-defined slab models and fits the reflectivity based on L.G. Parratts recursive algorithm [26, 27]. The required refractive indices of individ-ual slabs for a given X-ray wavelength were obtained from the Optical ConstantsDatabase4 [29], located at the Center for X-Ray Optics (CXRO) at LawrenceBerkeley Laboratory, California, USA. For many of the data presented in this the-sis, the reflectivity (R) is divided by the theoretical Fresnel reflectivity (RF ) of asingle, perfectly smooth interface:
RF =
∣∣∣∣∣1−√
1− (qc/qz)2
1 +√
1− (qc/qz)2
∣∣∣∣∣2
. (2.2)
The momentum transfer at the critical angle of total reflection is denoted as qc.The Fresnel normalization (R/RF ) can help to better pronounce distinct features
3http://www.hmi.de/bensc/instrumentation/instrumente/v6/refl/parratt en.htm4http://henke.lbl.gov/optical constants/

10 Setup for X-ray reflectivity and fluorescence microscopy
of the experimental data, especially at high qz (Fig. 2.4).First measurements of a lipid bilayer of SOPC5 supported on silicon oxide showedthat the reflectivity signal exhibits clear and pronounced Kiessig fringes (Fig. 2.4).These data confirmed that a single supported lipid bilayer (SLB) at the silicon-water interface produces sufficient electron density contrast to be precisely resolvedby high energy X-rays.
2.2 Fluorescence microscopy at the synchrotron
During the experimental visits to HASYLAB and ESRF, a compact and trans-portable fluorescence microscope (Axiotech vario, Carl Zeiss AG, Oberkochen),equipped with 10× (N.A. 0.3) and long-distance 63× (N.A. 0.75) Plan-Neofluarobjectives, was transported to the synchrotron. In a typical synchrotron experi-ment, the X-ray beam illuminates a surface area of up to 1×1 mm2 in size, which iscomparable to the area usually visualized by standard microscopy objectives. Usingthe microscope, the samples were thoroughly assessed for homogeneity prior to andafter the X-ray reflectivity measurements. For the optical characterization, lipidbilayers were labeled with small amounts of fluorescent dye (typically ∼0.5 mol %Texas-Red DPPE6). The fluorescence microscope was particularly useful for as-sessing sample defects introduced by preparation method and radiation damage.Overexposure of the biological interface to high flux X-rays was a major challengein our first synchrotron experiments. Reflectivity data measured repeatedly onthe same spot were not reproducible and significant radiation damage along theX-ray footprint was observed with fluorescence microscopy (Fig. 2.5). We havedeveloped several strategies to limit radiation damage effects: First, an automaticshutter system ensured that the sample is not unnecessarily exposed to the beamduring motor movements of the beamline stage. Second, computer controlledbeam attenuators in front of the sample limited the imparted incidence intensity,especially for small angles (<1) where the reflectivity signal is sufficiently intenseand does not require the full intensity. Third, only the minimum amount of datapoints necessary for a thorough data evaluation were collected and successive re-flectivity measurements on the same spots were avoided. The combination of theseprocedures has proven successful for suppressing radiation damage, as verified bythe exact reproducibility of at least two consecutive reflectivity measurements ona single spot.The fluorescence microscope was used to monitor sensitive steps in sample prepa-ration such as protein binding to the SLBs, particularly for successive X-ray mea-surements on a single sample. A comprehensive example for the feasibility ofsuch complementary X-ray reflectivity/fluorescence microscopy studies is given in
51-stearoyl-2-oleoyl-sn-glycero-3-phosphocholine6Texas Red - 1,2-dihexadecanoyl-sn-glycero-3-phosphoethanolamine

2.3 Quantitative fluorescence microscopy: Continuous bleaching 11
X-rayfootprint
membranesurface
(a)20 µm
specularbeam
SiO2
channel
lipid bilayer intact
signalof bare
substrate
beam footprint
200 µm
x-axis
(b)
fixedangle
Figure 2.5: (a) Observed radiation damage along the X-ray footprint after prolongedexposure (several minutes) to the full beam intensity at the ESRF. The small, circulardark spots on the surface are inhomogeneities in the membrane, introduced during samplepreparation. (b) The radiation damage to a SOPC bilayer was monitored by recordingthe temporal degradation of the reflectivity signal at a fixed incidence angle, namely atthe position of the first minima in the scan of Fig. 2.4, using the full beam intensity atthe ESRF. The absolute intensity remains unaffected for up to ∼30 s; for longer times,the signal starts to increase due to radiation damage and approaches the expected signalof a bare water/silicon oxide interface.
Ref. [4], where we have assessed streptavidin/avidin binding to biotin anchors ina supported lipid bilayer.
2.3 Quantitative fluorescence microscopy: Con-tinuous bleaching
Measuring lateral lipid diffusion in a supported lipid bilayer is important for un-derstanding the influence of the substrate on the lipid mobility and to quantifylipid dynamics [30]. A high mobility is also required for protein binding to lipidbilayers. Most established techniques for measuring lipid diffusion, such as fluo-rescence recovery after photobleaching (FRAP), require laser bleaching [12]. Wehave used a standard fluorescence microscope with a mercury lamp to quantifylipid diffusion in SLBs at the synchrotron using continuous bleaching. Despite itsversatility, continuous bleaching is still not a standard technique for measuring lipiddiffusion. The theoretical background has been originally developed in Ref. [13]and the experimental procedure is thoroughly described in Ref. [4], together witha comprehensive outline for data evaluation. In brief, the mobility of the fluores-cent dyes incorporated in the bilayer is monitored by illuminating a roughly circularspot of typically 100−200 µm diameter (Fig. 2.6). It is crucially important fora quantitative data analysis that the entire spot is evenly illuminated. To ensurethis, alignment of the mercury lamp prior to each experiment was necessary. For

12 Setup for X-ray reflectivity and fluorescence microscopy
0 50 100 150 200line profile [µm]
loga
rith
mic
inte
nsit
y [
× 10
00]
.2
2
34
1
1900 s
0 sinitial (t=0s)illumination
must be even
symmetric,monoexponential
decay
bleaching tobackground
(t=1900s)
bright rim fromdiffusing lipids
x0
1900 s
0 s
Figure 2.6: Principle of continuous bleaching. A circular spot on the bilayer surfaceis homogeneously illuminated and the intensity decay in the center is recorded as time-dependent image sequence. While the center area is bleached with time, a bright rimforms at the edge, which is due to unbleached lipids diffusing from the non-illuminatedarea into the illuminated spot. For prolonged bleaching (here: 1900 s), the centerintensity approaches the background level and line profiles through the center of thespot show a symmetric exponential intensity decay at the rim.
a large ensemble of continuously excited dye molecules with a mean fluorescencelifetime, the fluorescence intensity I(t) decays exponentially within the spot as afunction of time:
I(t) = I0 · exp(−B · t). (2.3)
The bleach rate B unifies experimental parameters such as luminosity of the mer-cury lamp, solution conditions, and fluorescent intensity and concentration of thedye. I0 is the fluorescence for t = 0. When the center intensity approaches thebackground level, the line profiles can be fitted to the spatial intensity decay atthe rim:
I(x) = Irim · cosh[√
B/D · (x− x0)]. (2.4)
Irim is the fluorescence intensity at the rim. The profiles should be symmetric andmonoexponential on both sides of the spot. It is important that the center of thesample is bleached to the background level to ensure that no dye molecules areable to cross the spot from one side of the rim to the other, thereby disruptingthe data analysis. Using the value for the bleach rate B from Eq. 2.3, thediffusion coefficient D can be extracted from Eq. 2.4. Typical values for diffusioncoefficients of supported lipid bilayers vary from 1 to 5 µm2/s, depending on thesubstrate properties.Data analysis for continuous bleaching was done using a self-written MatLab-program. It consists of an intuitive graphical user interface and follows the analysis
2.4 Membrane preparation 13
procedure described in Ref. [4]. A brief manual is provided in Appendix B.
2.4 Membrane preparation
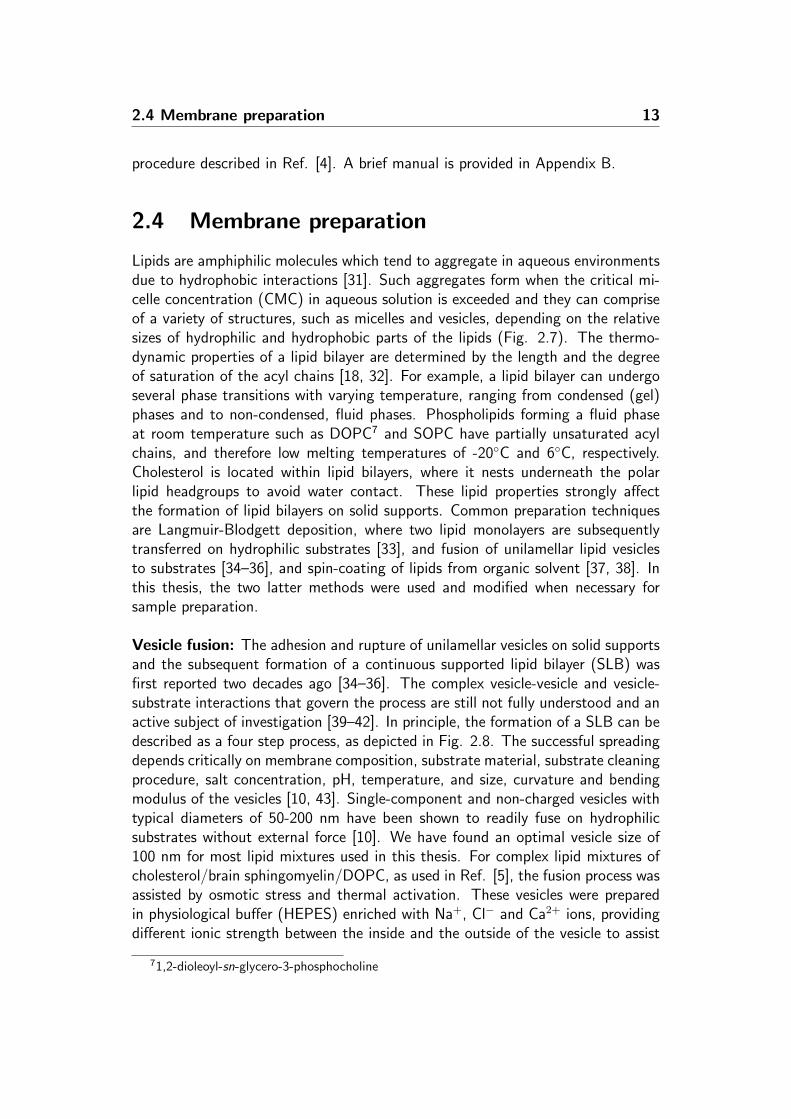
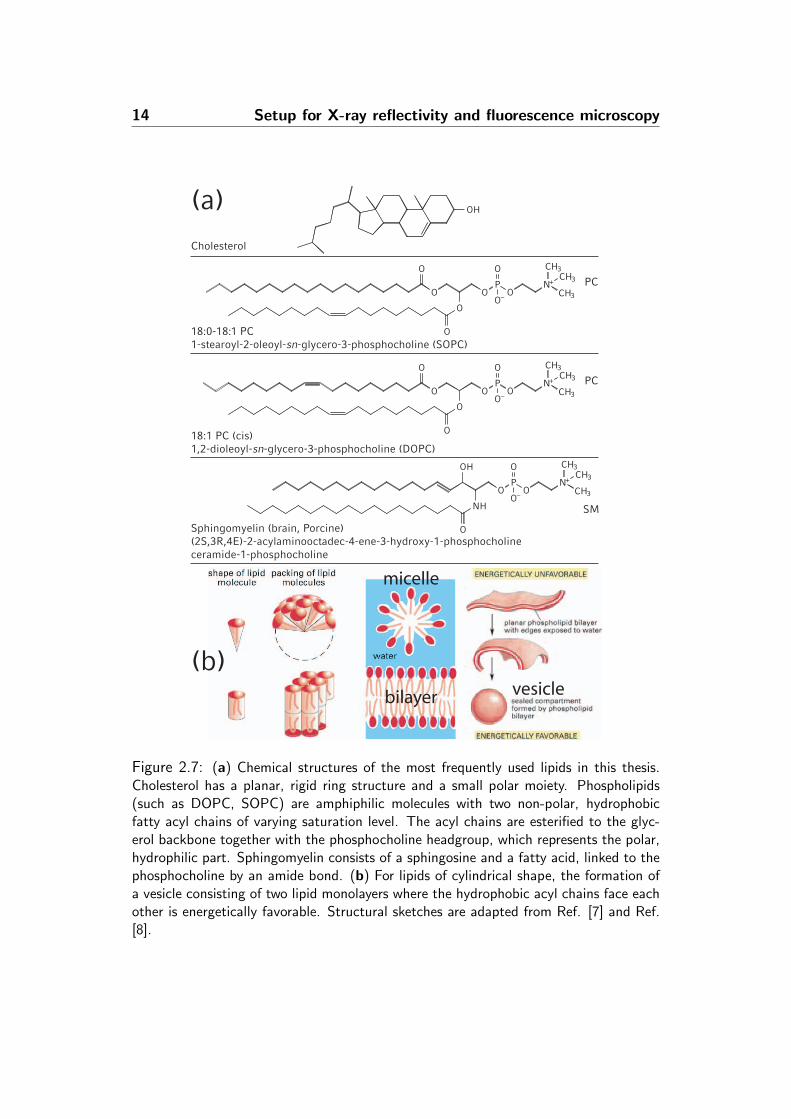
Lipids are amphiphilic molecules which tend to aggregate in aqueous environmentsdue to hydrophobic interactions [31]. Such aggregates form when the critical mi-celle concentration (CMC) in aqueous solution is exceeded and they can compriseof a variety of structures, such as micelles and vesicles, depending on the relativesizes of hydrophilic and hydrophobic parts of the lipids (Fig. 2.7). The thermo-dynamic properties of a lipid bilayer are determined by the length and the degreeof saturation of the acyl chains [18, 32]. For example, a lipid bilayer can undergoseveral phase transitions with varying temperature, ranging from condensed (gel)phases and to non-condensed, fluid phases. Phospholipids forming a fluid phaseat room temperature such as DOPC7 and SOPC have partially unsaturated acylchains, and therefore low melting temperatures of -20C and 6C, respectively.Cholesterol is located within lipid bilayers, where it nests underneath the polarlipid headgroups to avoid water contact. These lipid properties strongly affectthe formation of lipid bilayers on solid supports. Common preparation techniquesare Langmuir-Blodgett deposition, where two lipid monolayers are subsequentlytransferred on hydrophilic substrates [33], and fusion of unilamellar lipid vesiclesto substrates [34–36], and spin-coating of lipids from organic solvent [37, 38]. Inthis thesis, the two latter methods were used and modified when necessary forsample preparation.
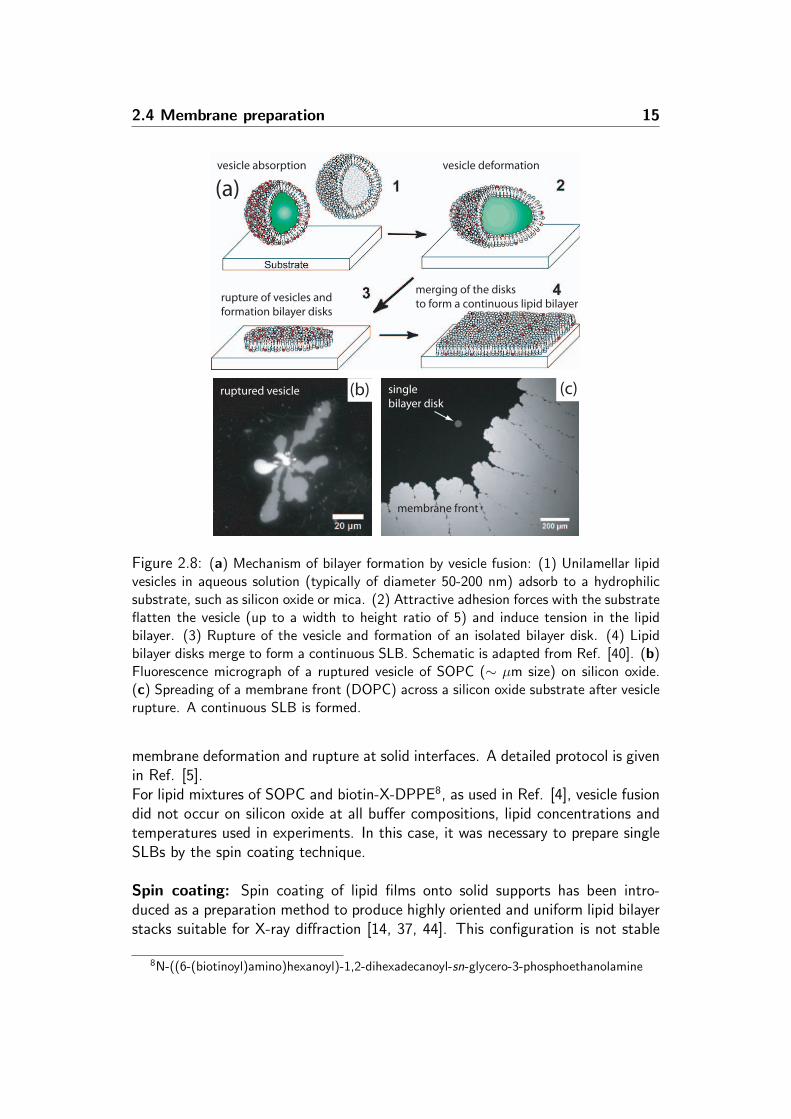
Vesicle fusion: The adhesion and rupture of unilamellar vesicles on solid supportsand the subsequent formation of a continuous supported lipid bilayer (SLB) wasfirst reported two decades ago [34–36]. The complex vesicle-vesicle and vesicle-substrate interactions that govern the process are still not fully understood and anactive subject of investigation [39–42]. In principle, the formation of a SLB can bedescribed as a four step process, as depicted in Fig. 2.8. The successful spreadingdepends critically on membrane composition, substrate material, substrate cleaningprocedure, salt concentration, pH, temperature, and size, curvature and bendingmodulus of the vesicles [10, 43]. Single-component and non-charged vesicles withtypical diameters of 50-200 nm have been shown to readily fuse on hydrophilicsubstrates without external force [10]. We have found an optimal vesicle size of100 nm for most lipid mixtures used in this thesis. For complex lipid mixtures ofcholesterol/brain sphingomyelin/DOPC, as used in Ref. [5], the fusion process wasassisted by osmotic stress and thermal activation. These vesicles were preparedin physiological buffer (HEPES) enriched with Na+, Cl− and Ca2+ ions, providingdifferent ionic strength between the inside and the outside of the vesicle to assist
71,2-dioleoyl-sn-glycero-3-phosphocholine
14 Setup for X-ray reflectivity and fluorescence microscopy
O OP
O
O
O
O
O
O–
N+
CH3
CH3CH3
NH
OH
O
PO
O
O–
N+
CH3
CH3CH3
O
OH
PC
SM
O OP
O
O
O
O
O
O–
N+
CH3
CH3CH3 PC
Cholesterol
18:1 PC (cis)1,2-dioleoyl-sn-glycero-3-phosphocholine (DOPC)
18:0-18:1 PC1-stearoyl-2-oleoyl-sn-glycero-3-phosphocholine (SOPC)
Sphingomyelin (brain, Porcine)(2S,3R,4E)-2-acylaminooctadec-4-ene-3-hydroxy-1-phosphocholineceramide-1-phosphocholine
(a)
(b)bilayer
micelle
vesicle
Figure 2.7: (a) Chemical structures of the most frequently used lipids in this thesis.Cholesterol has a planar, rigid ring structure and a small polar moiety. Phospholipids(such as DOPC, SOPC) are amphiphilic molecules with two non-polar, hydrophobicfatty acyl chains of varying saturation level. The acyl chains are esterified to the glyc-erol backbone together with the phosphocholine headgroup, which represents the polar,hydrophilic part. Sphingomyelin consists of a sphingosine and a fatty acid, linked to thephosphocholine by an amide bond. (b) For lipids of cylindrical shape, the formation ofa vesicle consisting of two lipid monolayers where the hydrophobic acyl chains face eachother is energetically favorable. Structural sketches are adapted from Ref. [7] and Ref.[8].
2.4 Membrane preparation 15
membrane front
singlebilayer disk
ruptured vesicle
vesicle absorption vesicle deformation
rupture of vesicles and formation bilayer disks
merging of the disksto form a continuous lipid bilayer
(a)
(b) (c)
Figure 2.8: (a) Mechanism of bilayer formation by vesicle fusion: (1) Unilamellar lipidvesicles in aqueous solution (typically of diameter 50-200 nm) adsorb to a hydrophilicsubstrate, such as silicon oxide or mica. (2) Attractive adhesion forces with the substrateflatten the vesicle (up to a width to height ratio of 5) and induce tension in the lipidbilayer. (3) Rupture of the vesicle and formation of an isolated bilayer disk. (4) Lipidbilayer disks merge to form a continuous SLB. Schematic is adapted from Ref. [40]. (b)Fluorescence micrograph of a ruptured vesicle of SOPC (∼ µm size) on silicon oxide.(c) Spreading of a membrane front (DOPC) across a silicon oxide substrate after vesiclerupture. A continuous SLB is formed.
membrane deformation and rupture at solid interfaces. A detailed protocol is givenin Ref. [5].For lipid mixtures of SOPC and biotin-X-DPPE8, as used in Ref. [4], vesicle fusiondid not occur on silicon oxide at all buffer compositions, lipid concentrations andtemperatures used in experiments. In this case, it was necessary to prepare singleSLBs by the spin coating technique.
Spin coating: Spin coating of lipid films onto solid supports has been intro-duced as a preparation method to produce highly oriented and uniform lipid bilayerstacks suitable for X-ray diffraction [14, 37, 44]. This configuration is not stable
8N-((6-(biotinoyl)amino)hexanoyl)-1,2-dihexadecanoyl-sn-glycero-3-phosphoethanolamine

16 Setup for X-ray reflectivity and fluorescence microscopy
1000
2000
3000
1 5432 6 70
time [s]
rpm
120 s
solventevaporation
pipette
lipids dissolvedin 2-propanol
3000 rpm
(b)
complete bilayeron substrate
2. bilayer
3. bilayer
1st bilayer
edge ofsilicon waferair water
(a)
(c) (d)
2nd
3rd
4th
Figure 2.9: Principle of membrane preparation by spin coating. (a) A pipette dropof lipid solution in 2-propanol (∼150 µl) is placed on a freshly cleaned silicon oxidewafer, fixed on the spinning disk of the spin coating device. (b) The wafer is acceleratedaccording to the depicted ramp. For t < 2s, the low spinning velocity evenly distributesthe solvent across the substrate. For t > 2s, the solvent is evaporated upon accelerationto 3000 rpm and the lipid molecules spontaneously self-assemble to form uniform lipidbilayer stacks. (c) SOPC multilayers on silicon oxide, as exposed to air directly after spin-coating, using a lipid concentration of 5 mg/mL. The overall surface coverage decreaseswith increasing bilayer number. (d) Continuous flushing of the surface with deionizedwater or buffer successively detaches the upper bilayers.
in water and it has been observed that individual bilayers readily detach upon hy-dration [38]. However, the undermost lipid bilayer in direct contact with the solidinterface remains on the substrate and is highly homogeneous and defect-free [38].This makes the technique feasible for the preparation of single SLBs. Lipid mix-tures are dissolved in polar organic solvents such as 2-propanol or ethanol to ensurecomplete wetting of hydrophilic substrates. Lipid stock solutions in chloroform arenot readily suited for spin coating since chloroform inadequately wets hydrophilicsurfaces such as mica and silicon oxide. A brief outline of the preparation methodis depicted in Fig. 2.9 and detailed protocols are given in Ref. [2] and Ref. [4].A critical parameter which determines the absolute number of bilayers formed onthe substrate is the lipid concentration in the solvent. An lipid concentration of1.5 mg/mL ensures a complete SLB on the substrate, with only small residues ofincomplete secondary bilayers on the top [38]. These residues can be washed awaywith excess water or buffer and subsequent tempering of the sample at ∼30Cfor several hours leaves a highly uniform and homogenous single bilayer on thesubstrate.

Chapter 3
Supported lipid membranes onpolymer substrates
Many biophysical properties of cellular membranes, such as phase state and mem-brane curvature, are affected by interactions of the lipid bilayer with the cytoskele-ton present in the cell cytoplasm. For example, micron-scale phase separation intocoexisting liquid phases has been extensively observed in free giant unilamellar vesi-cles [45–47], but is not observed in natural cell membranes with complex lipid andprotein constituents. Recently, it has been demonstrated that cell membranes arenevertheless capable of micron-scale phase separation once the cytoskeleton back-bone is removed [17]. These results suggest that coupling of the plasma membraneto the underlying cytoskeleton may prevent microscopic segregation. The biophys-ical properties of supported lipid bilayers (SLBs) are also considerably influenced byinteractions with the solid support [9, 48, 49]. For example, comparative studiesof lipid diffusion in free giant unilamellar vesicles and mica supported lipid bilay-ers have shown that the diffusion coefficients of DOPC bilayers are reduced by afactor of two at the solid interface (from D=7.8±0.8 µm2/s to 3.1±0.3 µm2/s,respectively) [30].Substrates for biomimetic lipid membrane preparation should have a high hy-drophilicity in order to enhance adhesion, rupture and surface spreading of vesiclesto form continuous lipid bilayers [35, 49]. Suitable substrates include silica surfaces(such as glass, quartz, sputtered silicon dioxide) [50] and hydrophilic mica [51], onwhich lipid bilayers retain a high lateral fluidity and similar thermodynamic prop-erties as compared to free standing bilayers. However, on similar solid supportssuch as TiO2, oxidized platinum and oxidized gold, vesicle adhesion takes place butrupture and formation of homogeneous and fluid bilayers is not readily facilitated[39]. In addition to the aforementioned solid supports, polymers are interestingsubstrates for lipid bilayers as well, since they can be easily modified in termsof lateral structure, surface charge and hydrophobicity/hydrophilicity. For exam-ple, fluid and homogeneous membranes can be successfully formed on oxidized

18 Lipid membranes on polymer supports
poly(dimethylsiloxane) (PDMS), and the chemical composition of the substratecan be locally modified to support either lipid monolayers or bilayers, or evenreject lipid adhesion in a controlled fashion [52]. For biosensoric applications, con-trolling the local composition and dielectric properties of SLBs is important forusing them as interfaces between biological systems and inorganic materials. Inthis chapter, structural studies of SLBs on two polymer substrates with potentialfor applications in biology and biotechnology are presented.
3.1 Lipid membranes on a thermoplastic substrate
Part of the work described in this section has been published [2]. The full articleis attached in Appendix A.2.
In this work the properties of lipid bilayers supported on 2-norbornene ethylene(Topas) were investigated. Topas is the building material of our microfluidic samplechambers and we had previously observed the formation of fluid membranes directlyon the chamber material. This raised the question of whether Topas itself pro-vides a suitable substrate for SLB formation. Known material properties of Topaswhich qualify it for lab-on-a-chip applications include a high UV-transparency, lowwater absorption and chemical resistivity against hydrolysis, polar organic solventsand most acids and bases [53]. Further, thermal nanoimprint lithography can beused to provide well-defined surface geometries [53]. The water contact angle ofTopas is 89 and is situated in the intermediate range between hydrophilic andhydrophobic surfaces. It was therefore important to clarify the structure and mo-bility of lipid membranes on such surfaces, since it is unclear whether the supportfacilitates the formation of a lipid monolayer or a lipid bilayer. For comparison,the surface chemistry of PDMS has been systematically modified to produce sup-ports with different hydrophilicity [52]. The formation of supported fluid bilayerswas observed at contact angles < 30, whereas fluid supported monolayers wereobserved for contact angles > 109. Thus, the key questions were: What kind oflipid structure forms on Topas? How does the fluidity of that lipid phase compareto lipid fluidity on other supports?As a first step, we prepared well-defined interfaces of Topas and assessed the sur-face roughness. A smooth interface is not necessary for the formation of lipidmembranes, but it is important for enhancing the reflectivity signal. Topas dis-solved in toluene was spin coated onto silicon oxide substrates of surface roughness3 A. The resulting Topas layer was characterized with X-ray reflectivity both onair and in contact with water at the beamline ID01 (ESRF) and had an averageroughness of 7 A. The thickness (∼ 450 A) and electron density (0.24 e−/A3) didnot change in the presence of water, indicating that no swelling of the Topas layeroccurred.
3.1 Lipid membranes on a thermoplastic substrate 19
α αSiOx
10-9
10-7
10-5
10-3
10-1
101
103
I/I0
0.50.40.30.20.10.0qz [1/Å]
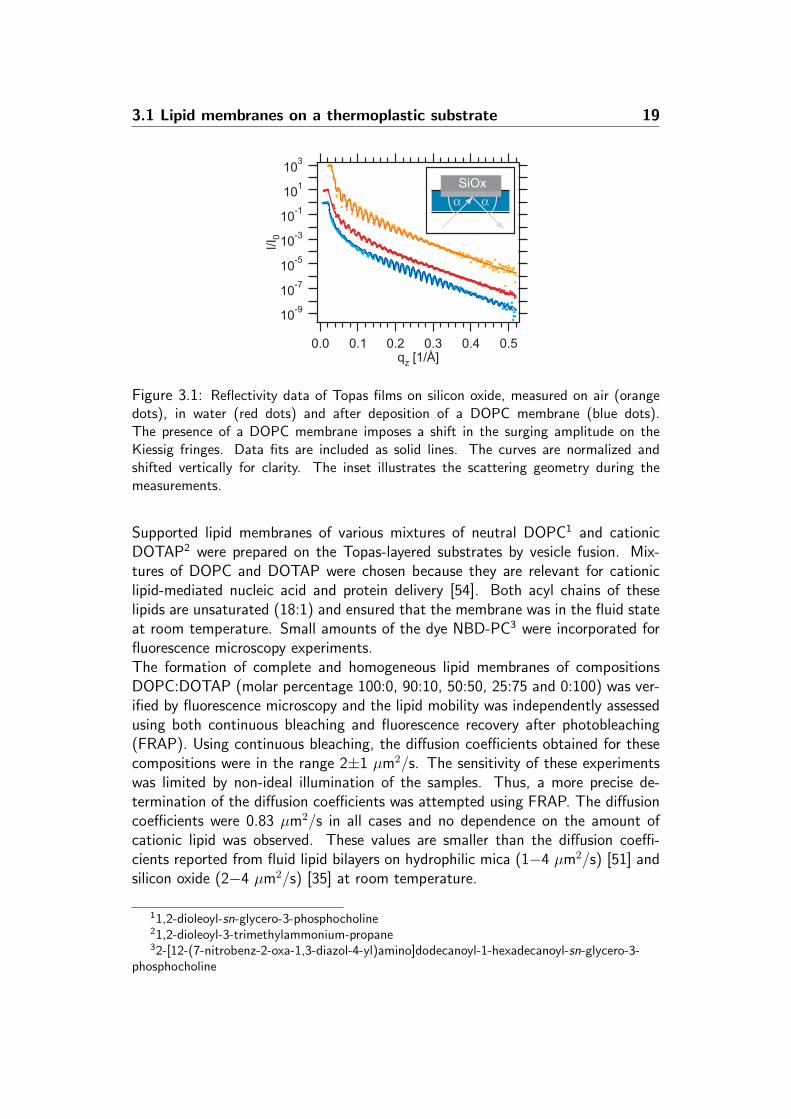
Figure 3.1: Reflectivity data of Topas films on silicon oxide, measured on air (orangedots), in water (red dots) and after deposition of a DOPC membrane (blue dots).The presence of a DOPC membrane imposes a shift in the surging amplitude on theKiessig fringes. Data fits are included as solid lines. The curves are normalized andshifted vertically for clarity. The inset illustrates the scattering geometry during themeasurements.
Supported lipid membranes of various mixtures of neutral DOPC1 and cationicDOTAP2 were prepared on the Topas-layered substrates by vesicle fusion. Mix-tures of DOPC and DOTAP were chosen because they are relevant for cationiclipid-mediated nucleic acid and protein delivery [54]. Both acyl chains of theselipids are unsaturated (18:1) and ensured that the membrane was in the fluid stateat room temperature. Small amounts of the dye NBD-PC3 were incorporated forfluorescence microscopy experiments.The formation of complete and homogeneous lipid membranes of compositionsDOPC:DOTAP (molar percentage 100:0, 90:10, 50:50, 25:75 and 0:100) was ver-ified by fluorescence microscopy and the lipid mobility was independently assessedusing both continuous bleaching and fluorescence recovery after photobleaching(FRAP). Using continuous bleaching, the diffusion coefficients obtained for thesecompositions were in the range 2±1 µm2/s. The sensitivity of these experimentswas limited by non-ideal illumination of the samples. Thus, a more precise de-termination of the diffusion coefficients was attempted using FRAP. The diffusioncoefficients were 0.83 µm2/s in all cases and no dependence on the amount ofcationic lipid was observed. These values are smaller than the diffusion coeffi-cients reported from fluid lipid bilayers on hydrophilic mica (1−4 µm2/s) [51] andsilicon oxide (2−4 µm2/s) [35] at room temperature.
11,2-dioleoyl-sn-glycero-3-phosphocholine21,2-dioleoyl-3-trimethylammonium-propane32-[12-(7-nitrobenz-2-oxa-1,3-diazol-4-yl)amino]dodecanoyl-1-hexadecanoyl-sn-glycero-3-
phosphocholine

20 Lipid membranes on polymer supports
yalonom
re
atad
reyalib
10-10
10-9
10-8
10-7
I/I0
q • 4
Å[ 4]
0.50.40.30.20.1qz [1/Å]
( )( )
n
m
H2O COCre
yali
b
yalo
nom
re
COCH2O
0.40
0.35
0.30
0.25
0.20
ρe [
-Å/
3 ]
40200-20h [Å](a) (b)
Figure 3.2: (a) The measured reflectivity of a DOPC membrane on Topas is plotted withFresnel normalization (center) and compared with the optimal data fits obtained fromfitting a bilayer (top curve) or a monolayer model (bottom curve). (b) Electron densityprofiles corresponding to the fit curves. Schematic drawings of the proposed models areincluded. The structural formula of Topas is placed in the upper right corner.
X-ray reflectivity measurements were performed at the ESRF on DOPC mem-branes supported on Topas. After deposition of the membrane, the observedKiessig fringes were still dominated by the oscillations resulting from the Topaslayer; however, the presence of additional layers (thickness Topas layer) wasclearly indicated by a shift of the surging amplitude (Fig. 3.1). We comparedtwo different structural models to assess the possibility of the formation of a lipidmonolayer or a lipid bilayer. We expected one of these two limiting cases to rep-resent the actual state of the membrane and exclude heterogeneous structures,since it was very unlikely that heterogeneously formed membranes would displaysuch a high and uniform lateral lipid fluidity. By simulating the reflectivity basedon slab models representing either a lipid monolayer or lipid bilayer, we found thatthe data were better described by the bilayer model (Fig. 3.2). The characteristicshift of the surging amplitude could not be adequately reproduced by fitting amonolayer model. The bilayer model however described the data reasonably welland a quantitative data fit provided following parameters: Electron density of lipidheadgroups (ρ1 = 0.34 e−/A3), acyl chains (ρ2 = 0.26 e−/A3) and headgroup-headgroup distance (d = 29 A). These results were different from values reportedfrom X-ray studies on silicon oxide supported lipid multilayers of DOPC [55], wherethe corresponding values were ρ1 = 0.44−46 e−/A3, ρ2 = 0.24−0.29 e−/A3 andd = 37 A. The parameters obtained from our work indicated that a lipid bilayerwith a substantially modified structure formed on Topas. The bilayer appeared’thinned’ and less densely packed than a bilayer on silicon oxide and exhibiteda slightly reduced lipid fluidity. We proposed two possible configurations of theTopas-supported bilayer: A configuration with coiled acyl chains, and a configura-tion with interdigitated acyl chains (Fig.3.3). Both models account for the reduced

3.2 Lipid membranes on dielectric polymer multilayers 21
d
d
ρ1 = 0.46 e /A- 3
ρ2 = 0.24 - 0.29 e /A- 3
ρ1 = 0.34 e /A- 3 ρ2 = 0.26 e /A- 3
d
support
SiOx
COC
(b)
(c)
(a)
Figure 3.3: (a) Schematic of the lipid bilayer structure as found on silicon oxide sub-strates. The two proposed lipid arrangements within a thinned bilayer on Topas areillustrated below: (b) coiled tails and (c) interdigitated tails.
bilayer thickness found in this study.
3.2 Lipid membranes on dielectric polymer multi-layers
Part of the work described in this section has been published [3]. The full articleis attached in Appendix A.3.
Layer-by-layer self assembly of polyanions and polycations on solid supports hasevolved as a simple and reliable method to build up multilayer architectures ofdefined thickness and net charge density [56]. Potential applications are for ex-ample silicon-on-insulator transistors, wherein polyelectrolyte multilayers act as adielectric [57]. The high hydrophilicity of such multilayer stacks also make thempromising substrates for lipid bilayers and therefore useful for biosensoric applica-tions. Most of the charges within a polyelectrolyte layer are compensated by thecharges of the opposing layer and can be further screened by counterions allocatedfrom buffer solutions [57, 58].In this study, we intended to characterize polyelectrolyte multilayers of varyingthicknesses (number of monolayers n=1, 7, 13) and to investigate the structureof SLBs adhered on top of the uppermost layer in terms structural modificationsdue to the polyanion/polycation multilayer support. We chose polyallylamine hy-drochloride (PAH, positive net charge) and poly(sodium 4-styrenesulfonate) (PSS,negative net charge) to build up multilayer architectures on silicon oxide. This
22 Lipid membranes on polymer supports
silicon oxide
PAH
Liquid (buffer solution)
silicon oxide
DOPS
PAH
Liquid
(a) (b)
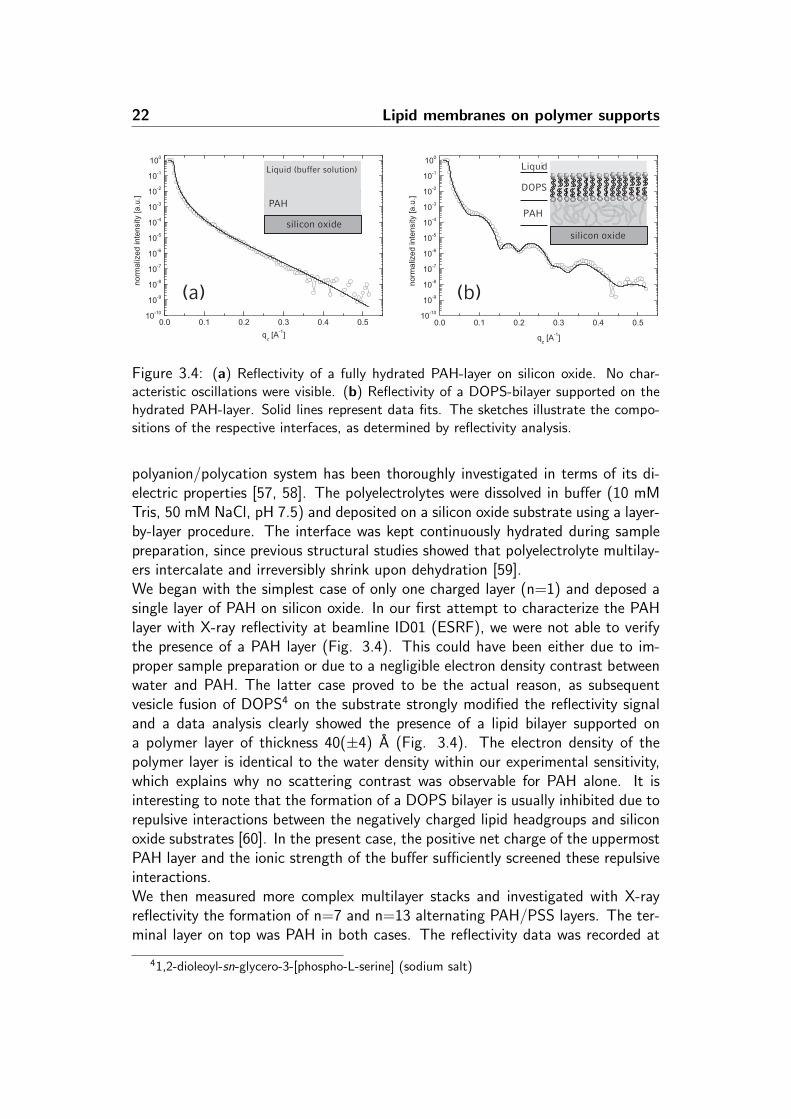
Figure 3.4: (a) Reflectivity of a fully hydrated PAH-layer on silicon oxide. No char-acteristic oscillations were visible. (b) Reflectivity of a DOPS-bilayer supported on thehydrated PAH-layer. Solid lines represent data fits. The sketches illustrate the compo-sitions of the respective interfaces, as determined by reflectivity analysis.
polyanion/polycation system has been thoroughly investigated in terms of its di-electric properties [57, 58]. The polyelectrolytes were dissolved in buffer (10 mMTris, 50 mM NaCl, pH 7.5) and deposited on a silicon oxide substrate using a layer-by-layer procedure. The interface was kept continuously hydrated during samplepreparation, since previous structural studies showed that polyelectrolyte multilay-ers intercalate and irreversibly shrink upon dehydration [59].We began with the simplest case of only one charged layer (n=1) and deposed asingle layer of PAH on silicon oxide. In our first attempt to characterize the PAHlayer with X-ray reflectivity at beamline ID01 (ESRF), we were not able to verifythe presence of a PAH layer (Fig. 3.4). This could have been either due to im-proper sample preparation or due to a negligible electron density contrast betweenwater and PAH. The latter case proved to be the actual reason, as subsequentvesicle fusion of DOPS4 on the substrate strongly modified the reflectivity signaland a data analysis clearly showed the presence of a lipid bilayer supported ona polymer layer of thickness 40(±4) A (Fig. 3.4). The electron density of thepolymer layer is identical to the water density within our experimental sensitivity,which explains why no scattering contrast was observable for PAH alone. It isinteresting to note that the formation of a DOPS bilayer is usually inhibited due torepulsive interactions between the negatively charged lipid headgroups and siliconoxide substrates [60]. In the present case, the positive net charge of the uppermostPAH layer and the ionic strength of the buffer sufficiently screened these repulsiveinteractions.We then measured more complex multilayer stacks and investigated with X-rayreflectivity the formation of n=7 and n=13 alternating PAH/PSS layers. The ter-minal layer on top was PAH in both cases. The reflectivity data was recorded at
41,2-dioleoyl-sn-glycero-3-[phospho-L-serine] (sodium salt)

3.2 Lipid membranes on dielectric polymer multilayers 23
7 layers
13layers
Å
silicon oxide
head-head distance
13 PAH/PSSmultilayers
silicon oxide
7 PAH/PSSmultilayers
Figure 3.5: Electron density profiles for polyelectrolyte stacks of 7 and 13 multilayers.The most prominent contribution to the contrast is provided by the water-free acyl chainsof the polymer supported lipid bilayers.
beamline D4 (Hasylab) and initially did not indicate any presence of multilayersdue to vanishing contrast. However, upon incubation of the n=7 layer samplewith DOPS vesicles, Kiessig fringes became apparent in the reflectivity, whichwe have associated in the electron density profile with a water-depleted layer of∼40 A in a distance of 82(±7) A (= the multilayer) from the silicon oxide (Fig.3.5). The Kiessig fringes in the data were well pronounced only in the region ofsmall momentum transfer (qz < 0.2 A−1) and vanish at higher qz due to the rela-tively large interface roughness (∼12 A) of the terminal PAH-layer on top of themultilayer. Correlative results were obtained in a subsequent experiment, whereneutral DOPC vesicles were spread on n=13 PAH/PSS layers. In this case, againa water-depleted region of ∼40 A was found on top of a multilayer of thickness133(±10) A with a roughness of 11 A. We have associated the observed water-freelayer in both cases with the hydrophobic acyl chains of a SLB, situated on top ofthe multilayer structure. The fact that we did not observe representative featuresof lipid headgroups in both electron density profiles suggests that the roughness ofthe multilayer surface resulted in a corrugated bilayer, which smeared the laterallyaveraged headgroup density in the profile. Incomplete surface coverage or interca-lation of lipid headgroups within cavities of the underlying polymer could also bea reason for vanishing headgroup contrast.These experiments allowed us to elucidate the structure of polyelectrolyte mul-tilayers with regard to applications as dielectric polymer cushions for supportinglipid bilayers. Their high water content makes these polar hydrophilic polymersundistinguishable from water by means of X-rays, and allows the SLB to appearas virtually floating. Upon increasing the number of layers, the overall multilayerthickness increases in a nonlinear manner, structurally reflecting the intercalationof multiple polyelectrolyte layers. The surface roughnesses of the investigated mul-

24 Lipid membranes on polymer supports
tilayer stacks are ∼1 nm and the SLB structure on top appears smeared, althoughclearly identifiable by the drop in electron density of the hydrophobic acyl chains.

Chapter 4
Structure and dynamics ofcrystalline protein layers bound tosupported lipid bilayers
Part of the work described in this chapter has been published [4]. The full articleis attached in Appendix A.4.
The plasma membrane of living cells consists of a variety of lipid species and asso-ciated proteins, which can self assemble to form functional lipid-protein complexes.Membrane-associated proteins can be imbedded in the lipid bilayer or peripherallyattached to the membrane. Such complexes can locally influence the membranestructure and fluidity through lipid rearrangement within the bilayer. For example,the membrane protein phospholipase A2 can bind to lipid bilayers and catalyze thehydrolysis of phospholipids into fatty acids and single-chained lipids, thus changingthe lipid composition and increasing the membrane heterogeneity [61]. System-atic structural studies of protein binding to model lipid bilayers can elucidate theimplications of lipid-protein interactions on membrane structure and fluidity. Inthe past, efforts have been made to use nanoscale-resolution techniques such asatomic force microscopy (AFM) [11] or X-ray reflectivity [62–64] to study lipid-protein binding events. Whereas the information provided by AFM is limited toheight differences in the bilayer, X-ray reflectivity offers detailed conclusions aboutthe molecular arrangement within the bilayer. X-Ray studies consistently reportthat proteins directly bound to lipid headgroups can intercalate between head-groups and change the lipid arrangement [63, 64]. So far, these studies focuson protein-coated membranes modeled by lipid monolayers prepared in Langmuirtroughs, mainly because the air-liquid interface is much more accessible to X-raysthan interfaces in a liquid environment. However, we believe that the fluid lipidbilayer at the solid-liquid interface is a much more representative and presumablymore stable model system for mimicking cell membranes than the lipid monolayer.

26 Protein layers on supported lipid membranes
Streptavid
in
Avidin
SOPC
biotin-X-DPPE
(a)(b)
Figure 4.1: (a) Schematic of streptavidin/avidin binding to a SLB. (b) Fluorescencemicrograph of the SLB surface, showing dark crystalline domains of streptavidin, sur-rounded by a matrix of partially fluorescently labeled avidin. The protein compositionfor this sample was 50:40:10 mass percent of streptavidin:avidin:alexa488-avidin. Scalebar is 100 µm (orange).
In this project, we have studied the binding of the proteins streptavidin and avidinto biotinylated lipids in a supported lipid bilayer by means of X-ray reflectivityand fluorescence microscopy. This model system is widely used in biotechnologi-cal research since the streptavidin-biotin interaction has a very strong noncovalentbinding affinity. The binding of streptavidin to model membranes occurs throughbiotin anchors on the membrane surface, where it can form 2D-crystalline arrays[65, 66]. A schematic is shown in Fig. 4.1. In the case of lipid monolayers, it hasbeen reported that the lipid packing is heavily distorted upon streptavidin bindingwith the protein partially penetrating the monolayer [64]. The key questions raisedin our work were: Can we resolve a single protein layer with X-rays? Does proteinbinding significantly affect the structure of the underlying lipid bilayer, as reportedfor lipid monolayers? What are the implications for the lipid fluidity upon proteinbinding?All experiments were conducted at the beamline ID01 (ESRF) using the microflu-idic setup; the same samples were used for X-ray reflectivity and fluorescencemicroscopy studies. We prepared lipid mixtures of SOPC1 and biotin-X-DPPE2
with molar ratio 9:1, respectively, and added a small amount of the fluorescencedye Texas Red DPPE3. Single homogeneous SLBs of this lipid composition weredeposited on silicon oxide substrates by the spin coating technique. Previous efforts
11-stearoyl-2-oleoyl-sn-glycero-3-phosphocholine2N-((6-(biotinoyl)amino)hexanoyl)-1,2-dihexadecanoyl-sn-glycero-3-phosphoethanolamine3Texas Red - 1,2-dihexadecanoyl-sn-glycero-3-phosphoethanolamine

Protein layers on supported lipid membranes 27
I
II
III
IV
qz [Å-1]
Fres
nel r
efle
ctiv
ity (R
/RF)
Figure 4.2: Reflectivity scans of protein-coated (I-III ) and bare SLBs (IV ). The com-positions of the protein solutions were (I ) 90:0:10, (II ) 50:40:10 and (III ) 10:80:10mass percent of streptavidin:avidin:alexa488-avidin. All data are presented with Fresnelnormalization and with the corresponding data fits (solid lines).
to form SLBs from these compositions using vesicle fusion were not successful. Theproper formation of the single SLBs from spin coating was verified using fluores-cence microscopy and the lateral diffusion coefficients were measured by continuousbleaching. All samples showed diffusion coefficients of 2.3 (±0.4) µm2/s.Protein solutions composed of streptavidin, egg white avidin and a fluorescentlylabeled conjugate of avidin (alexa488-avidin) were used to incubate the samples indifferent volume ratios of 90:0:10, 50:40:10 and 10:80:10, respectively. Whereasstreptavidin is known to form 2D crystal arrays, avidin does not crystallize at neu-tral pH due to its high isoelectric point of ∼10 and its bulky glycosylation groups.Thus, these protein compositions formed dark crystalline streptavidin domains sur-rounded by partially fluorescently labeled avidin, as shown in Fig. 4.1. The bilayersurface was completely covered with protein for all compositions. The protein do-mains exhibited the characteristic X- and H-shapes of streptavidin crystals withC222 symmetry as observed on lipid monolayers [67] and giant unilamellar vesicles[65]. The nucleation density, shape and size of the domains were uniform acrossthe whole substrate (20×15 mm2), indicating large-scale homogeneity of the pro-tein layer and the underlying lipid bilayer. All protein layers appeared immobile onthe timescale of continuous bleaching (several hours). We ascribe the immobilityto a jammed configuration of avidin among the crystalline streptavidin domains,as a result of full surface coverage. It has been previously reported that proteinsbound to membrane surfaces can show a 20- to 100-fold reduced diffusion as com-pared to the underlying lipids at high surface coverages [68]. The fluidity of theSLBs below the protein was reassessed by continuous bleaching for all samples and

28 Protein layers on supported lipid membranes
100
80
60
40
20
0
0.1 0.2 0.3 0.4 0.5 0.6 0.7
dist
ance
fro
m s
ubst
rate
[Å
]
electron density [e-/Å3]
silicon oxide
waterlayer~8 Å
head
head
chain
chain
protein
water
StreptavidinStreptavidin
Figure 4.3: Electron density profile of streptavidin/avidin coated SLBs. The overallprofile (red line) is composed of multiple components, such as the lipid headgroups, theacyl chains and the protein layer (green sigmoidal curves). The dotted line correspondsto the slab model employed for fitting the data. The thicknesses of the protein layer(40 A) and the separating water layer (8 A) between the protein and the SLB can beclearly resolved.
showed in each case a slightly reduced lipid mobility of 1.9−2.0 (±0.1) µm2/s.Thus the bound protein layer reduced the SLB mobility by only a small amount.We have characterized the SLBs prior to and after incubation with protein solutionusing X-ray reflectivity (Fig. 4.2). The electron density profiles of the SLBs lackingthe protein were very similar and showed a high symmetry across the leaflets. Afterfull formation of the protein layers, the reflectivity for each sample changed signif-icantly and the fringes exhibited a more complex signature (Fig. 4.2). The data ofall protein coated SLBs appeared very similar and were not distinguishable withinour experimental resolution. This is not surprising since streptavidin and avidinhave very similar structures [69]. Lateral segregation of streptavidin and avidinwas not detectable within the sensitivity of our X-ray reflectivity setup. Thus, thequantitative data analysis was done by fitting an 11-slab model to the averagedreflectivity of all protein coated samples. The resulting electron density profileshowed an additional feature as compared to the profiles of the bare SLBs, whichwe have assigned to a protein layer (thickness 40 A) on top of the SLBs (Fig. 4.3).Interestingly, we resolved an additional layer (thickness 8 A) separating the proteinlayer from the SLB. The electron density of this layer matched the value of water(0.334 e−/A3); we therefore concluded that this layer predominantly consists ofwater and, as a minor part, the spacer of biotin-X-DPPE.We propose that the observed reduction in lipid mobility of 10−15 % is due to

Protein layers on supported lipid membranes 29
a small fraction of biotinylated lipids that are immobilized within the SLB. Theselipids are linked to the immobile protein layer and create obstacles to membranediffusion. Theoretical descriptions of two-dimensional diffusion among obstacleshave been developed in the past [70] and simulated for the case of lipid bilayers[71]. Assuming bivalent binding (one streptavidin/avidin binds two biotinylatedlipids), a comparison of the relative sizes of lipids and proteins suggest an im-mobile lipid fraction of 0.04 at complete surface coverage. Applying the modelcalculation to our system yields an area fraction of immobilized lipids of 0.02−0.09with respect to the error margins of our diffusion coefficients. We can reasonablyexclude further lipid-protein interactions that might limit lipid diffusion due to theseparation provided by the water layer between the SLB and the proteins. This sep-aration allows the underlying lipid bilayer to retain a high fluidity and stability. Inaddition, we have shown that the lipid bilayer represents a much more stable lipidlayer than lipid monolayers. Our results contrast the observation in monolayersthat streptavidin binding rearranges lipids [64]. In general, we have demonstratedthat protein binding to lipid membranes does not necessarily modify the membranestructure.

30 Protein layers on supported lipid membranes

Chapter 5
Condensation, stretching andasymmetry: GM1 and cholesterolin single supported lipid bilayers
Part of the work described in this chapter has been submitted for publication [5].The full text of the submitted manuscript is attached in Appendix A.5.
The structural complexity of cell membranes is reflected by their numerous lipidand protein constituents, which can asymmetrically organize across the membraneleaflets and induce lipid phase separation [18]. The thickness of the membraneand the lipid fluidity depend locally on the length and degree of saturation of theacyl chains. Lipids with long saturated chains such as sphingomyelin preferentiallyinteract with cholesterol to form tightly packed domains in the membrane [19, 22].Such a condensed lipid phase (also termed liquid ordered, Lo) can coexist withnon-condensed lipid phases (liquid-disordered, Ld) over a broad range of tempera-tures. Lo domains, often referred to as lipid rafts, are proposed to play a key role inmembrane organization by concentrating specific receptor molecules into orderedlipid environments, thereby targeting their ligands to specific functional regions inthe membrane [7]. The monosialoganglioside GM1 is the receptor for cholera toxinentering the cell through the endocytic pathway and has been shown to localizeto raft domains in the outer membrane leaflet [72]. The asymmetric localizationof receptors within Lo or Ld phases is a structural phenomenon governed by inter-molecular interactions within the membrane. The leaflet asymmetry of GM1 mayalso induce an asymmetric distribution of cholesterol, whose exact transbilayer dis-tribution is not known [22]. The particular preference of GM1 to partition intocholesterol-enriched Lo phases is likely due to its saturated acyl chains, but there islittle knowledge about the interaction of its large oligosaccharide headgroup withthe lipid environment [7], although it is known that GM1 can decrease the mobilityof surrounding lipids [73].
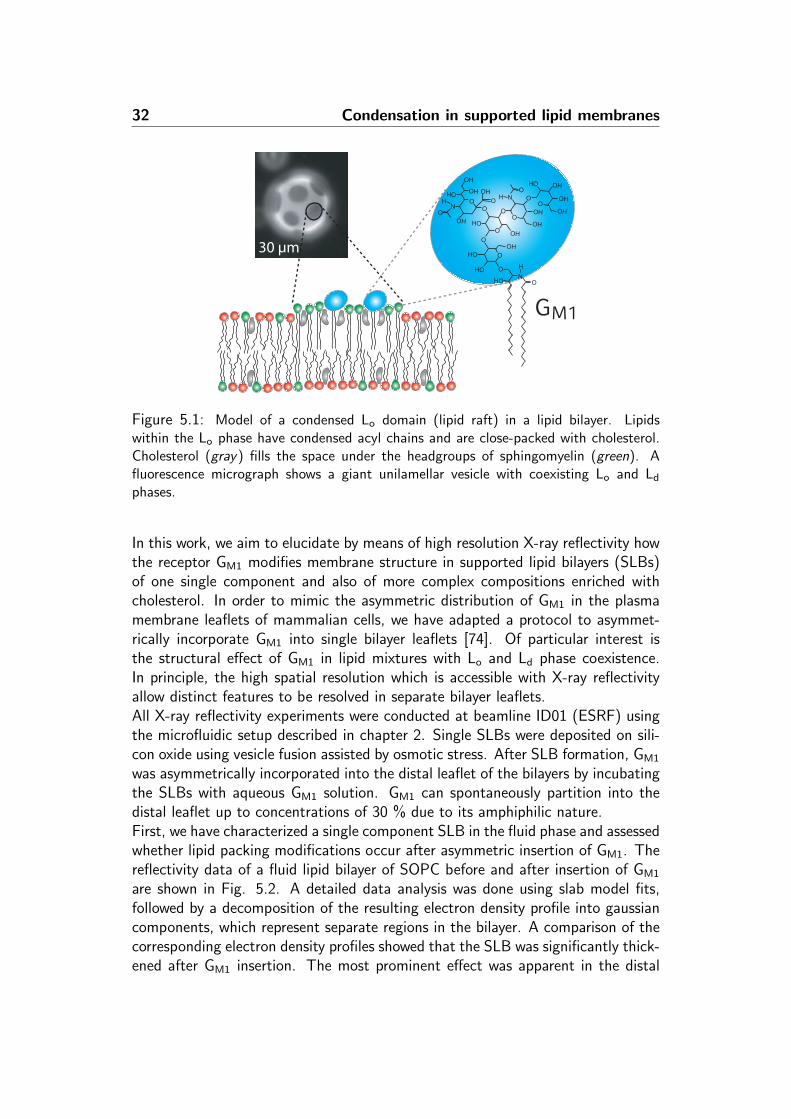
32 Condensation in supported lipid membranes
GM1
30 µm
OH
OH
OH
O OO
OOH
O
OH
OH
OHHO
NO
OOHHO
O
OH
NH
OHO
H
O
OHO
HO
O OH
OHO
NH
OHO
Figure 5.1: Model of a condensed Lo domain (lipid raft) in a lipid bilayer. Lipidswithin the Lo phase have condensed acyl chains and are close-packed with cholesterol.Cholesterol (gray) fills the space under the headgroups of sphingomyelin (green). Afluorescence micrograph shows a giant unilamellar vesicle with coexisting Lo and Ld
phases.
In this work, we aim to elucidate by means of high resolution X-ray reflectivity howthe receptor GM1 modifies membrane structure in supported lipid bilayers (SLBs)of one single component and also of more complex compositions enriched withcholesterol. In order to mimic the asymmetric distribution of GM1 in the plasmamembrane leaflets of mammalian cells, we have adapted a protocol to asymmet-rically incorporate GM1 into single bilayer leaflets [74]. Of particular interest isthe structural effect of GM1 in lipid mixtures with Lo and Ld phase coexistence.In principle, the high spatial resolution which is accessible with X-ray reflectivityallow distinct features to be resolved in separate bilayer leaflets.All X-ray reflectivity experiments were conducted at beamline ID01 (ESRF) usingthe microfluidic setup described in chapter 2. Single SLBs were deposited on sili-con oxide using vesicle fusion assisted by osmotic stress. After SLB formation, GM1
was asymmetrically incorporated into the distal leaflet of the bilayers by incubatingthe SLBs with aqueous GM1 solution. GM1 can spontaneously partition into thedistal leaflet up to concentrations of 30 % due to its amphiphilic nature.First, we have characterized a single component SLB in the fluid phase and assessedwhether lipid packing modifications occur after asymmetric insertion of GM1. Thereflectivity data of a fluid lipid bilayer of SOPC before and after insertion of GM1
are shown in Fig. 5.2. A detailed data analysis was done using slab model fits,followed by a decomposition of the resulting electron density profile into gaussiancomponents, which represent separate regions in the bilayer. A comparison of thecorresponding electron density profiles showed that the SLB was significantly thick-ened after GM1 insertion. The most prominent effect was apparent in the distal

Condensation in supported lipid membranes 33
706050403020100-10
0.6
distance from substrate [Å]
elec
tron
den
sity
[e- /Å
3 ]
0.5
0.4
0.3
0.2
0.1
0
0.7
silic
on o
xide
bilayer thickness
~59 Å
proximal leafletthickness
~26 Å
SOPC/GM1
silic
on o
xide
proximal leafletthickness
~23 Å
bilayer thickness
~48 Å0.6
elec
tron
den
sity
[e- /Å
3 ]
0.5
0.4
0.3
0.2
0.1
0.7
SOPC
0
(b)
wat
erw
ater
(a)
SOPC/GM1
SOPC
0.0 0.1 0.2 0.3 0.4 0.5 0.610-5
10-4
10-3
10-2
10-1
100
101
norm
aliz
ed re
flect
ivity
(R/R
F)
qz [Å-1]
Figure 5.2: (a) Normalized reflectivity scans with fits (solid lines) for a single SOPCbilayer before and after incubation with excess GM1. Sketches illustrate the approximatedbilayer structure and asymmetric incorporation of GM1 into the distal leaflet. (b) Electrondensity profiles (red curves) with and without incorporated GM1. The green curvesrepresent the separate regions of the membrane: the lipid headgroups, acyl chains andthe space where the acyl chains meet. The slab model used for fitting the data isincluded as dotted line.
bilayer leaflet, whose thickness was increased by 8 A. We ascribe the thickeningto a protrusion of the large oligosaccharide headgroups of GM1 above the surfaceof the neighboring phosphocholine headgroups. The protrusion length of 8 A issmaller than the reported value of 12 A from fully extended GM1 headgroups in eggPC multibilayers [75], indicating that GM1 was not completely extended from thebilayer surface. Our results clearly demonstrate that we were able to create SLBswith asymmetric GM1 distribution and we could resolve different regions within thebilayer (headgroups, acyl chains) in nanoscopic detail by means of high-resolutionX-ray reflectivity.In addition, we have investigated whether the binding of the subunit B of choleratoxin (CTB) to GM1 has an effect on the SLB structure. CTB can bind 5 GM1
receptors on the membrane surface to form a complex that allows the choleratoxin to cross the membrane [72]. Fluorescent labeled CTB was incubated withSLBs containing GM1 and specific binding to the SLB was verified by fluorescencemicroscopy. We could not detect the bound CTB layer on top of the SLB by
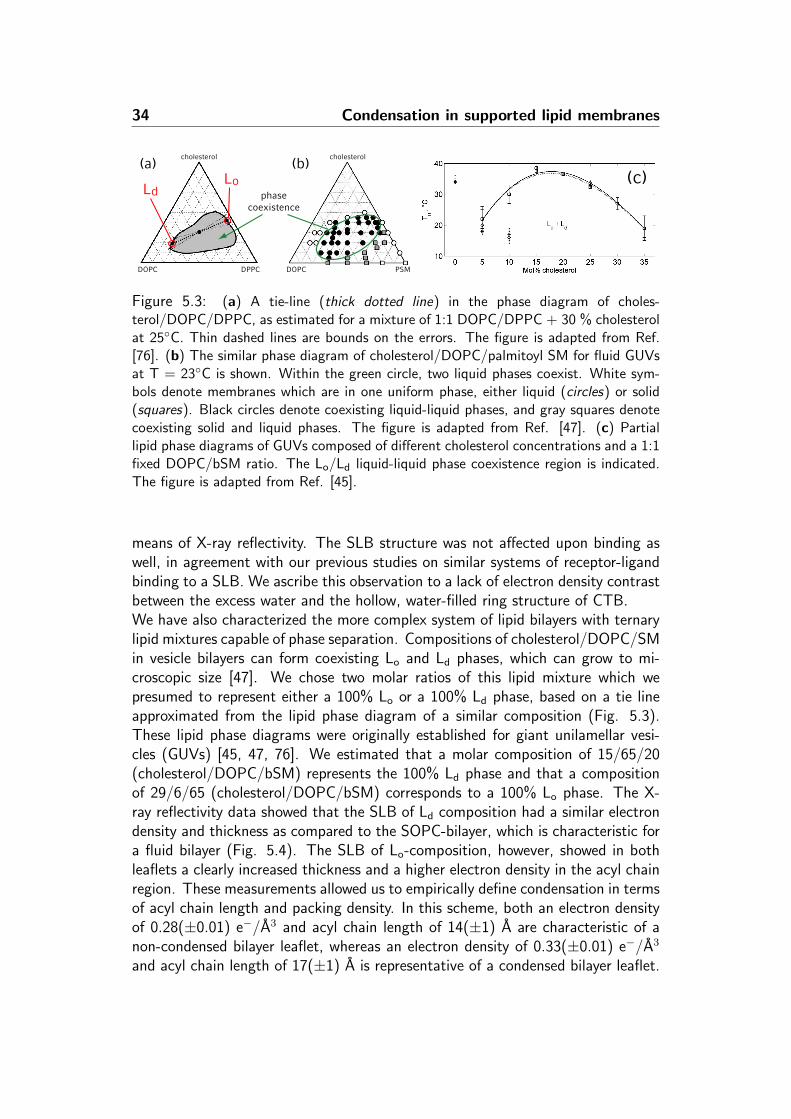
34 Condensation in supported lipid membranes
cholesterol
DOPC DPPC
cholesterol
DOPC PSM
(a) (b)
LdLo
phasecoexistence
(c)
Figure 5.3: (a) A tie-line (thick dotted line) in the phase diagram of choles-terol/DOPC/DPPC, as estimated for a mixture of 1:1 DOPC/DPPC + 30 % cholesterolat 25C. Thin dashed lines are bounds on the errors. The figure is adapted from Ref.[76]. (b) The similar phase diagram of cholesterol/DOPC/palmitoyl SM for fluid GUVsat T = 23C is shown. Within the green circle, two liquid phases coexist. White sym-bols denote membranes which are in one uniform phase, either liquid (circles) or solid(squares). Black circles denote coexisting liquid-liquid phases, and gray squares denotecoexisting solid and liquid phases. The figure is adapted from Ref. [47]. (c) Partiallipid phase diagrams of GUVs composed of different cholesterol concentrations and a 1:1fixed DOPC/bSM ratio. The Lo/Ld liquid-liquid phase coexistence region is indicated.The figure is adapted from Ref. [45].
means of X-ray reflectivity. The SLB structure was not affected upon binding aswell, in agreement with our previous studies on similar systems of receptor-ligandbinding to a SLB. We ascribe this observation to a lack of electron density contrastbetween the excess water and the hollow, water-filled ring structure of CTB.We have also characterized the more complex system of lipid bilayers with ternarylipid mixtures capable of phase separation. Compositions of cholesterol/DOPC/SMin vesicle bilayers can form coexisting Lo and Ld phases, which can grow to mi-croscopic size [47]. We chose two molar ratios of this lipid mixture which wepresumed to represent either a 100% Lo or a 100% Ld phase, based on a tie lineapproximated from the lipid phase diagram of a similar composition (Fig. 5.3).These lipid phase diagrams were originally established for giant unilamellar vesi-cles (GUVs) [45, 47, 76]. We estimated that a molar composition of 15/65/20(cholesterol/DOPC/bSM) represents the 100% Ld phase and that a compositionof 29/6/65 (cholesterol/DOPC/bSM) corresponds to a 100% Lo phase. The X-ray reflectivity data showed that the SLB of Ld composition had a similar electrondensity and thickness as compared to the SOPC-bilayer, which is characteristic fora fluid bilayer (Fig. 5.4). The SLB of Lo-composition, however, showed in bothleaflets a clearly increased thickness and a higher electron density in the acyl chainregion. These measurements allowed us to empirically define condensation in termsof acyl chain length and packing density. In this scheme, both an electron densityof 0.28(±0.01) e−/A3 and acyl chain length of 14(±1) A are characteristic of anon-condensed bilayer leaflet, whereas an electron density of 0.33(±0.01) e−/A3
and acyl chain length of 17(±1) A is representative of a condensed bilayer leaflet.

Condensation in supported lipid membranes 35
0.0 0.1 0.2 0.3 0.4 0.5
10-4
10-3
10-2
10-1
100
nor
mal
ized
ref
lect
ivit
y (R
/RF)
qz [Å-1]
liquid-disordered
liquid-ordered
(a)0
10
20
30
40
50
60
70]Å[ etartsbus
morf ecnatsid
liquid disordered (Ld)(b)
0
10
20
30
40
50
60
70]Å[ etartsbus
morf ecnatsid
electron density [e-/Å3]0.70.3 0.4 0.5 0.60.2
liquid ordered (Lo)
headgroup region
headgroup region
chain region
chain region
headgroup region
headgroup region
chain region
chain region
Figure 5.4: (a) Normalized X-ray reflectivity of SLBs with ternary compositions ofcholesterol/DOPC/bSM, modeling the Ld phase and the Lo phase. Solid lines representfits to the data. (b) Corresponding electron density profiles. The sketches representthe approximated molar ratios of cholesterol (gray), DOPC (red) and bSM (green) inthe bilayers and illustrate the differences in bilayer condensation and thickness. Thegray bars indicate the average electron density of the acyl chains for the Ld and the Lo
compositions.
These threshold values are graphically indicated in the electron density profiles ofFig. 5.4.Next, we have investigated a series of SLBs from cholesterol/DOPC/bSM mixtureswhich are capable of separation into coexisting Ld and Lo phases in GUVs. SLBsof molar compositions of 20/40/40 (referred to as 20chol), 30/35/35 (30chol)and 40/30/30 (40chol) were chosen. X-ray reflectivity showed that the structureof 20chol corresponded to a condensed phase, whereas 30chol 40chol were non-condensed (Fig. 5.5). A qualitative comparison with the GUV phase diagramshows that condensation is expected in GUVs of composition 20/40/40; whereasGUVs of 30/35/35 are at the onset of Ld/Lo coexistence and GUVs of 40/30/30are clearly in the non-condensed single phase region [45]. These results indicatethat the condensation states of a lipid bilayer on a solid support are at least inpartial agreement with the results found in free standing GUVs (compare Fig. 5.3and Fig. 5.6).The samples 20chol, 30chol and 40chol were reassessed after asymmetric insertionof GM1. The capability of GM1 to locally moderate lipid bilayer shape and fluidityin cholesterol-enriched lipid mixtures has been previously investigated [77, 78]; inthis work, we studied the structural implications of GM1 insertion into such mix-tures. We found that asymmetrically incorporated GM1 had only minor structuralinfluence on the already condensed 20chol -SLB. However, the structures of thenon-condensed SLBs, 30chol and 40chol, changed significantly in the presence of

36 Condensation in supported lipid membranes
-10
0
10
20
30
40
50
60
70
dist
ance
fro
m s
ubst
rate
[Å
]
30chol
20chol
40chol
(a)
-10
0
10
20
30
40
50
60
70
0.0 0.1 0.2 0.3 0.4 0.5 0.6 0.7
electron density [e− /Å3]
dist
ance
fro
m s
ubst
rate
[Å
]
20chol + GM1
30chol + GM1
40chol + GM1
(b)
Figure 5.5: Electron density profiles of cholesterol/DOPC/bSM SLBs with equimolarcomposition of DOPC and bSM, with (a) and without GM1 (b). The electron densityaxis is correctly aligned for 40chol and 40chol+GM1; the other profiles are shifted forclarity. The gray vertical lines indicate the lower and upper threshold values for theelectron density of the acyl chains, as defined in the text and illustrated in Fig. 5.4.The intermediate region between the lower value (0.28 e−/A3, non-condensed) and theupper value (0.33 e−/A3, condensed) is shaded for clarity of presentation.
GM1. These SLBs exhibited a strong condensation in the distal leaflet, where GM1
was actually present (Fig. 5.5). The proximal leaflet, lacking GM1, was not affectedby the condensation of the neighboring leaflet.As in our other work, we used fluorescence microscopy to complement the struc-tural X-ray studies. We examined the samples 20chol, 30chol and 40chol for ho-mogeneity prior to GM1 incubation. All samples showed uniform fluorescence fromTexas Red-DPPE, and no observable phase separation occurred on our smoothsilicon oxide substrates (roughness 3 A). Interestingly, we have observed for allsamples the formation of dark immobile domains (∼5 µm) upon incorporation ofGM1 (Fig. 5.6). These domains did not change size or shape up to a tempera-ture increase of 70C, suggesting that they were membrane defects such as pinnedGM1 clusters or bare surface areas. In sample 20chol, gray spots (∼5 µm) werepresent which disappeared upon heating at 40C and reappeared at the same po-sitions upon recooling. The size of these spots and their partial exclusion of thefluorescence dye indicates that the presence of GM1 can induce micron scale do-main segregation, probably Lo domains. Finally, the lipid diffusion of the samples
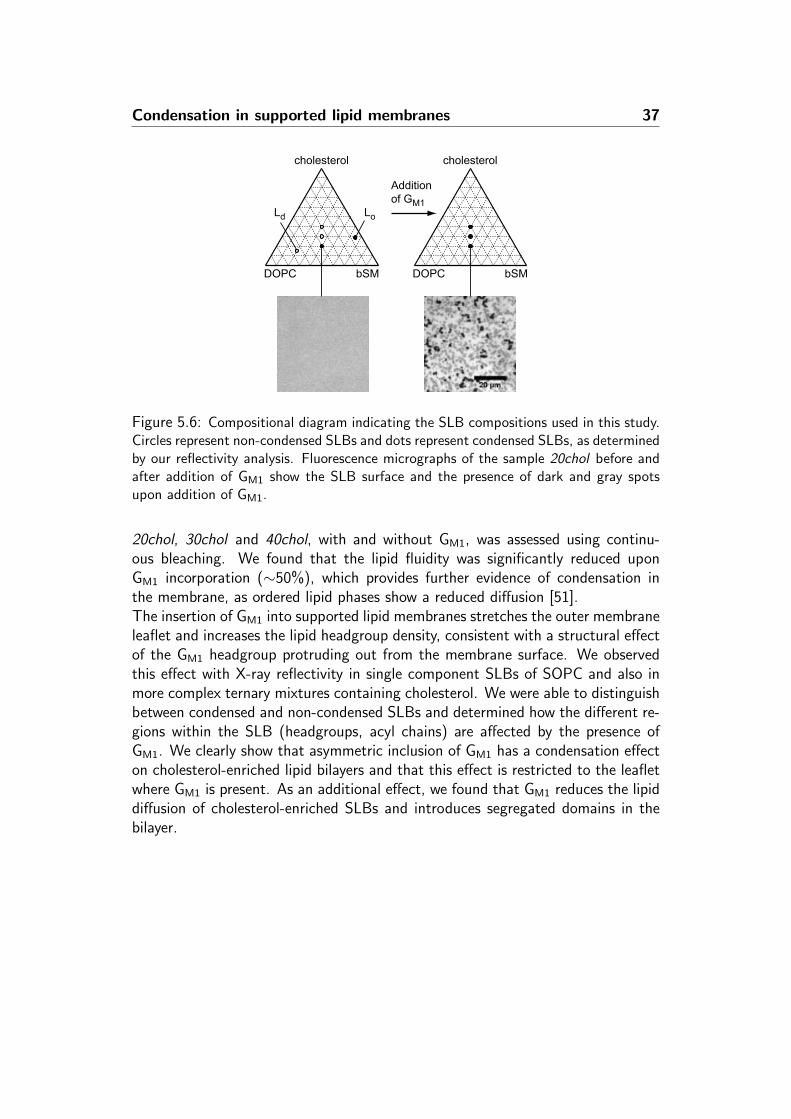
Condensation in supported lipid membranes 37
DOPC bSM
cholesterol
DOPC bSM
cholesterol
Additionof GM1
LoLd
Figure 5.6: Compositional diagram indicating the SLB compositions used in this study.Circles represent non-condensed SLBs and dots represent condensed SLBs, as determinedby our reflectivity analysis. Fluorescence micrographs of the sample 20chol before andafter addition of GM1 show the SLB surface and the presence of dark and gray spotsupon addition of GM1.
20chol, 30chol and 40chol, with and without GM1, was assessed using continu-ous bleaching. We found that the lipid fluidity was significantly reduced uponGM1 incorporation (∼50%), which provides further evidence of condensation inthe membrane, as ordered lipid phases show a reduced diffusion [51].The insertion of GM1 into supported lipid membranes stretches the outer membraneleaflet and increases the lipid headgroup density, consistent with a structural effectof the GM1 headgroup protruding out from the membrane surface. We observedthis effect with X-ray reflectivity in single component SLBs of SOPC and also inmore complex ternary mixtures containing cholesterol. We were able to distinguishbetween condensed and non-condensed SLBs and determined how the different re-gions within the SLB (headgroups, acyl chains) are affected by the presence ofGM1. We clearly show that asymmetric inclusion of GM1 has a condensation effecton cholesterol-enriched lipid bilayers and that this effect is restricted to the leafletwhere GM1 is present. As an additional effect, we found that GM1 reduces the lipiddiffusion of cholesterol-enriched SLBs and introduces segregated domains in thebilayer.

38 Condensation in supported lipid membranes

Appendix A
Publications
A.1 Full text of Ref. [1]
Christian Reich, Marion B. Hochrein, Barbel Krause and Bert Nickel
A microfluidic setup for studies of solid-liquid interfaces using x-ray reflectivity andfluorescence microscopy.
Review of Scientific Instruments 76, 095103 (2005).
This paper also has been selected for the compilation journals
Virtual Journal of Nanoscale Science & Technology 12 Iss. 12 (2005).andVirtual Journal of Biological Physics Research 10 Iss. 6 (2005).
Abstract:In this paper we present a concept for a microfluidic chamber optimized for x-rayreflectivity studies at solid-liquid interfaces. Experiments of this kind are usuallyconsiderably limited by strong beam attenuation due to interactions with the aque-ous environment. First experiments at synchrotron sources using supported modelmembranes showed that the microfluidic setup yields a very effective solution forminimizing background scattering and beam absorption, which are often accom-panied by radiation damage of biological samples. Additionally, the setup is alsowell suited for the application of fluorescence microscopy. The application of thesetwo different techniques on the same sample offers unique possibilities for comple-mentary studies.
Permanent weblink:http://dx.doi.org/10.1063/1.2040187

40 A. Publications
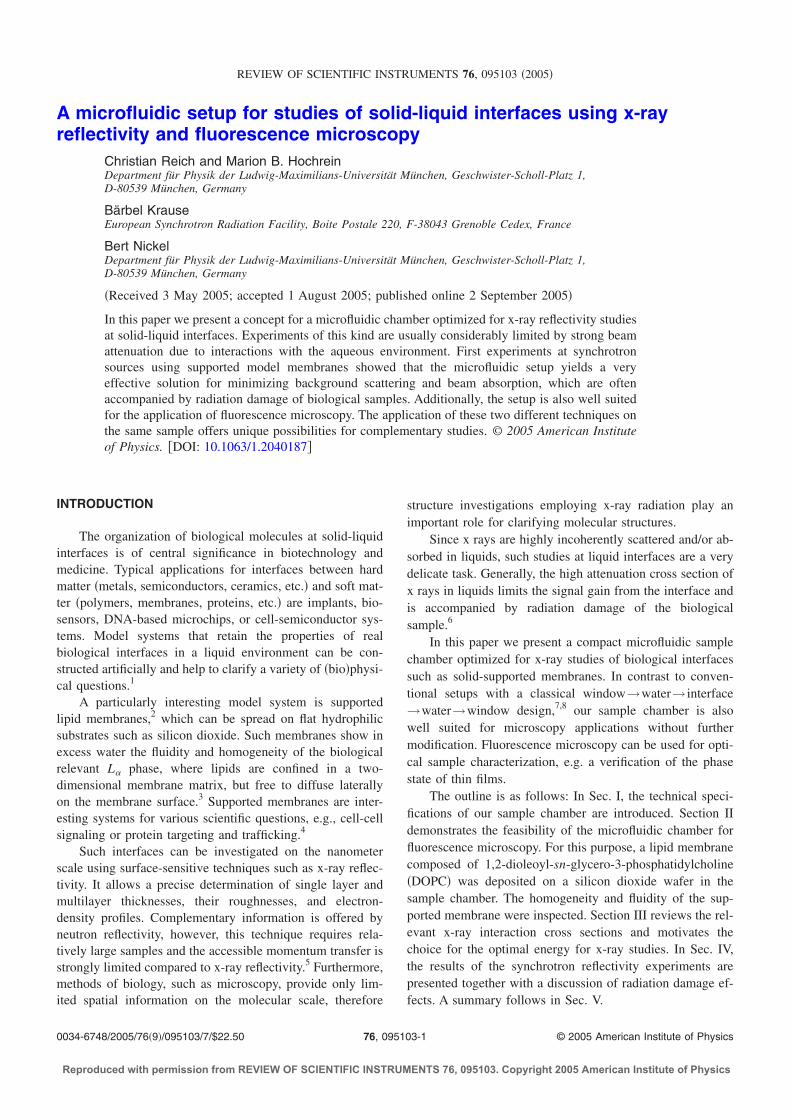
A microfluidic setup for studies of solid-liquid interfaces using x-rayreflectivity and fluorescence microscopy
Christian Reich and Marion B. HochreinDepartment für Physik der Ludwig-Maximilians-Universität München, Geschwister-Scholl-Platz 1,D-80539 München, Germany
Bärbel KrauseEuropean Synchrotron Radiation Facility, Boite Postale 220, F-38043 Grenoble Cedex, France
Bert NickelDepartment für Physik der Ludwig-Maximilians-Universität München, Geschwister-Scholl-Platz 1,D-80539 München, Germany
Received 3 May 2005; accepted 1 August 2005; published online 2 September 2005
In this paper we present a concept for a microfluidic chamber optimized for x-ray reflectivity studiesat solid-liquid interfaces. Experiments of this kind are usually considerably limited by strong beamattenuation due to interactions with the aqueous environment. First experiments at synchrotronsources using supported model membranes showed that the microfluidic setup yields a veryeffective solution for minimizing background scattering and beam absorption, which are oftenaccompanied by radiation damage of biological samples. Additionally, the setup is also well suitedfor the application of fluorescence microscopy. The application of these two different techniques onthe same sample offers unique possibilities for complementary studies. © 2005 American Instituteof Physics. DOI: 10.1063/1.2040187
INTRODUCTION
The organization of biological molecules at solid-liquidinterfaces is of central significance in biotechnology andmedicine. Typical applications for interfaces between hardmatter metals, semiconductors, ceramics, etc. and soft mat-ter polymers, membranes, proteins, etc. are implants, bio-sensors, DNA-based microchips, or cell-semiconductor sys-tems. Model systems that retain the properties of realbiological interfaces in a liquid environment can be con-structed artificially and help to clarify a variety of biophysi-cal questions.1
A particularly interesting model system is supportedlipid membranes,2 which can be spread on flat hydrophilicsubstrates such as silicon dioxide. Such membranes show inexcess water the fluidity and homogeneity of the biologicalrelevant L phase, where lipids are confined in a two-dimensional membrane matrix, but free to diffuse laterallyon the membrane surface.3 Supported membranes are inter-esting systems for various scientific questions, e.g., cell-cellsignaling or protein targeting and trafficking.4
Such interfaces can be investigated on the nanometerscale using surface-sensitive techniques such as x-ray reflec-tivity. It allows a precise determination of single layer andmultilayer thicknesses, their roughnesses, and electron-density profiles. Complementary information is offered byneutron reflectivity, however, this technique requires rela-tively large samples and the accessible momentum transfer isstrongly limited compared to x-ray reflectivity.5 Furthermore,methods of biology, such as microscopy, provide only lim-ited spatial information on the molecular scale, therefore
structure investigations employing x-ray radiation play animportant role for clarifying molecular structures.
Since x rays are highly incoherently scattered and/or ab-sorbed in liquids, such studies at liquid interfaces are a verydelicate task. Generally, the high attenuation cross section ofx rays in liquids limits the signal gain from the interface andis accompanied by radiation damage of the biologicalsample.6
In this paper we present a compact microfluidic samplechamber optimized for x-ray studies of biological interfacessuch as solid-supported membranes. In contrast to conven-tional setups with a classical window→water→ interface→water→window design,7,8 our sample chamber is alsowell suited for microscopy applications without furthermodification. Fluorescence microscopy can be used for opti-cal sample characterization, e.g. a verification of the phasestate of thin films.
The outline is as follows: In Sec. I, the technical speci-fications of our sample chamber are introduced. Section IIdemonstrates the feasibility of the microfluidic chamber forfluorescence microscopy. For this purpose, a lipid membranecomposed of 1,2-dioleoyl-sn-glycero-3-phosphatidylcholineDOPC was deposited on a silicon dioxide wafer in thesample chamber. The homogeneity and fluidity of the sup-ported membrane were inspected. Section III reviews the rel-evant x-ray interaction cross sections and motivates thechoice for the optimal energy for x-ray studies. In Sec. IV,the results of the synchrotron reflectivity experiments arepresented together with a discussion of radiation damage ef-fects. A summary follows in Sec. V.
REVIEW OF SCIENTIFIC INSTRUMENTS 76, 095103 2005
0034-6748/2005/769/095103/7/$22.50 © 2005 American Institute of Physics76, 095103-1
Reproduced with permission from REVIEW OF SCIENTIFIC INSTRUMENTS 76, 095103. Copyright 2005 American Institute of Physics
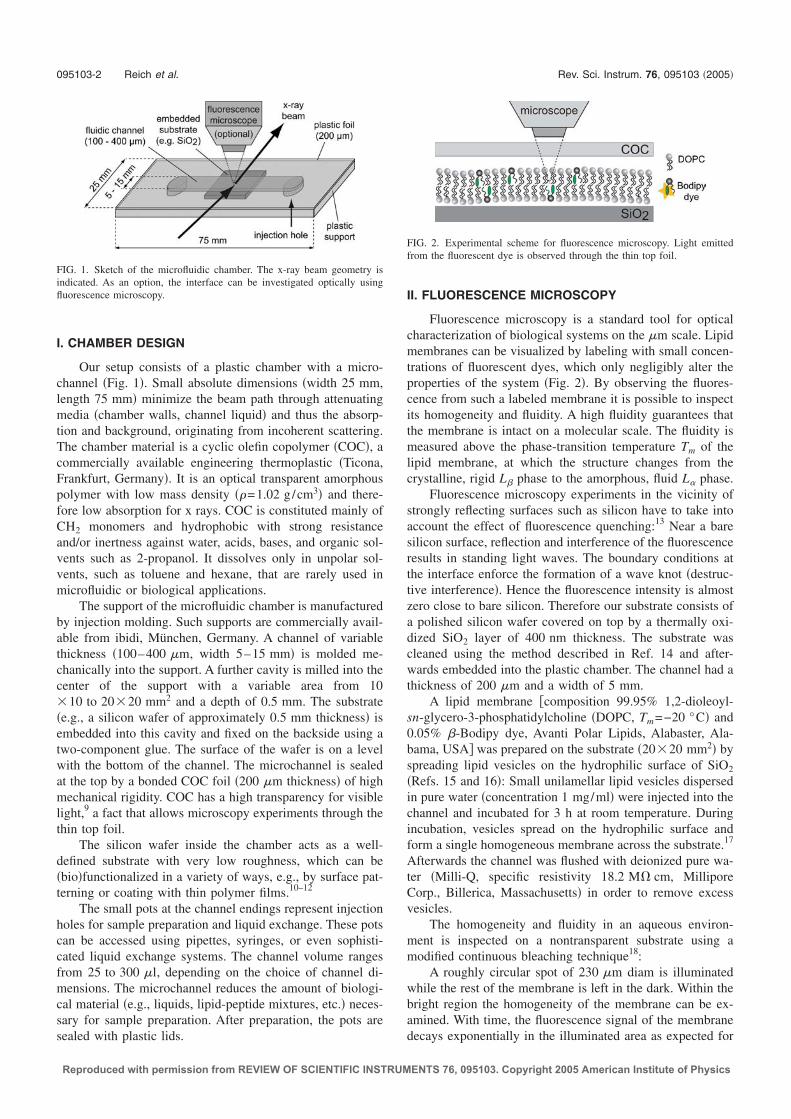
I. CHAMBER DESIGN
Our setup consists of a plastic chamber with a micro-channel Fig. 1. Small absolute dimensions width 25 mm,length 75 mm minimize the beam path through attenuatingmedia chamber walls, channel liquid and thus the absorp-tion and background, originating from incoherent scattering.The chamber material is a cyclic olefin copolymer COC, acommercially available engineering thermoplastic Ticona,Frankfurt, Germany. It is an optical transparent amorphouspolymer with low mass density =1.02 g/cm3 and there-fore low absorption for x rays. COC is constituted mainly ofCH2 monomers and hydrophobic with strong resistanceand/or inertness against water, acids, bases, and organic sol-vents such as 2-propanol. It dissolves only in unpolar sol-vents, such as toluene and hexane, that are rarely used inmicrofluidic or biological applications.
The support of the microfluidic chamber is manufacturedby injection molding. Such supports are commercially avail-able from ibidi, München, Germany. A channel of variablethickness 100–400 m, width 5–15 mm is molded me-chanically into the support. A further cavity is milled into thecenter of the support with a variable area from 1010 to 2020 mm2 and a depth of 0.5 mm. The substratee.g., a silicon wafer of approximately 0.5 mm thickness isembedded into this cavity and fixed on the backside using atwo-component glue. The surface of the wafer is on a levelwith the bottom of the channel. The microchannel is sealedat the top by a bonded COC foil 200 m thickness of highmechanical rigidity. COC has a high transparency for visiblelight,9 a fact that allows microscopy experiments through thethin top foil.
The silicon wafer inside the chamber acts as a well-defined substrate with very low roughness, which can bebiofunctionalized in a variety of ways, e.g., by surface pat-terning or coating with thin polymer films.10–12
The small pots at the channel endings represent injectionholes for sample preparation and liquid exchange. These potscan be accessed using pipettes, syringes, or even sophisti-cated liquid exchange systems. The channel volume rangesfrom 25 to 300 l, depending on the choice of channel di-mensions. The microchannel reduces the amount of biologi-cal material e.g., liquids, lipid-peptide mixtures, etc. neces-sary for sample preparation. After preparation, the pots aresealed with plastic lids.
II. FLUORESCENCE MICROSCOPY
Fluorescence microscopy is a standard tool for opticalcharacterization of biological systems on the m scale. Lipidmembranes can be visualized by labeling with small concen-trations of fluorescent dyes, which only negligibly alter theproperties of the system Fig. 2. By observing the fluores-cence from such a labeled membrane it is possible to inspectits homogeneity and fluidity. A high fluidity guarantees thatthe membrane is intact on a molecular scale. The fluidity ismeasured above the phase-transition temperature Tm of thelipid membrane, at which the structure changes from thecrystalline, rigid L phase to the amorphous, fluid L phase.
Fluorescence microscopy experiments in the vicinity ofstrongly reflecting surfaces such as silicon have to take intoaccount the effect of fluorescence quenching:13 Near a baresilicon surface, reflection and interference of the fluorescenceresults in standing light waves. The boundary conditions atthe interface enforce the formation of a wave knot destruc-tive interference. Hence the fluorescence intensity is almostzero close to bare silicon. Therefore our substrate consists ofa polished silicon wafer covered on top by a thermally oxi-dized SiO2 layer of 400 nm thickness. The substrate wascleaned using the method described in Ref. 14 and after-wards embedded into the plastic chamber. The channel had athickness of 200 m and a width of 5 mm.
A lipid membrane composition 99.95% 1,2-dioleoyl-sn-glycero-3-phosphatidylcholine DOPC, Tm=−20 °C and0.05% -Bodipy dye, Avanti Polar Lipids, Alabaster, Ala-bama, USA was prepared on the substrate 2020 mm2 byspreading lipid vesicles on the hydrophilic surface of SiO2
Refs. 15 and 16: Small unilamellar lipid vesicles dispersedin pure water concentration 1 mg/ml were injected into thechannel and incubated for 3 h at room temperature. Duringincubation, vesicles spread on the hydrophilic surface andform a single homogeneous membrane across the substrate.17
Afterwards the channel was flushed with deionized pure wa-ter Milli-Q, specific resistivity 18.2 M cm, MilliporeCorp., Billerica, Massachusetts in order to remove excessvesicles.
The homogeneity and fluidity in an aqueous environ-ment is inspected on a nontransparent substrate using amodified continuous bleaching technique18:
A roughly circular spot of 230 m diam is illuminatedwhile the rest of the membrane is left in the dark. Within thebright region the homogeneity of the membrane can be ex-amined. With time, the fluorescence signal of the membranedecays exponentially in the illuminated area as expected for
FIG. 1. Sketch of the microfluidic chamber. The x-ray beam geometry isindicated. As an option, the interface can be investigated optically usingfluorescence microscopy.
FIG. 2. Experimental scheme for fluorescence microscopy. Light emittedfrom the fluorescent dye is observed through the thin top foil.
095103-2 Reich et al. Rev. Sci. Instrum. 76, 095103 2005
Reproduced with permission from REVIEW OF SCIENTIFIC INSTRUMENTS 76, 095103. Copyright 2005 American Institute of Physics

a large ensemble of continuously exited dyes. Dye moleculescannot be excited consecutively on long time scales, sincethere is always a certain probability that the moleculeschemically react upon illumination. After such a process, thedye is irreversibly bleached.
Figure 3a shows a fluorescence image of a lipid mem-brane taken with a 40 objective on an Axiovert 100M mi-croscope numerical aperture 0.75, Plan-Neofluar series, CarlZeiss, Oberkochen, Germany. The membrane shows a spa-tially homogeneous fluorescence signal. After several sec-onds of continuous illumination or bleaching, the samplewas translated laterally for about 100 m and a second pic-ture was taken, showing the borderline between the previ-ously illuminated and nonilluminated area, see Fig. 3b. Ifthe lipid membrane is immobile, a sharp drop of the fluores-cence intensity at the borderline is expected. But in case thelipid membrane is fluid, the intensity will decrease steadilyfrom the former nonilluminated to the former illuminatedarea, due to lateral diffusion of unbleached fluorescently la-beled lipids. The size of the transition area is directly pro-portional to the diffusion constant.
The homogeneity of the membrane is clearly seen aswell as the borderline between the previously bleached andunbleached regions. The borderline is significantly smearedout due to lipid diffusion. It confirms that we were able toproduce a supported membrane of good quality on SiO2
proving that the surface is neither chemically nor physicallydegraded by the manufacturing process of our chamber.
III. X-RAY ENERGY SELECTION
The interaction of x rays with matter is dominated byhigh photoabsorption for commonly used x-ray energiesaround 10 keV. This fact complicates x-ray studies from bur-ied interfaces significantly. The choice of the optimal x-rayenergy should take into account three closely related aspects.First of all, transmission through the chamber material andthe liquid H2O should be of the order of 10% or more.Second, beam damage caused by incoherent scattering pro-cesses, which is always considered a serious problem withcomplex biomolecules, should be minimal. Third, the coher-ent cross section giving rise to the diffraction signal from theinterface should be high.
A detailed Monte Carlo simulation of the optimal x-rayenergy taking into account the different coherent and inco-herent cross sections of typical atomic concentrations, in,
e.g., proteins, is a work in progress.19 In a simplified ap-proach, we assume an interface composed of organic con-stituents embedded in a liquid water environment. The crosssections for this case are summarized in Fig. 4.20,21
We assume the coherent cross section of carbon coh asthe relevant signal from the interface and estimate theincoherent contribution as the weighted sum of photoscattering and Compton scattering from the bulk. Based onthe design of the sample cell see Sec. IV, the beam passesthrough 20 mm of COC and 5 mm of H2O total beam path25 mm, i.e., incoh=0.8photo+ComptonCOC+0.2photo+ComptonH2O. The ratio of the cross sectionscoh/incoh indicates a favorable energy range around 20 keVfor low-Z material inset of Fig. 4. This is a reasonableapproximation in our specific case, since our compact micro-fluidic design limits the overall beam attenuation by thesample environment to less than one order of magnitude. Thecalculation of the attenuation is presented in detail for anx-ray energy of 20 keV in Sec. IV.
IV. SYNCHROTRON EXPERIMENTS
The feasibility of the proposed concept for x-ray reflec-tivity was tested at the Hamburger Synchrotronstrahlungsla-bor HASYLAB in Hamburg, Germany bending magnetbeamline D4 and the European Synchrotron Radiation Fa-cility ESRF in Grenoble, France undulator beamlineID01. Microfluidic devices with the same specifications asdescribed in Sec. II were used Fig. 5. The employed x-rayenergy at HASYLAB was E=20 keV and the beam crosssection was limited by a presample aperture of 0.052 mm2
verticalhorizontal. At ESRF, the photon energy was E=19.5 keV and the presample aperture consisted of 0.020.2 mm2 vh. The grazing-incidence x-ray beam effec-tively illuminated a surface area comparable to the focal spotof the fluorescence microscope shown in Fig. 3, which isroughly 0.23 mm/220.20.2 mm2.
In principle, the chamber can be mounted on the sampletable in a horizontal or vertical scattering geometry. For theexperiments presented here, the horizontal setup was em-
FIG. 3. Fluorescence images of a fluid lipid membrane on SiO2. a Imageof a homogeneous lipid membrane. The white bar represents 40 m. b Asecond image, displaying the former borderline. A continuous, nonsharptransition from the previously nonilluminated to the previously illuminatedarea is clearly visible.
FIG. 4. X-ray interaction cross sections. The coherent cross section is plot-ted for carbon. The Compton and photocross sections for COC and H2O arealso indicated. The inset shows the cross-section ratio coh/incoh.
095103-3 A microfluidic setup Rev. Sci. Instrum. 76, 095103 2005
Reproduced with permission from REVIEW OF SCIENTIFIC INSTRUMENTS 76, 095103. Copyright 2005 American Institute of Physics
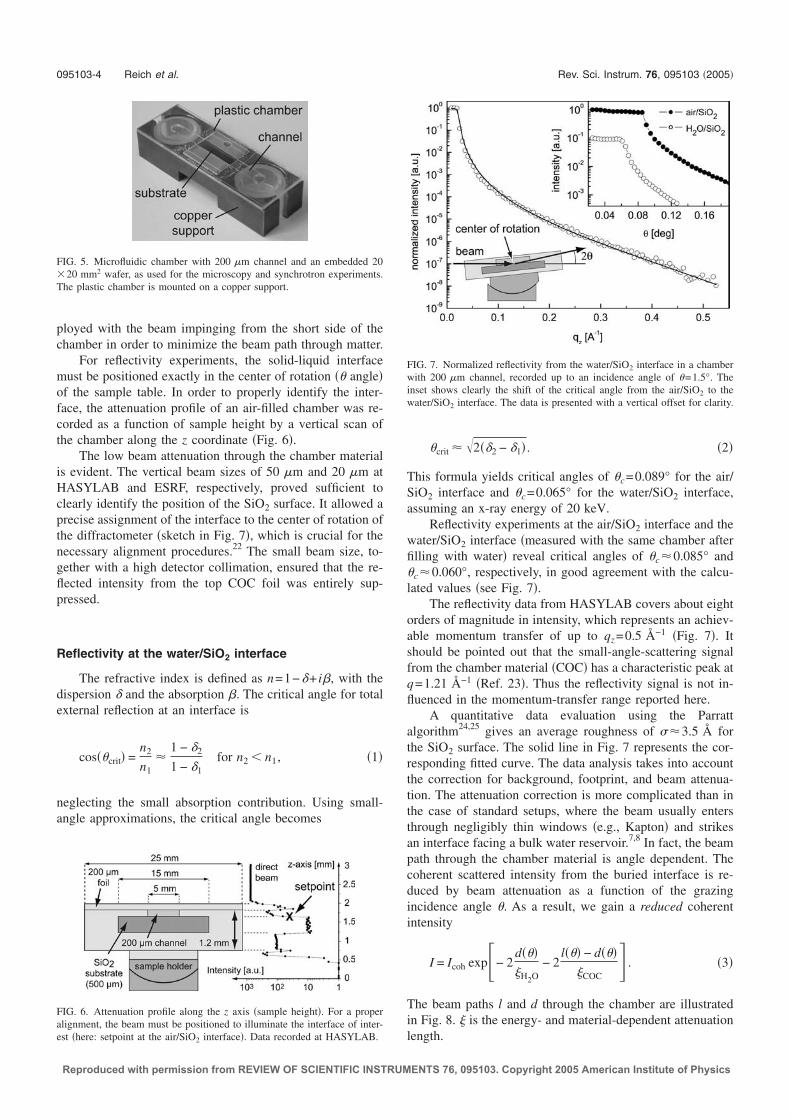
ployed with the beam impinging from the short side of thechamber in order to minimize the beam path through matter.
For reflectivity experiments, the solid-liquid interfacemust be positioned exactly in the center of rotation angleof the sample table. In order to properly identify the inter-face, the attenuation profile of an air-filled chamber was re-corded as a function of sample height by a vertical scan ofthe chamber along the z coordinate Fig. 6.
The low beam attenuation through the chamber materialis evident. The vertical beam sizes of 50 m and 20 m atHASYLAB and ESRF, respectively, proved sufficient toclearly identify the position of the SiO2 surface. It allowed aprecise assignment of the interface to the center of rotation ofthe diffractometer sketch in Fig. 7, which is crucial for thenecessary alignment procedures.22 The small beam size, to-gether with a high detector collimation, ensured that the re-flected intensity from the top COC foil was entirely sup-pressed.
Reflectivity at the water/SiO2 interface
The refractive index is defined as n=1−+ i, with thedispersion and the absorption . The critical angle for totalexternal reflection at an interface is
coscrit =n2
n1
1 − 2
1 − 1for n2 n1, 1
neglecting the small absorption contribution. Using small-angle approximations, the critical angle becomes
crit 22 − 1 . 2
This formula yields critical angles of c=0.089° for the air/SiO2 interface and c=0.065° for the water/SiO2 interface,assuming an x-ray energy of 20 keV.
Reflectivity experiments at the air/SiO2 interface and thewater/SiO2 interface measured with the same chamber afterfilling with water reveal critical angles of c0.085° andc0.060°, respectively, in good agreement with the calcu-lated values see Fig. 7.
The reflectivity data from HASYLAB covers about eightorders of magnitude in intensity, which represents an achiev-able momentum transfer of up to qz=0.5 Å−1 Fig. 7. Itshould be pointed out that the small-angle-scattering signalfrom the chamber material COC has a characteristic peak atq=1.21 Å−1 Ref. 23. Thus the reflectivity signal is not in-fluenced in the momentum-transfer range reported here.
A quantitative data evaluation using the Parrattalgorithm24,25 gives an average roughness of 3.5 Å forthe SiO2 surface. The solid line in Fig. 7 represents the cor-responding fitted curve. The data analysis takes into accountthe correction for background, footprint, and beam attenua-tion. The attenuation correction is more complicated than inthe case of standard setups, where the beam usually entersthrough negligibly thin windows e.g., Kapton and strikesan interface facing a bulk water reservoir.7,8 In fact, the beampath through the chamber material is angle dependent. Thecoherent scattered intensity from the buried interface is re-duced by beam attenuation as a function of the grazingincidence angle . As a result, we gain a reduced coherentintensity
I = Icoh exp− 2dH2O
− 2l − d
COC . 3
The beam paths l and d through the chamber are illustratedin Fig. 8. is the energy- and material-dependent attenuationlength.
FIG. 5. Microfluidic chamber with 200 m channel and an embedded 2020 mm2 wafer, as used for the microscopy and synchrotron experiments.The plastic chamber is mounted on a copper support.
FIG. 6. Attenuation profile along the z axis sample height. For a properalignment, the beam must be positioned to illuminate the interface of inter-est here: setpoint at the air/SiO2 interface. Data recorded at HASYLAB.
FIG. 7. Normalized reflectivity from the water/SiO2 interface in a chamberwith 200 m channel, recorded up to an incidence angle of =1.5°. Theinset shows clearly the shift of the critical angle from the air/SiO2 to thewater/SiO2 interface. The data is presented with a vertical offset for clarity.
095103-4 Reich et al. Rev. Sci. Instrum. 76, 095103 2005
Reproduced with permission from REVIEW OF SCIENTIFIC INSTRUMENTS 76, 095103. Copyright 2005 American Institute of Physics
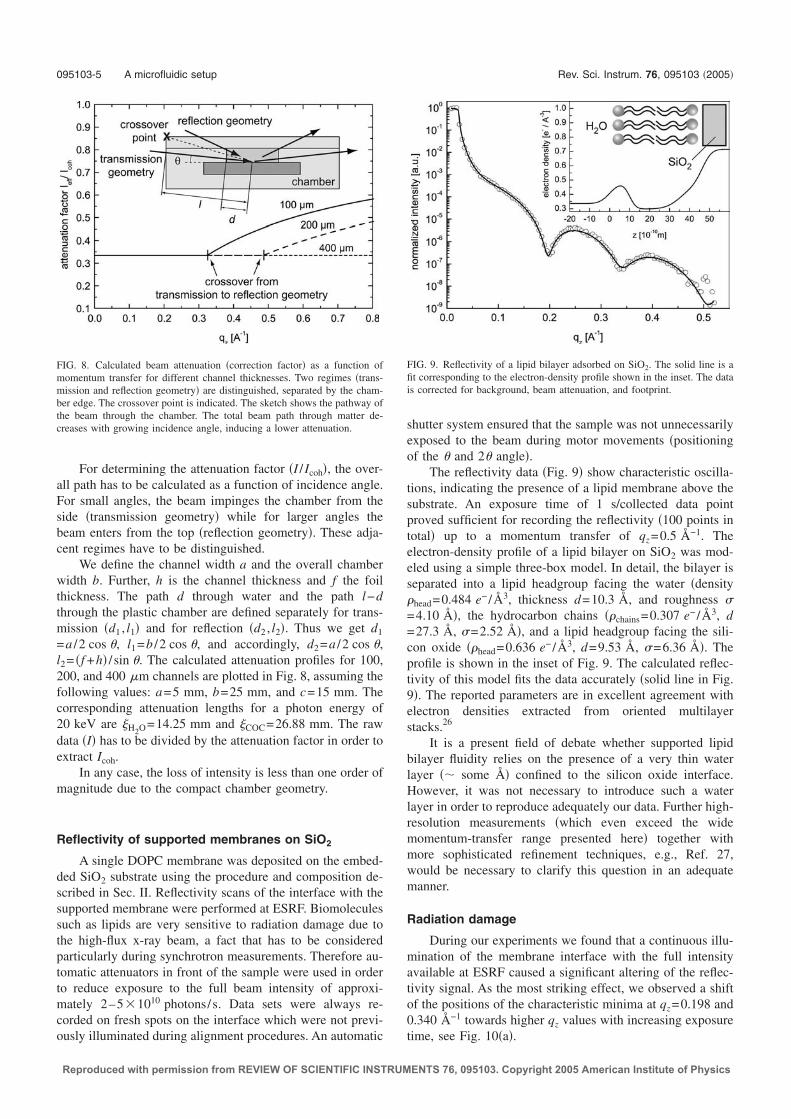
For determining the attenuation factor I / Icoh, the over-all path has to be calculated as a function of incidence angle.For small angles, the beam impinges the chamber from theside transmission geometry while for larger angles thebeam enters from the top reflection geometry. These adja-cent regimes have to be distinguished.
We define the channel width a and the overall chamberwidth b. Further, h is the channel thickness and f the foilthickness. The path d through water and the path l−dthrough the plastic chamber are defined separately for trans-mission d1 , l1 and for reflection d2 , l2. Thus we get d1
=a /2 cos , l1=b /2 cos , and accordingly, d2=a /2 cos ,l2= f +h / sin . The calculated attenuation profiles for 100,200, and 400 m channels are plotted in Fig. 8, assuming thefollowing values: a=5 mm, b=25 mm, and c=15 mm. Thecorresponding attenuation lengths for a photon energy of20 keV are H2O=14.25 mm and COC=26.88 mm. The rawdata I has to be divided by the attenuation factor in order toextract Icoh.
In any case, the loss of intensity is less than one order ofmagnitude due to the compact chamber geometry.
Reflectivity of supported membranes on SiO2
A single DOPC membrane was deposited on the embed-ded SiO2 substrate using the procedure and composition de-scribed in Sec. II. Reflectivity scans of the interface with thesupported membrane were performed at ESRF. Biomoleculessuch as lipids are very sensitive to radiation damage due tothe high-flux x-ray beam, a fact that has to be consideredparticularly during synchrotron measurements. Therefore au-tomatic attenuators in front of the sample were used in orderto reduce exposure to the full beam intensity of approxi-mately 2–51010 photons/s. Data sets were always re-corded on fresh spots on the interface which were not previ-ously illuminated during alignment procedures. An automatic
shutter system ensured that the sample was not unnecessarilyexposed to the beam during motor movements positioningof the and 2 angle.
The reflectivity data Fig. 9 show characteristic oscilla-tions, indicating the presence of a lipid membrane above thesubstrate. An exposure time of 1 s/collected data pointproved sufficient for recording the reflectivity 100 points intotal up to a momentum transfer of qz=0.5 Å−1. Theelectron-density profile of a lipid bilayer on SiO2 was mod-eled using a simple three-box model. In detail, the bilayer isseparated into a lipid headgroup facing the water densityhead=0.484 e− /Å3, thickness d=10.3 Å, and roughness =4.10 Å, the hydrocarbon chains chains=0.307 e− /Å3, d=27.3 Å, =2.52 Å, and a lipid headgroup facing the sili-con oxide head=0.636 e− /Å3, d=9.53 Å, =6.36 Å. Theprofile is shown in the inset of Fig. 9. The calculated reflec-tivity of this model fits the data accurately solid line in Fig.9. The reported parameters are in excellent agreement withelectron densities extracted from oriented multilayerstacks.26
It is a present field of debate whether supported lipidbilayer fluidity relies on the presence of a very thin waterlayer some Å confined to the silicon oxide interface.However, it was not necessary to introduce such a waterlayer in order to reproduce adequately our data. Further high-resolution measurements which even exceed the widemomentum-transfer range presented here together withmore sophisticated refinement techniques, e.g., Ref. 27,would be necessary to clarify this question in an adequatemanner.
Radiation damage
During our experiments we found that a continuous illu-mination of the membrane interface with the full intensityavailable at ESRF caused a significant altering of the reflec-tivity signal. As the most striking effect, we observed a shiftof the positions of the characteristic minima at qz=0.198 and0.340 Å−1 towards higher qz values with increasing exposuretime, see Fig. 10a.
FIG. 8. Calculated beam attenuation correction factor as a function ofmomentum transfer for different channel thicknesses. Two regimes trans-mission and reflection geometry are distinguished, separated by the cham-ber edge. The crossover point is indicated. The sketch shows the pathway ofthe beam through the chamber. The total beam path through matter de-creases with growing incidence angle, inducing a lower attenuation.
FIG. 9. Reflectivity of a lipid bilayer adsorbed on SiO2. The solid line is afit corresponding to the electron-density profile shown in the inset. The datais corrected for background, beam attenuation, and footprint.
095103-5 A microfluidic setup Rev. Sci. Instrum. 76, 095103 2005
Reproduced with permission from REVIEW OF SCIENTIFIC INSTRUMENTS 76, 095103. Copyright 2005 American Institute of Physics
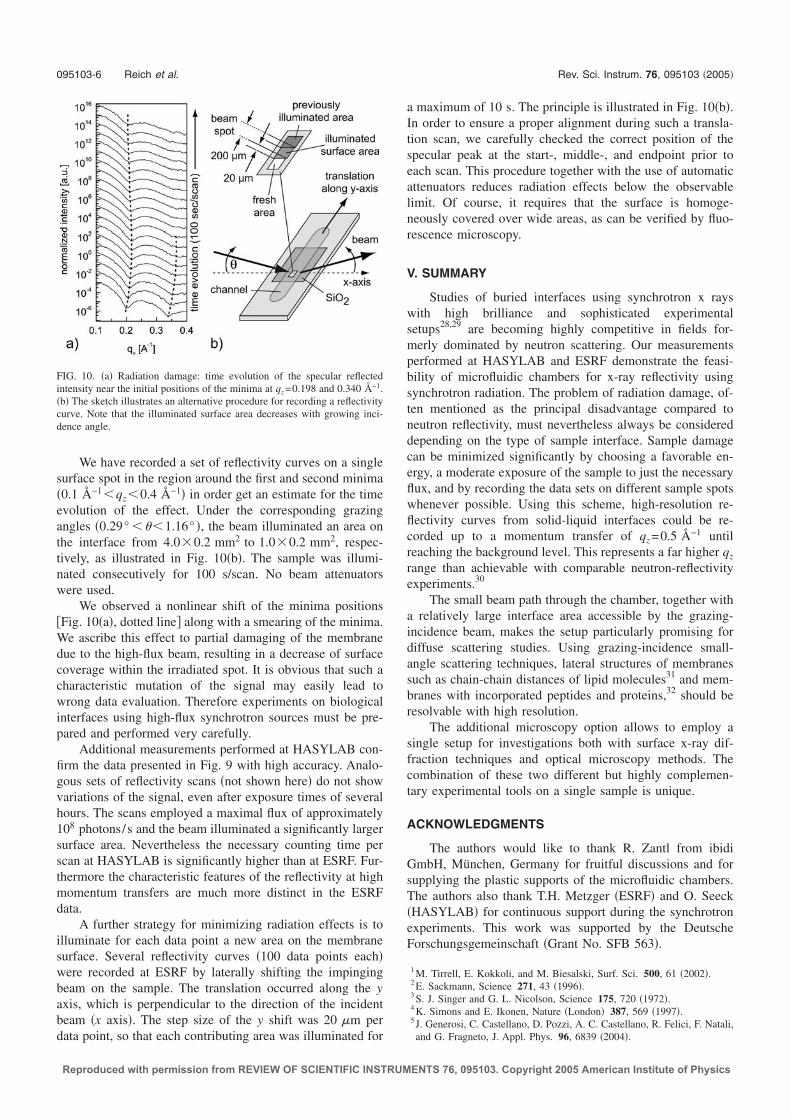
We have recorded a set of reflectivity curves on a singlesurface spot in the region around the first and second minima0.1 Å−1qz0.4 Å−1 in order get an estimate for the timeevolution of the effect. Under the corresponding grazingangles 0.29° 1.16° , the beam illuminated an area onthe interface from 4.00.2 mm2 to 1.00.2 mm2, respec-tively, as illustrated in Fig. 10b. The sample was illumi-nated consecutively for 100 s/scan. No beam attenuatorswere used.
We observed a nonlinear shift of the minima positionsFig. 10a, dotted line along with a smearing of the minima.We ascribe this effect to partial damaging of the membranedue to the high-flux beam, resulting in a decrease of surfacecoverage within the irradiated spot. It is obvious that such acharacteristic mutation of the signal may easily lead towrong data evaluation. Therefore experiments on biologicalinterfaces using high-flux synchrotron sources must be pre-pared and performed very carefully.
Additional measurements performed at HASYLAB con-firm the data presented in Fig. 9 with high accuracy. Analo-gous sets of reflectivity scans not shown here do not showvariations of the signal, even after exposure times of severalhours. The scans employed a maximal flux of approximately108 photons/s and the beam illuminated a significantly largersurface area. Nevertheless the necessary counting time perscan at HASYLAB is significantly higher than at ESRF. Fur-thermore the characteristic features of the reflectivity at highmomentum transfers are much more distinct in the ESRFdata.
A further strategy for minimizing radiation effects is toilluminate for each data point a new area on the membranesurface. Several reflectivity curves 100 data points eachwere recorded at ESRF by laterally shifting the impingingbeam on the sample. The translation occurred along the yaxis, which is perpendicular to the direction of the incidentbeam x axis. The step size of the y shift was 20 m perdata point, so that each contributing area was illuminated for
a maximum of 10 s. The principle is illustrated in Fig. 10b.In order to ensure a proper alignment during such a transla-tion scan, we carefully checked the correct position of thespecular peak at the start-, middle-, and endpoint prior toeach scan. This procedure together with the use of automaticattenuators reduces radiation effects below the observablelimit. Of course, it requires that the surface is homoge-neously covered over wide areas, as can be verified by fluo-rescence microscopy.
V. SUMMARY
Studies of buried interfaces using synchrotron x rayswith high brilliance and sophisticated experimentalsetups28,29 are becoming highly competitive in fields for-merly dominated by neutron scattering. Our measurementsperformed at HASYLAB and ESRF demonstrate the feasi-bility of microfluidic chambers for x-ray reflectivity usingsynchrotron radiation. The problem of radiation damage, of-ten mentioned as the principal disadvantage compared toneutron reflectivity, must nevertheless always be considereddepending on the type of sample interface. Sample damagecan be minimized significantly by choosing a favorable en-ergy, a moderate exposure of the sample to just the necessaryflux, and by recording the data sets on different sample spotswhenever possible. Using this scheme, high-resolution re-flectivity curves from solid-liquid interfaces could be re-corded up to a momentum transfer of qz=0.5 Å−1 untilreaching the background level. This represents a far higher qz
range than achievable with comparable neutron-reflectivityexperiments.30
The small beam path through the chamber, together witha relatively large interface area accessible by the grazing-incidence beam, makes the setup particularly promising fordiffuse scattering studies. Using grazing-incidence small-angle scattering techniques, lateral structures of membranessuch as chain-chain distances of lipid molecules31 and mem-branes with incorporated peptides and proteins,32 should beresolvable with high resolution.
The additional microscopy option allows to employ asingle setup for investigations both with surface x-ray dif-fraction techniques and optical microscopy methods. Thecombination of these two different but highly complemen-tary experimental tools on a single sample is unique.
ACKNOWLEDGMENTS
The authors would like to thank R. Zantl from ibidiGmbH, München, Germany for fruitful discussions and forsupplying the plastic supports of the microfluidic chambers.The authors also thank T.H. Metzger ESRF and O. SeeckHASYLAB for continuous support during the synchrotronexperiments. This work was supported by the DeutscheForschungsgemeinschaft Grant No. SFB 563.
1 M. Tirrell, E. Kokkoli, and M. Biesalski, Surf. Sci. 500, 61 2002.2 E. Sackmann, Science 271, 43 1996.3 S. J. Singer and G. L. Nicolson, Science 175, 720 1972.4 K. Simons and E. Ikonen, Nature London 387, 569 1997.5 J. Generosi, C. Castellano, D. Pozzi, A. C. Castellano, R. Felici, F. Natali,and G. Fragneto, J. Appl. Phys. 96, 6839 2004.
FIG. 10. a Radiation damage: time evolution of the specular reflectedintensity near the initial positions of the minima at qz=0.198 and 0.340 Å−1.b The sketch illustrates an alternative procedure for recording a reflectivitycurve. Note that the illuminated surface area decreases with growing inci-dence angle.
095103-6 Reich et al. Rev. Sci. Instrum. 76, 095103 2005
Reproduced with permission from REVIEW OF SCIENTIFIC INSTRUMENTS 76, 095103. Copyright 2005 American Institute of Physics
6 V. Cherezov, K. M. Riedl, and M. Caffrey, J. Synchrotron Radiat. 9, 3332002.
7 C. E. Miller, J. Majewski, T. Gog, and T. L. Kuhl, Phys. Rev. Lett. 94,238104 2005.
8 M. Vogel, C. Münster, W. Fenzl, and T. Salditt, Phys. Rev. Lett. 84, 3902000.
9 G. Khanarian, Opt. Eng. Bellingham 40, 1024 2001.10 T. Rohr, D. F. Ogletree, F. Svec, and J. M. J. Fréchet, Adv. Funct. Mater.
13, 264 2003.11 P. Lenz, C. M. Ajo-Franklin, and S. G. Boxer, Langmuir 20, 11092
2004.12 E. Sackmann and M. Tanaka, Trends Biotechnol. 18, 58 2000.13 D. Braun and P. Fromherz, Phys. Rev. Lett. 81, 5241 1998.14 W. Kern and D. A. Puotinen, RCA Rev. 31, 187 1970.15 A. A. Brian and H. M. McConnell, Proc. Natl. Acad. Sci. U.S.A. 81, 6159
1984.16 E. Kalb, S. Frey, and L. K. Tamm, Biochim. Biophys. Acta 1103, 307
1992.17 J. Nissen, K. Jacobs, and J. O. Rädler, Phys. Rev. Lett. 86, 1904 2001.18 C. Dietrich, R. Merkel, and R. Tampe, Biophys. J. 72, 1701 1997.19 M. Zahnder, I. Vartaniants, and E. Weckert private communication.
20 M. Berger, J. Hubbell, S. Seltzer, J. S. Coursey, and D. S. Zucker, PhotonCross Sections Database XCOM, NIST.
21 J. Hubbell, Int. J. Appl. Radiat. Isot. 33, 1269 1982.22 V. Holý, U. Pietsch, and T. Baumbach, High-Resolution X-Ray Scattering
from Thin Films and Multilayers, Springer Tracts in Modern Physics, Vol.149 Springer, Berlin, 1999.
23 T. D. Luccio, B. Nickel, F. Antolini, M. Pentimalli, and L. Tapfer, Mater.Res. Soc. Symp. Proc. 847, EE13.22 2004.
24 L. G. Parratt, Phys. Rev. 95, 359 1954.25 L. Névot and P. Croce, Rev. Phys. Appl. 15, 761 1980.26 Y. Liu and J. F. Nagle, Phys. Rev. E 69, 040901 2004.27 M. Schalke and M. Lösche, Adv. Colloid Interface Sci. 88, 243 2000.28 H. Reichert, O. Klein, H. Dosch, M. Denk, V. Honkimaki, T. Lippmann,
and G. Reiter, Nature London 408, 839 2000.29 H. Reichert, V. Honkimäki, A. Snigirev, S. Engemann, and H. Dosch,
Physica B 336, 46 2003.30 G. Fragneto, T. Charitat, F. Graner, K. Mecke, L. Perino-Gallice, and E.
Bellet-Amalrice, Europhys. Lett. 53, 100 2001.31 A. Spaar and T. Salditt, Biophys. J. 85, 1576 2003.32 C. Münster, A. Spaar, B. Bechinger, and T. Salditt, Biochim. Biophys.
Acta 1562, 37 2002.
095103-7 A microfluidic setup Rev. Sci. Instrum. 76, 095103 2005
Reproduced with permission from REVIEW OF SCIENTIFIC INSTRUMENTS 76, 095103. Copyright 2005 American Institute of Physics


A.2 Full text of Ref. [2] 49
A.2 Full text of Ref. [2]
Marion B. Hochrein, Christian Reich, Barbel Krause, Joachim O. Radler and BertNickel
Structure and Mobility of Lipid Membranes on a Thermoplastic Substrate.
Langmuir 22 (2), 538-545 (2006).
Abstract:Supported lipid membranes constitute one of the most important model systems forcell membranes. The properties of lipid membranes supported by the hydrophobicsolid polymer cyclic olefin copolymer (COC) were investigated. Lipid layers con-sisting of varying amounts of 1,2-dioleoyl-3-trimethylammonium propane (DOTAP,cationic) and 1,2-dioleoyl-sn-glycero-3-phosphocholine (DOPC, neutral) preparedby vesicle fusion and solvent exchange were compared. All lipid mixtures coatedthe COC surface homogeneously forming a fluid membrane as verified by fluo-rescence microscopy and fluorescence recovery after photobleaching (FRAP). Theexact structure of the supported membranes was determined by synchrotron reflec-tivity experiments using a microfluidic chamber. The X-ray data are in agreementwith a compressed (head-to-head distance = 29 A) and less densely packed bilayer.
Permanent weblink:http://dx.doi.org/10.1021/la051820y
Table of contents graphic:
( )( )n
m
microscopeobjectiveγ

50 A. Publications

Structure and Mobility of Lipid Membranes on a ThermoplasticSubstrate
Marion B. Hochrein,*,† Christian Reich,† Barbel Krause,‡ Joachim O. Radler,† andBert Nickel†
Department fur Physik, Ludwig-Maximilians-UniVersitat Munchen, Geschwister-Scholl-Platz 1,80539 Munchen, Germany, and European Synchrotron Radiation Facility, Boite Postale 220,
38043 Grenoble Cedex, France
ReceiVed July 6, 2005. In Final Form: September 23, 2005
Supported lipid membranes constitute one of the most important model systems for cell membranes. The propertiesof lipid membranes supported by the hydrophobic solid polymer cyclic olefin copolymer (COC) were investigated.Lipid layers consisting of varying amounts of 1,2-dioleoyl-3-trimethylammonium propane (DOTAP, cationic) and1,2-dioleoyl-sn-glycero-3-phosphocholine (DOPC, neutral) prepared by vesicle fusion and solvent exchange werecompared. All lipid mixtures coated the COC surface homogeneously forming a fluid membrane as verified byfluorescence microscopy and fluorescence recovery after photobleaching (FRAP). The exact structure of the supportedmembranes was determined by synchrotron reflectivity experiments using a microfluidic chamber. The X-ray dataare in agreement with a compressed (head-to-head distance ) 29 Å) and less densely packed bilayer.
1. Introduction
Cells are surrounded by a plasma membrane that protects thecell interior from its environment while still transducing signalsnecessary for cell functioning. Solid-supported fluid lipid bilayers1
serve as one of the most important model systems for cellmembranes. They allow the application of several surface-sensitive techniques such as ellipsometry, surface plasmonspectroscopy, atomic force microscopy (AFM),2 and neutronand X-ray reflectivity.3,4 Hence, structural details of membraneson a solid support that are not accessible to this extent for othermodel systems can be obtained.
Supported membranes represent an effective way of generatingbiofunctional surfaces, e.g., for biosensor applications.5,6 Fur-thermore, supported fluid positively charged membranes can beused for the manipulation of single biomolecules such as DNA.7,8,9
Note that the fluidity of the membrane is a basic requirementfor mimicking functional membranes.1 The proper choice of thesupporting substrate is crucial to ensure a fluid supportedmembrane. Standard supports, including glass cover slides,10
quartz substrates,11 oxidized silicon wafers,12,13 and mica,14 arehydrophilic and negatively charged. The charge density and thesurface chemistry are highly dependent on the cleaning procedureand change with time. Surface modification and structuring is
time-consuming and often requires clean-room equipment. Plasticmaterials can be easily formed at low cost to manifold shapesto comply with different needs. For technical and industrialapplications, it is therefore appealing to use plastic materials assupport. Studies of the behavior of lipid membranes supportedon plastic materials such as poly(dimethylsiloxane) (PDMS)15
and polystyrene (PS)16 have been performed previously indicatingthat fluid membranes can also be formed on plastic supports.
Here, we study the hydrophobic copolymer 2-norborneneethylene (“cyclic olefin copolymer”, COC). COC is a verypromising plastic material because it is inert against most acids,bases, and polar solvents and it does not swell in water.17 Itssurface chemistry is robust, e.g., it is independent of the cleaningprocedure used and does not vary after exposure to air due toaging effects. Also, COC is basically uncharged. Its high opticaltransmission, low amount of inclusions, and low autofluores-cence18 make it well-suited for high-resolution fluorescencemicroscopy. Various kinds of functional microfluidic chamberscan be formed from this material by injection molding,nanoimprinting,19 and surface functionalization.20
In this article, we studied the homogeneity, fluidity, andstructure of cationic 1,2-dioleoyl-3-trimethylammonium propane(DOTAP)/zwitterionic 1,2-dioleoyl-sn-glycero-3-phosphocholine(DOPC) lipid layers supported on COC. We have chosen DOTAP/DOPC mixtures because these lipids have been well-characterizedin previous studies.21-24 Two preparation techniques werecompared: the well-established vesicle-fusion method25 and the
* Corresponding author. E-mail: [email protected].† Ludwig-Maximilians-Universitat Munchen.‡ European Synchrotron Radiation Facility.(1) Yamazaki, V.; Sirenko, O.; Schafer, R. J.; Groves, J. T. J. Am. Chem. Soc.
2005, 127, 2826-2827.(2) Sackmann, E. Science 1996, 271, 43-48.(3) Fragneto, G.; Charitat, T.; Bellet-Amalric, E.; Cubitt, R.; Graner, F.Langmuir
2003, 19, 7695-7702.(4) Vogel, M.; Munster, C.; Fenzl, W.; Salditt, T. Phys. ReV. Lett. 2000, 84,
390-393.(5) Cornell, B. A.; BraachMaksvytis, V. L. B.; King, L. G.; Osman, P. D. J.;
Raguse, B.; Wieczorek, L.; Pace, R. J. Nature 1997, 387, 580-583.(6) Ziegler, C.; Gopel, W. Curr. Opin. Chem. Biol. 1998, 2, 585-591.(7) Maier, B.; Radler, J. O. Phys. ReV. Lett. 1999, 82, 1911-1914.(8) Maier, B.; Radler, J. O. Macromolecules 2000, 33, 7185-7194.(9) Olson, D. J.; Johnson, J. M.; Patel, P. D.; Shaqfeh, E. S. G.; Boxer, S. G.;
Fuller, G. G. Langmuir 2001, 17, 7396-7401.(10) Cremer, P. S.; Boxer, S. G. J. Phys. Chem. B 1999, 103, 2554-2559.(11) Kalb, E.; Frey, S.; Tamm, L. K. Biochim. Biophys. Acta 1992, 1103,
307-316.
(12) Puu, G.; Gustafson, I. Biochim. Biophys. Acta: Biomembranes 1997,1327, 149-161.
(13) Reimhult, E.; Hook, F.; Kasemo, B. Phys. ReV. E 2002, 66.(14) Mou, J. X.; Yang, J.; Shao, Z. F. J. Mol. Biol. 1995, 248, 507-512.(15) Lenz, P.; Ajo-Franklin, C. M.; Boxer, S. G. Langmuir 2004, 20, 11092-
11099.(16) Elliott, J. T.; Burden, D. L.; Woodward, J. T.; Sehgal, A.; Douglas, J. F.
Langmuir 2003, 19, 2275-2283.(17) Nielsen, T.; Nilsson, D.; Bundgaard, F.; Shi, P.; Szabo, P.; Geschke, O.;
Kristensen, A. J. Vac. Sci. Technol. B 2004, 22, 1770-1775.(18) Khanarian, G.; Celanese, H. Opt. Eng. 2001, 40, 1024-1029.(19) Monkkonen, K.; Lautanen, J.; Kettunen, V.; Leppanen, V. P.; Pakkanen,
T. T.; Jaaskelainen, T. J. Mater. Chem. 2000, 10, 2634-2636.(20) Rohr, T.; Ogletree, D. F.; Svec, F.; Frechet, J. M. J. AdV. Funct. Mater.
2003, 13, 264-270.(21) Clausen-Schaumann, H.; Gaub, H. E. Langmuir 1999, 15, 8246-8251.
538 Langmuir 2006, 22, 538-545
10.1021/la051820y CCC: $33.50 © 2006 American Chemical SocietyPublished on Web 12/13/2005
Reproduced with permission from LANGMUIR 2006, 22, 538-545. Copyright 2006 American Chemical Society

method of solvent exchange.26 First, the homogeneity and fluidityof the supported membranes were optically characterized withfluorescence microscopy, continuous bleaching, and fluorescencerecovery after photobleaching. Finally, the structure of COC-supported DOPC membranes was resolved by X-ray reflectivity,and the results are discussed.
2. Experiments
2.1. Materials and Methods. Chemicals. 1,2-Dioleoyl-3-tri-methylammonium propane (DOTAP) and 1,2-dioleoyl-sn-glycero-3-phosphocholine (DOPC) were purchased from Avanti Polar LipidsInc. (Alabaster, AL) and used without further purification. 2-[12-(7-Nitrobenz-2-oxa-1,3-diazol-4-yl)amino]dodecanoyl-1-hexadecanoyl-sn-gl ycero-3-phosphocholine (NBD C12-HPC) was purchased fromMolecular Probes (Eugene, OR). One percent (w/w) of thefluorescence probe was used to label the membrane. Only freshlybidistilled water (18.2 MΩ, Millipore, Billerica, MA) was usedthroughout this study. Chloroform, toluene, and 2-propanol of HPLCgrade were obtained from Carl Roth GmbH & Co. (Karlsruhe,Germany).
Microfluidic Chambers. The plastic chambers (µ-Slides, ibidiGmbH, Munchen, Germany) consisted of two reservoirs connectedby a channel with dimensions 5 × 0.4 × 50 mm3 (width × height× length). The bottom of the channel was sealed using a plastic foilmade of the copolymer of 2-norbornene ethylene [cyclic olefincopolymer (COC), Ticona, Frankfurt, Germany]. The high transpar-ency and 0.18-mm thickness of the foil allow for the application ofhigh-resolution optical microscopy (Figure 1a). The microfluidicchambers were cleaned before use by flushing 2 mL of 2-propanolthrough the flow chamber, followed by at least 20 mL of bidistilledwater.
For the X-ray reflectivity measurements, a thin COC film wasprepared by spin-coating COC onto a silicon wafer, thus avoidingthe long-range undulations present in free-standing foils. A siliconwafer (20 × 20 mm2) with a thermally grown oxide layer of 400-nmthickness was cleaned thoroughly for the COC coating by a modified
RCA method.27 In short, the silicon wafer was ultrasonicated for 5min in each acetone, 2-propanol, and finally water. Afterward, itwas boiled at 80 °C in a 1:1:5 H2O2/NH4OH/H2O mixture. Thewafer was shortly rinsed in bidistilled water and then boiled in 1:1:5H2O2/HCl/H2O at 80 °C. The wafer was dried at 70 °C for 3 h. Threehundred microliters of 10 µg/mL COC dissolved in toluene wasdeposited onto the wafer, and the wafer was accelerated to 3000 rpmfor 2 min. This procedure yielded a homogeneous, smooth COClayer with a thickness of around 450 Å and a surface roughness of7 Å.
A specially modified chamber was used to embed the siliconwafer as described in detail elsewhere.28 In brief, the µ-slide wasmilled open with a square the size of the wafer. The wafer wasembedded into the chamber with the COC layer facing toward thechannel interior. Finally, the chamber was sealed again with a two-component epoxy glue (Uhu Plus Endfest 300, Uhu GmbH, Buhl,Germany) (Figure 1b). After being allowed to dry for several hours,the chamber was ready for the deposition of the lipids.
Vesicle Fusion (VF). The desired lipid ratio was mixed inchloroform, dried under nitrogen flow, and stored in a vacuumchamber overnight. Bidistilled water was added to the dried lipidto obtain a concentration of 1 mg/mL, and the solution was incubatedfor 4 h at 50 °C, resulting in multilamellar vesicles. Small unilamellarvesicles were prepared by sonicating the lipid-water mixture in atip sonicator (Sonoplus UW 2070, Bandelin electronic, Berlin,Germany) for 10 min at an amplitude of 170 µm while the solutionwas cooled on ice.29 Four hundred microliters of the lipid solutionwas deposited into the chamber channel and incubated overnight.The chambers were flushed with at least 100 mL of bidistilled waterwhile avoiding air contact with the lipid layer.
SolVent Exchange (SE). The lipids were mixed and dried asdescribed above. A solution with a concentration of 1 mg/mL wasprepared by adding 2-propanol to the dried lipid. Two hundredmicroliters of the lipid solution was injected into the chamber. Twomilliliters of bidistilled water was added into one of the two reservoirsof the chamber, which led to a reduction of the 2-propanol contentin the solvent to 10%. After equilibration of the water levels in thetwo reservoirs, 30 mL of bidistilled water was quickly flushed throughthe channel to remove excess vesicles and reduce the amount ofvesicles adhered to the membrane.
For comparison, a membrane on a hydrogen-terminated siliconwafer (H-Si) was prepared as follows: A DOPC membrane wasdeposited by spin coating a DOPC-2-propanol solution (1 mg/mL)immediately after a HF etch.30 Then, the dried sample was placedin the microfluidic chamber and flushed with water prior to themeasurement.
X-ray ReflectiVity Measurements. All X-ray reflectivity measure-ments using COC supports were performed at the EuropeanSynchrotron Radiation Facility (ESRF) in Grenoble, France, at thebeamline ID01. The measurement of a lipid membrane supportedby hydrogen-terminated silicon was carried out at the HamburgerSynchrotronstrahlungslabor (Hasylab) (beamline D4, Hamburg,Germany). The X-ray energy was 19.5 keV (λ ) 0.636 Å). Detailsof the experimental setup are described in Reich et al.28 Special carewas taken to avoid beam damage due to overexposure by shiftingthe sample during the measurements. Because reflectivity curvescould be reproduced with high accuracy during several consecutivescans, we can exclude beam damage. The data were analyzed usingthe software Parratt32, version 1.5.2 (Christian Braun, HMI Berlin),which uses the Parratt algorithm31 to calculate the reflectivity dataand implements error minimization according to a simplified one-dimensional Newton-Raphson method.32 Good starting values wereneeded.
(22) Campbell, R. B.; Balasubramanian, S. V.; Straubinger, R. M. Biochim.Biophys. Acta: Biomembranes 2001, 1512, 27-39.
(23) Symietz, C.; Schneider, M.; Brezesinski, G.; Mohwald, H.Macromolecules2004, 37, 3865-3873.
(24) Radler, J. O.; Koltover, I.; Salditt, T.; Safinya, C. R. Science 1997, 275,810-814.
(25) Brian, A. A.; McConnell, H. M. Proc. Nat. Acad. Sci. U.S.A. 1984, 81,6159-6163.
(26) Miller, C.; Cuendet, P.; Gratzel, M. J. Electroanal. Chem. 1990, 278,175-192.
(27) Kern, W.; Puotinen, D. A. Rca ReV. 1970, 31, 187.(28) Reich, C.; Hochrein, M.; Krause, B.; Nickel, B. ReV. Sci. Instrum. 2005,
76, 095103.(29) Barenholz, Y.; Gibbes, D.; Litman, B. J.; Goll, J.; Thompson, T. E.;
Carlson, F. D. Biochemistry 1977, 16, 2806-2810.(30) Mennicke, U.; Salditt, T. Langmuir 2002, 18, 8172-8177.(31) Parratt, L. G. Phys. ReV. 1954, 95, 359-369.(32) Press, W.; Flannery, B.; Teukolsky, S.; Vetterling, W. Numerical Recipes;
Cambridge University Press: Cambridge, U.K., 1986.
Figure 1. Microfluidic chambers: (a) Schematic drawing of theplastic chamber used for microscopy (side view). (b) Modifiedchamber for the X-ray measurements (side view). This setup alsoallowed fluorescence microscopy to be used to optically characterizethe sample. The microscope objective shown here was not presentduring reflectivity experiments.
Lipid Membranes on a Thermoplastic Substrate Langmuir, Vol. 22, No. 2, 2006 539
Reproduced with permission from LANGMUIR 2006, 22, 538-545. Copyright 2006 American Chemical Society
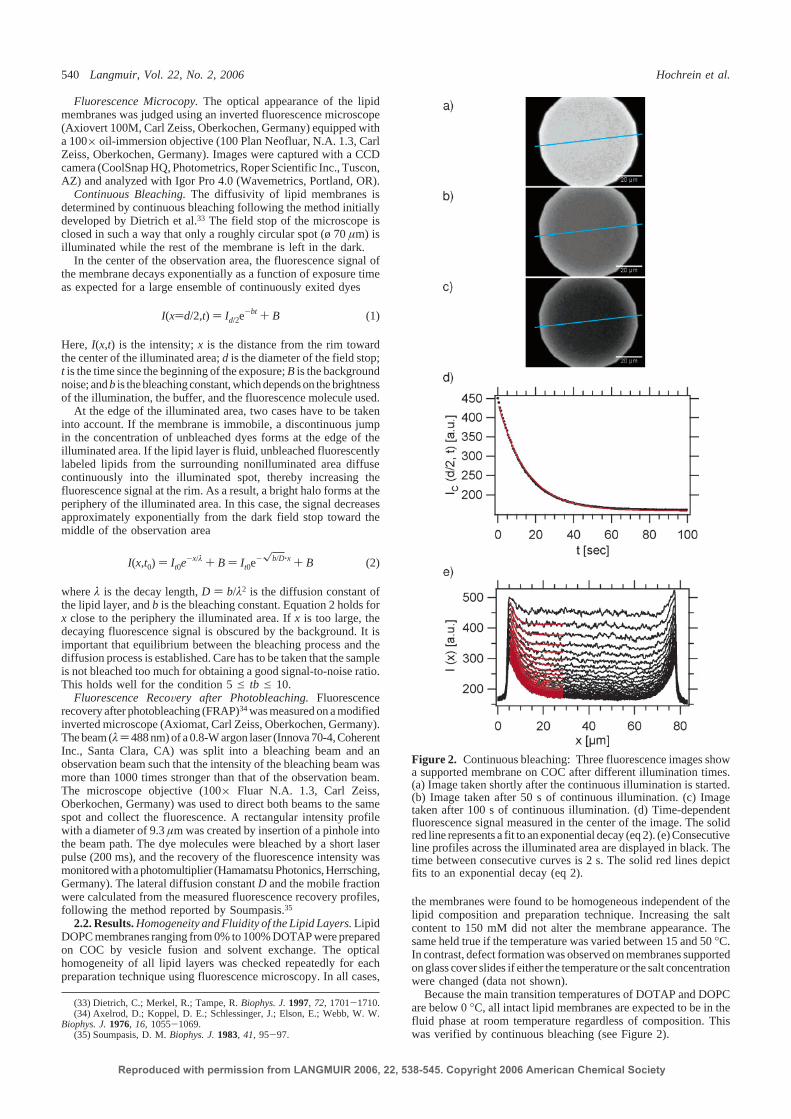
Fluorescence Microcopy. The optical appearance of the lipidmembranes was judged using an inverted fluorescence microscope(Axiovert 100M, Carl Zeiss, Oberkochen, Germany) equipped witha 100× oil-immersion objective (100 Plan Neofluar, N.A. 1.3, CarlZeiss, Oberkochen, Germany). Images were captured with a CCDcamera (CoolSnap HQ, Photometrics, Roper Scientific Inc., Tuscon,AZ) and analyzed with Igor Pro 4.0 (Wavemetrics, Portland, OR).
Continuous Bleaching. The diffusivity of lipid membranes isdetermined by continuous bleaching following the method initiallydeveloped by Dietrich et al.33 The field stop of the microscope isclosed in such a way that only a roughly circular spot (ø 70 µm) isilluminated while the rest of the membrane is left in the dark.
In the center of the observation area, the fluorescence signal ofthe membrane decays exponentially as a function of exposure timeas expected for a large ensemble of continuously exited dyes
Here, I(x,t) is the intensity; x is the distance from the rim towardthe center of the illuminated area; d is the diameter of the field stop;t is the time since the beginning of the exposure; B is the backgroundnoise; and b is the bleaching constant, which depends on the brightnessof the illumination, the buffer, and the fluorescence molecule used.
At the edge of the illuminated area, two cases have to be takeninto account. If the membrane is immobile, a discontinuous jumpin the concentration of unbleached dyes forms at the edge of theilluminated area. If the lipid layer is fluid, unbleached fluorescentlylabeled lipids from the surrounding nonilluminated area diffusecontinuously into the illuminated spot, thereby increasing thefluorescence signal at the rim. As a result, a bright halo forms at theperiphery of the illuminated area. In this case, the signal decreasesapproximately exponentially from the dark field stop toward themiddle of the observation area
where λ is the decay length, D ) b/λ2 is the diffusion constant ofthe lipid layer, and b is the bleaching constant. Equation 2 holds forx close to the periphery the illuminated area. If x is too large, thedecaying fluorescence signal is obscured by the background. It isimportant that equilibrium between the bleaching process and thediffusion process is established. Care has to be taken that the sampleis not bleached too much for obtaining a good signal-to-noise ratio.This holds well for the condition 5 e tb e 10.
Fluorescence RecoVery after Photobleaching. Fluorescencerecovery after photobleaching (FRAP)34 was measured on a modifiedinverted microscope (Axiomat, Carl Zeiss, Oberkochen, Germany).The beam (λ)488 nm) of a 0.8-W argon laser (Innova 70-4, CoherentInc., Santa Clara, CA) was split into a bleaching beam and anobservation beam such that the intensity of the bleaching beam wasmore than 1000 times stronger than that of the observation beam.The microscope objective (100× Fluar N.A. 1.3, Carl Zeiss,Oberkochen, Germany) was used to direct both beams to the samespot and collect the fluorescence. A rectangular intensity profilewith a diameter of 9.3 µm was created by insertion of a pinhole intothe beam path. The dye molecules were bleached by a short laserpulse (200 ms), and the recovery of the fluorescence intensity wasmonitored with a photomultiplier (Hamamatsu Photonics, Herrsching,Germany). The lateral diffusion constant D and the mobile fractionwere calculated from the measured fluorescence recovery profiles,following the method reported by Soumpasis.35
2.2. Results. Homogeneity and Fluidity of the Lipid Layers. LipidDOPC membranes ranging from 0% to 100% DOTAP were preparedon COC by vesicle fusion and solvent exchange. The opticalhomogeneity of all lipid layers was checked repeatedly for eachpreparation technique using fluorescence microscopy. In all cases,
the membranes were found to be homogeneous independent of thelipid composition and preparation technique. Increasing the saltcontent to 150 mM did not alter the membrane appearance. Thesame held true if the temperature was varied between 15 and 50 °C.In contrast, defect formation was observed on membranes supportedon glass cover slides if either the temperature or the salt concentrationwere changed (data not shown).
Because the main transition temperatures of DOTAP and DOPCare below 0 °C, all intact lipid membranes are expected to be in thefluid phase at room temperature regardless of composition. Thiswas verified by continuous bleaching (see Figure 2).
(33) Dietrich, C.; Merkel, R.; Tampe, R. Biophys. J. 1997, 72, 1701-1710.(34) Axelrod, D.; Koppel, D. E.; Schlessinger, J.; Elson, E.; Webb, W. W.
Biophys. J. 1976, 16, 1055-1069.(35) Soumpasis, D. M. Biophys. J. 1983, 41, 95-97.
Figure 2. Continuous bleaching: Three fluorescence images showa supported membrane on COC after different illumination times.(a) Image taken shortly after the continuous illumination is started.(b) Image taken after 50 s of continuous illumination. (c) Imagetaken after 100 s of continuous illumination. (d) Time-dependentfluorescence signal measured in the center of the image. The solidred line represents a fit to an exponential decay (eq 2). (e) Consecutiveline profiles across the illuminated area are displayed in black. Thetime between consecutive curves is 2 s. The solid red lines depictfits to an exponential decay (eq 2).
I(x)d/2,t) ) Id/2e-bt + B (1)
I(x,t0) ) It0e-x/λ + B ) It0e
-b/D‚x + B (2)
540 Langmuir, Vol. 22, No. 2, 2006 Hochrein et al.
Reproduced with permission from LANGMUIR 2006, 22, 538-545. Copyright 2006 American Chemical Society
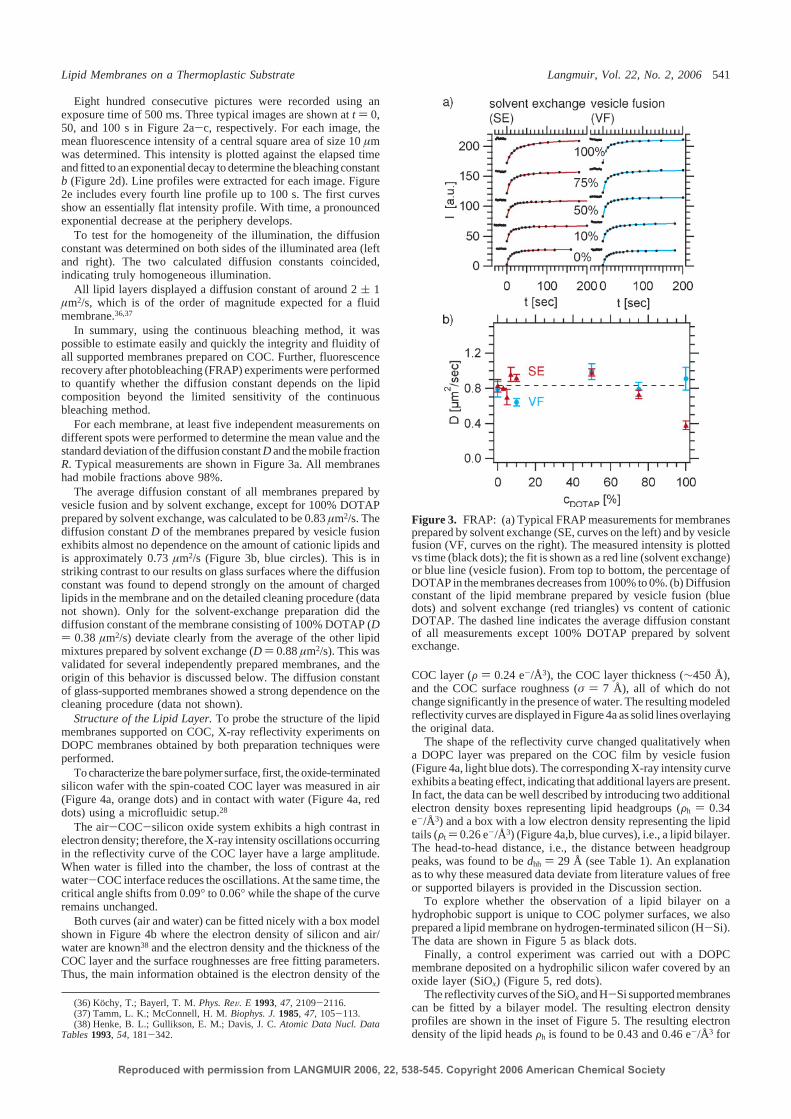
Eight hundred consecutive pictures were recorded using anexposure time of 500 ms. Three typical images are shown at t ) 0,50, and 100 s in Figure 2a-c, respectively. For each image, themean fluorescence intensity of a central square area of size 10 µmwas determined. This intensity is plotted against the elapsed timeand fitted to an exponential decay to determine the bleaching constantb (Figure 2d). Line profiles were extracted for each image. Figure2e includes every fourth line profile up to 100 s. The first curvesshow an essentially flat intensity profile. With time, a pronouncedexponential decrease at the periphery develops.
To test for the homogeneity of the illumination, the diffusionconstant was determined on both sides of the illuminated area (leftand right). The two calculated diffusion constants coincided,indicating truly homogeneous illumination.
All lipid layers displayed a diffusion constant of around 2 ( 1µm2/s, which is of the order of magnitude expected for a fluidmembrane.36,37
In summary, using the continuous bleaching method, it waspossible to estimate easily and quickly the integrity and fluidity ofall supported membranes prepared on COC. Further, fluorescencerecovery after photobleaching (FRAP) experiments were performedto quantify whether the diffusion constant depends on the lipidcomposition beyond the limited sensitivity of the continuousbleaching method.
For each membrane, at least five independent measurements ondifferent spots were performed to determine the mean value and thestandard deviation of the diffusion constant D and the mobile fractionR. Typical measurements are shown in Figure 3a. All membraneshad mobile fractions above 98%.
The average diffusion constant of all membranes prepared byvesicle fusion and by solvent exchange, except for 100% DOTAPprepared by solvent exchange, was calculated to be 0.83 µm2/s. Thediffusion constant D of the membranes prepared by vesicle fusionexhibits almost no dependence on the amount of cationic lipids andis approximately 0.73 µm2/s (Figure 3b, blue circles). This is instriking contrast to our results on glass surfaces where the diffusionconstant was found to depend strongly on the amount of chargedlipids in the membrane and on the detailed cleaning procedure (datanot shown). Only for the solvent-exchange preparation did thediffusion constant of the membrane consisting of 100% DOTAP (D) 0.38 µm2/s) deviate clearly from the average of the other lipidmixtures prepared by solvent exchange (D ) 0.88 µm2/s). This wasvalidated for several independently prepared membranes, and theorigin of this behavior is discussed below. The diffusion constantof glass-supported membranes showed a strong dependence on thecleaning procedure (data not shown).
Structure of the Lipid Layer. To probe the structure of the lipidmembranes supported on COC, X-ray reflectivity experiments onDOPC membranes obtained by both preparation techniques wereperformed.
Tocharacterize thebare polymer surface, first, the oxide-terminatedsilicon wafer with the spin-coated COC layer was measured in air(Figure 4a, orange dots) and in contact with water (Figure 4a, reddots) using a microfluidic setup.28
The air-COC-silicon oxide system exhibits a high contrast inelectron density; therefore, the X-ray intensity oscillations occurringin the reflectivity curve of the COC layer have a large amplitude.When water is filled into the chamber, the loss of contrast at thewater-COC interface reduces the oscillations. At the same time, thecritical angle shifts from 0.09° to 0.06° while the shape of the curveremains unchanged.
Both curves (air and water) can be fitted nicely with a box modelshown in Figure 4b where the electron density of silicon and air/water are known38 and the electron density and the thickness of theCOC layer and the surface roughnesses are free fitting parameters.Thus, the main information obtained is the electron density of the
COC layer (F ) 0.24 e-/Å3), the COC layer thickness (∼450 Å),and the COC surface roughness (σ ) 7 Å), all of which do notchange significantly in the presence of water. The resulting modeledreflectivity curves are displayed in Figure 4a as solid lines overlayingthe original data.
The shape of the reflectivity curve changed qualitatively whena DOPC layer was prepared on the COC film by vesicle fusion(Figure 4a, light blue dots). The corresponding X-ray intensity curveexhibits a beating effect, indicating that additional layers are present.In fact, the data can be well described by introducing two additionalelectron density boxes representing lipid headgroups (Fh ) 0.34e-/Å3) and a box with a low electron density representing the lipidtails (Ft ) 0.26 e-/Å3) (Figure 4a,b, blue curves), i.e., a lipid bilayer.The head-to-head distance, i.e., the distance between headgrouppeaks, was found to be dhh ) 29 Å (see Table 1). An explanationas to why these measured data deviate from literature values of freeor supported bilayers is provided in the Discussion section.
To explore whether the observation of a lipid bilayer on ahydrophobic support is unique to COC polymer surfaces, we alsoprepared a lipid membrane on hydrogen-terminated silicon (H-Si).The data are shown in Figure 5 as black dots.
Finally, a control experiment was carried out with a DOPCmembrane deposited on a hydrophilic silicon wafer covered by anoxide layer (SiOx) (Figure 5, red dots).
The reflectivity curves of the SiOx and H-Si supported membranescan be fitted by a bilayer model. The resulting electron densityprofiles are shown in the inset of Figure 5. The resulting electrondensity of the lipid heads Fh is found to be 0.43 and 0.46 e-/Å3 for
(36) Kochy, T.; Bayerl, T. M. Phys. ReV. E 1993, 47, 2109-2116.(37) Tamm, L. K.; McConnell, H. M. Biophys. J. 1985, 47, 105-113.(38) Henke, B. L.; Gullikson, E. M.; Davis, J. C. Atomic Data Nucl. Data
Tables 1993, 54, 181-342.
Figure 3. FRAP: (a) Typical FRAP measurements for membranesprepared by solvent exchange (SE, curves on the left) and by vesiclefusion (VF, curves on the right). The measured intensity is plottedvs time (black dots); the fit is shown as a red line (solvent exchange)or blue line (vesicle fusion). From top to bottom, the percentage ofDOTAP in the membranes decreases from 100% to 0%. (b) Diffusionconstant of the lipid membrane prepared by vesicle fusion (bluedots) and solvent exchange (red triangles) vs content of cationicDOTAP. The dashed line indicates the average diffusion constantof all measurements except 100% DOTAP prepared by solventexchange.
Lipid Membranes on a Thermoplastic Substrate Langmuir, Vol. 22, No. 2, 2006 541
Reproduced with permission from LANGMUIR 2006, 22, 538-545. Copyright 2006 American Chemical Society

H-Si and SiOx, respectively. The electron density of the lipid tailsFt coincides at 0.30 e-/Å3 for both supports. The head-to-head distancedhh is given by 40 and 36 Å for H-Si and SiOx, respectively (seeTable 1).
To test the influence of the deposition method, we performedreflectivity measurements on a DOPC membrane deposited on COCby solvent exchange. The measurements on the lipid membranesprepared by vesicle fusion (light blue dots) and by solvent exchange(red dots) are compared in Figure 6. For the membrane prepared bysolvent exchange, a slightly reduced amplitude of the oscillationswas observed.
Again, a bilayer model fits best to the data, indicating that,qualitatively, the bilayer formation is not dependent on the preparation
method. However, the contrast in electron density is clearly reduced(Fh)0.33 e-/Å3 andFt)0.29 e-/Å3). The reason for this is elucidatedin the following discussion. The head-to-head distance is dhh ) 27Å.
3. Discussion
Homogeneity and Fluidity. On hydrophilic supports such asglass cover slides, a change in temperature or salt concentrationmight result in membrane defects visible with fluorescencemicroscopy. It is known that the diffusion constant of glass-supported membranes shows a strong dependence on the cleaningprocedure.11 The conformation of a lipid membrane supportedby COC seems more stable and less dependent on solvent andtemperature conditions, as defect formation was not observed inthis study and the diffusion constant does not depend on theamount of charge in the membrane. This stability is of practicalrelevance.
The possibility that the lipids adsorb to the surface as vesiclescan be ruled out because our continuous bleaching and FRAPexperiments probed the mobility of the lipid membrane on thelength scale of a few micrometers.
The diffusion constants measured in our present work withFRAP (0.8 µm2/s) is very similar to the diffusion constant (0.9
Figure 4. X-ray data: (a) Reflectivity curves of a uniform COCfilm exposed to air (orange dots) and to water (red squares) and witha DOPC layer prepared by vesicle fusion (light blue triangles). Fitsto the different curves are included as solid lines in the same colorshaded slightly darker. The reflectivity curves are shifted verticallyfor clarity. The inset illustrates the setup used during reflectivitymeasurements. (b) Electron density profiles corresponding to thefits in a. The profile for the COC layer on air is shown as an orangeline, the profile for the COC layer under water is displayed as a redline, and the profile of a COC layer with a lipid membrane on topis depicted with a blue line. The profiles are shifted vertically forclarity. A cartoon illuminating the physical meaning of the electrondensity profile is placed on top of each profile.
Table 1. Parameters Extracted from X-ray ReflectivityMeasurements for DOPC Membranes on Different Supports
source supportdhh
(Å)Fh
(e-/Å3)Ft
(e-/Å3)
COC (VF) 29 0.34 0.26COC (SE) 27 0.33 0.29
this work H-Si 40 0.43 0.30SiOx 36 0.46 0.30
Liu et al.42 stacks on SiOx 37 0.44 0.24-0.29Tristram-Nagle43 free stacks 35 0.46 0.23-0.29
Figure 5. DOPC membranes on SiOx and H-Si: reflectivity curveof a lipid layer on the hydrophilic SiOx (red circles) and the best fit(dark red line). Displaced vertically is the reflectivity curve of amembrane on the hydrophobic H-Si (gray dots) with the best fit(black line). The profiles corresponding to the fits are shown in theinset in the upper right corner. A schematic drawing above the profilesillustrates the interpretation of the box models.
Figure 6. X-ray reflectivity: Reflectivity curves of DOPC lipidlayers prepared by vesicle fusion (VF) and solvent exchange (SE).The fits are included as full lines in the same color shaded darker.The inset shows the electron density profile of the sample preparedby solvent exchange.
542 Langmuir, Vol. 22, No. 2, 2006 Hochrein et al.
Reproduced with permission from LANGMUIR 2006, 22, 538-545. Copyright 2006 American Chemical Society

µm2/s) measured by Lenz et al.15 for a POPC lipid membraneon hydrophobic poly(dimethylsiloxane) (PDMS) surfaces. Also,FRAP measurements showed no dependence of the diffusionconstant on the lipid composition for membranes on COCprepared by vesicle fusion. The same holds true for membranesprepared by solvent exchange up to a DOTAP ratio of 75%. Thisis explained by the hydrophobic surface being uncharged, so thatthe electrostatic interactions between the lipid membrane andthe substrate are reduced compared to those with glass surfaces.Only the diffusion constant of a membrane composed of 100%DOTAP prepared by solvent exchange differs notably from allothers. It is likely that, during the preparation process by solventexchange, some amphiphilic 2-propanol stays intercalated in themembrane.39,40 This effect might increase for charged lipids,which could lead to the formation of small defects (below theresolution of optical microscopy) in the membrane. Such defectsreduce the diffusion constant significantly.
Structure. COC represents a highly hydrophobic substrate(contact angle ) 89°).20 Because of hydrophobic effects, onemight expect that lipids form a monolayer on hydrophobicsubstrates with the lipid tails facing toward the substrate. A clearreduction of the number of lipids in membranes deposited onhydrophobic substrates has been reported before.15,16,41 In detail,Lenz et al.15 found a factor of 2 difference between the twofluorescence intensities of a lipid membrane on hydrophobicand oxidized (hydrophilic) PDMS. Elliot et al.16 compared thefluorescence intensity of lipid membranes on polystyrene filmswith equivalent membranes on glass surfaces and counted thesingle fluorescence events with fluorescence correlation spec-troscopy. Retzinger et al.41 counted the radioactivity of radio-actively labeled lipids on polystyrene-divinylbenzene beads.
These experiments have taken the reduced number of lipidsas an indication for monolayer formation. Naturally, the totalamount of lipids in a monolayer is only one-half that in a compactbilayer. Our experiments suggest a different interpretation. Weargue that the reduction of the number of lipids on hydrophobicsupports might be due not to formation of a compact monolayerbut, at least in the case of COC, to the formation of a thinned,less densely packed bilayer, as we will show in the followingdiscussion of the X-ray data.
To emphasize details of the reflectivity curves, we divide thereflectivity of the lipid layer by the Fresnel reflectivity (1/qz
4).The measured reflectivity curve of the COC layer coated witha lipid membrane by vesicle fusion is displayed in Figure 7a aslight blue dots (labeled data). Vertically displaced is the best fitof the reflectivity curve resulting from a bilayer box model shownas a solid dark blue line (labeled bilayer). The best fit of thereflectivity data resulting fromamonolayer boxmodel is displayedstacked under it (labeled monolayer). Figure 7b shows theassociated electron density profiles with a schematic drawing ontop illustrating the physical composition of the layers. Only thesection of the electron density profile in proximity to the lipidlayer is displayed.
The monolayer model succeeds in reproducing the amplitudeand phase of the small oscillations quite well, but it fails to showthe beating effect.
In contrast, the bilayer model fits the oscillations reasonablywell, including the beating. Thus, we conclude that a bilayerformed.
Details of the Bilayer Structure. The vertical head-to-headdistance of the COC supported bilayer (dhh) was found to be 29
Å. This is 8 and 6 Å shorter, respectively, than the values reportedby Liu et al.42 for DOPC multilamellar membranes on SiOx andsimilar measurements on DOPC/water solutions.43 In the fol-lowing, discussion, we call this membrane a thinned bilayer.
The electron density of the lipid heads (Fh) in the thinnedbilayer is reduced to 0.34 e-/Å3, i.e., 0.1 and 0.12 e-/Å3 smallerthan reported previously,42,43 indicating a clear reduction in thepacking density of the lipids.
The electron density of the lipid tails (Ft) in the thinned bilayerwas found to be 0.26 e-/Å3. Tristram et al.43 and Liu et al.42
distinguish two domains in the lipid tail region. The headgroupregion is followed by a tail region with an intermediate electrondensity (0.29 e-/Å3)42,43 separated from the other leaflet of thebilayer by a small region with very low electron density (0.2442
and 0.2343 e-/Å3). In our study, we do not distinguish betweenthose tail regions, as it is well-known that data up to q > 0.5 Åare readily explained by a two-box model.44 Therefore, our Ft
result is between these literature values (Ft ) 0.26 e-/Å3).Note that the lipid density of a bilayer formed on SiOx (Figure
5) compares reasonably well with literature values42,43 (sum-
(39) Barry, J. A.; Gawrisch, K. Biochemistry 1994, 33, 8082-8088.(40) Barry, J. A.; Gawrisch, K. Biochemistry 1995, 34, 8852-8860.(41) Retzinger, G. S.; Meredith, S. C.; Lau, S. H.; Kaiser, E. T.; Kezdy, F.
J. Anal. Biochem. 1985, 150, 131-140.
(42) Liu, Y. F.; Nagle, J. F. Phys. ReV. E 2004, 69, 040901.(43) Tristram-Nagle, S.; Petrache, H. I.; Nagle, J. F. Biophys. J. 1998, 75,
917-925.(44) Schalke, M.; Losche, M. AdV. Colloid Interface Sci. 2000, 88, 243-274
(Special Issue).
Figure 7. Analysis: (a) The top curve features the best fit of thereflectivity data assuming a bilayer box model, divided by the Fresnelreflectivity q-4 (dark blue solid line, bilayer). Stacked under it, themeasured reflectivity data (light blue solid line, data) are displayed.The last curve represents the best fit of the reflectivity curve basedon a monolayer box model (red solid line, monolayer). (b) Profilescorresponding to the fit curves in a (bilayer, dark blue line; monolayer,red line). Right above and below the profiles, schematic drawingsillustrate the box models. The structural formula of COC is placedin the upper right corner.
Lipid Membranes on a Thermoplastic Substrate Langmuir, Vol. 22, No. 2, 2006 543
Reproduced with permission from LANGMUIR 2006, 22, 538-545. Copyright 2006 American Chemical Society

marized in Table 1). For a SiOx-supported membrane (Figure 5),we obtain a head-to-head distance of dhh ) 36 Å, an electrondensity of the heads of Fh ) 0.46 e-/Å3, and an electron densityof the tails of Ft ) 0.3 e-/Å3, in good agreement with literaturevalues.42,43
Table 1 summarizes the head-to-head distance dhh, themaximum electron density of the headgroups Fh, and the densityof the lipid tails Ft on the different supports and for the differentpreparation techniques. Values from the literature are includedfor comparison.
A simple explanation of the reduced electron density of thethinned bilayer on COC is a reduced packing density of thelipids.
The bilayer structure on SiOx and two different bilayerconfigurations in agreement with the measurements on COC aresummarized in Figure 8. Figure 8a shows the configuration ofa typical bilayer as found, for example, on SiOx. On COC, thepacking density of the lipids is reduced, allowing the lipid tailsto relax into a more disordered conformation (see Figure 8b). Asshown in Figure 8c, the lipid tails could also interdigitate, reducingthe packing density while the bilayer thickness is reduced.
This thinned bilayer is similar to the monolayer formationfound for the bipolar lipids in archae bacteria.45 InterdigitatedPC bilayers induced by traces of alcohol in the bulk solutionhave been reported by Mou et al.46 Hollinshead et al.47 alsodemonstrated that lipids can interdigitate on a supportedmonolayer grafted from octadecyltrichlorosilane (OTS) if thegrafting density is 60%.
For COC, a different, more general mechanism might beresponsible for the formation of a thinned bilayer. db is the lipidbilayer thickness, i.e., the distance from the beginning of theheadgroup in the first layer to the end of the opposing headgroup.Burgess et al.48 showed that the bilayer thickness db of DMPCmembranes spread on gold depends critically on the surface
charge density of the gold surface. At charge densities morenegative than -0.2 Cm-2, the bilayer thickness on goldcorresponded to the thickness typically found for fully hydratedmultilayers (db ) 37 Å). A similar surface charge density of-0.25 Cm-2 was estimated for silicon oxide surfaces at pH 8.49
In turn, the bilayer thickness on SiOx is the similar to that ofbilayer stacks.
At zero surface charge, the bilayer thickness on gold wasreduced to 26 Å. The potential of COC50 is -25 mV,50
corresponding to a basically uncharged surface. Remarkably,the reduced bilayer thickness on COC agrees with the reducedbilayer thickness on uncharged gold surfaces, suggesting thatsurface charge might control the membrane thickness.
On the other hand, we cannot exclude other explanations thatmight be responsible for the membrane thinning on COC. Suchreasons could include surface roughness or details of the molecularcomposition of the surface. This is supported by the enlarged dhh
value found on H-Si. The dhh value of DOPC on H-Si wascalculated to be 40 Å, 3-5 Å larger than the respective literaturevalues, while Fh and Ft did not deviate significantly.
Although both H-Si and COC are hydrophobic, the twosubstrates are very different in terms of molecular composition.Also, the COC support has a larger surface roughness, whichmight influence the packing density as well.
For a membrane prepared by solvent exchange on COC, abilayer model also fits the data reasonably well. The head-to-head distance dhh is 27 Å, in accordance with the distance gainedfrom the vesicle-fusion sample. The reduced contrast in electrondensity (Fh ) 0.33, Ft ) 0.29) compared to the vesicle-fusionsample can be explained by intercalated 2-propanol molecules.Another explanation is the formation of defects smaller than theoptical resolution. Other experiments performed in our laboratoryin which DNA molecules were adsorbed onto mixed DOPC/DOTAP lipid membranes did not show a difference between thepreparation methods, even though these experiments are intrinsi-cally very sensitive to even small membrane defects.51 Therefore,the reduced electron density of the heads is most likely explainedby 2-propanol molecules being intercalated into the membranerather than by defect formation.
The fluorescence microscopy and FRAP experiments did notdetect any difference in the lipid membranes prepared by vesiclefusion or by solvent exchange. This was further supported byX-ray reflectivity experiments where the two preparationtechniques resulted in similar curves except for a slight reductionin the electron density contrast.
Water Layer. Finally, we address the question of whether amesocopic water layer (dw g 10 Å) is needed to ensure a fluidbilayer.
In the literature, dw has been determined directly with scatteringmethods30,52-55 or indirectly with microscopic techniques56 andfound to range between 5 and 500 Å. The large deviations in dw
resulted most likely from different surface treatments.
(45) Gliozzi, A.; Relini, A.; Chong, P. L. G. J. Membr. Sci. 2002, 206, 131-147 (Special Issue).
(46) Mou, J. X.; Yang, J.; Huang, C.; Shao, Z. F. Biochemistry 1994, 33,9981-9985.
(47) Hollinshead, C. M.; Hanna, M.; Barlow, D. J.; De Biasi, V.; Bucknall,D. G.; Camilleri, P.; Hutt, A. J.; Lawrence, M. J.; Lu, J. R.; Su, T. J. Biochim.Biophys. Acta: Biomembranes 2001, 1511, 49-59.
(48) Burgess, I.; Li, M.; Horswell, S. L.; Szymanski, G.; Lipkowski, J.;Majewski, J.; Satija, S. Biophys. J. 2004, 86, 1763-1776.
(49) Groves, J. T.; Boxer, S. G.; McConnell, H. M. Proc. Nat. Acad. Sci.U.S.A. 1997, 94, 13390-13395.
(50) Radler, U.; Kahl, V. Private communication, ibidi GmbH, Munich,Germany, 2005.
(51) Hochrein, M.; Leierseder, J.; Radler, J.; Golubovic, L. Phys. ReV. Lett.,accepted.
(52) Charitat, T.; Bellet-Amalric, E.; Fragneto, G.; Graner, F. Eur. Phys. J.B 1999, 8, 583-593.
(53) Fragneto, G.; Bellet-Amalric, E.; Charitat, T.; Dubos, P.; Graner, F.;Perino-Galice, L. Physica B 2000, 276, 501-502.
(54) Koenig, B. W.; Kruger, S.; Orts, W. J.; Majkrzak, C. F.; Berk, N. F.;Silverton, J. V.; Gawrisch, K. Langmuir 1996, 12, 1343-1350.
(55) Johnson, S. J.; Bayerl, T. M.; McDermott, D. C.; Adam, G. W.; Rennie,A. R.; Thomas, R. K.; Sackmann, E. Biophys. J. 1991, 59, 289-294.
(56) Merkel, R.; Sackmann, E.; Evans, E. J. Phys. 1989, 50, 1535-1555.
Figure 8. Packing density in a bilayer: (a) typical bilayer as foundin supported DOPC membrane stacks or on SiOx. Thinned bilayer:(b) coiled tails, (c) interdigitated tails.
544 Langmuir, Vol. 22, No. 2, 2006 Hochrein et al.
Reproduced with permission from LANGMUIR 2006, 22, 538-545. Copyright 2006 American Chemical Society

In our study, we tried to determine the size of the water gap(dw) between the membrane and the support for COC, SiOx, andH-Si. We were not able to resolve a water layer on COC withinthe error of the surface roughness, which implies that dw mustbe smaller than 7 Å if present at all. Also, no water gap wasresolved on SiOx and H-Si, implying that, in these cases, dw issmaller than 4 and 3 Å, respectively. The value dw ) 4 Å wasmeasured recently by X-ray reflectivity by Miller et al.57 for aDOPC membrane supported on SiOx. Another study found thatit was not necessary to introduce a water layer in order to reproduceadequately the reflectivity data of a DOPC membrane on SiOx.28
The fact that we obtain fluid membranes on COC and SiOx
without the presence of a significant water layer suggests thata mesoscopic water layer is not mandatory to maintain fluidity.
4. Conclusion
In this article, we demonstrated that it is possible to preparehomogeneous and fluid lipid membranes on COC surfaces for
different membranes consisting of different concentrations ofDOTAP and DOPC. Using X-ray reflectivity measurements, wefound that these membranes consist of a thinned bilayer. Thesecoating properties make the thermoplast COC an ideal materialfor biofunctional surfaces.51
Acknowledgment. We thank Oliver Purrucker, ThomasSchubert, and Murat Tutus for their help with the FRAPmeasurements and Oliver Seeck for help with the setup of theD4 reflectometer at Hasylab. We owe thanks to ibidi GmbH forthe donation of µ-slides. This work was supported by SFB 563of the Deutsche Forschungsgemeinschaft. We thank the ESRFand the Hasylab for continuous support of this work.
Supporting InformationAvailable: Additional structural modelof the lipid membrane. This material is available free of charge via theInternet at http://pubs.acs.org.
LA051820Y(57) Miller, C.; Majewski, J.; Gog, T.; Kuhl, T. L. Phys. ReV. Lett. 2005, 94,
238104.
Lipid Membranes on a Thermoplastic Substrate Langmuir, Vol. 22, No. 2, 2006 545
Reproduced with permission from LANGMUIR 2006, 22, 538-545. Copyright 2006 American Chemical Society
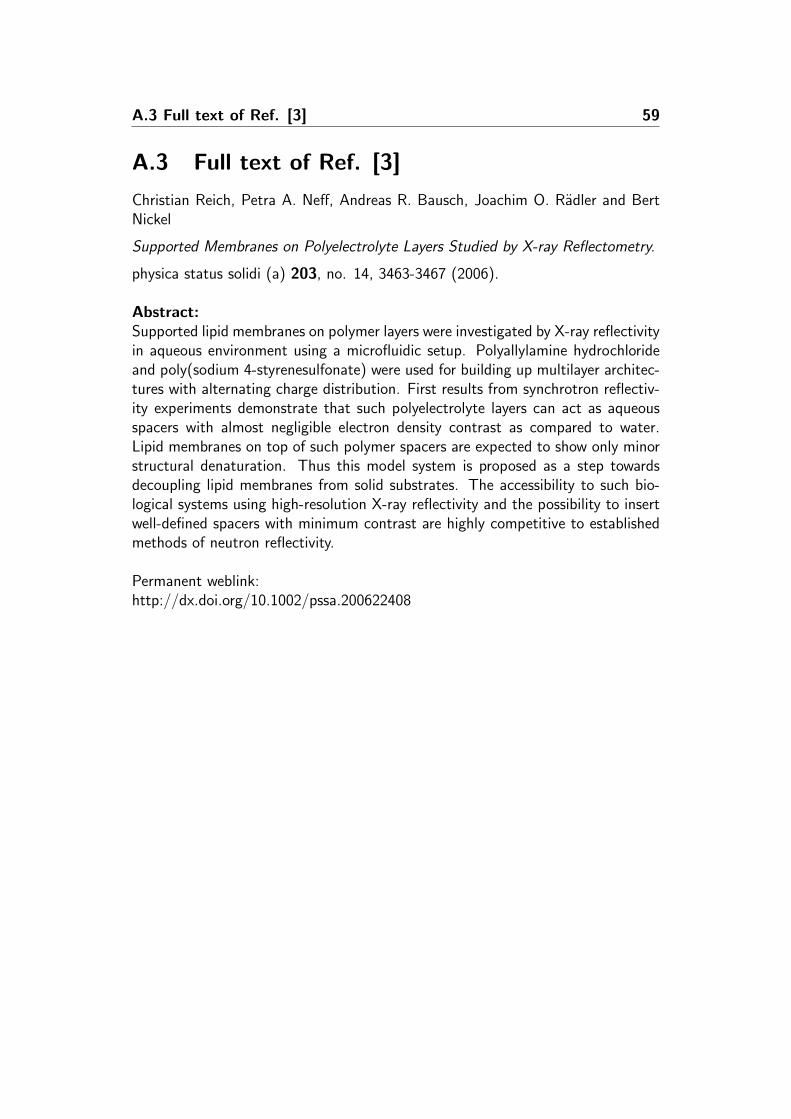
A.3 Full text of Ref. [3] 59
A.3 Full text of Ref. [3]
Christian Reich, Petra A. Neff, Andreas R. Bausch, Joachim O. Radler and BertNickel
Supported Membranes on Polyelectrolyte Layers Studied by X-ray Reflectometry.
physica status solidi (a) 203, no. 14, 3463-3467 (2006).
Abstract:Supported lipid membranes on polymer layers were investigated by X-ray reflectivityin aqueous environment using a microfluidic setup. Polyallylamine hydrochlorideand poly(sodium 4-styrenesulfonate) were used for building up multilayer architec-tures with alternating charge distribution. First results from synchrotron reflectiv-ity experiments demonstrate that such polyelectrolyte layers can act as aqueousspacers with almost negligible electron density contrast as compared to water.Lipid membranes on top of such polymer spacers are expected to show only minorstructural denaturation. Thus this model system is proposed as a step towardsdecoupling lipid membranes from solid substrates. The accessibility to such bio-logical systems using high-resolution X-ray reflectivity and the possibility to insertwell-defined spacers with minimum contrast are highly competitive to establishedmethods of neutron reflectivity.
Permanent weblink:http://dx.doi.org/10.1002/pssa.200622408

60 A. Publications
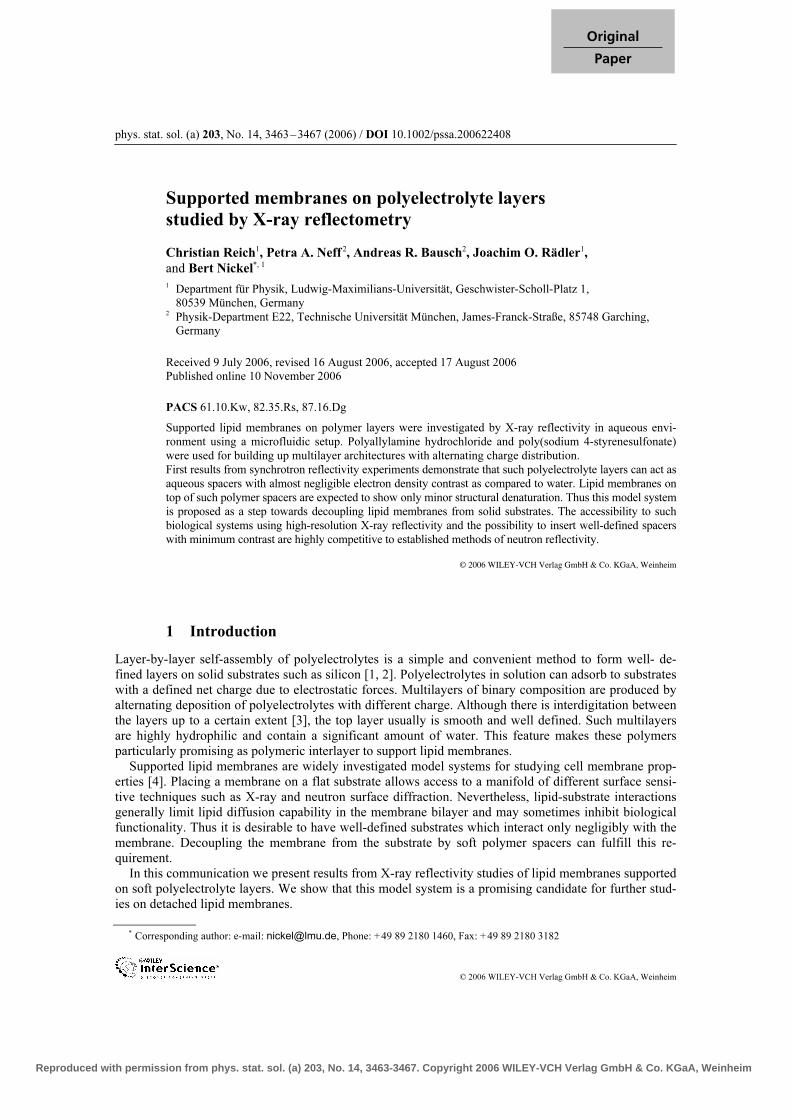
phys. stat. sol. (a) 203, No. 14, 3463–3467 (2006) / DOI 10.1002/pssa.200622408
© 2006 WILEY-VCH Verlag GmbH & Co. KGaA, Weinheim
Original
Paper
Supported membranes on polyelectrolyte layers
studied by X-ray reflectometry
Christian Reich1, Petra A. Neff 2, Andreas R. Bausch2, Joachim O. Rädler1,
and Bert Nickel*, 1
1 Department für Physik, Ludwig-Maximilians-Universität, Geschwister-Scholl-Platz 1,
80539 München, Germany 2 Physik-Department E22, Technische Universität München, James-Franck-Straße, 85748 Garching,
Germany
Received 9 July 2006, revised 16 August 2006, accepted 17 August 2006
Published online 10 November 2006
PACS 61.10.Kw, 82.35.Rs, 87.16.Dg
Supported lipid membranes on polymer layers were investigated by X-ray reflectivity in aqueous envi-
ronment using a microfluidic setup. Polyallylamine hydrochloride and poly(sodium 4-styrenesulfonate)
were used for building up multilayer architectures with alternating charge distribution.
First results from synchrotron reflectivity experiments demonstrate that such polyelectrolyte layers can act as
aqueous spacers with almost negligible electron density contrast as compared to water. Lipid membranes on
top of such polymer spacers are expected to show only minor structural denaturation. Thus this model system
is proposed as a step towards decoupling lipid membranes from solid substrates. The accessibility to such
biological systems using high-resolution X-ray reflectivity and the possibility to insert well-defined spacers
with minimum contrast are highly competitive to established methods of neutron reflectivity.
© 2006 WILEY-VCH Verlag GmbH & Co. KGaA, Weinheim
1 Introduction
Layer-by-layer self-assembly of polyelectrolytes is a simple and convenient method to form well- de-fined layers on solid substrates such as silicon [1, 2]. Polyelectrolytes in solution can adsorb to substrates with a defined net charge due to electrostatic forces. Multilayers of binary composition are produced by alternating deposition of polyelectrolytes with different charge. Although there is interdigitation between the layers up to a certain extent [3], the top layer usually is smooth and well defined. Such multilayers are highly hydrophilic and contain a significant amount of water. This feature makes these polymers particularly promising as polymeric interlayer to support lipid membranes. Supported lipid membranes are widely investigated model systems for studying cell membrane prop-erties [4]. Placing a membrane on a flat substrate allows access to a manifold of different surface sensi-tive techniques such as X-ray and neutron surface diffraction. Nevertheless, lipid-substrate interactions generally limit lipid diffusion capability in the membrane bilayer and may sometimes inhibit biological functionality. Thus it is desirable to have well-defined substrates which interact only negligibly with the membrane. Decoupling the membrane from the substrate by soft polymer spacers can fulfill this re-quirement. In this communication we present results from X-ray reflectivity studies of lipid membranes supported on soft polyelectrolyte layers. We show that this model system is a promising candidate for further stud-ies on detached lipid membranes.
* Corresponding author: e-mail: [email protected], Phone: +49 89 2180 1460, Fax: +49 89 2180 3182
Reproduced with permission from phys. stat. sol. (a) 203, No. 14, 3463-3467. Copyright 2006 WILEY-VCH Verlag GmbH & Co. KGaA, Weinheim

3464 C. Reich et al.: Supported membranes on polyelectrolyte layers
© 2006 WILEY-VCH Verlag GmbH & Co. KGaA, Weinheim www.pss-a.com
2 Experiment
Polyallylamine hydrochloride (PAH, positive net charge) and poly(sodium 4-styrenesulfonate) (PSS, negative net charge) were purchased from Sigma–Aldrich and dissolved in buffer solution (50 mM NaCl, 10 mM Tris, pH 7.5). Lipids were bought from Avanti Polar Lipids, Alabama, USA and used without further purification. A sample chamber with a silicon wafer at the bottom of a microfluidic channel was used for the re-flectivity studies. The chamber design is optimized for X-ray diffraction at solid-liquid interfaces and described in Ref. [5, 6]. Polyelectrolyte layers were produced as follows: The silicon wafers were cleaned using the method described in Ref. [7] and pre-wetted with buffer solution (50 mM NaCl, 10 mM Tris, pH 7.5). A single layer of PAH (5 mg/ml in buffer) was deposited on the wafer by flushing the microfluidic channel with 1 ml solution. After three minutes, the channel was flushed again with pure buffer to get rid of excess solution. As next step, PSS was injected into the channel (1 ml of 5 mg/ml solution) and again replaced by buffer after three minutes. This procedure was repeated consecutively until the desired multilayer architecture was achieved. Preparation of supported lipid bilayers: Lipid stock solutions of 1,2-Dioleoyl-sn-Glycero-3-Phos-phocholine (DOPC, neutral) and 1,2-Dioleoyl-sn-Glycero-3-Phospho-L-Serine (DOPS, negative net charge) were partitioned into desired quantities and dried under nitrogen flow, followed by 24 hours in an evacuated exsiccator. Multilamellar vesicle suspensions (concentration 1 mg/ml) were obtained by hydration with deionized pure water (specific resistivity 18.2 MW cm, Millipore Corp., Billerica, Massa-chusetts). Sonication of these suspensions gave small unilamellar vesicles (SUVs). The fresh SUV solu-tion was injected into the microchannel and incubated at room temperature for two hours, allowing the vesicles to adsorb on the top polyelectrolyte layer. The microchannel was subsequently flushed with buffer solution (50 mM NaCl, 10 mM Tris, pH 7.5). Due to osmotic pressure between the water-filled vesicles and the buffer environment, SUVs tend to deform and to rupture, giving lipid bilayer disks on the substrate. Such disks subsequently form continuous bilayers on the substrate [8, 9]. The X-ray reflectivity experiments were carried out at the European Synchrotron Radiation Facility (ESRF) in Grenoble, France (beamline ID01) and the Hamburger Synchrotronstrahlungslabor (Hasylab) in Hamburg, Germany (beamline D4). The X-ray energy was 19.9 keV and the same experimental ge-ometry was used as in Ref. [5].
3 Results
3.1 Lipid membrane on a single polyelectrolyte layer
First, a single layer of PAH was prepared on SiO2 in excess buffer as described above. The X-ray reflec-tivity of the layer shows no characteristic signature and is undistinguishable to the reflectivity of a smooth silicon oxide substrate exposed to buffer liquid (Fig. 1(a)). Either the polyelectrolyte layer did not form at all, or the layer is invisible in the reflectivity data due to a vanishing electron density contrast between the buffer and the strongly hydrated polyelectrolyte layer. Subsequently, small unilamellar vesicles of negatively charged DOPS were added and incubated for two hours. Afterwards, the chamber was flushed again with buffer solution to remove non-adhered and unfused vesicles. It is known that supported membranes of pure negatively charged lipids hardly spread on bare silicon oxide due to repulsive electrostatic forces [10]. Thus no lipid membrane is expected on the substrate if no polyelectrolyte layer is present. The reflectivity signal now shows clear characteristic oscillations, indicating the formation of a sup-ported lipid membrane detached from the substrate by a ca. 40 ( 4)± Å spacer (Fig. 1(b)). The corre-sponding electron density profile (Fig. 2(a)) was extracted from a fit using Parratt’s algorithm [11]: A simple five box model with an average roughness of 4 Å was refined using a one-dimensional Newton–Raphson method [12]. The refinement did not improve notably upon increasing the number of boxes in the fit model.
Reproduced with permission from phys. stat. sol. (a) 203, No. 14, 3463-3467. Copyright 2006 WILEY-VCH Verlag GmbH & Co. KGaA, Weinheim

phys. stat. sol. (a) 203, No. 14 (2006) 3465
www.pss-a.com © 2006 WILEY-VCH Verlag GmbH & Co. KGaA, Weinheim
Original
Paper
silicon oxide
PAH
Liquid (buffer solution)
silicon oxide
DOPS
PAH
Liquid
Fig. 1 (a) Reflectivity of a PAH-layer deposited on SiO2 in excess water. No characteristic oscillations are visible.
(b) Reflectivity of a DOPS-membrane floating on a PAH-cushion. The solid lines are fits to the data. All data sets
are background corrected and normalized. The data strongly indicates the presence of a PAH-layer between wafer and lipid membrane. The PAH-layer can be adequately fitted assuming an electron density very similar to the density of water. Thus we conclude that the PAH-layer consists of a significant amount of incorporated water molecules. This is in agreement with previous X-ray reflectivity experiments which have demonstrated that such polymer layers show an increase in electron density upon drying [3]. The extracted headgroup–headgroup distance of the membrane was determined to 49 ( 4)± Å, which is slightly larger than comparable data from supported DOPC-membranes on silicon oxide [5, 13]. This result was verified by performing the data refinement using different models and number of boxes. The dynamical momentum range covered by the data may not be sufficient to exclude other possible electron density profiles. However, it is reasonably large to conclude that the membrane is smoothly aligned on top of the polymer, without large undulations. Further, the membrane on the polymer monolayer retains the interface roughness of the bare silicon substrate (ca. 4 Å). The data sets were recorded at ESRF.
3.2 Lipid membrane on polyelectrolyte multilayers
In the next step, multilayer stacks were deposited on silicon oxide as described above. The top layer was PAH in all cases. The reflectivity of a DOPS membrane on 7 alternating PAH/PSS monolayers is shown in Fig. 2(b). An overall thickness of ca. 82 ( 7)± Å was found for the polymer cushion (approx.
lipid
headgro
ups
PA
H m
onola
yer
excess liq
uid
(buffer)
hyd
roca
rbo
n c
ha
ins
sili
con o
xid
e s
ubstr
ate
lipid
headgro
ups
DOPS membraneon 7 monolayers
DOPC membraneon 13 monolayers
Fig. 2 (a) Electron density profile corresponding to the fit in Fig. 1(b). (b) Reflectivity of a DOPS-membrane on 7
monolayers of PAH/PSS and of a DOPC-membrane on 13 monolayers of PAH/PSS. The scans are shifted for clar-
ity.
a) b)
a) b)
Reproduced with permission from phys. stat. sol. (a) 203, No. 14, 3463-3467. Copyright 2006 WILEY-VCH Verlag GmbH & Co. KGaA, Weinheim
3466 C. Reich et al.: Supported membranes on polyelectrolyte layers
© 2006 WILEY-VCH Verlag GmbH & Co. KGaA, Weinheim www.pss-a.com
7 layers
13
layers
silicon oxide
head-head distance
13 PAH/PSS
multilayers
silicon oxide
7 PAH/PSS
multilayers
Fig. 3 Electron density profiles for the data in Fig. 2(b). The dominant contrast contribution to the re-
flectivity signal results from the water-free chain region of the floating membrane.
11 7. Å average thickness for one layer). This result is in good agreement with complementary ellipsome-try data [14]. The discrepancy to the thickness of a single PAH-layer (ca. 40 Å) can be explained with a strong intercalation effect of alternating polyelectrolyte layers [3]. The signature of the lipid membrane is dominated by the electron density of the hydrocarbon chains, which are the only hydrophobic components in the system and therefore do not show swelling in the presence of water molecules (Fig. 3). The electron density of the lipid headgroups was found to converge towards the water density level, independently of the applied fitting model. We ascribe the vanishing electron density of the lipid headgroups partially to an increase of the laterally averaged interface rough-ness. The calculated roughness of the membrane/polymer interface is ca. 12 Å. This interface is not as well-defined as in the case of only one single PAH-layer between silicon oxide and the lipid membrane. Intercalation of lipid headgroups into holes or cavities of the underlying polymer could favor a loss of contrast as well. On the other hand, the fast decay of the oscillations in the data may indicate that these membranes were only partially homogeneous. In a parallel experiment, 13 alternating monolayers of PAH/PSS were deposited on silicon oxide, followed by a membrane of DOPC (Fig. 2(b)). We found no notable difference in the adhesion behavior between vesicles of (neutral) DOPC and (negative) DOPS on polyelectrolyte layers. Here, the overall multilayer thickness was found to be ca. 133 ( 10)± Å (approx. 10 2. Å average thickness for one layer), which is in good agreement with the previous experiment and with Ref. [14]. The calculated roughness at the membrane/polymer interface is 11 Å. These data sets were recorded at Hasylab.
4 Conclusions
We have demonstrated that polyelectrolyte layers can act as aqueous spacers and provide well defined model systems for X-ray surface diffraction studies of polymer supported lipid membranes. The reflec-tivity data show that it is possible to produce homogeneous membranes on smooth polymer layers. The thickness of these layers can be tuned with an accuracy of about one nanometer. However, a thicker layer is accompanied with an increased surface roughness. Another tunable parameter is the overall net charge of the top polymer layer, which offers further possibilities, e.g. for biosensor applications [14].
Acknowledgements We thank ibidi GmbH, München, Germany for supplying the plastic supports of the microflu-
idic chambers. We also thank B. Krause and T. H. Metzger for continuous support during the synchrotron experi-
ments at ESRF. We are indebted to Hasylab and ESRF for supplying beamtime and financial travel support. This
work was supported by the Deutsche Forschungsgemeinschaft (Grant no. SFB 563).
Reproduced with permission from phys. stat. sol. (a) 203, No. 14, 3463-3467. Copyright 2006 WILEY-VCH Verlag GmbH & Co. KGaA, Weinheim
phys. stat. sol. (a) 203, No. 14 (2006) 3467
www.pss-a.com © 2006 WILEY-VCH Verlag GmbH & Co. KGaA, Weinheim
Original
Paper
References
[1] G. Decher, Science 277, 1232–1237 (1997).
[2] C. Delajon, T. Gutberlet, R. Steitz, H. Möhwald, and R. Krastev, Langmuir 21, 8509–8514 (2005).
[3] A. Plech, T. Salditt, C. Münster, and J. Peisl, J. Colloid Interface Sci. 223, 74–82 (2000).
[4] E. Sackmann, Science 271, 43–48 (1996).
[5] C. Reich, M. B. Hochrein, B. Krause, and B. Nickel, Rev. Sci. Instrum. 76, 095103 (2005).
[6] M. B. Hochrein, C. Reich, B. Krause, J. O. Rädler, and B. Nickel, Langmuir 22, 538–545 (2006).
[7] W. Kern and D. A. Puotinen, RCA Review 31, 187 (1970).
[8] A. A. Brian and H. M. McConnell, Proc. Natl. Acad. Sci. 81, 6159–6163, (1984).
[9] J. Rädler, H. Strey, and E. Sackmann, Langmuir 11, 4539–4548 (1995).
[10] A. R. Sapuri, M. M. Baksh, and Jay T. Groves, Langmuir 19, 1606–1610 (2003).
[11] L. G. Parratt, Phys. Rev. 95, 359 (1954).
[12] W. Press, B. Flannery, S. Teukolsky, and W. Vetterling, Numerical Recipes (Cambridge University Press,
Cambridge, 1986).
[13] Y. Liu and J. F. Nagle. Phys. Rev. E 69, 040901 (2004).
[14] P. A. Neff, A. Naji, C. Ecker, B. Nickel, R. v. Klitzing, and A. R. Bausch, Macromolecules 39, 463–466
(2006).
Reproduced with permission from phys. stat. sol. (a) 203, No. 14, 3463-3467. Copyright 2006 WILEY-VCH Verlag GmbH & Co. KGaA, Weinheim

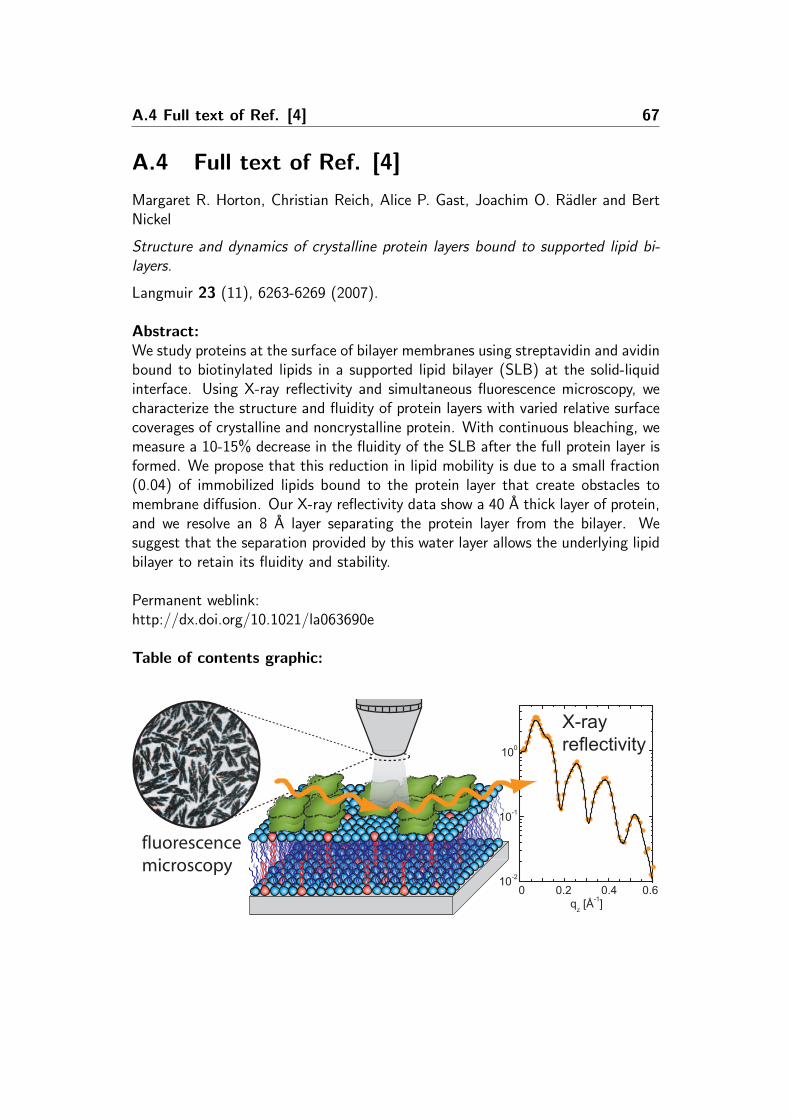
A.4 Full text of Ref. [4] 67
A.4 Full text of Ref. [4]
Margaret R. Horton, Christian Reich, Alice P. Gast, Joachim O. Radler and BertNickel
Structure and dynamics of crystalline protein layers bound to supported lipid bi-layers.
Langmuir 23 (11), 6263-6269 (2007).
Abstract:We study proteins at the surface of bilayer membranes using streptavidin and avidinbound to biotinylated lipids in a supported lipid bilayer (SLB) at the solid-liquidinterface. Using X-ray reflectivity and simultaneous fluorescence microscopy, wecharacterize the structure and fluidity of protein layers with varied relative surfacecoverages of crystalline and noncrystalline protein. With continuous bleaching, wemeasure a 10-15% decrease in the fluidity of the SLB after the full protein layer isformed. We propose that this reduction in lipid mobility is due to a small fraction(0.04) of immobilized lipids bound to the protein layer that create obstacles tomembrane diffusion. Our X-ray reflectivity data show a 40 A thick layer of protein,and we resolve an 8 A layer separating the protein layer from the bilayer. Wesuggest that the separation provided by this water layer allows the underlying lipidbilayer to retain its fluidity and stability.
Permanent weblink:http://dx.doi.org/10.1021/la063690e
Table of contents graphic:
X-rayreflectivity
fluorescencemicroscopy

68 A. Publications

Structure and Dynamics of Crystalline Protein Layers Bound toSupported Lipid Bilayers
Margaret R. Horton,*,†,‡ Christian Reich,† Alice P. Gast,§ Joachim O. Radler,† andBert Nickel†
Department fur Physik, Ludwig-Maximilians-UniVersitat, Geschwister-Scholl-Platz 1, 80539 Munchen,Germany, Department of Chemical Engineering, Massachusetts Institute of Technology, Cambridge,
Massachusetts 02139, and Department of Chemical Engineering, Lehigh UniVersity,Bethlehem, PennsylVania 18015
ReceiVed December 20, 2006. In Final Form: March 7, 2007
We study proteins at the surface of bilayer membranes using streptavidin and avidin bound to biotinylated lipidsin a supported lipid bilayer (SLB) at the solid-liquid interface. Using X-ray reflectivity and simultaneous fluorescencemicroscopy, we characterize the structure and fluidity of protein layers with varied relative surface coverages ofcrystalline and noncrystalline protein. With continuous bleaching, we measure a 10-15% decrease in the fluidity ofthe SLB after the full protein layer is formed. We propose that this reduction in lipid mobility is due to a small fraction(0.04) of immobilized lipids bound to the protein layer that create obstacles to membrane diffusion. Our X-rayreflectivity data show a 40 Å thick layer of protein, and we resolve an 8 Å layer separating the protein layer fromthe bilayer. We suggest that the separation provided by this water layer allows the underlying lipid bilayer to retainits fluidity and stability.
Introduction
The cell membrane is a heterogeneous matrix of lipids andproteins that provides a barrier between the interior of a cell andits outside environment. Self-assembled protein complexes incell membranes have diverse functions, including structuralmembrane deformation1,2 and transduction of external signals.3
These complexes can be peripherally attached to the membraneor imbedded in the lipid bilayer; the nature of this physicalarrangement can impact the overall membrane structure andfluidity.4 An important biological function attributed to manymembrane-associated proteins and protein complexes is to directlyinfluence the membrane structure and fluidity through lipid bilayermodification or rearrangement. An example of a membrane-active protein that chemically modifies the bilayer is phospho-lipase A2, which binds lipid bilayers and catalyzes the hydrolysisof phospholipids into fatty acids and single-chained lipids, thuschanging the lipid composition and increasing the membraneheterogeneity.5 In an example of protein-mediated membranestructural modification, the membrane receptor GM1 binds theprotein cholera toxin and forms a complex on the surface of thecell membrane that assists the entry of cholera toxin into thecell.6 To understand the biological activity of proteins in cellmembranes better, it is important to study proteins interactingwith lipid interfaces.
Microscopic and nanoscopic structural studies of proteincomplexes at membrane surfaces offer complementary insight
into protein-lipid interactions. Studies of the diffusion or mobilityof lipids within membranes have provided the basis forunderstanding the dynamics and fluidity of the lipid bilayer.7
Fluorescence microscopy can be used to measure the mobilityof lipids and demonstrates that proteins bound to lipid bilayerscan moderate lipid fluidity.8 Lipid mobility likewise influencesprotein complex formation, and a microscopic investigation ofthe growth of 2D crystals of the tetrameric protein streptavidinsuggests that immobile lipids hinder the formation of proteincrystals.9 On the nanoscale, X-ray and neutron scattering providedetailed structural information that can elucidate the role ofproteins at biological interfaces.10 For example, X-ray reflectivitymeasurements reveal that the membrane-targeting domain of theperipheral protein cPLA-RC2 displaces water molecules fromthe lipid headgroups to facilitate membrane attachment and ligandbinding.11 Other studies show that single layers of a crystallineprotein can intercalate lipids, resulting in a rearrangement of thelipid headgroups.12-14 In these X-ray and neutron reflectivityexamples, lipid monolayers provide the model interface forstudying surface proteins.
Experimental accessibility traditionally guides the choice ofthe biomimetic lipid interface to study protein-lipid interactions.Whereas lipid monolayers at the air/water interface are the mostcommon experimental system currently used for X-ray andneutron reflectivity studies, they are not as representative of cellmembranes as a single lipid bilayer in the liquid phase. Stacksof multilamellar lipid membranes can mimic the fluidity of cellular* To whom correspondence should be addressed. E-mail: mhorton@
mit.edu.† Ludwig-Maximilians-Universitat.‡ Massachusetts Institute of Technology.§ Lehigh University.(1) Antonny, B. Curr. Opin. Cell Biol. 2006, 18, 386-394.(2) Farsad, K.; De Camilli, P. Curr. Opin. Cell Biol. 2003, 15, 372-381.(3) Bray, D. Annu. ReV. Biophys. Biomol. Struct. 1998, 27, 59-75.(4) Janmey, P. A.; Kinnunen, P. K. J. Trends Cell Biol. 2006, 16, 538-546.(5) Mouritsen, O. G.; Andresen, T. L.; Halperin, A.; Hansen, P. L.; Jakobsen,
A. F.; Jensen, U. B.; Jensen, M. Ø.; Jørgensen, K.; Kaasgaard, T.; Leidy, C.;Simonsen, A. C.; Peters, G. H.; Weiss, M. J. Phys.: Condens. Matter 2006, 18,S1293-S1304.
(6) Lencer, W. I.; Hirst, T. R.; Holmes, R. Biochim. Biophys. Acta 1999, 1450,177-190.
(7) Edidin, M. Nat. ReV. Mol. Cell Biol. 2003, 4, 414-418.(8) Yamazaki, V.; Sirenko, O.; Schafer, R. J.; Groves, J. T. J. Am. Chem. Soc.
2005, 127, 2826-2827.(9) Calvert, T. L.; Leckband, D. Langmuir 1997, 13, 6737-6745.(10) Krueger, S. Curr. Opin. Colloid Interface Sci. 2001, 6, 111-117.(11) Malkova, S.; Long, F.; Stahelin, R. V.; Pingali, S. V.; Murray, D.; Cho,
W.; Schlossman, M. L. Biophys. J. 2005, 89, 1861-1873.(12) Vaknin, D.; Kjaer, K.; Ringsdorf, H.; Blankenburg, R.; Piepenstock, M.;
Diederich, A.; Losche, M. Langmuir 1993, 9, 1171-1174.(13) Weygand, M.; Kjaer, K.; Howes, P. B.; Wetzer, B.; Pum, D.; Sleytr, U.
B.; Losche, M. J. Phys. Chem. B 2002, 106, 5793-5799.(14) Weygand, M.; Wetzer, B.; Pum, D.; Sleytr, U. B.; Cuvillier, N.; Kjaer,
K.; Howes, P. B.; Losche, M. Biophys. J. 1999, 76, 458-468.
6263Langmuir 2007, 23, 6263-6269
10.1021/la063690e CCC: $37.00 © 2007 American Chemical SocietyPublished on Web 05/01/2007

membranes and provide signal amplification for X-ray analysis;15
however, the stacked geometry complicates the study of surface-associated protein complexes. The base structure of all cellmembranes is a single lipid bilayer that is often mechanicallycoupled to a cytoskeletal matrix, which can be approximatedexperimentally by a supported lipid bilayer (SLB) on a solidsubstrate.16 Reflectivity characterization of a single SLB requiresa sufficiently flat substrate, optimized contrast, and minimal beamdamage. Neutron reflectivity offers the advantages of high contrastand little beam damage; however, X-ray reflectivity at lipidinterfaces offers superior resolution.17 We extend recent devel-opments to resolve single SLBs with X-ray reflectivity17-20 tostudy the more complex system of proteins interacting with singleSLBs on both microscopic and nanoscopic scales.
We study the proteins streptavidin and avidin bound tobiotinylated lipids to model peripheral membrane proteins onthe surface of cell membranes. We prepare large (∼cm2)symmetric biotinylated SLBs and study them in a microfluidicdevice19 that enables simultaneous in-situ characterization withX-ray reflectivity and fluorescence microscopy. Our membranecharacterization combines dynamic studies of lipid diffusion inthe membrane with direct structural observation of protein layerformation on both microscopic and nanoscopic scales. Strepta-vidin forms 2D crystals visualized among fluorescent Alexa488-conjugated avidin, which binds to the biotinylated lipids butdoes not crystallize.9 By using different ratios of streptavidin toavidin, we tune the amount of crystalline versus noncrystallineprotein to examine the influence of protein ordering on themobility of the underlying lipid membrane. Previously publishedX-ray and neutron reflectivity studies of streptavidin bound tolipid monolayers12,21 allow us to compare bilayer and monolayerinterfaces and, in particular, the structural effect of the proteinon different lipid interfaces. In addition to their use in structuralstudies, stable SLBs at the solid interface have potential biosensingand lab-on-a-chip applications, where a single membrane or aprotein layer directly coupled to a surface can be used formeasurement and analysis.16,22
Materials and Methods
Chemicals. The lipid 1-stearoyl-2-oleoyl-sn-glycero-3-phospho-choline (SOPC) was purchased from Avanti Polar Lipids (Alabaster,AL). Lipids N-((6-(biotinoyl)amino)hexanoyl)-1,2-dihexadecanoyl-sn-glycero-3-phosphoethanolamine triethylammonium salt (biotin-X-DPPE) and 1,2-dihexadecanoyl-sn-glycero-3-phosphoethanola-mine triethylammonium salt (TR-DPPE) and proteins streptavidin,egg white avidin, and fluorescently labeled Alexa Fluor 488 avidin(Alexa488-avidin) were obtained from Invitrogen (Karlsruhe,Germany). Phosphate-buffered saline (0.01 M PBS; pH 7.4; 138mM NaCl, 2.7 mM KCl, 10 mM Na2HPO4, 2 mM KH2PO4) waspurchased from Sigma (St. Louis, MO). The buffer was preparedin deionized (DI) water from Millipore Corp. (Billerica, MA). HPLC-grade chloroform, acetone, isopropanol, and ethanol were from CarlRoth (Karlsruhe, Germany). Reagent-grade NH4OH, 37% HCl, andH2O2 were purchased from Sigma.
Substrate Preparation. Silicon substrates 20 × 15 mm2 in sizeand 675 µm thick were cut from polished 6 in. silicon wafers witha 100 nm thick thermal oxide layer to avoid fluorescence quenching.The substrates were cleaned by sonication in isopropanol for 10min, followed by rinsing with DI water, and then a three-stagechemical cleaning treatment was applied. First, substrates were boiledin acetone for 10 min and then in a mixture of 1:1:5 H2O2/HCl/H2Oby volume for 15 min at 150 °C and then in 1:1:5 H2O2/NH4OH/H2O for 15 min at 150 °C. After each step, the substrates were rinsedwith DI water. After cleaning, the substrates were stored in DI waterfor later use.
Spin Coating. The lipid mixture 89.5 mol % SOPC, 10 mol %biotin-X-DPPE, and 0.5 mol % TR-DPPE was prepared in chloroformand 3 mg total lipid was placed in clean glass vials. The chloroformwas evaporated from each vial in a nitrogen stream, followed byevacuation in a vacuum chamber for at least 12 h. Dried lipids werethen redissolved in isopropanol to a final concentration of 1.5 mg/mL for spin coating. This concentration ensures the formation of acomplete single bilayer.23 Unlike chloroform, isopropanol completelywets the hydrophilic silicon substrates. To coat the substrates, 200µL of lipid solution was dropped onto a clean silicon substrate ina Delta 10 spin-coater from BLE Lab Equipment (Radolfzell,Germany). The substrate was immediately accelerated with thefollowing profile: a ramp from 0 to 2000 rpm was driven for 2 s,followed by another ramp from 2000 to 3000 rpm for 2 s. Then thesample was spun at constant velocity of 3000 rpm for another 118s. After spin-coating, the substrates were placed in a vacuum chamberfor at least 4 h to ensure complete evaporation of the isopropanol.
Microfluidic Chamber Assembly.The dry spin-coated substrateswere glued into plastic microfluidic chambers purchased from ibidiGmbH (Munchen, Germany)19 using two-component UHU epoxyglue that hardens in 5 min (Buhl, Germany). After allowing theepoxy glue to dry for 30 min, the chambers with glued-in substrateswere placed under vacuum for 6 h for final hardening. Themicrofluidic channels were then flushed several times with DI waterto hydrate the supported lipid bilayers (SLBs) and to flush awayexcess lipids. The geometry of the microfluidic chamber with theimbedded SiO2 substrate is shown in Figure 1.
Protein Layer Formation on SLBs. The SLBs were rinsed inthe microfluidic chambers five times with PBS buffer, and then 1mL of a protein solution in PBS buffer at a protein concentrationof 40 µg/mL was pipetted into channels to allow protein layers toform on the SLBs. The SLBs were left undisturbed to incubate inprotein mixtures for more than 12 h at 30 °C.
X-ray Reflectivity. X-ray reflectivity measurements were per-formed at the undulator beamline ID01 at the European SynchrotronRadiation Facility (ESRF) in Grenoble, France. An X-ray energy of19.9 keV (λ ) 0.623 Å) was chosen to maximize the reflectivity
(15) Salditt, T. Curr. Opin. Struct. Biol. 2003, 13, 467-478.(16) Sackmann, E. Science 1996, 271, 43-48.(17) Miller, C. E.; Majewski, J.; Gog, T.; Kuhl, T. L. Phys. ReV. Lett. 2005,
94, 238104.(18) Novakova, E.; Giewekemeyer, K.; Salditt, T. Phys. ReV. E 2006, 74,
051911.(19) Reich, C.; Hochrein, M.; Krause, B.; Nickel, B. ReV. Sci. Instrum. 2005,
76, 095103.(20) Vogel, M.; Munster, C.; Fenzl, W.; Salditt, T. Phys. ReV. Lett. 2000, 84,
390-393.(21) Losche, M.; Piepenstock, M.; Diederich, A.; Grunewald, T.; Kjaer, K.;
Vaknin, D. Biophys. J. 1993, 65, 2160-2177.(22) Astier, Y.; Bayley, H.; Howorka, S. Curr. Opin. Chem. Biol. 2005, 9,
576-584. (23) Mennicke, U.; Salditt, T. Langmuir 2002, 18, 8172-8177.
Figure 1. Schematic of the microfluidic chamber used to characterizea protein-coated SLB on an imbedded SiO2 substrate using X-rayreflectivity and fluorescence microscopy. (Inset): Cross section ofthe microfluidic channel (200 µm in height) with the proteinperipherally bound to the lipid bilayer.
6264 Langmuir, Vol. 23, No. 11, 2007 Horton et al.
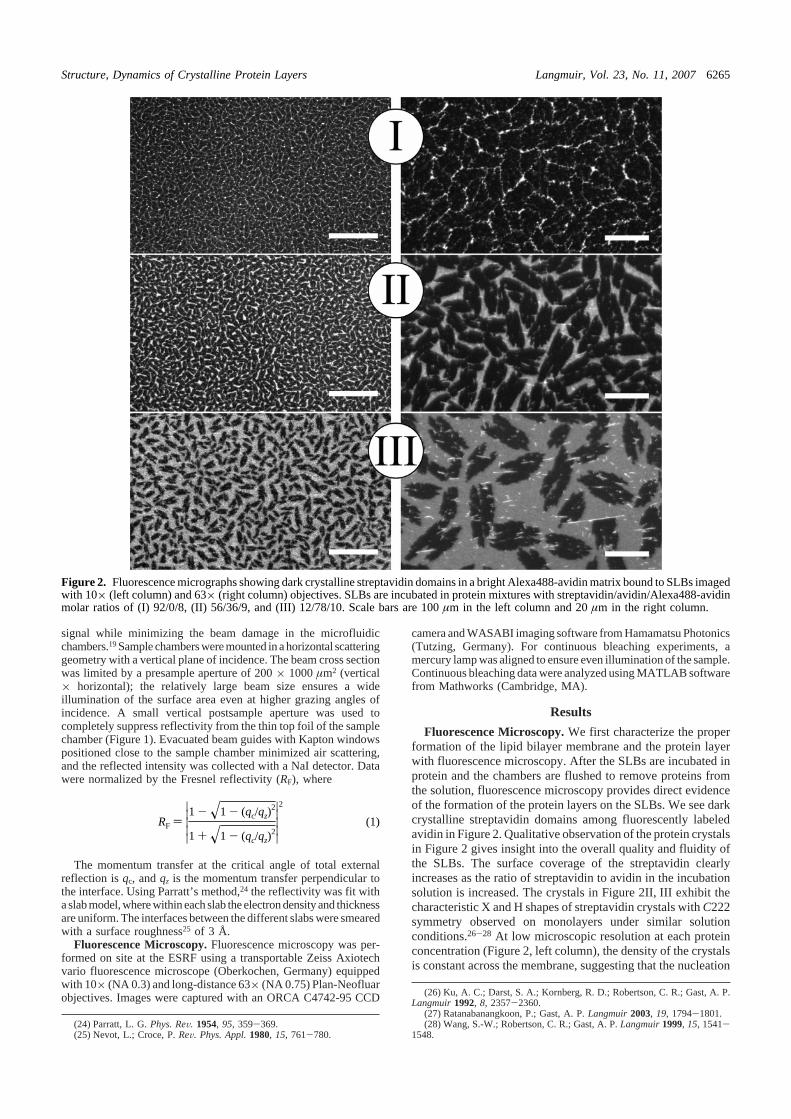
signal while minimizing the beam damage in the microfluidicchambers.19 Sample chambers were mounted in a horizontal scatteringgeometry with a vertical plane of incidence. The beam cross sectionwas limited by a presample aperture of 200 × 1000 µm2 (vertical× horizontal); the relatively large beam size ensures a wideillumination of the surface area even at higher grazing angles ofincidence. A small vertical postsample aperture was used tocompletely suppress reflectivity from the thin top foil of the samplechamber (Figure 1). Evacuated beam guides with Kapton windowspositioned close to the sample chamber minimized air scattering,and the reflected intensity was collected with a NaI detector. Datawere normalized by the Fresnel reflectivity (RF), where
The momentum transfer at the critical angle of total externalreflection is qc, and qz is the momentum transfer perpendicular tothe interface. Using Parratt’s method,24 the reflectivity was fit witha slab model, where within each slab the electron density and thicknessare uniform. The interfaces between the different slabs were smearedwith a surface roughness25 of 3 Å.
Fluorescence Microscopy. Fluorescence microscopy was per-formed on site at the ESRF using a transportable Zeiss Axiotechvario fluorescence microscope (Oberkochen, Germany) equippedwith 10× (NA 0.3) and long-distance 63× (NA 0.75) Plan-Neofluarobjectives. Images were captured with an ORCA C4742-95 CCD
camera and WASABI imaging software from Hamamatsu Photonics(Tutzing, Germany). For continuous bleaching experiments, amercury lamp was aligned to ensure even illumination of the sample.Continuous bleaching data were analyzed using MATLAB softwarefrom Mathworks (Cambridge, MA).
Results
Fluorescence Microscopy. We first characterize the properformation of the lipid bilayer membrane and the protein layerwith fluorescence microscopy. After the SLBs are incubated inprotein and the chambers are flushed to remove proteins fromthe solution, fluorescence microscopy provides direct evidenceof the formation of the protein layers on the SLBs. We see darkcrystalline streptavidin domains among fluorescently labeledavidin in Figure 2. Qualitative observation of the protein crystalsin Figure 2 gives insight into the overall quality and fluidity ofthe SLBs. The surface coverage of the streptavidin clearlyincreases as the ratio of streptavidin to avidin in the incubationsolution is increased. The crystals in Figure 2II, III exhibit thecharacteristic X and H shapes of streptavidin crystals with C222symmetry observed on monolayers under similar solutionconditions.26-28 At low microscopic resolution at each proteinconcentration (Figure 2, left column), the density of the crystalsis constant across the membrane, suggesting that the nucleation
(24) Parratt, L. G. Phys. ReV. 1954, 95, 359-369.(25) Nevot, L.; Croce, P. ReV. Phys. Appl. 1980, 15, 761-780.
(26) Ku, A. C.; Darst, S. A.; Kornberg, R. D.; Robertson, C. R.; Gast, A. P.Langmuir 1992, 8, 2357-2360.
(27) Ratanabanangkoon, P.; Gast, A. P. Langmuir 2003, 19, 1794-1801.(28) Wang, S.-W.; Robertson, C. R.; Gast, A. P. Langmuir 1999, 15, 1541-
1548.
Figure 2. Fluorescence micrographs showing dark crystalline streptavidin domains in a bright Alexa488-avidin matrix bound to SLBs imagedwith 10× (left column) and 63× (right column) objectives. SLBs are incubated in protein mixtures with streptavidin/avidin/Alexa488-avidinmolar ratios of (I) 92/0/8, (II) 56/36/9, and (III) 12/78/10. Scale bars are 100 µm in the left column and 20 µm in the right column.
RF )|||||1 - 1 - (qc/qz)
2
1 + 1 - (qc/qz)2
|||||
2
(1)
Structure, Dynamics of Crystalline Protein Layers Langmuir, Vol. 23, No. 11, 2007 6265
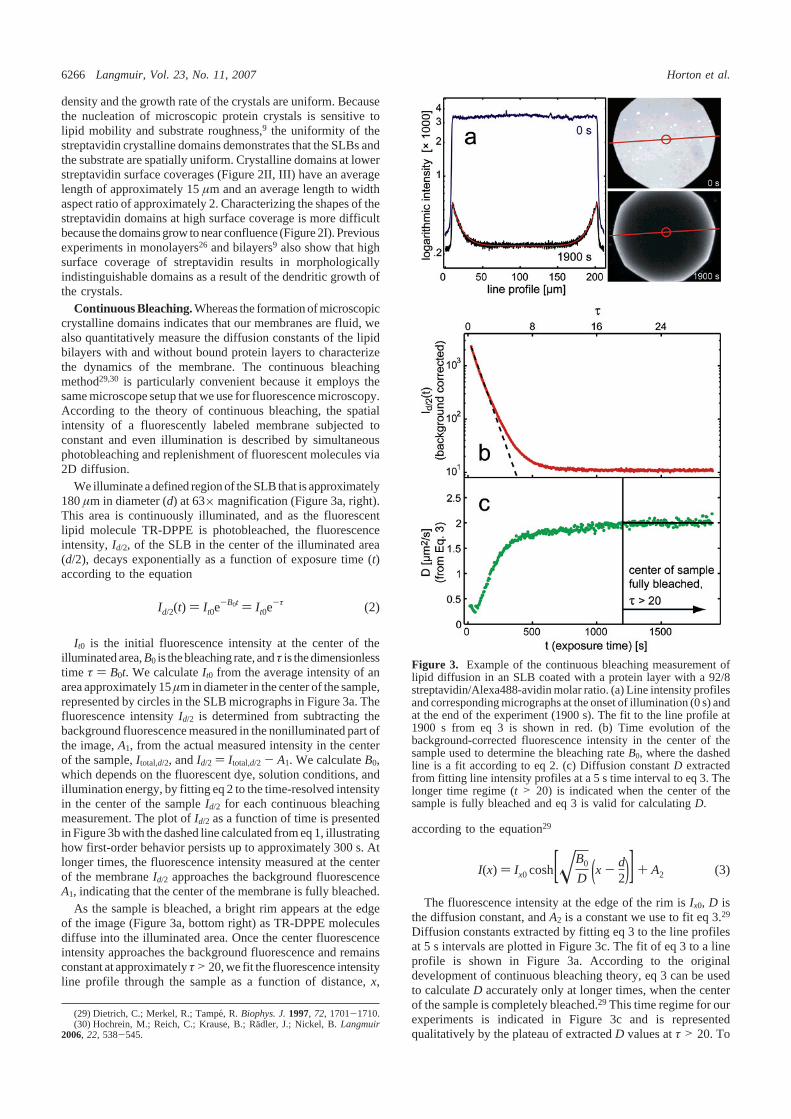
density and the growth rate of the crystals are uniform. Becausethe nucleation of microscopic protein crystals is sensitive tolipid mobility and substrate roughness,9 the uniformity of thestreptavidin crystalline domains demonstrates that the SLBs andthe substrate are spatially uniform. Crystalline domains at lowerstreptavidin surface coverages (Figure 2II, III) have an averagelength of approximately 15 µm and an average length to widthaspect ratio of approximately 2. Characterizing the shapes of thestreptavidin domains at high surface coverage is more difficultbecause the domains grow to near confluence (Figure 2I). Previousexperiments in monolayers26 and bilayers9 also show that highsurface coverage of streptavidin results in morphologicallyindistinguishable domains as a result of the dendritic growth ofthe crystals.
Continuous Bleaching. Whereas the formation of microscopiccrystalline domains indicates that our membranes are fluid, wealso quantitatively measure the diffusion constants of the lipidbilayers with and without bound protein layers to characterizethe dynamics of the membrane. The continuous bleachingmethod29,30 is particularly convenient because it employs thesame microscope setup that we use for fluorescence microscopy.According to the theory of continuous bleaching, the spatialintensity of a fluorescently labeled membrane subjected toconstant and even illumination is described by simultaneousphotobleaching and replenishment of fluorescent molecules via2D diffusion.
We illuminate a defined region of the SLB that is approximately180 µm in diameter (d) at 63× magnification (Figure 3a, right).This area is continuously illuminated, and as the fluorescentlipid molecule TR-DPPE is photobleached, the fluorescenceintensity, Id/2, of the SLB in the center of the illuminated area(d/2), decays exponentially as a function of exposure time (t)according to the equation
It0 is the initial fluorescence intensity at the center of theilluminated area, B0 is the bleaching rate, and τ is the dimensionlesstime τ ) B0t. We calculate It0 from the average intensity of anarea approximately 15 µm in diameter in the center of the sample,represented by circles in the SLB micrographs in Figure 3a. Thefluorescence intensity Id/2 is determined from subtracting thebackground fluorescence measured in the nonilluminated part ofthe image, A1, from the actual measured intensity in the centerof the sample, Itotal,d/2, and Id/2 ) Itotal,d/2 - A1. We calculate B0,which depends on the fluorescent dye, solution conditions, andillumination energy, by fitting eq 2 to the time-resolved intensityin the center of the sample Id/2 for each continuous bleachingmeasurement. The plot of Id/2 as a function of time is presentedin Figure 3b with the dashed line calculated from eq 1, illustratinghow first-order behavior persists up to approximately 300 s. Atlonger times, the fluorescence intensity measured at the centerof the membrane Id/2 approaches the background fluorescenceA1, indicating that the center of the membrane is fully bleached.
As the sample is bleached, a bright rim appears at the edgeof the image (Figure 3a, bottom right) as TR-DPPE moleculesdiffuse into the illuminated area. Once the center fluorescenceintensity approaches the background fluorescence and remainsconstant at approximately τ> 20, we fit the fluorescence intensityline profile through the sample as a function of distance, x,
according to the equation29
The fluorescence intensity at the edge of the rim is Ix0, D isthe diffusion constant, and A2 is a constant we use to fit eq 3.29
Diffusion constants extracted by fitting eq 3 to the line profilesat 5 s intervals are plotted in Figure 3c. The fit of eq 3 to a lineprofile is shown in Figure 3a. According to the originaldevelopment of continuous bleaching theory, eq 3 can be usedto calculate D accurately only at longer times, when the centerof the sample is completely bleached.29 This time regime for ourexperiments is indicated in Figure 3c and is representedqualitatively by the plateau of extracted D values at τ > 20. To
(29) Dietrich, C.; Merkel, R.; Tampe, R. Biophys. J. 1997, 72, 1701-1710.(30) Hochrein, M.; Reich, C.; Krause, B.; Radler, J.; Nickel, B. Langmuir
2006, 22, 538-545.
Figure 3. Example of the continuous bleaching measurement oflipid diffusion in an SLB coated with a protein layer with a 92/8streptavidin/Alexa488-avidin molar ratio. (a) Line intensity profilesand corresponding micrographs at the onset of illumination (0 s) andat the end of the experiment (1900 s). The fit to the line profile at1900 s from eq 3 is shown in red. (b) Time evolution of thebackground-corrected fluorescence intensity in the center of thesample used to determine the bleaching rate B0, where the dashedline is a fit according to eq 2. (c) Diffusion constant D extractedfrom fitting line intensity profiles at a 5 s time interval to eq 3. Thelonger time regime (t > 20) is indicated when the center of thesample is fully bleached and eq 3 is valid for calculating D.
I(x) ) Ix0 cosh[B0
D (x - d2)] + A2 (3)
Id/2(t) ) It0e-B0t ) It0e
-τ (2)
6266 Langmuir, Vol. 23, No. 11, 2007 Horton et al.

obtain data suitable for robust quantitative analysis, extra caremust be taken to ensure even sample illumination and a flatinitial line profile (Figure 3a), and the center of the sample mustbe completely bleached to the background level to calculate thediffusion constant D.
Using this continuous bleaching method and analysis, wereproducibly measure the diffusion constants of our SLBs toinvestigate whether a bound protein layer changes the fluidityof the bilayer. Table 1 lists the lipid diffusion constants of theSLBs. We determine that the protein binding to the SLB resultsin a slight decrease in lipid mobility, as shown by the 10-15%reduction in lipid diffusion constants when a protein layer ispresent. The composition of the protein mixture and hence thearea coverage of crystalline protein do not have a measurableeffect on lipid mobility. We are also unable to detect an immobilefraction of lipids; after our continuous bleaching experiments,the SLBs recover to their full original fluorescence after 8 h.
We also investigate whether the protein molecules within thebound protein layers are mobile by using fluorescently labeledavidin as a tracer molecule. When we continuously illuminatethe protein layer on the SLBs at 488 nm, corresponding to theexcitation energy of Alexa488-avidin, we do not observe thebright rim at the sample edge characteristic of a fluid membrane.Instead, the illuminated area, viewed after 1 h of bleaching, hasa sharp outline and a flat fluorescence intensity profile, indicatingno diffusion of Alexa488-avidin (data not shown). Note thatbecause of the high photostability of the Alexa dye there is onlyminimal photobleaching. This immobility is observed for allprotein layers, and time-resolved images show that the streptavidindomains do not translate or rotate, further indicating theimmobility of the protein layer. By simple comparison of theestimated relative sizes of a lipid molecule (7 Å) and a singleprotein molecule (50 Å),31 we expect the diffusion constant ofthe bound protein to be lower than that of the underlying lipids.This size difference between lipid and protein diverges furtheras streptavidin crystallizes and the size of the protein crystalincreases. The mobility of the protein molecules can also behindered by collisions with adjacent proteins at the high proteinsurface coverage in these experiments. Our observation that theproteins within the protein layer are immobilized relative to thelipids is consistent with previous observations: proteins attachedto membranes at high surface coverages can diffuse 20-100times slower than lipids.26 It is therefore reasonable that themobility of the proteins is significantly lower than that of theunderlying lipids that are not bound to the protein.
X-ray Reflectivity. To further complement the microscopicdynamic and structural insight from fluorescence microscopy
characterization, we use X-ray reflectivity to determine thestructure of the protein and the underlying bilayer in nanoscopicdetail. In Figure 4, we compare the reflectivity of bare and protein-coated bilayers. The main signature of the protein layers in Figure4I-III is the dip in the reflectivity curve at qz)0.1 Å-1, indicatingan additional layer on the lipid bilayer membrane that is notpresent in our scan of the bare bilayer (Figure 4(IV)). To extractstructural details of the protein layers and SLBs, we fit the X-rayreflectivity data using Parratt’s formalism, where the interfaceis modeled as a series of slabs of varying thickness and electrondensity.24 These parameters for each slab are independently varied,and a nonlinear least-squares fitting routine is used to fit thereflectivity. All slab profiles are smoothed by an overallroughness25 of 3 Å. We model the SLBs with seven slabs: twoslabs for each headgroup layer, one slab for each acyl chainlayer, and one slab for the space between leaflets. Protein-coatedSLBs are modeled with an additional four slabs: the regionbetween the upper surface of the SLB and the bottom of theperipheral protein layer is one slab, and we use three slabs tomodel the protein layer.
From initial observation, the reflectivity data from protein-coated SLBs with different protein layer compositions shown inFigure 4I-III are nearly indistinguishable. We tested thisstructural similarity by fitting all reflectivity data of protein-coated bilayers to a single depth profile based on the same slabmodel. We plot this common profile with data from each proteincomposition in Figure 4I-III. To verify that this common profilereasonably approximates all of the different protein compositions,we also independently fitted the scans for each protein composi-tion, allowing the thickness and density of each slab to vary. Theresulting electron density profiles of the different protein mixtureswere identical within the precision of our measurements. Thesimilar reflectivity of different ratios of avidin and streptavidin
(31) Hendrickson, W. A.; Pahler, A.; Smith, J. L.; Satow, Y.; Merritt, E. A.;Phizackerley, R. P. Proc. Natl. Acad. Sci. U.S.A. 1989, 86, 2190-2194.
Table 1. Lipid Diffusion Constants Determined by ContinuousBleachinga
composition of protein solutiondiffusion constant,
D (µm2/s)
no protein (bare SLB) 2.3 ( 0.492 mol % streptavidin, 8 mol % avidin 2.0 ( 0.156 mol % streptavidin, 44 mol % avidin 1.9 ( 0.112 mol % streptavidin, 88 mol % avidin 1.9 ( 0.1100% avidin 2.0 ( 0.1
a Diffusion constants are calculated by fitting eqs 2 and 3 to continuousbleaching data. SLBs are incubated in protein solutions with thecompositions listed; total mol % avidin comprises 8-10 mol % Alexa488-avidin, and the balance is egg white avidin. Three different time-resolvedline profiles are measured for every sample, each corresponding to N>20 calculations of D. The error is estimated as the experimental standarddeviation.
Figure 4. Normalized reflectivity scans of protein-coated (I-III)and bare (IV) SLBs. Protein-coated SLBs (I-III) have a signaturedip at qz ) 0.1 Å-1. SLBs coated with protein mixtures withstreptavidin/avidin/Alexa488-avidin molar ratios of (I, blue) 92/0/8,(II, green) 56/36/9, and (III, red) 12/78/10. The common reflectivityfit is plotted with the data sets in I-III to illustrate the similarityof the streptavidin and avidin-protein layers. The reflectivity of abare SLB lacking protein (IV) is shown with its fit (orange curve).Plots are shifted vertically for clarity, and all data are backgroundcorrected and normalized by the Fresnel reflectivity, RF.
Structure, Dynamics of Crystalline Protein Layers Langmuir, Vol. 23, No. 11, 2007 6267
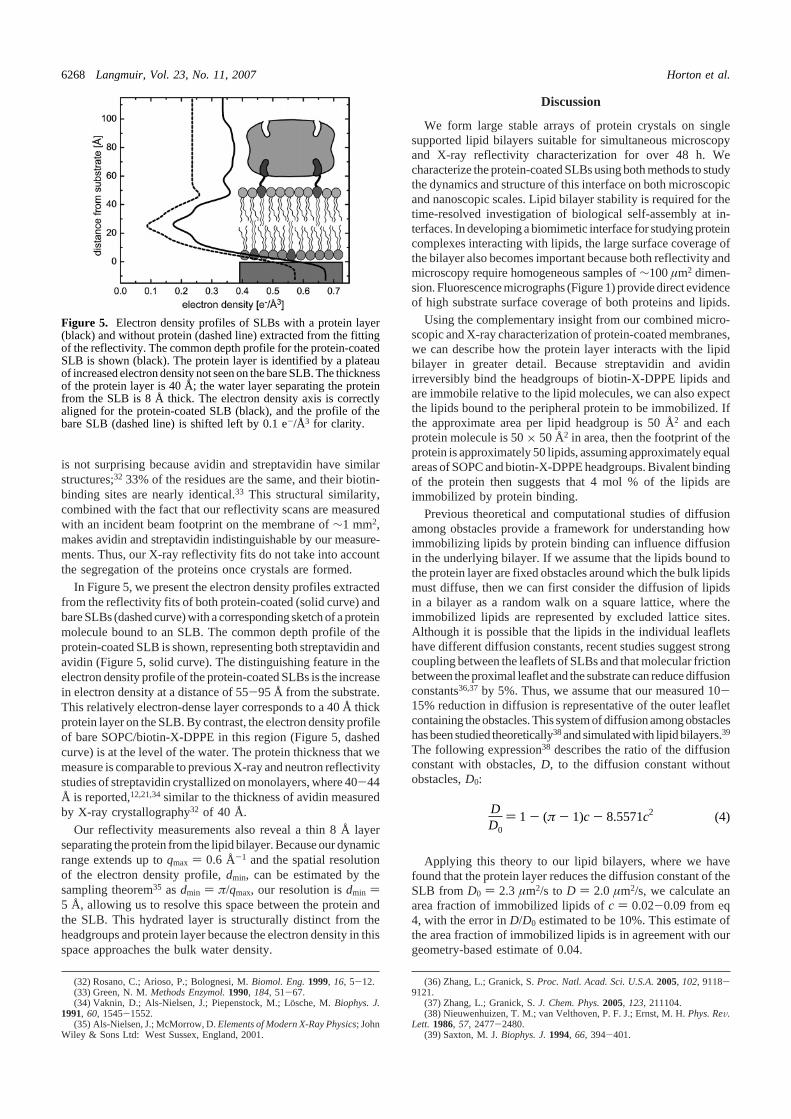
is not surprising because avidin and streptavidin have similarstructures;32 33% of the residues are the same, and their biotin-binding sites are nearly identical.33 This structural similarity,combined with the fact that our reflectivity scans are measuredwith an incident beam footprint on the membrane of ∼1 mm2,makes avidin and streptavidin indistinguishable by our measure-ments. Thus, our X-ray reflectivity fits do not take into accountthe segregation of the proteins once crystals are formed.
In Figure 5, we present the electron density profiles extractedfrom the reflectivity fits of both protein-coated (solid curve) andbare SLBs (dashed curve) with a corresponding sketch of a proteinmolecule bound to an SLB. The common depth profile of theprotein-coated SLB is shown, representing both streptavidin andavidin (Figure 5, solid curve). The distinguishing feature in theelectron density profile of the protein-coated SLBs is the increasein electron density at a distance of 55-95 Å from the substrate.This relatively electron-dense layer corresponds to a 40 Å thickprotein layer on the SLB. By contrast, the electron density profileof bare SOPC/biotin-X-DPPE in this region (Figure 5, dashedcurve) is at the level of the water. The protein thickness that wemeasure is comparable to previous X-ray and neutron reflectivitystudies of streptavidin crystallized on monolayers, where 40-44Å is reported,12,21,34 similar to the thickness of avidin measuredby X-ray crystallography32 of 40 Å.
Our reflectivity measurements also reveal a thin 8 Å layerseparating the protein from the lipid bilayer. Because our dynamicrange extends up to qmax ) 0.6 Å-1 and the spatial resolutionof the electron density profile, dmin, can be estimated by thesampling theorem35 as dmin ) π/qmax, our resolution is dmin )5 Å, allowing us to resolve this space between the protein andthe SLB. This hydrated layer is structurally distinct from theheadgroups and protein layer because the electron density in thisspace approaches the bulk water density.
Discussion
We form large stable arrays of protein crystals on singlesupported lipid bilayers suitable for simultaneous microscopyand X-ray reflectivity characterization for over 48 h. Wecharacterize the protein-coated SLBs using both methods to studythe dynamics and structure of this interface on both microscopicand nanoscopic scales. Lipid bilayer stability is required for thetime-resolved investigation of biological self-assembly at in-terfaces. In developing a biomimetic interface for studying proteincomplexes interacting with lipids, the large surface coverage ofthe bilayer also becomes important because both reflectivity andmicroscopy require homogeneous samples of ∼100 µm2 dimen-sion. Fluorescence micrographs (Figure 1) provide direct evidenceof high substrate surface coverage of both proteins and lipids.
Using the complementary insight from our combined micro-scopic and X-ray characterization of protein-coated membranes,we can describe how the protein layer interacts with the lipidbilayer in greater detail. Because streptavidin and avidinirreversibly bind the headgroups of biotin-X-DPPE lipids andare immobile relative to the lipid molecules, we can also expectthe lipids bound to the peripheral protein to be immobilized. Ifthe approximate area per lipid headgroup is 50 Å2 and eachprotein molecule is 50 × 50 Å2 in area, then the footprint of theprotein is approximately 50 lipids, assuming approximately equalareas of SOPC and biotin-X-DPPE headgroups. Bivalent bindingof the protein then suggests that 4 mol % of the lipids areimmobilized by protein binding.
Previous theoretical and computational studies of diffusionamong obstacles provide a framework for understanding howimmobilizing lipids by protein binding can influence diffusionin the underlying bilayer. If we assume that the lipids bound tothe protein layer are fixed obstacles around which the bulk lipidsmust diffuse, then we can first consider the diffusion of lipidsin a bilayer as a random walk on a square lattice, where theimmobilized lipids are represented by excluded lattice sites.Although it is possible that the lipids in the individual leafletshave different diffusion constants, recent studies suggest strongcoupling between the leaflets of SLBs and that molecular frictionbetween the proximal leaflet and the substrate can reduce diffusionconstants36,37 by 5%. Thus, we assume that our measured 10-15% reduction in diffusion is representative of the outer leafletcontaining the obstacles. This system of diffusion among obstacleshas been studied theoretically38 and simulated with lipid bilayers.39
The following expression38 describes the ratio of the diffusionconstant with obstacles, D, to the diffusion constant withoutobstacles, D0:
Applying this theory to our lipid bilayers, where we havefound that the protein layer reduces the diffusion constant of theSLB from D0 ) 2.3 µm2/s to D ) 2.0 µm2/s, we calculate anarea fraction of immobilized lipids of c ) 0.02-0.09 from eq4, with the error in D/D0 estimated to be 10%. This estimate ofthe area fraction of immobilized lipids is in agreement with ourgeometry-based estimate of 0.04.
(32) Rosano, C.; Arioso, P.; Bolognesi, M. Biomol. Eng. 1999, 16, 5-12.(33) Green, N. M. Methods Enzymol. 1990, 184, 51-67.(34) Vaknin, D.; Als-Nielsen, J.; Piepenstock, M.; Losche, M. Biophys. J.
1991, 60, 1545-1552.(35) Als-Nielsen, J.; McMorrow, D. Elements of Modern X-Ray Physics; John
Wiley & Sons Ltd: West Sussex, England, 2001.
(36) Zhang, L.; Granick, S. Proc. Natl. Acad. Sci. U.S.A. 2005, 102, 9118-9121.
(37) Zhang, L.; Granick, S. J. Chem. Phys. 2005, 123, 211104.(38) Nieuwenhuizen, T. M.; van Velthoven, P. F. J.; Ernst, M. H. Phys. ReV.
Lett. 1986, 57, 2477-2480.(39) Saxton, M. J. Biophys. J. 1994, 66, 394-401.
Figure 5. Electron density profiles of SLBs with a protein layer(black) and without protein (dashed line) extracted from the fittingof the reflectivity. The common depth profile for the protein-coatedSLB is shown (black). The protein layer is identified by a plateauof increased electron density not seen on the bare SLB. The thicknessof the protein layer is 40 Å; the water layer separating the proteinfrom the SLB is 8 Å thick. The electron density axis is correctlyaligned for the protein-coated SLB (black), and the profile of thebare SLB (dashed line) is shifted left by 0.1 e-/Å3 for clarity.
DD0
) 1 - (π - 1)c - 8.5571c2 (4)
6268 Langmuir, Vol. 23, No. 11, 2007 Horton et al.
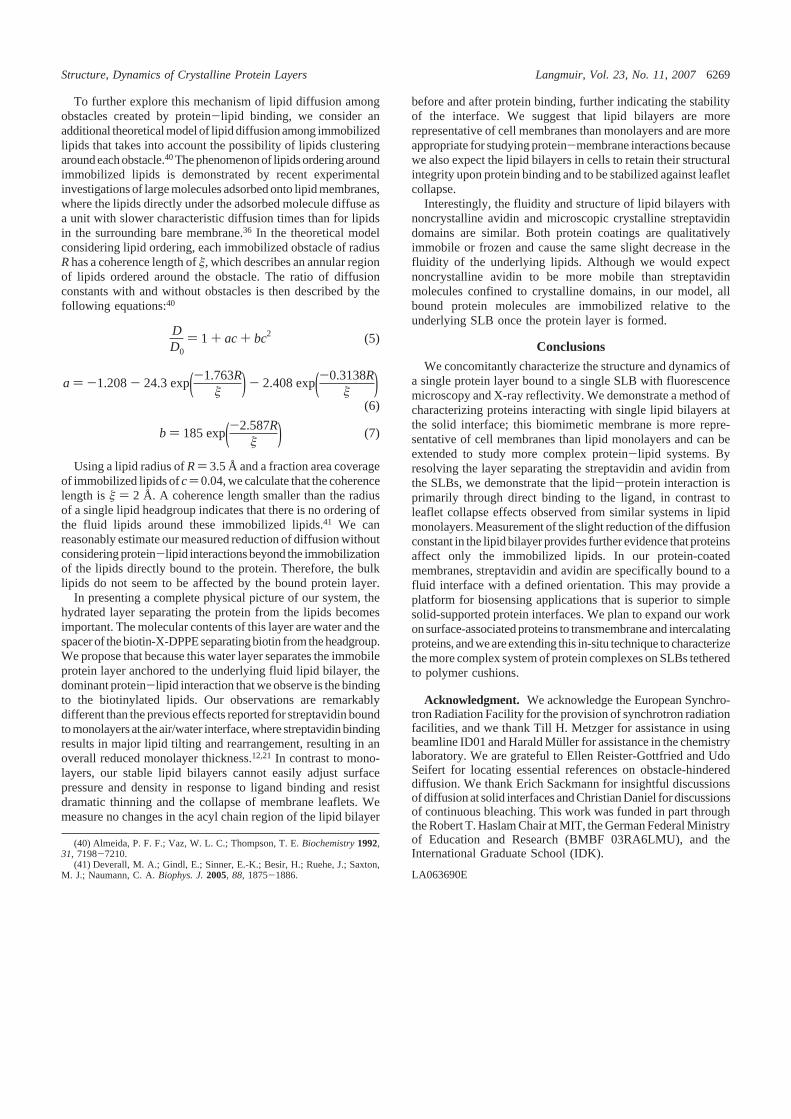
To further explore this mechanism of lipid diffusion amongobstacles created by protein-lipid binding, we consider anadditional theoretical model of lipid diffusion among immobilizedlipids that takes into account the possibility of lipids clusteringaround each obstacle.40 The phenomenon of lipids ordering aroundimmobilized lipids is demonstrated by recent experimentalinvestigations of large molecules adsorbed onto lipid membranes,where the lipids directly under the adsorbed molecule diffuse asa unit with slower characteristic diffusion times than for lipidsin the surrounding bare membrane.36 In the theoretical modelconsidering lipid ordering, each immobilized obstacle of radiusR has a coherence length of , which describes an annular regionof lipids ordered around the obstacle. The ratio of diffusionconstants with and without obstacles is then described by thefollowing equations:40
Using a lipid radius of R ) 3.5 Å and a fraction area coverageof immobilized lipids of c) 0.04, we calculate that the coherencelength is ) 2 Å. A coherence length smaller than the radiusof a single lipid headgroup indicates that there is no ordering ofthe fluid lipids around these immobilized lipids.41 We canreasonably estimate our measured reduction of diffusion withoutconsidering protein-lipid interactions beyond the immobilizationof the lipids directly bound to the protein. Therefore, the bulklipids do not seem to be affected by the bound protein layer.
In presenting a complete physical picture of our system, thehydrated layer separating the protein from the lipids becomesimportant. The molecular contents of this layer are water and thespacer of thebiotin-X-DPPEseparatingbiotin from theheadgroup.We propose that because this water layer separates the immobileprotein layer anchored to the underlying fluid lipid bilayer, thedominant protein-lipid interaction that we observe is the bindingto the biotinylated lipids. Our observations are remarkablydifferent than the previous effects reported for streptavidin boundtomonolayers at the air/water interface,where streptavidinbindingresults in major lipid tilting and rearrangement, resulting in anoverall reduced monolayer thickness.12,21 In contrast to mono-layers, our stable lipid bilayers cannot easily adjust surfacepressure and density in response to ligand binding and resistdramatic thinning and the collapse of membrane leaflets. Wemeasure no changes in the acyl chain region of the lipid bilayer
before and after protein binding, further indicating the stabilityof the interface. We suggest that lipid bilayers are morerepresentative of cell membranes than monolayers and are moreappropriate for studying protein-membrane interactions becausewe also expect the lipid bilayers in cells to retain their structuralintegrity upon protein binding and to be stabilized against leafletcollapse.
Interestingly, the fluidity and structure of lipid bilayers withnoncrystalline avidin and microscopic crystalline streptavidindomains are similar. Both protein coatings are qualitativelyimmobile or frozen and cause the same slight decrease in thefluidity of the underlying lipids. Although we would expectnoncrystalline avidin to be more mobile than streptavidinmolecules confined to crystalline domains, in our model, allbound protein molecules are immobilized relative to theunderlying SLB once the protein layer is formed.
Conclusions
We concomitantly characterize the structure and dynamics ofa single protein layer bound to a single SLB with fluorescencemicroscopy and X-ray reflectivity. We demonstrate a method ofcharacterizing proteins interacting with single lipid bilayers atthe solid interface; this biomimetic membrane is more repre-sentative of cell membranes than lipid monolayers and can beextended to study more complex protein-lipid systems. Byresolving the layer separating the streptavidin and avidin fromthe SLBs, we demonstrate that the lipid-protein interaction isprimarily through direct binding to the ligand, in contrast toleaflet collapse effects observed from similar systems in lipidmonolayers. Measurement of the slight reduction of the diffusionconstant in the lipid bilayer provides further evidence that proteinsaffect only the immobilized lipids. In our protein-coatedmembranes, streptavidin and avidin are specifically bound to afluid interface with a defined orientation. This may provide aplatform for biosensing applications that is superior to simplesolid-supported protein interfaces. We plan to expand our workon surface-associated proteins to transmembrane and intercalatingproteins, andweare extending this in-situ technique to characterizethe more complex system of protein complexes on SLBs tetheredto polymer cushions.
Acknowledgment. We acknowledge the European Synchro-tron Radiation Facility for the provision of synchrotron radiationfacilities, and we thank Till H. Metzger for assistance in usingbeamline ID01 and Harald Muller for assistance in the chemistrylaboratory. We are grateful to Ellen Reister-Gottfried and UdoSeifert for locating essential references on obstacle-hindereddiffusion. We thank Erich Sackmann for insightful discussionsof diffusion at solid interfaces and Christian Daniel for discussionsof continuous bleaching. This work was funded in part throughthe Robert T. Haslam Chair at MIT, the German Federal Ministryof Education and Research (BMBF 03RA6LMU), and theInternational Graduate School (IDK).
LA063690E
(40) Almeida, P. F. F.; Vaz, W. L. C.; Thompson, T. E. Biochemistry 1992,31, 7198-7210.
(41) Deverall, M. A.; Gindl, E.; Sinner, E.-K.; Besir, H.; Ruehe, J.; Saxton,M. J.; Naumann, C. A. Biophys. J. 2005, 88, 1875-1886.
DD0
) 1 + ac + bc2 (5)
a ) -1.208 - 24.3 exp(-1.763R ) - 2.408 exp(-0.3138R
)(6)
b ) 185 exp(-2.587R ) (7)
Structure, Dynamics of Crystalline Protein Layers Langmuir, Vol. 23, No. 11, 2007 6269


A.5 Full text of Ref. [5] 77
A.5 Full text of Ref. [5]
Christian Reich, Margaret R. Horton, Barbel Krause, Alice P. Gast, Joachim O.Radler and Bert Nickel
Condensation, stretching and asymmetry: GM1 and cholesterol in single supportedlipid bilayers.
Submitted on May 18, 2007.
Abstract:The membrane of living cells comprises numerous protein and lipid molecules capa-ble of liquid-liquid phase separation and asymmetric organization between leaflets,resulting in structural heterogeneity. We model cell membranes using supportedlipid bilayers (SLBs) to study the structural effects of cholesterol and the ganglio-side receptor GM1 along the full membrane depth profile with nanoscale resolutionusing synchrotron reflectivity. Ganglioside GM1 resides in the outer cell membraneleaflet and is thought to partition into liquid-ordered phases and promote mem-brane condensation. We compare the structure of single-component SLBs withand without asymmetrically inserted GM1, mimicking the receptor orientation incell membranes. Using ternary lipid mixtures of cholesterol, brain sphingomyelinand 1,2-dioleoyl-sn-glycero-3-phosphocholine, we resolve the structural differencesbetween condensed and non-condensed SLBs in terms of acyl chain packing densityand thickness. We show that asymmetric incorporation of GM1 into these SLBshas a condensing effect on the leaflet in which it is present and reduces the lipiddiffusion within the SLB, as measured by continuous bleaching using fluorescencemicroscopy. These results show that X-ray reflectivity is an effective tool for re-solving separate condensation states in different membrane leaflets induced by thepresence of membrane receptors.

78 A. Publications
Condensation, stretching and asymmetry: GM1 andcholesterol in single supported lipid bilayers
Christian Reich∗,Department fur Physik, Ludwig-Maximilians-Universitat,
Munchen, Germany
Margaret R. Horton†
Department of Chemical Engineering, Massachusetts Institute of Technology,Cambridge, Massachusetts
Barbel Krause‡
European Synchrotron Radiation Facility,Grenoble, France
Alice P. GastDepartment of Chemical Engineering, Lehigh University,
Bethlehem, Pennsylvania
Joachim O. Radler and Bert NickelDepartment fur Physik, Ludwig-Maximilians-Universitat,
Munchen, Germany
May 17, 2007
∗Corresponding author. Full address: Department fur Physik, Ludwig-Maximilians-Universitat,Geschwister-Scholl-Platz 1, D-80539 Munchen, Germany, Tel.: (+49) 89 2180-1453, Fax: (+49) 89 2180-1452, E-mail: [email protected]
†Present address: Department fur Physik, Ludwig-Maximilians-Universitat‡Present address: Carl Zeiss AG, Oberkochen, Germany

Abstract
The membrane of living cells comprises numerous protein and lipid molecules capable of liquid-liquid phase separation and asymmetric organization between leaflets, resulting in structural het-erogeneity. We model cell membranes using supported lipid bilayers (SLBs) to study the struc-tural effects of cholesterol and the ganglioside receptor GM1 along the full membrane depth profilewith nanoscale resolution using synchrotron reflectivity. Ganglioside GM1 resides in the outer cellmembrane leaflet and is thought to partition into liquid-ordered phases and promote membranecondensation. We compare the structure of single-component SLBs with and without asymmet-rically inserted GM1, mimicking the receptor orientation in cell membranes. Using ternary lipidmixtures of cholesterol, brain sphingomyelin and 1,2-dioleoyl-sn-glycero-3-phosphocholine, weresolve the structural differences between condensed and non-condensed SLBs in terms of acylchain packing density and thickness. We show that asymmetric incorporation of GM1 into theseSLBs has a condensing effect on the leaflet in which it is present and reduces the lipid diffusionwithin the SLB, as measured by continuous bleaching using fluorescence microscopy. These re-sults show that X-ray reflectivity is an effective tool for resolving separate condensation states indifferent membrane leaflets induced by the presence of membrane receptors.
Key words: X-ray reflectivity; solid-liquid interface; lipid rafts; fluorescence microscopy; lipiddiffusion.
Condensation in supported lipid bilayers 2
IntroductionCell membranes are highly heterogeneous structures with numerous lipid and protein species. Thisheterogeneity is reflected in asymmetric lipid compositions in the inner and outer leaflets of theplasma membrane. Within mammalian membrane leaflets, the degree of saturation and the lengthof the lipid acyl chains vary among molecules and can locally affect the membrane thickness andinduce lateral heterogeneity (1). The major constituents of the outer membrane leaflet of mam-malian cells (phospholipids, sphingomyelin and cholesterol) are capable of phase separation dueto attractive interactions between cholesterol and sphingomyelin (2–4). Cholesterol preferentiallylocalizes to the vicinity of sphingomyelin due to hydrogen bonding between the hydroxyl group ofthe sphingosine backbone and the polar moiety of the sterol (5, 6). The relatively rigid structureof cholesterol and its ability to fit into the interstitial space between the saturated acyl chains ofsphingomyelin tighten lipid packing and result in a cholesterol-enriched liquid-ordered phase (Lo)(6), in coexistence with a cholesterol-depleted liquid-disordered phase (Ld) which contains mainlyunsaturated phospholipids. Lo domains, commonly referred to as lipid rafts (2), are thought to playa role in membrane organization by concentrating different receptor molecules into certain lipidenvironments (7).The monosialoganglioside GM1 is the receptor for cholera toxin entering the cell through the endo-cytic pathway and has been shown to localize to raft domains in the outer membrane leaflet (8). Theasymmetric localization of receptors within Lo or Ld phases is governed by intermolecular interac-tions within the membrane. The particular preference of GM1 to partition into the ordered Lo phaseis likely due to its saturated acyl chains, although specific interactions of its large oligosaccharideheadgroup with nearby sphingomyelin and phosphocholine headgroups may also play a role (7).The leaflet asymmetry of GM1 may also induce an asymmetric distribution of cholesterol, whoseexact transbilayer distribution is not known (6). Molecular-level structural methods are necessaryto measure leaflet asymmetry and to precisely determine how cholesterol and receptor moleculesmodify the lipid bilayer structure.The complex structure of cell membranes often inhibits discrete experimental studies of lipid-lipid interactions. Successful efforts to systematically study intermolecular interactions have beenmade using simplified biomimetic membranes, which can be engineered with multiple componentsand lipid asymmetry among the leaflets, mimicking the structure and function of cell membranes.A special class of biomimetic membranes are solid supported lipid bilayers (SLBs) which haveproven particularly useful for the application of surface sensitive techiques, such as atomic forcemicroscopy (AFM) (9), X-ray and neutron diffraction (10) and methods based on fluorescencemicroscopy (11–13). Experimental evidence for condensation of Lo domains in SLBs has beenobtained using AFM, where a relative increase in the height of the Lo phase of 8 A with respect tothe surrounding Ld phase (14, 15) has been reported. In SLBs containing model lipid raft domainsand symmetrically distributed GM1, a height difference of 20 A between GM1-enriched domains andthe surrounding bilayer has been reported (16). However, these AFM studies do not permit conclu-sions about the absolute thicknesses and densities of the SLBs and it remains unclear whether theobserved height differences originate from a stretching effect of the extended GM1 headgroups orfrom local condensation within the membrane. A method of determining whether certain receptorsprefer condensed lipid environments is to use fluorescence microscopy to assess the partitioningbehavior of their labeled conjugates into microscopic Lo/Ld phases (17–19) or through detectionof changes in the emission spectra of the dye depending on its localization in either the Lo or
Condensation in supported lipid bilayers 3
Ld phase (20, 21). In such experiments, however, it is not easily possible to distinguish whetherthe fluorescence intensity of the labeled conjugate was emitted from the inner or outer membraneleaflet.Another common technique to indirectly study the structure of lipid bilayers is to assess the lateralmotion of the dye molecules in a SLB using fluorescence recovery after photobleaching (FRAP)(12), continuous bleaching (22) or fluorescence correlation spectroscopy (FCS). With these mea-surements, lipid diffusion in the bilayer is quantified, providing information about the bilayer flu-idity and whether the SLB is in a condensed or fluid state. Recent FCS studies in model lipid raftSLBs on mica show that lipid diffusion is more than tenfold slower in Lo domains compared to Ld
domains (14), suggesting that lipid rafts are condensed entities (3). Membrane receptors have alsobeen shown to influence lipid mobility: FRAP studies on SLBs with GM1 symmetrically distributedamong the leaflets demonstrate that GM1 decreases the mobility of surrounding lipids (23), partic-ularly if the surrounding lipids are near a gel phase transition (24). Possible mechanisms of lipidfluidity moderation by GM1 are lateral condensation of lipid molecules (25) or local lipid immo-bilization due to a disruption of lipid headgroup packing, as reported for lipid monolayer systems(26). Such lateral structures within the membrane may act as obstacles and hinder the diffusionof lipids (27, 28). A direct method to examine lipid bilayer structure is X-ray surface diffraction;in principle, the sensitivity of X-rays to the electron density distribution within SLBs should al-low distinction between the different condensation states of a lipid bilayer. X-ray reflectivity atsolid-liquid interfaces has been used to study the structure of SLBs with subnanometer resolution(29–31) and there has been progress towards understanding single bilayer heterogeneity using thistechnique (32). Highly brilliant X-rays, provided by modern synchrotron sources, can give accessto detailed depth profiles of lipid bilayers with an accuracy of several Angstrøm, allowing for anidentification of distinct components in separate lipid leaflets.In this work, we directly measure how the receptor GM1 and model lipid rafts impact the struc-ture of model lipid bilayers. We characterize single SLBs at the solid-liquid interface with X-rayreflectivity using a microfluidic sample chamber described in previous work (29, 30, 33). First, aone-component SLB in the fluid phase is characterized and lipid packing modifications after asym-metric insertion of GM1 are analyzed. Then, the structural characteristics of single phase SLBsrepresenting either condensed or non-condensed bilayers are identified; we estimate the lipid com-positions based on the corresponding 100% Lo and 100% Ld phases in the phase diagram of giantunilamellar vesicles of ternary mixtures of cholesterol/sphingomyelin/1,2-dioleoyl-sn-glycero-3-phosphocholine (34, 35). Finally, a series of SLBs from ternary mixtures capable of liquid-liquidphase separation are investigated and the structural modifications of these SLBs upon asymmetricGM1 insertion are analyzed in terms of condensation and stretching. These structural X-ray studiesare complemented by fluorescence microscopy and continuous bleaching on the same samples. Wealso investigate lipid dynamics by measuring lipid diffusion before and after incorporation of GM1
into the bilayers.
Condensation in supported lipid bilayers 4
Materials and Methods
ChemicalsThe lipids 1-stearoyl-2-oleoyl-sn-glycero-3-phosphocholine (SOPC), 1,2-dioleoyl-sn-glycero-3-phosphocholine (DOPC), brain sphingomyelin (bSM), cholesterol and the ovine brain gangliosideGM1 are purchased from Avanti Polar Lipids (Alabaster, AL). Cholera toxin subunit B, labeledwith Alexa Fluor 488 (Alexa488-CTB), and Texas Red labeled 1,2-dihexadecanoyl-sn-glycero-3-phosphoethanolamine, triethylammonium salt (TR-DPPE) are purchased from Invitrogen (Karl-sruhe, Germany). HPLC-grade chloroform, acetone, isopropanol and ethanol are obtained fromCarl Roth (Karlsruhe, Germany). Reagent-grade NH4OH, HCl (37%) and H2O2 are purchasedfrom Sigma (St. Louis, MO). NaCl, CaCl2, MgCl2, phosphate buffered saline (PBS) and HEPESare also from Sigma. Buffer I is composed of 10 mM HEPES, 100 mM NaCl, 2 mM CaCl2, 2 mMMgCl2 at pH= 7.4 and buffer II is composed of 138 mM NaCl, 2.7 mM KCl, 10 mM Na2HPO4,2 mM KH2PO4 at pH= 7.4 (0.01 M PBS). Buffers are prepared in de-ionized (DI) water fromMillipore Corp. (Billerica, MA).
Substrate treatmentPolished 6” silicon wafers with a 100 nm thermal oxide layer are cut into small pieces of size20 × 15 mm2 (Crystec GmbH, Berlin, Germany). Before experiments, the substrates are cleanedby sonication in isopropanol for 10 min followed by rinsing with DI water. Afterwards, a three-stage chemical cleaning treatment is applied: first, the substrates are boiled in acetone for 10 min,then in 1/1/5 H2O2/HCl/H2O by volume for 15 min at 150C, then in 1/1/5 H2O2/NH4OH/H2O foranother 15 min at 150C. After each step, the substrates are rinsed thoroughly with DI water. Thesubstrates are stored in DI water until further use.
Sample chamber assemblyPlastic sample chambers (µ-Slide I) are purchased from ibidi GmbH (Munchen, Germany) and aremodified to embed the silicon wafer pieces (30). The clean SiO2 substrates are affixed to the baseof the chamber. The substrates are dried with a nitrogen stream and immediately glued into thechambers using two-component epoxy glue that hardens in 5 min (UHU, Buhl, Germany). Afterallowing the epoxy glue to dry for 30 min, the chambers with glued-in substrates are placed undervacuum for 6 h for final hardening. The microfluidic channel inside the sample chamber is thenfilled with buffer I.
Preparation of large unilamellar vesiclesAll lipid mixtures are prepared in HPLC-grade chloroform in clean glass vials, except for TR-DPPE, which is prepared in a 1:1 mixture by volume of chloroform and methanol. The chloroformis first evaporated from each vial in a nitrogen stream followed by 8 h evacuation in a vacuumchamber to completely remove the solvent. The dry lipid film in the vials is suspended in bufferI at a final concentration of 1 mg/mL and heated to 50C for 1 h. The extrusion method (36) is
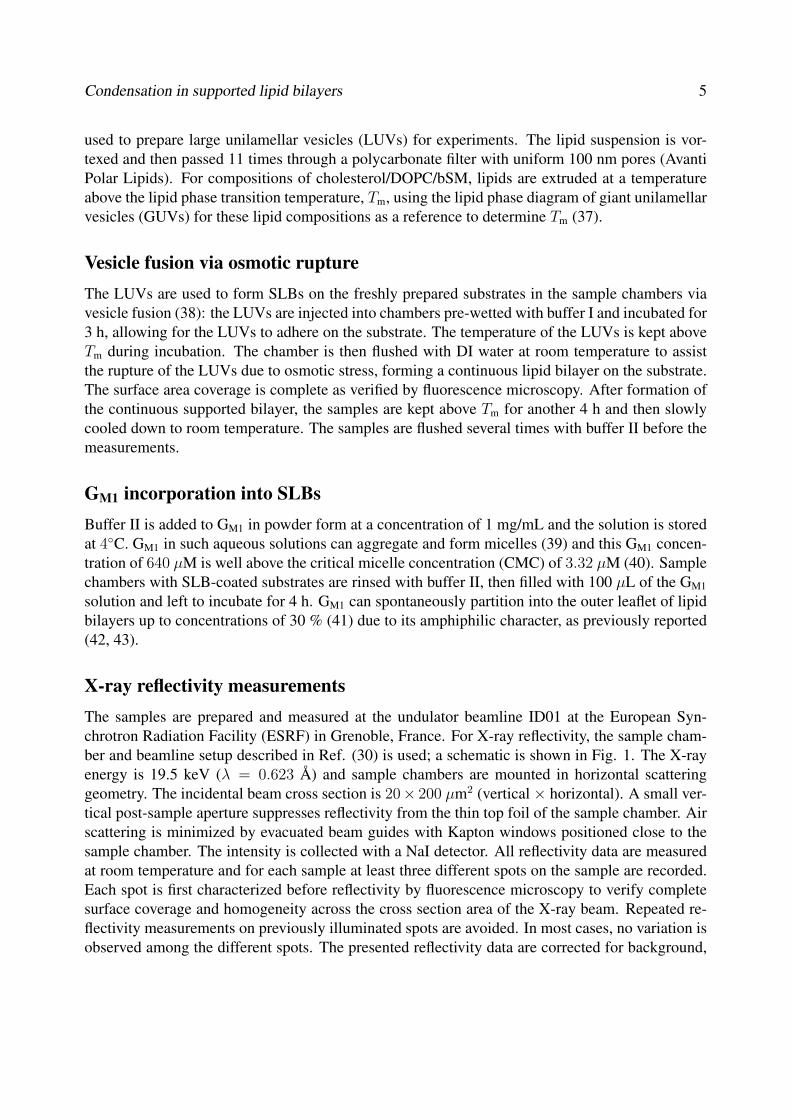
Condensation in supported lipid bilayers 5
used to prepare large unilamellar vesicles (LUVs) for experiments. The lipid suspension is vor-texed and then passed 11 times through a polycarbonate filter with uniform 100 nm pores (AvantiPolar Lipids). For compositions of cholesterol/DOPC/bSM, lipids are extruded at a temperatureabove the lipid phase transition temperature, Tm, using the lipid phase diagram of giant unilamellarvesicles (GUVs) for these lipid compositions as a reference to determine Tm (37).
Vesicle fusion via osmotic ruptureThe LUVs are used to form SLBs on the freshly prepared substrates in the sample chambers viavesicle fusion (38): the LUVs are injected into chambers pre-wetted with buffer I and incubated for3 h, allowing for the LUVs to adhere on the substrate. The temperature of the LUVs is kept aboveTm during incubation. The chamber is then flushed with DI water at room temperature to assistthe rupture of the LUVs due to osmotic stress, forming a continuous lipid bilayer on the substrate.The surface area coverage is complete as verified by fluorescence microscopy. After formation ofthe continuous supported bilayer, the samples are kept above Tm for another 4 h and then slowlycooled down to room temperature. The samples are flushed several times with buffer II before themeasurements.
GM1 incorporation into SLBsBuffer II is added to GM1 in powder form at a concentration of 1 mg/mL and the solution is storedat 4C. GM1 in such aqueous solutions can aggregate and form micelles (39) and this GM1 concen-tration of 640 µM is well above the critical micelle concentration (CMC) of 3.32 µM (40). Samplechambers with SLB-coated substrates are rinsed with buffer II, then filled with 100 µL of the GM1
solution and left to incubate for 4 h. GM1 can spontaneously partition into the outer leaflet of lipidbilayers up to concentrations of 30 % (41) due to its amphiphilic character, as previously reported(42, 43).
X-ray reflectivity measurementsThe samples are prepared and measured at the undulator beamline ID01 at the European Syn-chrotron Radiation Facility (ESRF) in Grenoble, France. For X-ray reflectivity, the sample cham-ber and beamline setup described in Ref. (30) is used; a schematic is shown in Fig. 1. The X-rayenergy is 19.5 keV (λ = 0.623 A) and sample chambers are mounted in horizontal scatteringgeometry. The incidental beam cross section is 20× 200 µm2 (vertical × horizontal). A small ver-tical post-sample aperture suppresses reflectivity from the thin top foil of the sample chamber. Airscattering is minimized by evacuated beam guides with Kapton windows positioned close to thesample chamber. The intensity is collected with a NaI detector. All reflectivity data are measuredat room temperature and for each sample at least three different spots on the sample are recorded.Each spot is first characterized before reflectivity by fluorescence microscopy to verify completesurface coverage and homogeneity across the cross section area of the X-ray beam. Repeated re-flectivity measurements on previously illuminated spots are avoided. In most cases, no variation isobserved among the different spots. The presented reflectivity data are corrected for background,
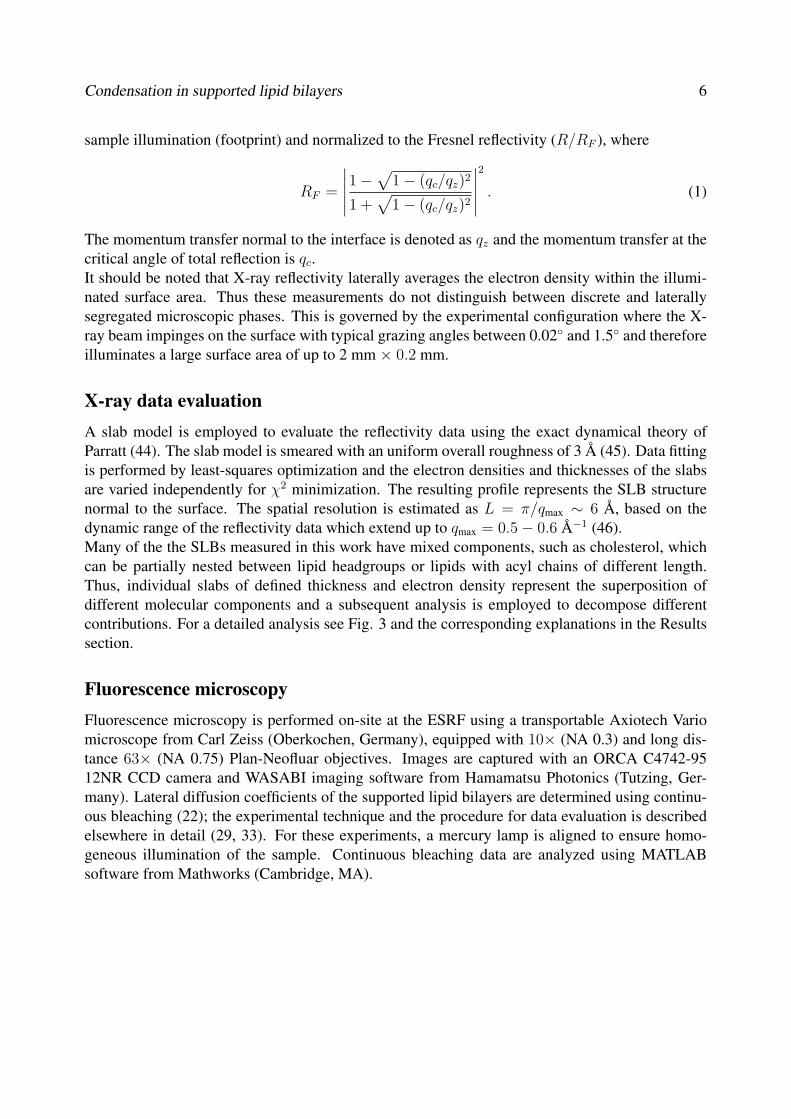
Condensation in supported lipid bilayers 6
sample illumination (footprint) and normalized to the Fresnel reflectivity (R/RF ), where
RF =
∣∣∣∣∣1 − √
1 − (qc/qz)2
1 +√
1 − (qc/qz)2
∣∣∣∣∣
2
. (1)
The momentum transfer normal to the interface is denoted as qz and the momentum transfer at thecritical angle of total reflection is qc.It should be noted that X-ray reflectivity laterally averages the electron density within the illumi-nated surface area. Thus these measurements do not distinguish between discrete and laterallysegregated microscopic phases. This is governed by the experimental configuration where the X-ray beam impinges on the surface with typical grazing angles between 0.02 and 1.5 and thereforeilluminates a large surface area of up to 2 mm × 0.2 mm.
X-ray data evaluationA slab model is employed to evaluate the reflectivity data using the exact dynamical theory ofParratt (44). The slab model is smeared with an uniform overall roughness of 3 A (45). Data fittingis performed by least-squares optimization and the electron densities and thicknesses of the slabsare varied independently for χ2 minimization. The resulting profile represents the SLB structurenormal to the surface. The spatial resolution is estimated as L = π/qmax ∼ 6 A, based on thedynamic range of the reflectivity data which extend up to qmax = 0.5 − 0.6 A−1 (46).Many of the the SLBs measured in this work have mixed components, such as cholesterol, whichcan be partially nested between lipid headgroups or lipids with acyl chains of different length.Thus, individual slabs of defined thickness and electron density represent the superposition ofdifferent molecular components and a subsequent analysis is employed to decompose differentcontributions. For a detailed analysis see Fig. 3 and the corresponding explanations in the Resultssection.
Fluorescence microscopyFluorescence microscopy is performed on-site at the ESRF using a transportable Axiotech Variomicroscope from Carl Zeiss (Oberkochen, Germany), equipped with 10× (NA 0.3) and long dis-tance 63× (NA 0.75) Plan-Neofluar objectives. Images are captured with an ORCA C4742-9512NR CCD camera and WASABI imaging software from Hamamatsu Photonics (Tutzing, Ger-many). Lateral diffusion coefficients of the supported lipid bilayers are determined using continu-ous bleaching (22); the experimental technique and the procedure for data evaluation is describedelsewhere in detail (29, 33). For these experiments, a mercury lamp is aligned to ensure homo-geneous illumination of the sample. Continuous bleaching data are analyzed using MATLABsoftware from Mathworks (Cambridge, MA).

Condensation in supported lipid bilayers 7
Results and Discussion
Structural impact of GM1 insertion into single component SLBsThe simplest model for the cell membrane is a single lipid bilayer of only one lipid component. Thefluid SOPC bilayer (Tm = 6C) provides a well-defined interface for understanding the structuralinfluence of GM1 on lipid bilayers. Fig. 2a shows the reflectivity of a lipid bilayer of 99.5 mol %SOPC and the fluorescent probe 0.5 mol % TR-DPPE; the data curve is characteristic for a singlelipid bilayer above a solid support (30, 31). After incubation for 4 h with excess GM1, we againmeasure the reflectivity and small but significant changes in the reflectivity are apparent as seen inthe normalized scan presented in Fig. 2b. The most prominent effect of GM1 incorporation into themembrane is a downward shift in the positions of the minima, from qz ∼ 0.2 to 0.18 A−1 and from0.34 to 0.3 A−1, qualitatively indicating a thickening of the bilayer.We use the slab model to analyze the reflectivity. In our model for the SOPC bilayer withoutGM1, each leaflet has 2 slabs representing the headgroups and 1 slab for the acyl chains and theregion where the proximal and distal acyl chains meet is an additional slab; thus the whole bilayercomprises 7 slabs. To fit the SOPC layer after GM1 insertion, we add 1 slab to the distal head-groups to account for the large oligosaccharide headgroup of GM1 and use an 8 slab model. Theelectron density profiles extracted from fitting the slab model are presented as red curves in Fig.3, a and b. The individual slabs are indicated by dashed lines. The green curves represent thesubsequent decomposition of the profiles into sigmoidal error functions with a Gaussian rough-ness of 3 A. Slabs of thickness > 6 A are directly converted into symmetric Gaussians, whereasneighboring slabs < 6 A are pooled together and represented as asymmetric sigmoidal functions.This parametrization indicates the location of the headgroup region, the acyl chains, and the regionwhere the proximal and distal acyl chains meet. The parameters for the SOPC and SOPC/GM1
bilayers as determined following this procedure are listed in Table 1.It is well established that water can penetrate into the lipid headgroups (47), which may complicatean exact definition of bilayer thickness based on X-ray data. However, we estimate this value fromthe sigmoidal peak corresponding to the distal headgroup, where we define the half-maximum po-sition at the outermost slope as bilayer thickness, as shown in Fig. 3. Using this analysis, theSOPC bilayer has an overall thickness of 48 A and appears highly symmetric. The thicknesses ofthe proximal and distal leaflets (headgroups and acyl chains) are 23 A and 25 A, respectively, andboth headgroups are 10 A. Upon insertion of GM1, however, the bilayer structure becomes asym-metric and is significantly thickened (59 A). The thickening effect is marginal in the proximalleaflet (26 A), whereas the effect is primarily in the distal leaflet (33 A). This increase in thicknessof the distal leaflet originates mainly from the headgroup region, where a significant increase inelectron density is observed upon GM1 insertion.By comparing the thicknesses of the distal leaflet before (25 A) and after (33 A) GM1 insertion, wefind that the GM1 headgroup protrudes a distance of 8 A above the bilayer surface. Protrusion ofthe GM1 above the bilayer has been observed previously both with AFM (25) and X-ray diffraction(48), where it was shown that GM1 protrudes up to 12 A above the surface of membranes in os-motically stretched stacked multibilayers. In the latter work, a full extension of the GM1 headgroupfrom the bilayer is reported, based on a comparison of the relative dimensions of GM1 and phos-phatidylcholine headgroups. Assuming that GM1 headgroups in their fully extended conformationnormal to the bilayer surface are 12 A in height (48), our protrusion length of 8 A (with experi-
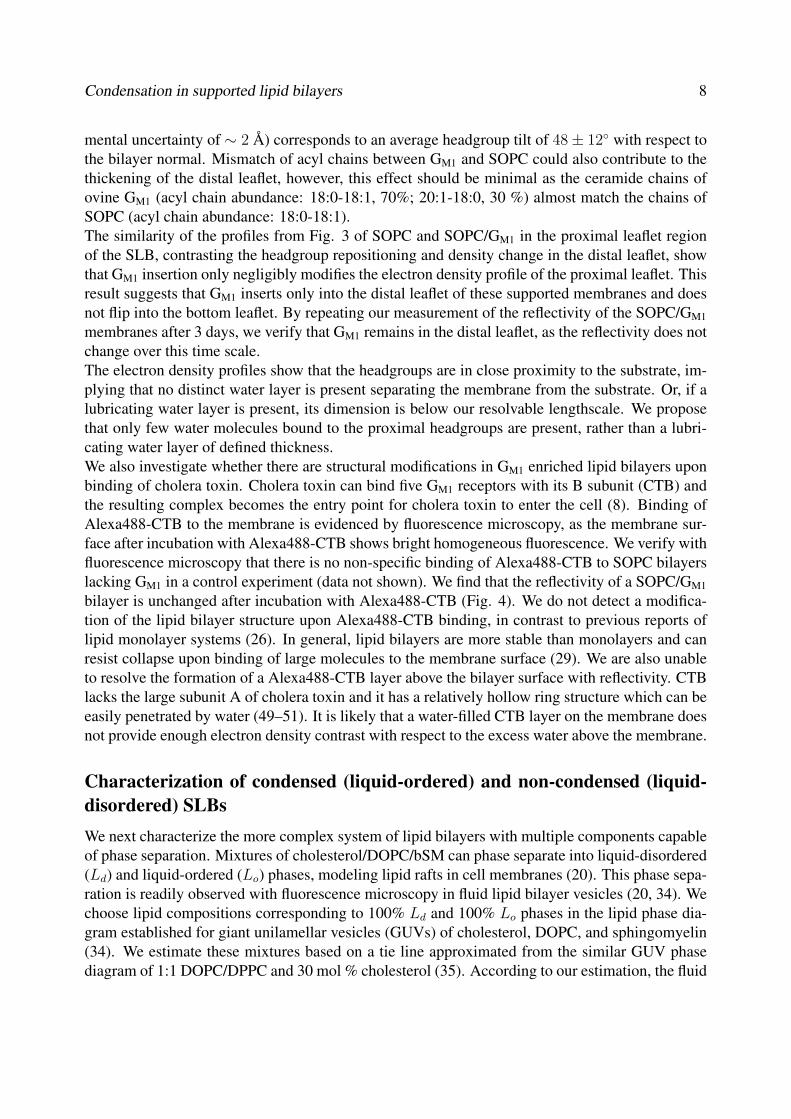
Condensation in supported lipid bilayers 8
mental uncertainty of ∼ 2 A) corresponds to an average headgroup tilt of 48 ± 12 with respect tothe bilayer normal. Mismatch of acyl chains between GM1 and SOPC could also contribute to thethickening of the distal leaflet, however, this effect should be minimal as the ceramide chains ofovine GM1 (acyl chain abundance: 18:0-18:1, 70%; 20:1-18:0, 30 %) almost match the chains ofSOPC (acyl chain abundance: 18:0-18:1).The similarity of the profiles from Fig. 3 of SOPC and SOPC/GM1 in the proximal leaflet regionof the SLB, contrasting the headgroup repositioning and density change in the distal leaflet, showthat GM1 insertion only negligibly modifies the electron density profile of the proximal leaflet. Thisresult suggests that GM1 inserts only into the distal leaflet of these supported membranes and doesnot flip into the bottom leaflet. By repeating our measurement of the reflectivity of the SOPC/GM1
membranes after 3 days, we verify that GM1 remains in the distal leaflet, as the reflectivity does notchange over this time scale.The electron density profiles show that the headgroups are in close proximity to the substrate, im-plying that no distinct water layer is present separating the membrane from the substrate. Or, if alubricating water layer is present, its dimension is below our resolvable lengthscale. We proposethat only few water molecules bound to the proximal headgroups are present, rather than a lubri-cating water layer of defined thickness.We also investigate whether there are structural modifications in GM1 enriched lipid bilayers uponbinding of cholera toxin. Cholera toxin can bind five GM1 receptors with its B subunit (CTB) andthe resulting complex becomes the entry point for cholera toxin to enter the cell (8). Binding ofAlexa488-CTB to the membrane is evidenced by fluorescence microscopy, as the membrane sur-face after incubation with Alexa488-CTB shows bright homogeneous fluorescence. We verify withfluorescence microscopy that there is no non-specific binding of Alexa488-CTB to SOPC bilayerslacking GM1 in a control experiment (data not shown). We find that the reflectivity of a SOPC/GM1
bilayer is unchanged after incubation with Alexa488-CTB (Fig. 4). We do not detect a modifica-tion of the lipid bilayer structure upon Alexa488-CTB binding, in contrast to previous reports oflipid monolayer systems (26). In general, lipid bilayers are more stable than monolayers and canresist collapse upon binding of large molecules to the membrane surface (29). We are also unableto resolve the formation of a Alexa488-CTB layer above the bilayer surface with reflectivity. CTBlacks the large subunit A of cholera toxin and it has a relatively hollow ring structure which can beeasily penetrated by water (49–51). It is likely that a water-filled CTB layer on the membrane doesnot provide enough electron density contrast with respect to the excess water above the membrane.
Characterization of condensed (liquid-ordered) and non-condensed (liquid-disordered) SLBsWe next characterize the more complex system of lipid bilayers with multiple components capableof phase separation. Mixtures of cholesterol/DOPC/bSM can phase separate into liquid-disordered(Ld) and liquid-ordered (Lo) phases, modeling lipid rafts in cell membranes (20). This phase sepa-ration is readily observed with fluorescence microscopy in fluid lipid bilayer vesicles (20, 34). Wechoose lipid compositions corresponding to 100% Ld and 100% Lo phases in the lipid phase dia-gram established for giant unilamellar vesicles (GUVs) of cholesterol, DOPC, and sphingomyelin(34). We estimate these mixtures based on a tie line approximated from the similar GUV phasediagram of 1:1 DOPC/DPPC and 30 mol % cholesterol (35). According to our estimation, the fluid

Condensation in supported lipid bilayers 9
Ld phase has an approximate composition of 15/65/20 (cholesterol/DOPC/bSM) and the Lo phasehas an approximate composition of 29/6/65 (cholesterol/DOPC/bSM).To elucidate structural differences between the Ld and Lo phase, we prepare separate SLBs withcompositions of 15/65/19.5/0.5 (referred to as LD) and 29/6/64.5/0.5 (referred to as LO) mol %cholesterol/DOPC/bSM/TR-DPPE and measure them with reflectivity. The reflectivity data areshown in Fig. 5, the corresponding electron density profiles are plotted in Fig. 6, and the pa-rameters extracted from fitting the data are summarized in Table 2. We show that the electrondensity profile of LD is similar to the profile of a fluid SOPC bilayer (compare Fig. 3a and Fig.6a). In both of these SLBs, the acyl chain thicknesses in both leaflets are 14 A and the electrondensity in the chain region is 0.28 e−/A3. For the LO composition, the bilayer structure changessignificantly and exhibits condensation. The LO bilayer is 10 A thicker than the LD bilayer, asshown in Fig. 6b. Our measured height difference is consistent with AFM experiments, where arelative height difference between Lo and Ld phases of 8 A has been measured on SLBs of mo-lar composition 0.67:1:1 (cholesterol:DOPC:SM) (14). For the LO bilayer, we measure a higherelectron density in the acyl chain regions of 0.33 e−/A3, as compared to 0.28 e−/A3 for the LDbilayer. In both cases, the distal headgroup regions appear broadened compared to the proximalheadgroup regions, indicating that the membrane surface facing the water is not as smooth as theopposite surface facing the substrate. Here, the advantage of using X-ray reflectivity for structuralcharacterization becomes clear because, in addition to height differences, we are able to resolvestructural details along the full depth of the membrane.Based on these results, we empirically define condensation of lipid bilayers in terms of the elec-tron density and thickness of the acyl chains. In this scheme, both an electron density of 0.28 ±0.01 e−/A3 and chain thickness of 14 ± 1 A are characteristic of a non-condensed bilayer leaflet,whereas an electron density of 0.33± 0.01 e−/A3 and chain thickness of 17± 1 A is representativeof a condensed bilayer leaflet. This condensation effect is reflected in the corresponding sketchesof the bilayer structure in Fig. 6, showing the LO bilayer as thickened with stretched and packedacyl chains as compared to the LD bilayer. The threshold values (non-condensed, condensed) forthe electron density are graphically indicated as gray lines in Fig. 6.We discuss the effect of cholesterol, which is present both in the LD and LO bilayers, by compar-ing the profiles of the LD bilayer (Fig. 6a) with the single component SOPC bilayer (Fig. 3a).In the LD bilayer, we find a higher electron density where the headgroups and acyl chains meetcompared to the SOPC bilayer. This increase of electron density is also apparent in the LO profile(Fig. 6b). We can explain this effect by an accumulation of cholesterol below the lipid headgroups,which effectively contributes to the electron rich headgroup region. This nesting effect of choles-terol below headgroups is consistent with mechanisms proposed in modeling studies. PreviousMonte Carlo simulations suggest that due to an unfavorable free energy of cholesterol in contactwith water, nonpolar cholesterol is located underneath polar lipid headgroups in bilayers (52). Itshould be noted that the variety of lipid constituents with different chain length in natural brainsphingomyelin may additionally contribute to the measured broadening of the headgroups.
Model lipid raft SLBs and the asymmetric condensing effect of GM1
After having separately characterized LD and LO bilayers, we now investigate SLBs with anequimolar lipid ratio of DOPC and bSM and varying amount of cholesterol. Three samples withSLBs of cholesterol/DOPC/bSM/TR-DPPE with molar percentages 20/40/39.5/0.5 (referred to as
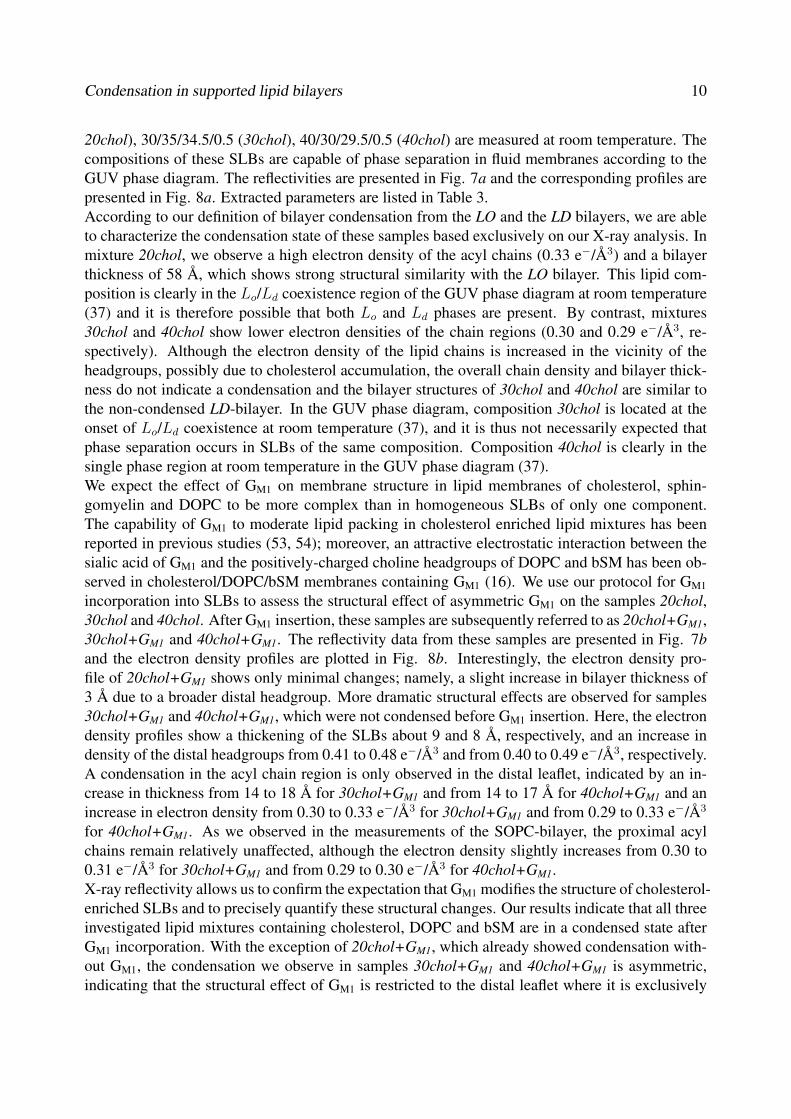
Condensation in supported lipid bilayers 10
20chol), 30/35/34.5/0.5 (30chol), 40/30/29.5/0.5 (40chol) are measured at room temperature. Thecompositions of these SLBs are capable of phase separation in fluid membranes according to theGUV phase diagram. The reflectivities are presented in Fig. 7a and the corresponding profiles arepresented in Fig. 8a. Extracted parameters are listed in Table 3.According to our definition of bilayer condensation from the LO and the LD bilayers, we are ableto characterize the condensation state of these samples based exclusively on our X-ray analysis. Inmixture 20chol, we observe a high electron density of the acyl chains (0.33 e−/A3) and a bilayerthickness of 58 A, which shows strong structural similarity with the LO bilayer. This lipid com-position is clearly in the Lo/Ld coexistence region of the GUV phase diagram at room temperature(37) and it is therefore possible that both Lo and Ld phases are present. By contrast, mixtures30chol and 40chol show lower electron densities of the chain regions (0.30 and 0.29 e−/A3, re-spectively). Although the electron density of the lipid chains is increased in the vicinity of theheadgroups, possibly due to cholesterol accumulation, the overall chain density and bilayer thick-ness do not indicate a condensation and the bilayer structures of 30chol and 40chol are similar tothe non-condensed LD-bilayer. In the GUV phase diagram, composition 30chol is located at theonset of Lo/Ld coexistence at room temperature (37), and it is thus not necessarily expected thatphase separation occurs in SLBs of the same composition. Composition 40chol is clearly in thesingle phase region at room temperature in the GUV phase diagram (37).We expect the effect of GM1 on membrane structure in lipid membranes of cholesterol, sphin-gomyelin and DOPC to be more complex than in homogeneous SLBs of only one component.The capability of GM1 to moderate lipid packing in cholesterol enriched lipid mixtures has beenreported in previous studies (53, 54); moreover, an attractive electrostatic interaction between thesialic acid of GM1 and the positively-charged choline headgroups of DOPC and bSM has been ob-served in cholesterol/DOPC/bSM membranes containing GM1 (16). We use our protocol for GM1
incorporation into SLBs to assess the structural effect of asymmetric GM1 on the samples 20chol,30chol and 40chol. After GM1 insertion, these samples are subsequently referred to as 20chol+GM1,30chol+GM1 and 40chol+GM1. The reflectivity data from these samples are presented in Fig. 7band the electron density profiles are plotted in Fig. 8b. Interestingly, the electron density pro-file of 20chol+GM1 shows only minimal changes; namely, a slight increase in bilayer thickness of3 A due to a broader distal headgroup. More dramatic structural effects are observed for samples30chol+GM1 and 40chol+GM1, which were not condensed before GM1 insertion. Here, the electrondensity profiles show a thickening of the SLBs about 9 and 8 A, respectively, and an increase indensity of the distal headgroups from 0.41 to 0.48 e−/A3 and from 0.40 to 0.49 e−/A3, respectively.A condensation in the acyl chain region is only observed in the distal leaflet, indicated by an in-crease in thickness from 14 to 18 A for 30chol+GM1 and from 14 to 17 A for 40chol+GM1 and anincrease in electron density from 0.30 to 0.33 e−/A3 for 30chol+GM1 and from 0.29 to 0.33 e−/A3
for 40chol+GM1. As we observed in the measurements of the SOPC-bilayer, the proximal acylchains remain relatively unaffected, although the electron density slightly increases from 0.30 to0.31 e−/A3 for 30chol+GM1 and from 0.29 to 0.30 e−/A3 for 40chol+GM1.X-ray reflectivity allows us to confirm the expectation that GM1 modifies the structure of cholesterol-enriched SLBs and to precisely quantify these structural changes. Our results indicate that all threeinvestigated lipid mixtures containing cholesterol, DOPC and bSM are in a condensed state afterGM1 incorporation. With the exception of 20chol+GM1, which already showed condensation with-out GM1, the condensation we observe in samples 30chol+GM1 and 40chol+GM1 is asymmetric,indicating that the structural effect of GM1 is restricted to the distal leaflet where it is exclusively
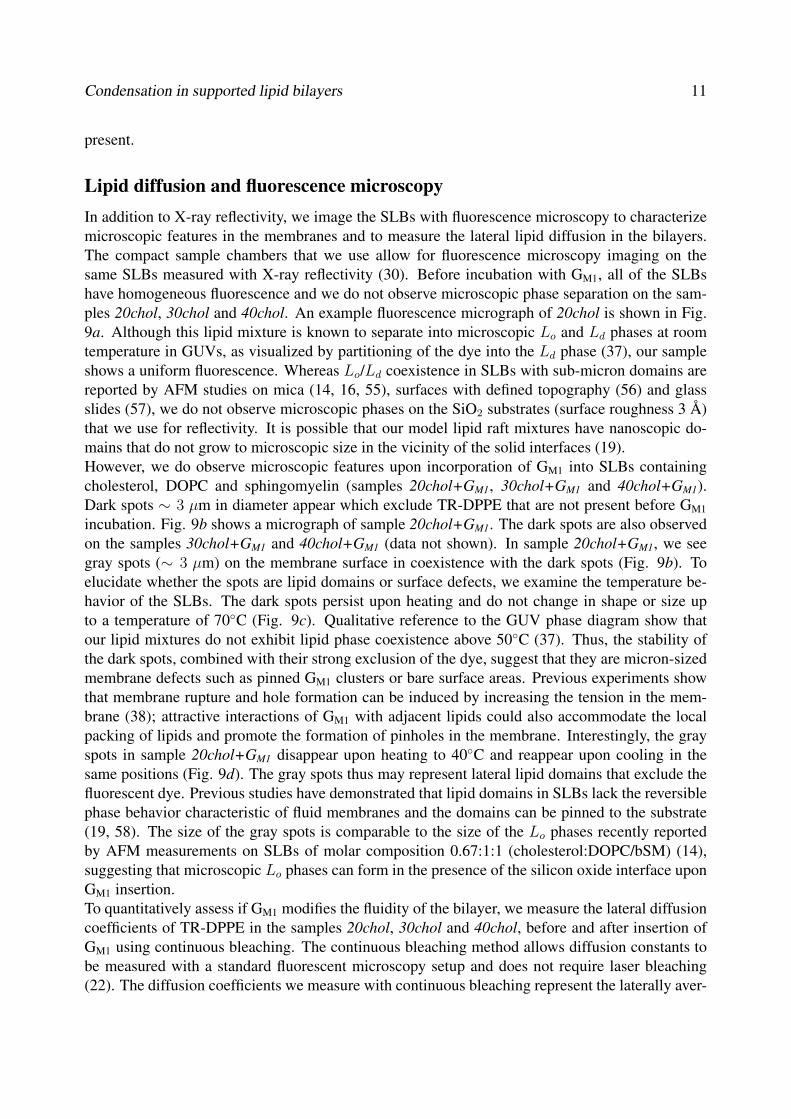
Condensation in supported lipid bilayers 11
present.
Lipid diffusion and fluorescence microscopyIn addition to X-ray reflectivity, we image the SLBs with fluorescence microscopy to characterizemicroscopic features in the membranes and to measure the lateral lipid diffusion in the bilayers.The compact sample chambers that we use allow for fluorescence microscopy imaging on thesame SLBs measured with X-ray reflectivity (30). Before incubation with GM1, all of the SLBshave homogeneous fluorescence and we do not observe microscopic phase separation on the sam-ples 20chol, 30chol and 40chol. An example fluorescence micrograph of 20chol is shown in Fig.9a. Although this lipid mixture is known to separate into microscopic Lo and Ld phases at roomtemperature in GUVs, as visualized by partitioning of the dye into the Ld phase (37), our sampleshows a uniform fluorescence. Whereas Lo/Ld coexistence in SLBs with sub-micron domains arereported by AFM studies on mica (14, 16, 55), surfaces with defined topography (56) and glassslides (57), we do not observe microscopic phases on the SiO2 substrates (surface roughness 3 A)that we use for reflectivity. It is possible that our model lipid raft mixtures have nanoscopic do-mains that do not grow to microscopic size in the vicinity of the solid interfaces (19).However, we do observe microscopic features upon incorporation of GM1 into SLBs containingcholesterol, DOPC and sphingomyelin (samples 20chol+GM1, 30chol+GM1 and 40chol+GM1).Dark spots ∼ 3 µm in diameter appear which exclude TR-DPPE that are not present before GM1
incubation. Fig. 9b shows a micrograph of sample 20chol+GM1. The dark spots are also observedon the samples 30chol+GM1 and 40chol+GM1 (data not shown). In sample 20chol+GM1, we seegray spots (∼ 3 µm) on the membrane surface in coexistence with the dark spots (Fig. 9b). Toelucidate whether the spots are lipid domains or surface defects, we examine the temperature be-havior of the SLBs. The dark spots persist upon heating and do not change in shape or size upto a temperature of 70C (Fig. 9c). Qualitative reference to the GUV phase diagram show thatour lipid mixtures do not exhibit lipid phase coexistence above 50C (37). Thus, the stability ofthe dark spots, combined with their strong exclusion of the dye, suggest that they are micron-sizedmembrane defects such as pinned GM1 clusters or bare surface areas. Previous experiments showthat membrane rupture and hole formation can be induced by increasing the tension in the mem-brane (38); attractive interactions of GM1 with adjacent lipids could also accommodate the localpacking of lipids and promote the formation of pinholes in the membrane. Interestingly, the grayspots in sample 20chol+GM1 disappear upon heating to 40C and reappear upon cooling in thesame positions (Fig. 9d). The gray spots thus may represent lateral lipid domains that exclude thefluorescent dye. Previous studies have demonstrated that lipid domains in SLBs lack the reversiblephase behavior characteristic of fluid membranes and the domains can be pinned to the substrate(19, 58). The size of the gray spots is comparable to the size of the Lo phases recently reportedby AFM measurements on SLBs of molar composition 0.67:1:1 (cholesterol:DOPC/bSM) (14),suggesting that microscopic Lo phases can form in the presence of the silicon oxide interface uponGM1 insertion.To quantitatively assess if GM1 modifies the fluidity of the bilayer, we measure the lateral diffusioncoefficients of TR-DPPE in the samples 20chol, 30chol and 40chol, before and after insertion ofGM1 using continuous bleaching. The continuous bleaching method allows diffusion constants tobe measured with a standard fluorescent microscopy setup and does not require laser bleaching(22). The diffusion coefficients we measure with continuous bleaching represent the laterally aver-

Condensation in supported lipid bilayers 12
aged lipid diffusion in a circular spot 180 µm diameter and it is therefore not possible to distinguishbetween separate diffusion coefficients in coexisting phases. Recent work using two-focus scan-ning fluorescence correlation spectroscopy reports separate diffusion constants of 3.5 ± 0.3 µm2/sfor the Ld phase and 0.1 ± 0.02 µm2/s for the Lo phase in a SLB with 0.67:1:1 molar composi-tion of cholesterol:DOPC:SM (14). We measure diffusion coefficients for samples 20chol, 30choland 40chol of (0.45 ± 0.03, 0.22 ± 0.01 and 0.12 ± 0.01) µm2/s, respectively. Our diffusion datashows the general trend that diffusion is reduced as the concentration of cholesterol is increased.Our coefficients are between the two values reported for the Ld and Lo phase and it is possiblethat they represent averaged values of coexisting phases. After these samples are incubated withexcess GM1, we measure diffusion constants of (0.10 ± 0.02, 0.09 ± 0.01 and 0.03 ± 0.01) µm2/sfor samples 20chol+GM1, 30chol+GM1 and 40chol+GM1, respectively. Thus, the addition of GM1
to the bilayer reduces the lipid fluidity by more than 50%. These results confirm that condensa-tion of SLBs is accompanied by a reduced lipid diffusion. The reduction in the mobility of singlecomponent membranes after the addition of GM1 is well-established (23, 24, 59). In heterogeneousmembranes, where GM1 can influence lipid phase separation (24, 53), lipid diffusion is more com-plicated. The condensing effect of GM1 can promote the formation of Lo domains and ordered lipiddomains can also reduce the fluidity of the surrounding lipid bilayer as a function of area coverageby creating obstacles for lipid movement (60).
ConclusionStructural studies of single SLBs with Angstrøm resolution allow the effect of individual moleculeson the condensation state of the SLB to be quantified. The incorporation of the membrane receptorGM1 into SLBs stretches the outer membrane leaflet and increases the lipid headgroup density,consistent with a structural effect of the GM1 headgroup protruding out from the membrane surface.We observe this effect in homogeneous SLBs of SOPC, where the asymmetry among both leafletsafter insertion of GM1 can be resolved. With X-ray reflectivity, we are clearly able to distinguishcondensed and fluid SLBs and determine how the individual regions of the SLB (headgroups, acylchains) are affected by condensation. Our measurements also suggest the position of cholesterolwithin the bilayer as the electron density is increased in the region where headgroups and acylchains meet, which is consistent with cholesterol nesting below the headgroups. Asymmetricinclusion of GM1 has a condensing effect on cholesterol-enriched membranes and this effect isrestricted to the leaflet where GM1 is present. The condensing effect of GM1 is also evidencedby a reduced lipid diffusion of cholesterol-enriched membranes and we observe microscopic lipiddomains introduced in the presence GM1. Understanding the organization of molecules withinbiological membranes requires techniques that probe the structure of individual leaflets. Such highresolution can be obtained with X-ray reflectivity at solid-liquid interfaces and this technique maybe applied to other complex membrane systems.
AcknowledgmentsWe acknowledge the European Synchrotron Radiation Facility for provision of synchrotron ra-diation facilities and we thank Till H. Metzger for assistance in using the beamline ID01 and

Condensation in supported lipid bilayers 13
Harald Muller for assistance in the chemistry laboratory. We are grateful to Martin Huth for helpwith the synchrotron measurements. We thank the Alexander von Humboldt Foundation and theMIT Germany Program for travel funds. This work was funded in part through the Robert T.Haslam Chair at MIT and the German Federal Ministry of Education and Research (BMBF grantno. 03RA6LMU).

Condensation in supported lipid bilayers 14
References1. Janmey, P., and P. Kinnunen, 2006. Biophysical properties of lipids and dynamic membranes.
Trends Cell Biol. 16:538–546.
2. Simons, K., and E. Ikonen, 1997. Functional rafts in cell membranes. Nature 387:569–572.
3. Brown, D. A., and E. London, 2000. Structure and Function of Sphingolipid- and Cholesterol-rich Membrane Rafts. J. Biol. Chem. 275:17221–17224.
4. Anderson, R. G. W., and K. Jacobson, 2002. A Role for Lipid Shells in Targeting Proteins toCaveolae, Rafts, and Other Lipid Domains. Science 296:1821–1825.
5. Simons, K., and E. Ikonen, 2000. How Cells Handle Cholesterol. Science 290:1721–1726.
6. Maxfield, F. R., and I. Tabas, 2005. Role of cholesterol and lipid organization in disease.Nature 438:612–621.
7. Sprong, H., P. van der Sluijs, and G. van Meer, 2001. How proteins move lipids and lipidsmove proteins. Nat. Rev. Mol. Cell Biol. 2:504–513.
8. Lencer, W. I., T. R. Hirst, and R. K. Holmes, 1999. Membrane traffic and the cellular uptakeof cholera toxin. Biochim. Biophys. Acta (BBA) - Molecular Cell Research 1450:177–190.
9. Richter, R., and A. Brisson, 2003. Characterization of Lipid Bilayers and Protein AssembliesSupported on Rough Surfaces by Atomic Force Microscopy. Langmuir 19:1632–1640.
10. Salditt, T., 2005. Thermal fluctuations and stability of solid-supported lipid membranes. J.Phys.: Condens. Matter 17:R287–R314.
11. Braun, D., and P. Fromherz, 1998. Fluorescence Interferometry of Neuronal Cell Adhesion onMicrostructured Silicon. Phys. Rev. Lett. 81:5241.
12. Axelrod, D., D. E. Koppel, J. Schlessinger, E. Elson, and W. W. Webb, 1976. MobilityMeasurement by Analysis of Fluorescence Photobleaching Recovery Kinetics. Biophys. J.16:1055.
13. Radler, J., and E. Sackmann, 1993. Imaging optical thicknesses and separation distances ofphospholipid vesicles at solid surfaces. J. Phys. II France 3:727–748.
14. Chiantia, S., J. Ries, N. Kahya, and P. Schwille, 2006. Combined AFM and Two-Focus SFCSStudy of Raft-Exhibiting Model Membranes. ChemPhysChem 7:2409–2418.
15. Chiantia, S., N. Kahya, J. Ries, and P. Schwille, 2006. Effects of Ceramide on Liquid-OrderedDomains Investigated by Simultaneous AFM and FCS. Biophys. J. 90:4500–4508.
16. Yuan, C., J. Furlong, P. Burgos, and L. J. Johnston, 2002. The Size of Lipid Rafts: An AtomicForce Microscopy Study of Ganglioside GM1 Domains in Sphingomyelin/DOPC/CholesterolMembranes. Biophys. J. 82:2526–2535.
Condensation in supported lipid bilayers 15
17. Samsonov, A. V., I. Mihalyov, and F. S. Cohen, 2001. Characterization of Cholesterol-Sphingomyelin Domains and Their Dynamics in Bilayer Membranes. Biophys. J. 81:1486–1500.
18. Crane, J., V. Kiessling, and L. Tamm, 2005. Measuring Lipid Asymmetry in Planar SupportedBilayers by Fluorescence Interference Contrast Microscopy. Langmuir 21:1377–1388.
19. Garg, S., J. Ruhe, K. Ludtke, R. Jordan, and C. A. Naumann, 2007. Domain Registration inRaft-Mimicking Lipid Mixtures Studied Using Polymer-Tethered Lipid Bilayers. Biophys. J.92:1263–1270.
20. Dietrich, C., L. A. Bagatolli, Z. N. Volovyk, N. L. Thompson, M. Levi, K. Jacobson, andE. Gratton, 2001. Lipid Rafts Reconstituted in Model Membranes. Biophys. J. 80:1417–1428.
21. Bagatolli, L. A., 2006. To see or not to see: Lateral organization of biological membranes andfluorescence microscopy. Biochim. Biophys. Acta (BBA) - Biomembranes 1758:1541–1556.
22. Dietrich, C., R. Merkel, and R. Tampe, 1997. Diffusion Measurement of Fluorescence-LabeledAmphiphilic Molecules with a Standard Fluorescence Microscope. Biophys. J. 72:1701–1710.
23. Weng, K. C., J. L. Kanter, W. H. Robinson, and C. W. Frank, 2006. Fluid supported lipidbilayers containing monosialoganglioside GM1: A QCM-D and FRAP study. Colloids Surf.B. Biointerfaces 50:76–84.
24. Yamazaki, V., O. Sirenko, R. Schafer, and J. Groves, 2005. Lipid Mobility and MolecularBinding in Fluid Lipid Membranes. J. Am. Chem. Soc. 127:2826–2827.
25. Yuan, C., and L. J. Johnston, 2001. Atomic Force Microscopy Studies of Ganglioside GM1Domains in Phosphatidylcholine and Phosphatidylcholine/Cholesterol Bilayers. Biophys. J.81:1059–1069.
26. Miller, C. E., J. Majewski, R. Faller, S. Satija, and T. L. Kuhl, 2004. Cholera Toxin Assault onLipid Monolayers Containing Ganglioside GM1. Biophys. J. 86:3700–3708.
27. Almeida, P. F. F., W. L. C. Vaz, and T. E. Thompson, 1992. Lateral Diffusion and Percolation inTwo-Phase, Two-Component Lipid Bilayers. Topology of the Solid-Phase Domains In-Planeand Across the Lipid Bilayer. Biochemistry 31:7198–7210.
28. Zhang, L., and S. Granick, 2005. Slaved diffusion in phospholipid bilayers. Proc. Natl. Acad.Sci. USA 102:9118–9121.
29. Horton, M. R., C. Reich, A. P. Gast, J. O. Radler, and B. Nickel, 2007. Structure and Dynamicsof Crystalline Protein Layers Bound to Supported Lipid Bilayers. Langmuir 23:6263–6269.
30. Reich, C., M. B. Hochrein, B. Krause, and B. Nickel, 2005. A microfluidic setup for studies ofsolid-liquid interfaces using x-ray reflectivity and fluorescence microscopy. Rev. Sci. Instrum.76:095103.
31. Miller, C. E., J. Majewski, T. Gog, and T. L. Kuhl, 2005. Characterization of Biological ThinFilms at the Solid-Liquid Interface by X-Ray Reflectivity. Phys. Rev. Lett. 94:238104.
Condensation in supported lipid bilayers 16
32. Novakova, E., K. Giewekemeyer, and T. Salditt, 2006. Structure of two-component lipidmembranes on solid support: An x-ray reflectivity study. Phys. Rev. E 74:051911.
33. Hochrein, M. B., C. Reich, B. Krause, J. O. Radler, and B. Nickel, 2006. Structure andMobility of Lipid Membranes on a Thermoplastic Substrate. Langmuir 22:538–545.
34. Veatch, S. L., and S. L. Keller, 2005. Miscibility phase diagrams of giant vesicles containingsphingomyelin. Phys. Rev. Lett. 94:148101.
35. Veatch, S. L., I. V. Polozov, K. Gawrisch, and S. L. Keller, 2004. Liquid Domains in VesiclesInvestigated by NMR and Fluorescence Microscopy. Biophys. J. 86:2910–2922.
36. MacDonald, R. C., R. I. MacDonald, B. P. M. Menco, K. Takeshita, N. K. Subbarao, andL. Hu, 1991. Small-volume extrusion apparatus for preparation of large, unilamellar vesicles.Biochim. Biophys. Acta (BBA) - Biomembranes 1061:297–303.
37. Horton, M. R., J. Radler, and A. P. Gast, 2006. Phase behavior and the partitioning of caveolin-1 scaffolding domain peptides in model lipid bilayers. J. Colloid Interface Sci. 304:67–76.
38. Tamm, L. K., and H. M. McConnell, 1985. Supported phospholipid bilayers. Biophys. J.47:105–113.
39. Cantu, L., M. Corti, E. Del Favero, E. Muller, A. Raudino, and S. Sonnino, 1999. Ther-mal Hysteresis in Ganglioside Micelles Investigated by Differential Scanning Calorimetry andLight-Scattering. Langmuir 15:4975–4980.
40. Basu, A., and R. H. Glew, 1985. Characterization of the activation of rat liver beta-glucosidaseby sialosylgangliotetraosylceramide. J. Biol. Chem. 260:13067–13073.
41. Bach, D., I. R. Miller, and B.-A. Sela, 1982. Calorimetric studies on various gangliosides andganglioside-lipid interactions. Biochim. Biophys. Acta (BBA) - Biomembranes 686:233–239.
42. Spiegel, S., J. Schlessinger, and P. H. Fishman, 1984. Incorporation of fluorescent gangliosidesinto human fibroblasts: mobility, fate, and interaction with fibronectin. J. Cell Biol. 99:699–704.
43. Wang, R., J. Shi, A. N. Parikh, A. P. Shreve, L. Chen, and B. I. Swanson, 2004. Evidence forcholera aggregation on GM1-decorated lipid bilayers. Colloids Surf. B. Biointerfaces 33:45–51.
44. Parratt, L. G., 1954. Surface Studies of Solids by Total Reflection of X-rays. Phys. Rev.95:359.
45. Nevot, L., and P. Croce, 1980. Characterization of surfaces by grazing x-ray reflection - Ap-plication to study of polishing of some silicate-glasses. Revue de physique appliquee 15:761.
46. Pershan, P. S., 1994. X-ray or neutron reflectivity: Limitations in the determination of interfa-cial profiles. Phys. Rev. E 50:2369–2372.
Condensation in supported lipid bilayers 17
47. Wiener, M. C., G. I. King, and S. H. White, 1991. Structure of a fluid dioleoylphosphatidyl-choline bilayer determined by joint refinement of x-ray and neutron diffraction data. I. Scalingof neutron data and the distributions of double bonds and water. Biophys. J. 60:568–576.
48. McIntosh, T. J., and S. A. Simon, 1994. Long- and Short-Range Interactions between Phos-pholipid/Ganglioside GM1 Bilayers. Biochemistry 33:10477–10486.
49. Zhang, R.-G., M. L. Westbrook, E. M. Westbrook, D. L. Scott, Z. Otwinowski, P. R. Maulik,R. A. Reed, and G. G. Shipley, 1995. The 2.4 A Crystal Structure of Cholera Toxin B SubunitPentamer: Choleragenoid. J. Mol. Biol. 251:550–562.
50. Merritt, E. A., S. Sarfaty, F. V. D. Akker, C. L’Hoir, J. A. Martial, and W. G. Hol, 1994. Crystalstructure of cholera toxin B-pentamer bound to receptor G(M1) pentasaccharide. Protein Sci.3:166–175.
51. Ribi, H. O., D. S. Ludwig, K. L. Mercer, G. K. Schoolnik, and R. D. Kornberg, 1988. Three-dimensional structure of cholera toxin penetrating a lipid membrane. Science 239:1272–1276.
52. Huang, J., and G. W. Feigenson, 1999. A Microscopic Interaction Model of Maximum Solu-bility of Cholesterol in Lipid Bilayers. Biophys. J. 76:2142–2157.
53. Hammond, A. T., F. A. Heberle, T. Baumgart, D. Holowka, B. Baird, and G. W. Feigenson,2005. Crosslinking a lipid raft component triggers liquid ordered-liquid disordered phaseseparation in model plasma membranes. Proc. Natl. Acad. Sci. USA 102:6320–6325.
54. Dietrich, C., Z. N. Volovyk, M. Levi, N. L. Thompson, and K. Jacobson, 2001. Partitioning ofThy-1, GM1, and cross-linked phospholipid analogs into lipid rafts reconstituted in supportedmodel membrane monolayers. Proc. Natl. Acad. Sci. USA 98:10642–10647.
55. Lawrence, J. C., D. E. Saslowsky, J. M. Edwardson, and R. M. Henderson, 2003. Real-Time Analysis of the Effects of Cholesterol on Lipid Raft Behavior Using Atomic Force Mi-croscopy. Biophys. J. 84:1827–1832.
56. Yoon, T.-Y., C. Jeong, S.-W. Lee, J. H. Kim, M. C. Choi, S.-J. Kim, M. W. Kim, and S.-D. Lee,2006. Topographic control of lipid-raft reconstitution in model membranes. Nature Materials5:281–285.
57. Seu, K. J., A. P. Pandey, F. Haque, E. A. Proctor, A. E. Ribbe, and J. S. Hovis, 2007. Effect ofSurface Treatment on Diffusion and Domain Formation in Supported Lipid Bilayers. Biophys.J. 92:2445–2450.
58. Stottrup, B. L., S. L. Veatch, and S. L. Keller, 2004. Nonequilibrium Behavior in SupportedLipid Membranes Containing Cholesterol. Biophys. J. 86:2942–2950.
59. Goins, B., M. Masserini, B. G. Barisas, and E. Freire, 1986. Lateral diffusion of gangliosideGM1 in phospholipid bilayer membranes. Biophys. J. 49:849856.
60. Ratto, T. V., and M. L. Longo, 2002. Obstructed Diffusion in Phase-Separated SupportedLipid Bilayers: A Combined Atomic Force Microscopy and Fluorescence Recovery after Pho-tobleaching Approach. Biophys. J. 83:3380–3392.

Condensation in supported lipid bilayers 18
Sample thickness thickness thickness thickness thickness prox./dist. peak densityof the proximal proximal distal distal chain of distalbilayer headgroup acyl chains acyl chains headgroup density headgroup
[A] [A] [A] [A] [A] [e−/A3] [e−/A3]SOPC 48 10 13 15 10 0.28/0.28 0.46SOPC/GM1 59 10 16 15 18 0.28/0.28 0.50
Table 1: Parameters extracted from analysis of the X-ray reflectivity data of SOPC and SOPC/GM1
SLBs.
Sample thickness thickness thickness thickness thickness prox./dist. peak densityof the proximal proximal distal distal chain of distalbilayer headgroup acyl chains acyl chains headgroup density headgroup
[A] [A] [A] [A] [A] [e−/A3] [e−/A3]LD 54 11 14 14 15 0.28/0.28 0.44LO 64 13 18 18 15 0.33/0.33 0.48
Table 2: Parameters extracted from analysis of the X-ray reflectivity data of the samples LD andLO.
Sample thickness thickness thickness thickness thickness prox./dist. peak densityof the proximal proximal distal distal chain of distalbilayer headgroup acyl chains acyl chains headgroup density headgroup
[A] [A] [A] [A] [A] [e−/A3] [e−/A3]20chol 58 12 17 16 13 0.33/0.33 0.4320chol+GM1 61 12 16 16 17 0.33/0.33 0.4330chol 56 12 13 14 17 0.30/0.30 0.4130chol+GM1 65 11 15 18 21 0.31/0.33 0.4840chol 56 12 14 14 16 0.29/0.29 0.4040chol+GM1 64 11 14 17 22 0.30/0.33 0.49
Table 3: Parameters extracted from analysis of the X-ray reflectivity data of model lipid raft SLBs.
Condensation in supported lipid bilayers 19
Figure LegendsFigure 1.
Schematic of the microfluidic sample chamber used for X-ray and fluorescence microscopy exper-iments.
Figure 2.
Normalized reflectivity scans with fits (solid lines) for SOPC before (a) and after (b) incubationwith excess GM1. Sketches illustrate the bilayer structure and asymmetric incorporation of GM1
into the distal leaflet.
Figure 3.
Decomposition of the electron density profiles (red curves) to determine the thicknesses of differentbilayer regions. The slab model used for fitting the data is shown as a dotted line. The lipidheadgroup region, alkyl chains and the space where the acyl chains meet are parameterized usingsigmoidal functions (green curves). The excess water (or buffer) on top of the SLBs is indicatedin blue. We define thickness as the Gaussian FWHM around the center of mass of the sigmoidalpeaks. The thickness of each leaflet is separately indicated. The overall thickening of the SLB dueto GM1 incorporation is 11 A. By separate comparison of the thicknesses of the distal leaflets onlybefore (∼ 25 A) and after (∼ 33 A) GM1 incorporation, we find that GM1 extends ∼ 8 A from themembrane surface.
Figure 4.
No measurable changes in the reflectivity of SOPC/GM1 SLBs before (top) and after (bottom)incubation of CTB. The lines connecting the data points are drawn for clarity of presentation anddo not represent a fit to the data.
Figure 5.
Normalized X-ray reflectivity of SLBs with compositions of 15/65/20 mol % (LD) and 29/6/65mol % (LO) cholesterol/DOPC/bSM. Solid lines represent fits to the data.
Figure 6.
Electron density profiles of samples (a) LD and (b) LO. The sketches represent the molar composi-tions of cholesterol (gray), DOPC (red) and bSM (green) in the LD and LO bilayers and illustratethe differences in bilayer condensation and thickness. The gray lines represent the average electrondensity of the acyl chains, 0.28 e−/A3 for the LD bilayer (solid line) and 0.33 e−/A3 for the LObilayer (dotted line). These values define thresholds for the state of the SLB (non-condensed andcondensed, respectively), according to the empirical definition in the text.
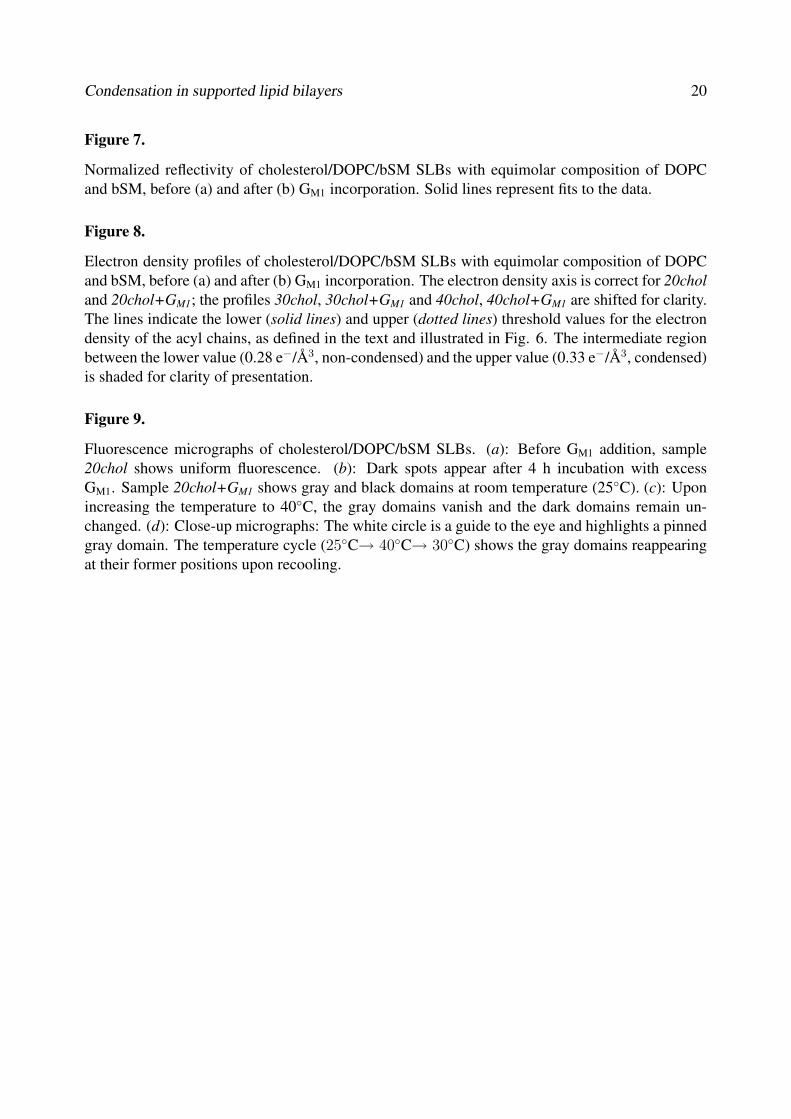
Condensation in supported lipid bilayers 20
Figure 7.
Normalized reflectivity of cholesterol/DOPC/bSM SLBs with equimolar composition of DOPCand bSM, before (a) and after (b) GM1 incorporation. Solid lines represent fits to the data.
Figure 8.
Electron density profiles of cholesterol/DOPC/bSM SLBs with equimolar composition of DOPCand bSM, before (a) and after (b) GM1 incorporation. The electron density axis is correct for 20choland 20chol+GM1; the profiles 30chol, 30chol+GM1 and 40chol, 40chol+GM1 are shifted for clarity.The lines indicate the lower (solid lines) and upper (dotted lines) threshold values for the electrondensity of the acyl chains, as defined in the text and illustrated in Fig. 6. The intermediate regionbetween the lower value (0.28 e−/A3, non-condensed) and the upper value (0.33 e−/A3, condensed)is shaded for clarity of presentation.
Figure 9.
Fluorescence micrographs of cholesterol/DOPC/bSM SLBs. (a): Before GM1 addition, sample20chol shows uniform fluorescence. (b): Dark spots appear after 4 h incubation with excessGM1. Sample 20chol+GM1 shows gray and black domains at room temperature (25C). (c): Uponincreasing the temperature to 40C, the gray domains vanish and the dark domains remain un-changed. (d): Close-up micrographs: The white circle is a guide to the eye and highlights a pinnedgray domain. The temperature cycle (25C→ 40C→ 30C) shows the gray domains reappearingat their former positions upon recooling.

Condensation in supported lipid bilayers 21
Figure 1:
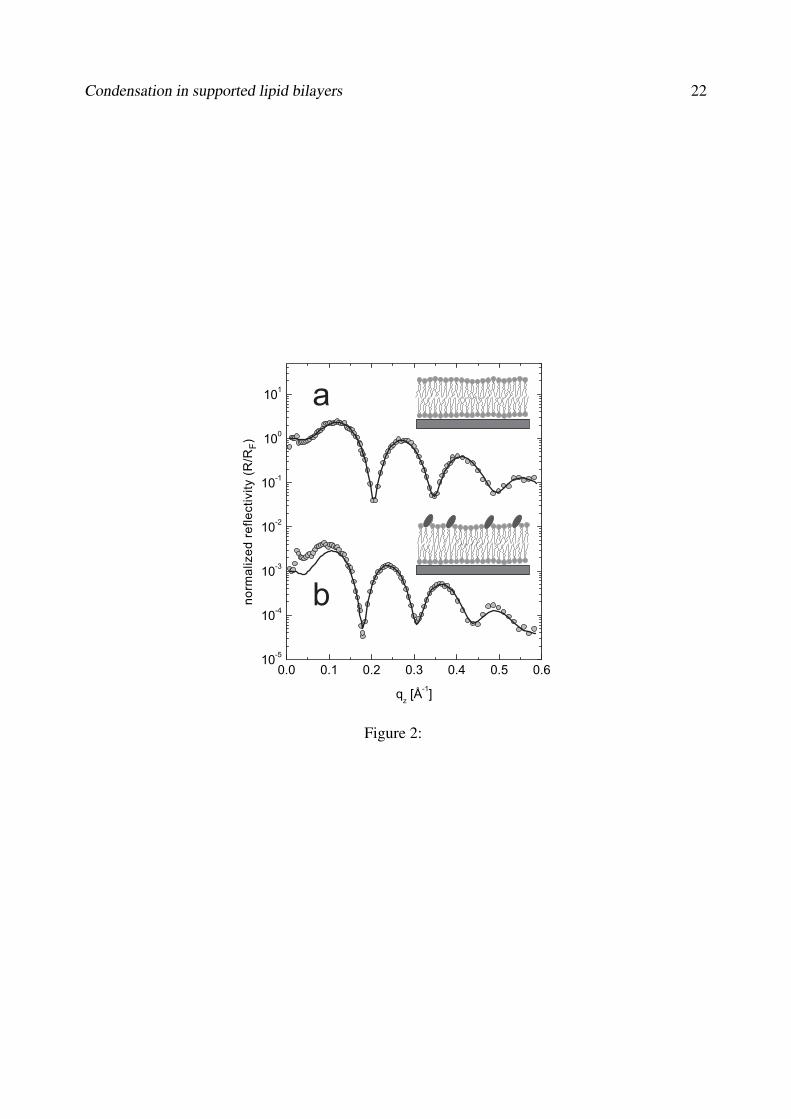
Condensation in supported lipid bilayers 22
Figure 2:
Condensation in supported lipid bilayers 23
Figure 3:
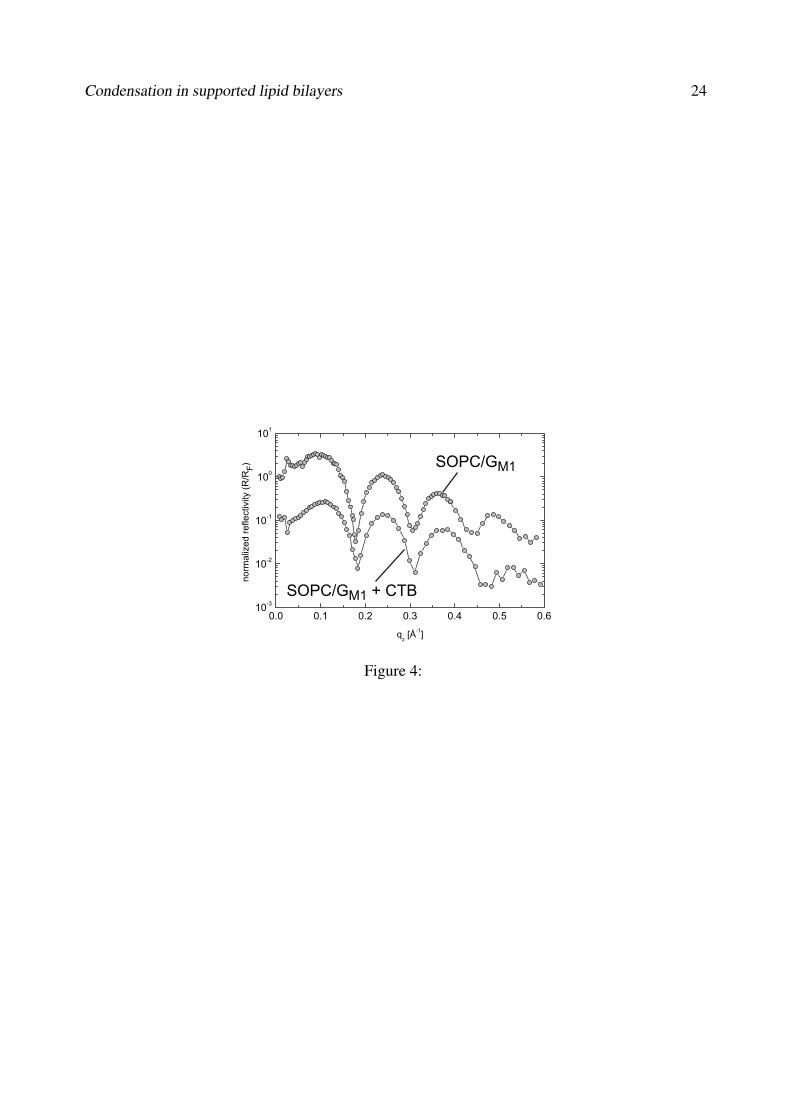
Condensation in supported lipid bilayers 24
Figure 4:

Condensation in supported lipid bilayers 25
Figure 5:

Condensation in supported lipid bilayers 26
Figure 6:
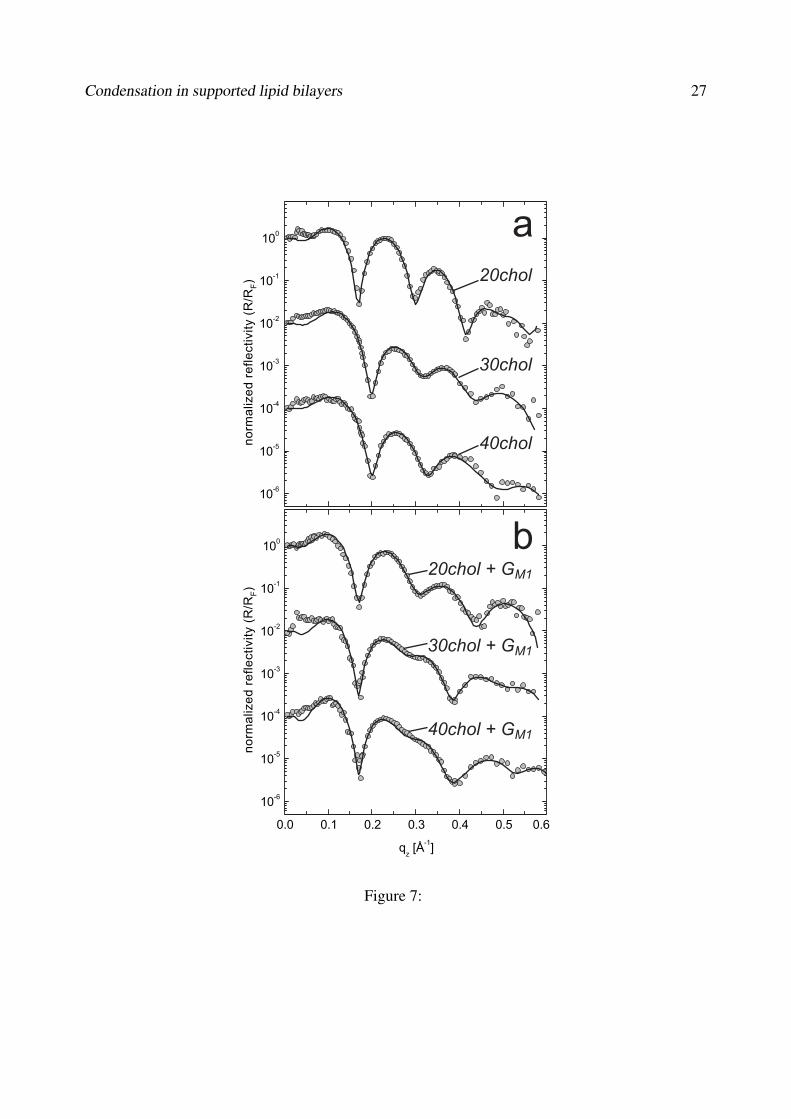
Condensation in supported lipid bilayers 27
Figure 7:

Condensation in supported lipid bilayers 28
Figure 8:
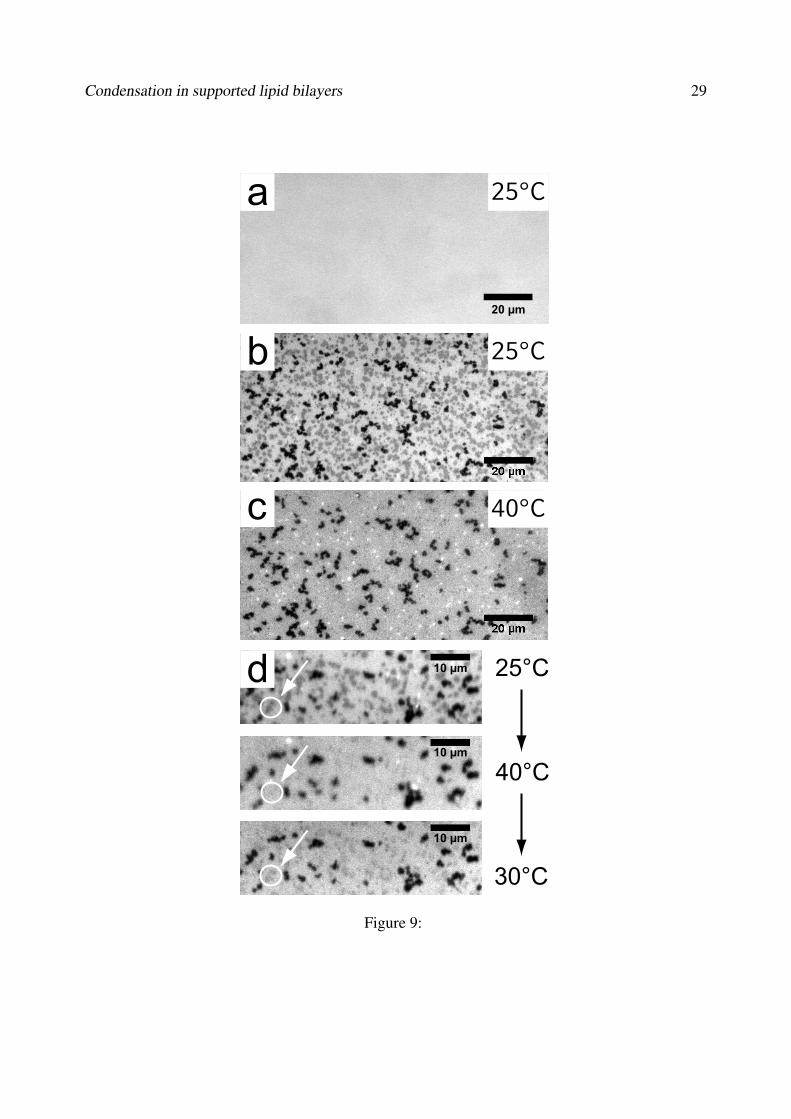
Condensation in supported lipid bilayers 29
Figure 9:

Appendix B
Continuous bleaching: Dataevaluation and program description
A program for analyzing and fitting of continuous bleaching data was written usingMatLab v7.1 (Mathworks, Cambridge, MA). The theoretical basis for continuousbleaching was first established in Ref. [13]; detailed guidelines on experimentalpremises and how to collect continuous bleaching data are given in Ref. [2] andRef. [4]. The program requires the following toolboxes:
• Optimization
• Image processing
and consists of the files
• cb.m, cb 2.m, cb 3.m
• cb.fig, cb 2.fig, cb 3.fig
• cbexp.m, cbcosh.m, cbbessel.m
The program is initialized by executing the command ’cb’ in the MatLab console.This opens the graphical user interface in the figure file ’cb.fig’; the correspondingfunctions are defined in the procedure file ’cb.m’. Three subsequent panels guidethe user through the steps for analyzing the data. In panel 1 (Fig. B.2), a singleimage can be loaded into the workspace and is displayed in a separate imagewindow (Fig. B.1). Four elements are present in the image window. The blue lineallows to choose a line profile in the image which represents the monoexponentialdecay of the fluorescence intensity at the rim (described by equation 3 in Ref. [4]).It should be chosen to span across the center, from one side of the illuminatedarea to the other, and should not protrude into the dark region. The yellow lineshould be chosen to represent the intensity decay at the rim of the illuminated spot(equation 3 in Ref. [13]). Two boxes allow to choose representative areas in the
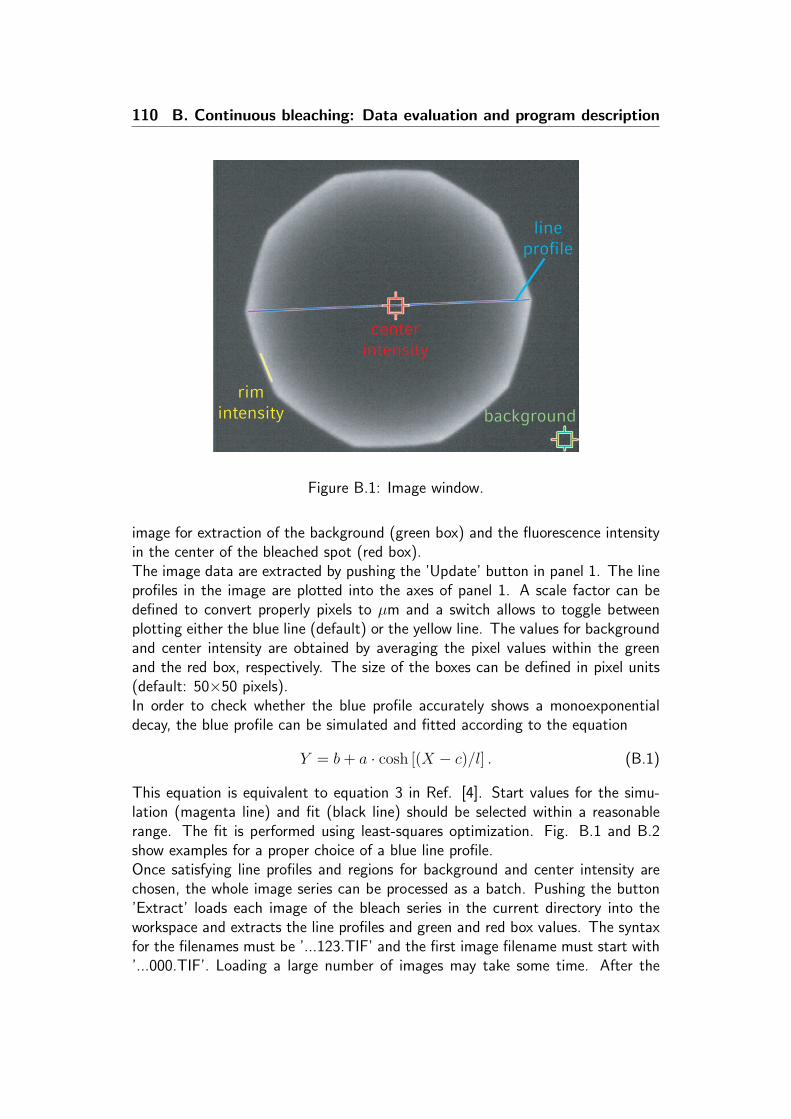
110 B. Continuous bleaching: Data evaluation and program description
lineprofile
background
centerintensity
rimintensity
Figure B.1: Image window.
image for extraction of the background (green box) and the fluorescence intensityin the center of the bleached spot (red box).The image data are extracted by pushing the ’Update’ button in panel 1. The lineprofiles in the image are plotted into the axes of panel 1. A scale factor can bedefined to convert properly pixels to µm and a switch allows to toggle betweenplotting either the blue line (default) or the yellow line. The values for backgroundand center intensity are obtained by averaging the pixel values within the greenand the red box, respectively. The size of the boxes can be defined in pixel units(default: 50×50 pixels).In order to check whether the blue profile accurately shows a monoexponentialdecay, the blue profile can be simulated and fitted according to the equation
Y = b + a · cosh [(X − c)/l] . (B.1)
This equation is equivalent to equation 3 in Ref. [4]. Start values for the simu-lation (magenta line) and fit (black line) should be selected within a reasonablerange. The fit is performed using least-squares optimization. Fig. B.1 and B.2show examples for a proper choice of a blue line profile.Once satisfying line profiles and regions for background and center intensity arechosen, the whole image series can be processed as a batch. Pushing the button’Extract’ loads each image of the bleach series in the current directory into theworkspace and extracts the line profiles and green and red box values. The syntaxfor the filenames must be ’...123.TIF’ and the first image filename must start with’...000.TIF’. Loading a large number of images may take some time. After the

111
data are extracted, pushing the button ’Go to next panel’ proceeds to panel 2.Panel 2 allows to extract the bleach rate B, either from the time-dependent in-tensity decay in the center of the image (upper axes) or from the time-dependentintensity decay at the rim (lower axes). The time lapse interval which was chosenin the continuous bleaching experiment has to be specified in order to properlydisplay the time axis. The bleach rate can be calculate by fitting the exponentialequation
Y = A · exp(−B · t) (B.2)
to the data in the upper axes, which represents the intensity in the center of theilluminated spot subtracted by the background intensity (red box - green box).Equation B.2 is equivalent to equation 2 in Ref. [4].The bleach rate B can also be extracted from the time-dependent intensity decayat the rim, according to equation 3 in Ref. [13]. The data are corrected forbackground and fitted to the equation
Y = A · exp(−B · t/2) · I0(B · t/2) (B.3)
where I0 is the zeroth modified Bessel function of the first kind.In panel 3, a selection of the extracted blue line profiles is plotted in the upperaxes. For clarity of data presentation, a value can be specified which determineshow many profiles are plotted at a time. A value of ’1’ plots every profile; avalue of 20 plots only profiles with index 1, 21, 41, and so on. The ’Fit’ buttoncalls a batch procedure which fits all profiles to equation B.1 using least-squaresminimization. The batch procedure starts with the last profile index (n, here:n=241) and uses the predefined parameters imported from panel 1 as start valuesfor the fit. After fitting the n-th profile, the fit results for parameters a, l, b, c aretaken as start values for fitting the profile n-1. This ensures that the fit does notdiverge for small n, where the exponential decay at the rim is less pronounced. Adiffusion coefficient D is extracted for each profile from the exponent l =
√B/D
and plotted in the lower axes. Since equation B.1 is only applicable for B · t > 4,the values for D at small times are usually not accurate [13]. Thus, boundaryvalues for t can be set and the average diffusion coefficient is calculated withinthis region. The error is indicated as standard deviation.

112 B. Continuous bleaching: Data evaluation and program description
work folder filename
load and displaya sample image[lines 34-111]
update thecurrent display[lines 122-209]
conversion factor(pixels to µm)
sizes of green andred box, here:50 x 50 pixel
proceed to panel no. 2
Loads whole image sequence and extractsdata for blue/yellow linesand green/red boxes[lines 264-302]
µm
line profile
data fit
simulation
simulate the profileusing start parameters[lines 225-237]
fit the profileusing start parameters[lines 239-261]
start parameter
toggle blue/yellowline profile[lines 211-223]
Figure B.2: This is the start interface (panel 1), stored in the figure file ’cb.fig’.Pushing a button calls the corresponding function in the MatLab procedure file’cb.m’. The source code lines where the function is defined are indicated in brack-ets. For example, the ’Load image’ button executes the source code lines [34-111]in the procedure file.

113
start & endboundariesfor fitting
start parameterfor fit
proceed to panel no. 3
fit results
average center intensity(red box - green box)
[lines 38-61]
data fit
set time lapseinterval forimage sequence
fit the datawithinboundaries[lines 63-82]
rim intensity(yellow line - green box)
[lines 84-107]
data fitfit the datawithinboundaries[lines 109-128]
Figure B.3: Panel 2. This interface is called from within panel 1 and offers twoindependent possibilities for calculating the bleach rate B. The name of the figurefile is ’cb 2.fig’ and the procedure file is ’cb 2.m’.

114 B. Continuous bleaching: Data evaluation and program description
select plotinterval
startparameterfor fit
fit the profiles[68-90]
updatecurrentdisplay[47-66]
blue line profiles
data fit
background level
set rangefor extractionof diffusioncoefficient
plot diffusioncoefficient[92-121]
µm2/s
diffusion coefficient
extractedvalues fordiffusion
mean valuebetween
boundaries
Figure B.4: Panel 3. This interface is called from within panel 2 and fits a seriesof line profiles. The diffusion coefficient D is subsequently extracted from the fitresults. The name of the figure file is ’cb 3.fig’ and the procedure file is ’cb 3.m’.
Bibliography
1. C. Reich, M. B. Hochrein, B. Krause, and B. Nickel. A microfluidic setupfor studies of solid-liquid interfaces using x-ray reflectivity and fluorescencemicroscopy. Rev. Sci. Instrum., 76(9):095103, 2005.
2. M. B. Hochrein, C. Reich, B. Krause, J. O. Radler, and B. Nickel. Structureand mobility of lipid membranes on a thermoplastic substrate. Langmuir, 22(2):538–545, 2006.
3. C. Reich, P. A. Neff, A. R. Bausch, J. O. Radler, and B. Nickel. Supportedmembranes on polyelectrolyte layers studied by X-ray reflectometry. physicastatus solidi (a), 203(14):3463–3467, 2006.
4. M. R. Horton, C. Reich, A. P. Gast, J. O. Radler, and B. Nickel. Structureand dynamics of crystalline protein layers bound to supported lipid bilayers.Langmuir, 23(11):6263–6269, 2007.
5. C. Reich, M. R. Horton, B. Krause, A. P. Gast, J. O. Radler, and B. Nickel.Condensation, stretching and asymmetry: GM1 and cholesterol in single sup-ported lipid bilayers. submitted, May 2007.
6. S. J. Singer and G. L. Nicolson. The fluid mosaic model of the structure ofcell membranes. Science, 175(23):720–31, 1972.
7. H. Sprong, P. van der Sluijs, and G. van Meer. How proteins move lipids andlipids move proteins. Nat. Rev. Mol. Cell Biol., 2(7):504–513, 2001.
8. B. Alberts, A. Johnson, J. Lewis, M. Raff, K. Roberts, and P. Walter. Molec-ular Biology of the Cell, 4th edition. New York: Garland, 2002.
9. E. Sackmann. Supported Membranes: Scientific and Practical Applications.Science, 271:43–48, 1996.
10. I. Reviakine and A. Brisson. Formation of Supported Phospholipid Bilayersfrom Unilamellar Vesicles Investigated by Atomic Force Microscopy. Langmuir,16(4):1806–1815, 2000.

116 BIBLIOGRAPHY
11. R. P. Richter and A. Brisson. Characterization of lipid bilayers and proteinassemblies supported on rough surfaces by atomic force microscopy. Langmuir,19(5):1632–1640, 2003.
12. D. Axelrod, D. E. Koppel, J. Schlessinger, E. Elson, and W. W. Webb. MobilityMeasurement by Analysis of Fluorescence Photobleaching Recovery Kinetics.Biophys. J., 16:1055, 1976.
13. C. Dietrich, R. Merkel, and R. Tampe. Diffusion Measurement of Fluorescence-Labeled Amphiphilic Molecules with a Standard Fluorescence Microscope. Bio-phys. J., 72:1701–1710, 1997.
14. T. Salditt. Thermal fluctuations and stability of solid-supported lipid mem-branes. J. Phys.: Condens. Matter, 17:R287–R314, 2005.
15. S. Krueger. Neutron reflection from interfaces with biological and biomimeticmaterials. Curr. Opin. Colloid Interface Sci., 6:111–117, 2001.
16. R. K. Thomas. Neutron Reflection From Liquid Interfaces. Annual Review ofPhysical Chemistry, 55(1):391–426, 2004.
17. T. Baumgart, A. T. Hammond, P. Sengupta, S. T. Hess, D. A. Holowka, B. A.Baird, and W. W. Webb. Large-scale fluid/fluid phase separation of proteinsand lipids in giant plasma membrane vesicles. Proc. Natl. Acad. Sci. USA,104(9):3165–3170, 2007.
18. P. A. Janmey and P. K. J. Kinnunen. Biophysical properties of lipids anddynamic membranes. Trends Cell Biol., 16(10):538–546, 2006.
19. K. Simons and E. Ikonen. Functional rafts in cell membranes. Nature, 387:569–572, 1997.
20. D. A. Brown and E. London. Structure and Function of Sphingolipid- andCholesterol-rich Membrane Rafts. J. Biol. Chem., 275(23):17221–17224,2000.
21. K. Simons and E. Ikonen. How Cells Handle Cholesterol. Science, 290(5497):1721–1726, 2000.
22. F. R. Maxfield and I. Tabas. Role of cholesterol and lipid organization indisease. Nature, 438:612–621, 2005.
23. R. G. W. Anderson and K. Jacobson. A role for lipid shells in targeting proteinsto caveolae, rafts, and other lipid domains. Science, 296:1821–1825, 2002.
24. B. Antonny. Membrane deformation by protein coats. Curr. Opin. Cell. Biol.,18(4):386–394, 2006.

BIBLIOGRAPHY 117
25. G. Khanarian. Optical properties of cyclic olefin copolymers. Opt. Eng., 40(6):1024–1029, 2001.
26. L. G. Parratt. Surface Studies of Solids by Total Reflection of X-rays. Phys.Rev., 95(2):359, July 1954.
27. L. Nevot and P. Croce. Characterization of surfaces by grazing x-ray reflection- Application to study of polishing of some silicate-glasses. Revue de physiqueappliquee, 15:761, 1980.
28. J. Als-Nielsen and D. McMorrow. Elements of Modern X-ray Physics. Wiley& Sons, Ltd., 2001.
29. B. L. Henke, E. M. Gullikson, and J. C. Davis. X-ray interactions: Photoab-sorption, scattering, transmission, and reflection at E = 50-30,000 eV, Z =1-92. Atomic Data and Nuclear Data Tables, 54(2):181–342, 1993.
30. M. Przybylo, J. Sykora, J. Humpolickova, A. Benda, A. Zan, and M. Hof.Lipid diffusion in giant unilamellar vesicles is more than 2 times faster than insupported phospholipid bilayers under identical conditions. Langmuir, 22(22):9096–9099, 2006.
31. F. M. Menger, M. E. Chlebowski, A. L. Galloway, H. Lu, V. A. Seredyuk, J. L.Sorrells, and H. Zhang. A tribute to the phospholipid. Langmuir, 21(23):10336–10341, 2005.
32. W. H. Binder, V. Barragan, and F. M. Menger. Domains and rafts in lipidmembranes. Angew. Chem. Int. Ed, 42:5802–5827, 2003.
33. E. Kalb, S. Frey, and L. K. Tamm. Formation of supported planar bilayers byfusion of vesicles to supported phospholipid monolayers. Biochim. Biophys.Acta, 1103:307–316, 1992.
34. A. A. Brian and H. M. McConnell. Allogeneic stimulation of cytotoxic Tcells by supported planar membranes. Proc. Natl. Acad. Sci., 81:6159–6163,October 1984.
35. L. K. Tamm and H. M. McConnell. Supported phospholipid bilayers. Biophys.J., 47(1):105–113, January 1985.
36. H. M. McConnell, T. H. Watts, R. M. Weis, and A. A. Brian. Supported planarmembranes in studies of cell-cell recognition in the immune system. Biochim.Biophys. Acta (BBA) - Reviews on Biomembranes, 864(1):95–106, 1986.
37. U. Mennicke and T. Salditt. Preparation of solid-supported lipid bilayers byspin-coating. Langmuir, 18(21):8172–8177, 2002.

118 BIBLIOGRAPHY
38. A. C. Simonsen and L. A. Bagatolli. Structure of spin-coated lipid films anddomain formation in supported membranes formed by hydration. Langmuir,20(22):9720–9728, 2004.
39. E. Reimhult, F. Hook, and B. Kasemo. Intact vesicle adsorption and sup-ported biomembrane formation from vesicles in solution: Influence of surfacechemistry, vesicle size, temperature, and osmotic pressure. Langmuir, 19(5):1681–1691, 2003.
40. H. Schonherr, J. M. Johnson, P. Lenz, C. W. Frank, and S. G. Boxer. VesicleAdsorption and Lipid Bilayer Formation on Glass Studied by Atomic ForceMicroscopy. Langmuir, 20(26):11600–11606, 2004.
41. R. P. Richter, R. Berat, and A. R. Brisson. Formation of Solid-Supported LipidBilayers: An Integrated View. Langmuir, 22(8):3497–3505, 2006.
42. C. Hamai, P. S. Cremer, and S. M. Musser. Single Giant Vesicle RuptureEvents Reveal Multiple Mechanisms of Glass-Supported Bilayer Formation.Biophys. J., 92(6):1988–1999, 2007.
43. U. Seifert. Configurations of fluid membranes and vesicles. Advances inPhysics, 46(1):13–137, 1997.
44. A. Spaar and T. Salditt. Short range of hydrocarbon chains in fluid phos-pholipid bilayers studied by x-ray diffractions from highly oriented membranes.Biophys. J., 85:1576–1584, 2003.
45. M. R. Horton, J. O. Radler, and A. P. Gast. Phase behavior and the partitioningof caveolin-1 scaffolding domain peptides in model lipid bilayers. J. ColloidInterface Sci., 304(1):67–76, 2006.
46. L. A. Bagatolli. To see or not to see: Lateral organization of biological mem-branes and fluorescence microscopy. Biochim. Biophys. Acta (BBA) - Biomem-branes, 1758(10):1541–1556, 2006.
47. S. L. Veatch and S. L. Keller. Miscibility phase diagrams of giant vesiclescontaining sphingomyelin. Phys. Rev. Lett., 94:148101, 2005.
48. E. Evans and E. Sackmann. Translational and rotational drag coefficients fora disk moving in a liquid membrane-associated with a rigid substrate. Journalof Fluid Mechanics, 194:553–561, 1988.
49. J. Radler, H. Strey, and E. Sackmann. Phenomenology and Kinetics of LipidBilayer Spreading on Hydrophilic Surfaces. Langmuir, 11:4539–4548, 1995.

BIBLIOGRAPHY 119
50. P. S. Cremer and S. G. Boxer. Formation and spreading of lipid bilayers onplanar glass supports. Journal of Physical Chemistry B, 103(13):2554–2559,1999.
51. S. Chiantia, J. Ries, N. Kahya, and P. Schwille. Combined AFM and Two-Focus SFCS Study of Raft-Exhibiting Model Membranes. ChemPhysChem, 7(11):2409–2418, 2006.
52. P. Lenz, C. M. Ajo-Franklin, and S. G. Boxer. Patterned supported lipidbilayers and monolayers on poly(dimethylsiloxane). Langmuir, 20(25):11092–11099, 2004.
53. T. Nielsen, F. Bundgaard, P. Shi, P. Szabo, O. Geschke, and A. Kristensen.Nanoimprint lithography in the cyclic olefin, Topas, a highly UV-transparentand chemically resistant thermoplast. Journal of vacuum Science and Tech-nology B, 22:1770–1775, 2004.
54. M. B. Hochrein, J. A. Leierseder, L. Golubovic, and J. O. Radler. DNALocalization and Stretching on Periodically Microstructured Lipid Membranes.Phys. Rev. Lett., 96(3):038103, 2006.
55. Y. Liu and J. F. Nagle. Diffuse scattering provides material parameters andelectron density profiles of biomembranes. Phys. Rev. E, 69:040901, 2004.
56. G. Decher. Fuzzy Nanoassemblies: Toward Layered Polymeric Multicompos-ites. Science, 277:1232–1237, 1997.
57. P. A. Neff, A. Naji, C. Ecker, B. Nickel, R. v. Klitzing, and A. R. Bausch.Electrical detection of self-assembled polyelectrolyte multilayers by a thin filmresistor. Macromolecules, 39(2):463–466, 2006.
58. P. A. Neff, B. K. Wunderlich, R. v. Klitzing, and A. R. Bausch. Formationand dielectric properties of polyelectrolyte multilayers studied by a silicon-on-insulator based thin film resistor. Langmuir, 23(7):4048–4052, 2007.
59. A. Plech, T. Salditt, C. Munster, and J. Peisl. Investigation of Structureand Growth of Self-Assembled Polyelectrolyte Layers by X-ray and NeutronScattering under Grazing Angles. J. Colloid Interface Sci., 223:74–82, 2000.
60. A. R. Sapuri, M. M. Baksh, and J. T. Groves. Electrostatically TargetedIntermembrane Lipid Exchange with Micropatterned Supported Membranes.Langmuir, 19:1606–1610, 2003.
61. O. G. Mouritsen, T. L. Andresen, A. Halperin, P. L. Hansen, A. F. Jakobsen,U. B. Jensen, M. Ø Jensen, K. Jørgensen, T. Kaasgaard, C. Leidy, A. C.Simonsen, G. H. Peters, and M. Weiss. Activation of interfacial enzymes at
120 BIBLIOGRAPHY
membrane surfaces. Journal of Physics: Condensed Matter, 18(28):S1293–S1304, 2006.
62. V. M. Kaganer, H. Mohwald, and P. Dutta. Structure and phase transitionsin Langmuir monolayers. Reviews of Modern Physics, 71(3):779–819, 1999.
63. C. E. Miller, J. Majewski, R. Faller, S. Satija, and T. L. Kuhl. Cholera ToxinAssault on Lipid Monolayers Containing Ganglioside GM1. Biophys. J., 86(6):3700–3708, 2004.
64. D. Vaknin, K. Kjaer, H. Ringsdorf, R. Blankenburg, M. Piepenstock,A. Diederich, and M. Loesche. X-ray and neutron reflectivity studies of aprotein monolayer adsorbed to a functionalized aqueous surface. Langmuir, 9(5):1171–1174, 1993.
65. P. Ratanabanangkoon, M. Gropper, R. Merkel, E. Sackmann, and A. P. Gast.Two-dimensional streptavidin crystals on giant lipid bilayer vesicles. Langmuir,18:4270–4276, 2002.
66. T. L. Calvert and D. Leckband. Two-dimensional protein crystallization atsolid-liquid interfaces. Langmuir, 13(25):6737–6745, 1997.
67. P. Ratanabanangkoon and A.P. Gast. Effect of ionic strength on two-dimensional streptavidin crystallization. Langmuir, 19(5):1794–1801, 2003.
68. Andrew C. Ku, Seth A. Darst, Roger D. Kornberg, Channing R. Robertson, andAlice P. Gast. Dendritic growth of two-dimensional protein crystals. Langmuir,8(10):2357–2360, 1992.
69. C. Rosano, P. Arosio, and M. Bolognesi. The x-ray three-dimensional structureof avidin. Biomolecular Engineering, 16:5–12, 1999.
70. Th. M. Nieuwenhuizen, P. F. J. van Velthoven, and M. H. Ernst. Diffusionand long-time tails in a two-dimensional site-percolation model. Phys. Rev.Lett., 57(20):2477–2480, Nov 1986.
71. M. J. Saxton. Anomalous diffusion due to obstacles: a Monte Carlo study.Biophys. J., 66:394–401, 1994.
72. W. I. Lencer, T. R. Hirst, and R. K. Holmes. Membrane traffic and thecellular uptake of cholera toxin. Biochim. Biophys. Acta (BBA) - MolecularCell Research, 1450(3):177–190, July 1999.
73. K. C. Weng, J. L. Kanter, W. H. Robinson, and C. W. Frank. Fluid supportedlipid bilayers containing monosialoganglioside GM1: A QCM-D and FRAPstudy. Colloids Surf. B. Biointerfaces, 50(1):76–84, 2006.

BIBLIOGRAPHY 121
74. R. Wang, J. Shi, A. N. Parikh, A. P. Shreve, L. Chen, and B. I. Swanson.Evidence for cholera aggregation on GM1-decorated lipid bilayers. ColloidsSurf. B. Biointerfaces, 33:45–51, 2004.
75. T. J. McIntosh and S. A. Simon. Long- and Short-Range Interactions betweenPhospholipid/Ganglioside GM1 Bilayers. Biochemistry, 33(34):10477–10486,1994.
76. S. L. Veatch, I. V. Polozov, K. Gawrisch, and S. L. Keller. Liquid Domains inVesicles Investigated by NMR and Fluorescence Microscopy. Biophys. J., 86(5):2910–2922, 2004.
77. A. T. Hammond, F. A. Heberle, T. Baumgart, D. Holowka, B. Baird, andG. W. Feigenson. Crosslinking a lipid raft component triggers liquid ordered-liquid disordered phase separation in model plasma membranes. Proc. Natl.Acad. Sci. USA, 102(18):6320–6325, 2005.
78. C. Dietrich, L. A. Bagatolli, Z. N. Volovyk, N. L. Thompson, M. Levi, K. Jacob-son, and E. Gratton. Lipid rafts reconstituted in model membranes. Biophys.J., 80:1417–1428, 2001.

122 BIBLIOGRAPHY

123
Danksagung
Ich danke Joachim O. Rädler für die herzliche Aufnahme an seinem Institut
und für die Bereitstellung eines Arbeitsumfeldes mit einer sehr guten
Infrastruktur, ohne die diese Doktorarbeit nicht möglich gewesen wäre. Die
Vielfältigkeit der Projekte am Lehrstuhl Rädler haben mir stets einen
Überblick weit über den Horizont meiner eigenen Arbeit hinaus ermöglicht.
Bert Nickel danke ich für die hervorragende Betreuung meiner Dissertation.
Seine stets positive und pragmatische Herangehensweise an neue Frage-
und Problemstellungen hat so manches Projekt meiner Doktorarbeit aus
vermeintlichen Sackgassen erfolgreich herausgeführt.
Meinen Kollegen Margaret Horton, Marion Hochrein, Luisa Andruzzi,
Christian Daniel und Andreas Hohner möchte ich ein besonderes
Dankeschön aussprechen. Von Ihnen habe ich nicht nur unschätzbar viel
über Lipide & Co. gelernt, sondern insbesondere wie man mit viel Ausdauer,
Enthusiasmus und kritischem Hinterfragen von scheinbar Offensichtlichem
auch gerade die etwas schwierigeren Projekte zum Erfolg führen kann. Ihnen
und Simon Keller, Daniel Hönig, Teresa Eichinger und Claudia Schmidt
danke ich für eine sehr angenehme und oftmals lustige Arbeitsatmosphäre
am Lehrstuhl. Bärbel Krause möchte ich für Ihren unermüdlichen Einsatz
bei unseren Synchrotronmessungen an der ESRF danken. Ein herzliches
Dankeschön auch an Gerlinde Schwake und Susi Kempter für ihre grosse
Hilfsbereitschaft und ihren Überblick im Labor, und an Margarete Meixner
für die Unterstützung bei allen administrativen Fragen, sowie allen anderen
netten Leuten am Lehrstuhl.
Ein ganz besonderer Dank gilt meiner Familie. Für Alles.