structure and dynamics of spherical and rodlike alkyl
TRANSCRIPT

Structure and Dynamics of Spherical and Rodlike Alkyl EthoxylateSurfactant Micelles Investigated Using NMR Relaxation andAtomistic Molecular Dynamics SimulationsAllison Talley Edwards,†,‡ Abdolreza Javidialesaadi,†,∥ Katie M. Weigandt,§ George Stan,*,†
and Charles D. Eads*,‡
†Department of Chemistry, University of Cincinnati, Cincinnati, Ohio 45221, United States‡Corporate Research & Development, The Procter & Gamble Company, Mason, Ohio 45040, United States§National Institute of Standards and Technology, 100 Bureau Drive, MS 6102, Gaithersburg, Maryland 20899, United States
*S Supporting Information
ABSTRACT: Predicting and controlling the properties ofamphiphile aggregate mixtures require understanding thearrangements and dynamics of the constituent molecules. Toexplore these topics, we study molecular arrangements anddynamics in alkyl ethoxylate nonionic surfactant micelles bycombining NMR relaxation measurements with large-scaleatomistic molecular dynamics simulations. We calculate param-eters that determine relaxation rates directly from simulatedtrajectories, without introducing specific functional forms todescribe the dynamics. NMR relaxation rates, which depend onrelative motions of interacting atom pairs, are influenced by widedistributions of dynamic time scales. We find that relative motions of neighboring atom pairs are rapid and liquidlike but aresubject to structural constraints imposed by micelle morphology. Relative motions of distant atom pairs are slower than nearbyatom pairs because changes in distances and angles are smaller when the moving atoms are further apart. Large numbers ofatom pairs undergoing these slow relative motions contribute to predominantly negative cross-relaxation rates. For sphericalmicelles, but not for cylindrical micelles, cross-relaxation rates are positive only for surfactant tail atoms connected to thehydrophilic headgroup. This effect is related to the lower packing density of these atoms at the hydrophilic−hydrophobicboundary in spherical vs cylindrical arrangements, with correspondingly rapid and less constrained motion of atoms at theboundary.
■ INTRODUCTION
Surfactant and amphiphile aggregates control or influence theproperties of many materials relevant to biology, medicine,industry, technology, and more.1−3 Specific examples ofcommercial application areas include consumer cleaningproducts, oil recovery,4 and drug delivery.5,6 Commercialmixture properties that depend on amphiphile aggregatestructure and dynamics include viscosity,7−10 foaming,11 andthe ability to suspend and deliver solubilized materials likeflavors, fragrances,12−15 and drugs.16 Amphiphile aggregate-based materials are often empirically designed to create andexploit these properties.12 However, small uncontrolledchanges in composition or conditions can lead to large,unpredictable, and consequential property changes.17−19
Deeper understanding and better control of these propertiescan be gained by pursuing a detailed study of the arrangementsand dynamics of molecules within the aggregates. Moleculardynamics (MD) simulations20−23 and nuclear magneticresonance (NMR) relaxation measurements24,25 provideinformation of this nature, and these techniques are especiallyvaluable when used together.26−29 Combining experiments and
simulations, bridged by theory, makes it possible to develop adetailed description of aggregate structure and dynamics and torefine our ability to interpret experimental results in relatedaggregate systems. Of the techniques available for studyingaggregate dynamics, NMR is uniquely capable of measuring avast range of molecular dynamics time scales ranging over 9orders of magnitude.30,31 NMR relaxation phenomena areparticularly informative for exploring dynamics time scalesranging from picoseconds to microseconds.27,32,33
Numerous literature reports describe the structure anddynamics of aggregate structures utilizing MD simulations,NMR relaxation, or a combination of the two. These reportsaddress structured biomacromolecules including proteins,nucleic acids, and complex carbohydrates and a variety ofother materials including bulk liquids and amphiphileaggregates.22,25,27,34−44 In some limiting situations, simpleanalytical expressions can be used to simplify the interpretation
Received: May 6, 2019Revised: September 27, 2019Published: October 1, 2019
Article
pubs.acs.org/LangmuirCite This: Langmuir 2019, 35, 13880−13892
© 2019 American Chemical Society 13880 DOI: 10.1021/acs.langmuir.9b01345Langmuir 2019, 35, 13880−13892
Dow
nloa
ded
via
NA
TL
IN
ST O
F ST
AN
DA
RD
S &
TE
CH
NO
LO
GY
on
Apr
il 21
, 202
0 at
16:
39:1
4 (U
TC
).Se
e ht
tps:
//pub
s.ac
s.or
g/sh
arin
ggui
delin
es f
or o
ptio
ns o
n ho
w to
legi
timat
ely
shar
e pu
blis
hed
artic
les.

of simulations or to directly describe the dynamics. Forexample, great simplification arises when interatomic distancesare approximately constant and different atoms are spectro-scopically resolvable. This is often the case for isotropicallytumbling organic molecules and for biomacromolecules.37 Inother cases, interatomic distances do not remain constant, anddifferent atoms are not resolvable. This situation arisesespecially in systems consisting of bulk liquids or polymers.Such systems are often analyzed following Torrey45 by usingpropagators to bridge molecular distribution functions withmolecular dynamics to accommodate large networks ofcoupled, diffusing spins.46,47
Our aim in this work is to understand the structural anddynamic origins of NMR relaxation phenomena observed innonionic surfactant micelles. We pursue this using acombination of experimental, computational, and theoreticalapproaches. Nonionic surfactants are widely used and versatilein applications and make excellent model systems forexperiment and theory.48−51 While the study of nonionicmicelle structure and dynamics has a long history, dynamicaspects of the aggregates are still insufficiently under-stood.25,52−56 For example, experimental measurementsshown in this work of cross-relaxation in these micelles usingtwo-dimensional 1H-1H Nuclear Overhauser Effect Spectros-copY (NOESY) give mostly negative cross-relaxation rates,which typically accompany slow molecular motions. However,alkyl chain protons adjacent to the ethoxy headgroup exhibitpositive cross-relaxation rate constants in some of thesesystems, indicative of rapid molecular motions. Notably, theseprotons are located at the boundary between hydrophobic andhydrophilic regions of spherical micelles, where we mightexpect atoms to be especially sterically constrained anddynamically encumbered by the structure of the micelle.39,57,58
To obtain microscopic-level understanding of phenomenarevealed by these NMR experiments, we perform extensiveatomistic MD simulations that sample a total of ≃2.7 μs. Wethen analyze the results in the context of the NMR relaxationtheory. Rather than relying on analytical models or theirunderlying assumptions, we consult MD trajectories directly toobtain insights into the relaxation behavior. To informinterpretation of NMR relaxation phenomena, simulations
must adequately sample dynamics over a correspondingly largerange of time scales. Doing so suggests an explanation of theobserved relaxation behavior. This enables a deeper under-standing of structure and dynamics in amphiphile aggregatesand improves our ability to gain information from thesetechniques.
■ METHODSExperimental. Samples contained nonionic alkyl ethoxylate
surfactants of type CiEj, where i denotes the number of carbonatoms in the alkyl chain and j is the number of ethoxy units.Octaethylene glycol monododecyl ether (C12E8), hexaethylene glycolmonododecyl ether (C12E6), tetraethylene glycol monododecyl ether(C12E4), and deuterium oxide (D2O) were purchased from Sigma-Aldrich and used without further purification. The surfactants werecombined with pure D2O and allowed to equilibrate for 24 h at roomtemperature before data acquisition. One series of samples wascreated to probe micelle shapes from spherical to increasingly longwormlike structures. For this series, samples were prepared havingrelative (molar) amounts of C12E8 and C12E4 of 1:0, 3:1, 2:1, and 1:1.The total surfactant concentration in these samples was 80 mM inevery case. Another sample was prepared to study relaxation ratesacross a thermally driven transition from a hexagonal phase to amicellar phase. This sample contained C12E6 at 50% wt/wt in D2O.
All 1H relaxation measurements were performed with vendor-supplied pulse sequences using a Bruker Avance III 600 MHzinstrument, while 13C relaxation measurements were performed usinga Bruker Avance 700 MHz instrument. The two-dimensional 1H-1HNuclear Overhauser Effect SpectroscopY (NOESY) technique wasused to measure cross-relaxation using the pulse sequencenoesygpphpp. The mixing time was 400 ms, and the data wereacquired with 4096 points in F2, 1024 points in F1, and using arelaxation delay of 10 s. One-dimensional 1H spectra were collectedwith the zg pulse sequence using 16 scans and an interscan relaxationdelay of 20 s. 1H T1 and
13C T1 data were acquired using the t1ir andt1irpg pulse sequences, respectively, using 16 time increments and aninterscan relaxation delay of 55 s. 1H T2 measurements wereperformed using the cpmg pulse sequence with an interscan relaxationdelay of 55 s. Unless otherwise specified, all experiments wereperformed at 25 °C. To monitor the thermally driven phase transition,NOESY spectra were acquired at 25, 35, 40, and 45 °C as describedabove.
Molecular Dynamics Simulations. We perform all-atomsimulations of a spherical micelle comprising pure C12E8 and of a
Figure 1. Molecular structure of (a) C12E8 and (b) C12E4 surfactants. Alkyl chain carbon atom numbering and ethoxy chain groups are indicated.Carbon atoms are designated with blue, oxygen atoms with red, and hydrogen atoms with white.
Langmuir Article
DOI: 10.1021/acs.langmuir.9b01345Langmuir 2019, 35, 13880−13892
13881

cylindrical micelle comprising a 1:1 mixture of C12E8 and C12E4. Asthe reported range of aggregation numbers for C12E8 at 25 °C rangefrom 80 to 120,59−62 we choose an aggregation number of 99. Theresulting micelles have an average radius of 29.5 Å. Aggregationnumbers of extended wormlike micelles of the type CiEj are reportedto be ≥1000,10,54 which would require atomistic simulations that arecomputationally too demanding. Therefore, we study cylindricalmicelles with lower aggregation numbers that reproduce an aggregatewith a contour length larger than the 150−200 Å persistence length ofCiEj nonionic micelles.63 To this end, we consider cylindrical micellescomprising 400 C12E8 and 400 C12E4 molecules, which have anaverage contour length ≃320 Å and a cross-sectional radius ≃24 Å.Models of aggregate structures are obtained using the Packmol64
software package. For spherical micelles, we arrange 99 of the linearmolecules of C12E8, shown in Figure 1, in an initial spherical shapeusing a distance tolerance of 2.0 Å. These structures are then solvatedusing 36783 TIP3P water molecules in a rhombic dodecahedron boxwith dimensions 120 Å × 120 Å × 120 Å, corresponding to a total of119 754 atoms. The cylindrical micelle comprises 400 C12E8 and 400C12E4 molecules each, shown in Figure 1. These are then arranged ina cylindrical shape with a tolerance of 2.0 Å. To facilitate fastersolvation and equilibration, this structure is first minimized using theconjugate gradient method for 500 steps. Next, the minimizedstructure is solvated using 173 866 TIP3P water molecules in anorthorhombic box with dimensions 130 Å × 130 Å × 350 Å,corresponding to a total of 586 398 atoms.MD simulations are performed using the molecular modeling
program NAMD version 2.1265 and the CHARMM36 force field.66,67
Interactions involving surfactant molecules are modeled using thestandard CHARMM36 parameters including the ethers parameter set,and interactions involving water molecules are modeled using theTIP3P parameter set. The force field and water model used here wereshown to yield accurate size and shape properties of mi-celles.21,58,68−71 Periodic boundary conditions are applied, andelectrostatic interactions are treated using particle mesh Ewald72
with a grid spacing of 1 Å. The integration algorithm uses the velocityVerlet method with an integration time step of 2 fs. Nonbondedinteractions are truncated using a switching function between 10 and12 Å. All covalent bond lengths involving hydrogen are held constantusing the SHAKE algorithm73 with a tolerance of 1.0 × 10⁻⁸ Å. Thepressure and temperature are controlled with a Nose−HooverLangevin piston using a reference pressure of 1 bar and dampingcoefficient of 2 ps−1. Simulations are performed at T = 300 K.For both spherical and cylindrical systems, the initial solvated
Packmol model structures are energy minimized using the conjugategradient method for 5000 steps. Next, equilibration simulations at T =300 K are performed for 10 ns with the spherical micelles and for 50ns with the cylindrical micelles. Equilibration is attained when stableradius of gyration (Rg) and eccentricity (e) values are reached. Theeccentricity is defined as e = 1 − Imin/Iavg, where Imin and Iavg are thesmallest and the average principal moment of inertia, respectively.74
We find that e ≃ 0.10 ± 0.04 for spherical micelles and e ≃ 0.85 ±0.01 for cylindrical micelles. These values are consistent with sphericaland cylindrical shapes, respectively, considering the limiting cases of aperfect sphere (e = 0) and of an infinitely long rod (e = 1). Theequilibrium value of Rg for spherical micelles is ≃23.7 ± 0.1 Å and forcylindrical micelles it is ≃85.0 ± 1.6 Å. The configurations obtainedafter these equilibration simulations were used as initial configurationsof production runs. One additional configuration was obtained foreach of the micelle types by extending the equilibration simulationsfor 20 ns. Representative structures are shown in Figure 2a,b withwater omitted for clarity. Two production trajectories are performedfor each micelle for 680 ns and are sampled at 10 ps intervals tocapture frequencies up to 100 times faster than the Larmor frequencyat 14.1 T (600 MHz). As MD simulations have a finite duration of680 ns, they provide no information on dynamic processes withlonger time scales.Calculating NMR Relaxation Rates from Simulations.
Synopsis of the Relaxation Theory. The relaxation theory used inthis work has been summarized in standard references.75−78 In short,
according to the Bloembergen, Purcell, and Pound (BPP)perturbation theory, nuclear spin relaxation rates are functions ofspin state transition probabilities.79 These transition probabilities are,in turn, proportional to the intensities of fluctuations in interactionsthat occur at frequencies that match differences between the energylevels of spin systems. Spectral density functions J(ω) quantify theseintensities and are determined by the Fourier transformation ofcorrelation functions G(τ) that characterize the time dependence ofthe interactions underlying the relaxation. Relaxation processesstudied in this work are dominated by fluctuations in the magneticdipole−dipole coupling among pairs of nuclei. Given reliabletrajectories, the main task in relating MD simulations to NMRrelaxation phenomena is therefore to calculate correlation functionsfor the dipole−dipole interactions from the trajectories.
Because of the algebraic form of the dipole−dipole interaction,magnetic dipole−dipole correlation functions can be expressed interms of second-rank spherical harmonics and the internucleardistances as
G G
KY t t
r tY t t
r t
( ) ( )
( ( ( ), ( )))( )
( ( ), ( ))( )
mm
mIS
m m2
2
2
22
32
3
∑
∑
τ τ
θ ϕ θ τ ϕ ττ
=
=* + +
+
=−
=−
(1)
where r(t) is the distance between the two interacting nuclei,Y2m(θ(t),ϕ(t)) are the spherical harmonics, and θ(t) and ϕ(t) are the
polar and azimuthal angles in the laboratory frame with the appliedmagnetic field defining the polar axis. KIS contains physical constantsrelated to the magnetic properties of the insensitive (I) and sensitive
(S) interacting spins, ( )KIS I S4
20 γ γ= ℏμπ , where μ0 is the vacuum
permittivity, ℏ is the Planck constant divided by 2π, and γ is thegyromagnetic ratio.
Inspection of eq 1 indicates that correlation functions calculatedfrom MD simulation trajectories depend on changes in orientation,reflected in spherical harmonic terms of all orders m, and on changesin the distances between nuclei. For cases where internucleardistances are approximately constant, for example, 13C relaxation,which is dominated by directly attached hydrogen atoms, analysis canbe simplified by separating the distance and angle variables. For caseswhere the internuclear distances vary, for example, when theinteracting nuclei reside on different molecules, such simplificationsare not valid since it is necessary to accommodate the distancefluctuations and potential correlations between distance and anglefluctuations.46,47 We note that the correlation function G(τ) may beexpressed in a compact form by using the second-order Legendre
Figure 2. Equilibrated micelle structures: (a) C12E8 spherical micelleand (b) 1:1 molar ratio C12E8/C12E4 cylindrical micelle. The alkylcore is shown in yellow, the methylene units of the ethoxy headgroupsare shown in cyan, and the oxygen atoms are shown in red. Watermolecules are omitted for clarity.
Langmuir Article
DOI: 10.1021/acs.langmuir.9b01345Langmuir 2019, 35, 13880−13892
13882

polynomial, P2, to represent the angular part via the additiontheorem33,37 P2(cos χt,t+τ) = (4π/5)∑m=−2
2 (Y2m(θ(t), ϕ(t)))*Y2
m(θ(t +τ), ϕ(t + τ)), where χt, t+τ is the angle of the internuclear vector at tand t + τ.Because correlation functions are even and real, Fourier trans-
formation is equivalent to real-valued cosine transformation of thecorrelation function to generate the spectral density function
J G( ) 2 ( )cos( )dm m0
∫ω τ ωτ τ=∞
(2)
Given the spectral density functions, the relaxation rates due toproton−proton dipolar coupling are given by
TJ J
1( ) 4 (2 )
11 H 2 Hω ω= +
(3)
TJ J J
1 32
(0)52
( ) (2 )2
0 1 H 2 Hω ω= + +(4)
J J6 (2 ) (0)2 H 0σ ω= − (5)
Here, T1 is the longitudinal relaxation time, T2 is the transverserelaxation time, and σ is the cross-relaxation rate. ωH is the Larmorfrequency of protons for the magnetic field used in the experiment,600 MHz in this work.The expression for 13C T1 due to carbon−proton dipolar coupling
is
TN
J J J1
4( ( ) 3 ( ) 6 ( ))
10 H C 1 C 2 H Cω ω ω ω ω= − + + +
(6)
where N is the number of protons attached to the carbon atom, andthe Larmor frequency of carbon is ωC.
13C relaxation measurementsare performed on a 16.4 T instrument, so ωC is 176 MHz and ωH is700 MHz.Treatment of Rigid-Body vs Internal Motion Contributions.
Properties of globular proteins and amphiphile aggregate systems maybe examined by highlighting contributions of rigid-body (overall) andinternal dynamics on different time scales.34,35,40,80,81 In the context ofprotein relaxation analysis, Ollila et al.80 developed a sophisticatedanalysis of anisotropic diffusion to obtain an effective correlation timefor rigid-body rotational diffusion, which provides the dominantcontribution to correlation functions. Nery et al.35 utilized the two-step82 and three-step models to describe experimental 13C relaxationin spherical and nonspherical micelles. A satisfactory account of thedata was achieved by assuming that the rotational tumbling of themicelle and lateral surfactant diffusion together account for the longcorrelation times in the model. Interestingly, they conclude that thelateral diffusion of the amphiphiles dominates the long correlationtimes in both spherical and nonspherical micelles. Bogusz et al.40
identify complex liquidlike motions of individual amphiphiles within anonionic micelle that are not readily separable and that render a rigidsphere model inadequate. For nonionic amphiphilic bilayers, Ferreiraet al.43 used separation of rigid-body and internal dynamicscontributions to the correlation function along with a novelexperimental scheme to disentangle rigid-body and internal motiontime scales. Klauda et al.81 analyzed the relative contribution ofmotions of individual lipid molecules within a lipid bilayer. Overall,for aggregates such as globular proteins that have restricted internalmotions, rigid-body rotational and translational motions oftendominate the correlation functions. By contrast, surfactant and lipidaggregates have internal diffusive motions of the amphiphiles that maylead to more rapid decay of correlation functions.27,40,81
Our perspective is to work as directly as possible with thecorrelation functions that emerge from direct analysis of the simulatedtrajectories. We do not attempt to separate rigid-body motions frominternal motions, and we do not attempt to separately analyzefluctuations in distances and angles. To that end, we calculatecorrelation functions for all orders of the spherical harmonics and forall distances, and we average these to obtain effective correlationfunctions for use in eqs 3−5. This approach leads to spectral density
functions having less noise, makes no significant difference incalculated relaxation parameters compared with the more rigoroustreatment, and facilitates analysis and discussion.
Calculation of Spectral Density Functions without Fitting to anAnalytic Expression. Correlation functions calculated from MDtrajectories are typically noisy and unsuited for direct conversion tospectral density functions. They are therefore traditionally fit to afunctional form, usually a sum of exponential functions, to generate aparametrized algebraic expression. The resulting correlation functionis then subjected to symbolic Fourier transformation to generate thespectral density function. In this work, for analysis of cross-relaxation,we do not need to assume a functional form for the correlationfunction because of the extensive averaging achieved using the longsimulations. Instead, we calculate the spectral density function byFourier transformation of the correlation functions obtained directlyfrom the simulations.
The critical advantage of this approach is that it does not dependon any assumptions or model of the dynamics. A disadvantage is thatthe lowest frequency available in the resulting spectral densityfunction is limited by the duration of the simulation since ourcorrelation functions do not always fully decay within that time.Without a functional form, we have no basis for extrapolation. Low-frequency motions are especially important for predicting cross-relaxation rates, which are strongly influenced by the (near) zero-frequency spectral density. Our approach allows calculation of a lowerlimit on this low-frequency spectral density, but it does not provide abasis for extrapolation beyond that limit. We are therefore not able tomake numerical estimates of cross-relaxation rates, but based on thelower limits, we are able to draw qualitative conclusions.
Correlation Functions Involving Multiple Unresolvable CouplingPartners. Equations 1 and 2 apply to individual spin pairs, whereasmicelles have numerous spectroscopically indistinguishable nuclei atmany different distances that contribute in an additive manner to themeasured relaxation rates. Even though the effect of dipole−dipolecoupling falls off rapidly with distance (as r−6), there are many spins atlong distances whose cumulative effects are significant.46 For example,consider a smooth isotropic distribution whose closest internucleardistance is rmin. Integrating over all space gives ⟨r−6⟩ = (4π/3)rmin
−3 ,which is longer range in distance by a power of three. Distributions inamphiphile aggregates are not smooth, isotropic, or infinite, but thisshows that distant spins can be important and will play an importantrole in the discussion below.
To account for the long-range contributions in micelles,interactions must be added and averaged appropriately,83 so we usethe following procedure. We consider groups of spins that, within agroup, may be spectroscopically unresolvable. Considering a singlereference spin of group l, we make a list of all spins of another group kthat, at some point along the simulated trajectory, appears within thecutoff distance of 10 Å of the type-l spin. For every k spin soidentified, the correlation function with the reference spin of type l iscomputed using eq 1, including contributions from time steps whenthe distance exceeds the cutoff distance. We then sum all correlationfunctions generated by this list, separating intramolecular andintermolecular correlations. We repeat this process for a definitenumber of spins and then average these correlation functions togenerate an average correlation function for l,k spin pairs. We find thataveraging the results of this procedure over 99 spins of group l gives areasonable compromise of computation time and adequate sampling.
Defining Dynamic Time Scales Using Spectral Density FunctionsInvolving a Single Exponential Correlation Function. Though wecalculate spectral density functions directly from MD trajectories,insights into expected behavior, and some common vocabulary, comefrom consideration of simple models. In particular, the conventionaldistinction between fast and slow motions arises from the singleexponential case. We use this terminology throughout. The modelassumes that the rotational correlation function decays monoexpo-nentially
ikjjjjj
y{zzzzzg
t( ) exp
cτ
τ= −
(7)
Langmuir Article
DOI: 10.1021/acs.langmuir.9b01345Langmuir 2019, 35, 13880−13892
13883
and that the rotational correlation time τc characterizing this functionis the same as the tumbling time of the relaxing molecule or aggregate.In this case, the spectral density function is given by
j( )1
c2
c2ω
τω τ
=+ (8)
(We use lower-case symbols for correlation and spectral densityfunctions to indicate that we drop physical and numeric factors tosimplify notation.)When τc is short so that ωτc ≪1, the process is deemed fast, and
the spectral density is proportional to τc. When τc is long so that ωτc≫1, the process is deemed slow, and the spectral density function isproportional to (ω2τc)
−1. In the following, we use the terms fast andslow in relation to time scales relative to the spectrometer frequency.Small-Angle Neutron Scattering (SANS) Methods. Samples
prepared for small-angle neutron scattering (SANS) contained 4 mMC12E8 or a mixture of 2 mM C12E8 and 2 mM C12E4 in D2O.Additional samples were prepared to ensure that the sample wassufficiently dilute to neglect interactions between particles. All SANSmeasurements were performed on the NGB 10 m beamline at theNIST Center for Neutron Research. Three configurations using 5 or12 Å neutrons were used to access a q range from 0.004 to 0.6 Å−1,which resolves structures from 10 to 1500 Å. The scattering curveswere corrected for background and reduced to absolute scale usingthe standard NIST reduction IGOR macros.84
■ RESULTS AND DISCUSSIONMicelle Shape and Size. To interpret the relaxation
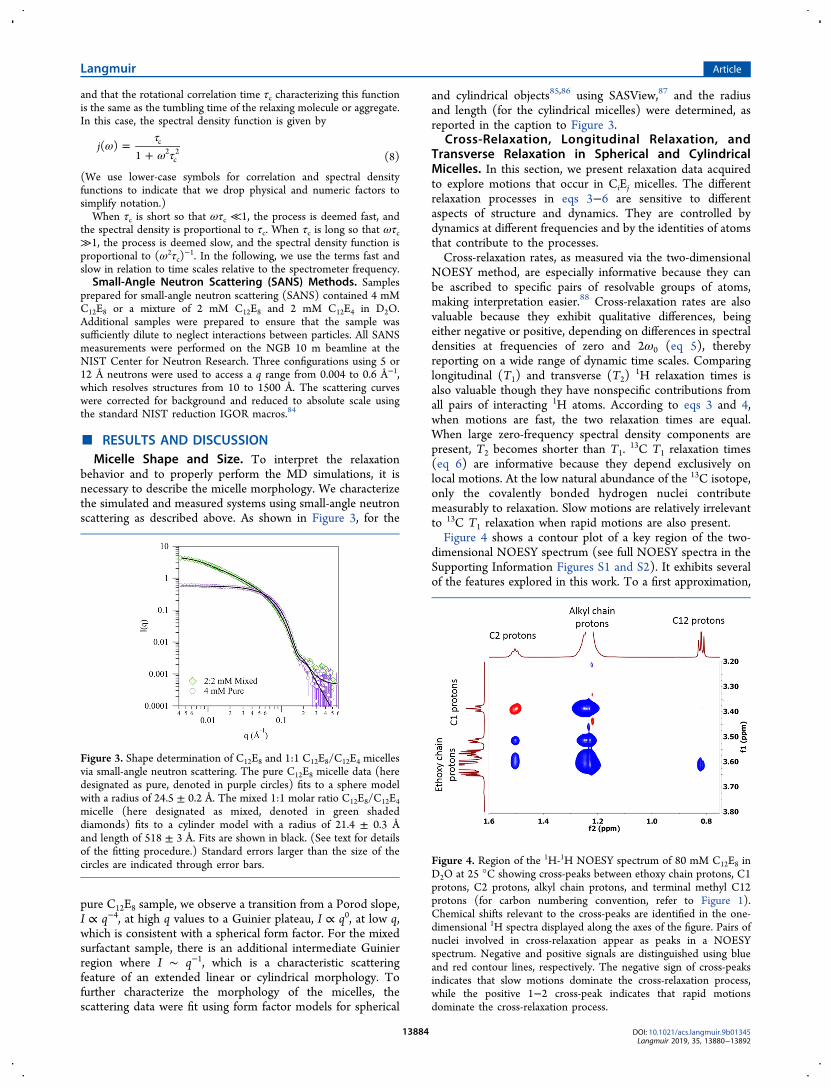
behavior and to properly perform the MD simulations, it isnecessary to describe the micelle morphology. We characterizethe simulated and measured systems using small-angle neutronscattering as described above. As shown in Figure 3, for the
pure C12E8 sample, we observe a transition from a Porod slope,I ∝ q−4, at high q values to a Guinier plateau, I ∝ q0, at low q,which is consistent with a spherical form factor. For the mixedsurfactant sample, there is an additional intermediate Guinierregion where I ∼ q−1, which is a characteristic scatteringfeature of an extended linear or cylindrical morphology. Tofurther characterize the morphology of the micelles, thescattering data were fit using form factor models for spherical
and cylindrical objects85,86 using SASView,87 and the radiusand length (for the cylindrical micelles) were determined, asreported in the caption to Figure 3.
Cross-Relaxation, Longitudinal Relaxation, andTransverse Relaxation in Spherical and CylindricalMicelles. In this section, we present relaxation data acquiredto explore motions that occur in CiEj micelles. The differentrelaxation processes in eqs 3−6 are sensitive to differentaspects of structure and dynamics. They are controlled bydynamics at different frequencies and by the identities of atomsthat contribute to the processes.Cross-relaxation rates, as measured via the two-dimensional
NOESY method, are especially informative because they canbe ascribed to specific pairs of resolvable groups of atoms,making interpretation easier.88 Cross-relaxation rates are alsovaluable because they exhibit qualitative differences, beingeither negative or positive, depending on differences in spectraldensities at frequencies of zero and 2ω0 (eq 5), therebyreporting on a wide range of dynamic time scales. Comparinglongitudinal (T1) and transverse (T2)
1H relaxation times isalso valuable though they have nonspecific contributions fromall pairs of interacting 1H atoms. According to eqs 3 and 4,when motions are fast, the two relaxation times are equal.When large zero-frequency spectral density components arepresent, T2 becomes shorter than T1.
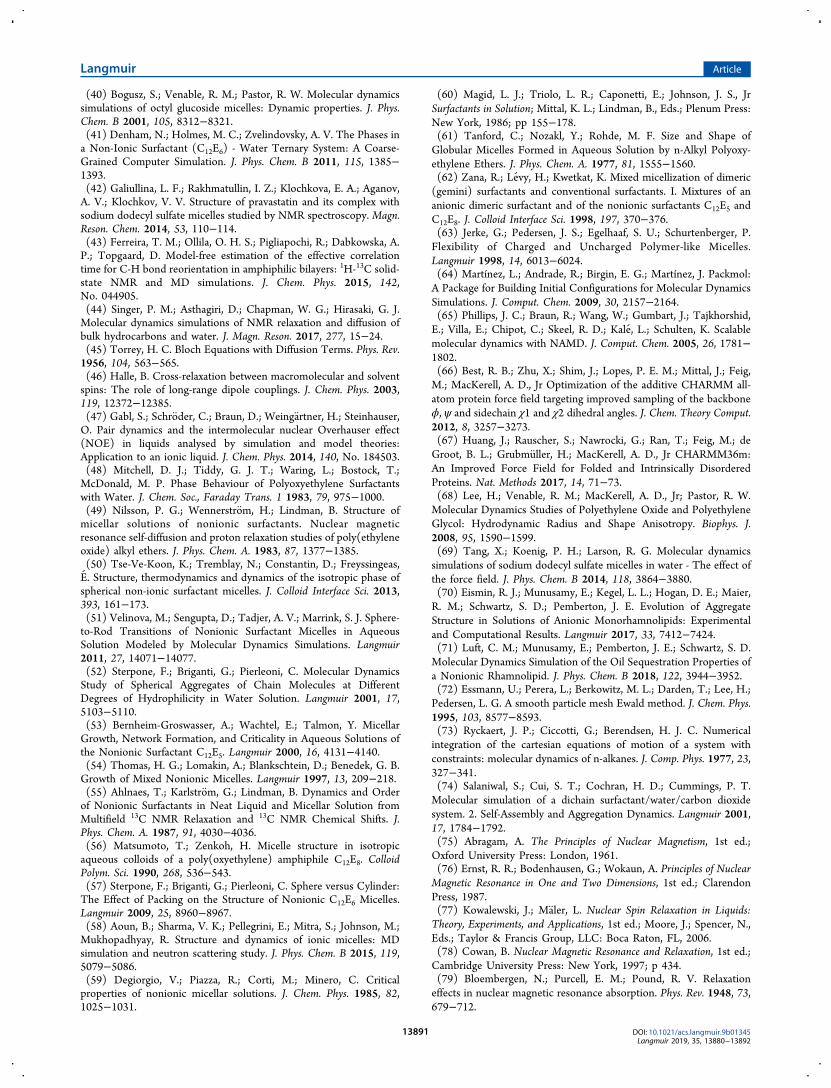
13C T1 relaxation times(eq 6) are informative because they depend exclusively onlocal motions. At the low natural abundance of the 13C isotope,only the covalently bonded hydrogen nuclei contributemeasurably to relaxation. Slow motions are relatively irrelevantto 13C T1 relaxation when rapid motions are also present.Figure 4 shows a contour plot of a key region of the two-
dimensional NOESY spectrum (see full NOESY spectra in theSupporting Information Figures S1 and S2). It exhibits severalof the features explored in this work. To a first approximation,
Figure 3. Shape determination of C12E8 and 1:1 C12E8/C12E4 micellesvia small-angle neutron scattering. The pure C12E8 micelle data (heredesignated as pure, denoted in purple circles) fits to a sphere modelwith a radius of 24.5 ± 0.2 Å. The mixed 1:1 molar ratio C12E8/C12E4micelle (here designated as mixed, denoted in green shadeddiamonds) fits to a cylinder model with a radius of 21.4 ± 0.3 Åand length of 518 ± 3 Å. Fits are shown in black. (See text for detailsof the fitting procedure.) Standard errors larger than the size of thecircles are indicated through error bars. Figure 4. Region of the 1H-1H NOESY spectrum of 80 mM C12E8 in
D2O at 25 °C showing cross-peaks between ethoxy chain protons, C1protons, C2 protons, alkyl chain protons, and terminal methyl C12protons (for carbon numbering convention, refer to Figure 1).Chemical shifts relevant to the cross-peaks are identified in the one-dimensional 1H spectra displayed along the axes of the figure. Pairs ofnuclei involved in cross-relaxation appear as peaks in a NOESYspectrum. Negative and positive signals are distinguished using blueand red contour lines, respectively. The negative sign of cross-peaksindicates that slow motions dominate the cross-relaxation process,while the positive 1−2 cross-peak indicates that rapid motionsdominate the cross-relaxation process.
Langmuir Article
DOI: 10.1021/acs.langmuir.9b01345Langmuir 2019, 35, 13880−13892
13884

signals in NOESY spectra are proportional to signed cross-relaxation rates (eq 5) and to the populations of the coupledspin groups. Negative and positive signals are shown in blueand red, respectively.For the spherical C12E8 micelles, all but one of the cross-
relaxation rates are negative. The important exception is thepeak due to interactions between hydrogen atoms on carbonatoms 1 and 2. According to eq 5, negative or positive cross-relaxation rates correspond to slow and fast modulations,respectively, of the dipole−dipole interactions leading to cross-relaxation. In the case of spherical micelles, cross-relaxationbetween atoms at positions 1 and 2 is dominated by fastmotions, whereas for the cylindrical micelles, the cross-relaxation is dominated by slow motions.Table 1 shows experimental 1H T1 and 1H T2 values for
several signals. In all cases, T1 values are longer than T2 values.
This shows that the correlation functions throughout haveslowly decaying components, leading to significant zero-frequency spectral densities. This contrasts with results forsmall unconstrained molecules without slowly decayingcomponents, where T1 and T2 are typically equal. Startingwith position 2 in the hydrophobic tails, the relaxation timesbecome longer toward the CH3 chain terminus, suggesting thatmotions become faster along the chain in this dimension.Relaxation times at position 1 are longer than at position 2,indicating faster motions at the hydrophobic−hydrophilicinterface of the aggregates. T1 values for spherical andcylindrical micelles are nearly identical for correspondingpositions. This indicates that spectral densities at ω and 2ω arevery similar in the two cases. On the other hand, T2 values inspherical micelles are systematically longer than in cylindricalmicelles at the same positions. This indicates that zero-frequency spectral densities (and therefore slower motions) arerelatively more prevalent in cylindrical vs spherical micelles.Unlike the cross-relaxation data, however, there is no
qualitative difference between T1 and T2 values for atomsnear the surfactant headgroups in spherical vs cylindricalmicelles. 1H T1 and T2 values for a particular nucleus dependon a sum of contributions from all nuclei that interact with thatnucleus. Cross-relaxation, on the other hand, depends only oninteractions between specific pairs of nuclei. In addition,
because the signs of contributions from fast and slow motionsare different, the cross-relaxation rate can differ qualitativelydepending on the dominant time scale of specific internuclearinteractions. Because of this lack of specificity provided by 1HT1 and T2 values, and the fact that differences between T1 andT2 for the two micelle types do not help explain the cross-relaxation rate sign change results, we do not focus oncalculating 1H T1 and T2 values via simulations in this work.Figure 5a,b shows that the sign and intensity of the C1−C2
cross-peak can be systematically manipulated by changing thecomposition or conditions, and consequently the shape, ofC12Ej surfactant aggregates. Figure 5 shows that by adjustingthe composition of the micelles to cause a shape transitionfrom wormlike to spherical, the 1−2 cross-peak changes signfrom negative to positive. Figure 5 shows that for a thermallydriven phase transition from a hexagonal to micellar phase, the1−2 cross-peak also changes sign from negative to positive.89
Table 2 shows measured and simulated 13C T1 relaxationrates for selected resolvable signals in spherical and wormlikeaggregates, indicating very good agreement between theexperimental results and those calculated from simulation.While the TIP3P water model is known to predict lower waterviscosities, this has only a weak effect in calculations involvingsurfactant tail carbons in micelles.40 As water penetration tothe micelle core is low and the contribution of the internalrelaxation dynamics of individual spins dominates over therigid-body rotation for solutes with high internal mobility (e.g.,micelles or lipid bilayers),37,40,80 correlation times of surfactanttails primarily reflect the accuracy of the hydrocarbonparametrization rather than the water model.39,40 As discussedin the Methods, section, slow motion micellar 13C T1 NMRrelaxation dynamics are dominated by internal diffusivemotions,35 which are relatively insensitive to aggregate shape.This leads to a reduction of the effect of the viscosity of thewater model on surfactant tail relaxation values in micelles. Ineither case, both experimental and simulated relaxation timesincrease (relaxation rates decrease) systematically along thealkyl chain, a trend that normally indicates that the mobilityincreases.According to these data, in both the spherical and cylindrical
micelles, the least mobile atoms reside at the boundarybetween hydrophobic and hydrophilic regions of theaggregates. Assuming a single correlation time, and in lightof eq 6, we find correlation times ranging from ∼7 × 10⁻¹² sfor position 1 to ∼1 × 10⁻¹² s for position 12. Thesecorrelation times are liquidlike, in the sense that relaxationmeasurements on neat liquid hydrocarbons of comparable sizegive correlation times of similar magnitudes. The simulatedrelaxation times in Table 2 will be discussed below.
Morphology-Dependent Molecular Packing and Dy-namics Underlie the Behavior of Cross-Relaxation Ratesin Micelles. The emphasis on the analysis of simulated MD inthis report is to address several key features of theseexperimental results. Cross-relaxation rates σ are predom-inately negative. This suggests, via eq 5, that slow motionsusually dominate cross-relaxation. Cross-relaxation involvingpositions 1 and 2 indicates fast motions at the hydrophobic−hydrophilic boundary for spherical micelles, and slow motionsotherwise. 1H T1 and T2 results also support the importance ofslow motions, though somewhat less specifically than theNOESY results. 13C T1 results suggest, via eq 6, that internalmicelle motions occur on fast liquidlike time scales, but theyare the slowest near the hydrophobic−hydrophilic boundary
Table 1. 1H T1 and T2 Values Calculated from Experimenta
spherical spherical cylindrical cylindrical
proton T1 (ms) T2 (ms) T1 (ms) T2 (ms)
E1 625 237 603 89C1 632 96 617 27C2 598 71 603 20C3−C11 718 142 711 32C12 1390 249 1110 119
aProton designation follows the five resolvable 1H peaks and isdenoted by the heavy atom to which it is attached, starting at thecarbon on the ethoxy unit directly adjacent to the alkyl chain (E1).Protons on C1 and C2 are distinguishable, while protons on the mainalkyl chain from carbon 3 to carbon 11 are contained in a single broadpeak. The terminal methyl protons are resolvable and denoted C12.Relaxation rates for 80 mM C12E8 (spherical) micelles and 80 mMtotal surfactant 1:1 molar ratio of C12E8/C12E4 (cylindrical) micelleswere determined on a Bruker 600 MHz (14.1 T) magnet utilizing thet1ir and cpmg pulse sequences. Samples were solvated in D2O.Experimental samples were analyzed at 298 K. Experimental error isless than 10%.
Langmuir Article
DOI: 10.1021/acs.langmuir.9b01345Langmuir 2019, 35, 13880−13892
13885

region of the aggregates. These relaxation results cannot all beexplained using a simple dynamic model, such as that given ineqs 7 and 8, so a detailed exploration of dynamics in light ofthese experimental results is performed.Dynamic Analysis of the C1−C2 Interaction. Figure 6
shows the normalized correlation functions for modulations ofthe dipole−dipole interactions between hydrogen atoms atpositions 1 and 2. These were calculated from the MDsimulations as described above. Intramolecular interactiondynamics appear very similar in the cylindrical and sphericalmicelles, and in both cases the correlation functions decayquickly. Correlation functions for intermolecular interactionshave slow components in both cases, but behave differently inspherical compared with cylindrical micelles. Specifically, theintermolecular correlation function decays more slowly in thecylindrical vs the spherical case.The relative contributions of intermolecular vs intra-
molecular interactions to the total interaction are controlledby the initial values of the correlation functions, G(0)inter and
G(0)intra, respectively. This follows from the properties ofautocorrelation functions where G(0) is the mean-squareamplitude of the correlated function.77,78 IntramolecularG(0)intra values were nearly identical in both micelle systems,while intermolecular G(0)inter values were found to be an orderof magnitude lower. The plots of the correlation functionsshow that the motions must be described using a wide range oftime scales. In the absence of an analytical formula thatdescribes these correlation functions, we cannot parametrizethe results to obtain analytical expressions for the spectraldensity functions. However, using long simulations and
Figure 5. Illustration of the relation between micelle morphology and NOESY cross-peak signs. (a): NOESY cross-peaks among ethoxy chainprotons, protons at positions 1 and 2, and unresolvable protons within the alkyl chains as a function of composition at 25 °C. Compositions shownare molar ratios of (i) 1:1, (ii) 2:1, (iii) 3:1, and (iv) 1:0 C12E8/C12E4. Total surfactant concentration is 80 mM in D2O. (b) NOESY cross-peaksamong ethoxy chain protons, protons at positions 1 and 2, and unresolvable protons within the alkyl chains as a function of temperature for 50%wt/wt C12E6 in D2O. (i) is at 25 °C, (ii) is at 35 °C, (iii) is at 40 °C, and (iv) is at 45 °C.
Table 2. 13C T1 Values Calculated from Experiment andSimulationa
spherical spherical cylindrical cylindrical
carbonT1 (s)
experimentT1 (s)
simulationT1 (s)
experimentT1 (s)
simulation
C1 0.65 0.60 0.67 0.55C2 0.74 0.64 0.76 0.61C3 0.72 0.74 0.77 0.73C11 1.74 1.64 1.91 1.98C12 2.85 2.47 2.88 2.56
aRelaxation rates for 80 mM C12E8 (spherical) micelles and 80 mMtotal surfactant 1:1 molar ratio of C12E8/C12E4 (cylindrical) micelleswere determined on a Bruker 700 MHz (16.4 T) magnet utilizing theinversion-recovery method at 298 K in a D2O solvent. Simulationswere performed at 300 K. See text for details of calculations.Experimental and simulation errors are less than 10%.
Figure 6. Normalized correlation functions G(τ)/G(0) for dipole−dipole interactions between protons located on carbons 1 and 2.Spherical micelles are shown in red, and cylindrical micelles are shownin blue. Main figure: correlation functions for intermolecularinteractions. Inset: correlation functions for intramolecular inter-actions. Note the difference in the x-axis scale, which emphasizes thatintermolecular interactions decay relatively slowly compared withintramolecular interactions. In addition, intermolecular interactionsdecay much more slowly for cylindrical vs spherical micelles,consistent with differences in spectral density functions suggestedby cross-relaxation rates.
Langmuir Article
DOI: 10.1021/acs.langmuir.9b01345Langmuir 2019, 35, 13880−13892
13886

extensive averaging, it is possible to calculate spectral densityfunctions by direct Fourier transformation of the correlationfunctions as described above.Figure 7 shows the resulting spectral density functions for
hydrogen atoms at positions 1 and 2, corresponding to the
NOESY cross-peak that changes sign in Figure 5a,b. Thecorrelation functions were normalized prior to Fouriertransformation. Normalization highlights differences in theshapes of the spectral density functions. Non-normalizedspectral density functions (Figure 7 inset) account, in addition,for the differences in G(0) magnitudes of the two interactions.Differences in the behavior of cylindrical vs spherical micellesare apparent from these functions, especially at lowfrequencies. The spectral density for intermolecular inter-actions is higher for cylindrical than for spherical micelles inthe low-frequency region. We cannot extrapolate these curvesto frequencies close to zero because we do not have an analyticfunctional form. Nevertheless, we can conclude that thecylindrical micelle experiences relatively slower modulation ofintermolecular 1−2 dipole−dipole interactions. For theintramolecular interactions, the two spectral density functionslargely overlap except at a single point at the lowest frequency.This indicates that the correlation function does not decay tozero during the duration of the simulation. Though thisresidual correlation is not visible to the eye (Figure 6), directaveraging of the tail of the correlation function supports itspresence. It follows that the small residual correlation in thecorrelation function may make an important contribution tothe low-frequency spectral density and to the negative cross-relaxation rate observed in cylindrical but not sphericalmicelles.Dynamic Analysis of Directly Bonded 1H−13C Interac-
tions. For 13C longitudinal relaxation, extraction of spectraldensity functions leads to the predicted relaxation times listedin Table 2. For this case, we do not need to extrapolate to timescales outside the range directly sampled by the simulations, soit is possible to calculate relaxation rates quantitatively by usinga parametrized fitting function that enables smoothing and
interpolation. Without implying a mechanistic dynamic model,we describe the correlation functions as sums of fourexponential functions. For each exponential component, weinclude a term aiτc,i/(1 + ω2τc,i
2 ) in the spectral densityfunctions, where ai is the intensity of component i, τc,i is thecorrelation time for component i, and ω refers to theappropriate frequency or sum or difference of frequencies.Using the resulting spectral density functions in eq 6 gives therelaxation times listed in Table 1. Calculated relaxation timesare similar for both cylindrical and spherical cases and agreewell with the experiment. Taken together, the cross-relaxationand carbon relaxation results indicate that the MD simulations,interpreted without a dynamic model, are consistent with theexperiment. In particular, the quantitative agreement ofpredicted and measured 13C T1 values gives confidence thatthe MD simulations are successfully modeling importantaspects of the internal dynamics of the micelles.
Effects of Micelle Morphology on Distances andDynamics. Different micelle morphologies lead to differentpacking constraints and corresponding differences in dynamics.To explore the packing constraints, Figure 8 shows thenumbers of 1−1 spin pairs vs distance for spherical andcylindrical micelles. This gives a measure of the packingdensity of headgroups in the boundary region of the micelle.The number of spins grows more slowly with spherical micellescompared with cylindrical micelles, showing that the surfacedensity and the total number of coupling partners are smallerin spherical compared with cylindrical micelles. This differencein density is evident even within local (<4.5 Å) distances,emphasizing the additive effects of interacting spins within afluid.46
One common way to characterize aggregate shape withsurfactant structure is by the packing parameter N = v/(a × l).This relates micelle morphology to the volume v per surfactantmolecule in the aggregate, the radius l of the aggregate core,and the area a of the headgroup.2,3 For idealized shapes, thisdimensionless parameter, as a direct consequence of geometry,increases in the progression from spherical (N = 0.33) tocylindrical (N = 0.5) to planar (N = 1) structures. Since C12E4has smaller polar headgroups compared with C12E8, theconversion from spherical to cylindrical shape likely is due to areduction in a, and this is likely to influence the internucleardistances and dynamics near the hydrophobic−hydrophilicboundary where positions 1 and 2 predominantly reside.From this simple perspective, it might be expected that the
distance distribution among headgroup atoms should berelatable to these geometric descriptors. However, the distancedistributions cannot be easily analyzed by assuming that theatoms reside in a thin shell on the surface of a sphere orcylinder because the micelles are not adequately approximatedby these shapes and because the position 1 hydrogen atoms donot reside in a thin enough shell.Nevertheless, it is possible to use the distance distributions
to characterize micelle morphology and packing density morefully. Figure 8 shows a graph of the logarithm of the number ofatoms vs the logarithm of the distance. Such plots should havea slope equal to d − 1, where d is the dimension of the objecton the scale indicated by the horizontal axis. An idealizedcylindrical shell having a uniform distribution and thickness,for example, would have dimension 3 at distances less than thethickness of the shell. This dimension would decrease to 2when the distance exceeds the width of the shell but remainsless than the radius of the cylinder, and it would decrease
Figure 7. Spectral density functions from the Fourier transformationof correlation functions for dipole−dipole interactions betweenprotons located on carbons 1 and 2. Main figure: normalizedcorrelation functions G(τ)/G(0); inset: non-normalized correlationfunctions G(τ) multiplied by KIS. Intramolecular spectral densities forspherical micelles are shown in red, and cylindrical micelles are shownin blue. Intermolecular spectral densities for spherical micelles areshown in magenta, and cylindrical micelles are shown in cyan. Ourprocedure does not allow extrapolation to zero frequency, so the low-frequency values represent lower limits on the zero-frequency spectraldensities.
Langmuir Article
DOI: 10.1021/acs.langmuir.9b01345Langmuir 2019, 35, 13880−13892
13887

further to 1 when the distance is larger than the radius but lessthan the length of the cylinder. Finally, the dimension woulddecrease to zero once the distance exceeds the length of thecylinder.At distances between about 4.5 and 15 Å, which spans a
range that is larger than the methylene groups but smaller thanthe average radii of the aggregates, both curves in Figure 8inset are roughly linear and have slopes approximating 1.25,indicating a dimension d ≃ 2.25. This is indicated by the slopeof the black line included for reference. A nonintegerdimension somewhat greater than 2 is related to the thicknessof the distribution of hydrogen atoms bound to carbon 1 inthese aggregates. It is also noteworthy that the curves forspherical and cylindrical micelles are parallel, but thecylindrical micelle curve is displaced upward. This indicatesagain that the density of type 1 hydrogen atoms is higher in thecylindrical compared with that in the spherical micelles, eventhough the dimensionality of the region is similar.Prevalence of Negative Cross-Relaxation Signals in
NOESY Spectra. As described above and shown in Figure 4,
nearly all of the cross-relaxation rates observed in the NOESYspectra have negative signs, indicating that the zero-frequencyspectral density components in eq 5 usually dominate cross-relaxation. We investigate the origin of this by analyzing theMD simulations. We find that the slow motions thataccompany this effect are due to large numbers of long-rangeinteractions and that the correlation functions for long-rangeinteractions decay slowly as a consequence of the relativelylong distances involved.Figure 9 shows that even the hydrogen atoms at position 12,
which are expected to be among the most mobile atoms in the
micelles, exhibit net negative cross-relaxation rates with thebulk of the alkyl chain hydrogen atoms. We expect slowermodulations of internuclear vectors for most other pairs ofatoms and correspondingly more negative cross-relaxationrates. We therefore consider the dynamics of internuclearvectors involving position 12 in detail as a limiting case. Figure10 shows spectral density functions derived from the MDsimulations that involve hydrogen atoms at position 12. Weseparately calculate intramolecular and intermolecular spectraldensity functions because they are subject to very differentgeometric constraints and therefore exhibit very differentrelative motions. Because the different classes of interactingatoms are not distinguished spectroscopically, the measuredcross-relaxation rates result from a weighted sum of the twotypes of interactions.The red and orange curves in Figure 10 characterize
modulation of the intramolecular and intermolecular vectorsjoining positions 12 and 11. For the intramolecular vector, thecorrelation function decays very quickly, so that the spectraldensity function is liquidlike, having low intensity at lowfrequencies. Hence, intramolecular interactions on adjacentpositions do not contribute to the negative sign of the cross-relaxation rates. The intermolecular correlation function, onthe other hand, decays much more slowly. Although we cannotextrapolate the spectral density function to near-zero frequencybecause of the finite duration of the simulation, it is apparentthat the low-frequency spectral density function is large for the
Figure 8. (a) Histogram of intermolecular C1 proton counts as afunction of radius. The bin width is 0.1 Å. The red curve correspondsto the spherical micelle, and the blue curve corresponds to thecylindrical micelle. Error bars are shown in black. Inset: close-up ofthe radius region from 1.5 to 5 Å. Each line corresponds to averagestaken over five separate 1.4 ns sections of trajectory for 99 surfactantmolecules. For the spherical micelle, this encompasses all surfactantmolecules within the micelle. For the cylindrical micelle, thisencompasses 99 C12E8 molecules and 99 C12E4 molecules separately.(b) Histograms displayed on a log−log plot, using the same colorcode as in (a), with a reference line of slope 1.25 shown in black.
Figure 9. Region of the 1H-1H NOESY spectrum of 80 mM C12E8 inD2O at 25 °C showing cross-peaks between terminal methyl C12protons, central alkyl chain protons C3−C11, and C2 protons (forcarbon numbering convention, refer to Figure 1). Chemical shiftsrelevant to the cross-peaks are identified in the one-dimensional 1Hspectra displayed along the axes. Diagonal peaks and negative cross-peaks are indicated using blue contours, and red is used for positivecontours. Note that all of the cross-peaks are negative.
Langmuir Article
DOI: 10.1021/acs.langmuir.9b01345Langmuir 2019, 35, 13880−13892
13888

intermolecular interaction. This suggests that the intermolec-ular interactions lead to a negative cross-relaxation rate.The blue and purple curves in Figure 10 characterize
modulation of the intramolecular and intermolecular vectorsjoining more distant positions, namely, 12 and 10. Comparedwith the correlation functions for the 12−11 interaction, the12−10 correlation functions decay even more slowly. Thisleads to even larger low-frequency contributions to the spectraldensity functions and therefore to more negative cross-relaxation rates. As expected from simple geometric consid-erations, as the distance between atoms is larger, the relativecontribution of slow motions to the correlation functionincreases. When atoms are constrained to reside at longdistances, or when they are free to sample predominantly largedistances within the aggregate, they are likely to exhibitnegative cross-relaxation rates.
■ SUMMARY AND CONCLUSIONSNMR relaxation measurements and atomistic MD simulationsprovide insights into the structure and dynamics of sphericaland cylindrical micelles formed by pure and mixed nonionicalkyl ethoxylate surfactants. NMR relaxation results indicaterich internal dynamics with motions occurring over a widerange of time scales. 13C longitudinal relaxation times implythe presence of liquidlike local motions, while two-dimensionalcross-relaxation measurements, as indicated by predominantlynegative cross-relaxation rates, imply the simultaneouspresence of slow motions. In spherical micelles, but not incylindrical micelles, the cross-relaxation rate linking hydrogenatoms in alkane positions 1 and 2, located near thehydrophilic−hydrophobic boundary, is positive. This impliesa relative absence of slow motions in the boundary region ofspherical micelles. MD simulations are used to constructcorrelation functions, spectral density functions, and positionaldistribution functions that rationalize the experimental results.These functions are calculated directly from the simulations,without fitting to any assumed functional form. Resultsindicate that relative motions of nearby atoms are liquidlike,
in agreement with 13C T1 measurements, though constrainedby micelle morphology. Relative motions of distant atoms haveslower components because the relative changes in distancesand angles are smaller when the moving atoms are furtherapart. The slow, long-range motions appear to be responsiblefor the predominantly negative cross-relaxation rates observedin NOESY spectra. The densities of atoms from positions 1and 2 in the boundary region are lower in spherical micellescompared with cylindrical micelles. Correspondingly, motionsin this region are less constrained by micelle morphology in thespherical compared with the cylindrical cases. The two effectsof morphology lead to the unusual occurrence of positivecross-relaxation involving positions 1 and 2 for spheres.
■ ASSOCIATED CONTENT
*S Supporting InformationThe Supporting Information is available free of charge on theACS Publications website at DOI: 10.1021/acs.lang-muir.9b01345.
1H-1H NOESY spectrum of 80 mM C12E8 in D2O at 25°C; 1H-1H NOESY spectrum of equimolar mixture of 40mM C12E8 40 mM C12E4 in D2O at 25°C (PDF)
■ AUTHOR INFORMATION
Corresponding Authors*E-mail: [email protected]. Phone: +1 (513) 556-3049. Fax:+1 (513) 556-9239 (G.S.).*E-mail: [email protected]. Phone: +1 (513) 526-9388(C.D.E.).
ORCIDGeorge Stan: 0000-0003-1880-4173Present Address∥Discovery, Product Development Supply, Janssen Research &Development, Spring House, Pennsylvania 19477, UnitedStates (A.J.).
NotesThe authors declare no competing financial interest.
■ ACKNOWLEDGMENTS
The authors thank Rafael Bruschweiler, Rich Pastor, PeterKoenig, and David Eike for insightful discussion. This work hasbeen supported in part by the National Science Foundation(NSF) grant MCB-1516918 to G.S. This work used resourcesof the Oak Ridge Leadership Computing Facility, which is aDOE Office of Science User Facility supported under ContractDE-AC05-00OR22725 through Project CHP105 to A.T.E.Portions of this work benefited from and provided support tothe NIST nSoft consortium (www.nist.gov/nsoft), includinguse of the 10 m Small Angle Neutron Scattering instrument atthe NCNR. This work benefited from the use of the SasViewapplication, originally developed under NSF Award DMR-0520547. SasView also contains a code developed with fundingfrom the EU Horizon 2020 program under the SINE2020project Grant no. 654000. Commercial products identified inthis manuscript are included for the purpose of including acomplete and accurate description of the methods andmaterials used in this work and are not an endorsement bythe National Institute of Standards and Technology.
Figure 10. Normalized spectral density functions for intramolecularand intermolecular dipolar interactions involving protons at position12. For 11−12, intramolecular interactions are indicated with red, andintermolecular interactions are indicated with orange. For 10−12,intramolecular interactions are indicated with blue, and intermolec-ular interactions are indicated with purple. ω0 denotes the Larmorfrequency. Inset: corresponding normalized correlation functions. Thelarge, low-frequency components are responsible for predominantlynegative cross-relaxation rates observed experimentally.
Langmuir Article
DOI: 10.1021/acs.langmuir.9b01345Langmuir 2019, 35, 13880−13892
13889

■ REFERENCES(1) Laughlin, R. G. The Aqueous Phase Behavior of Surfactants, 1sted.; Academic Press, Inc.: San Diego, 1994.(2) Israelachvili, J. N. Intermolecular and Surface Forces, 3rd ed.;Elsevier Inc.: New York, 2011.(3) Holmberg, K.; Jonsson, B.; Kronberg, B.; Lindman, B. Surfactantsand Polymers in Aqueous Solution, 2nd ed.; John Wiley & Sons:Norfolk, U.K., 2007.(4) Terron-Mejia Ketzasmin, A.; Lopez-Rendon, R.; Goicochea, A.G. Desorption of hydrocarbon chains by association with ionic andnonionic surfactants under flow as a mechanism for enhanced oilrecovery. Sci. Rep. 2017, 7, No. 9586.(5) Kuramochi, H.; Andoh, Y.; Yoshii, N.; Okazaki, S. All-AtomMolecular Dynamics Study of a Spherical Micelle Composed of N-Acetylated Poly (ethylene glycol)-Poly (γ-benzyl L -glutamate ) BlockCopolymers: A Potential Carrier of Drug Delivery Systems forCancer. J. Phys. Chem. B 2009, 113, 15181−15188.(6) Callari, M.; DeSouza, P. L.; Rawal, A.; Stenzel, M. H. The Effectof Drug Loading on Micelle Properties: Solid-State NMR as a Tool toGain Structural Insight. Angew. Chem., Int. Ed. 2017, 56, 8441−8445.(7) Cates, M. E.; Candau, S. J. Statics and dynamics of worm-likesurfactant micelles. J. Phys.: Condens. Matter 1990, 2, 6869−6892.(8) Berret, J.-F.; Appell, J.; Porte, G. Linear Rheology of EntangledWormlike Micelles. Langmuir 1993, 9, 2851−2854.(9) Lin, Z.; Eads, C. D. Polymer-Induced Structural Transitions inOleate Solutions: Microscopy, Rheology, and Nuclear MagneticResonance Studies. Langmuir 1997, 13, 2647−2654.(10) Einaga, Y. Wormlike Micelles of Polyoxyethylene Alkyl EthersCiEj. Polym. J. 2009, 41, 157−173.(11) Osei-Bonsu, K.; Shokri, N.; Grassia, P. Foam stability in thepresence and absence of hydrocarbons: From bubble- to bulk-scale.Colloids Surf., A 2015, 481, 514−526.(12) Tang, X.; Zou, W.; Koenig, P. H.; McConaughy, S. D.; Weaver,M. R.; Eike, D. M.; Schmidt, M. J.; Larson, R. G. Multiscale Modelingof the Effects of Salt and Perfume Raw Materials on the RheologicalProperties of Commercial Threadlike Micellar Solutions. J. Phys.Chem. B 2017, 121, 2468−2485.(13) Penfold, J.; Tucker, I.; Green, A.; Grainger, D.; Jones, C.; Ford,G.; Roberts, C.; Hubbard, J.; Petkov, J.; Thomas, R. K.; Grillo, I.Impact of Model Perfumes on Surfactant and Mixed Surfactant Self-Assembly. Langmuir 2008, 24, 12209−12220.(14) Bradbury, R.; Penfold, J.; Thomas, R. K.; Tucker, I. M.; Petkov,J. T.; Jones, C.; Grillo, I. Impact of Model Perfume Molecules on theSelf-Assembly of Anionic Surfactant Sodium Dodecyl 6-BenzeneSulfonate. Langmuir 2013, 29, 3234−3245.(15) Fischer, E.; Fieber, W.; Navarro, C.; Sommer, H.; Benczedi, D.;Velazco, M. I.; Schonhoff, M. Partitioning and Localization ofFragrances in Surfactant Mixed Micelles. J. Surfactants Deterg. 2009,12, 73−84.(16) Rangel-Yagui, C. O.; Pessoa, A., Jr; Tavares, L. C. Micellarsolubilization of drugs. J. Pharm. Pharm. Sci. 2005, 8, 147−163.(17) Kunieda, H.; Ozawa, K.; Huang, K.-L. Effect of Oil on theSurfactant Molecular Curvatures in Liquid Crystals. J. Phys. Chem. B1998, 102, 831−838.(18) Liu, Q.; Ji, X.; Wang, S.; Zou, W.; Li, J.; Lv, D.; Yin, B.; Yan, H.;Wei, X. Effect of Additives on Surfactant Micelle Shape Trans-formation: Rheology and Molecular Dynamics Studies. J. Phys. Chem.C 2019, 123, 2922−2932.(19) Kaizu, K.; Alexandridis, P. Glucose-induced sphere to ellipsoidtransition of polyoxyethylene - polyoxypropylene block copolymermicelles in aqueous solutions. Colloids Surf., A 2015, 480, 203−213.(20) Yoshii, N.; Nimura, Y.; Fujimoto, K.; Okazaki, S. Sphericalharmonics analysis of surface density fluctuations of spherical ionicSDS and nonionic C12E8 micelles: A molecular dynamics study. J.Chem. Phys. 2017, 147, No. 034906.(21) Yuan, F.; Wang, S.; Larson, R. G. Potentials of mean force andescape times of surfactants from micelles and hydrophobic surfacesusing molecular dynamics simulations. Langmuir 2015, 31, 1336−1343.
(22) Braun, D.; Steinhauser, O. The intermolecular NOE is stronglyinfluenced by dynamics. Phys. Chem. Chem. Phys. 2015, 17, 8509−8517.(23) Gujt, J.; Bester-Rogac, M.; Spohr, E. Structure and Stability ofLong Rod-like Dodecyltrimethylammonium Chloride Micelles inSolutions of Hydroxybenzoates: A Molecular Dynamics SimulationStudy. Langmuir 2016, 32, 8275−8286.(24) Ferreira, T. M.; Medronho, B.; Martin, R. W.; Topgaard, D.Segmental order parameters in a nonionic surfactant lamellar phasestudied with 1H-13C solid-state NMR. Phys. Chem. Chem. Phys. 2008,10, 6033−6038.(25) Padia, F. N.; Yaseen, M.; Gore, B.; Rogers, S.; Bell, G.; Lu, J. R.Influence of Molecular Structure on the Size, Shape, andNanostructure of Nonionic CnEm Surfactant Micelles. J. Phys. Chem.B 2014, 118, 179−188.(26) Dixon, A. M.; Venable, R. M.; Pastor, R. W.; Bull, T. E. Micelle-bound conformation of a hairpin-forming peptide: Combined NMRand molecular dynamics study. Biopolymers 2002, 65, 284−298.(27) Shintani, M.; Yoshida, K.; Sakuraba, S.; Nakahara, M.;Matubayasi, N. NMR-NOE and MD Simulation Study onPhospholipid Membranes: Dependence on Membrane Diameterand Multiple Time Scale Dynamics. J. Phys. Chem. B 2011, 115,9106−9115.(28) Cao, C.; Mao, J.; Li, F.; Yang, M.; He, H.; Jiang, L.; Liu, M.Understanding the Interaction between Valsartan and Detergents byNMR Techniques and Molecular Dynamics Simulation. J. Phys. Chem.B 2012, 116, 7470−7478.(29) Ferreira, T. M.; Topgaard, D.; Ollila, O. H. S. MolecularConformation and Bilayer Pores in a Nonionic Surfactant LamellarPhase Studied with 1H-13C Solid-State NMR and MolecularDynamics Simulations. Langmuir 2014, 30, 461−469.(30) Kimmich, R.; Fatkullin, N. Self-diffusion studies by intra- andinter-molecular spin-lattice relaxometry using field-cycling: Liquids,plastic crystals, porous media, and polymer segments. Prog. Nucl.Magn. Reson. Spectrosc. 2017, 101, 18−50.(31) Wachowicz, M.; Jurga, S.; Vilfan, M. Collective and localmolecular dynamics in the lyotropic mesophases of decylammoniumchloride: 1H and 2H NMR study. Phys. Rev. E 2004, 70, No. 031701.(32) Yang, Q.; Zhou, Q.; Somasundaran, P. Mixed micelles ofoctane-1,8 bis(dodecyl dimethyl ammonium chloride) and n-dodecyl-β-d-maltoside by 1H NMR study. Colloids Surf., A 2007, 305, 22−28.(33) Peter, C.; Daura, X.; Gunsteren, W. F. Calculation of NMR-relaxation parameters for exible molecules from molecular dynamicssimulations. J. Biomol. NMR 2001, 20, 297−310.(34) Wennerstroem, H.; Lindman, B.; Soderman, O.; Drakenberg,T.; Rosenholm, J. B. 13C Magnetic Relaxation in Micellar Solutions.Influence of Aggregate Motion on T1. J. Am. Chem. Soc. 1979, 101,6860−6864.(35) Nery, H.; Soderman, O.; Canet, D.; Walderhaug, H.; Lindman,B. Surfactant dynamics in spherical and nonspherical micelles. Anuclear magnetic resonance study. J. Phys. Chem. A. 1986, 90, 5802−5808.(36) Ribeiro, A. A.; Dennis, E. A. A Carbon-13 and Proton NuclearMagnetic Resonance Study on the Structure and Mobility ofNonionic Alkyl Polyoxyethylene Ether Micelles. J. Phys. Chem. A.1977, 81, 957−963.(37) Bruschweiler, R.; Case, D. A. Characterization of biomolecularstructure and dynamics by NMR cross relaxation. Prog. Nucl. Magn.Reson. Spectrosc. 1994, 26, 27−58.(38) MacKerell, A. D., Jr Molecular Dynamics Simulation Analysis ofa Sodium Dodecyl Sulfate Micelle in Aqueous Solution: DecreasedFluidity of the Micelle Hydrocarbon Interior. J. Phys. Chem. A. 1995,99, 1846−1855.(39) Tieleman, D. P.; van der Spoel, D.; Berendsen, H. J. C.Molecular Dynamics Simulations of Dodecylphosphocholine Micellesat Three Different Aggregate Sizes: Micellar Structure and ChainRelaxation. J. Phys. Chem. B 2000, 104, 6380−6388.
Langmuir Article
DOI: 10.1021/acs.langmuir.9b01345Langmuir 2019, 35, 13880−13892
13890
(40) Bogusz, S.; Venable, R. M.; Pastor, R. W. Molecular dynamicssimulations of octyl glucoside micelles: Dynamic properties. J. Phys.Chem. B 2001, 105, 8312−8321.(41) Denham, N.; Holmes, M. C.; Zvelindovsky, A. V. The Phases ina Non-Ionic Surfactant (C12E6) - Water Ternary System: A Coarse-Grained Computer Simulation. J. Phys. Chem. B 2011, 115, 1385−1393.(42) Galiullina, L. F.; Rakhmatullin, I. Z.; Klochkova, E. A.; Aganov,A. V.; Klochkov, V. V. Structure of pravastatin and its complex withsodium dodecyl sulfate micelles studied by NMR spectroscopy. Magn.Reson. Chem. 2014, 53, 110−114.(43) Ferreira, T. M.; Ollila, O. H. S.; Pigliapochi, R.; Dabkowska, A.P.; Topgaard, D. Model-free estimation of the effective correlationtime for C-H bond reorientation in amphiphilic bilayers: 1H-13C solid-state NMR and MD simulations. J. Chem. Phys. 2015, 142,No. 044905.(44) Singer, P. M.; Asthagiri, D.; Chapman, W. G.; Hirasaki, G. J.Molecular dynamics simulations of NMR relaxation and diffusion ofbulk hydrocarbons and water. J. Magn. Reson. 2017, 277, 15−24.(45) Torrey, H. C. Bloch Equations with Diffusion Terms. Phys. Rev.1956, 104, 563−565.(46) Halle, B. Cross-relaxation between macromolecular and solventspins: The role of long-range dipole couplings. J. Chem. Phys. 2003,119, 12372−12385.(47) Gabl, S.; Schroder, C.; Braun, D.; Weingartner, H.; Steinhauser,O. Pair dynamics and the intermolecular nuclear Overhauser effect(NOE) in liquids analysed by simulation and model theories:Application to an ionic liquid. J. Chem. Phys. 2014, 140, No. 184503.(48) Mitchell, D. J.; Tiddy, G. J. T.; Waring, L.; Bostock, T.;McDonald, M. P. Phase Behaviour of Polyoxyethylene Surfactantswith Water. J. Chem. Soc., Faraday Trans. 1 1983, 79, 975−1000.(49) Nilsson, P. G.; Wennerstrom, H.; Lindman, B. Structure ofmicellar solutions of nonionic surfactants. Nuclear magneticresonance self-diffusion and proton relaxation studies of poly(ethyleneoxide) alkyl ethers. J. Phys. Chem. A. 1983, 87, 1377−1385.(50) Tse-Ve-Koon, K.; Tremblay, N.; Constantin, D.; Freyssingeas,E. Structure, thermodynamics and dynamics of the isotropic phase ofspherical non-ionic surfactant micelles. J. Colloid Interface Sci. 2013,393, 161−173.(51) Velinova, M.; Sengupta, D.; Tadjer, A. V.; Marrink, S. J. Sphere-to-Rod Transitions of Nonionic Surfactant Micelles in AqueousSolution Modeled by Molecular Dynamics Simulations. Langmuir2011, 27, 14071−14077.(52) Sterpone, F.; Briganti, G.; Pierleoni, C. Molecular DynamicsStudy of Spherical Aggregates of Chain Molecules at DifferentDegrees of Hydrophilicity in Water Solution. Langmuir 2001, 17,5103−5110.(53) Bernheim-Groswasser, A.; Wachtel, E.; Talmon, Y. MicellarGrowth, Network Formation, and Criticality in Aqueous Solutions ofthe Nonionic Surfactant C12E5. Langmuir 2000, 16, 4131−4140.(54) Thomas, H. G.; Lomakin, A.; Blankschtein, D.; Benedek, G. B.Growth of Mixed Nonionic Micelles. Langmuir 1997, 13, 209−218.(55) Ahlnaes, T.; Karlstrom, G.; Lindman, B. Dynamics and Orderof Nonionic Surfactants in Neat Liquid and Micellar Solution fromMultifield 13C NMR Relaxation and 13C NMR Chemical Shifts. J.Phys. Chem. A. 1987, 91, 4030−4036.(56) Matsumoto, T.; Zenkoh, H. Micelle structure in isotropicaqueous colloids of a poly(oxyethylene) amphiphile C12E8. ColloidPolym. Sci. 1990, 268, 536−543.(57) Sterpone, F.; Briganti, G.; Pierleoni, C. Sphere versus Cylinder:The Effect of Packing on the Structure of Nonionic C12E6 Micelles.Langmuir 2009, 25, 8960−8967.(58) Aoun, B.; Sharma, V. K.; Pellegrini, E.; Mitra, S.; Johnson, M.;Mukhopadhyay, R. Structure and dynamics of ionic micelles: MDsimulation and neutron scattering study. J. Phys. Chem. B 2015, 119,5079−5086.(59) Degiorgio, V.; Piazza, R.; Corti, M.; Minero, C. Criticalproperties of nonionic micellar solutions. J. Chem. Phys. 1985, 82,1025−1031.
(60) Magid, L. J.; Triolo, L. R.; Caponetti, E.; Johnson, J. S., JrSurfactants in Solution; Mittal, K. L.; Lindman, B., Eds.; Plenum Press:New York, 1986; pp 155−178.(61) Tanford, C.; Nozakl, Y.; Rohde, M. F. Size and Shape ofGlobular Micelles Formed in Aqueous Solution by n-Alkyl Polyoxy-ethylene Ethers. J. Phys. Chem. A. 1977, 81, 1555−1560.(62) Zana, R.; Levy, H.; Kwetkat, K. Mixed micellization of dimeric(gemini) surfactants and conventional surfactants. I. Mixtures of ananionic dimeric surfactant and of the nonionic surfactants C12E5 andC12E8. J. Colloid Interface Sci. 1998, 197, 370−376.(63) Jerke, G.; Pedersen, J. S.; Egelhaaf, S. U.; Schurtenberger, P.Flexibility of Charged and Uncharged Polymer-like Micelles.Langmuir 1998, 14, 6013−6024.(64) Martínez, L.; Andrade, R.; Birgin, E. G.; Martínez, J. Packmol:A Package for Building Initial Configurations for Molecular DynamicsSimulations. J. Comput. Chem. 2009, 30, 2157−2164.(65) Phillips, J. C.; Braun, R.; Wang, W.; Gumbart, J.; Tajkhorshid,E.; Villa, E.; Chipot, C.; Skeel, R. D.; Kale, L.; Schulten, K. Scalablemolecular dynamics with NAMD. J. Comput. Chem. 2005, 26, 1781−1802.(66) Best, R. B.; Zhu, X.; Shim, J.; Lopes, P. E. M.; Mittal, J.; Feig,M.; MacKerell, A. D., Jr Optimization of the additive CHARMM all-atom protein force field targeting improved sampling of the backboneϕ, ψ and sidechain χ1 and χ2 dihedral angles. J. Chem. Theory Comput.2012, 8, 3257−3273.(67) Huang, J.; Rauscher, S.; Nawrocki, G.; Ran, T.; Feig, M.; deGroot, B. L.; Grubmuller, H.; MacKerell, A. D., Jr CHARMM36m:An Improved Force Field for Folded and Intrinsically DisorderedProteins. Nat. Methods 2017, 14, 71−73.(68) Lee, H.; Venable, R. M.; MacKerell, A. D., Jr; Pastor, R. W.Molecular Dynamics Studies of Polyethylene Oxide and PolyethyleneGlycol: Hydrodynamic Radius and Shape Anisotropy. Biophys. J.2008, 95, 1590−1599.(69) Tang, X.; Koenig, P. H.; Larson, R. G. Molecular dynamicssimulations of sodium dodecyl sulfate micelles in water - The effect ofthe force field. J. Phys. Chem. B 2014, 118, 3864−3880.(70) Eismin, R. J.; Munusamy, E.; Kegel, L. L.; Hogan, D. E.; Maier,R. M.; Schwartz, S. D.; Pemberton, J. E. Evolution of AggregateStructure in Solutions of Anionic Monorhamnolipids: Experimentaland Computational Results. Langmuir 2017, 33, 7412−7424.(71) Luft, C. M.; Munusamy, E.; Pemberton, J. E.; Schwartz, S. D.Molecular Dynamics Simulation of the Oil Sequestration Properties ofa Nonionic Rhamnolipid. J. Phys. Chem. B 2018, 122, 3944−3952.(72) Essmann, U.; Perera, L.; Berkowitz, M. L.; Darden, T.; Lee, H.;Pedersen, L. G. A smooth particle mesh Ewald method. J. Chem. Phys.1995, 103, 8577−8593.(73) Ryckaert, J. P.; Ciccotti, G.; Berendsen, H. J. C. Numericalintegration of the cartesian equations of motion of a system withconstraints: molecular dynamics of n-alkanes. J. Comp. Phys. 1977, 23,327−341.(74) Salaniwal, S.; Cui, S. T.; Cochran, H. D.; Cummings, P. T.Molecular simulation of a dichain surfactant/water/carbon dioxidesystem. 2. Self-Assembly and Aggregation Dynamics. Langmuir 2001,17, 1784−1792.(75) Abragam, A. The Principles of Nuclear Magnetism, 1st ed.;Oxford University Press: London, 1961.(76) Ernst, R. R.; Bodenhausen, G.; Wokaun, A. Principles of NuclearMagnetic Resonance in One and Two Dimensions, 1st ed.; ClarendonPress, 1987.(77) Kowalewski, J.; Maler, L. Nuclear Spin Relaxation in Liquids:Theory, Experiments, and Applications, 1st ed.; Moore, J.; Spencer, N.,Eds.; Taylor & Francis Group, LLC: Boca Raton, FL, 2006.(78) Cowan, B. Nuclear Magnetic Resonance and Relaxation, 1st ed.;Cambridge University Press: New York, 1997; p 434.(79) Bloembergen, N.; Purcell, E. M.; Pound, R. V. Relaxationeffects in nuclear magnetic resonance absorption. Phys. Rev. 1948, 73,679−712.
Langmuir Article
DOI: 10.1021/acs.langmuir.9b01345Langmuir 2019, 35, 13880−13892
13891

(80) Ollila, O. H. S.; Heikkinen, H. A.; Iwaï, H. Rotational Dynamicsof Proteins from Spin Relaxation Times and Molecular DynamicsSimulations. J. Phys. Chem. B 2018, 122, 6559−6569.(81) Klauda, J. B.; Roberts, M. F.; Redfield, A. G.; Brooks, B. R.;Pastor, R. W. Rotation of Lipids in Membranes: Molecular DynamicsSimulation, 31P Spin-Lattice Relaxation, and Rigid-Body Dynamics.Biophys. J. 2008, 94, 3074−3083.(82) Halle, B.; Wennerstrom, H. Interpretation of magneticresonance data from water nuclei in heterogeneous systems. J.Chem. Phys. 1981, 75, 1928−1943.(83) Macura, S.; Ernst, R. Elucidation of cross relaxation in liquidsby two-dimensional N.M.R. spectroscopy. Mol. Phys. 1980, 41, 95−117.(84) Kline, S. R. Reduction and analysis of SANS and USANS datausing IGOR Pro. J. Appl. Crystallogr. 2006, 39, 895−900.(85) Guinier, A.; Fournet, G. Small-Angle Scattering of X-Rays; JohnWiley & Sons: New York, 1955.(86) Pedersen, J. S. Analysis of small-angle scattering data fromcolloids and polymer solutions: modeling and least-squares fitting.Adv. Colloid Interface Sci. 1997, 70, 171−210.(87) Doucet, M., et al.et al. SasView Version 4.1; Zenodo: 2017;DOI: 10.5281/zenodo.438138.(88) Neuhaus, D.; Williamson, M. P. The Nuclear Overhauser Effectin Structural and Conformational Analysis, 1st ed.; VCH Publishers,Inc.: New York, 1989.(89) Balmbra, R. R.; Clunie, J. S.; Corkill, J. M.; Goodman, J. F.Effect of Temperature on the Micelle Size of a Homogeneous Non-ionic Detergent. J. Chem. Soc., Faraday Trans. 1962, 58, 1661−1667.
Langmuir Article
DOI: 10.1021/acs.langmuir.9b01345Langmuir 2019, 35, 13880−13892
13892