structural response and continuous strength method design
TRANSCRIPT

Structural response and continuous strength method design of slender
stainless steel cross-sections
Ou Zhao *a
, Sheida Afshan b, Leroy Gardner
c
a School of Civil and Environmental Engineering, Nanyang Technological University, 50 Nanyang
Avenue, 639798 Singapore, Singapore
b Department of Mechanical, Aerospace and Civil Engineering, Brunel University London, London,
UK
c Department of Civil and Environmental Engineering, Imperial College London, London, UK
* Corresponding author, Phone: +65 6790 6934
Email: [email protected]
Abstract
In current structural stainless steel design codes, local buckling is accounted for through a
cross-section classification framework, which is based on an elastic, perfectly-plastic material
model, providing consistency with the corresponding treatment of carbon steel cross-sections.
Hence, for non-slender cross-sections, the codified design stress is limited to the 0.2% proof
stress without considering the pronounced strain hardening exhibited by stainless steels,
while for slender cross-sections, the effective width method is employed without considering
the beneficial effect of element interaction. Previous comparisons between test results and
codified predictions have generally indicated over-conservatism and scatter. This has
prompted the development of more efficient design rules, which can reflect better the actual
local buckling behaviour and nonlinear material response of stainless steel cross-sections. A
deformation-based design approach called the continuous strength method (CSM) has been
proposed for the design of stocky cross-sections, which relates the strength of a cross-section
to its deformation capacity and employs a bi-linear (elastic, linear hardening) material model
Zhao, O., Afshan, S., & Gardner, L. (2017). Structural response and continuous strength method
design of slender stainless steel cross-sections. Engineering Structures; 140: 14 – 25.

to account for strain hardening. In this paper, the scope of the CSM is extended to cover the
design of slender stainless steel cross-sections under compression, bending and combined
loading, underpinned by and validated against 794 experimental and numerical results. The
proposed approach allows for the beneficial effect of element interaction within the cross-
section, and is shown to yield a higher level of accuracy and consistency, as well as design
efficiency, in the capacity predictions of slender stainless steel cross-sections, compared to
the effective width methods employed in the current international design standards. Non-
doubly symmetric sections in bending, which may be slender, but still benefit from strain
hardening, are also discussed. The reliability of the CSM proposal has been confirmed by
means of statistical analyses according to EN 1990, demonstrating its suitability for
incorporation into future revisions of international design codes for stainless steel structures.
1. Introduction
Stainless steel is becoming an increasingly attractive choice as a construction material, rather
than simply a decorative material, in a range of engineering applications, owing principally to
its favourable mechanical properties, good ductility and excellent corrosion and fire
resistance. Given the high initial material price of stainless steels, structural design efficiency
is of primary concern. For the design of stainless steel plated sections (e.g., square and
rectangular hollow sections (SHS and RHS), I-sections, channel sections, angle sections and
T-sections) susceptible to local buckling, although a number of design standards exist, the
provisions were generally developed in line with the corresponding carbon steel design
guidelines, which are based on the idealised elastic, perfectly-plastic material model without
accounting for strain hardening, and the traditional cross-section classification and effective
width concepts without considering element interaction. Hence, current stainless steel design
standards generally ignore these two beneficial effects – strain hardening and element

interaction – and have, as a result, been shown to often result in unduly conservative and
scattered predictions of cross-section resistances under compression [1–4], bending [3,5–8]
and combined loading [9–12].
To address this shortcoming, a deformation-based design approach called the continuous
strength method (CSM) has been proposed [13–16]. The CSM replaces the concept of cross-
section classification, which is defined on the basis of the most slender constituent plate
element of the cross-section, with a non-dimensional measure of cross-section deformation
capacity, which is presented as a function of the full cross-section slenderness that accounts
for the beneficial effect of element interaction within the cross-section. An elastic, linear
hardening material model is also adopted, representing better the actual material behaviour of
stainless steels, compared to the elastic, perfectly-plastic material model used in current
design standards. The CSM [13–15] has previously been developed for the design of non-
slender stainless steel plated sections, and shown to yield substantially improved predictions
of capacity over the current design standards, due to the consideration of strain hardening and
element interaction, while its application to slender plated sections is extended and described
herein.
The paper begins with a brief review and comparative analysis of the current design methods
for slender stainless steel cross-sections failing by local buckling, including the European
codes EN 1993-1-4 [17] and EN 1993-1-5 [18], American specification SEI/ASCE-8 [19],
Australian/New Zealand standard AS/NZS 4673 [20], AISC design guide 27 [21] and direct
strength method (DSM) [6,22–25]. The continuous strength method (CSM), originally
developed to account for strain hardening in the design of non-slender stainless steel plated
sections, is firstly described, and then extended to cover the design of slender cross-sections,

underpinned by experimental results collected from the literature. A numerical modelling
programme is also performed to generate further structural performance data. The present
numerical studies focus primarily on tubular SHS and RHS, though a wider study by the
authors also includes other open section profiles, such as I-, T-, channel and angle sections.
Finally, the combined experimental and numerical data are employed to assess the accuracy
and reliability of the proposed CSM for slender stainless steel plated sections.
2. Current design methods for slender stainless steel cross-sections
2.1 Codified design methods
The codified treatment of local buckling in slender stainless steel cross-sections, as given in
the current European codes EN 1993-1-4 [17] and EN 1993-1-5 [18], American specification
SEI/ASCE-8 [19], Australian/New Zealand standard AS/NZS 4673 [20] and AISC design
guide 27 [21], is based on the traditional effective width concept, as adopted in the
corresponding carbon steel design standards. The effective width methods treat the cross-
section as an assemblage of isolated plate elements without considering element interaction,
and account for loss of effectiveness due to local buckling through a reduction in plate
element width. The level of the susceptibility of a plate element to local bucking and thus the
reduction in plate width and resistance are dependent on its plate element slenderness l , as
defined in Eq. (1), where b is the flat width of the plate element, t is the plate thickness,
(235 / )( / 210000)yf E is a coefficient related to material properties, in which fy is the
material yield stress, taken as the 0.2% proof stress σ0.2 for stainless steels, E is the Young’s
modulus, and kσ is the plate buckling coefficient, depending on the edge support conditions
and the stress ratio across the plate width. Note that the definition of flat width b varies
between the design codes and the appropriate width has been used for the calculations and
comparisons presented.
/
28.4l
b t
k
(1)
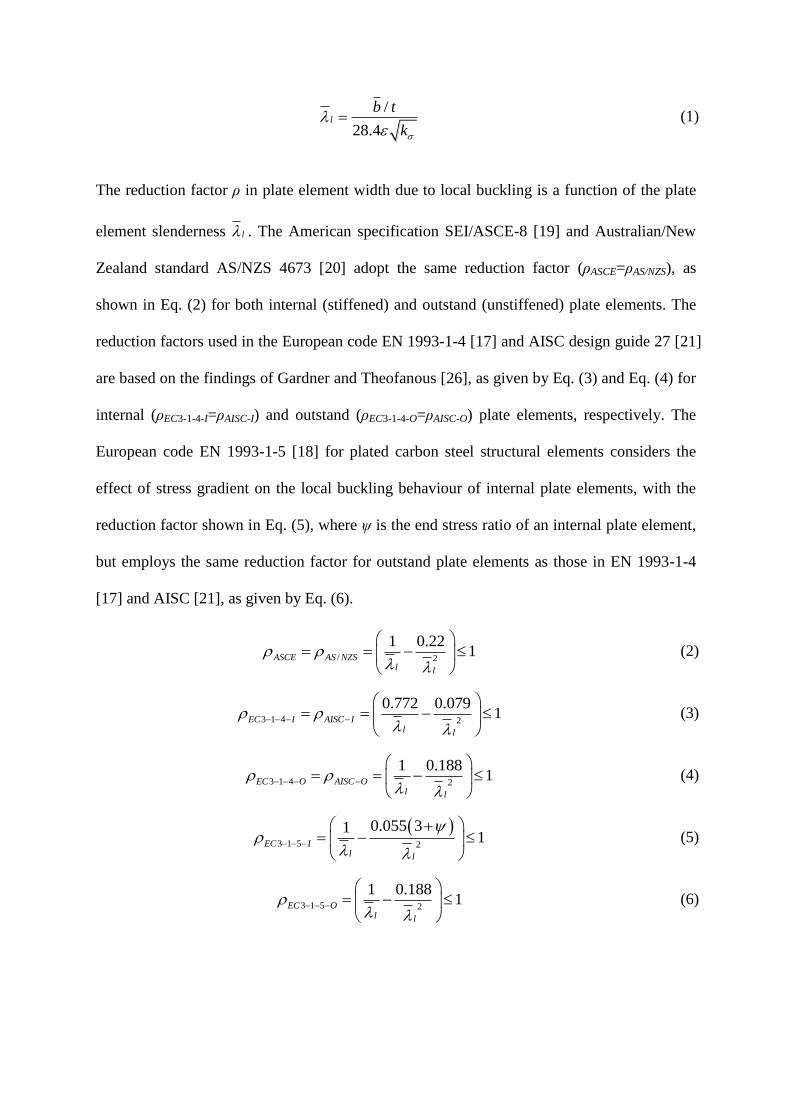
The reduction factor ρ in plate element width due to local buckling is a function of the plate
element slenderness l . The American specification SEI/ASCE-8 [19] and Australian/New
Zealand standard AS/NZS 4673 [20] adopt the same reduction factor (ρASCE=ρAS/NZS), as
shown in Eq. (2) for both internal (stiffened) and outstand (unstiffened) plate elements. The
reduction factors used in the European code EN 1993-1-4 [17] and AISC design guide 27 [21]
are based on the findings of Gardner and Theofanous [26], as given by Eq. (3) and Eq. (4) for
internal (ρEC3-1-4-I=ρAISC-I) and outstand (ρEC3-1-4-O=ρAISC-O) plate elements, respectively. The
European code EN 1993-1-5 [18] for plated carbon steel structural elements considers the
effect of stress gradient on the local buckling behaviour of internal plate elements, with the
reduction factor shown in Eq. (5), where ψ is the end stress ratio of an internal plate element,
but employs the same reduction factor for outstand plate elements as those in EN 1993-1-4
[17] and AISC [21], as given by Eq. (6).
/ 2
1 0.221
lASCE AS NZ
l
S
(2)
4 23 1
0.772 0.0791
lEC I AISC I
l
(3)
1 23 4
1 0.1881EC O AIS O
l
Cl
(4)
5 23 1
0.055 311I
lE
l
C
(5)
1 23 5
1 0.1881EC O
l l
(6)

On the basis of the effective width of each constituent plate element, the effective cross-
section properties, including the effective section area Aeff and modulus Weff, can be
determined. The effective cross-section resistances under pure compression (Neff) and
bending (Meff) are then calculated as the products of the yield stress fy and the effective
section area Aeff and modulus Weff, respectively. For slender cross-sections under combined
loading, failure is determined based on a linear summation of the utilization ratios under each
component of loading, with a limit of unity. The design expression is given by Eq. (7), in
which NEd is the applied axial load, MEd,y and MEd,z are the applied bending moments about
the two principal axes, Neff, Meff,y and Meff,z are the corresponding design effective cross-
section compression and bending resistances.
,
, ,
,1
eff
Ed y Ed zEd
ze y e fff f
M MN
N M M (7)
Following comparisons with test and finite element (FE) results, it has been generally found
in previous research [27] that the effective width methods result in rather scattered cross-
section resistance predictions, especially for sections where the slenderness of the constituent
plate elements varies significantly, e.g., RHS with large aspect ratios, owing to the failure to
account for the beneficial effect of element interaction in the design. Moreover, application of
the effective width method is often cumbersome, due to a shift of neutral axis.
2.2 The direct strength method (DSM)
The direct strength method (DSM) was developed by Schafer and Peköz [22,23] to overcome
the cumbersome nature of the effective width method when applied to slender cold-formed
carbon steel cross-sections of complex geometries or under stress gradients, and to consider
the beneficial effect of element interaction in the determination of cross-section resistances.
The DSM directly relates the strength of a cross-section to its overall cross-section

slenderness /p y crf f , in which fcr is the elastic buckling stress of the full cross-section
under the applied loading conditions, and may be determined using the finite strip software
CUFSM [28]. In contrast, the effective width method treats the cross-section as an
assemblage of isolated plate elements and calculates the effective width and strength of each
plate element based on the individual plate slenderness l without considering the beneficial
effect of element interaction. The DSM design resistance formulae are given by Eqs (8) and
(9) for cross-sections failing by local buckling in compression (Nnl) and bending (Mnl),
respectively, in which Ny is the cross-section yield load, equal to the gross cross-section area
A multiplied by yield stress fy and Mel is the elastic moment capacity, defined as the product
of the cross-section elastic section modulus Wel and yield stress fy. Following successful
application to cold-formed carbon steel sections, proposals to extend the DSM to structural
stainless steel sections of austenitic [24,25], duplex [6] and ferritic [24,25] grades have been
set out. Although the DSM approach is currently included in the North American
specification for cold-formed carbon steel structures AISI-S100-12 [29], it has not yet been
incorporated into stainless steel design standards.
0.8 0.8
1 0.776
0.15 11 0.776
p
nl
y p
p p
N
N
(8)
0.8 0.8
1 0.776
0.15 11 0.776
p
nl
y p
p p
M
M
(9)
3. The continuous strength method (CSM)
3.1 Introduction
The continuous strength method (CSM) [13–16] is a deformation-based design approach,
originally developed to allow for a rational exploitation of strain hardening in the design of

stocky (i.e. non-slender Class 1, 2 and 3) stainless steel cross-sections. It was shown to yield
a high level of accuracy and consistency in the resistance predictions of non-slender stainless
steel cross-sections under various loading conditions, including pure compression [4,9–12,14],
pure bending [6,8,9–12,14] and combined loading [9–12]. In the following sub-section, a
brief summary of the CSM for non-slender stainless steel sections is firstly described;
extension of the method to slender (Class 4) cross-sections is in Section 3.3.
3.2 The CSM for non-slender cross-sections
The main characteristics of the CSM for non-slender sections lie in the employment of a
‘base curve’ to determine the maximum strain that a cross-section can attain prior to failure
by local buckling, and the adoption of an elastic, linear hardening material model to enable
design stresses greater than the yield stress. The base curve, derived on the basis of a
regression fit to compression and bending test data for a range of metallic materials,
including austenitic, duplex and ferritic stainless steels, carbon steel, high strength steel and
aluminium, defines the relationship between the deformation capacity, expressed in terms of
the strain ratio (εcsm/εy), and the full cross-section slenderness p , as given by Eq. (10), where
εcsm is the maximum attainable strain and εy is the yield strain equal to fy/E. Two limits are
applied to the strain ratio (εcsm/εy) given by Eq. (10): the first limit of 15 is to prevent
excessive strains and also corresponds to the material ductility requirement given in EN
1993-1-4 [17], while the second limit, which is related to the adopted elastic, linear hardening
material model, is to avoid over-prediction of the material strength. Similarly to the direct
strength method (DSM), the continuous strength method (CSM) also uses the full cross-
section slenderness p rather than the individual plate slenderness l , and thus takes into
account the beneficial effect of element interaction. Note that the base curve, defined by Eq.

(10), applies to non-slender cross-sections with p less than or equal to 0.68, at which point
the strain ratio εcsm/εy is equal to unity.
3.6
0.25s
p
c m
y
but 1min 15, u
y
C
, for 0.68p (10)
The CSM elastic, linear hardening material model, which features four material coefficients
(C1, C2, C3 and C4), is illustrated in Fig. 1, with the strain hardening slope Esh calculated from
Eq. (11). Values of the coefficients for each metallic material were calibrated based on the
material tensile coupon test data by means of least squares regression, and are summarised in
Table 1 [16]. The CSM material model parameter C1 is used to define a cut-off strain (see Eq.
(10)) to ensure that the material strength is not over-predicted from the adopted linear
hardening material model. The CSM material coefficient C2 is employed in Eq. (11) to define
the strain hardening slope Esh, while the parameter εu=C3(1–fy/fu)+C4 is the predicted strain
corresponding to the material ultimate strength fu.
2
u y
sh
u y
f fE
C
(11)
Upon determination of the maximum attainable strain εcsm and the strain hardening modulus
Esh, the CSM design stress fcsm can be calculated from Eq. (12), which is then employed
directly to obtain the cross-section compression resistance Ncsm,Rd, as given by Eq. (13),
where γM0 is a partial factor for cross-section resistance, with a recommended value of 1.1 for
stainless steel. Based on the assumption of a linearly-varying through-depth strain
distribution and the bi-linear CSM material model, the CSM bending resistance for non-
slender cross-sections Mcsm,Rd can be determined from the design formula given by Eq. (14),
where Wel and Wpl are the elastic and plastic section moduli, respectively, and α is the CSM

bending coefficient, related to cross-section shape and axis of bending: for SHS and RHS
bending about either axis and for I-sections under major axis bending, α is equal to 2.0, while
for I-sections in minor axis bending, α=1.2 [14,15]. For mono-symmetric sections (e.g.,
channel sections and T-sections) and asymmetric sections (e.g., angle sections), the
corresponding values of the α coefficient have been recently derived by Zhao and Gardner
[30].
csm y sh csm yf f E (12)
,
0
csmcsm Rd
M
AfN
(13)
,
0
1 1 1 /pl y sh el csm el csm
csm Rd
M pl y pl y
W f E W WM
W WE
(14)
The scope of the CSM was extended from isolated loading cases (i.e. pure compression or
pure bending) to combined loading cases (i.e. combined compression and bending) by Liew
and Gardner [15] and Zhao et al. [10,11]. The proposals utilise the CSM compression and
bending resistances as the end points, with efficient cross-section interaction curves between
these points.
Following comprehensive comparisons with the test and FE results, it was found that the
CSM generally yields a much higher level of accuracy and consistency in the resistance
predictions of non-slender stainless steel cross-sections subjected to various loading
conditions, including pure compression [4,9–12,14], pure bending [6,8,9–12,14] and
combined compression and bending [9–12], owing principally to the consideration of strain
hardening.

3.3 Extension of the CSM to slender cross-sections
Upon successful application to non-slender stainless steel cross-sections, the CSM is now
extended to cover the design of slender cross-sections, in which local buckling occurs prior to
the attainment of the 0.2% proof stress, and no significant benefit arises from strain hardening.
The CSM generally features two key components – a base curve defining the maximum strain
that a cross-section can achieve prior to failure by local buckling, and an elastic, linear
hardening material model, which offers a simplified representation of the nonlinear stress–
strain characteristics of stainless steels. As described previously, the adopted CSM material
model was calibrated based on the analysis of material tensile coupon test data, and is thus
independent of cross-section slenderness. Therefore, the key step towards extending the CSM
to the design of slender cross-sections lies in the development of a second base curve for
slender sections with slenderness p greater than 0.68.
The CSM base curve was derived for non-slender cross-sections through a regression fit to
the test data, with the experimental local buckling limiting strain εlb taken as the maximum
attainable strain at the ultimate load, e.g., εlb is equal to the ratio of the end shortening δu at
failure to the initial specimen length L for stub columns. However, for slender cross-sections
that fail by local buckling before yielding, the observed experimental deformation response is
strongly influenced by elastic buckling (accompanied by a drop in axial stiffness and hence
deviation from the elastic material behaviour) and post-buckling, and thus the base curve
developed on the basis of the former definition of the experimental local buckling limiting
strain would result in over-predictions of failure stress from the adopted CSM material model,
which has a linear stress–strain response up to the yield stress. The above issue is illustrated
in Fig. 2, where the experimental stress–strain curve, transformed from the load–end
shortening curve of a typical slender section (RHS 100×40×2) stub column test [31], is

plotted together with the CSM elastic, linear strain hardening material model, indicating that
the actual failure stress fu,actual would be greatly over-predicted by the adopted CSM material
model, if the local buckling limiting strain is defined as the maximum strain at the failure
load for slender cross-sections.
The concept of equivalent local buckling strain [32] is therefore used in the definition of the
experimental limiting strain for slender sections, in order to avoid over-predictions of design
failure stress. Considering that the CSM adopts a linear stress–strain material model up to the
yield stress, the equivalent experimental local buckling limiting strains εlb,e for slender section
members that fail below the yield strength are determined based on the assumption of a linear
load–deformation structural response, as illustrated in Fig. 2; hence εlb,e=Nu,test/(AE) and
εlb,e=Mu,test/(WelE) for slender section stub columns and beams, respectively, where Nu,test is
the test ultimate load and Mu,test is the test ultimate bending moment. The experimental local
buckling strain ratios for stub columns and beams, defined as the ratio of the equivalent local
buckling stain to the yield strain εy, are now therefore simply equal to the corresponding
ratios of the test ultimate capacity to the yield capacity, as shown in Eqs (15) and (16),
respectively, where Ny=Afy is the cross-section yield load and My =Welfy is the cross-section
elastic bending moment capacity. Additionally, with this adopted definition of deformation
capacity, unlike in the development of the base curve for non-slender sections [14], no further
account needs to be made for the difference between the actual rounded material stress–strain
response and the assumed CSM linear elastic material response below the 0.2% proof stress,
and hence εcsm/εy= εlb,e/εy.
, ,lb e u testcsm
y y y
N
N
(15)
, ,lb e u testcsm
y y y
M
M
(16)

Previous stub column and beam test data have been collected for the development of the
second base curve for slender cross-sections with 0.68p . In total, 442 experimental
results have been gathered from the literature, including 149 for stainless steel [1,3–8,31,33–
42], 13 for carbon steel [43–46], 61 for high strength steel [47–55], and 219 for aluminium
[56–65]. For each data point, the equivalent local buckling limiting strain ratio, as determined
from Eq. (15) or Eq. (16), is plotted against the cross-section slenderness in Fig. 3. The base
curve is defined by a continuous function of the general form given by Eq. (17), which is
similar to that used in other strength-based design approaches, such as the DSM and effective
width methods. The values of the parameters A and B were determined following a
regression fit of Eq. (17) to the test data; for compatibility with the CSM base curve for non-
slender cross-sections with 0.68p , the base curve for slender sections should also pass
through the identified cross-section slenderness limit (transition point) between slender and
non-slender sections, i.e. (0.68, 1). The derived CSM base curve for slender sections, as
defined by Eq. (18), is shown in Fig. 3, together with the design curves from the codified
effective width methods for comparison purposes. The full base curve, together with the test
data on both stocky and slender cross-sections is also shown in Fig. 4. Note that the
continuity of position, but not slope is maintained at 0.68p .
1
1csm
B B
y p p
A
(17)
1.050 1.050
0.222 11csm
y p p
(18)

The CSM cross-section compression and bending resistances are then calculated as the
corresponding yield (elastic) strengths multiplied by the strain ratio, as shown in Eqs (19) and
(20), respectively.
,
0
ycsmcsm Rd
y M
AfN
(19)
,
0
el ycsmcsm Rd
y M
W fM
(20)
For the design of slender cross-sections under combined axial compressive load and bending
moment, a linear interaction formula is employed, as given by Eq. (21), where Ncsm,Rd is the
CSM compression resistance, calculated from Eq. (19), while Mcsm,y,Rd and Mcsm,z,Rd are the
CSM bending moment resistances about the major and minor axes, respectively, determined
from Eq. (20).
, ,
, , , , ,
1Ed y Ed zEd
csm Rd csm y Rd csm z Rd
M MN
N M M (21)
For slender non-doubly symmetric sections (e.g., channel, T- and angle sections) in bending,
in the case where the neutral axis is closer to the extreme compressive fibre, although the
limiting strain in compression is less than the yield strain, the corresponding strains in tension
can be significantly larger than the yield strain, resulting in strain hardening. Therefore,
slender non-doubly symmetric sections in bending can also benefit from strain hardening.
The CSM can take this beneficial strain hardening effect into account in the design. For
slender non-doubly symmetric sections in bending (i.e. cross-section slenderness greater than
0.68), the design local buckling strain in compression εcsm is determined from Eq. (18), while
the design strain in tension εcsm,t can be obtained based on the assumption of a linearly-
varying through-depth strain distribution. For ,csm t y (i.e. when yielding occurs on the

tensile side), the design position of the neutral axis can be approximated as the mid-point
between the elastic and plastic neutral axes for practically used non-doubly symmetric
sections in structural engineering [30,66]. When ,csm t y , the cross-section remains elastic
and the elastic neutral axis is therefore employed in the design calculations. The shift in
neutral axis resulting from local buckling is not explicitly considered in the CSM, though this
effect is inherently present in the bending test and FE data used to formulate and assess the
design proposals; the same approach is adopted in the direct strength method (DSM) but not
in the design methods of EN 1993-1-4 [17] and EN 1993-1-5 [18], where the shift in neutral
axis should be explicitly determined. The corresponding stress distribution is then derived on
the basis of the CSM elastic, linear hardening material model. Fig. 5 illustrates the CSM
design strain and stress distribution for a slender T-section in major axis bending. The CSM
cross-section bending moment resistance is then determined by integration of the stress
distribution throughout the cross-section depth. The detailed development of simplified
design equations for slender mono-symmetric and asymmetric cross-sections in bending is
described by Zhao and Gardner [30].
The accuracy of the proposed CSM for slender stainless steel cross-sections is evaluated
through comparisons against the test and FE data in Section 5 of the paper. The experimental
data on a range of section types, including SHS and RHS, I-section, channel section and
angle section, were collected from the literature, while the FE results, generated in Section 4,
focused primarily on tubular SHS and RHS. With regards to loading type, the experimental
dataset includes stub column test results for SHS and RHS [1,3,4,31,33–36,38,39,41,42], I-
sections [35,40,41], channel sections [35] and angle sections [35], and beam tests results for
SHS and RHS [5–8,31,37,38,42], while the numerical study considers SHS and RHS under
pure compression, pure bending and combined compression and bending.

4. Numerical modelling
The present numerical modelling programme was carried out through the use of the nonlinear
finite element analysis package ABAQUS [67]. Numerical simulations were carried out on
stainless steel SHS and RHS stub columns subjected to both concentric and eccentric
compression, and beams under four-point bending. A detailed description of the development
of the FE models and their validation against experimental results were presented by the
authors in previous numerical studies [10,11,31] of stainless steel tubular sections under pure
compression, pure bending and combined loading, so only the key features of the modelling
are reported herein.
Having been used successfully employed in previous studies [10,11,31] concerning the
modelling of stainless steel SHS and RHS structural members, the four-noded doubly curved
shell element with reduced integration and finite membrane strain, S4R [67], was adopted in
the present numerical studies. An element size equal to the cross-section thickness was used
in the flat portions of the modelled cross-sections, while a finer mesh of four elements was
assigned to the corners to accurately represent the curved geometry. Symmetry was exploited
by modelling only half the cross-section and member length of the concentrically-loaded stub
column, uniaxial eccentrically-loaded stub column, and four-point bending FE models. For
the biaxial eccentrically-loaded stub column FE models, half the member length but the full
cross-section was modelled. Suitable symmetry boundary conditions were applied to each
axis of symmetry.
The adopted material properties for the present numerical modelling were taken from
previous tests on stainless steel SHS and RHS structural members [9,31]. Table 2 reports the
employed material properties for each of the three considered stainless steel grades (austenitic,

duplex and ferritic), including the Young’s modulus E, the 0.2% proof stress σ0.2, the 1.0%
proof stress σ1.0, the ultimate tensile strength σu and the strain hardening exponents n, n’0.2,1.0
and n’0.2,u, as utilized in the two–stage Ramberg–Osgood (R–O) material model [68–71].
Since ABAQUS [67] requires the material properties to be specified in the form of true stress
and log plastic strain for the adopted element type, the measured engineering stress–strain
curves from the tensile coupon tests [9,31] were firstly represented by the two-stage
Ramberg–Osgood material model, and then converted into true stress-strain curves. Measured
corner material properties were also assigned to the curved corner portions of the sections,
and to the adjacent flat portions extending beyond the corners to a distance equal to two times
the cross-section thickness, in accordance with the previous finding [72,73] that both of the
aforementioned regions exhibit similar stress–strain characteristics due to approximately the
same degree of strength enhancement experienced during the cold-rolling process. The
material properties of the flat material were assigned to the remaining regions of the FE
models.
Stainless steel SHS and RHS structural members are generally fabricated by cold-forming,
during which the flat metal sheets are firstly cold-rolled into circular tubes and welded closed,
and then gradually deformed into the required profiles by means of dies. Two types of
residual stresses – through-thickness bending residual stresses arising from non-uniform
plastic deformation during cold-forming and membrane residual stresses induced through
uneven cooling upon welding, are introduced into the specimens during the fabrication
process and therefore exist in the sections in their unloaded state. However, explicit inclusion
of residual stresses in the numerical models was deemed unnecessary, principally owing to
the negligible influence of the membrane residual stresses on cold-formed stainless steel

tubular profiles, and the inherent presence of the more dominant through-thickness residual
stresses in the measured material properties [74–76].
The end section boundary conditions of the numerical models were arranged as follows: For
the concentrically-loaded stub column FE models, all degrees of freedom of the loaded end
section were coupled to a concentric reference point, which only allowed longitudinal
translation, to simulate fixed end boundary conditions. With regards to the four-point bending
FE models, the end cross-section was coupled to a reference point, located at the bottom
(tension) flange of the model, where all degrees of freedom were restrained except for the
longitudinal translation and rotation about the axis of buckling, in order to replicate simply-
supported boundary conditions. In addition, the cross-section of the beam model under the
loading point was set as a rigid body, which only allowed rotation about the loading point and
vertical deflection. For each eccentrically-loaded stub column FE model, the loaded end
section was coupled to an eccentric reference point, allowing longitudinal translation and
rotation about the axis of buckling, to model pin-ended boundary conditions; an axial load
was applied to the model through the eccentric reference point, resulting in the application of
both axial compressive load and bending moment to the numerical model.
Initial local geometric imperfections are introduced into the cold-formed structural members
primarily during the fabrication process and can influence the development of local buckling,
the failure load and the post-ultimate behaviour. For each type of the numerical model, the
initial local geometric imperfection pattern along the member length was taken as the lowest
local buckling model shape under the considered loading condition, which was determined by
performing a prior elastic eigenvalue buckling analysis [10,11,31,77–79]. The initial local
imperfection amplitudes were determined by means of the modified Dawson and Walker

model [72,80], as given by Eq. (22), where σcr,min is the minimum elastic buckling stress of all
the plate elements making up the cross-section. Upon incorporation of the initial local
geometric imperfections into the FE models, geometrically and materially nonlinear analyses
were carried out, based on the modified Riks method [67], to determine the failure loads,
which were then used to assess the accuracy of the proposed CSM for slender stainless steel
cross-sections subjected to a range of loading conditions.
0.2&
,min
0.023D W
cr
t
(22)
With regards to the geometric dimensions of the modelled cross-sections, the outer width was
set equal to 100 mm while the outer depths ranged from 100 mm to 200 mm, leading to a
spectrum of cross-section aspect ratios between 1.0 and 2.0; the internal corner radii were set
equal to the cross-section thickness, which varied from 0.5 mm to 4 mm, resulting in a range
of cross-section slenderness values p between 0.65 and 2.70. The member length of each
concentrically- or eccentrically-loaded stub column FE model was set equal to four times its
mean outer dimension, while the length of each four-point bending FE model was set equal to
15 times its mean outer dimension. For the eccentrically-loaded stub column FE models, the
employed initial loading eccentricities ranged from 1 mm to 500 mm, enabling a broad range
of loading combinations (i.e. proportions of bending moment to axial load) to be examined.
In total, 645 parametric study results were generated, with 215 for each grade, which
included 75 for concentrically-loaded stub columns, 70 for four-point bending beams and 70
for eccentrically-loaded stub columns.
5. Comparisons with test and FE results
The accuracy of the proposed design approach, as well as the effective width methods given
in the current European codes EN 1993-1-4 [17] and EN 1993-1-5 [18], American

specification SEI/ASCE-8 [19], Australian/New Zealand standard AS/NZS 4673 [20] and
AISC design guide 27 [21], for the design of slender stainless steel cross-sections, was
evaluated through comparisons of the test and FE strengths with the unfactored (i.e. all partial
factors set to unity) predicted strengths, based on the measured or modelled geometries and
weighted average (by area) material properties to allow for the higher strengths in the corners.
The direct strength method (DSM) [23], though originally developed for the design of slender
carbon steel cross-sections, was also assessed herein for slender stainless steel sections. The
comparisons are presented in terms of the ratio of test (or FE) to predicted strengths Ru/Ru,pred,
as shown in Tables 3(a)–3(c) for concentrically-loaded stub columns, beams and
eccentrically-loaded stub columns, respectively, in which Ru is equal to the test (or FE)
failure load Nu for the concentrically- and eccentrically-loaded stub columns, and is equal to
the test (or FE) failure moment Mu for beams, while Ru,pred is the corresponding predicted
resistance from each design method. Note that ratios greater than unity indicate that the test
(or FE) data points are safely predicted.
The mean ratios of test (or FE) to CSM predicted strengths, as reported in Tables 3(a)–3(c),
are equal to 1.07, 1.23 and 1.17 with coefficients of the variation (COV) of 0.06, 0.05 and
0.06 for slender stainless steel sections subjected to pure compression, pure bending and
combined compression and bending, respectively, revealing that the proposed CSM leads to a
higher level of design accuracy and consistency than the European code EN 1993-1-4 [17]
and AISC design guide 27 [21] in the prediction of slender stainless steel cross-section
resistances. The European code EN 1993-1-5 [18], American specification SEI/ASCE-8 [19]
and Australian/New Zealand standard AS/NZS 4673 [20] were generally found to yield more
accurate mean ratios of test (or FE) to predicted capacities than the CSM, but with a higher
degree of scatter, as shown in Tables 3(a)–3(c). In addition, these three design standards led

to many resistance predictions on the unconservative side, as can be seen from Figs 6 and 7,
where the ratio of test (or FE) capacity to predicted capacity Ru/Ru,pred is plotted against the
cross-section slenderness p . Moreover, the effective width approaches generally involve
more cumbersome calculation in order to obtain the design resistance, while the CSM directly
calculates the design resistance as the product of the cross-section yield (elastic) strength and
the strain ratio, and is thus very practical. Note that EN 1993-1-4 [17] and the AISC design
guide [21] utilise the same reduction factor for plate elements susceptible to local buckling,
but with a different definition of the flat width b of the plate element, e.g., for SHS and RHS,
3b b t is used in EN 1993-1-4 [17], while 2 2 ib b t r is employed in the AISC design
guide [21]; this leads to different capacity predictions, as can be seen from Tables 3(a)–3(c).
The direct strength method (DSM) [23] was also shown to result in more accurate strength
predictions than the CSM proposal, on average, but a significant portion of the strength
predictions lie on the unconservative side, as indicted in Fig. 8. The ratios of test (or FE)
failure loads to predicted strengths, arranged by stainless steel grade, are presented in Tables
4(a)–4(c), enabling the accuracy of the design methods to be assessed for each material grade.
Figs 9–11 present the comparisons between the CSM and the European code EN 1993-1-4
[17] for austenitic, duplex and ferritic stainless steels, respectively.
Comparisons were also made based on the test data only. The mean ratios of test to CSM
predicted capacities Ru,test/Ru,csm, as reported in Tables 5(a) and 5(b), are 1.07 and 1.22 with
the same COV of 0.08 for stub columns and beams, respectively, indicating that the CSM
leads to more precise and consistent resistance predictions than the European code EN 1993-
1-4 [17]; this can also be seen in Fig. 12, where the Ru,test/Ru,pred ratio against the cross-section
slenderness p is depicted.

6. Reliability analysis
In this section, a statistical analysis is carried out to assess the reliability of the proposed
continuous strength method for slender stainless steel cross-sections, according to the
provisions of EN 1990 [81]. Table 6 summarises the key calculated statistical parameters,
calculated based on a total of 794 test and FE data on slender stainless steel cross-sections
subjected to compression, bending and combined loading, where kd,n is the design (ultimate
limit state) fractile factor, b is the average ratio of test (or FE) to design model resistance
based on a least squares fit to all data, Vδ is the COV of the tests and FE simulations relative
to the resistance model, Vr is the combined COV incorporating both model and basic variable
uncertainties, and γM0 is the partial safety factor for cross-section resistance. In the reliability
analyses, the over-strength ratios for material yield strength were taken as 1.3, 1.1 and 1.2,
with COVs of 0.060, 0.030 and 0.045, for the austenitic, duplex and ferritic stainless steels,
respectively, while the COV of the geometric properties was taken as 0.050 for all the
stainless steel grades, as recommended by Afshan et al. [82]. As can be seen from Table 6,
the resulting partial factor for each stainless steel grade is less than the currently adopted
value of 1.1 in EN 1993-1-4 [17], and thus demonstrate that the proposed CSM for slender
stainless steel cross-sections satisfies the reliability requirements of EN 1990 [81].
7. Conclusions
Current design provisions for slender stainless steel cross-sections, as set out in the European
codes EN 1993-1-4 [17] and EN 1993-1-5 [18], American specification SEI/ASCE-8 [19],
Australian/New Zealand standard AS/NZS 4673 [20] and AISC design guide 27 [21], are
based on the traditional effective width methods. Comparisons of collected test data from the
literature and FE results generated herein with the capacity predictions from these codes
generally show a fairly high level of scatter, due mainly to the neglect of the beneficial effect

of element interaction within the cross-section, and often require cumbersome calculations.
To address these shortcomings, an improved design approach has been proposed through
extension of the deformation-based continuous strength method (CSM) to cover the design of
slender stainless steel cross-sections. The CSM proposal considers the beneficial effect of
element interaction within the cross-section, and directly calculates the design strength as the
product of the cross-section yield (elastic) strength and the strain ratio, which was shown to
yield a high level of design accuracy and consistency, as well as design efficiency, in the
prediction of the resistances of slender stainless steel sections. The reliability of the proposal
was demonstrated by means of statistical analyses according to EN 1990 [81]. It is therefore
recommended that the proposed approach for slender stainless steel cross-sections be
considered for incorporation into future revisions of stainless steel structural design standards.
References
[1] Gardner L, Nethercot DA. Experiments on stainless steel hollow sections – Part 1:
Material and cross-sectional behaviour. Journal of Constructional Steel Research,
2004;60(9):1291–318.
[2] Theofanous M, Gardner L. Testing and numerical modelling of lean duplex stainless steel
hollow section columns. Engineering Structures, 2009;31(12):3047–58.
[3] Afshan S, Gardner L. Experimental study of cold-formed ferritic stainless steel hollow
sections. Journal of Structural Engineering (ASCE), 2013;139(5):717–28.
[4] Shu G, Zheng B, Shen X. Experimental and theoretical study on the behaviour of cold-
formed stainless steel stub columns. International Journal of Steel Structures, 2013;13(1)141–
53.

[5] Gardner L, Nethercot DA. Experiments on stainless steel hollow sections – Part 2:
Member behaviour of columns and beams. Journal of Constructional Steel Research,
2004;60(9):1319–32.
[6] Huang Y, Young B. Experimental and numerical investigation of cold-formed lean duplex
stainless steel flexural members. Thin-Walled Structures, 2013;73(19):216–28.
[7] Theofanous M, Saliba N, Zhao O, Gardner, L. Ultimate response of stainless steel
continuous beams. Thin-Walled Structures, 2014;83:115–27.
[8] Arrayago I, Real E. Experimental study on ferritic stainless steel simply supported and
continuous beams. Journal of Constructional Steel Research, 2016;119:50–62.
[9] Zhao O, Rossi B, Gardner L, Young, B. Behaviour of structural stainless steel cross-
sections under combined loading – Part I: Experimental study. Engineering Structures,
2015;89:236–46.
[10] Zhao O, Rossi B, Gardner L, Young B. Behaviour of structural stainless steel cross-
sections under combined loading – Part II: Numerical modelling and design approach.
Engineering Structures, 2015;89:247–59.
[11] Zhao O, Rossi B, Gardner L, Young B. Experimental and numerical studies of ferritic
stainless steel tubular cross-sections under combined compression and bending. Journal of
Structural Engineering (ASCE), 2016;142(2):04015110.
[12] Arrayago I, Real E. Experimental study on ferritic stainless steel RHS and SHS cross-
sectional resistance under combined loading. Structures, 2015;4:69–79.

[13] Ashraf M, Gardner L, Nethercot DA. Structural stainless steel design: resistance based
on deformation capacity. Journal of Structural Engineering (ASCE), 2008;134(3):402–11.
[14] Afshan S, Gardner L. The continuous strength method for structural stainless steel
design. Thin-Walled Structures, 2013;68(4):42–49.
[15] Liew A, Gardner L. Ultimate capacity of structural steel cross-sections under
compression, bending and combined loading. Structures, 2015;1:2–11.
[16] Buchanan C, Gardner L, Liew A. The continuous strength method for the design of
circular hollow sections. Journal of Constructional Steel Research, 2016;118:207–16.
[17] EN 1993-1-4:2006+A1:2015. Eurocode 3: Design of steel structures – Part 1.4: General
rules – Supplementary rules for stainless steels, including amendment A1 (2015). Brussels:
European Committee for Standardization (CEN); 2015.
[18] EN 1993-1-5. Eurocode 3: Design of steel structures – Part 1.5: Plated structural
elements. Brussels: European Committee for Standardization (CEN); 2006.
[19] SEI/ASCE 8-02. Specification for the design of cold-formed stainless steel structural
members. Reston: American Society of Civil Engineers (ASCE); 2002.
[20] AS/NZS 4673. Cold-formed stainless steel structures. Sydney: AS/NZS 4673:2001;
2001.
[21] AISC. Design Guide 27: Structural Stainless Steel. American Institute of Steel
Construction (AISC); 2013.

[22] Schafer BW, Peköz T. Direct strength prediction of cold-formed steel members using
numerical elastic buckling solutions. Proceedings of the Fourteenth International Speciality
Conference on Cold-formed Steel Structures, St. Louis, Missouri, USA; 1998.
[23] Schafer BW. Review: The direct strength method of cold-formed steel member design.
Journal of Constructional Steel Research, 2008;64(7):766–78.
[24] Becque J, Lecce M, Rasmussen KJR. The direct strength method for stainless steel
compression members. Journal of Constructional Steel Research, 2008;64(11):1231–8.
[25] Rossi B, Rasmussen KJR. Carrying capacity of stainless steel columns in the low
slenderness range. Journal of Structural Engineering (ASCE), 2012;139(6):1088–92.
[26] Gardner L, Theofanous M. Discrete and continuous treatment of local buckling in
stainless steel elements. Journal of Constructional Steel Research, 2008;64(11):1207–16.
[27] Theofanous M, Gardner L. Effect of element interaction and material nonlinearity on the
ultimate capacity of stainless steel cross-sections. Steel and Composite Structures,
2012;12(1):73–92.
[28] Schafer BW, Ádány S. Buckling analysis of cold-formed steel members using CUFSM:
conventional and constrained finite strip methods. Proceedings of the Eighteenth
International Speciality Conference on Cold-formed Steel Structures, Orlando, USA; 2006.
[29] AISI-S100-12. North American specification for the design of cold-formed steel
structural members. Washington, D.C.: American Iron and Steel Institute (AISI); 2012.
[30] Zhao O, Gardner L. Design of non-doubly symmetric stainless steel sections in bending.
Journal of Constructional Steel Research, under review.
[31] Zhao O, Gardner L, Young B. Buckling of ferritic stainless steel members under
combined axial compression and bending. Journal of Constructional Steel Research,
2016;117:35–48.
[32] Anwar-Us-Saadat M, Ashraf M, Ahmed S. Behaviour and design of stainless steel
slender cross-sections subjected to combined loading. Thin-Walled Structures,
2016;104:225–37.
[33] Talja A, Salmi P. Design of stainless steel RHS beams, columns and beam-columns.
Research note 1619, VTT building technology, Finland; 1995.
[34] Liu Y, Young B. Buckling of stainless steel square hollow section compression members.
Journal of Constructional Steel Research, 2003;59(2):165–77.
[35] Kuwamura H. Local buckling of thin-walled stainless steel members. International
Journal of Steel Structures, 2003;3(3):191–201.
[36] Young B, Lui WM. Behavior of cold-formed high strength stainless steel sections.
Journal of Structural Engineering (ASCE), 2005;131(11):1738–45.
[37] Zhou F, Young B. Tests of cold-formed stainless steel tubular flexural members. Thin-
Walled Structures, 2005;43(9):1325–37.
[38] Gardner L, Talja A, Baddoo NR. Structural design of high-strength austenitic stainless
steel. Thin-Walled Structures, 2006;44(5):517–28.

[39] Huang Y, Young B. Material properties of cold-formed lean duplex stainless steel
sections. Thin-Walled Structures, 2012;54(7):72–81.
[40] Saliba N, Gardner L. Cross-section stability of lean duplex stainless steel welded I-
sections. Journal of Constructional Steel Research, 2013;80:1–14.
[41] Yuan HX, Wang YQ, Shi YJ, Gardner L. Stub column tests on stainless steel built-up
sections. Thin-Walled Structures, 2014;83:103–14.
[42] Bock M, Arrayago I, Real E. Experiments on cold-formed ferritic stainless steel slender
sections. Journal of Constructional Steel Research, 2015;109:13–23.
[43] Zhao XL, Hancock GJ. Tests to determine plate slenderness limits for cold-formed
rectangular hollow sections of grade C450. Steel Construction, 1991;25(4):2–16.
[44] Sakino K, Nakahara H, Morino S, Nishiyama I. Behavior of centrally loaded concrete-
filled steel-tube short columns. Journal of Structural Engineering (ASCE), 2004;130(2):180–
8.
[45] Greiner R, Kettler M, Lechner A, Freytag B, Linder J, Jaspart JP, Boissonnade N,
Bortolotti E, Weynand K, Ziller C, Oerder R. SEMI-COMP: Plastic Member Capacity of
Semi-Compact Steel Sections–a more Economic Design. RFSR-CT-2004-00044, Final
Report, Research Programme of the Research Fund for Coal and Steel–RTD; 2008.
[46] Gardner L, Saari N, Wang F. Comparative experimental study of hot-rolled and cold-
formed rectangular hollow sections. Thin-Walled Structures, 2010;48(7):495–507.

[47] Nishino F, Ueda Y, Tall L. Experimental investigation of the buckling of plates with
residual stresses. Test methods for compression members, ASTM International; 1967.
[48] Usami T, Fukumoto Y. Welded box compression members. Journal of Structural
Engineering, 1984;110(10):2457–70.
[49] Rasmussen KJR, Hancock GJ. Plate slenderness limits for high strength steel sections.
Journal of Constructional Steel Research, 1992;23(1):73–96.
[50] Im SW, Ko SK, Chang IH. A study on the characteristics of high tensile strength steel
(SM570) plates in compression members. Journal of Korean Society of Steel Construction,
2001;13(3):223–32.
[51] Im SW, Kim YS, Chang IH. A study on the characteristics of SM570TMC plates in
compression members. Journal of Korean Society of Steel Construction, 2005;17(3):357–63.
[52] Gao L, Sun H, Jin F, Fan H. Load-carrying capacity of high-strength steel box-sections I:
Stub columns. Journal of Constructional Steel Research, 2009;65(4):918–24.
[53] Lee CH, Kim DK, Han KH, Kim JH, Lee SE, Ha TH. Compressive strength and residual
stress evaluation of stub columns fabricated of high strength steel. Journal of Korean Society
of Steel Construction, 2012;24(1):23–34.
[54] Yoo JH, Kim JW, Yang JG, Kang JW, Lee MJ. Local buckling in the stub columns
fabricated with HSA800 of high performance steel. International Journal of Steel Structures,
2013;13(3):445–58.

[55] Shi G, Zhou W, Bai Y, Lin C. Local buckling of 460MPa high strength steel welded
section stub columns under axial compression. Journal of Constructional Steel Research,
2014;100:60–70.
[56] Bijlaard PP, Fisher GP. Column strength of H-sections and square tubes in post buckling
range of component plates. Technical Note 2994, Washington DC: National Advisory
Committee for Aeronautics; 1953.
[57] Langseth M, Hopperstad OS. Local buckling of square thin-walled aluminum extrusions.
Thin-Walled Structures, 1997;27(1):117–26.
[58] Moen LA, Hopperstad OS, Langseth M. Rotational capacity of aluminum beams under
moment gradient. I: Experiments. Journal of Structural Engineering (ASCE),
1999;125(8):910–20.
[59] Faella C, Mazzolani FM, Piluso V, Rizzano G. Local buckling of aluminum members:
testing and classification. Journal of Structural Engineering (ASCE), 2000;126(3):353–60.
[60] Mazzolani FM, Piluso V, Rizzano G. Experimental analysis of aluminum alloy channels
subjected to local buckling under uniform compression. Proceedings of XVIII CTA Congress,
Venice, Italy; 2001.
[61] Mennink, J. Cross-sectional stability of aluminum extrusions: Prediction of the actual
local buckling behavior. PhD Thesis; 2002.
[62] Zhu JH, Young B. Tests and design of aluminum alloy compression members. Journal of
Structural Engineering (ASCE), 2006;132(7):1096–107.

[63] Zhu JH, Young B. Experimental investigation of aluminum alloy thin-walled tubular
members in combined compression and bending. Journal of Structural Engineering (ASCE),
2006;132(12):1955–66.
[64] Zhu JH, Young B. Design of aluminum alloy flexural members using direct strength
method. Journal of Structural Engineering (ASCE), 2009;135(5):558–66.
[65] Mazzolani FM, Piluso V, Rizzano G. Local buckling of aluminum alloy angles under
uniform compression. Journal of Structural Engineering (ASCE), 2010;137(2):173–84.
[66] Theofanous M, Liew A, Gardner L. Experimental study of stainless steel angles and
channels in bending. Structures, 2015;4:80-90.
[67] Hibbitt, Karlsson & Sorensen, Inc. ABAQUS. ABAQUS/Standard user's manual
volumes I-III and ABAQUS CAE manual. Version 6.12. Pawtucket (USA); 2012.
[68] Ramberg W, Osgood WR. Description of stress–strain curves by three parameters.
Technical note 902, Washington DC: National Advisory Committee for Aeronautics; 1943.
[69] Hill HN. Determination of stress–strain relations from offset yield strength values.
Technical note 927, Washington DC: National advisory committee for aeronautics; 1944.
[70] Mirambell E, Real E. On the calculation of deflections in structural stainless steel beams:
An experimental and numerical investigation. Journal of Constructional Steel Research,
2000;54(1):109–33.
[71] Gardner L, Ashraf M. Structural design for non-linear metallic materials. Engineering
Structures, 2006;28(6):926–34.

[72] Gardner L, Nethercot DA. Numerical modeling of stainless steel structural components –
A consistent approach. Journal of Structural Engineering (ASCE), 2004;130(10):1586–601.
[73] Cruise RB, Gardner L. Strength enhancements induced during cold forming of stainless
steel sections. Journal of Constructional Steel Research, 2008;64(11):1310–6.
[74] Rasmussen KJR, Hancock GJ. Design of cold-formed stainless steel tubular members. I:
Columns. Journal of Structural Engineering (ASCE), 1993;119(8):2349–67.
[75] Cruise RB, Gardner L. Residual stress analysis of structural stainless steel sections.
Journal of Constructional Steel Research, 2008;64(3):352–66.
[76] Jandera M, Gardner L, Machacek J. Residual stresses in cold-rolled stainless steel
hollow sections. Journal of Constructional Steel Research, 2008;64(11):1255–63.
[77] Zhao O, Gardner L, Young B. Structural performance of stainless steel circular hollow
sections under combined axial load and bending – Part 2: Parametric studies and design.
Thin-Walled Structures, 2016;101:240–8.
[78] Zhao O, Gardner L, Young B. Testing and numerical modelling of austenitic stainless
steel CHS beam-columns. Engineering Structures, 2016;111:263–74.
[79] Zhao O, Gardner L, Young B. Behaviour and design of stainless steel SHS and RHS
beam-columns. Thin-Walled Structures, 2016;106:330–45.
[80] Dawson RG, Walker AC. Post-buckling of geometrically imperfect plates. Journal of the
Structural Division (ASCE), 1972;98(1):75–94.

[81] EN 1990. Eurocode – basis of structural design. Brussels: European Committee for
Standardization (CEN); 2002.
[82] Afshan S, Francis P, Baddoo NR, Gardner L. Reliability analysis of structural stainless
steel design provisions. Journal of Constructional Steel Research, 2015;114:293–304.

List of Tables
Table 1 Summary of the CSM material model coefficients for each metallic material.
Material C1 C2 C3 C4
Hot-finished carbon steel –a –
a –
a –
a
Cold-formed carbon steel 0.40 0.45 0.60 0
High strength steel 0.40 0.45 0.60 0
Austenitic and duplex stainless steels 0.10 0.16 1.00 0
Ferritic stainless steel 0.40 0.45 0.60 0
Aluminium 0.50 0.50 0.13 0.06
a Hot-finished carbon steel material model is under development.
Table 2 Summary of key measured material properties from the tensile flat and corner coupons employed
in the FE models.
(a) Flat material properties.
Material grade E σ0.2 σ1.0 σu R-O exponents
(GPa) (MPa) (MPa) (MPa) n n’0.2,1.0 n’0.2,u
Austenitic 193 343 391 605 6.7 2.4 3.1
Duplex 199 519 578 728 5.3 2.8 3.7
Ferritic 199 470 485 488 7.3 7.6 10.9
(b) Corner material properties.
Material grade E σ0.2 σ1.0 σu R-O exponents
(GPa) (MPa) (MPa) (MPa) n n’0.2,1.0 n’0.2,u
Austenitic 193 526 601 687 10.8 3.0 3.5
Duplex 207 831 906 920 8.9 6.1 4.4
Ferritic 200 579 – 648 4.0 – 7.3
Table 3 Comparisons of test and FE results with predicted strengths for each loading case.
(a) Concentrically-loaded stub columns (pure compression)
EN 1993-1-4 EN 1993-1-5 AISC ASCE AS/NZS CSM DSM
No. of test data: 127 Ru/Ru,EC3-1-4 Ru/Ru,EC3-1-5 Ru/Ru,AISC Ru/Ru,ASCE Ru/Ru,AS/NZS Ru/Ru,CSM Ru/Ru,DSM
No. of FE data: 225
Mean 1.12 1.00 1.07 0.98 0.98 1.07 0.96
COV 0.06 0.07 0.06 0.07 0.07 0.06 0.08

(b) Beams (pure bending)
EN 1993-1-4 EN 1993-1-5 AISC ASCE AS/NZS CSM DSM
No. of test data: 22 Ru/Ru,EC3-1-4 Ru/Ru,EC3-1-5 Ru/Ru,AISC Ru/Ru,ASCE Ru/Ru,AS/NZS Ru/Ru,CSM Ru/Ru,DSM
No. of FE data: 210
Mean 1.30 1.14 1.24 1.10 1.10 1.23 1.11
COV 0.04 0.08 0.04 0.11 0.11 0.05 0.07
(c) Eccentrically-loaded stub columns (combined compression and bending)
EN 1993-1-4 EN 1993-1-5 AISC ASCE AS/NZS CSM DSM
No. of test data: 0 Ru/Ru,EC3-1-4 Ru/Ru,EC3-1-5 Ru/Ru,AISC Ru/Ru,ASCE Ru/Ru,AS/NZS Ru/Ru,CSM Ru/Ru,DSM
No. of FE data: 210
Mean 1.29 1.10 1.22 1.07 1.07 1.17 1.03
COV 0.05 0.09 0.05 0.09 0.09 0.06 0.10
Table 4 Comparisons of test and FE results with predicted strengths for each stainless steel grade.
(a) Austenitic stainless steel
EN 1993-1-4 EN 1993-1-5 AISC ASCE AS/NZS CSM DSM
No. of test data: 104 Ru/Ru,EC3-1-4 Ru/Ru,EC3-1-5 Ru/Ru,AISC Ru/Ru,ASCE Ru/Ru,AS/NZS Ru/Ru,CSM Ru/Ru,DSM
No. of FE data: 215
Mean 1.19 1.06 1.14 1.03 1.03 1.12 1.02
COV 0.10 0.11 0.09 0.11 0.11 0.09 0.11
(b) Duplex stainless steel
EN 1993-1-4 EN 1993-1-5 AISC ASCE AS/NZS CSM DSM
No. of test data: 22 Ru/Ru,EC3-1-4 Ru/Ru,EC3-1-5 Ru/Ru,AISC Ru/Ru,ASCE Ru/Ru,AS/NZS Ru/Ru,CSM Ru/Ru,DSM
No. of FE data: 215
Mean 1.27 1.08 1.20 1.05 1.05 1.18 1.04
COV 0.08 0.09 0.08 0.10 0.10 0.07 0.10
(c) Ferritic stainless steel
EN 1993-1-4 EN 1993-1-5 AISC ASCE AS/NZS CSM DSM
No. of test data: 23 Ru/Ru,EC3-1-4 Ru/Ru,EC3-1-5 Ru/Ru,AISC Ru/Ru,ASCE Ru/Ru,AS/NZS Ru/Ru,CSM Ru/Ru,DSM
No. of FE data: 215
Mean 1.21 1.05 1.15 1.02 1.02 1.14 1.01
COV 0.08 0.09 0.08 0.10 0.10 0.08 0.10

Table 5 Comparisons of test results with predicted strengths for each loading case.
(a) Concentrically-loaded stub columns (pure compression)
EN 1993-1-4 EN 1993-1-5 AISC ASCE AS/NZS CSM DSM
No. of test data: 127 Ru,test/Ru,EC3-1-4 Ru,test/Ru,EC3-1-5 Ru,test/Ru,AISC Ru,test/Ru,ASCE Ru,test/Ru,AS/NZS Ru,test/Ru,CSM Ru,test/Ru,DSM
Mean 1.11 1.02 1.07 0.99 0.99 1.07 0.98
COV 0.08 0.09 0.07 0.09 0.09 0.08 0.09
(b) Beams (pure bending)
EN 1993-1-4 EN 1993-1-5 AISC ASCE AS/NZS CSM DSM
No. of test data: 22 Ru,test/Ru,EC3-1-4 Ru,test/Ru,EC3-1-5 Ru,test/Ru,AISC Ru,test/Ru,ASCE Ru,test/Ru,AS/NZS Ru,test/Ru,CSM Ru,test/Ru,DSM
Mean 1.31 1.21 1.26 1.19 1.19 1.22 1.14
COV 0.08 0.07 0.08 0.08 0.08 0.08 0.07
Table 6 Reliability analysis results calculated according to EN 1990.
Grade No. of test and FE data kd,n b Vδ Vr γM0
Austenitic 319 3.121 1.056 0.088 0.117 1.05
Duplex 237 3.132 1.104 0.073 0.093 1.10
Ferritic 238 3.132 1.072 0.079 0.104 1.08

List of Figures
Fig. 1. CSM elastic, linear hardening material model.
Fig. 2. Comparison of stress–strain curve from a slender section stub column test [31] with CSM material model.
0
100
200
300
400
500
600
0 0.2 0.4 0.6 0.8
Str
ess,
σ (
MP
a)
Strain, ε (%)
ε
Esh fy
εy
σ
fu
C1εu C2εu
E
3 41y
u
u
fC C
f
CSM material model
fu,actual
fcsm
εlb εlb,e

Fig. 3. Experimental equivalent local buckling strain ratio plotted against cross-section slenderness.
Fig. 4. Full CSM base curve with test data on both stocky and slender cross-sections.
0.00
0.20
0.40
0.60
0.80
1.00
1.20
1.40
1.60
1.80
2.00
0.60 0.75 0.90 1.05 1.20 1.35 1.50 1.65 1.80
ε lb,e/ε
y (ε
csm/ε
y)
Cross-section slenderness
Stainless steel stub columns Stainless steel beams
Aluminum stub columns Aluminum beams
High strength steel stub columns Carbon steel stub columns
CSM EN 1993-1-4
EN 1993-1-5 AISC
ASCE AS/NZS
DSM
0
5
10
15
20
25
0.0 0.2 0.4 0.6 0.8 1.0 1.2 1.4 1.6 1.8 2.0
ε csm
/εy
Cross-section slenderness
Test data
CSM base curve for stocky sections (Eq. (10))
CSM base curve for slender sections (Eq. (18))
λ̅𝑝
EN1993-1-4 and AISC
design curves coincide
EN1993-1-5, ASCE and AS/NZS
design curves coincide
CSM base curve
DSM design curve
0.5
1.0
1.5
2.0
2.5
0.6(0.68, 1)
λ̅𝑝

Fig. 5. Illustration of CSM strain and stress distribution for a slender T-section in bending.
Fig. 6. Comparison of stainless steel test and FE results with EN 1993-1-5 strength predictions.
0.0
0.4
0.8
1.2
1.6
2.0
0.6 0.9 1.2 1.5 1.8 2.1 2.4
Ru/R
u,p
red
Cross-section slenderness
Austenitic
Duplex
Ferritic
Plastic neutral axis
Elastic neutral axis
Design neutral axis
εcsm<εy
εcsm,t>εy
fcsm<fy
fcsm,t>fy
f=fy ε=εy
λ̅𝑝

Fig. 7. Comparison of stainless steel test and FE results with SEI/ASCE (or AS/NZS 4673) strength predictions.
Fig. 8. Comparison of stainless steel test and FE results with DSM strength predictions.
0.0
0.4
0.8
1.2
1.6
2.0
0.6 0.9 1.2 1.5 1.8 2.1 2.4
Ru/R
u,p
red
Cross-section slenderness
Austenitic
Duplex
Ferritic
0.0
0.4
0.8
1.2
1.6
2.0
0.6 0.9 1.2 1.5 1.8 2.1 2.4
Ru/R
u,p
red
Cross-section slenderness
Austenitic
Duplex
Ferritic
λ̅𝑝
λ̅𝑝

Fig. 9. Comparison of austenitic stainless steel test and FE results with CSM and EN 1993-1-4 strength
predictions.
Fig. 10. Comparison of duplex stainless steel test and FE results with CSM and EN 1993-1-4 strength
predictions.
0.0
0.4
0.8
1.2
1.6
2.0
0.6 0.9 1.2 1.5 1.8 2.1 2.4
Ru/R
u,p
red
Cross-section slenderness
CSM
EN 1993-1-4
0.0
0.4
0.8
1.2
1.6
2.0
0.6 0.9 1.2 1.5 1.8 2.1 2.4
Ru/R
u,p
red
Cross-section slenderness
CSM
EN 1993-1-4
λ̅𝑝
λ̅𝑝

Fig. 11. Comparison of ferritic stainless steel test and FE results with CSM and EN 1993-1-4 strength
predictions.
Fig. 12. Comparison of test results with CSM and EN 1993-1-4 resistance predictions.
0.0
0.4
0.8
1.2
1.6
2.0
0.6 0.9 1.2 1.5 1.8 2.1 2.4
Ru/R
u,p
red
Cross-section slenderness
CSM
EN 1993-1-4
0.0
0.4
0.8
1.2
1.6
2.0
0.6 0.9 1.2 1.5 1.8
Ru,t
est/R
u,p
red
Cross-section slenderness
CSM_Stub columns CSM_Beams
EN 1993-1-4_Stub columns EN 1993-1-4_Beams
λ̅𝑝
λ̅𝑝