structural reforms and productivity growth in emerging market and
TRANSCRIPT

WP/16/15
Structural Reforms and Productivity Growth in Emerging Market and Developing Economies
by Era Dabla-Norris, Giang Ho, and Annette Kyobe

© 2016 International Monetary Fund WP/16/15
IMF Working Paper
Strategy and Policy Review Department
Structural Reforms and Productivity Growth in Emerging Market and Developing
Economies*
Prepared by Era Dabla-Norris, Giang Ho, and Annette Kyobe
Authorized for distribution by Andreas W. Bauer
February 2016
Abstract
This paper empirically assesses the role of structural and institutional reforms in driving
productivity growth across countries at different stages of development, using a distance-to-
frontier framework. It gauges whether particular policies and reforms matter more for
increasing productivity growth at the aggregate and sectoral levels for some emerging market
and developing economies (EMDEs) than others. Recognizing the possibility of time lags
between reform implementation and reform payoffs, the paper also examines how
productivity gains from various reforms evolve over the the short- and medium-term.
JEL Classification Numbers: D24, O16, O24, O43, O47
Keywords: Total factor productivity; Labor productivity; Economic Growth; Structural
Reforms; Institutions; Emerging Market and Developing Countries; Agriculture; Industry;
Services
Author’s E-Mail Address: [email protected], [email protected], [email protected].
* We would like to thank Kalpana Kochhar and Robert Tchaidze for their helpful comments. An earlier version
of this paper was prepared as input into the IMF SDN, “Anchoring Medium-Term Growth in Emerging and
Developing Economies: The Importance of Productivity-Enhancing Reforms,” (Dabla-Norris et al., 2013).
IMF Working Papers describe research in progress by the author(s) and are published to
elicit comments and to encourage debate. The views expressed in IMF Working Papers are
those of the author(s) and do not necessarily represent the views of the IMF, its Executive Board,
or IMF management.

3
Contents Page
ABSTRACT ....................................................................................................................................... 2
I. INTRODUCTION .......................................................................................................................... 4
II. WHAT REFORMS: A SELECTED LITERATURE REVIEW ............................................................. 6
III. REFORMS AND DISTANCE TO FRONTIER ANALYSIS ............................................................ 9
A. Empirical approach ...................................................................................................................................... 9
Box 1. The Case of Korea ............................................................................................................................. 12
B. Results ............................................................................................................................................................ 13
IV. THE DYNAMIC IMPACT OF REFORMS .................................................................................. 17
A. Empirical approach ................................................................................................................................... 17
B. Results ............................................................................................................................................................ 18
V. CONCLUDING REMARKS ......................................................................................................... 20
Figures
1. Economic Liberalization in Emerging and Developing Economies ............................... 11
2. Korea Productivity Growth in First Generation Reform ..................................................... 12
3. Korea: Total Factor Productivity ................................................................................................. 13
4. Estimated Reform Coefficients by Distance to Frontier ..................................................... 14
5. Estimated Dynamic Reform Impact on Aggregate Labor ................................................. 19
Appendix
I. Definitions of Structural Reforms ................................................................................................ 22
Appendix Tables
1. Reforms and Distance to Frontier: Aggregate Productivity Growth ............................. 24
2. Reforms and Distance to Frontier: Sectoral Productivity Growth .................................. 25
3. Short and Medium-term Impacts: Aggregate Productivity Growth .............................. 26
A1. Reforms and Distance to Frontier: 3 Year Average Aggregate
Productivity Growth ..................................................................................................................... 28
A1. Reforms and Distance to Frontier: 3 Year Average Aggregate
Productivity Growth ..................................................................................................................... 28
References ............................................................................................................................................... 32

4
I. INTRODUCTION
Emerging market and developing economies (EMDEs) as a group have experienced a
remarkable period of growth over the last two decades. Actual and potential growth in many
EMDEs is now slowing and the tailwinds of strong external demand, buoyant commodity
prices, and ample global liquidity are fading. There is a growing consensus that structural
reforms are needed to achieve robust, sustainable growth and to foster convergence to higher
income levels. Reforms to lift productivity growth―a key driver of long-term growth
prospects and improvements in living standards―are central in this regard.
Assessing the impact of reforms on productivity growth is a challenging endeavor as the
benefits are often difficult to gauge. This paper explores two dimensions of the structural
reform debate. The first is the question of how the productivity payoffs of structural reforms
vary as countries develop and move closer to the global technological frontier. The second is
how reform payoffs evolve over time, recognizing that productivity gains from reforms can
take time to materialize. This paper addresses these questions by examining the empirical
association between a range of structural reforms and productivity growth for a sample of
countries.
A large body of empirical evidence finds that structural reforms can improve resource
allocation and boost productive capacity. Potential sources of productivity growth in EMDEs
arise from catch-up growth by absorbing technology and ideas from advanced economies,
structural change into higher-productivity sectors and new activities, and improved resource
allocation within sectors (Dabla-Norris and others, 2013). Higher quality and quantity of
infrastructure and human capital, trade openness, efficient and well-developed financial
systems, and economic institutions that promote competition, facilitate entry and exit, and
encourage entrepreneurship and innovation have been variously found to increase
productivity growth at the cross-country, industry, and firm levels (see for e.g., Nicoletti and
Scarpetta, 2003; Syverson, 2011; Christiansen and others, 2013; OECD, 2013; Prati and
others, 2013; Restuccia and Rogerson, 2013; Bourles and others, 2013).
There is also theoretical support for the hypothesis that the drivers of productivity growth
vary along the development path. Neo-Schumpeterian growth theory suggests that the
process of economic development is influenced by a country’s income gap with countries
that define the global technological frontier (Aghion and Howitt, 2006, 2009). The main
growth driver for economies farther away from the technological frontier is the adoption of
existing technologies. This process can also be more broadly defined as the implementation
of more efficient production techniques. The closer a country gets to the global technological
frontier the higher is the relative importance of innovation instead of imitation for sustaining
productivity and output growth (Acemoglu and others, 2006). An important implication of
this framework is that that the set of policies aimed at sustaining productivity growth and
fostering convergence at earlier stages of development can be different from those that may
be required as economies develop. Therefore, a proper empirical assessment of the relevance

5
of different productivity-enhancing policies requires taking into account the possibility of
non-linear effects arising from a country’s distance to the global technological frontier.
Gains from reforms depend on the types of reforms being implemented, the outcome
examined (output, productivity, or employment), initial macroeconomic and political
conditions, and the time period over which impacts are assessed. The impact also depends on
how reforms shift aggregate demand and supply. In the short-run, some structural reforms
can impact demand through improved confidence and wealth effects stemming from the
expectation of positive future income (Kerdrain et al, 2010). Supply side gains from reforms
largely accrue over the medium- to long-term as they can involve adjustment costs arising
from costly reallocation of labor and capital and firm restructuring.1
This paper makes a twofold contribution to the literature. First, it assesses if the productivity
impact of reforms differs based on a country’s distance to the global technology frontier. In
this sense, the paper is similar to Prati and others (2013) who examine the impact of reforms
on economic growth. In contrast to their paper, we focus on the productivity impacts for a
larger sample of countries and reforms. Second, we examine the dynamic (short- vs.
medium-term) impact of reforms. By focusing on productivity rather than total output
growth, it fills an important gap in the paper literature as it sheds light on the channels
through which reforms increase output. In particular, we examine the impact of a range of
reforms on both aggregate productivity (both total factor productivity (TFP) and average
labor productivity) as well as sector-level productivity (i.e., agriculture, manufacturing, and
services) separately. The sectoral perspective can help shed further light on the mechanisms
underlying aggregate productivity dynamics.
The analysis covers more than a hundred countries at various stages of economic
development. In contrast to most of the existing literature which focuses on advanced
economies, we focus primarily on EMDEs. The reform and institutional measures chosen for
inclusion in the analysis reflect recent theoretical and empirical findings on productivity and
growth determinants as well as data availability. In particular, the analysis makes use of
recent indices compiled by the IMF of de jure reforms and liberalization in the real and
financial sectors. These encompass reforms in domestic financial systems, liberalization of
agriculture, trade, and FDI. These measures are supplemented with variables capturing
institutional quality (e.g., the strength of property rights protection and legal frameworks)
1 Theoretical results of DSGE models (e.g., Cacciatore et al., 2012) find that reforms payoffs accrue over time.
This is partly because benefits materialize through firm entry and increased hiring, both of which are gradual
processes, while any reform-driven layoffs are immediate. Empirically, the dynamic impact of product and
labor market reforms has largely been studied for advanced countries. For example, empirical work by Bouis
and others (2012) and Dabla-Norris and others (2015) finds that reform benefits typically increase over time.

6
and regulatory restrictiveness (e.g., the extent of business and labor regulations) that have
been found to influence economic outcomes in previous studies.2
We find that the importance of different reforms depends on the distance to the technology
frontier. Thus, we find support for both the commonality of productivity drivers and the
dissimilarity of their potency across country groups. For example, while lower income
countries benefit most from reforms that alleviate constraints on trade and foreign
investment, and removal of agricultural price controls and subsidies, emerging market
economies (EMEs) experience relatively larger productivity gains from enhancing the
efficiency of the banking systems, capital market development, and improving the business
environment. Second, our analysis suggests that not all reforms generate immediate
productivity payoffs. For instance, productivity gains from banking system reforms can take
a few years to materialize. Moreover, consistent with previous evidence for advanced
economies (Dabla-Norris and others, 2015), we find that the payoffs from most reforms
increase over time.
An important caveat to our results is that we do not explicitly control for the potential
endogeneity of reforms.3 There are many reasons why reforms are implemented in the first
place, which could be correlated with productivity growth. As such, our results should be
viewed as highlighting correlations rather than identifying causality. However, our results
qualitatively hold across different dependent variables and empirical specifications. Further,
we look at sectoral productivity dynamics, which allow for an examination of the key
channels through which reforms improve aggregate productivity. Second, we estimate the
impact of large structural reform shocks on productivity, which partially attenuates the
endogeneity problem. Finally, we provide robustness check of the results estimated using the
Arellano-Bond Generalized Method of Moments (GMM).
The paper is organized as follows. Section II reviews the reform literature. Section III
presents the distance to frontier analysis, and Section IV looks at the dynamic impact of
reforms. Section V concludes.
II. WHAT REFORMS: A SELECTED LITERATURE REVIEW
A large existing literature has shown that economic reforms that reduce barriers to efficient
factor reallocation, technology adoption, and innovation are associated with higher
productivity growth. In this section we provide a select review of aggregate, sector- and firm-
level evidence, focusing on the variables of interest in our empirical analysis.
2 Structural reforms may also involve actions to address market failures or fiscal policies that affect productivity
more directly. The choice of reform variables considered in this paper was restricted by data availability across
a large sample of countries.
3 See Bordon and others (2015) for an attempt to deal with reform endogeneity.

7
Financial sector reforms
Theoretical and empirical studies find that efficient financial systems can help increase
investment and spur innovation (Levine, 2005), and allow countries to take advantage of
technology transfer. Developed financial systems can also lead to a more efficient allocation
of capital across firms and industries (Rajan and Zingales, 2001; Tressel, 2008). Reducing
financial repression and restrictions on the price or quantity of credit can also facilitate the
movement of resources to more productive uses, both across and within sectors. For instance,
firm-level evidence from 10 Eastern European countries finds that reforms to reduce
financial repression raised manufacturing productivity by 17 percent through improvements
in the within-industry allocation of resources across firms (Larrain and Stumpner, 2013).
Beyond policies to remove financial distortions, previous studies have found that capital
market development is associated with higher productivity growth. Reforms that encourage
the formation and development of equity, bonds (particularly local currency bond markets),
and securities markets can be effective in increasing productivity by lowering the cost of
capital and facilitating the financing of new capital and innovation. Studies, however, find
that the availability of financial instruments useful for financing the innovation process can
be more relevant for countries closer to the technology frontier (Aghion and others, 2005).
Trade and FDI liberalization
Barriers to international trade and foreign investment can impede efficient resource
allocation and technology transfer, thereby reducing productivity growth. An extensive
literature shows that more open economies with lower trade barriers grew faster (Wacziarg
and Welch, 2008). In many low-income countries, especially in Sub-Saharan Africa (SSA),
tariffs are high and non-tariff barriers stymie regional integration and can be a source of low
agricultural productivity growth (Tombe, 2012). Services barriers in developing countries,
especially EMEs, on average, are substantially higher than in Organization for Economic
Cooperation and Development countries (Borchert and others, 2010). An expanding body of
research has documented the positive association between open services markets, FDI in
services, and the performance of domestic firms, including on exports. Evidence suggests
that the dismantling of entry barriers and the easing of regulatory restrictions for FDI in the
services sector is associated with higher productivity in downstream manufacturing sectors
(see for e.g., Arnold and others, 2012, for India; and Fernandes and Paunov, 2012, for Chile).
Labor markets
In many emerging market economies, the combination of rigid hiring and firing practices,
employment protection regulations, and weak income protection systems encourage
informality, rendering it costly for labor to move to more productive sectors. Recent evidence
finds a significant correlation between low TFP growth and high levels of informality in
Latin America and the Caribbean (LAC)—a 1 percentage point decrease in the informality

8
rate is associated with about a 0.5 percentage point decline in the gap between TFP in LAC
versus the United States (IDB, 2013). Moreover, microeconomic evidence finds that labor
productivity and TFP growth tend to be weaker in industries with more stringent employment
protection (Bassanini and Duval, 2009). Evidence also suggests that mandatory dismissal
regulations have a depressing impact on productivity growth in industries where layoff
restrictions are more binding (Bassanini and others, 2000). Firm-level evidence also suggests
that less stringent labor market institutions facilitate the movement of labor to more
productive firms, and foster firm entry and exit (Henrekson and Johansson, 2010). Country-
specific studies find that excessive regulation can slow down job creation in global value
chains, causing countries to miss out on jobs-supporting agglomeration effects and
knowledge spillovers (World Bank, 2012).
Product market reforms
Regulations limiting entry into product markets can hinder the adoption of technologies by
reducing competition, constraining technology spillovers, and discouraging the entry of new
high technology firms. These are found to be more of a detriment to productivity growth for
countries closer to the global technology frontier (Aghion and others, 2009). Indeed,
evidence from OECD countries suggests that countries with lighter direct and indirect
regulatory burdens have experienced higher productivity growth rates (Dall’Olio and others,
2013). Low product market competition is also found to impair productivity growth, inhibit
new firm creation and business investment, and reduce the speed of diffusion of new
technologies and production techniques (Conway and others, 2006). Liberalizing product
markets can facilitate firm monitoring and encourage managers or state-owned firms to
improve efficiency. This impact may be sizable in some EMDEs given large state-owned
sectors, which create implicit barriers to entry. The impact of product markets on
productivity has also been extensively analyzed at the sector level. In manufacturing, gains
from lowering entry barriers are higher the farther a country is from the frontier because
strict regulatory settings can curb incentives to adopt new technologies (Nicoletti and
Scarpetta, 2003; Dabla-Norris and others, 2015; Bourles and others, 2013).
Agricultural sector reforms, including efforts to scale back excessive government
intervention (e.g., export monopolies or administered prices) and boost within-sector
productivity (e.g., through appropriate land reforms, tenancy restrictions, and improvements
in physical infrastructure and crop yields) can generate economy-wide productivity gains
(Adamopoulos and Restuccia, 2011). Agricultural reforms can also facilitate structural
transformation, particularly in economies with large shares of agricultural employment
(Dabla-Norris et al., 2013).
Institutions
Property rights and the ability to enforce contracts are two critical elements of a country’s
institutional and legal framework. Such institutions can promote private investment and

9
entrepreneurship, foster financial sector development, and improve the efficiency of resource
allocation, thereby boosting productivity growth. Indeed, evidence suggests that secure
property rights and sound legal systems have a first-order effect on long-term economic
growth (Acemoglu, Johnson, and Robinson, 2005).
Human capital and innovation.
Human capital facilitates the development of a skills-intensive industries and new
technologies, and can also influence a country’s productivity by encouraging technological
diffusion between firms. Evidence suggests that primary and secondary education matters
more for a country’s ability to imitate the frontier technology, while tertiary education has a
larger impact on a country’s capability of innovating (Aghion and Howitt, 2009). In
particular, as a country catches up to the global technology frontier, tertiary education
becomes more relevant for growth rather than primary and secondary education
(Vandenbussche and others, 2006).
Investment in research and development can increase growth by facilitating innovation in
countries near the technology frontier and increasing the absorptive capacity of countries not
yet there (Acemoglu and others, 2006). As countries move up value chains, technology
transfer tends to be more skill intensive, requiring sufficient research and development in the
recipient country to adapt new technologies to local conditions.
III. REFORMS AND DISTANCE TO FRONTIER ANALYSIS
A. Empirical approach
Empirical model
Cross-country analysis can shed light on the extent to which the short-term productivity
payoffs of structural reforms differ across countries at different development levels. We
grouped countries into income quartiles according to their distance to the global technology
frontier, as approximated by a country’s real per capita GDP gap with the United States (a
proxy for the technological frontier).4 In any given year, countries are classified into quartiles
(denoted by Q1 through Q4, with Q4 being those countries that are closest to the frontier).
Low-income countries mostly comprise the first quartile, and most EMEs in the latest year
fall into the second (e.g., China, India) or third quartiles (e.g., Chile, Poland). The set of
countries belonging to each quartile varies from year to year. The model is estimated using a
sample of 108 countries for the period 1970–2011, depending upon available data for the
reform indicators.
4 Using productivity gap instead of the income gap makes no material differences to the identified quartiles.

10
For each country group Q1-Q4, we estimate the following specification using panel fixed-
effect estimator, similar to Prati and others (2013):
y i,t is the annual productivity growth rate in country i at year t. We use several measures of
productivity: aggregate TFP measured as the residual from a standard aggregate Cobb-
Douglas production, aggregate labor productivity (output per worker), and average labor
productivity in the three broad sectors (agriculture, manufacturing and services).5 We focus
on productivity rather than growth, because despite the broad-based up-tick in growth across
most countries in the 2000s, catch up growth in EMDEs was driven mainly by labor
productivity, reflecting the contribution of technology and efficiency gains (TFP), greater
capital intensity, or both (Dabla-Norris and others, 2013). A one year lag of the productivity
levels gap with the United States is included to capture convergence effects. , 1i tX is a one
year lag of the reform indicator or institutional variable, entered separately (one-by-one) in
each regression.6 The model tests for the short-term effect of reforms on productivity growth,
and the focus is on how the size and statistical significance of the β2 coefficient differs across
the different income groups. The equation controls for time effects t to capture common
time trends (e.g. oil price shocks and other global shocks) and time-invariant country effects
i (e.g., geographical location, historical legacies and legal origins). We use robust standard
errors clustered at the country level to allow for correlation among observations within the
same country over time.
Data
The data is taken from several sources. TFP and aggregate labor productivity growth are
from the Penn World Tables (PWT, version 8.0). Average labor productivity in agriculture,
manufacturing and services sectors is calculated as real value added per worker, using sector-
level value-added data from the UN National Accounts database and sector-level
employment from a combination of sources: the International Labor Organization, the World
Bank’s World Development Indicators, and the Groningen Growth and Development Center
5 As TFP growth is measured as a residual, any measurement errors in the labor and capital series will be
captured in the estimate.TFP growth depends on advances in technology and also captures the efficiency with
which labor and capital are combined to generate output. This depends not only on businesses’ ability to
innovate, but also on the extent to which they operate in an environment that fosters competition, imposes less
onerous administrative burdens, provides modern and efficient infrastructure, and allows easy access to finance
(Svyerson 2011).
6 Some reforms can have complementary effects and are often implemented as a package (e.g., product and
labor market reforms), so that the correlation in reform indices renders it challenging to include all types of
reforms together in aggregate cross-country panel regressions. The estimated effect of each reform included one
by one should be viewed as the upper-bound impact.
, 0 1 , , 1 2 , 1 ,y yi t i US t i t t i i tX

11
(GGDC) database. Per capita GDP data (to calculate distance to the frontier) are from PWT
(purchasing-power-parity-adjusted constant U.S. dollars).
The reform and institutional measures chosen for inclusion in the analysis reflect theoretical
and empirical findings on productivity and growth determinants described in previous
sections as well as data availability. In particular, the analysis makes use of recent indices
compiled by the IMF of de jure reforms and liberalization in the real and financial sectors.
These measures are supplemented with variables capturing institutional quality (e.g., the
strength of property rights protection and legal frameworks) and regulatory restrictiveness
(e.g., the extent of business and labor regulations). Given the paucity of data on education
quality and research and development, these variables were not explicitly accounted for in
the regression analysis.
Structural reform indices are compiled by the IMF (2008).7 These are annual indicators of
enacted reforms in international trade, FDI, the financial sector (banking system and capital
market), and liberalization of agriculture. All reform indices are normalized to range between
0 and 1, with higher values indicating a greater degree of liberalization. By these metrics,
EMDEs on average have significantly liberalized their economy on all fronts since the early
1990s or so, although some reform areas recorded more progress than others (Figure 1).
Institutional variables include the quality of labor market institutions and business
regulations as captured by the Fraser index, with higher values denoting less restrictive
regulations. To check the robustness of the results, alternative data sources for institutional
quality and business regulations were also considered.
7 See Appendix I for the definition of reforms.
Figure 1. Economic Liberalization in Emerging and Developing Economies (indices, normalized between 0 and 1, represent means across countries;
higher values mean greater liberalization)
Sources: IMF (2008) and IMF staff estimates.
0.0
0.2
0.4
0.6
0.8
1.0
1970 1980 1990 2000
Domestic financial sector
Agriculture
External capital account
Trade (tariff)
Trade (current account)
Telecommunicationsand electricity
12
Country experiences also suggest that economies face evolving growth challenges at
different stages of development, and that these require different sets of reform priorities.
Countries that have successfully kick-started and maintained high productivity growth rates
were able to do so by adapting reforms over time. Korea’s case stands out as an illuminating
example in this regard (Box 1).
Box 1. The Case of Korea
Korea’s reform experience illustrates that countries face evolving growth challenges at different stages of
development, and that these require different sets of reform priorities. Considered a star of economic
development, Korea experienced a transition to advanced economy status, with per capita real GDP (in PPP
2005 US$) increasing from around $2,000 in 1960 to $28,000 by 2008. Its growth trajectory was not free of
recessions and crises, but often these were turned into opportunities to implement economic reforms that bore
subsequent productivity and growth payoffs.
First-generation reforms
Korea grew fast between 1960 and 1980. This episode was characterized by high investment rates, exports,
improved human capital (helped by education reforms), and a stable macroeconomic environment. In the
second half of the 1970s, the government embarked on a large-scale program subsidizing industry. The large-
scale government-directed investment projects increased the current account deficit, exacerbated by the oil
shocks of the 1970s, combined with an agricultural disaster, political turmoil and previous policy mistakes,
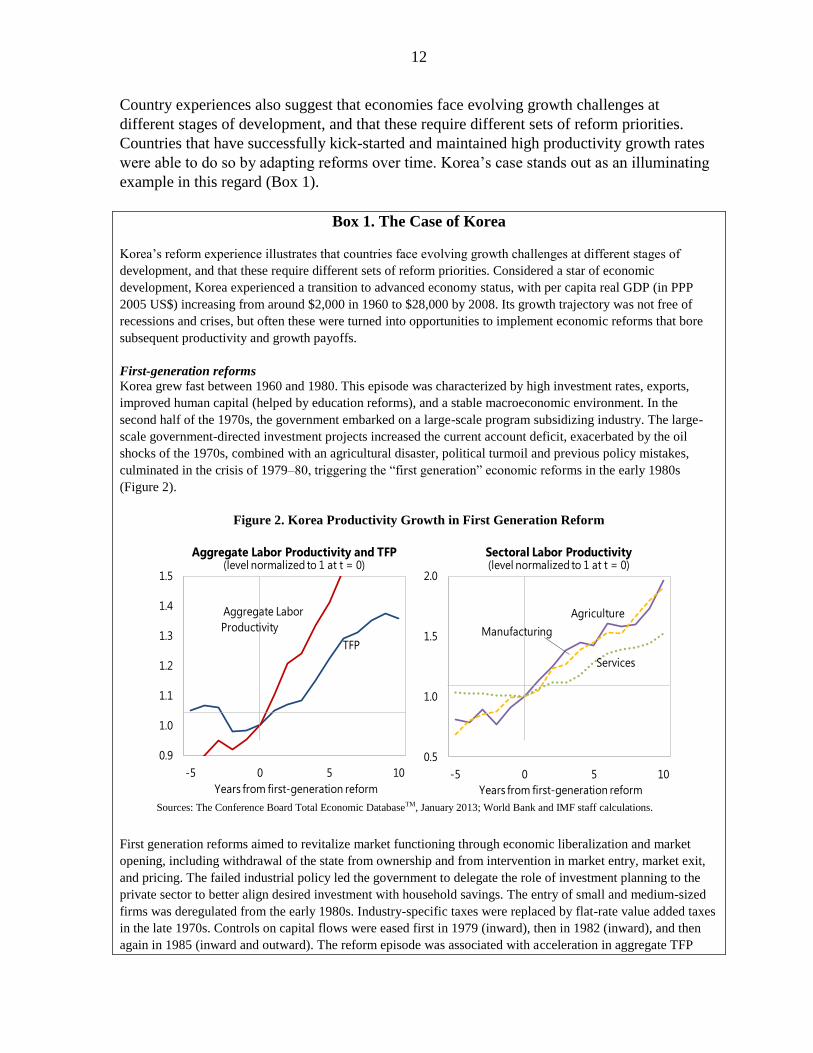
culminated in the crisis of 1979–80, triggering the “first generation” economic reforms in the early 1980s
(Figure 2).
Figure 2. Korea Productivity Growth in First Generation Reform
Sources: The Conference Board Total Economic DatabaseTM, January 2013; World Bank and IMF staff calculations.
First generation reforms aimed to revitalize market functioning through economic liberalization and market
opening, including withdrawal of the state from ownership and from intervention in market entry, market exit,
and pricing. The failed industrial policy led the government to delegate the role of investment planning to the
private sector to better align desired investment with household savings. The entry of small and medium-sized
firms was deregulated from the early 1980s. Industry-specific taxes were replaced by flat-rate value added taxes
in the late 1970s. Controls on capital flows were eased first in 1979 (inward), then in 1982 (inward), and then
again in 1985 (inward and outward). The reform episode was associated with acceleration in aggregate TFP
0.9
1.0
1.1
1.2
1.3
1.4
1.5
-5 0 5 10
Years from first-generation reform
TFP
Aggregate Labor
Productivity
Aggregate Labor Productivity and TFP(level normalized to 1 at t = 0)
0.5
1.0
1.5
2.0
-5 0 5 10
Years from first-generation reform
Agriculture
Services
Manufacturing
Sectoral Labor Productivity(level normalized to 1 at t = 0)

13
growth (average 3.6 percent per annum in the following decade), as well as in agricultural and services sector
labor productivity growth. The 1980–90 period saw rapid increases in real per capita income, investment, and
exports.
Second-generation reforms
The sizable productivity gains accrued from first generation reforms tapered off by the early 1990s. Distortions
in the financial markets remained, with directed lending and highly regulated interest rates, much of which were
a legacy from the industrial policies of the 1970s. Korea’s industrial sector (e.g. manufacturing, trading, heavy
industry) was still dominated by the chaebol (business conglomerates) which drained away capital from the rest
of the economy because they were for many years considered “too big to fail” and hence shielded from market
discipline. It was not until the 1997 Asian financial crisis that the weaknesses of the system were widely
understood, and reform measures were invigorated to restructure the business sector, banking, the public sector,
and the labor market (i.e., “second generation” reforms). Measures included, for example, creation of agencies
in charge of financial regulation and oversight, increased reserve requirements, requirements to improve
management transparency and accountability in the business sector, and increased flexibility in the labor
market. Economic reforms combined with aggressive counter-cyclical monetary and fiscal policies, significant
growth in the export sector, and high FDI inflows enable a swift recovery from the crisis. TFP growth was once
again boosted (Figure 3), and the economy grew at an annual rate of 5.3 percent during 2000–08, with exports
increasing their share of GDP from 32 percent in 1997 to 53 percent in 2008.
Figure 3. Korea: Total Factor Productivity
(normalized to 1 in 1982)
Sources: Penn World Table 8.0; and IMF staff calculations.
B. Results
Baseline results
Table 1 shows results of the impact of reforms on economy-wide productivity growth (TFP
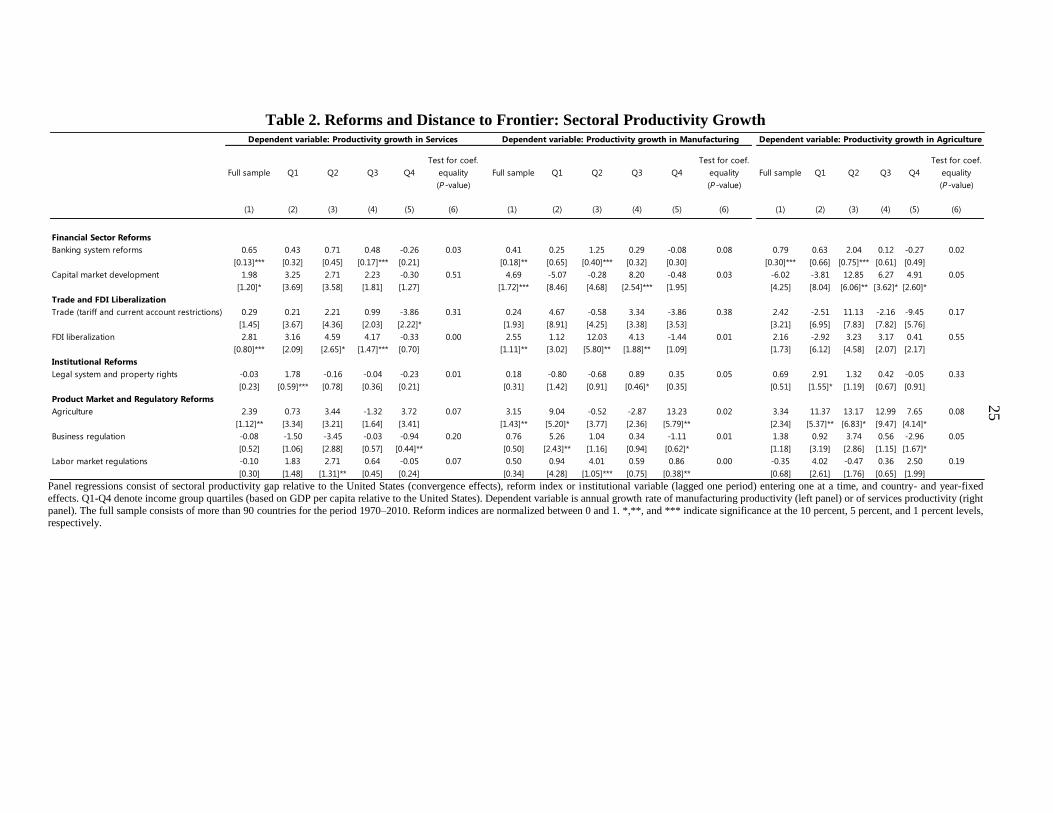
and average labor productivity), while Table 2 present results on labor productivity growth in
the services, manufacturing and agricultural sectors. Estimates are reported for the full
sample (column 1) and each income quartile (columns 2–5). Column 6 presents the p-value
of the test for the equality of the coefficient estimates across the different quartiles. In
general, although the various reform and institutional variables broadly behave directionally
0.9
1.0
1.1
1.2
1.3
1.4
1.5
1.6
1.7
1977 1982 1987 1992 1997 2002 2007
First-generationreform
Second-generationreform
TFPLinear trend line

14
the same way across country groups, the size and significance of coefficients differ across the
quartiles.
Overall, our results indicate that the productivity payoffs of reforms differ as countries close
their gap to the global technological frontier. For example, while trade liberalization and
agricultural reforms are associated with higher productivity growth in lower-income
countries, banking system reforms and lower business regulations are particularly important
for EMEs (Figure 4). The magnitude of the impact of some reforms is economically
significant. For example, a full liberalization of credit controls in the banking sector (i.e.
reform index goes from 0 to 1) is associated with a higher short-term TFP growth of about
2.9 percentage points on average for countries in the second quartile (typically lower-middle
income countries), whereas this effect is insignificant for other income groups. More detailed
results for each type of reform are discussed below.
Figure 4. Estimated Reform Coefficients by Distance to Frontier (TFP growth specification, * represents level of significance)
Source: IMF staff calculations. *, **, and *** indicate significance at the 10 percent, 5 percent, and 1 percent levels, respectively.
The importance of financial sector reforms for increasing productivity growth varies across
the development path.
Banking sector reforms. Our results suggest that aggregate productivity payoffs from
undertaking banking system reforms, including for the various subcomponents of
banking sector reforms (privatization and the strengthening of supervision) accrue for all
countries. However, significant cross-country differences exist. Lower-middle-income
countries (second quartile), which tend to have more bank-based financial systems,
benefit most from banking system reforms. In particular, the coefficient estimates for the
various subcomponents of banking sector reforms are statistically different from each
*
***
***
**
***
**
***
**
***
*
***
***
-1
0
1
2
3
4
5
6
7
Banking system
reforms
Trade reform Institutional
reform
Agriculture Business
regulation
Q1
Q2
Q3
Q4

15
other across the different quartiles, with the coefficients on the reform variables highest
for countries in the second quartile. Underlying the increase in aggregate productivity is
the higher productivity gains that accrue across all sectors. For instance, banking sector
reforms increase manufacturing sector productivity in lower middle-income countries
(those in the second quartile). They also are associated with a statistically significant
positive effect on services and agricultural sector productivity growth, mostly in upper-
middle income countries (third quartile).
Capital market development. The magnitude of the coefficient on capital market
development is statistically significant and highest for upper-middle-income countries
(third quartile), suggesting that these countries can reap significant productivity gains by
further developing their capital markets. These results are consistent with the evidence
from Aghion and others (2005) for a smaller sample of countries. The largest productivity
gains accrue in manufacturing and agricultural sectors for countries closer to the frontier
(third and fourth quartiles).
Trade reforms and liberalization of FDI boost productivity growth, especially in EMDEs.
Reducing trade barriers. The empirical results suggest that reducing trade barriers can
raise average labor productivity growth in low-income countries (column 2, Table 1).
Reducing such barriers could help to open up new markets, facilitate export
diversification, including through better market access, cheaper imported inputs, and
greater competition. This could be especially relevant for low-income countries in Sub-
Saharan Africa, where nontariff barriers stymie regional integration and agricultural
productivity gaps remain wide.
Liberalizing FDI. The empirical results suggest that liberalization of FDI can boost
productivity growth in manufacturing and services sectors in middle-income countries
and foster economy-wide productivity gains (columns 3–4, Tables 1–2). Given the
growing role of the services sector in EMs, further liberalization of FDI could confer
important growth benefits.
Institutional reform is productivity enhancing, particularly in low-income countries. The
analysis suggests that all EMDEs can reap productivity gains from improving the quality of
their institutional frameworks that protect property rights and facilitate private contracting.
The magnitude of the coefficient estimates, however, is highest for low-income countries,
suggesting that productivity and growth benefits from strengthening institutions are most
pronounced for this group. Across sectors, improved legal systems and property rights

16
increase productivity in agriculture and services—a result that is significant for low-income
countries (first quartile).8
Productivity dividends from product market and regulatory reforms are important across all
country groups, but, with the exception of agricultural sector reforms, tend to be largest for
countries closer to the technology frontier (higher income quartiles).
Business regulations. The results suggest that reforms focused on reducing administrative
burdens and improving the investment climate are positively associated with higher
aggregate productivity growth for middle-income countries, and for manufacturing
productivity growth in low-income countries. In manufacturing, the gains from lowering
entry barriers are higher the farther a given country is from the technology leader, in part
because strict regulatory settings can curb incentives to adopt new technologies.
Agricultural sector reforms. The results suggest that agricultural sector reforms are
associated with higher productivity growth in low- and lower-middle-income countries,
where agriculture is a more dominant share of economic activity and employment.
Moreover, agricultural sector reforms are associated with both higher agricultural sector
productivity but also higher manufacturing sector productivity in low-income and lower-
middle income countries, suggesting the existence of significant spillovers and linkages
among the sectors.
Labor market regulations. The empirical results suggest that removing excessive labor
market rigidities can boost aggregate and sectoral productivity growth in middle-income
countries (in the second and third quartiles) closer to the technology frontier, but the
reform payoffs are likely to be more limited in low-income countries. Interestingly, the
productivity payoffs from labor market reforms tend to be most significant for
manufacturing and services sectors for lower-middle income countries (in the second
quartile).
Robustness
In order to assess the robustness of our results, we undertook two separate analyses. First, we
re-estimated all the specifications using three-year averages for productivity growth as well
as the independent variable (Table A.1). This attempts to remove cyclical variations in the
productivity growth series and gives greater confidence to the persistence of the reform
impact. Most results are robust, including across income groups. Institutional reforms, while
associated with higher TFP and aggregate labor productivity for the full sample, are no
longer significant across income groups. Weaker results are explained by fewer observations
for each income group.
8 Private institutions―sound accounting and reporting standards, transparency, and maintaining investor and
consumer confidence―can be just as important for growth. The paucity of cross-country data on these issues,
however, precludes an empirical analysis of the role of strong private institutions in boosting productivity.

17
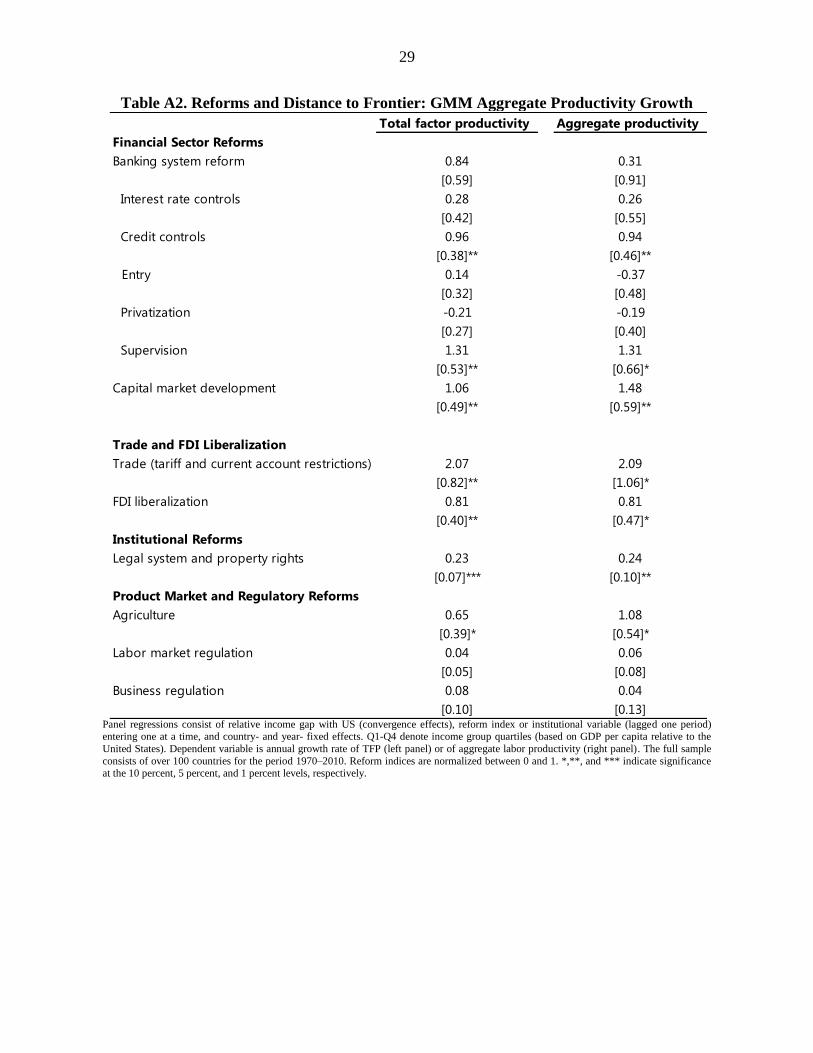
Second, for the full-country sample, we re-estimate the baseline specification using system-
GMM, instrumenting for each of the reform variables using 2 of its own lags.9 The results are
reported in Table A.2. Most results hold, including for capital market development, trade
reforms and some domestic financial sector reforms, such as loosening of credit controls.
Banking system reforms, labor and business regulations, however, loose significance in this
specification.
IV. THE DYNAMIC IMPACT OF REFORMS
A. Empirical approach
Reforms can generate productivity payoffs with a lag, and possibly entail short-term costs.
To test this hypothesis for our sample of countries, we focus on reform shocks identified by
large changes in the reform indices.10
Thus, our approach implies that it is not the level of
liberalization, but a (large) change in the degree of liberalization, that has significant
productivity impacts. This approach is also less likely to be plagued by endogeneity concerns
since large reform changes are less likely to be systematically correlated with other variables
that could affect productivity growth.
We identify two large reform shocks. These are identified using reform variables from the
previous section. The first shock “sd-shock” captures changes in reforms that are larger than
two standard deviations. It takes the value 1, if the calculated as the year-on-year change in
the reform index is larger than two standard deviations and zero otherwise.11
As a robustness
test, a second shock, an “up-break” in reform is constructed using the Berg et al. (2008)
structural break algorithm. This procedure identifies statistical structural breaks in the data,
requiring that the change in the series is both large as well as long-lasting. The year of the
up-break denotes the year before an abrupt and persistent statistically significant increase in
the reform indicator. As before, the variable takes the value 1 if there is an “up-break”
There are on average 106 “sd-shocks” across all reform indicators and 166 average “up-
breaks” identified across the full sample of countries and time periods. The two sets of
reform shocks overlap, despite being identified using different criteria (available from
authors upon request).
We use these shock variables to examine the dynamic impact of reforms on productivity
growth. The approach, following work by Ahrend and others (2011), Bouis and others
(2012), and Dabla-Norris and others (2015), estimates a set of five independent equations to
9 We do not do this analysis by income quartile, as using instruments absorbs too many degrees of freedom to
allow a sufficiently robust analysis of system GMM.
10 We do not do this in the distance to frontier analysis, as this limits the number of reform episodes that would
meet the criteria.
11 The standard deviation is calculated across the entire cross-country reform distribution.

18
identify the impact of reforms up to five years after they were implemented. The estimated
coefficient 3k gives the impact at horizon k (k =1, …,5). Impulse responses to reform shocks
can be calculated from these coefficients over a 5 year horizon to capture short- and medium-
term impacts. Data limitation on the number of reform shocks dictate that we run the
specification across a joint total sample instead of dividing the sample into income quartiles.
As in the distance-to-frontier specification, a one year lag of the productivity gap with the
United States is included to capture convergence effects. ,i ty is the log level of TFP;
agricultural; manufacturing and service productivity. The dependent variable is thus,
productivity growth, the difference in the log-level of productivity between year t and t-1.
The regression includes lags of the dependent variable as explanatory variables. , 1i tX is a
reform shock (“up-break” and “sd-shock”) across each reform indicator or institutional
variable. Following OECD (2012), the equation includes crises episodes to control for the
possibility that economic crises facilitate large reform episodes and are also likely to affect
productivity growth. Five lags of crisis indicators, taking the value one if the country in that
year experienced a banking, currency, or debt crisis, are included (from Laeven and
Valencia’s (2008) crisis database). The equation also controls for time t k and country fixed
effects ik .
B. Results
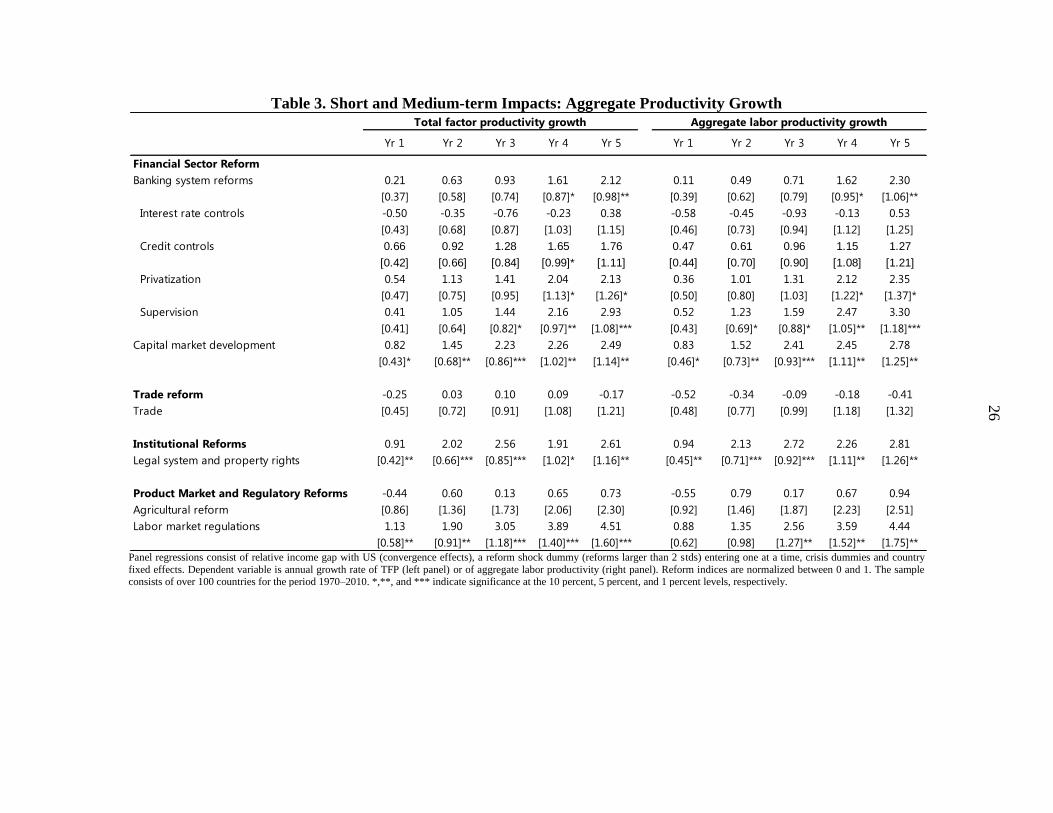
Tables 3 and 4 report the estimated dynamic impact of reforms on aggregate and sectoral
productivity growth, respectively, using “sd-shock” as the relevant reform measure.12
The
impacts are cumulative and reported for one to five-year horizons.
Short-term impact of reforms
We find no evidence of costs to reforms in terms of growth in the short run (i.e., the year
immediately after a large reform is implemented) and across a number of reforms even a
positive payoff. Though results are not directly comparable across specification,
encouragingly, short-term results in the dynamic specification using a large reform shock
variable are—for the majority of reforms—robust to results using the level of reform indices
in the previous section for the full sample (column 1, Table 1 and 2).
12
We had to drop business regulations from the set of reforms included in the dynamic specification due to
insufficient observations of reform shocks.
5
, , 0 1 , , 1 2 , 3 , , , , ,
0
y y y yj
i t k i t k i US t k i t j k i t t k i k i t k
j
X

19
For example, capital market development, and institutional and agricultural sector reforms
are associated with higher TFP and aggregate labor productivity growth in the short term.
However, trade liberalization and labor market reform only have productivity payoffs over
the longer term, possibly reflecting costs associated with resource re-allocation.
Medium-term impact of reforms
Looking over longer horizons, some reforms are associated with increases in productivity
growth that are long-lasting. For example, productivity payoffs accruing from capital market
development (e.g., development of securities markets) can be sizable—about 2.8 percentage
point by the fifth year (or over 0.5 percentage point per year on average). As expected,
capital market development improves aggregate productivity growth by boosting
productivity in the sector most reliant on credit, which is manufacturing. Not surprisingly,
improvements in the legal system and property rights are associated with continuous
increases in productivity over 5 years. While some reforms generate immediate productivity
gains, others take more time for the associated benefits to materialize. For example,
productivity gains from banking sector reforms (lifting interest rates and credit controls, bank
privatization, and removing entry barrier) are reaped around four years after the reforms are
put in place (Figure 5). Moreover, our results indicate that higher agricultural and
manufacturing productivity growth drive aggregate productivity developments.
Figure 5. Estimated Dynamic Reform Impact on Aggregate Labor Productivity Growth (percentage point; average impact with 90 percent CI)
Source: IMF Staff calculations.
Robustness
Results using the alternative measure of reform shock (up-break) for aggregate and sectoral
productivity growth are presented in Tables A.3 and A.4 respectively. The estimated
dynamic impacts of banking system and trade reforms using this alternative reform measure
are qualitatively in line with the two standard deviation (“sd-shock”) results. However, the
magnitude of the coefficient estimates is larger, possibly reflecting the more stringent criteria
used in identifying a reform up-break—that is, changes in reform indicators are not only
large but also persistent. Results for other reforms are less consistent. For example,
-1
0
1
2
3
4
5
0 1 2 3 4 5
Banking system reform
0
1
2
3
4
5
6
0 1 2 3 4 5
Capital market development

20
productivity gains from improving the legal system and property rights are weaker (and only
significant for aggregate productivity) and less long-lasting.
V. CONCLUDING REMARKS
This paper assesses the short- and medium-term impact of structural reforms on aggregate
and sectoral productivity growth. Our results indicate that the productivity dividends depend
on where a country is in the development process, highlighting the need for calibrating
reforms to the stage of economic development. Although the empirical results are not
intended to suggest that the specific reforms discussed in the note should be implemented by
all countries in the income group, they emphasize the need for taking this into account.
Moreover, the analysis suggests that reforms need to be continually adapted as income gaps
close.
Despite progress in recent decades, the scope for structural reforms remains considerable in
most EMDEs, and recommendations tailored to the country’s position along the development
path can help focus attention to areas in which potential productivity payoffs are likely to be
larger. We find that lower income countries can benefit from reforms that remove constraints
to the free movement of goods and factors of production, such as trade and foreign
investment liberalization, which would facilitate the adoption and transfer of technology
from more advanced trading partners. Strengthening economic institutions needed for
market-based economic activity can also spur productivity growth. Moreover, given the often
dominant size of the agricultural sector at early stages of development, removal of inefficient
state control and subsidies in agriculture can help boost productivity growth. This can also
facilitate structural transformation by facilitating resource reallocation and boosting
productivity in manufacturing sectors.
As economies and the financial structures develop and become more sophisticated, reform
payoffs and priorities shift. EMs, in particular, can reap significant gains by advancing the
second generation reform agenda to boost productivity and foster innovation by upgrading
institutions and markets. The required mix of reforms will vary across countries, but
productivity gains depend on deepening financial markets and moving to market-driven
allocation of finance, adopting more competitive product and labor market regulations, and
reducing barriers to FDI for a more vibrant services sector.
Looking over longer horizons, our empirical analysis finds that the productivity payoffs vary
across reforms and over time. For instance, productivity payoffs from capital market
development and improving legal systems and property rights can be sizable and persistent
over time. At the same time, productivity payoffs from banking system reforms can take time
to materialize. This is to be expected, as a reallocation of resources is not an automatic
process. Indeed, country experiences suggest that attaining a more efficient resource
allocation necessarily involves a gradual adjustment process.
21
Several caveats are needed in interpreting the results and extrapolating into policy
conclusions. First, it is difficult to fully account for complementarities in the determinants of
productivity growth. The focus of this paper is on the individual effect of reforms rather than
how reforms in different areas interact in their effects on productivity growth. Given that
many of these reforms are often implemented as a policy package, this approach could under-
or overstate their individual measured impact on productivity growth. The regression results
also do not account for reform complementarities because the high correlation in the reform
indices requires them to enter the regressions one at a time. Second, issues of reform
sequencing that could be critical for reform benefits to materialize are not addressed. Third,
policy reforms may have nonlinear effects that can be contingent on the quality of political
and economic institutions (Acemoglu and others, 2005). This empirical analysis instead
considers the impact of reforms by countries’ distance from the frontier. To the extent that
income levels are correlated with institutional quality, the analysis implicitly accounts for
this complementarity.

22
Appendix I. Definition of Structural Reforms
Financial sector
The dataset, from Abiad and others (2010), contains two measures of financial sector
reforms: domestic financial sector and the extent of capital account liberalization. The
domestic financial sector liberalization indicator includes measures of securities markets and
banking sector reforms. The securities markets subindex assesses the quality of the market
framework, including the existence of an independent regulator and the extent of legal
restrictions on the development of domestic bond and equity markets. The banking subindex
captures i) reductions or removal of interest rate controls (floors or ceilings), ii) credit
controls (directed credit and subsidized lending), iii) competition restrictions (limits on
branches and entry barriers in the banking market, including licensing requirements or limits
on foreign banks), iv) the degree of public ownership of banks and v) a measure of the
quality of banking supervision and regulation, including the power and independence of bank
supervisors, the adoption of Basel capital standards, and the presence of a framework for
bank inspection.
Labor Market
Labor market reforms are made up of two sub-indices: Hiring and firing regulations: This
index is based on an Executive Opinion Survey conducted by the World Economic Forum,
which asks whether the hiring and firing of workers in a country is impeded by regulations
(=1) or flexibly determined by employers (=7). Collective bargaining: This index assesses
whether wages in a country are generally set by a centralized bargaining process (=1) or up to
each individual company (=7). Data is from the world Economic Forum, Global
Competitiveness Report.
Product market
The product market reforms cover i) the degree of liberalization in the telecommunication
and ii) electricity markets, including the extent of competition in the provision of these
services, the presence of an independent regulatory authority, and privatization.
Agricultural sector
The agricultural sector indicator captures intervention in the market for the main agricultural
export commodity in each country. It measures the extent of i) public intervention in the
market going from total monopoly or monopsony in production, transportation or marketing
(i.e., the presence of marketing boards), ii) the presence of administered prices, iii) public
ownership of relevant producers or concession requirement to free market. Data is from Prati
et al. 2012 "Which reforms work and under what institutional environment? Evidence from a
new dataset on structural reform"; IMF Index of Agricultural regulation.
23
Trade liberalization
Trade reforms are captured using two indicators: one tariff-based measure (measured on a
scale of 0 to 1, where zero means tariff rates are 60 percent or higher and 1 means tariff rates
are zero). Data is from Prati and others. 2013 "Which reforms work and under what
institutional environment? Evidence from a new dataset on structural reform."
Capital account liberalization
We use two measures of capital account liberalization from Chin-Ito (2006). The first
measures the extent to which a government is compliant with its obligations under the IMF’s
Article VIII to free from government restriction the proceeds from international trade in
goods and services. The second index gives information on a broad set of restrictions
including, for example, controls on external borrowing between residents and non-residents,
as well as approval requirements for foreign direct investment (FDI).
Institutional reforms
The index of legal system and property rights gauges the legal protections afforded
individuals and property, and thus a legal system consistent with economic freedom in terms
of the rule of law, security of property rights, an independent and unbiased judiciary, and an
impartial court system. The index is compiled by EFW-Fraser Institute from three primary
sources: the PRS Group’s International Country Risk Guide, the World Economic Forum’s
Global Competitiveness Report, and the World Bank’s Doing Business project and
Worldwide Governance Indicators. Data is from EFW-Fraser Institute Database, 1975–2012.

24
Table 1. Reforms and Distance to Frontier: Aggregate Productivity Growth
Panel regressions consist of relative income gap with US (convergence effects), reform index or institutional variable (lagged one period) entering one at a time, and country- and year-fixed effects. Q1-
Q4 denote income group quartiles (based on GDP per capita relative to the United States). Dependent variable is annual growth rate of TFP (left panel) or of aggregate labor productivity (right panel).
The full sample consists of over 100 countries for the period 1970–2010. Reform indices are normalized between 0 and 1. *,**, and *** indicate significance at the 10 percent, 5 percent, and 1 percent levels, respectively.
Full sample Q1 Q2 Q3 Q4Test for coef.
equality (P-value)Full sample Q1 Q2 Q3 Q4
Test for coef.
equality (P-value)
(1) (2) (3) (4) (5) (6) (1) (2) (3) (4) (5) (6)
Financial Sector Reforms
Banking system reforms 3.27 2.94 6.37 5.93 0.46 0.001 4.32 4.54 7.07 7.57 0.36 0.000
[0.66]*** [1.74]* [1.55]*** [1.87]*** [0.64] [0.72]*** [1.90]** [1.78]*** [2.03]*** [0.67]
Interest rate controls 1.03 1.24 1.59 1.43 0.36 0.052 1.16 2.23 1.35 1.66 -0.03 0.066
[0.31]*** [0.96] [0.74]** [0.85]* [0.30] [0.34]*** [1.05]** [0.85] [0.92]* [0.32]
Credit controls 1.18 0.85 2.91 1.00 0.49 0.053 1.45 0.89 3.45 1.34 0.57 0.036
[0.34]*** [0.99] [0.82]*** [0.82] [0.34] [0.38]*** [1.08] [0.94]*** [0.89] [0.36]
Privatization 1.40 1.05 2.48 3.06 -0.14 0.002 2.01 1.66 2.97 3.66 -0.13 0.000
[0.36]*** [1.01] [0.86]*** [0.88]*** [0.37] [0.40]*** [1.11] [0.99]*** [0.96]*** [0.39]
Supervision 2.21 4.01 4.08 4.93 0.63 0.001 2.29 5.21 4.96 4.60 0.91 0.000
[0.47]*** [1.96]** [1.25]*** [1.55]*** [0.44] [0.52]*** [2.15]** [1.44]*** [1.69]*** [0.46]**
Capital market development 2.36 2.58 2.08 6.43 0.86 0.001 2.29 3.09 2.15 6.60 0.02 0.000
[0.45]*** [1.84] [1.22]* [1.00]*** [0.43]** [0.49]*** [2.02] [1.41] [1.10]*** [0.45]
Trade and FDI Liberalization
Trade (tariff and current account restrictions) 0.50 4.20 0.19 0.67 1.43 0.015 1.52 5.05 0.52 1.33 2.78 0.001
[0.54] [1.49]*** [1.03] [1.10] [0.87] [0.59]*** [1.57]*** [1.20] [1.18] [0.81]***
FDI liberalization 1.47 1.51 2.80 1.67 0.25 0.017 1.94 2.52 2.89 2.25 0.20 0.005
[0.34]*** [1.30] [0.76]*** [0.76]** [0.35] [0.37]*** [1.43]* [0.88]*** [0.83]*** [0.37]
Institutional Reforms
Legal system and property rights 0.15 0.60 0.37 0.36 -0.06 0.045 0.35 0.94 0.35 0.44 -0.03 0.007
[0.08]* [0.22]*** [0.18]** [0.19]* [0.10] [0.09]*** [0.23]*** [0.21]* [0.21]** [0.11]
Product Market and Regulatory Reforms
Agriculture 1.98 3.81 3.96 -0.07 1.12 0.008 2.43 0.58 4.64 -0.24 1.63 0.004
[0.46]*** [1.62]** [0.88]*** [0.94] [0.83] [0.50]*** [1.13] [0.99]*** [1.08] [0.83]**
Business regulation 0.49 0.04 0.70 0.97 0.49 0.024 0.59 0.39 1.08 0.67 0.29 0.227
[0.12]*** [0.36] [0.28]** [0.21]*** [0.13]*** [0.13]*** [0.38] [0.32]*** [0.23]*** [0.14]**
Labor market regulations 0.24 -0.87 0.76 0.49 -0.15 0.051 0.29 -0.93 1.59 0.57 -0.08 0.079
[0.11]** [0.58] [0.46]* [0.12]*** [0.11] [0.13]** [0.69] [0.34]*** [0.28]** [0.12]
Dependent variable: Total factor productivity growth Dependent variable: Aggregate labor productivity growth
25
Table 2. Reforms and Distance to Frontier: Sectoral Productivity Growth
Panel regressions consist of sectoral productivity gap relative to the United States (convergence effects), reform index or institutional variable (lagged one period) entering one at a time, and country- and year-fixed
effects. Q1-Q4 denote income group quartiles (based on GDP per capita relative to the United States). Dependent variable is annual growth rate of manufacturing productivity (left panel) or of services productivity (right
panel). The full sample consists of more than 90 countries for the period 1970–2010. Reform indices are normalized between 0 and 1. *,**, and *** indicate significance at the 10 percent, 5 percent, and 1 percent levels, respectively.
Full sample Q1 Q2 Q3 Q4
Test for coef.
equality
(P-value)
Full sample Q1 Q2 Q3 Q4
Test for coef.
equality
(P-value)
Full sample Q1 Q2 Q3 Q4
Test for coef.
equality
(P-value)
(1) (2) (3) (4) (5) (6) (1) (2) (3) (4) (5) (6) (1) (2) (3) (4) (5) (6)
Financial Sector Reforms
Banking system reforms 0.65 0.43 0.71 0.48 -0.26 0.03 0.41 0.25 1.25 0.29 -0.08 0.08 0.79 0.63 2.04 0.12 -0.27 0.02
[0.13]*** [0.32] [0.45] [0.17]*** [0.21] [0.18]** [0.65] [0.40]*** [0.32] [0.30] [0.30]*** [0.66] [0.75]*** [0.61] [0.49]
Capital market development 1.98 3.25 2.71 2.23 -0.30 0.51 4.69 -5.07 -0.28 8.20 -0.48 0.03 -6.02 -3.81 12.85 6.27 4.91 0.05
[1.20]* [3.69] [3.58] [1.81] [1.27] [1.72]*** [8.46] [4.68] [2.54]*** [1.95] [4.25] [8.04] [6.06]** [3.62]* [2.60]*
Trade and FDI Liberalization
Trade (tariff and current account restrictions) 0.29 0.21 2.21 0.99 -3.86 0.31 0.24 4.67 -0.58 3.34 -3.86 0.38 2.42 -2.51 11.13 -2.16 -9.45 0.17
[1.45] [3.67] [4.36] [2.03] [2.22]* [1.93] [8.91] [4.25] [3.38] [3.53] [3.21] [6.95] [7.83] [7.82] [5.76]
FDI liberalization 2.81 3.16 4.59 4.17 -0.33 0.00 2.55 1.12 12.03 4.13 -1.44 0.01 2.16 -2.92 3.23 3.17 0.41 0.55
[0.80]*** [2.09] [2.65]* [1.47]*** [0.70] [1.11]** [3.02] [5.80]** [1.88]** [1.09] [1.73] [6.12] [4.58] [2.07] [2.17]
Institutional Reforms
Legal system and property rights -0.03 1.78 -0.16 -0.04 -0.23 0.01 0.18 -0.80 -0.68 0.89 0.35 0.05 0.69 2.91 1.32 0.42 -0.05 0.33
[0.23] [0.59]*** [0.78] [0.36] [0.21] [0.31] [1.42] [0.91] [0.46]* [0.35] [0.51] [1.55]* [1.19] [0.67] [0.91]
Product Market and Regulatory Reforms
Agriculture 2.39 0.73 3.44 -1.32 3.72 0.07 3.15 9.04 -0.52 -2.87 13.23 0.02 3.34 11.37 13.17 12.99 7.65 0.08
[1.12]** [3.34] [3.21] [1.64] [3.41] [1.43]** [5.20]* [3.77] [2.36] [5.79]** [2.34] [5.37]** [6.83]* [9.47] [4.14]*
Business regulation -0.08 -1.50 -3.45 -0.03 -0.94 0.20 0.76 5.26 1.04 0.34 -1.11 0.01 1.38 0.92 3.74 0.56 -2.96 0.05
[0.52] [1.06] [2.88] [0.57] [0.44]** [0.50] [2.43]** [1.16] [0.94] [0.62]* [1.18] [3.19] [2.86] [1.15] [1.67]*
Labor market regulations -0.10 1.83 2.71 0.64 -0.05 0.07 0.50 0.94 4.01 0.59 0.86 0.00 -0.35 4.02 -0.47 0.36 2.50 0.19
[0.30] [1.48] [1.31]** [0.45] [0.24] [0.34] [4.28] [1.05]*** [0.75] [0.38]** [0.68] [2.61] [1.76] [0.65] [1.99]
Dependent variable: Productivity growth in Services Dependent variable: Productivity growth in Manufacturing Dependent variable: Productivity growth in Agriculture
26
Table 3. Short and Medium-term Impacts: Aggregate Productivity Growth
Panel regressions consist of relative income gap with US (convergence effects), a reform shock dummy (reforms larger than 2 stds) entering one at a time, crisis dummies and country
fixed effects. Dependent variable is annual growth rate of TFP (left panel) or of aggregate labor productivity (right panel). Reform indices are normalized between 0 and 1. The sample consists of over 100 countries for the period 1970–2010. *,**, and *** indicate significance at the 10 percent, 5 percent, and 1 percent levels, respectively.
Yr 1 Yr 2 Yr 3 Yr 4 Yr 5 Yr 1 Yr 2 Yr 3 Yr 4 Yr 5
Financial Sector Reform
Banking system reforms 0.21 0.63 0.93 1.61 2.12 0.11 0.49 0.71 1.62 2.30
[0.37] [0.58] [0.74] [0.87]* [0.98]** [0.39] [0.62] [0.79] [0.95]* [1.06]**
Interest rate controls -0.50 -0.35 -0.76 -0.23 0.38 -0.58 -0.45 -0.93 -0.13 0.53
[0.43] [0.68] [0.87] [1.03] [1.15] [0.46] [0.73] [0.94] [1.12] [1.25]
Credit controls 0.66 0.92 1.28 1.65 1.76 0.47 0.61 0.96 1.15 1.27
[0.42] [0.66] [0.84] [0.99]* [1.11] [0.44] [0.70] [0.90] [1.08] [1.21]
Privatization 0.54 1.13 1.41 2.04 2.13 0.36 1.01 1.31 2.12 2.35
[0.47] [0.75] [0.95] [1.13]* [1.26]* [0.50] [0.80] [1.03] [1.22]* [1.37]*
Supervision 0.41 1.05 1.44 2.16 2.93 0.52 1.23 1.59 2.47 3.30
[0.41] [0.64] [0.82]* [0.97]** [1.08]*** [0.43] [0.69]* [0.88]* [1.05]** [1.18]***
Capital market development 0.82 1.45 2.23 2.26 2.49 0.83 1.52 2.41 2.45 2.78
[0.43]* [0.68]** [0.86]*** [1.02]** [1.14]** [0.46]* [0.73]** [0.93]*** [1.11]** [1.25]**
Trade reform -0.25 0.03 0.10 0.09 -0.17 -0.52 -0.34 -0.09 -0.18 -0.41
Trade [0.45] [0.72] [0.91] [1.08] [1.21] [0.48] [0.77] [0.99] [1.18] [1.32]
Institutional Reforms 0.91 2.02 2.56 1.91 2.61 0.94 2.13 2.72 2.26 2.81
Legal system and property rights [0.42]** [0.66]*** [0.85]*** [1.02]* [1.16]** [0.45]** [0.71]*** [0.92]*** [1.11]** [1.26]**
Product Market and Regulatory Reforms -0.44 0.60 0.13 0.65 0.73 -0.55 0.79 0.17 0.67 0.94
Agricultural reform [0.86] [1.36] [1.73] [2.06] [2.30] [0.92] [1.46] [1.87] [2.23] [2.51]
Labor market regulations 1.13 1.90 3.05 3.89 4.51 0.88 1.35 2.56 3.59 4.44
[0.58]** [0.91]** [1.18]*** [1.40]*** [1.60]*** [0.62] [0.98] [1.27]** [1.52]** [1.75]**
Total factor productivity growth Aggregate labor productivity growth

27
Table 4. Short and Medium-term Impacts: Sector Productivity Growth
Panel regressions consist of sectoral productivity gap relative to the United States (convergence effects), a reform shock dummy (reforms larger than 2 stds) entering one at a time, crisis dummies and country fixed
effects. Q1-Q4 denote income group quartiles (based on GDP per capita relative to the United States). Dependent variable is annual growth rate of services, manufacturing, and agricultural productivity. The sample consists of over 100 countries for the period 1970–2010. Reform indices are normalized between 0 and 1. *,**, and *** indicate significance at the 10 percent, 5 percent, and 1 percent levels, respectively.
Yr 1 Yr 2 Yr 3 Yr 4 Yr 5 Yr 1 Yr 2 Yr 3 Yr 4 Yr 5 Yr 1 Yr 2 Yr 3 Yr 4 Yr 5
Financial Sector Reform
Banking system reforms 0.57 -0.64 0.04 0.39 0.64 1.20 1.26 2.84 4.07 4.35 -0.63 0.96 1.55 3.81 6.80
[0.65] [0.86] [1.04] [1.16] [1.27] [0.89] [1.18] [1.38]** [1.53]*** [1.62]*** [1.44] [1.73] [1.84] [2.11]* [2.20]***
Interest rate controls 0.44 -1.17 0.25 2.13 1.25 0.20 -1.88 0.57 3.54 3.26 -1.43 -0.77 -0.64 2.68 5.24
[0.77] [1.02] [1.23] [1.36] [1.49] [1.04] [1.37] [1.62] [1.79]** [1.89]* [1.71] [2.05] [2.18] [2.49] [2.61]**
Credit controls -1.63 -0.81 -0.87 0.42 0.39 0.06 0.52 1.24 2.44 1.10 -1.66 -0.20 1.56 0.07 1.75
[0.73]** [0.96] [1.16] [1.29] [1.41] [0.99] [1.29] [1.52] [1.68] [1.78] [1.61] [1.92] [2.04] [2.34] [2.44]
Privatization 0.10 0.81 1.43 -0.34 -0.35 1.01 2.73 2.80 3.66 4.43 5.47 7.68 6.12 10.91 11.78
[0.81] [1.08] [1.30] [1.49] [1.64] [1.10] [1.46]* [1.72] [1.97]* [2.10]** [1.79]*** [2.16]*** [2.29]*** [2.68]*** [2.80]***
Supervision 1.67 0.57 0.50 2.15 2.40 1.91 3.16 2.47 3.34 3.73 1.25 1.31 2.66 3.19 2.96
[0.65]** [0.86] [1.04] [1.17]* [1.31]* [0.89]** [1.19]*** [1.40]* [1.56]** [1.69]** [1.43] [1.73] [1.84] [2.14] [2.26]
Capital market development -0.39 -0.24 0.63 0.59 1.69 0.89 2.50 4.40 4.84 4.47 1.19 1.20 0.74 0.77 2.01
[0.76] [1.01] [1.21] [1.36] [1.49] [1.03] [1.36]* [1.60]*** [1.78]*** [1.88]** [1.68] [2.02] [2.14] [2.46] [2.57]
Trade reform -1.92 -1.13 0.75 1.88 0.70 -1.23 -0.95 0.73 0.86 1.26 -2.09 -1.32 -1.07 1.66 3.61
Trade [1.06]* [1.41] [1.73] [1.95] [2.16] [1.38] [1.83] [2.18] [2.43] [2.59] [2.31] [2.79] [3.01] [3.52] [3.70]
Institutional Reform 0.68 1.05 -0.33 -2.82 -6.19 0.09 2.43 0.30 1.26 2.27 2.12 4.35 10.15 12.85 16.00
Legal system and property rights [0.83] [1.16] [1.50] [1.87] [2.29]*** [1.10] [1.56] [2.01] [2.56] [2.81] [1.83] [2.32]* [2.61]*** [3.36]*** [3.89]***
Product Market and Regulatory Reform -4.24 4.34 5.70 6.39 1.25 1.54 12.55 16.48 20.98 20.71 0.63 8.35 9.74 13.73 17.21
Agricultural reform [1.48]*** [2.03]** [2.45]** [2.70]** [2.93] [2.09] [2.78]*** [3.26]*** [3.55]*** [3.78]*** [3.27] [4.07]** [4.40]** [5.00]*** [5.11]***
Labor market regulation 1.51 2.82 5.13 3.79 3.74 1.44 3.23 5.24 5.00 6.93 0.32 -0.61 -1.17 2.67 3.14
[0.97] [1.30]** [1.71]*** [2.04]* [2.39] [1.34] [1.81]* [2.36]** [2.84]* [3.31]** [2.13] [2.61] [3.03] [3.71] [4.12]
Productivity growth in Services Productivity growth in Manufacturing Productivity growth in Agriculture

28
Table A1. Reforms and Distance to Frontier: 3 Year Average Aggregate Productivity Growth
Panel regressions consist of relative income gap with US (convergence effects), reform index or institutional variable (lagged one period) entering one at a time, and country- and year-
fixed effects. Q1-Q4 denote income group quartiles (based on GDP per capita relative to the United States). Dependent variable is annual growth rate of TFP (left panel) or of aggregate
labor productivity (right panel). The full sample consists of over 100 countries for the period 1970–2010. Reform indices are normalized between 0 and 1. *,**, and *** indicate significance at the 10 percent, 5 percent, and 1 percent levels, respectively.
All Q1 Q2 Q3 Q4 All Q1 Q2 Q3 Q4
(1) (2) (3) (4) (5) (1) (2) (3) (4) (5)
Financial Sector Reforms
Banking system reforms 4.81 3.00 6.74 12.15 0.05 5.68 4.88 7.62 12.41 0.2
[0.88]*** [1.99] [2.26]*** [2.57]*** [0.74] [0.93]*** [2.26]** [2.51]*** [2.64]*** [0.71]
Interest rate controls 1.35 1.83 1.96 2.9 -0.04 1.48 3.07 1.69 2.95 -0.26
[0.42]*** [1.10]* [1.10]* [1.28]** [0.36] [0.45]*** [1.24]** [1.23] [1.32]** [0.34]
Credit controls 1.55 0.39 2.5 2.7 0.32 1.77 0.5 3.09 2.73 0.39
[0.47]*** [1.13] [1.21]** [1.22]** [0.40] [0.50]*** [1.30] [1.34]** [1.25]** [0.38]
Privatization 2.91 0.93 3.99 6.09 0.34 3.29 1.47 4.57 6.16 0.34
[0.48]*** [1.17] [1.19]*** [1.22]*** [0.43] [0.51]*** [1.33] [1.32]*** [1.26]*** [0.41]
Supervision 2.43 3.27 3.5 8.67 0.24 2.67 4.66 4.22 8.65 0.7
[0.65]*** [2.18] [1.86]* [2.31]*** [0.52] [0.70]*** [2.48]* [2.06]** [2.39]*** [0.50]
Capital market development 3.07 2.68 1.96 7.1 1.09 3.15 4.16 1.98 7.71 0.28
[0.61]*** [2.12] [1.80] [1.52]*** [0.51]** [0.66]*** [2.41]* [2.00] [1.55]*** [0.49]
Trade and FDI Liberalization
Trade (tariff and current account restrictions) -0.40 2.09 -1.31 -1.63 -1.08 0.45 3.2 -0.89 -0.46 -2.36
[0.72] [2.19] [1.45] [1.42] [0.85] [0.77] [2.32] [1.61] [1.46] [0.88]***
FDI liberalization 1.85 1.39 2.54 2.46 0.13 2.28 2.4 2.8 3.25 -0.07
[0.45]*** [1.48] [1.06]** [1.11]** [0.40] [0.48]*** [1.69] [1.18]** [1.13]*** [0.38]
Institutional Reforms
Legal system and property rights 0.21 0.27 0.31 0.3 0.07 0.36 0.54 0.26 0.29 0.1
[0.10]** [0.26] [0.23] [0.24] [0.12] [0.11]*** [0.28]* [0.25] [0.26] [0.13]
Product Market and Regulatory Reforms
Agriculture 2.74 0.33 6.13 0.18 1.08 3.26 0.49 6.93 0.25 1.79
[0.70]*** [1.33] [1.44]*** [1.67] [1.14] [0.74]*** [1.46] [1.52]*** [1.70] [1.23]
Business regulation 0.35 -0.36 0.62 0.36 0.04 0.42 -0.01 0.66 0.44 -0.29
[0.20]* [0.33] [0.62] [0.36] [0.20] [0.21]** [0.32] [0.62] [0.44] [0.18]
Labor market regulations -0.35 -0.93 -0.54 -0.08 -0.06 -0.38 -0.84 -0.59 -0.4 -0.04
[0.15]** [0.54]* [0.78] [0.36] [0.13] [0.16]** [0.53] [0.78] [0.40] [0.14]
Total factor productivity growth Aggregate labor productivity growth
29
Table A2. Reforms and Distance to Frontier: GMM Aggregate Productivity Growth
Panel regressions consist of relative income gap with US (convergence effects), reform index or institutional variable (lagged one period) entering one at a time, and country- and year- fixed effects. Q1-Q4 denote income group quartiles (based on GDP per capita relative to the
United States). Dependent variable is annual growth rate of TFP (left panel) or of aggregate labor productivity (right panel). The full sample
consists of over 100 countries for the period 1970–2010. Reform indices are normalized between 0 and 1. *,**, and *** indicate significance at the 10 percent, 5 percent, and 1 percent levels, respectively.
Total factor productivity Aggregate productivity
Financial Sector Reforms
Banking system reform 0.84 0.31
[0.59] [0.91]
Interest rate controls 0.28 0.26
[0.42] [0.55]
Credit controls 0.96 0.94
[0.38]** [0.46]**
Entry 0.14 -0.37
[0.32] [0.48]
Privatization -0.21 -0.19
[0.27] [0.40]
Supervision 1.31 1.31
[0.53]** [0.66]*
Capital market development 1.06 1.48
[0.49]** [0.59]**
Trade and FDI Liberalization
Trade (tariff and current account restrictions) 2.07 2.09
[0.82]** [1.06]*
FDI liberalization 0.81 0.81
[0.40]** [0.47]*
Institutional Reforms
Legal system and property rights 0.23 0.24
[0.07]*** [0.10]**
Product Market and Regulatory Reforms
Agriculture 0.65 1.08
[0.39]* [0.54]*
Labor market regulation 0.04 0.06
[0.05] [0.08]
Business regulation 0.08 0.04
[0.10] [0.13]
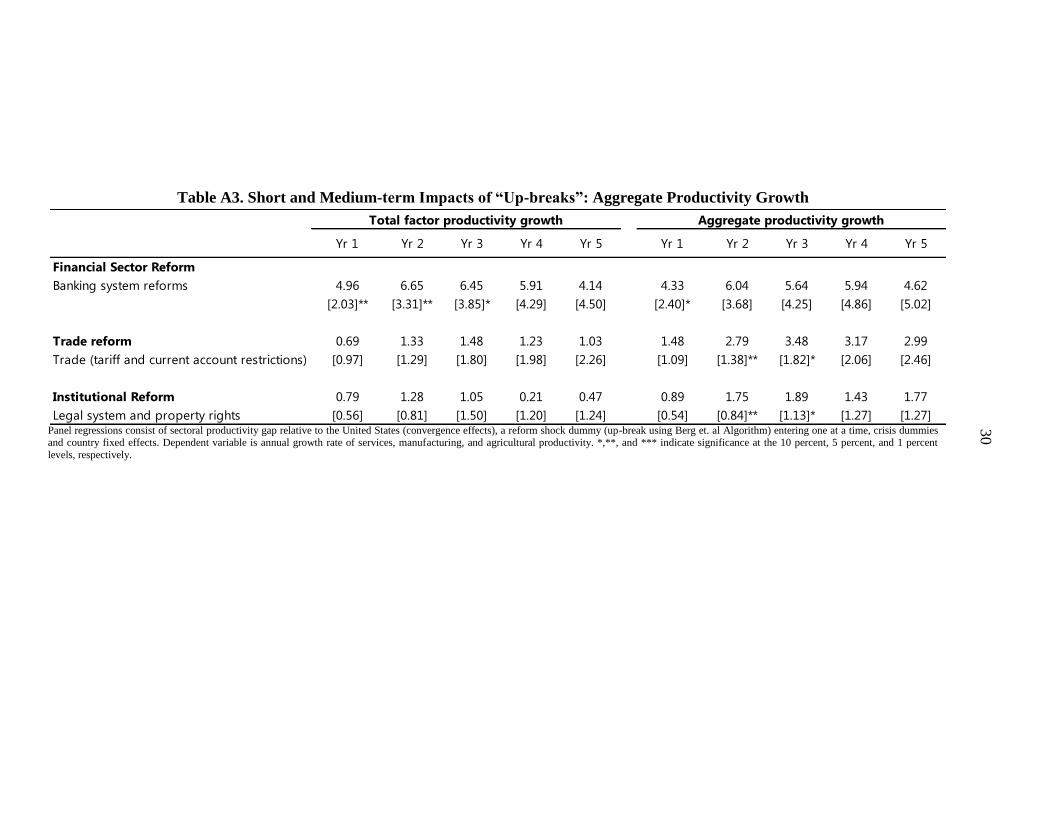
30
Table A3. Short and Medium-term Impacts of “Up-breaks”: Aggregate Productivity Growth
Panel regressions consist of sectoral productivity gap relative to the United States (convergence effects), a reform shock dummy (up-break using Berg et. al Algorithm) entering one at a time, crisis dummies
and country fixed effects. Dependent variable is annual growth rate of services, manufacturing, and agricultural productivity. *,**, and *** indicate significance at the 10 percent, 5 percent, and 1 percent
levels, respectively.
Yr 1 Yr 2 Yr 3 Yr 4 Yr 5 Yr 1 Yr 2 Yr 3 Yr 4 Yr 5
Financial Sector Reform
Banking system reforms 4.96 6.65 6.45 5.91 4.14 4.33 6.04 5.64 5.94 4.62
[2.03]** [3.31]** [3.85]* [4.29] [4.50] [2.40]* [3.68] [4.25] [4.86] [5.02]
Trade reform 0.69 1.33 1.48 1.23 1.03 1.48 2.79 3.48 3.17 2.99
Trade (tariff and current account restrictions) [0.97] [1.29] [1.80] [1.98] [2.26] [1.09] [1.38]** [1.82]* [2.06] [2.46]
Institutional Reform 0.79 1.28 1.05 0.21 0.47 0.89 1.75 1.89 1.43 1.77
Legal system and property rights [0.56] [0.81] [1.50] [1.20] [1.24] [0.54] [0.84]** [1.13]* [1.27] [1.27]
Total factor productivity growth Aggregate productivity growth
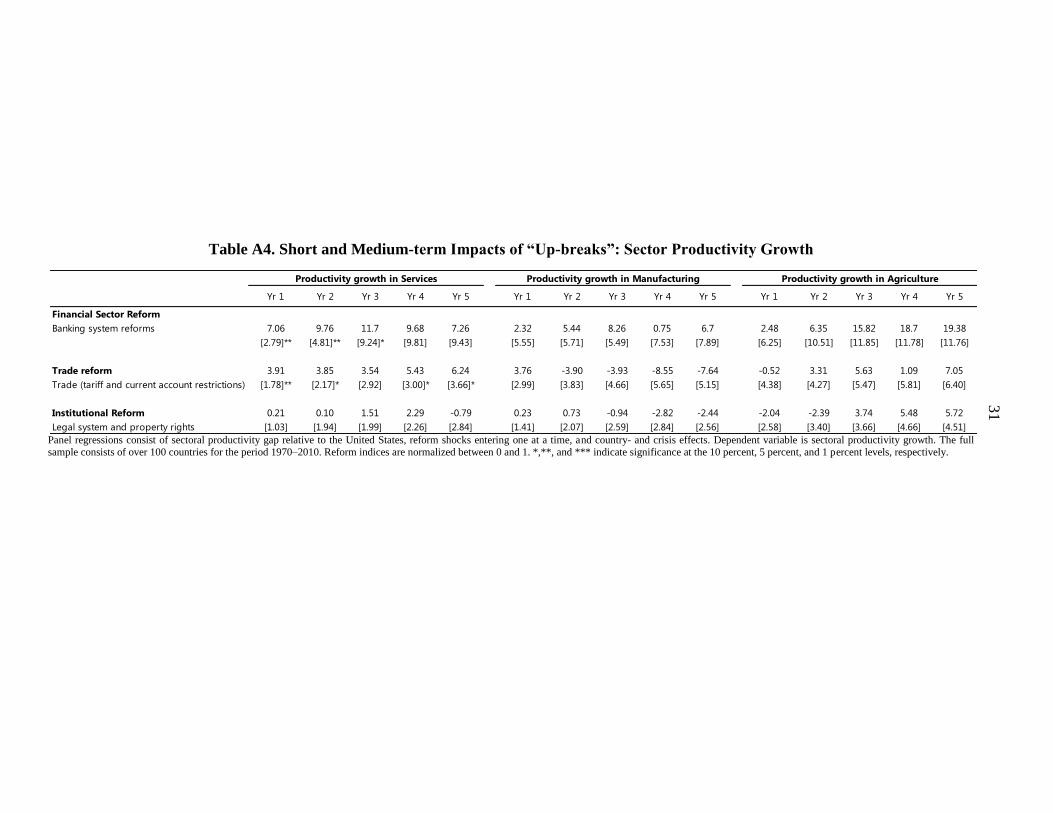
31
Table A4. Short and Medium-term Impacts of “Up-breaks”: Sector Productivity Growth
Panel regressions consist of sectoral productivity gap relative to the United States, reform shocks entering one at a time, and country- and crisis effects. Dependent variable is sectoral productivity growth. The full sample consists of over 100 countries for the period 1970–2010. Reform indices are normalized between 0 and 1. *,**, and *** indicate significance at the 10 percent, 5 percent, and 1 percent levels, respectively.
Yr 1 Yr 2 Yr 3 Yr 4 Yr 5 Yr 1 Yr 2 Yr 3 Yr 4 Yr 5 Yr 1 Yr 2 Yr 3 Yr 4 Yr 5
Financial Sector Reform
Banking system reforms 7.06 9.76 11.7 9.68 7.26 2.32 5.44 8.26 0.75 6.7 2.48 6.35 15.82 18.7 19.38
[2.79]** [4.81]** [9.24]* [9.81] [9.43] [5.55] [5.71] [5.49] [7.53] [7.89] [6.25] [10.51] [11.85] [11.78] [11.76]
Trade reform 3.91 3.85 3.54 5.43 6.24 3.76 -3.90 -3.93 -8.55 -7.64 -0.52 3.31 5.63 1.09 7.05
Trade (tariff and current account restrictions) [1.78]** [2.17]* [2.92] [3.00]* [3.66]* [2.99] [3.83] [4.66] [5.65] [5.15] [4.38] [4.27] [5.47] [5.81] [6.40]
Institutional Reform 0.21 0.10 1.51 2.29 -0.79 0.23 0.73 -0.94 -2.82 -2.44 -2.04 -2.39 3.74 5.48 5.72
Legal system and property rights [1.03] [1.94] [1.99] [2.26] [2.84] [1.41] [2.07] [2.59] [2.84] [2.56] [2.58] [3.40] [3.66] [4.66] [4.51]
Productivity growth in Services Productivity growth in Manufacturing Productivity growth in Agriculture

32
References
Acemoglu, D., S. Johnson, and J Robinson. 2005. “Institutions as a Fundamental Cause of
Long-Run Growth.” Handbook of Economic Growth, Chapter 6.
______, P. Aghion, and F. Zilibotti. 2006. “Distance to Frontier, Selection, and Economic
Growth.” Journal of the European Economic Association, Vol. 4(1), 37–74.
Abiad, A. G., Detragiache, E., & Tressel, T. 2010. A new database of financial reforms.
IMF Staff Papers, 57(2), 281–302.
Adamopoulos, T., D. Restuccia. 2011. “The Size Distribution of Farms and International
Productivity Differences.” Manuscript, University of Toronto.
Aghion, P., P. Howitt, and D. Mayer-Foulkes. 2005. “The Effect of Financial
Development on Convergence: Theory and Evidence.” The Quarterly Journal of
Economics, 120(1), 173–222.
______, and P. Howitt. 2006. “Joseph Schumpeter Lecture. Appropriate Growth Policy: A
Unifying Framework.” Journal of European Economic Association, Vol. 4(2–3),
269–314.
———, 2009, The Economics of Growth (Cambridge, Massachusetts: MIT Press).
Ahrend R., J. Arnold, and C. Moeser. 2011. “The Sharing of Macroeconomic Risk: Who
Loses (and Gains) from Macroeconomic Shocks.” OECD Economics Department
Working Paper No. 877, Organization for Economic Cooperation and
Development, Paris.
Arnold, J., B. Javorcik, M. Lipscomb, and A. Mattoo. 2012. “Services Reform and
Manufacturing Performance: Evidence from India.” WB Policy Research Working
Paper 5948, World Bank, Washington.
Bah, E., and L. Fang. 2013. “Impact of the Business Environment on Output and
Productivity in Africa.” Manuscript, University of Auckland.
Bassassini, A., Scarpetta, S., & Visco, I. 2000. Knowledge, technology and economic
growth: an OECD perspective.
Bassanini, A., and R. Duval. 2009. “Unemployment, Institutions, and Reform
Complementarities: Re-assessing the Aggregate Evidence for OECD countries.”
Oxford Review of Economic Policy, 25(1), 40–59.
Borchert, I., B. Gootiiz, and A. Mattoo. 2010. “Restrictions on Services Trade and FDI in
Developing Countries.” World Bank, mimeo.

33
Bordon, A., C. Ebeke, and K. Shirono. 2015. forthcoming, “When do Structural Reforms
Work? On the Role of the Business Cycle and Macroeconomic Policies.” IMF
Working Paper. International Monetary Fund, Washington.
Bouis, R., and R. Duval. 2011. “Raining Potential Growth After the Crisis: A Quantitative
Assessment of the Potential Gains from Various Structural Reforms in the OECD
Area and Beyond.” OECD Economics Department Working Papers, No. 835,
OECD Publishing.
______, O. Causa, L. Demmou, R. Duval, and A. Zdzienicka. 2012, “The Short-Term
Effects of Structural Reforms: An Empirical Analysis.” OECD Economics
Department Working Papers, No. 949, OECD Publishing.
Cacciatore, M., R. Duval, and G. Fiori. 2012. “Short-Term Gain or Pain? A DSGE Model
Based Analysis of the Short-Term Effects of Structural Reforms in Labor and
Product Markets.” OECD Economics Department Working Papers, No. 948,
OECD Publishing.
Cao, K. H., and J.A. Birchenall. 2013. “Agricultural Productivity, Structural Change, and
Economic Growth in Post-Reform China.” Journal of Development Economics.
Chinn, Menzie D. and Hiro Ito (2006). "What Matters for Financial Development? Capital
Controls, Institutions, and Interactions," Journal of Development Economics,
Volume 81, Issue 1, Pages 163–192 (October).
Christiansen, L., M. Schindler, and T. Tressel. 2013. “Growth and Structural Reforms: A
New Assessment.” Journal of International Economics, 89, 347–56.
Conway, P., D. de Rosa, G. Nicoletti, and F. Steiner. 2006. “Product Market Regulation
and Convergence.” OECD Economic Studies No. 43, 2006/2, OECD, Paris.
Dabla-Norris, E., S. Guo, V. Haksar, M. Kim, K. Kochhar, K.Wiseman, and A.
Zdzienicka. 2015. “The New Normal: A Sector-Level Perspective on Growth and
Productivity Trends in Advanced Economies.” IMF Staff Discussion Note 15/03
International Monetary Fund, Washington.
______, G. Ho, K. Kochhar, A. Kyobe, and R. Tchaidze. 2013. “Anchoring Growth: The
Importance of Productivity-Enhancing Reforms in Emerging Market and
Developing Economies.” IMF Staff Discussion Note 13/08, International Monetary
Fund, Washington.
______, A.Thomas, R. Garcia-Verdu, and Y. Chen. 2013. “Benchmarking Structural
Transformation Across the World.” IMF Working Paper 13/176, International
Monetary Fund, Washington.
Dall’Olio, A., M. Iootty, N. Kanehira, and F. Saliola. 2013. “Productivity Growth in
Europe.” WB Policy Research Working Paper 6425, World Bank, Washington.
34
Duggan, V., S. Rahardja, and G. Varela. 2013. “Service Sector Reform and
Manufacturing Productivity: Evidence from Indonesia.” WB Policy Research
Working Paper 6349, World Bank, Washington.
Fernandes, A.M., and C. Paunov. 2012. “Foreign Direct Investment in Services and
Manufacturing Productivity: Evidence for Chile.” Journal of Development
Economics, vol. 97(2), 305–21.
Henrekson, M., & Johansson, D. (2010). Firm growth, institutions and structural
transformation.
International Monetary Fund (IMF). 2008. “Structural Reforms and Economic
Performance in Advanced and Developing Countries.” IMF Policy Paper,
Washington.
———. 2012. “Fiscal Policy and Employment in Advanced and Emerging Economies.”
IMF Policy Paper, Washington.
———. 2013. “Guidance Note on Jobs and Growth Issues in Surveillance and Program
Work: Supplement on Country Case Studies.” Washington.
Inter-American Development Bank (IDB), 2013. Rethinking Reforms, How Latin
America and the Caribbean Can Escape Suppressed World Growth (Washington:
Inter-American Development Bank).
Kerdrain, C., Koske, I., & Wanner, I. (2010). The impact of structural policies on saving,
investment and current accounts.
Larrain, M., and S. Stumpner. 2013. “Financial Reforms and Aggregate Productivity: The
Microeconomic Channel.” Working Paper.
Levine, R. 2005. “Finance and Growth: Theory and Evidence.” Handbook of Economic
Growth, 1, 865–934.
Nicoletti, G., and S. Scarpetta. 2003. “Regulation, Productivity and Growth: OECD
Evidence.” Economic Policy, 18(36), 9–72.
Organisation for Economic Co-operation and Development (OECD). 2013. “Economic
Policy Reforms 2013: Going for Growth.” OECD Publishing.
http://dx.doi.org/10.1787/growth-2013-en
Prati, A., M. G. Onorato, and C. Papageorgiou. 2013. “Which Reforms Work and under
What Institutional Environment? Evidence from a New Data Set on Structural
Reforms.” Review of Economics and Statistics, 95(3), 946–68.
Rajan, R. G., and L. Zingales. 2001. “Financial systems, Industrial Structure, and
Growth,” Oxford Review of Economic Policy, 17(4), 467–82.

35
Restuccia, D., and R. Rogerson. 2013. “Misallocation and Productivity, Review of
Economic Dynamics.” Vol. 16, 1–10.
Syverson, C. 2011. “What Determines Productivity?” Journal of Economic Literature, 49
(2), 326–65.
Tombe, T. 2012. “The Missing Good Problem: How Low Agricultural Imports Contribute
to International Income and Productivity Differences.” Manuscript, University of
Calgary.
Tressel, T. 2008. “Unbundling the Effects of Reforms,” preliminary draft, 28–29.
http://www.imf.org/external/np/seminars/eng/2008/strureform/pdf/unbund.pdf.
Vandenbussche, J., P. Aghion, and C. Meghir. 2006. “Growth, Distance to Frontier and
Composition of Human Capital.” Journal of Economic Growth, 11(2), 97–127.
Wacziarg, R., and K. H. Welch. 2008. “Trade Liberalization and Growth: New Evidence.”
The World Bank Economic Review, 22(2),187–231, Washington.
World Bank. 2012. World Development Report 2013: Jobs World Bank: Washington.