structural investigation of snake venom proteins by mass
TRANSCRIPT
Structural Investigation of Snake Venom
Proteins by Mass Spectrometry
_____________________________________
A thesis submitted for the Degree of Master of Philosophy
by
Chia-De Ruth Wang B. Sc. (Advanced)
from the
Department of Chemistry, The University of Adelaide
October 2019
~ Contents ~
Acknowledgements ................................................................................................................... i
Statement of Originality .......................................................................................................... ii
Abstract .................................................................................................................................. iii
Chapter 1: Introduction .......................................................................................................... 1
1.1. Proteinaceous composition of snake venoms .............................................................. 1
1.2. Pharmacological interest in snake venoms.................................................................. 3
1.3. Ecological interest in snake venoms ........................................................................... 4
1.4. Challenges from pharmacological and ecological aspects .......................................... 5
1.5. Methodology ............................................................................................................... 8
1.5.1. Electrospray ionisation ........................................................................................ 8
1.5.2. LTQ Orbitrap mass spectrometer ........................................................................ 9
1.5.3. Shotgun proteomics ............................................................................................ 10
1.5.4. Q-IM-TOF mass spectrometer ........................................................................... 12
1.5.5. Native ion-mobility mass spectrometry .............................................................. 13
1.6. Characterisation of snake venoms by mass spectrometry ......................................... 14
Chapter 2: Proteomic Variations Between Venoms of Different Populations of Notechis
scutatus (Australian Tiger Snake) ........................................................................................ 15
2.1. Introduction ............................................................................................................... 15
2.1.1. Ecological significance of N. scutatus ............................................................... 15
2.1.2. Geographical variations in N. scutatus venom composition ............................. 16
2.2. Results and discussion ............................................................................................... 18
2.2.1. Venom complexity analysis by 2D gel electrophoresis ...................................... 18
2.2.2. Qualitative proteomic analysis reveals diversity of N. scutatus venoms ........... 19
2.2.3. Quantitative proteomic analysis of N. scutatus venoms .................................... 23
2.2.4. Quantitative proteomic analysis of Franklin Island and Mt Gambier venom
proteomes.......................................................................................................................... 26
2.3. Concluding remarks .................................................................................................. 28
2.4. Experimental procedures ........................................................................................... 29
2.4.1. Materials, reagents and buffers used ................................................................. 29
2.4.2. 2D-SDS PAGE ................................................................................................... 29
2.4.3. Filter-aided, in-solution tryptic digestion .......................................................... 30
2.4.4. LC-MS/MS analyses of the multi-populational study ........................................ 31
2.4.5. LC-MS/MS analysis for comparison between Franklin Island and Mt Gambier
venoms 31
2.4.6. Mascot Protein Identification ............................................................................ 32
2.4.7. MaxQuant Analysis ............................................................................................ 32
2.4.8. PEAKS Studio X Analysis .................................................................................. 33
Chapter 3: Proteomic and Structural Investigation of Higher-order Protein Assemblies
in Pseudechis colletti, Naja melanoleuca and Bitis arietans Venoms Using Mass
Spectrometry ......................................................................................................................... 34
3.1. Introduction ............................................................................................................... 34
3.1.1. Efforts to characterise snake venoms from sequence to structure ..................... 34
3.1.2. Pseudechis colletti, Naja melanoleuca, and Bitis arietans venoms .................... 35
3.2. Results and discussion ............................................................................................... 38
3.2.1. Separation of P. colletti, N. melanoleuca, and B. arietans whole venoms by size
exclusion chromatography ............................................................................................... 38
3.2.2. Analysis of the venom SEC fractions by reducing SDS-PAGE .......................... 40
3.2.3. Shotgun proteomics of the three whole venoms ................................................. 41
3.2.4. Shotgun proteomic analysis of venom high and intermediate sized protein
fractions from SEC ........................................................................................................... 44
3.2.5. Native MS analysis of SEC fractions ................................................................. 45
3.2.3. Denatured MS analysis offers insight into the nature of higher-order protein
structures .......................................................................................................................... 48
3.3. Concluding remarks .................................................................................................. 51
3.4. Experimental procedures ........................................................................................... 52
3.4.1. Materials, reagents, and buffers used ................................................................ 52
3.4.2. Separation of whole venom by SEC ................................................................... 52
3.4.3. 1D SDS-PAGE analysis ..................................................................................... 53
3.4.4. Filter-aided, in-solution tryptic digestion .......................................................... 53
3.4.5. LC-MS/MS analysis of venom samples .............................................................. 54
3.4.6. MASCOT analysis .............................................................................................. 54
3.4.7. Native MS analysis of the venom samples ......................................................... 55
3.4.8. Denatured MS analysis of the venom samples ................................................... 55
Chapter 4: Structural and Functional Insights into PLA2 Enzymes Isolated from P.
colletti Venom ......................................................................................................................... 56
4.1. Introduction ............................................................................................................... 56
4.1.1. Significance and structure of phospholipase A2 ................................................ 56
4.1.2. Higher-order structures of snake venom phospholipase A2 .............................. 57
4.2. Results and discussion ............................................................................................... 58
4.2.1. Purification of PLA2 oligomers from crude P. colletti venom ........................... 58
4.2.2. Analysing the quaternary structure of P. colletti PLA2 by native IM-MS .......... 59
4.2.3. Structural investigation of dimeric PLA2 by native IM-MS ............................... 61
4.2.4. CCS determinations reveal compactness and sphericity of P. colletti PLA2 ..... 65
4.2.5. Functional characterisation of dimeric and monomeric P. colletti PLA2 ......... 68
4.3. Concluding remarks .................................................................................................. 71
4.4. Experimental procedures ........................................................................................... 73
4.4.1. Materials, reagents, and buffers used ................................................................ 73
4.4.2. Separation of whole P. colletti venom by SEC .................................................. 73
4.4.3. Separation of P. colletti PLA2 fractions by IEX ................................................. 73
4.4.4. 1D SDS-PAGE ................................................................................................... 74
4.4.5. IM-MS analysis of venom subunits .................................................................... 74
4.4.6. Denatured MS analysis ...................................................................................... 75
4.4.7. MS-based PLA2 enzymatic assay ....................................................................... 75
Chapter 5: Summary ............................................................................................................. 77
5.1. Investigation of proteomic variations in the venoms of different N. scutatus
populations ........................................................................................................................... 77
5.2. Higher-order structural characterisation of venom proteins from P. colletti, N.
melanoleuca, and B. arietans venoms .................................................................................. 78
5.3. Structural and functional insight on PLA2s from P. colletti venom.......................... 78
5.4. Concluding remarks .................................................................................................. 79
References ............................................................................................................................... 80
Appendix A ............................................................................................................................ 85
Appendix B ........................................................................................................................... 116
Appendix C ........................................................................................................................... 125

i
~ Acknowledgements ~
I would like to acknowledge everyone who has contributed to this exhilarating
whirlwind of a journey, filled with character-building challenges and victories alike. Firstly, I
must thank my supervisors Associate Professor Tara Pukala and Professor Grant Booker. In
particular, I cannot express enough gratitude to Tara who has been so kind and supportive from
even before Day One, graciously entertaining my crazy idea to work with venoms. To members
of the Pukala Group (Dr. Blagojce Jovcevski (BJ), Henry Sanders, Jiawei Li, Katherine Stevens,
Alex Begbie, Emily Bubner, and Jack Klose), thank you all for filling the past two years with
laughter, joy, and way too many Fruchocs. In particular, thank you BJ for showing me the ropes
in the laboratory and for being so patient with me and my questions.
A huge thank you to Dr. Parul Mittal and Mr. Chris Cursaro from the Adelaide
Proteomics Centre for all their help with experiments and technical support; to Dr. Vicki
Thomson for letting me in on your project and Professor Stephen Blanksby for generously
sharing your methods with us. I would also like to acknowledge Dr. Marten Snell and Dr. Paul
Trimm from SAHMRI for their time and equipping me with software skills when I needed it
the most, as well as Venom Supplies Ltd for providing the snake venoms.
Finally, I thank God for my wonderful family (Mum, Dad, and Daniel) – you have
loved, supported, and encouraged me through life and this amazing research opportunity. I am
reminded every day of just how blessed I am to be surrounded by such a great group of people,
and am encouraged to continue working hard to do what I love and make a difference to this
world, however big or small. From the bottom of my heart, thank you all.

ii
~ Statement of Originality ~
I certify that this work contains no material which has been accepted for the award of
any other degree or diploma in my name, in any university or other tertiary institution and, to
the best of my knowledge and belief, contains no material previously published or written by
another person, except where due reference has been made in the text. In addition, I certify that
no part of this work will, in the future, be used in a submission in my name, for any other
degree or diploma in any university or other tertiary institution without the prior approval of
the University of Adelaide and where applicable, any partner institution responsible for the
joint-award of this degree.
I give permission for the digital version of my thesis to be made available on the web,
via the University’s digital research repository, the Library Search and also through web search
engines, unless permission has been granted by the University to restrict access for a period of
time.
I acknowledge the support I have received for my research through the provision of an
Australian Government Research Training Program Scholarship.
Chia-De Ruth Wang
31st October 2019
iii
~ Abstract ~
Snake venoms are a rich and complex source of bioactive proteins and peptides. The
proteomic variability of snake venoms introduces fascinating and complex investigations from
a venom adaptational perspective, and the potency and specificity of these venom proteins lend
promising potential for therapeutic applications. However, a significant knowledge gap exists
in the proteomic and higher-order structural understanding of venom proteins, which poses a
challenge for successful applications. The research in this thesis is focussed on probing
ecological and structural biology questions surrounding snake venoms of medical importance
from a fundamental protein structural level using mass spectrometry (MS)-based proteomics
and native MS. This work contributes towards bridging the knowledge gap between venom
protein structure and potential applications, and further expands knowledge of venom diversity.
The venom composition of the Australian tiger snake Notechis scutatus was studied
using a shotgun proteomics approach from five different geographical populations in response
to the polymorphic and widespread geographical diversity exhibited by this species. Analysis
of the five venom proteomes established a high degree of diversity in the various toxin groups
identified in each population, and in particular, significant variations in relative abundance of
3 finger-toxins appeared to be the greatest distinction across the five venoms. Venom
proteomic variations between populations may be due to a diet prey-type influence although
climate, seasonal, and intrinsic variabilities must also be considered.
Quaternary structures of various venom proteins from a repertoire of medically
significant venoms including Collett’s snake Pseudechis colletti, the forest cobra Naja
melanoleuca, and the puff adder Bitis arietans were explored for the first time. Using a
combined approach of proteomics, native and denatured MS, a 117 kDa non-covalent dimer of
a minor toxin component L-amino acid oxidase in the P. colletti venom and a 60 kDa tetramer
of a major toxin group C-type lectin in the B. arietans venom were identified amongst other
components.
A targeted, higher-order structural characterisation of phospholipase A2s (PLA2) in P.
colletti venom by combined native and denatured MS analyses revealed a variety of monomeric,
highly modified PLA2s. Furthermore, a 27.7 kDa covalently-linked PLA2 dimer was identified
iii
in P. colletti venom for the first time by MS, and these PLA2 species were also found to adopt
a highly compact and spherical geometry based on ion mobility measurements of collision
cross section. Importantly, further exploration of the catalytic efficiencies of the monomeric
and dimeric forms of PLA2 using a MS-based PLA2 enzyme assay revealed that dimeric PLA2
possessed substantially greater bioactivity than monomeric PLA2. This highlights the
significance of quaternary structures in augmenting biological activity, and emphasises the
importance of understanding higher-order protein interactions in venoms.
1
~ Chapter 1 ~
Introduction
1.1. Proteinaceous composition of snake venoms
Snake venoms are complex, sophisticated, and largely unexplored cocktails of
pharmacologically active proteins and peptides [1-7] that serve as a snake’s primary hunting
tool, facilitating the immobilisation, killing, and digestion of prey [5, 8, 9]. For these purposes,
venom proteins are often extremely stable (commonly due to unusually high numbers of
disulphide bonds maintaining structural integrity), potent and specific even at low doses [1, 5-
7, 10, 11]. The proteins that constitute venoms can be generally categorised into two classes:
enzymatic toxins and non-enzymatic toxins (Table 1.1). The former class contributes towards
debilitating and often lethal effects of the venom as well as a speculated role in prey digestion.
These enzymatic components often include toxin superfamilies such as phospholipase A2s
(PLA2s), snake venom serine proteases (SVSPs) and metalloproteinases (SVMPs), L-amino
acid oxidases (LAAOs), acetylcholinesterases (AChE), and various nucleotidases [5]; they are
generally known to participate in disruption of cellular pathways involved in haemostasis,
tissue necrosis, and myotoxicity [4, 6].
On the other hand, the class of non-enzymatic toxins is thought to be mainly responsible
for prey immobilisation [7]. These include a diverse range of superfamilies such as 3-finger
toxins (3FTxs), C-type lectins (CTLs), proteinase inhibitors (PIs), nerve growth factors (NGFs),
natriuretic peptides (NPs), bradykinin-potentiating peptides (BPPs), cysteine-rich secretory
proteins (CRISPs), vascular endothelial growth factors (VEGFs), and disintegrins (DIS) to
name a few, all of which play different roles by interfering with the cardiovascular and
neuromuscular systems [7, 12]. Venom composition is highly variable across different families
of snakes, with viperid venoms known to be more abundant in enzymes while non-enzymatic
toxins are more prevalent in elapid venoms [4]. However, it is the combination of these various
venom proteins that lends to the complex envenomation symptoms observed [5].
2
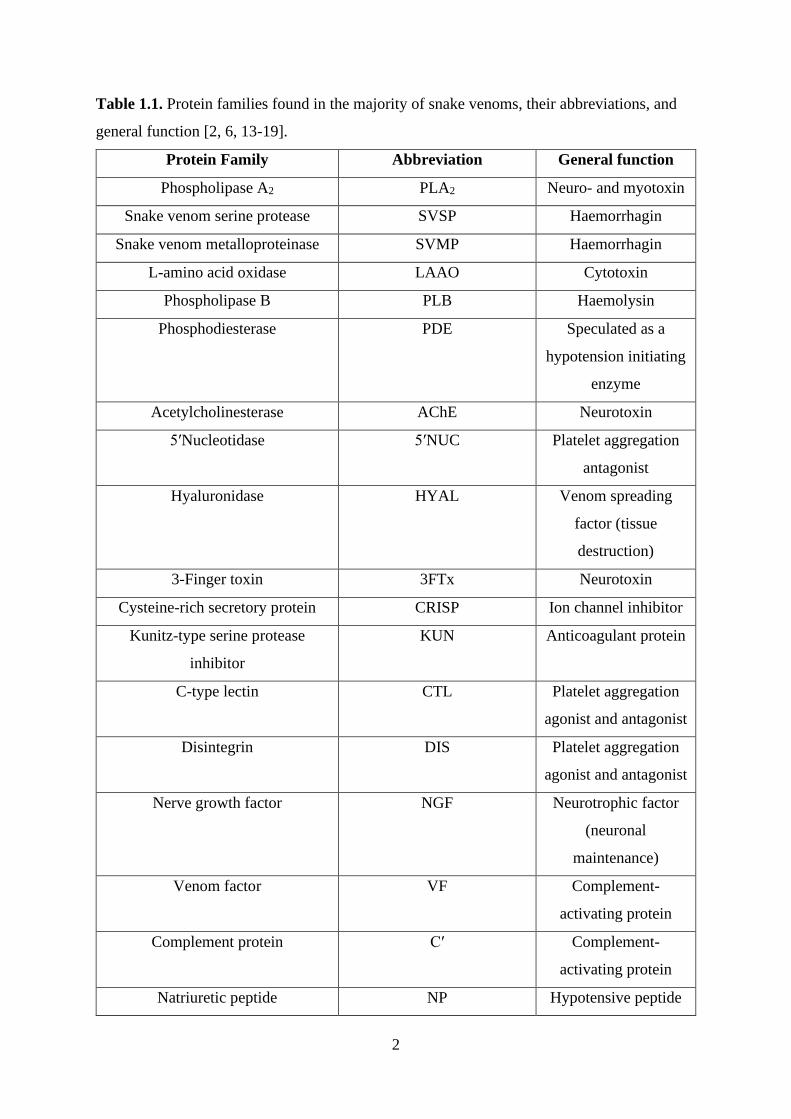
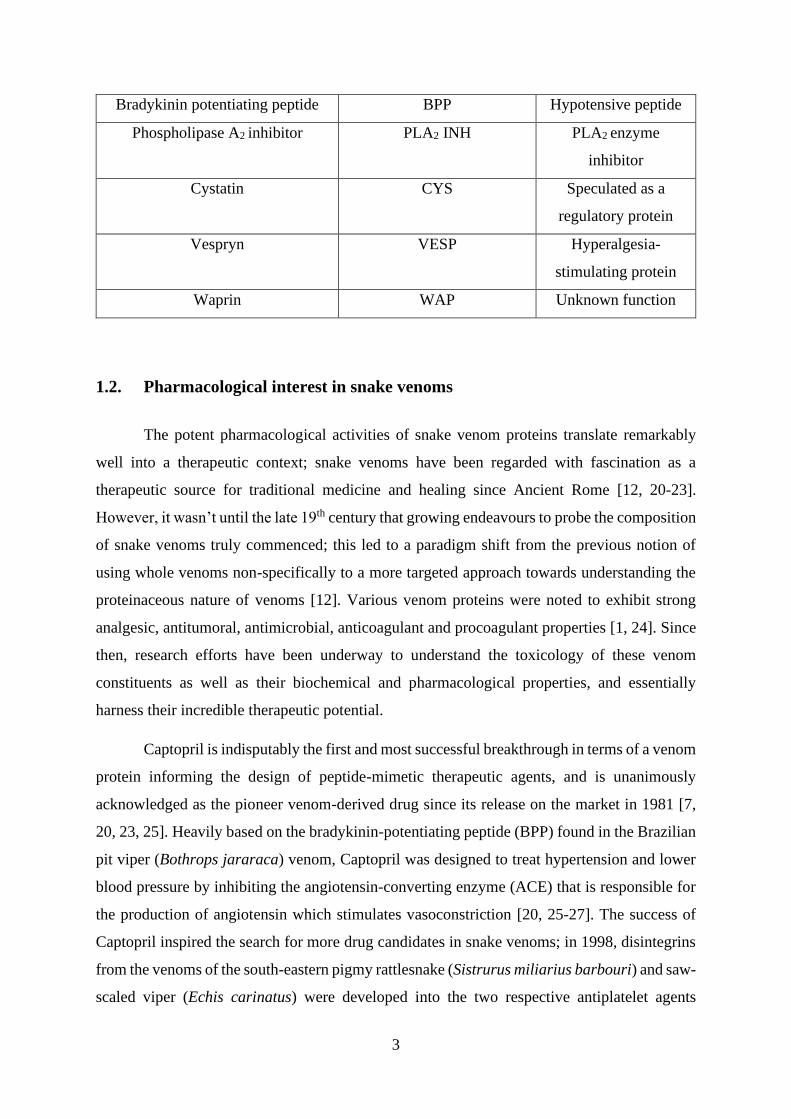
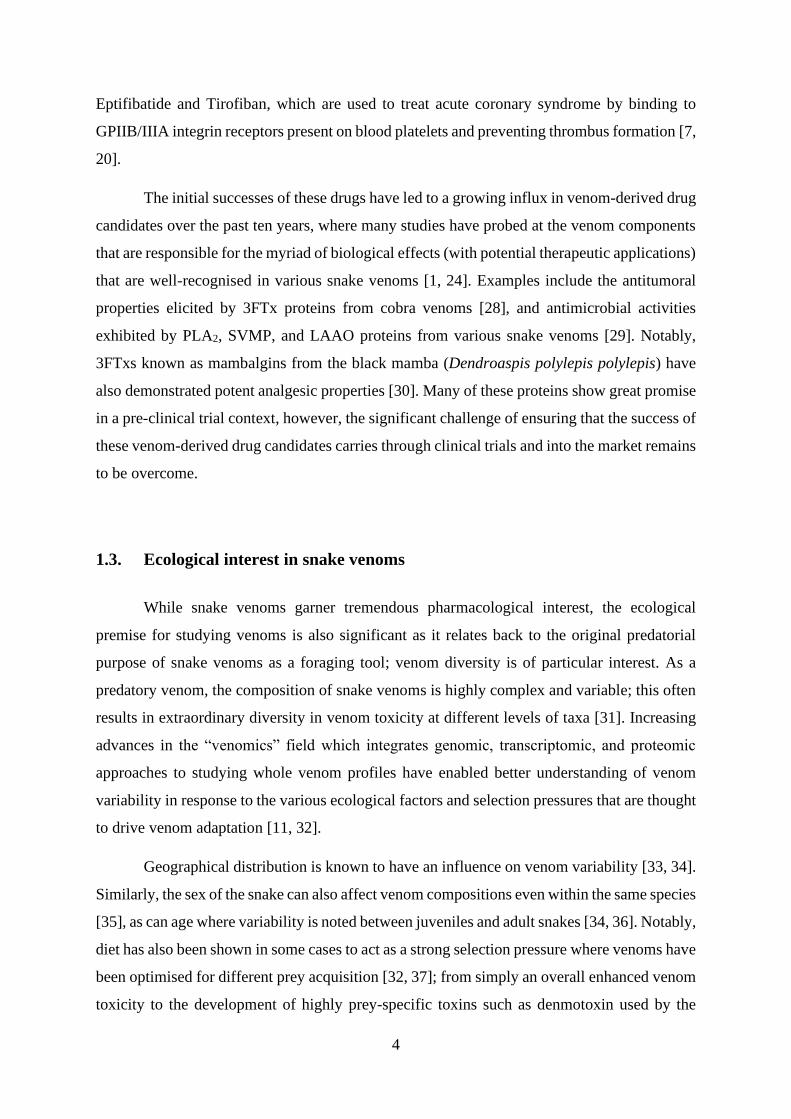
Table 1.1. Protein families found in the majority of snake venoms, their abbreviations, and
general function [2, 6, 13-19].
Protein Family Abbreviation General function
Phospholipase A2 PLA2 Neuro- and myotoxin
Snake venom serine protease SVSP Haemorrhagin
Snake venom metalloproteinase SVMP Haemorrhagin
L-amino acid oxidase LAAO Cytotoxin
Phospholipase B PLB Haemolysin
Phosphodiesterase PDE Speculated as a
hypotension initiating
enzyme
Acetylcholinesterase AChE Neurotoxin
5ʹNucleotidase 5ʹNUC Platelet aggregation
antagonist
Hyaluronidase HYAL Venom spreading
factor (tissue
destruction)
3-Finger toxin 3FTx Neurotoxin
Cysteine-rich secretory protein CRISP Ion channel inhibitor
Kunitz-type serine protease
inhibitor
KUN Anticoagulant protein
C-type lectin CTL Platelet aggregation
agonist and antagonist
Disintegrin DIS Platelet aggregation
agonist and antagonist
Nerve growth factor NGF Neurotrophic factor
(neuronal
maintenance)
Venom factor VF Complement-
activating protein
Complement protein Cʹ Complement-
activating protein
Natriuretic peptide NP Hypotensive peptide
3
Bradykinin potentiating peptide BPP Hypotensive peptide
Phospholipase A2 inhibitor PLA2 INH PLA2 enzyme
inhibitor
Cystatin CYS Speculated as a
regulatory protein
Vespryn VESP Hyperalgesia-
stimulating protein
Waprin WAP Unknown function
1.2. Pharmacological interest in snake venoms
The potent pharmacological activities of snake venom proteins translate remarkably
well into a therapeutic context; snake venoms have been regarded with fascination as a
therapeutic source for traditional medicine and healing since Ancient Rome [12, 20-23].
However, it wasn’t until the late 19th century that growing endeavours to probe the composition
of snake venoms truly commenced; this led to a paradigm shift from the previous notion of
using whole venoms non-specifically to a more targeted approach towards understanding the
proteinaceous nature of venoms [12]. Various venom proteins were noted to exhibit strong
analgesic, antitumoral, antimicrobial, anticoagulant and procoagulant properties [1, 24]. Since
then, research efforts have been underway to understand the toxicology of these venom
constituents as well as their biochemical and pharmacological properties, and essentially
harness their incredible therapeutic potential.
Captopril is indisputably the first and most successful breakthrough in terms of a venom
protein informing the design of peptide-mimetic therapeutic agents, and is unanimously
acknowledged as the pioneer venom-derived drug since its release on the market in 1981 [7,
20, 23, 25]. Heavily based on the bradykinin-potentiating peptide (BPP) found in the Brazilian
pit viper (Bothrops jararaca) venom, Captopril was designed to treat hypertension and lower
blood pressure by inhibiting the angiotensin-converting enzyme (ACE) that is responsible for
the production of angiotensin which stimulates vasoconstriction [20, 25-27]. The success of
Captopril inspired the search for more drug candidates in snake venoms; in 1998, disintegrins
from the venoms of the south-eastern pigmy rattlesnake (Sistrurus miliarius barbouri) and saw-
scaled viper (Echis carinatus) were developed into the two respective antiplatelet agents
4
Eptifibatide and Tirofiban, which are used to treat acute coronary syndrome by binding to
GPIIB/IIIA integrin receptors present on blood platelets and preventing thrombus formation [7,
20].
The initial successes of these drugs have led to a growing influx in venom-derived drug
candidates over the past ten years, where many studies have probed at the venom components
that are responsible for the myriad of biological effects (with potential therapeutic applications)
that are well-recognised in various snake venoms [1, 24]. Examples include the antitumoral
properties elicited by 3FTx proteins from cobra venoms [28], and antimicrobial activities
exhibited by PLA2, SVMP, and LAAO proteins from various snake venoms [29]. Notably,
3FTxs known as mambalgins from the black mamba (Dendroaspis polylepis polylepis) have
also demonstrated potent analgesic properties [30]. Many of these proteins show great promise
in a pre-clinical trial context, however, the significant challenge of ensuring that the success of
these venom-derived drug candidates carries through clinical trials and into the market remains
to be overcome.
1.3. Ecological interest in snake venoms
While snake venoms garner tremendous pharmacological interest, the ecological
premise for studying venoms is also significant as it relates back to the original predatorial
purpose of snake venoms as a foraging tool; venom diversity is of particular interest. As a
predatory venom, the composition of snake venoms is highly complex and variable; this often
results in extraordinary diversity in venom toxicity at different levels of taxa [31]. Increasing
advances in the “venomics” field which integrates genomic, transcriptomic, and proteomic
approaches to studying whole venom profiles have enabled better understanding of venom
variability in response to the various ecological factors and selection pressures that are thought
to drive venom adaptation [11, 32].
Geographical distribution is known to have an influence on venom variability [33, 34].
Similarly, the sex of the snake can also affect venom compositions even within the same species
[35], as can age where variability is noted between juveniles and adult snakes [34, 36]. Notably,
diet has also been shown in some cases to act as a strong selection pressure where venoms have
been optimised for different prey acquisition [32, 37]; from simply an overall enhanced venom
toxicity to the development of highly prey-specific toxins such as denmotoxin used by the
5
mangrove snake (Boiga dendrophila) for its bird-specific diet, numerous studies have
illustrated the variable degree of venom adaptation that is present in nature [37]. These
geographical, sex-, age-, and diet-related variations can all impart influence on the diversity of
snake venoms [31, 33-37].
Implications of such venom diversity are severe when considering the efficacy of
human antivenom, and thus drive characterisation of venom variability and its associated
factors. As antivenom consists of antibodies purified from blood plasma of animals that have
been hyperimmunised with a specific snake venom, the efficacy of the antivenom is largely
restricted towards the species of snake it was raised against [31]. Since the antivenom only
neutralises critical epitopes or recognition sites on the venom components that initially
triggered a strong immune response in the animal, antivenom treatment is thus rendered
essentially ineffective even for very similar species of snakes if venom variability alters the
critical epitopes. Given the fact that snake envenomation is responsible for at least 94 000
deaths and many thousands more cases of morbidity annually worldwide [38], a comprehensive
understanding of the variability in venom compositions is critical in order to support better
development of effective antivenoms.
1.4. Challenges from pharmacological and ecological aspects
In spite of the research endeavours occurring in both pharmacological and ecological
areas, significant roadblocks exist in both fields. From a pharmacological perspective, the
majority of the drug candidates that may have appeared promising in pre-clinical studies are
unable to successfully pass evaluation during clinical trials and consequently, are not released
into the market [20]. A myriad of contributing factors can be considered but the discontinuation
of many of these pharmacological investigations is mainly due to the reported high levels of
toxicity and lack of efficacy, drug stability as well as low bioavailability [1, 20]. These issues
ultimately stem from insufficient knowledge of the pharmacological and biochemical effects
of these venom components. This can be further traced back to a distinct knowledge gap in the
fundamental understanding of the structure-function relationships between these venom
components, in particular higher-order synergistic interactions of venom proteins that are
speculated to augment venom potency and specificity [6, 39].
6
From an ecological perspective, while efforts to catalogue the venom proteomes of
certain species are admirable, there is still a tremendous knowledge disparity in the current
understanding of venom composition and the ecological factors speculated to influence venom
variability. The sheer number of different venomous species and the great array of protein
variants coupled to the finer ecological pressures render venomic characterisation to be a
difficult, labour-intense challenge [32].
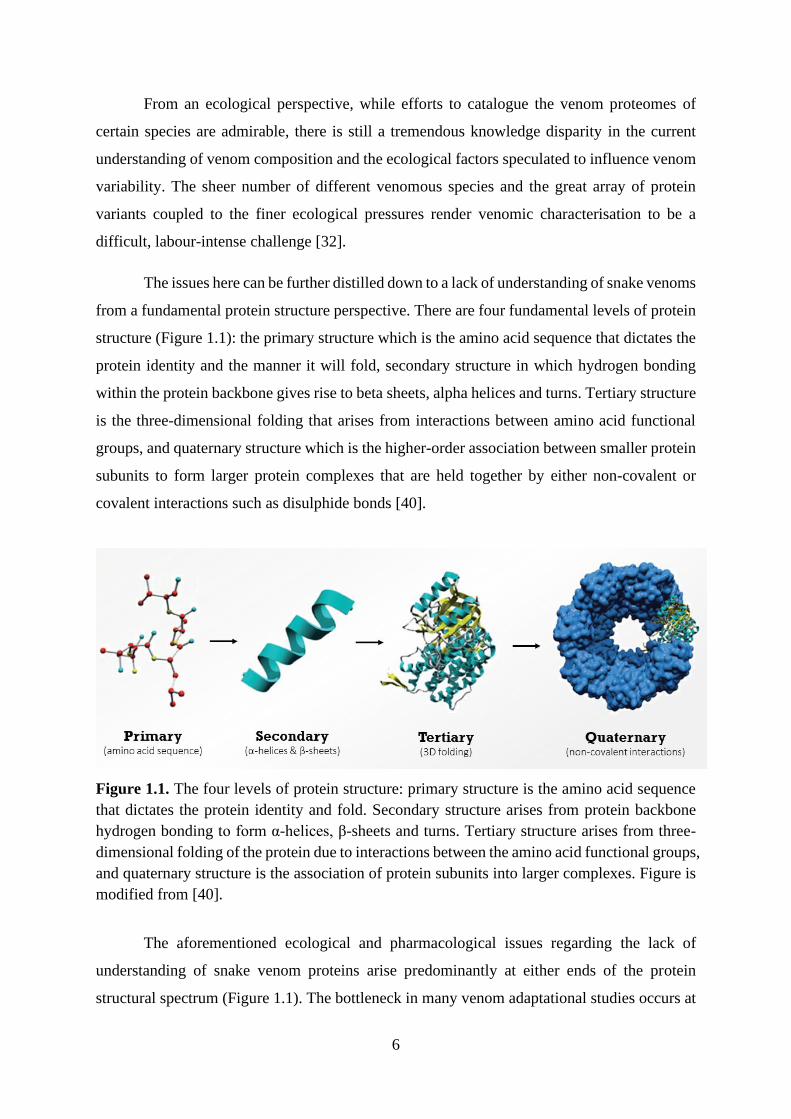
The issues here can be further distilled down to a lack of understanding of snake venoms
from a fundamental protein structure perspective. There are four fundamental levels of protein
structure (Figure 1.1): the primary structure which is the amino acid sequence that dictates the
protein identity and the manner it will fold, secondary structure in which hydrogen bonding
within the protein backbone gives rise to beta sheets, alpha helices and turns. Tertiary structure
is the three-dimensional folding that arises from interactions between amino acid functional
groups, and quaternary structure which is the higher-order association between smaller protein
subunits to form larger protein complexes that are held together by either non-covalent or
covalent interactions such as disulphide bonds [40].
Figure 1.1. The four levels of protein structure: primary structure is the amino acid sequence
that dictates the protein identity and fold. Secondary structure arises from protein backbone
hydrogen bonding to form α-helices, β-sheets and turns. Tertiary structure arises from three-
dimensional folding of the protein due to interactions between the amino acid functional groups,
and quaternary structure is the association of protein subunits into larger complexes. Figure is
modified from [40].
The aforementioned ecological and pharmacological issues regarding the lack of
understanding of snake venom proteins arise predominantly at either ends of the protein
structural spectrum (Figure 1.1). The bottleneck in many venom adaptational studies occurs at
7
the primary structure level where existing catalogues of amino acid sequences are limited and
insufficient to generate a comprehensive understanding of venom proteomes from snake of
interest. In addition, many of these proteins are known to possess complex, variable post-
translation modifications (PTMs) such as glycosylation, which offer great diversity to protein
function and further contribute another complicated aspect to venom proteins that requires
characterisation [41, 42]. The advent of “omics” technology has certainly enabled a more
thorough understanding of venom proteomes by facilitating high-throughput identification of
various venom protein amino acid sequences and quantification of venom protein abundance
[1, 22]. There remains, nonetheless, an immeasurable array of proteins yet to be characterised
in order to enable our understanding of the venom diversity exhibited by many venomous snake
species along with the possible ecological factors driving these changes.
At the quaternary structure level, many of the higher-order protein complexes that are
increasingly speculated to play a dominant, synergistic role in directing venom potency and
specificity remain largely unexplored for many venoms [6]. Recognition of this knowledge gap
has driven limited research efforts to study these often non-covalent interactions in venoms;
the heterodimeric PLA2 crotoxin [43], dimeric 3FTx κ-bungarotoxin [6, 44], and
heteropentameric PLA2 complex textilotoxin are some celebrated examples of successful
higher-order structure elucidation [2, 6]. Despite these successes, however, characterisation of
these interactions is still in the early developmental stages considering the plethora of venom
proteins in the sheer number of medically significant snakes that require characterisation.
Moreover, high-resolution techniques such as x-ray crystallography and nuclear magnetic
resonance (NMR) spectroscopy have been the predominant structure elucidation methods used
in these studies [45]; while these techniques yield structural information at an atomic-level
which has been considered very useful in structure-based drug design, they may have difficulty
capturing the often dynamic and heterogenous nature of larger oligomeric venom proteins that
may exist at low abundances, particularly in a high-throughput manner [46-49]. Thus, new
approaches towards understanding the quaternary structure of these venom proteins are also
critical in order to advance functional applications of snake venoms.
8
1.5. Methodology
Mass spectrometry (MS) based techniques such as shotgun proteomics and native ion
mobility-mass spectrometry (IM-MS) have emerged as powerful analytical tools for the
investigation of many biological questions. Due to the powerful analytical contributions of
these two techniques in proteomic sequencing and higher-order protein structure determination,
MS based methods are utilised here to address knowledge gaps identified in the respective
ecological and pharmacological contexts regarding snake venoms. Fundamentally, MS is a
technique that generates, differentiates, and measures ions in the gas phase, and enables
determination of molecular mass and structural information of molecules in a sensitive and
high-throughput manner.
1.5.1. Electrospray ionisation
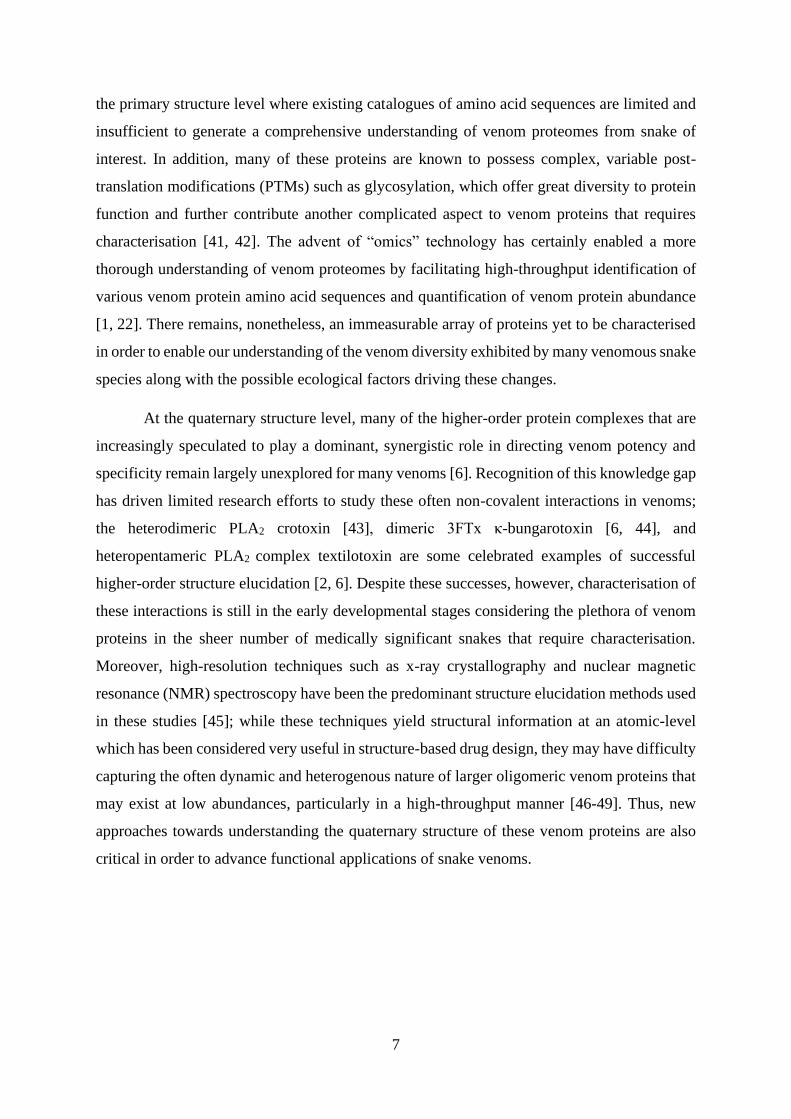
Electrospray ionisation (ESI) is the key ionisation technique utilised in the work in this
thesis to introduce protein samples from liquid to gas-phase in the mass spectrometer. The
sample is pulled from the tip of a conducting capillary by an applied potential difference
towards the inlet of the mass spectrometer as a fine mist of charged droplets. These charged
droplets shrink in size as solvent is evaporated by heating and drying gas until the surface
tension holding the charged droplet together is overcome by the Coulombic repulsion between
the charges on the droplet surface, and the droplet fissions [50]. The result of repeated fission
events and solvent evaporation is the generation of an analyte ion (Figure 1.2). A combination
of organic solvents, acids and high temperatures is typically used to assist desolvation and ion
generation; however, these conditions can be quite harsh and not necessarily compatible for
native MS studies that aim to capture non-covalent protein complexes [51]. Nanoelectrospray
ionisation (nanoESI) is the variation of ESI that is often employed for native MS analysis of
intact proteins in their native-like, folded and functional state [48, 51]. NanoESI allows the use
of smaller sample volumes and reduces flow rate which generates smaller initial sample droplet
sizes. Subsequently, sensitivity is increased and allows the proteins to be analysed in neutral
aqueous buffers such as ammonium acetate that further preserves the proteins in their native-
like state. Importantly, this retains any non-covalent interactions present, as opposed to the
organic solvents and higher temperature conditions utilised in denaturing MS experiments [48,
50-52].
9
Figure 1.2. Electrospray ionisation process of an analyte. The analyte is pulled from the tip of
the capillary by an applied electrical potential to form a charged droplet containing analyte ions
which shrink as solvent is evaporated. Coulombic repulsion overcomes the surface tension of
the droplet and results in droplet fission; an analyte ion is generated after multiple droplet
fission events and solvent evaporation.
Different and often hybrid mass analysers are coupled to ESI to differentiate and detect
the generated ions. The linear trap quadrupole Orbitrap (LTQ-Orbitrap) and quadrupole-ion
mobility-time of flight (Q-IM-TOF) mass spectrometers are highlighted as two key examples
of the various instrument configurations that are frequently used for different types of MS
based analyses; they are also the predominant instrumentation employed for work described in
this thesis.
1.5.2. LTQ Orbitrap mass spectrometer
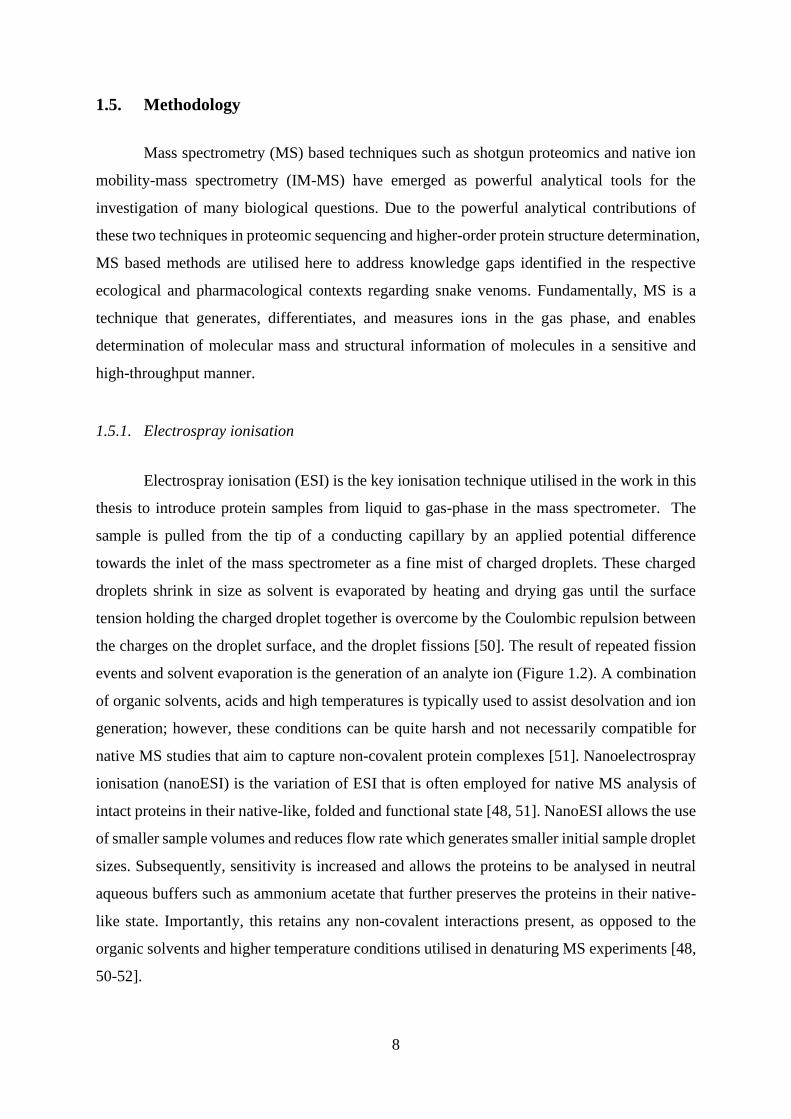
The LTQ-Orbitrap mass spectrometer is a powerful tool that offers high resolution,
sensitivity, and mass accuracy (Figure 1.3) [53, 54]. A key component is the hybrid LTQ-
Orbitrap mass analyser; ions are first accumulated by the linear trap quadrupole (LTQ) sector
where a set of four parallel rods known as a quadrupole confines the generated ions radially by
application of a 2D radio frequency (RF) field as well as axially by stopping potentials applied
to the electrodes [55]. Ions are then injected into the Orbitrap mass analyser which is composed
of a central spindle-like electrode surrounded by two bell-shaped outer electrodes. Ions are
electrostatically confined to orbit the central electrode; depending on the electric field applied,
the ions will oscillate harmonically and separate into rings along the electrode based on their
mass-to-charge (m/z) ratios, which can be analysed by Fourier transformation to afford mass
spectra [53].

10
Figure 1.3. Schematic representation of the LTQ XL Orbitrap mass spectrometer. Samples are
introduced into the mass spectrometer by electrospray ionisation (ESI); the generated ions are
trapped by the LTQ component, separated and analysed in the orbitrap sector based on the m/z
ratios of the ions. Fragmentation of ions by collision induced dissociation (CID) can occur in
the collision cell for tandem mass spectrometry.
The high resolution, sensitivity and mass accuracy of LTQ Orbitrap mass analysers
often make these instruments desirable for performing tandem MS (MS/MS) experiments to
further acquire more detailed structural information, where separated mass-selected ions
undergo fragmentation by collision-induced dissociation (CID) with noble gas molecules in the
collision cell of the instrument. The precursor ions (MS1) are subsequently cleaved into
fragment ions (MS2), which are measured by their m/z values at the detector [56].
Fragmentation patterns of the precursor ion can impart further structural information for the
molecule; in the context of proteins and peptides, amino acid sequences can be determined in
this manner based on sequential mass loss corresponding to amino acid residues, and this
establishes the basis of MS based proteomics such as bottom-up proteomics approaches, used
to identify and quantify proteins in biological samples.
1.5.3. Shotgun proteomics
Shotgun proteomics is a variant of bottom-up proteomics that enables protein
identification and possible quantification of relative abundance without the need to use
chemical labelling [57]. The general workflow of the proteomic experiment is illustrated below
(Figure 1.4), where the protein mixture of interest is isolated from the biological source and is
digested into peptides, usually by the enzyme trypsin which cleaves specifically C-terminal to
11
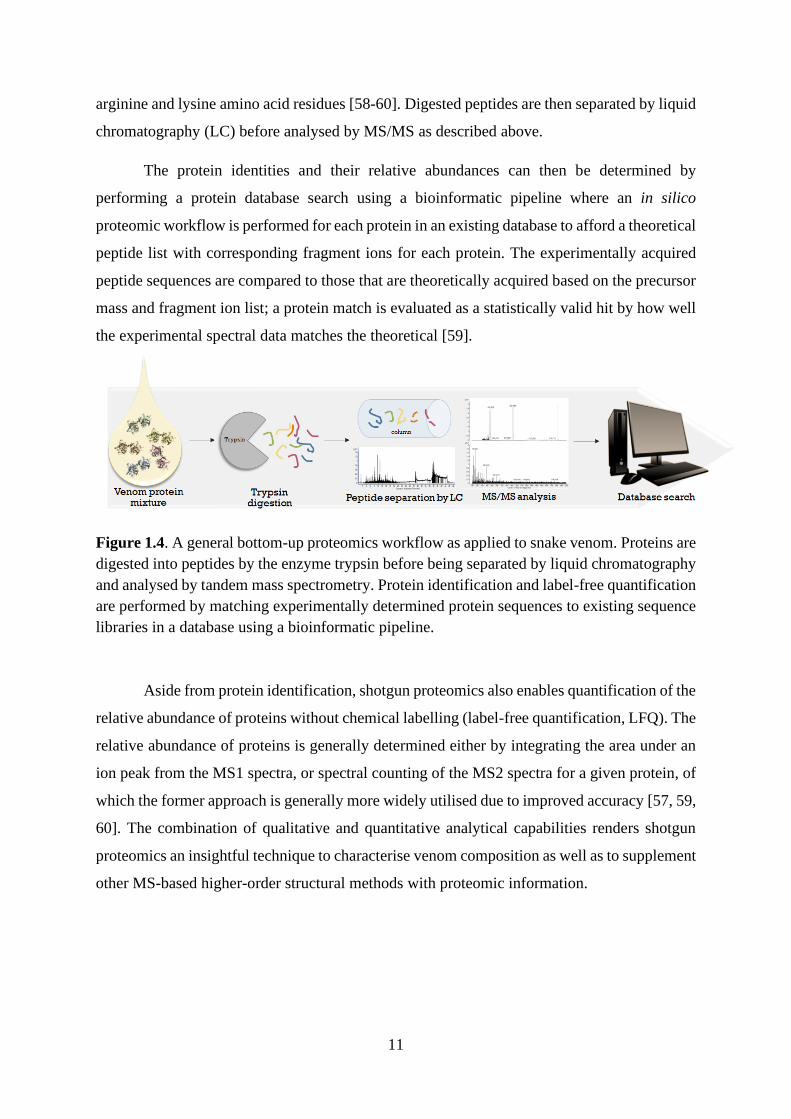
arginine and lysine amino acid residues [58-60]. Digested peptides are then separated by liquid
chromatography (LC) before analysed by MS/MS as described above.
The protein identities and their relative abundances can then be determined by
performing a protein database search using a bioinformatic pipeline where an in silico
proteomic workflow is performed for each protein in an existing database to afford a theoretical
peptide list with corresponding fragment ions for each protein. The experimentally acquired
peptide sequences are compared to those that are theoretically acquired based on the precursor
mass and fragment ion list; a protein match is evaluated as a statistically valid hit by how well
the experimental spectral data matches the theoretical [59].
Figure 1.4. A general bottom-up proteomics workflow as applied to snake venom. Proteins are
digested into peptides by the enzyme trypsin before being separated by liquid chromatography
and analysed by tandem mass spectrometry. Protein identification and label-free quantification
are performed by matching experimentally determined protein sequences to existing sequence
libraries in a database using a bioinformatic pipeline.
Aside from protein identification, shotgun proteomics also enables quantification of the
relative abundance of proteins without chemical labelling (label-free quantification, LFQ). The
relative abundance of proteins is generally determined either by integrating the area under an
ion peak from the MS1 spectra, or spectral counting of the MS2 spectra for a given protein, of
which the former approach is generally more widely utilised due to improved accuracy [57, 59,
60]. The combination of qualitative and quantitative analytical capabilities renders shotgun
proteomics an insightful technique to characterise venom composition as well as to supplement
other MS-based higher-order structural methods with proteomic information.
12
1.5.4. Q-IM-TOF mass spectrometer
Q-TOF mass analysers are also hybrid mass analysers that are conventionally used for
protein analysis. The versatility of this configuration also enables Q-TOF MS to be coupled to
another separation technique known as ion mobility (IM) separation, and the Synapt G1 mass
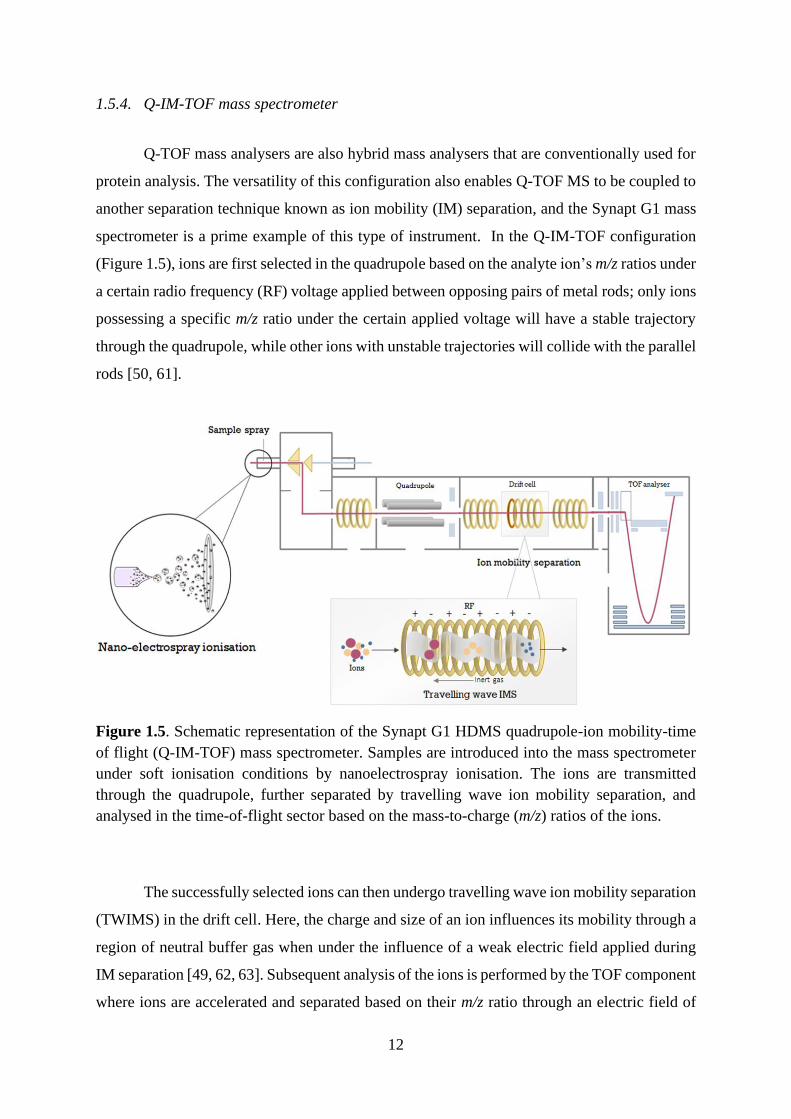
spectrometer is a prime example of this type of instrument. In the Q-IM-TOF configuration
(Figure 1.5), ions are first selected in the quadrupole based on the analyte ion’s m/z ratios under
a certain radio frequency (RF) voltage applied between opposing pairs of metal rods; only ions
possessing a specific m/z ratio under the certain applied voltage will have a stable trajectory
through the quadrupole, while other ions with unstable trajectories will collide with the parallel
rods [50, 61].
Figure 1.5. Schematic representation of the Synapt G1 HDMS quadrupole-ion mobility-time
of flight (Q-IM-TOF) mass spectrometer. Samples are introduced into the mass spectrometer
under soft ionisation conditions by nanoelectrospray ionisation. The ions are transmitted
through the quadrupole, further separated by travelling wave ion mobility separation, and
analysed in the time-of-flight sector based on the mass-to-charge (m/z) ratios of the ions.
The successfully selected ions can then undergo travelling wave ion mobility separation
(TWIMS) in the drift cell. Here, the charge and size of an ion influences its mobility through a
region of neutral buffer gas when under the influence of a weak electric field applied during
IM separation [49, 62, 63]. Subsequent analysis of the ions is performed by the TOF component
where ions are accelerated and separated based on their m/z ratio through an electric field of
13
known strength and distance. The time taken for an ion to travel through this drift region and
reach the detector can be measured and related back to the velocity of the ion which is
dependent on its m/z ratio [50, 61]. The Q-IM-TOF configuration offers multi-dimensional
separation of ions and greatly lends itself to the field of native ion-mobility mass spectrometry
(IM-MS) in the analysis of quaternary protein structures and interactions.
1.5.5. Native ion-mobility mass spectrometry
Native ion-mobility MS (IM-MS) is a technique that combines the mildness of nanoESI
and the multi-dimensional separation imparted by the Q-IM-TOF configuration. It has emerged
as a powerful biophysical technique that contributes to the higher-order protein structural
knowledge gap as soft ionisation conditions preserve any non-covalent complexes of interest,
and the addition of IM separation lends another degree of separation and structural
characterisation to the native MS analysis. Larger, more extended and unfolded protein
structures are known to take longer to traverse the drift cell as they are hindered by more
frequent collisions with the neutral gas molecules in the cell; these ions would thus possess a
longer drift time than a protein ion that is smaller and more compact [49]. Collision cross
section (CCS) values, which are an inherent physical property of the measured ion that infers
structural geometry of the molecule, can be calculated from these drift times, which is valuable
for studying the shape, size, and various conformations proteins can adopt [49, 64].
In previous studies, IM-MS has shown its potential in the successful characterisation of
various multiprotein assemblies and their topologies [49, 65, 66], but is still in relatively early
stages in the context of venom protein characterisation where it has only been applied to study
phospholipase A2s (PLA2s) from the eastern brown snake (Pseudonaja textilis) and the
Australian taipans (Oxyuranus spp.) [66, 67]. The speed and sensitivity of IM-MS data
acquisition, ability to maintain proteins in native-like states, unrestricted by protein size, and
capability to capture transient protein interactions are all factors that make native IM-MS an
appealing technique to help characterise higher-order oligomeric protein species in venoms
[46, 48, 63].
14
1.6. Characterisation of snake venoms by mass spectrometry
In this project, we aim to apply MS based techniques to structurally characterise
proteins in medically significant snake venoms that are both exotic and native to Australia. We
firstly aim to contribute towards venom adaptational curiosities, investigating the differences
in the venom proteomes of the geographically and morphologically diverse Australian tiger
snakes (Notechis scutatus). Next, characterisation of higher-order venom protein complexes
will be conducted for a small, phylogenetically diverse repertoire of venoms from medically
important yet underexplored snakes, namely the Collett’s snake (Pseudechis colletti), forest
cobra (Naja melanoleuca), and the puff adder (Bitis arietans). Finally, further structural and
preliminary functional characterisation of PLA2s in the venom of P. colletti will also be
explored.
15
~ Chapter 2 ~
Proteomic Variations Between Venoms of Different Populations of
Notechis scutatus (Australian Tiger Snake)
2.1. Introduction
2.1.1. Ecological significance of N. scutatus
There is considerable ecological and adaptational fascination surrounding N. scutatus,
which stands out as being the most widely distributed species of all Australian elapids and
inhabits the South-West and South-East regions of mainland Australia as well as a few
Southern off-shore islands [3, 68]. Prior to approximately 10 000 years ago, a continuous
stretch of N. scutatus populations was thought to have extended from regions of Western
Australia all the way to Queensland; however, the inundation of the South Australian coastal
plains by rising sea levels fragmented this population into isolated pockets [3, 68]. From an
ecological perspective, N. scutatus became a fascinating model because the resulting mainland
and insular island populations developed very distinct morphological traits.
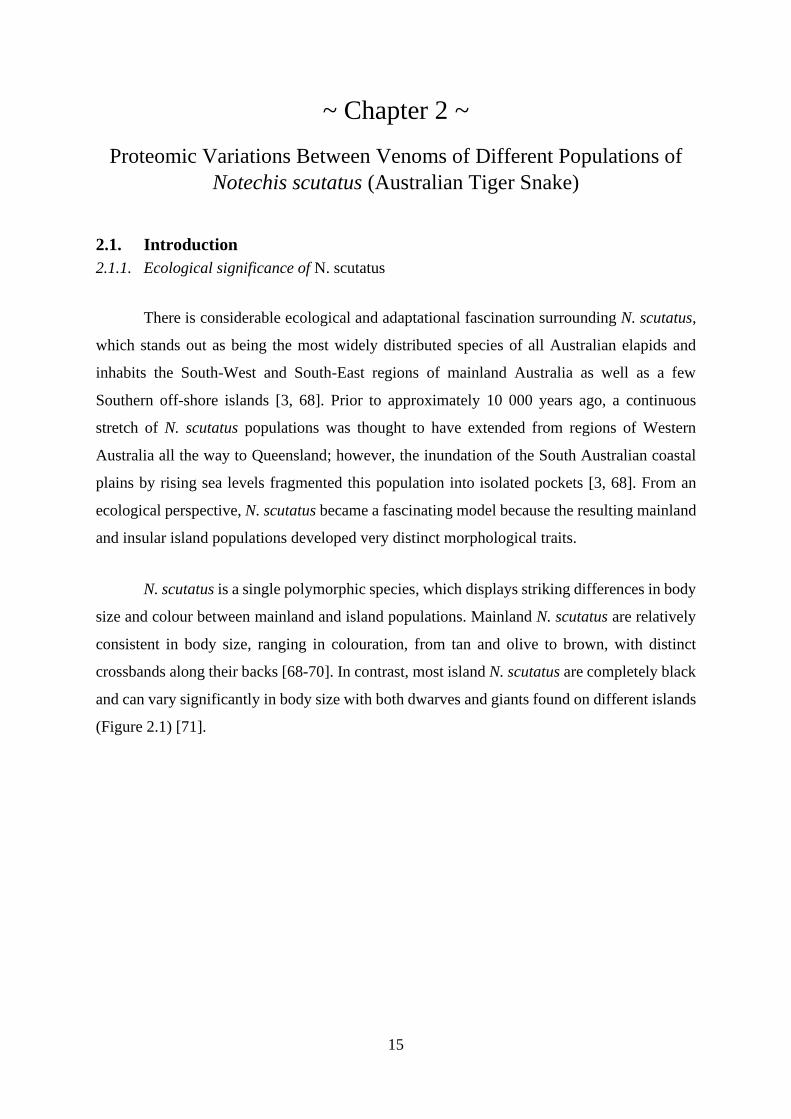
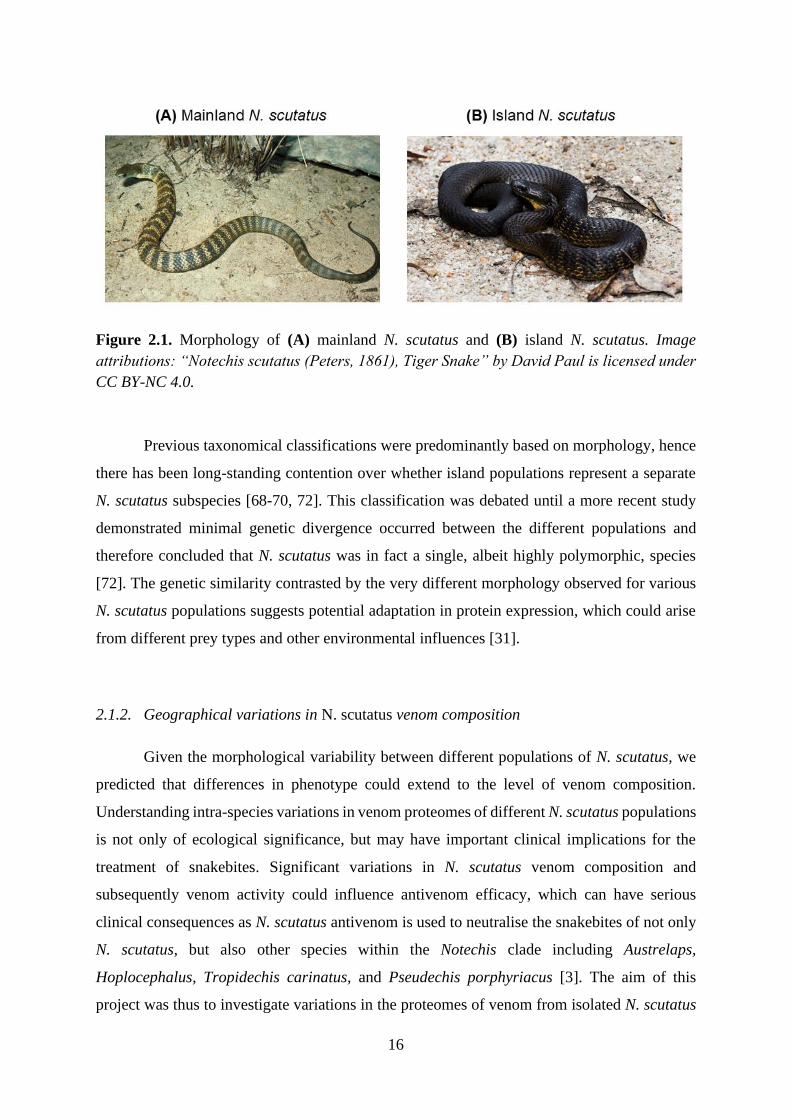
N. scutatus is a single polymorphic species, which displays striking differences in body
size and colour between mainland and island populations. Mainland N. scutatus are relatively
consistent in body size, ranging in colouration, from tan and olive to brown, with distinct
crossbands along their backs [68-70]. In contrast, most island N. scutatus are completely black
and can vary significantly in body size with both dwarves and giants found on different islands
(Figure 2.1) [71].
16
Figure 2.1. Morphology of (A) mainland N. scutatus and (B) island N. scutatus. Image
attributions: “Notechis scutatus (Peters, 1861), Tiger Snake” by David Paul is licensed under
CC BY-NC 4.0.
Previous taxonomical classifications were predominantly based on morphology, hence
there has been long-standing contention over whether island populations represent a separate
N. scutatus subspecies [68-70, 72]. This classification was debated until a more recent study
demonstrated minimal genetic divergence occurred between the different populations and
therefore concluded that N. scutatus was in fact a single, albeit highly polymorphic, species
[72]. The genetic similarity contrasted by the very different morphology observed for various
N. scutatus populations suggests potential adaptation in protein expression, which could arise
from different prey types and other environmental influences [31].
2.1.2. Geographical variations in N. scutatus venom composition
Given the morphological variability between different populations of N. scutatus, we
predicted that differences in phenotype could extend to the level of venom composition.
Understanding intra-species variations in venom proteomes of different N. scutatus populations
is not only of ecological significance, but may have important clinical implications for the
treatment of snakebites. Significant variations in N. scutatus venom composition and
subsequently venom activity could influence antivenom efficacy, which can have serious
clinical consequences as N. scutatus antivenom is used to neutralise the snakebites of not only
N. scutatus, but also other species within the Notechis clade including Austrelaps,
Hoplocephalus, Tropidechis carinatus, and Pseudechis porphyriacus [3]. The aim of this
project was thus to investigate variations in the proteomes of venom from isolated N. scutatus

17
populations. In this study, venoms from age-matched male N. scutatus were sourced from
populations in Melbourne, Mount Gambier, Tasmania, Franklin Island, and Reevesby Island
(Figure 2.2).
Figure 2.2. Geographical populations from which the venoms of adult male N. scutatus were
sourced for this study: Franklin Island (purple), Reevesby Island (blue), Mt Gambier (green),
Melbourne (orange), Tasmania (red).
N. scutatus are generalist predators, being indiscriminate with their prey types and often
feeding on a combination of ectothermic prey, such as anurans and small reptiles, as well small
endothermic mammals and occasionally birds [3, 69, 73]. However, the geographically
fragmented nature of N. scutatus populations restricts prey type availability, and distinctions
in the prey types consumed by different N. scutatus populations have been noted [68, 69, 73].
Of the five populations in this study, Franklin Island and Reevesby Island N. scutatus have
been observed preying on additional local prey types that are unavailable for mainland
populations. For example, Franklin Island N. scutatus also feed on large mutton bird chicks
(Thomson et al., unpublished fieldwork observations, 2018). This may be an important driver
for diversification of the venom proteome.
The research presented in this chapter details the investigation of proteomic variations
of five N. scutatus venoms, for which a shotgun proteomics approach was utilised to analyse
venom composition. A focussed quantitative analysis was also conducted for two South
Australian N. scutatus venoms that are representative of the mainland and island populations,
respectively.
18
2.2. Results and discussion
2.2.1. Venom complexity analysis by 2D gel electrophoresis
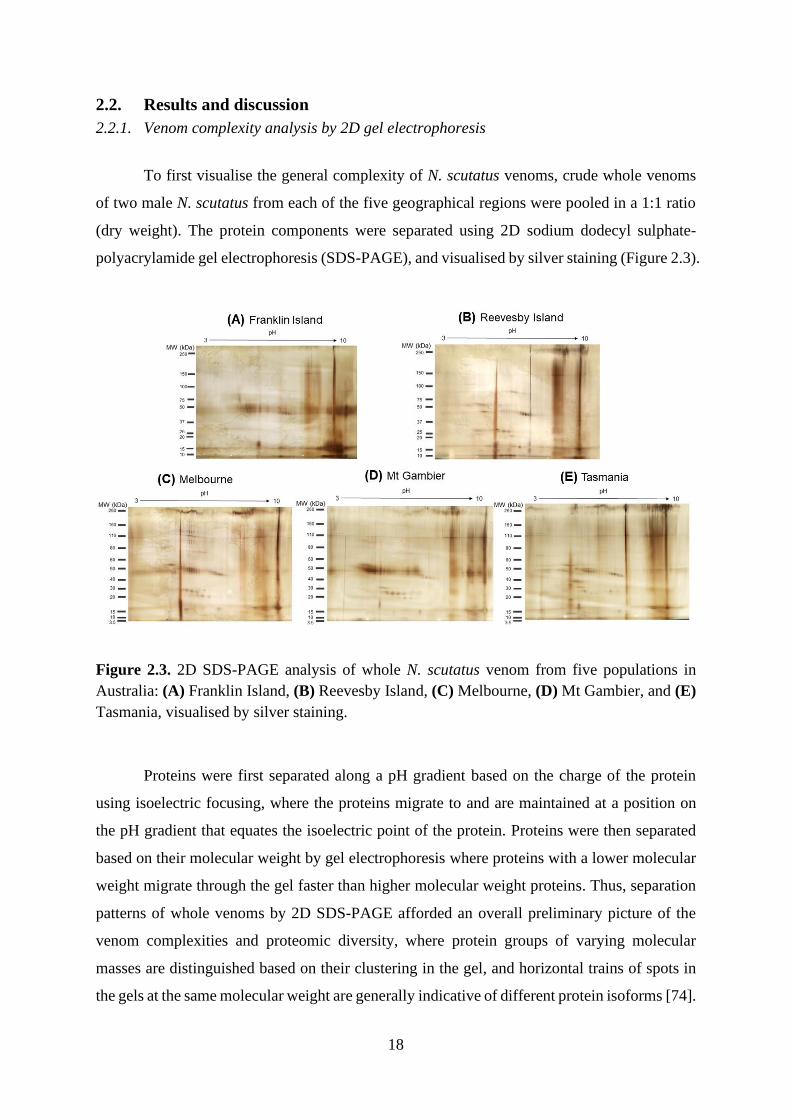
To first visualise the general complexity of N. scutatus venoms, crude whole venoms
of two male N. scutatus from each of the five geographical regions were pooled in a 1:1 ratio
(dry weight). The protein components were separated using 2D sodium dodecyl sulphate-
polyacrylamide gel electrophoresis (SDS-PAGE), and visualised by silver staining (Figure 2.3).
Figure 2.3. 2D SDS-PAGE analysis of whole N. scutatus venom from five populations in
Australia: (A) Franklin Island, (B) Reevesby Island, (C) Melbourne, (D) Mt Gambier, and (E)
Tasmania, visualised by silver staining.
Proteins were first separated along a pH gradient based on the charge of the protein
using isoelectric focusing, where the proteins migrate to and are maintained at a position on
the pH gradient that equates the isoelectric point of the protein. Proteins were then separated
based on their molecular weight by gel electrophoresis where proteins with a lower molecular
weight migrate through the gel faster than higher molecular weight proteins. Thus, separation
patterns of whole venoms by 2D SDS-PAGE afforded an overall preliminary picture of the
venom complexities and proteomic diversity, where protein groups of varying molecular
masses are distinguished based on their clustering in the gel, and horizontal trains of spots in
the gels at the same molecular weight are generally indicative of different protein isoforms [74].
19
Consistent with the broad mass range of proteins that is characteristic of N. scutatus venom
[74, 75], four major protein clusters were generally categorised based on their molecular mass:
high (>100 kDa), intermediate (50 – 70 kDa), intermediate-low (20 – 30 kDa), and low (9 – 16
kDa) molecular weight proteins.
These four protein clusters were identified in all five venoms, albeit at varying
abundances and displaying various isoforms, which are indicated by the protein spot intensity
and the horizontal trains of spots in the gels [74], respectively. Basic, high molecular weight
proteins were present at approximately pH 10 for all five venoms. A cluster of neutral
intermediate molecular weight proteins appeared to be abundant across the five venoms, with
more variety observed for the Tasmanian venom. Neutral, intermediate-low molecular weight
proteins were also found in the majority of venoms. The gel profile for the Franklin Island
venom was more distinctly complex within this molecular weight range, in which more basic
proteins were noted, compared to other venoms. Various isoforms of low molecular weight
proteins were also observed in all five venoms at varying abundances. An intense cluster of
protein spots at approximately pH 10 for the Franklin Island venom suggests abundance of
more basic isoforms in this low molecular weight range. Overall, crude fractionation via 2D
SDS-PAGE demonstrated that N. scutatus venom proteomes are quite diverse and complex,
including a range of large to small proteins with various potential isoforms. However, the
venom proteomes of the five populations appeared to be generally similar, despite some
variations in protein abundance and isoforms (Figure 2.3).
2.2.2. Qualitative proteomic analysis reveals diversity of N. scutatus venoms
Whole venoms from each of the five populations were digested with trypsin and
analysed by LC-MS/MS. Duplicate experiments were conducted for each biological replicate
to afford four replicates per population; restricted physical access to a greater number of
biological replicates thus limited this study to a relatively modest sample size. Proteins in the
venom samples were then identified by database searching using the protein identification
search engine Mascot (Matrixscience), where the experimentally generated peptide sequences
in the mass spectral data files were matched against existing peptide sequences in the protein
database. The data was searched against all Chordata entries present in the Swiss-Prot database
with the significance threshold set as P-value < 0.05 to ensure the exclusive inclusion of the
statistically significant protein matches. Any contaminants or false positive hits were removed
20
during this filtering process, and the protein matches from all four replicates for each N.
scutatus population were pooled together for further qualitative analysis. As this study was
focussed on toxin components (TOXINs) of the venoms, cellular (CELL) and uncharacterised
(UN) proteins were excluded from further analysis.
Within each N. scutatus population, the number of pooled toxin hits were then counted
and categorised for a given toxin family based on their toxic mode of action in the venom. It
should be noted that given the nature of database searching, the same peptide sequence may
have been matched to very similar proteins but across different snake species during the
analysis. As this section of the study only presents a very general and qualitative proteomic
perspective of the whole venoms, these protein hits that share the same peptide sequence but
possess different homologies were all included in Appendix A. However, recurring protein hits
(identical protein accession codes) in the four replicates within each N. scutatus population
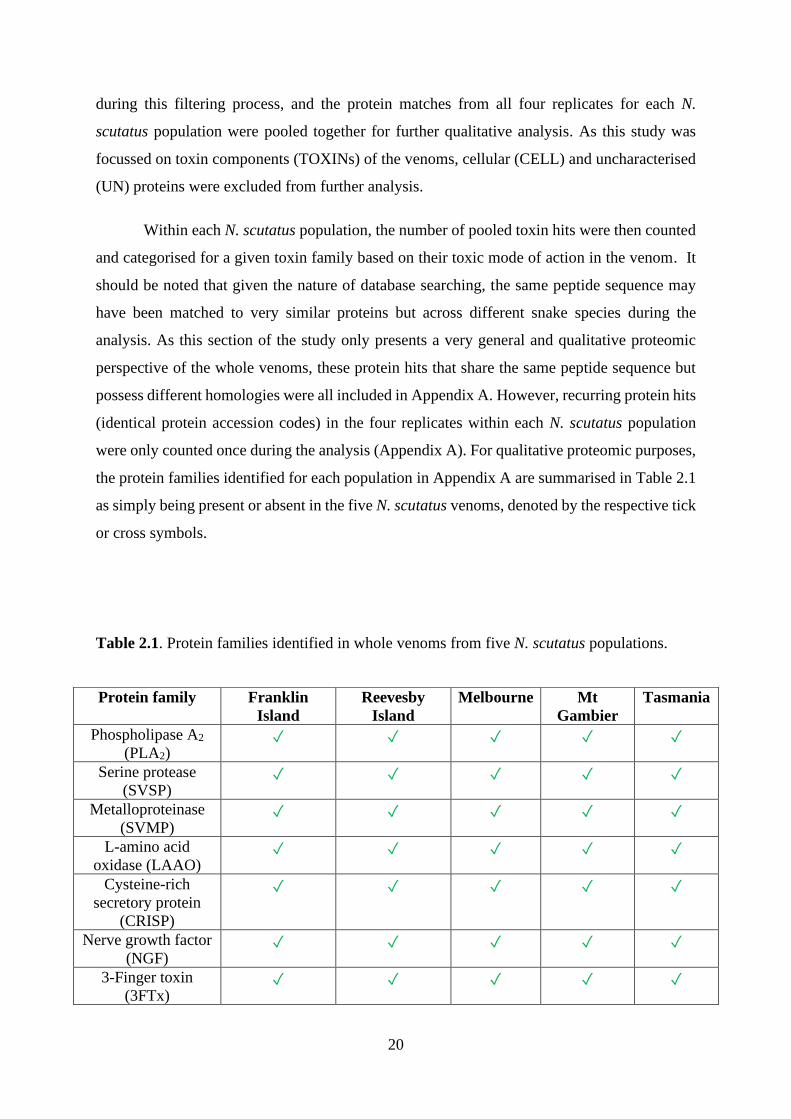
were only counted once during the analysis (Appendix A). For qualitative proteomic purposes,
the protein families identified for each population in Appendix A are summarised in Table 2.1
as simply being present or absent in the five N. scutatus venoms, denoted by the respective tick
or cross symbols.
Table 2.1. Protein families identified in whole venoms from five N. scutatus populations.
Protein family Franklin
Island
Reevesby
Island
Melbourne Mt
Gambier
Tasmania
Phospholipase A2
(PLA2) ✓ ✓ ✓ ✓ ✓
Serine protease
(SVSP) ✓ ✓ ✓ ✓ ✓
Metalloproteinase
(SVMP) ✓ ✓ ✓ ✓ ✓
L-amino acid
oxidase (LAAO) ✓ ✓ ✓ ✓ ✓
Cysteine-rich
secretory protein
(CRISP)
✓ ✓ ✓ ✓ ✓
Nerve growth factor
(NGF) ✓ ✓ ✓ ✓ ✓
3-Finger toxin
(3FTx) ✓ ✓ ✓ ✓ ✓
21
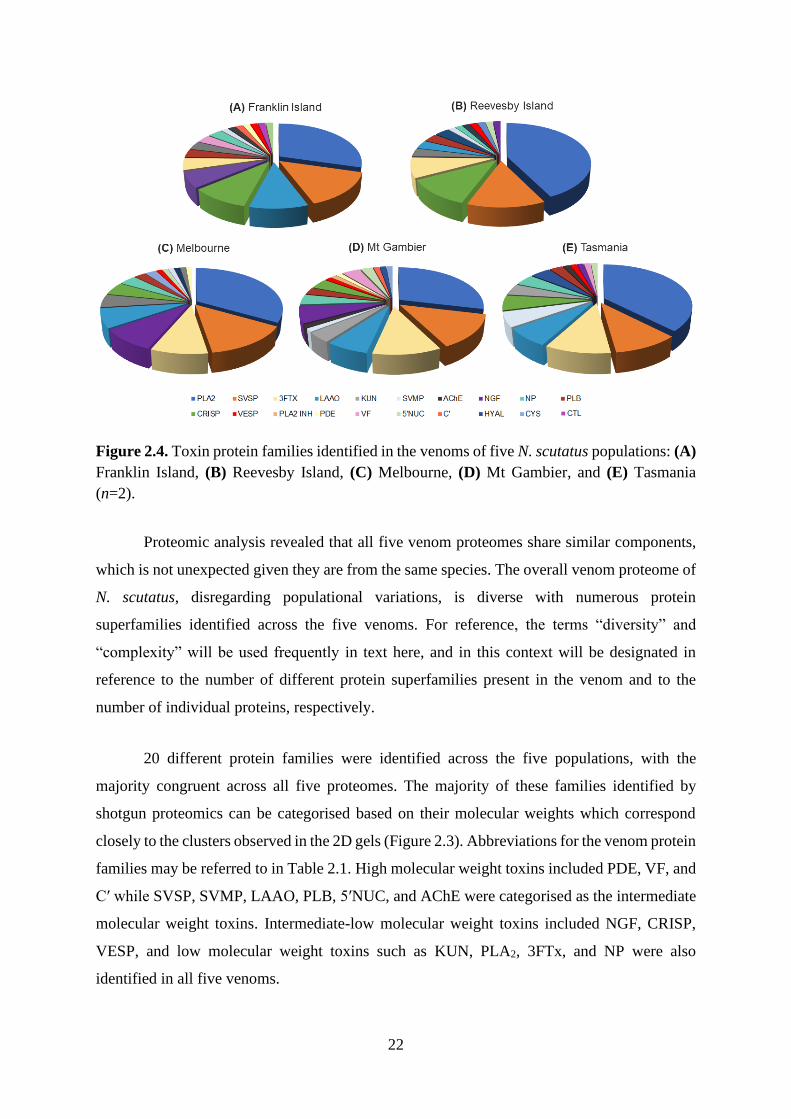
The total toxin hits for each population are further summarised in Figure 2.4 which
represents a preliminary and qualitative comparison of venom diversity. The protein hits
belonging to the same protein group, for instance PLA2, for a given N. scutatus population are
counted and categorised into one toxin group, shown as one coloured wedge in Figure 2.4. Of
note, the size of the protein family proportions represented in Figure 2.4 is not representative
of relative protein abundance; rather, as mentioned previously they show the number of protein
hits within protein superfamilies of a specific toxic function (denoted by coloured wedges) that
were identified for each population.
Phospholipase B
(PLB) ✓ ✓ ✓ ✓ ✓
Kunitz-type serine
protease inhibitor
(KUN)
✓ ✓ ✓ ✓ ✓
Natriuretic peptide
(NP) ✓ ✓ ✓ ✓ ✓
5ʹnucleotidase
(5ʹNUC) ✓ ✓ ✓ ✓ ✓
Acetylcholinesterase
(AChE) ✓ ✓ ✓ ✓ ✓
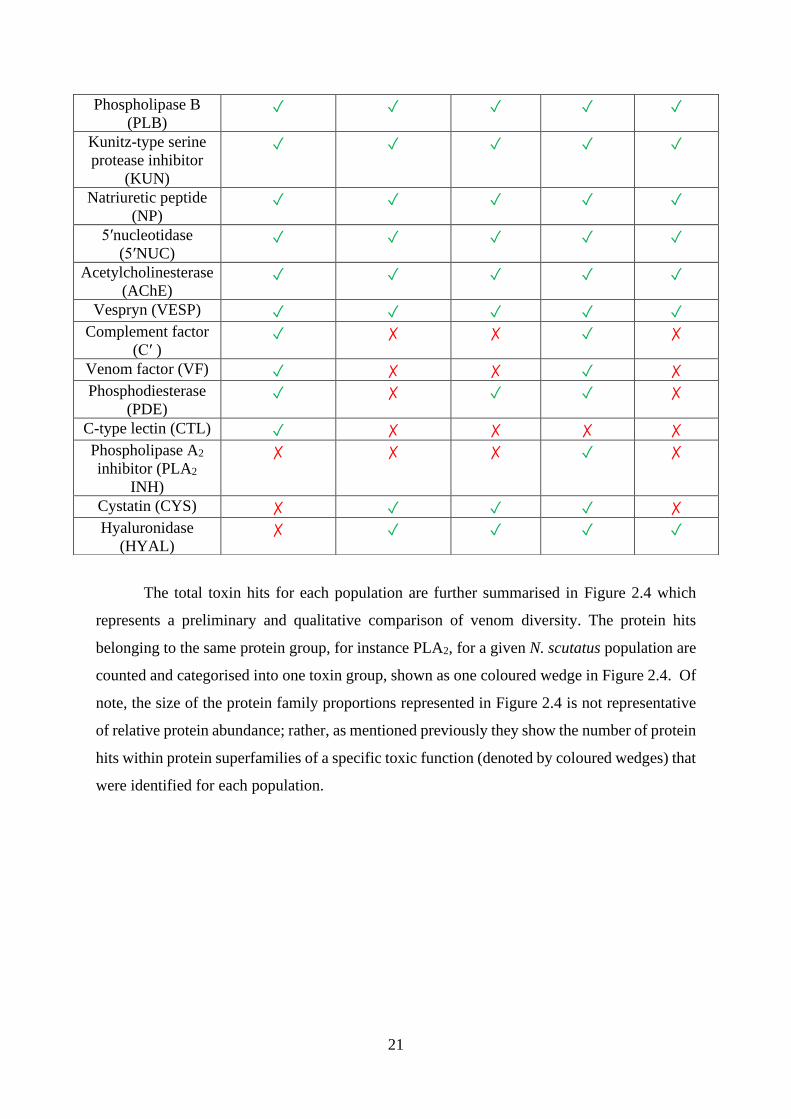
Vespryn (VESP) ✓ ✓ ✓ ✓ ✓
Complement factor
(Cʹ ) ✓ ✗ ✗ ✓ ✗
Venom factor (VF) ✓ ✗ ✗ ✓ ✗
Phosphodiesterase
(PDE) ✓ ✗ ✓ ✓ ✗
C-type lectin (CTL) ✓ ✗ ✗ ✗ ✗
Phospholipase A2
inhibitor (PLA2
INH)
✗ ✗ ✗ ✓ ✗
Cystatin (CYS) ✗ ✓ ✓ ✓ ✗
Hyaluronidase
(HYAL) ✗ ✓ ✓ ✓ ✓
22
Figure 2.4. Toxin protein families identified in the venoms of five N. scutatus populations: (A)
Franklin Island, (B) Reevesby Island, (C) Melbourne, (D) Mt Gambier, and (E) Tasmania
(n=2).
Proteomic analysis revealed that all five venom proteomes share similar components,
which is not unexpected given they are from the same species. The overall venom proteome of
N. scutatus, disregarding populational variations, is diverse with numerous protein
superfamilies identified across the five venoms. For reference, the terms “diversity” and
“complexity” will be used frequently in text here, and in this context will be designated in
reference to the number of different protein superfamilies present in the venom and to the
number of individual proteins, respectively.
20 different protein families were identified across the five populations, with the
majority congruent across all five proteomes. The majority of these families identified by
shotgun proteomics can be categorised based on their molecular weights which correspond
closely to the clusters observed in the 2D gels (Figure 2.3). Abbreviations for the venom protein
families may be referred to in Table 2.1. High molecular weight toxins included PDE, VF, and
Cʹ while SVSP, SVMP, LAAO, PLB, 5ʹNUC, and AChE were categorised as the intermediate
molecular weight toxins. Intermediate-low molecular weight toxins included NGF, CRISP,
VESP, and low molecular weight toxins such as KUN, PLA2, 3FTx, and NP were also
identified in all five venoms.
23
Despite their overall similarities in major toxin families identified, slight variations in
venom diversity were noted across the populations. Notably, Mt Gambier and Franklin Island
venoms were the most diverse with 19 and 17 toxin families identified, respectively. Some of
the minor toxin families appeared unique to each population: Cʹ and VF were identified in both
venoms whereas PLA2 INH appeared unique to the venom of the Mt Gambier population and
CTL was only identified in the Franklin Island venom. The diverse repertoire of toxin families
identified here, from an ecological perspective, is consistent with N. scutatus’ nature as a
generalist predator. This species would likely benefit from having various toxic components to
aid immobilisation and digestion of a wide range of ectothermic and endothermic prey-types
[3, 73].
Notably, the proteins identified here correspond to the best matches against a protein
database search using the broad Chordata taxonomy filter, and therefore do not necessarily
represent the entirety of the proteins in these venoms. It is possible that some of the more
unique proteins in N. scutatus venom were not identified here, owing to the fact that many
proteins would not have been sequenced and collated in the database yet, hence assignment
would not have been made. Transcriptomics of the N. scutatus venoms described here is
currently being undertaken in parallel with this study; while the results are not yet available, a
combination of the proteomic analysis with the transcriptomic results will potentially provide
a more comprehensive understanding of the N. scutatus venom composition and diversity.
2.2.3. Quantitative proteomic analysis of N. scutatus venoms
In order to obtain more quantitative insight on the proteomic variations of these N.
scutatus venoms, this protein dataset was further processed using the MaxQuant software [76]
to compare relative toxin protein abundances based on label-free quantification (LFQ) intensity
values, which can be regarded as a proxy for relative protein abundance [77]. These intensities
were used to construct a clearer picture of the relative proportions of toxin families within
venoms (amount of protein expressed within each protein family, as opposed to numbers of
different protein hits within families; Figure 2.5). For this analysis, more stringent parameters
were applied so that a valid protein hit consisted of peptide matches for at least two of the four
replicates within a population; hence, some previously identified minor toxin families were
eliminated from this analysis. Proportions of toxin families within each population venom
24
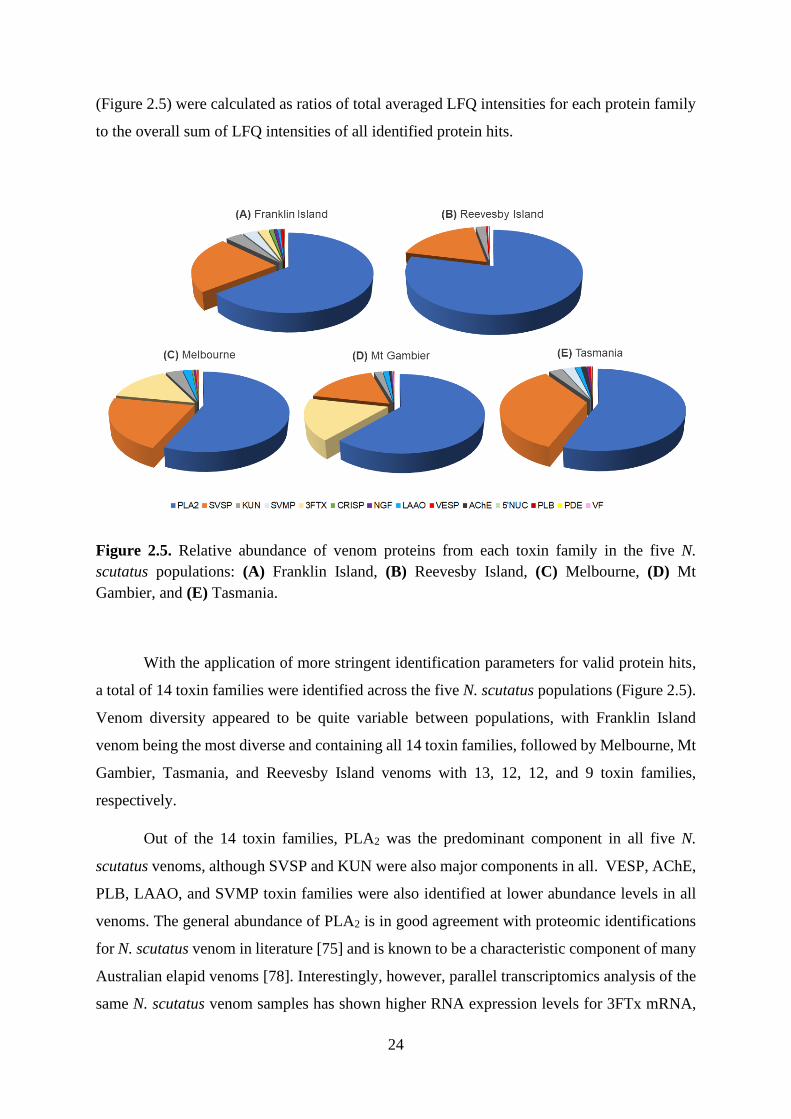
(Figure 2.5) were calculated as ratios of total averaged LFQ intensities for each protein family
to the overall sum of LFQ intensities of all identified protein hits.
Figure 2.5. Relative abundance of venom proteins from each toxin family in the five N.
scutatus populations: (A) Franklin Island, (B) Reevesby Island, (C) Melbourne, (D) Mt
Gambier, and (E) Tasmania.
With the application of more stringent identification parameters for valid protein hits,
a total of 14 toxin families were identified across the five N. scutatus populations (Figure 2.5).
Venom diversity appeared to be quite variable between populations, with Franklin Island
venom being the most diverse and containing all 14 toxin families, followed by Melbourne, Mt
Gambier, Tasmania, and Reevesby Island venoms with 13, 12, 12, and 9 toxin families,
respectively.
Out of the 14 toxin families, PLA2 was the predominant component in all five N.
scutatus venoms, although SVSP and KUN were also major components in all. VESP, AChE,
PLB, LAAO, and SVMP toxin families were also identified at lower abundance levels in all
venoms. The general abundance of PLA2 is in good agreement with proteomic identifications
for N. scutatus venom in literature [75] and is known to be a characteristic component of many
Australian elapid venoms [78]. Interestingly, however, parallel transcriptomics analysis of the
same N. scutatus venom samples has shown higher RNA expression levels for 3FTx mRNA,
25
compared to that of PLA2 (Thomson et al., unpublished results, 2018). Thus, the strong
presence of PLA2 and comparably low, more variable levels of 3FTx in all five venom
proteomes could reflect differences between the extent of RNA expression of these genes and
their translation into functional proteins. Given the high abundance of 3FTx proteins in
Melbourne and Mt Gambier venoms, it is unlikely these proteins were not observed in the other
populations due to sample preparation or analytical methods. This, nonetheless, forms the
subject of ongoing analysis.
Aside from their shared toxin groups, notable variations in venom diversity and
complexity were observed across the five different populations. The most remarkable
difference was the variation in 3FTx abundances that distinguished certain N. scutatus venom
proteomes from others. Melbourne and Mt Gambier venoms had comparable levels of 3FTx,
PLA2, and SVSP proteins, which are also the most abundant protein families for these venoms.
In contrast, Franklin Island, Reevesby Island, and Tasmanian venoms all had a low abundance
or absence of 3FTxs in their proteomes. These differences are interesting in that they could
suggest a correlation between venom composition and diet prey types. Melbourne and Mt
Gambier N. scutatus have a diet that is rich in ectotherms (predominantly frogs) (Thomson et
al., unpublished fieldwork observations, 2018). It is plausible that the high-expression of
paralytic 3FTxs in these venoms provides an advantage for immobilising agile prey types.
Contrastingly, the endothermic mutton bird-dominant diet observed for Franklin and Reevesby
Island N. scutatus populations could have a correlation with the minimal or absent 3FTx
proteins for these venoms.
This diet hypothesis, however, does not account for the unique composition of
Tasmanian venoms, which appear to share traits from both island and mainland populations
groups. Despite the similar diets of Tasmanian, Melbourne, and Mt Gambier N. scutatus, the
Tasmanian venom proteome more closely resembled those of Franklin and Reevesby Islands
in that 3FTxs were absent. However, it should be noted that although the N. scutatus venoms
used in this study were sourced from mainland Tasmania, mutton bird colonies have been
observed on small islands surrounding mainland Tasmania (Thomson et al., unpublished
fieldwork observations, 2018). Thus, there is a possibility that the diets of Tasmanian N.
scutatus also includes larger birds, which could therefore explain the similarities between
Tasmanian venoms and those of Franklin and Reevesby Islands. Furthermore, the influence of
other factors, such as the time of venom acquisition, climate, seasonal, and geographical factors
26
have been extensively discussed in previous studies for other snake venoms [8, 31] and may
likely have an impact on the venom proteomes of these N. scutatus populations as well.
2.2.4. Quantitative proteomic analysis of Franklin Island and Mt Gambier venom proteomes
Due to the small sample sizes, a comparison between all five N. scutatus populations
was not statistically feasible; however, two venoms were selected for a quantitative comparison
of their protein expression levels. Additional biological replicates were sourced for Franklin
Island and Mt Gambier venoms, which were selected as representative South Australian island
and mainland venoms, respectively. Experiments were conducted using three different venoms
from each population (biological triplicates), with three technical replicates performed for each
individual venom that were relatively consistent with similar protein hits.
Venom samples were prepared as previously described, except with mass spectrometric
analysis of tryptic digests performed using a Bruker Impact II Q-TOF mass spectrometer,
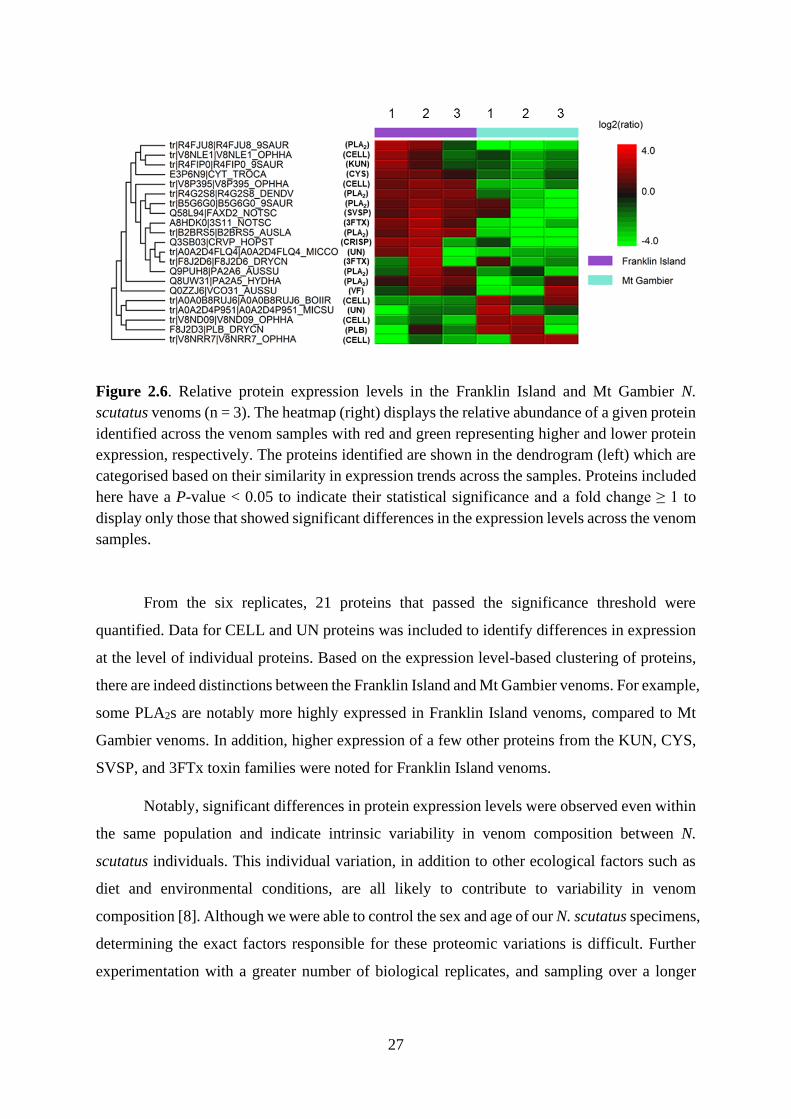
owing to issues with instrument availability. PEAKS (Bioinformatics Solutions Inc.) software
was used to generate a heatmap of relative protein expression levels for the biological
triplicates in each population (Figure 2.6). The relative abundance of a given protein is
represented by the colour intensity on the heatmap, based on log2(ratio) values derived from
the ratio of peak area of the relevant peptide ions being compared (ie. sample protein abundance)
to the average abundance of that protein across all samples [79]. Only proteins that met
statistical requirements of P-value < 0.05 and fold change ≥ 1 were included in Figure 2.6,
where red in the heatmap represents high protein expression level while low expression is
shown in green. The dendrogram in Figure 2.6 displays hierarchal clustering of the proteins
based on their similarity in expression trends across the various samples [79]; proteins
identified with the most similar levels of expression are clustered closest together in the
dendrogram.
27
Figure 2.6. Relative protein expression levels in the Franklin Island and Mt Gambier N.
scutatus venoms (n = 3). The heatmap (right) displays the relative abundance of a given protein
identified across the venom samples with red and green representing higher and lower protein
expression, respectively. The proteins identified are shown in the dendrogram (left) which are
categorised based on their similarity in expression trends across the samples. Proteins included
here have a P-value < 0.05 to indicate their statistical significance and a fold change ≥ 1 to
display only those that showed significant differences in the expression levels across the venom
samples.
From the six replicates, 21 proteins that passed the significance threshold were
quantified. Data for CELL and UN proteins was included to identify differences in expression
at the level of individual proteins. Based on the expression level-based clustering of proteins,
there are indeed distinctions between the Franklin Island and Mt Gambier venoms. For example,
some PLA2s are notably more highly expressed in Franklin Island venoms, compared to Mt
Gambier venoms. In addition, higher expression of a few other proteins from the KUN, CYS,
SVSP, and 3FTx toxin families were noted for Franklin Island venoms.
Notably, significant differences in protein expression levels were observed even within
the same population and indicate intrinsic variability in venom composition between N.
scutatus individuals. This individual variation, in addition to other ecological factors such as
diet and environmental conditions, are all likely to contribute to variability in venom
composition [8]. Although we were able to control the sex and age of our N. scutatus specimens,
determining the exact factors responsible for these proteomic variations is difficult. Further
experimentation with a greater number of biological replicates, and sampling over a longer
28
period of time with additional representative populations will provide a more accurate
representation of the effect of these factors on N. scutatus venom protein composition.
2.3. Concluding remarks
In this chapter, we have applied a shotgun proteomic pipeline to investigate the venom
composition of five different N. scutatus populations. 2D gel electrophoretic and proteomic
analyses revealed N. scutatus to be a diverse, predominantly PLA2-abundant venom. Variations
in 3FTx abundance appeared to exist between certain mainland and island populations, which
may suggest some dietary influence over venom composition. However, focussed quantitative
comparisons of representative South Australian mainland and island population venoms
revealed significant intra-population differences consistent with intrinsic variability between
N. scutatus individuals. Nonetheless, our findings here showcase the impressive variability of
N. scutatus venom across different populations. While prey types may play a role in proteomic
variability, our findings infer that other factors are also likely involved. Further
experimentation with a larger sample size and the integration of our proteomics results with
transcriptomics data would be crucial for providing a more comprehensive understanding of N.
scutatus venom composition.
29
2.4. Experimental procedures
2.4.1. Materials, reagents and buffers used
All reagents were purchased from Sigma Aldrich (NSW, Australia) unless specified otherwise.
Whole lyophilised N. scutatus venoms were kindly supplied by Dr. Vicki Thomson and Venom
Supplies Pty. Ltd. (Tanunda, Australia). The venoms were stored at -20 oC until required for
experimentation.
Rehydration buffer: 7 M urea, 2 M thiourea, 4% (w/v) CHAPs, 10 mM dithiothreitol (DTT),
0.2% (w/v) SERVALYT carrier ampholytes (SERVA electrophoresis GmbH, Heidelberg,
Germany)
Reducing buffer: 0.05 M tris-HCl (pH 8.8), 6 M urea, 2% (w/v) SDS, 20% (v/v) glycerol, and
10 mM DTT in 100 mM ammonium acetate (NH4OAc).
Alkylating buffer: 0.05 M tris-HCl (pH 8.8), 6 M urea, 2% (w/v) SDS, 20% (v/v) glycerol, and
55 mM iodoacetamide (IAA) in 100 mM NH4OAc.
1x SDS-tris-glycine running buffer: diluted from 10x running buffer (25 mM tris, 192 mM
glycine, 0.1% SDS, pH 8.5).
Solvent A: 2% (v/v) acetonitrile (ACN) 0.1% (v/v) formic acid (FA)
Solvent B: 80% (v/v) ACN 0.1% (v/v) FA
2.4.2. 2D-SDS PAGE
The method was adapted from [74]. Crude whole venoms from the biological duplicates
for each population were combined in a 1:1 (w/w) ratio. Lyophilised whole venom (2 mg) for
each N. scutatus population was dissolved in 200 µL of 50% glycerol and 50% 1x phosphate
buffered saline (PBS). 30 µL (i.e. 300 µg of whole venom) of each reconstituted venom was
then added to rehydration buffer, to a final volume of 185 µL. The mixture was applied onto a
ReadyStripTM Bio-Rad IPG strip (11 cm, pH 3 - 10) (Bio-Rad, California, US), and rehydrated
overnight in rehydration buffer. First dimension isoelectric focusing (IEF) was performed in
an Ettan IPGphor II isoelectric focusing unit (Amersham Biosciences, Amersham, UK) at 20
oC. A 3-phase program was used: 250 V rapid gradient for 15 min, 8000 V linear gradient for
3 h, and 8000 V step to a total of 40 000 V-hr.
30
The IPG strips were incubated in reducing buffer for 15 min, then subsequently in
alkylating buffer for 15 min with gentle agitation in both instances. The IPG strips were layered
onto 4 - 15% Bio-Rad Criterion tris-HCl polyacrylamide gels (11cm, IPG+1 wells) (Bio-Rad,
California, US). Protein separation by molecular weight in the second dimension was
performed by electrophoresis at 180 V and 100 mA for 1 h, using 1x SDS tris-glycine running
buffer. Precision Plus Protein dual colour standards (Bio-Rad, California, US) were used as
molecular weight markers in the Franklin Island and Reevesby Island venom gels, and Novex
Sharp unstained protein standards (Invitrogen, California, US) were the protein markers used
in the Melbourne, Mt Gambier, and Tasmanian venom gels. Gels were then silver-stained
according to the SilverQuest Kit protocol (Thermo Fisher Scientific, Massachusetts, US) and
imaged using an Imagescanner densitometer (Amersham Biosciences, Amersham, UK).
2.4.3. Filter-aided, in-solution tryptic digestion
All whole venom tryptic digests were performed as in-solution, filter-aided tryptic
digests in Amicon Ultra-0.5mL centrifugal filter units (MerckMillipore, Darmstadt, Germany)
with a 10 kDa molecular weight cut-off. In the case of the quantitative proteomic study, spin
filters with 3 kDa molecular weight cut-offs were used instead.
Whole venom (0.1 mg) in 200 μL of 7 M urea/100 mM ammonium bicarbonate
(NH4HCO3) was incubated with 50 mM DTT for 1 h at room temperature, then further
incubated with 55 mM IAA for 20 min in darkness. Promega MS grade trypsin (Thermo Fisher
Scientific, Massachusetts, US), resuspended at 100 ng/μL in 10 mM NH4HCO3, was added to
the sample so that a mass ratio of 1:50 (enzyme:protein) was achieved, and the sample was
incubated at 37 oC overnight. The digested peptides were eluted through the spin-filter,
collected, then dried using vacuum centrifugation, before being reconstituted in 100 µL of 2%
(v/v) ACN 0.1% (v/v) FA. The sample was then purified with a C18 Biospin column (Thermo
Fisher Scientific, Massachusetts, US) according to the manufacturer’s protocol, and
concentrations were verified on a NanoDrop 2000/2000c UV-Vis spectrophotometer (Thermo
Scientific, Massachusetts, US) at a wavelength of 205 nm, ε205 of 31 mL mg-1cm-1 as per the
manufacturer’s instructions. All samples were stored at -20 oC until required for LC-MS/MS.
31
2.4.4. LC-MS/MS analyses of the multi-populational study
For qualitative and quantitative proteomic analyses of the venoms, digested samples
were investigated by LC-MS/MS using an Ultimate 3000 nano-flow system (Thermo Fisher
Scientific, California, US) coupled to a LTQ XL Orbitrap ETD mass spectrometer (Thermo
Fisher Scientific, California, US). 2 µg of each peptide sample was first concentrated on a C18
trapping column (Acclaim PepMap 100 C18 75 µm x 20 mm, Thermo-Fisher Scientific) at a
flow rate of 5 µL/min using 2% (v/v) ACN 0.1% (v/v) trifluoroacetic acid (TFA) for 10 min.
Peptides were then separated using a 75 µm ID C18 column (Acclaim PepMap100 C18 75 µm
x 50 cm, Thermo-Fisher Scientific) at a flow rate of 0.3 µL/min, using a linear gradient of 5 to
45% Solvent B over 60 min. This was followed by a 5 min wash with 90% Solvent B, and then
a 15 min equilibration process with 5% Solvent B. Samples were acquired in technical
duplicates.
LC-MS/MS acquisitions were controlled by Xcalibur (version 2.1, Thermo Fisher
Scientific). The mass spectrometer was operated in data-dependent acquisition mode.
Conditions used were as follows: m/z range, 300 – 2000 at a resolution of 60 000 in FT mode;
polarity, positive. The 10 most intense precursor ions were selected for CID fragmentation with
a dynamic exclusion of 5 seconds. The dynamic exclusion criteria included: minimum relative
signal intensity of 1000 and ≥ 2 positive charge state. The isolation width used was 3.0 m/z and
a normalised collision energy of 35 was applied.
2.4.5. LC-MS/MS analysis for comparison between Franklin Island and Mt Gambier venoms
For quantitative proteomic analysis, the samples were investigated by nano-LC-ESI-
MS/MS using an Ultimate 3000 RSLC system (Thermo Fisher Scientific, Waltham, US)
coupled to an Impact II HD QTOF mass spectrometer (Bruker Daltonics, Bremen, Germany)
with an Advance CaptiveSpray nanosource (Bruker Daltonics). 2 µg of each peptide sample
was first pre-concentrated on a C18 trapping column (Acclaim PepMap 100 C18 75 µm x 20
mm, Thermo-Fisher Scientific) at a flow rate of 5 µL/min using 2% (v/v) ACN 0.1% (v/v) TFA
for 10 min. Peptides were then separated using a 75 µm ID C18 column (Acclaim PepMap100
C18 75 µm x 50 cm, Thermo-Fisher Scientific) at a flow rate of 0.3 µL/min, using a linear
gradient of 5 to 45% Solvent B over 60 min. This was followed by a 5 min wash with 90%
32
Solvent B, and then a 15 min equilibration process with 5% Solvent B. Samples were acquired
in technical triplicates.
LC-MS/MS acquisition were performed in data-dependent acquisition mode. The
conditions used were as follows: m/z range, 300 – 2200; polarity, positive. Previously chosen
precursor ions were excluded unless the ion’s chromatographic peak intensity increased by a
factor of 5. Singly charged precursor ions were also excluded from the acquisition. Collision
energy used varied from 23% to 65% and was dependent on the precursor ion’s m/z value.
2.4.6. Mascot Protein Identification
Raw MS/MS data were converted to MGF file formats and submitted for qualitative
protein identification on the in-house Mascot server (version 2.3.01, Matrixscience). The data
was searched against all Chordata entries present in the Swiss-Prot database. Parameters set
for the performed search were as follows: tryptic peptides with up to 2 missed cleavages were
allowed, peptide mass tolerance of 10 ppm, fragment mass tolerance of 0.8 Da, cysteine
carbamidomethylation set as fixed modification and methionine oxidation as a variable
modification.
2.4.7. MaxQuant Analysis
Raw MS/MS data acquired on the Orbitrap mass spectrometer were submitted for
analysis using MaxQuant (version 1.6.10, Max Planck Institute of Biochemistry). The data was
searched against all Serpentes entries present in the Swiss-Prot database. Standard Orbitrap
settings in MaxQuant were used with the parameter settings as follows: tryptic peptides with
up to 2 missed cleavages were allowed, MS mass error tolerance of 20 ppm, MS/MS mass error
tolerance of 0.5 Da, cysteine carbamidomethylation set as fixed modification and methionine
oxidation as a variable modification. Label-free quantification (LFQ) was performed with
minimum ratio count of 2 and matches between runs, and unidentified features were enabled.
LC-MS/MS runs were normalised according to the least overall proteome variation where the
majority of proteins remain unchanged between the sample runs. False discovery rate (FDR)
was set to 5% for both proteins and peptides. A minimum peptide length of 7 amino acids was
set.
33
2.4.8. PEAKS Studio X Analysis
The raw MS/MS data acquired on the Bruker mass spectrometer were analysed using
PEAKS Studio X software package (Bioinformatics Solutions Inc). The data was searched
against all Serpentes entries present in the Swiss-Prot database. The settings used were as
follows: tryptic peptides with up to 2 missed cleavages were allowed, parent mass error
tolerance of 30 ppm, fragment mass error tolerance of 0.6 Da, cysteine carbamidomethylation
set as fixed modification and methionine oxidation as a variable modification. PEAKS Q
algorithm was used for LFQ analysis: mass error tolerance was 20 ppm, and retention time
shift tolerance was 1.0 min. Statistical filters were further applied to the identified proteins:
significance threshold ≥15 (ie. P-value < 0.05), and fold change in protein expression ≥ 1.
34
~ Chapter 3 ~
Proteomic and Structural Investigation of Higher-order Protein
Assemblies in Pseudechis colletti, Naja melanoleuca and Bitis
arietans Venoms Using Mass Spectrometry
3.1. Introduction
3.1.1. Efforts to characterise snake venoms from sequence to structure
Understanding the protein composition of a snake’s venom and exploiting its potency
for therapeutic uses have been long-standing challenges since ancient times [21, 22]. As
mentioned in Chapter 1, increasing efforts over the past few decades have been undertaken
from various fields to characterise protein components of snake venoms; key developments
include functional studies to understand the activities of certain isolated proteins [5], structural
analysis by high resolution techniques [6, 45, 80, 81], and high-throughput venomic
characterisation of various snake venoms [11, 32, 82]. However, amidst these developments,
dynamic non-covalent protein assemblies remain comparatively underexplored despite the fact
that these interactions have been speculated to be critical in driving venom potency. It has been
postulated that protein oligomerisation may be an effective means to increase toxin
effectiveness and consequently lethality [66]. While certain studies that have celebrated
successful characterisation of some non-covalent complexes using NMR spectroscopy and x-
ray crystallography, there is still great difficulty in capturing these interactions in a high-
throughput manner, given the heterogeneous nature of many of these complexes and expansive
catalogue of venom proteins [6, 81, 83].
Native MS is a powerful technique that can be used to investigate these quaternary
structures owing to its capability towards interrogating heterogenous protein mixtures in a
comparatively more high-throughput manner than the aforementioned traditional techniques
[46, 51, 63, 65, 84]. Abundant examples of native MS capturing structures of a myriad of
biomolecular assemblies are available in the literature, which includes studies of the DNA
polymerase III complex [85] and viral capsids [86] to name a few. However, application of
native MS to snake venom proteins is still in its pioneering stages with only a few venom
proteins characterised so far, specifically non-covalent phospholipase A2 complexes in
Australian snake venoms. The pentameric Textilotoxin from the Australian Common Brown
35
snake Pseudonaja textilis, and the trimeric complexes Paradoxin from the Inland Taipan
Oxyuranus microlepidotus and Taipoxin from the Coastal Taipan Oxyuranus scutellatus are
prominent examples [66, 67]. Another critical aspect that has been a long-standing hurdle to
overcome in snake venom research is the sheer number of venomous species that require
characterisation, and furthermore, the complexity of each species’ venom. To establish a
comprehensive understanding of each species’ venom from primary sequence to higher-order
structure is a challenging feat, and one which presents an ultimate goal in terms of furthering
venom-derived therapeutics and applications.
3.1.2. Pseudechis colletti, Naja melanoleuca, and Bitis arietans venoms
Amongst the numerous species of snakes, here we aim to explore the venoms of three
geographically and phylogenetically variable species that are of medical significance: an
Australian elapid representative Collett’s snake (Pseudechis colletti), and two venoms exotic
to Australia from the African elapid forest cobra (Naja melanoleuca), and the African viperid
puff adder (Bitis arietans) (Figure 3.1).
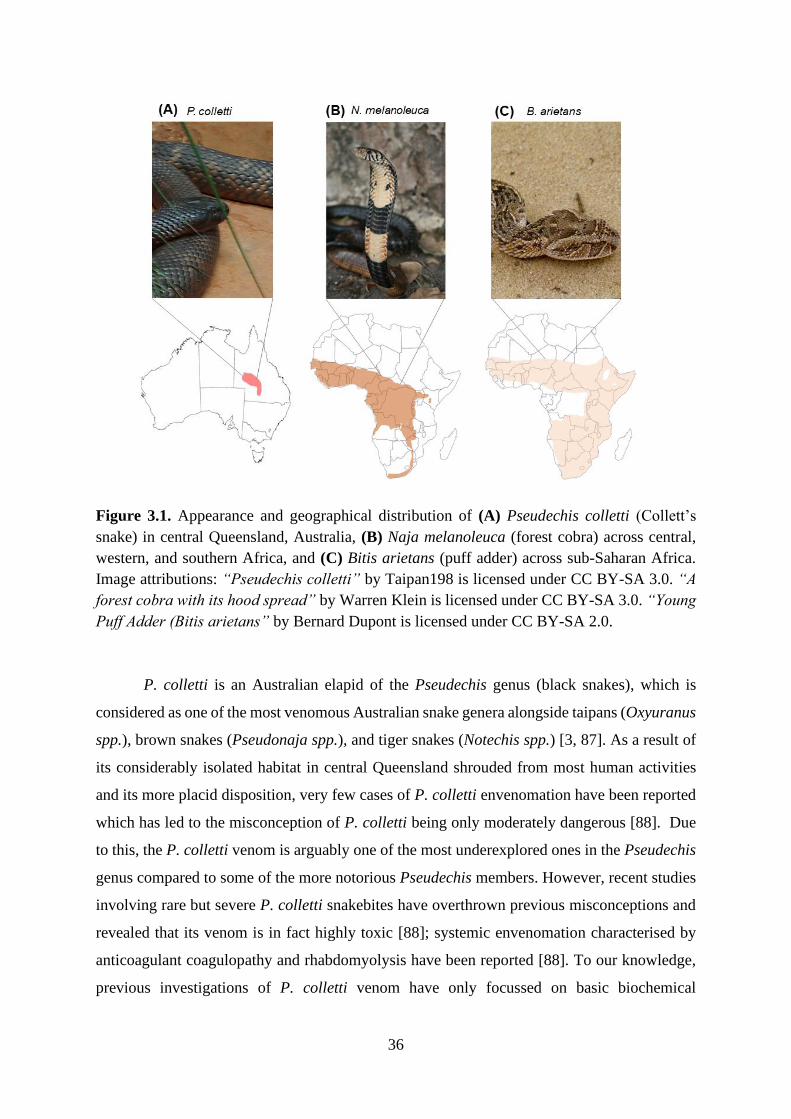
36
Figure 3.1. Appearance and geographical distribution of (A) Pseudechis colletti (Collett’s
snake) in central Queensland, Australia, (B) Naja melanoleuca (forest cobra) across central,
western, and southern Africa, and (C) Bitis arietans (puff adder) across sub-Saharan Africa.
Image attributions: “Pseudechis colletti” by Taipan198 is licensed under CC BY-SA 3.0. “A
forest cobra with its hood spread” by Warren Klein is licensed under CC BY-SA 3.0. “Young
Puff Adder (Bitis arietans” by Bernard Dupont is licensed under CC BY-SA 2.0.
P. colletti is an Australian elapid of the Pseudechis genus (black snakes), which is
considered as one of the most venomous Australian snake genera alongside taipans (Oxyuranus
spp.), brown snakes (Pseudonaja spp.), and tiger snakes (Notechis spp.) [3, 87]. As a result of
its considerably isolated habitat in central Queensland shrouded from most human activities
and its more placid disposition, very few cases of P. colletti envenomation have been reported
which has led to the misconception of P. colletti being only moderately dangerous [88]. Due
to this, the P. colletti venom is arguably one of the most underexplored ones in the Pseudechis
genus compared to some of the more notorious Pseudechis members. However, recent studies
involving rare but severe P. colletti snakebites have overthrown previous misconceptions and
revealed that its venom is in fact highly toxic [88]; systemic envenomation characterised by
anticoagulant coagulopathy and rhabdomyolysis have been reported [88]. To our knowledge,
previous investigations of P. colletti venom have only focussed on basic biochemical

37
characterisation of the most abundant or toxic protein components such as phospholipase A2
(PLA2), which form a major toxin family known to participate in various pathophysiological
effects that lead to many of the aforementioned symptoms [89]. While P. colletti’s rather
simple but PLA2-dominant venom has only been revealed in recent proteomic studies [90], any
dynamic protein structural interactions still remain largely unexplored.
N. melanoleuca is the largest species out of the African cobras, and is found to inhabit
a diverse range of habitats from river areas, forests to suburban regions in Central, Western,
and Southern Africa [91, 92]. The extensive diversity of N. melanoleuca’s habitat along with
its enormous venom yields and severe envenomation symptoms render N. melanoleuca as a
category 1 snake of highest medical significance as categorised by the World Health
Organisation [91]. Envenomation by N. melanoleuca is predominantly characterised by
neurotoxicity which results in progressive paralysis of respiratory muscles and leads to death;
this neurotoxicity has been attributed to the abundance of long and short neurotoxins known as
3 finger toxins (3FTx) and various PLA2 proteins in N. melanoleuca venom [91].
Native to widespread regions of sub-Saharan Africa, B. arietans has also been regarded
as an extremely venomous species belonging to the viperid family [93]. Notoriety of B. arietans
venom arises from its remarkably extensive habitat, inclination to bite and venom potency [93-
95]; B. arietans envenomation is known to be responsible for the majority of snakebite fatalities
in Africa, with coagulopathy and tissue necrosis observed upon envenomation resulting in
morbidity and eventually death [93]. Much of envenomation severity is due to the abundance
of both enzymatic and non-enzymatic toxins. These include snake venom metalloproteinase
(SVMP) and serine proteases (SVSP) that target tissues and toxins such as disintegrins (DIS)
that disrupt haemostasis [93]. The pathophysiological effects described are starkly different to
the two elapids P. colletti and N. melanoleuca but are commonly observed in many viper
envenomation.
The severity and frequency of N. melanoleuca and B. arietans envenomation have
spurred on research efforts to catalogue the entire venom proteomes [91, 94, 96], characterise
activities of individual venom proteins by biochemical and immunological analyses, and
slowly accumulate three-dimensional structures corresponding to a few of these proteins in a
growing protein structure database [45, 91, 94].
38
Despite these efforts to characterise venoms, however, as aforementioned a distinct
knowledge gap in our understanding of the various higher-order, non-covalent interactions
between protein constituents that elicit such severe pathophysiological effects remains. From
a therapeutic perspective, understanding the protein composition of snake venom and how
proteins therein interact to elicit toxicity are critical steps towards improving treatment as well
as the long-standing goal of utilising venoms for therapeutics. In this chapter, the venoms of P.
colletti, N. melanoleuca, and B. arietans were explored for critical quaternary, non-covalent
protein complexes that may be involved in driving venom toxicity, using an integrated MS
based approach of shotgun proteomics and native MS.
3.2. Results and discussion
3.2.1. Separation of P. colletti, N. melanoleuca, and B. arietans whole venoms by size
exclusion chromatography
Fractionation of crude whole venom from P. colletti, N. melanoleuca, and B. arietans
by size-exclusion chromatography (SEC) was performed in order to obtain a broad view of the
respective venom complexities (Figure 3.2). The proteins were eluted in ammonium acetate
buffer which is known to maintain the proteins and any potential non-covalent complexes in
their physiologically relevant state and is compatible with downstream native MS analysis [48,
51].
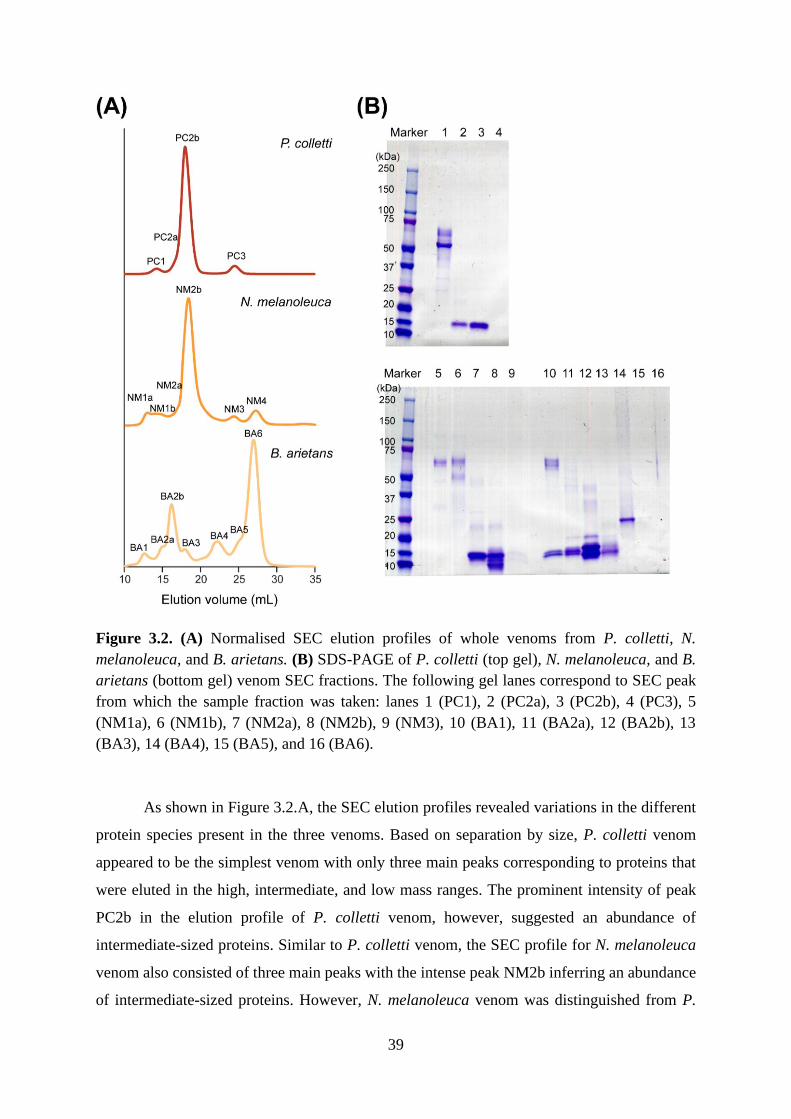
39
Figure 3.2. (A) Normalised SEC elution profiles of whole venoms from P. colletti, N.
melanoleuca, and B. arietans. (B) SDS-PAGE of P. colletti (top gel), N. melanoleuca, and B.
arietans (bottom gel) venom SEC fractions. The following gel lanes correspond to SEC peak
from which the sample fraction was taken: lanes 1 (PC1), 2 (PC2a), 3 (PC2b), 4 (PC3), 5
(NM1a), 6 (NM1b), 7 (NM2a), 8 (NM2b), 9 (NM3), 10 (BA1), 11 (BA2a), 12 (BA2b), 13
(BA3), 14 (BA4), 15 (BA5), and 16 (BA6).
As shown in Figure 3.2.A, the SEC elution profiles revealed variations in the different
protein species present in the three venoms. Based on separation by size, P. colletti venom
appeared to be the simplest venom with only three main peaks corresponding to proteins that
were eluted in the high, intermediate, and low mass ranges. The prominent intensity of peak
PC2b in the elution profile of P. colletti venom, however, suggested an abundance of
intermediate-sized proteins. Similar to P. colletti venom, the SEC profile for N. melanoleuca
venom also consisted of three main peaks with the intense peak NM2b inferring an abundance
of intermediate-sized proteins. However, N. melanoleuca venom was distinguished from P.
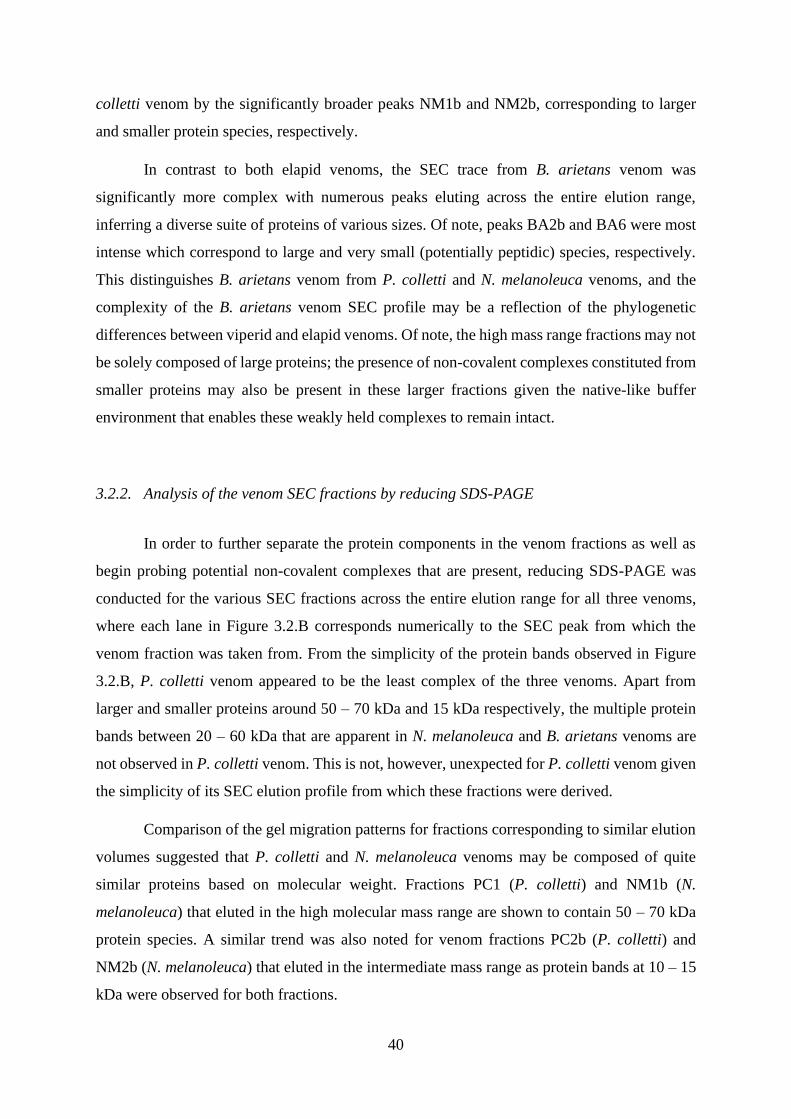
40
colletti venom by the significantly broader peaks NM1b and NM2b, corresponding to larger
and smaller protein species, respectively.
In contrast to both elapid venoms, the SEC trace from B. arietans venom was
significantly more complex with numerous peaks eluting across the entire elution range,
inferring a diverse suite of proteins of various sizes. Of note, peaks BA2b and BA6 were most
intense which correspond to large and very small (potentially peptidic) species, respectively.
This distinguishes B. arietans venom from P. colletti and N. melanoleuca venoms, and the
complexity of the B. arietans venom SEC profile may be a reflection of the phylogenetic
differences between viperid and elapid venoms. Of note, the high mass range fractions may not
be solely composed of large proteins; the presence of non-covalent complexes constituted from
smaller proteins may also be present in these larger fractions given the native-like buffer
environment that enables these weakly held complexes to remain intact.
3.2.2. Analysis of the venom SEC fractions by reducing SDS-PAGE
In order to further separate the protein components in the venom fractions as well as
begin probing potential non-covalent complexes that are present, reducing SDS-PAGE was
conducted for the various SEC fractions across the entire elution range for all three venoms,
where each lane in Figure 3.2.B corresponds numerically to the SEC peak from which the
venom fraction was taken from. From the simplicity of the protein bands observed in Figure
3.2.B, P. colletti venom appeared to be the least complex of the three venoms. Apart from
larger and smaller proteins around 50 – 70 kDa and 15 kDa respectively, the multiple protein
bands between 20 – 60 kDa that are apparent in N. melanoleuca and B. arietans venoms are
not observed in P. colletti venom. This is not, however, unexpected for P. colletti venom given
the simplicity of its SEC elution profile from which these fractions were derived.
Comparison of the gel migration patterns for fractions corresponding to similar elution
volumes suggested that P. colletti and N. melanoleuca venoms may be composed of quite
similar proteins based on molecular weight. Fractions PC1 (P. colletti) and NM1b (N.
melanoleuca) that eluted in the high molecular mass range are shown to contain 50 – 70 kDa
protein species. A similar trend was also noted for venom fractions PC2b (P. colletti) and
NM2b (N. melanoleuca) that eluted in the intermediate mass range as protein bands at 10 – 15
kDa were observed for both fractions.
41
While the two elapid venoms appear to have similar protein compositions in general by
molecular mass, the SDS-PAGE results for B. arietans venom fractions were comparatively
distinct. High mass range fractions such as fractions BA1 and BA2a were found to be
composed of smaller protein species around 15 kDa which is interesting. Non-covalent protein
complexes that were maintained in a native-like state during separation by SEC would be
disrupted by the reducing conditions of the SDS-PAGE analysis, affording protein bands that
correspond to monomeric masses. Thus, identification of small proteins in a high mass range
fraction as observed in B. arietans venom fractions BA1 and BA2a suggested the presence of
potential non-covalent complexes.
Notably, mass shifts in certain protein bands were observed which may be due to post
translational modifications (PTMs). A key example is the B. arietans venom fraction BA4
where the protein at 25 kDa is considerably higher than what is anticipated for a low molecular
weight range fraction. The mass shift may be indicative of PTMs which are likely to be
glycosylation, a modification known to be common for certain snake venom proteins [66]. As
the focus of this study was primarily on non-covalent protein complexes, only the higher and
intermediate mass range venom fractions were considered for further analysis; fractions beyond
25 mL which correspond to peptidic species were not included.
3.2.3. Shotgun proteomics of the three whole venoms
While distinctions between the three venoms were observed through simple
fractionation analyses, gaining insight on the venom diversities at a proteomic level is essential.
To first catalogue the proteomic composition of the three snake venoms of interest, whole
venoms of P. colletti, N. melanoleuca, and B. arietans were digested with trypsin and analysed
by LC-MS/MS in a shotgun bottom-up workflow. Proteins were identified by database
searching using the protein identification search engine Mascot (Matrixscience) with Chordata
applied as the taxonomy filter. The significance threshold was set as P-value < 0.05 and false
positives, contaminants, and proteins that did not possess a toxic function were eliminated from
further analysis as only toxin families are of interest in this study (Appendix B). Relative
abundance of the different toxin groups within a whole venom mixture was determined from
the Exponentially Modified Protein Abundance Index (emPAI) scores generated by Mascot,
which is a label-free quantitative estimation for relative protein abundance within the sample
based on spectral counting [77, 97]. The sum of the emPAI scores for protein hits from the
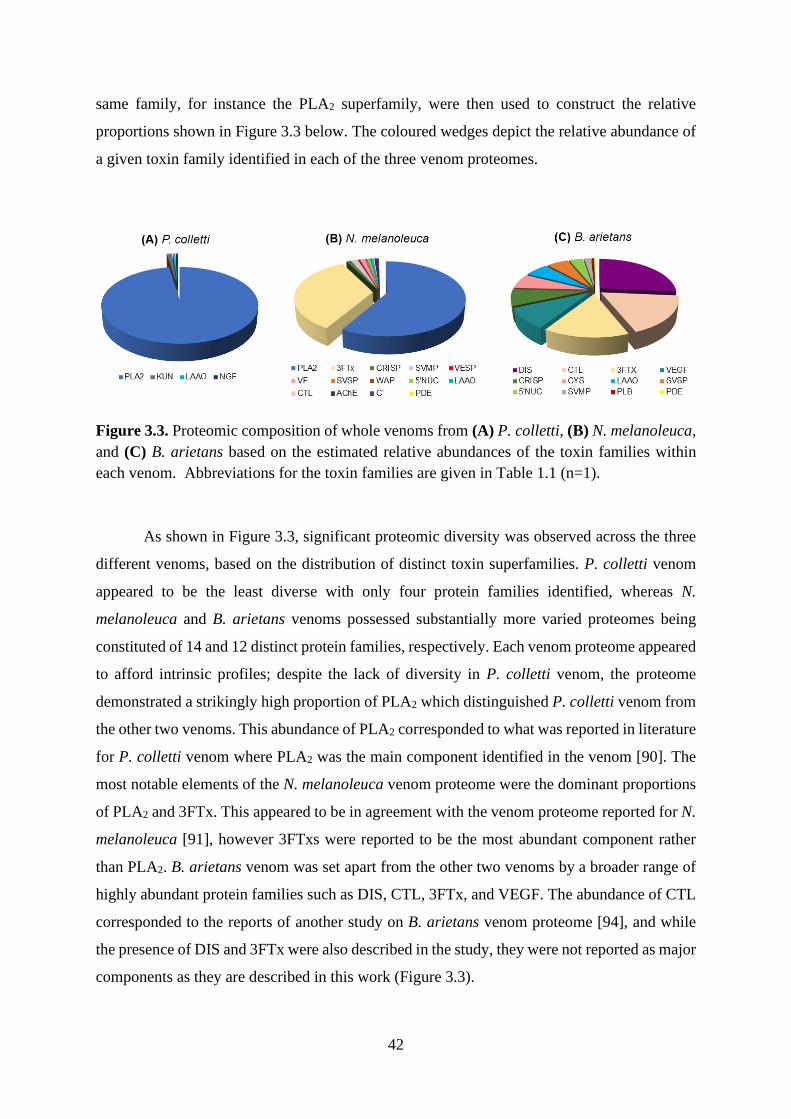
42
same family, for instance the PLA2 superfamily, were then used to construct the relative
proportions shown in Figure 3.3 below. The coloured wedges depict the relative abundance of
a given toxin family identified in each of the three venom proteomes.
Figure 3.3. Proteomic composition of whole venoms from (A) P. colletti, (B) N. melanoleuca,
and (C) B. arietans based on the estimated relative abundances of the toxin families within
each venom. Abbreviations for the toxin families are given in Table 1.1 (n=1).
As shown in Figure 3.3, significant proteomic diversity was observed across the three
different venoms, based on the distribution of distinct toxin superfamilies. P. colletti venom
appeared to be the least diverse with only four protein families identified, whereas N.
melanoleuca and B. arietans venoms possessed substantially more varied proteomes being
constituted of 14 and 12 distinct protein families, respectively. Each venom proteome appeared
to afford intrinsic profiles; despite the lack of diversity in P. colletti venom, the proteome
demonstrated a strikingly high proportion of PLA2 which distinguished P. colletti venom from
the other two venoms. This abundance of PLA2 corresponded to what was reported in literature
for P. colletti venom where PLA2 was the main component identified in the venom [90]. The
most notable elements of the N. melanoleuca venom proteome were the dominant proportions
of PLA2 and 3FTx. This appeared to be in agreement with the venom proteome reported for N.
melanoleuca [91], however 3FTxs were reported to be the most abundant component rather
than PLA2. B. arietans venom was set apart from the other two venoms by a broader range of
highly abundant protein families such as DIS, CTL, 3FTx, and VEGF. The abundance of CTL
corresponded to the reports of another study on B. arietans venom proteome [94], and while
the presence of DIS and 3FTx were also described in the study, they were not reported as major
components as they are described in this work (Figure 3.3).
43
These variations in the relative abundance of different protein groups may be attributed
to intraspecies venom variation, but the overall proteomic profiles of these venoms are in
agreement with what is known in literature [90, 91, 94].
Distinctions between the two elapid venoms and the viperid venom were also apparent.
The predominance of smaller enzymes such as PLA2 and the presence of 3FTx in both P.
colletti and N. melanoleuca venom proteomes are in line with what is known for elapid venoms
which is generally a higher abundance of PLA2 and 3FTx [90, 91]. PLA2 is known to participate
in a myriad of pathways that elicit pre- and post-synaptic neurotoxicity, cardiotoxicity,
myotoxicity, and anti- and pro-coagulation to name a few [47, 98] while 3FTx predominantly
acts to elicit neurotoxicity and cardiotoxicity in the case of cobra venoms [99]. The tremendous
abundance of PLA2 in P. colletti venom appeared to be in good agreement with what is
symptomatically known for its envenomation [88]. Similarly, the high composition of PLA2
and 3FTx in N. melanoleuca venom may be attributed to the severe symptoms of paralysis
reported for envenomation by this species.
As the viperid venom in the study, B. arietans venom proteome was distinct compared
to the other two elapid venoms as shown in Figure 3.3.C, being rich in DIS, CTL, 3FTx, and
VEGF. These proteins are known to participate in disrupting haemostasis and preventing
platelet aggregation, resulting in envenomation symptoms such as strong haemorrhage, which
is quite characteristic of viperid envenomation [45, 93]. The relatively strong presence of 3FTx
is interesting as previous studies on B. arietans venom have not observed this, but rather higher
abundance of SVMPs and SVSPs [93, 100].
It is also noteworthy that while proteomic studies have been performed for these
venoms in the past [90, 91, 94], to our knowledge the feasibility of a high throughput approach
by shotgun proteomics is reported here for the first time for these venoms. As noted perhaps
more prominently for the B. arietans venom, intrinsic variations in the venom proteomes tend
to occur, thus, being able to apply shotgun proteomics as a tool to accurately help characterise
the identities of the proteins of interest for higher-order structural study is a critical step in this
workflow.
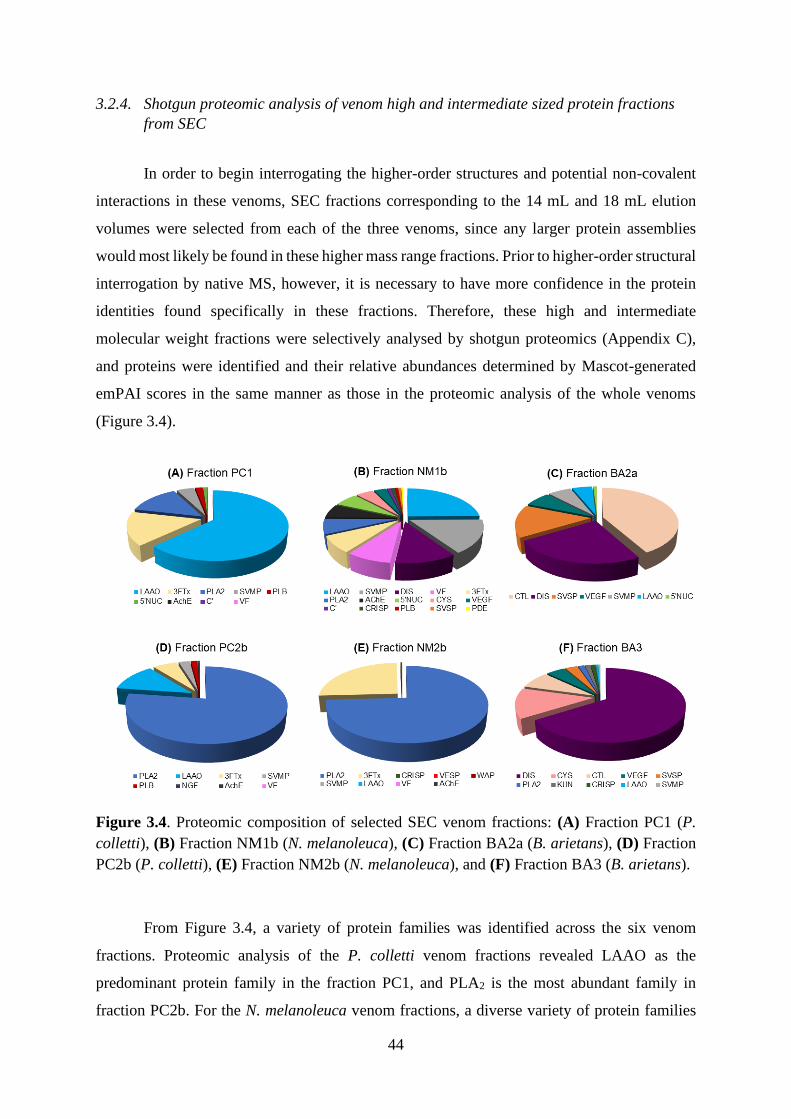
44
3.2.4. Shotgun proteomic analysis of venom high and intermediate sized protein fractions
from SEC
In order to begin interrogating the higher-order structures and potential non-covalent
interactions in these venoms, SEC fractions corresponding to the 14 mL and 18 mL elution
volumes were selected from each of the three venoms, since any larger protein assemblies
would most likely be found in these higher mass range fractions. Prior to higher-order structural
interrogation by native MS, however, it is necessary to have more confidence in the protein
identities found specifically in these fractions. Therefore, these high and intermediate
molecular weight fractions were selectively analysed by shotgun proteomics (Appendix C),
and proteins were identified and their relative abundances determined by Mascot-generated
emPAI scores in the same manner as those in the proteomic analysis of the whole venoms
(Figure 3.4).
Figure 3.4. Proteomic composition of selected SEC venom fractions: (A) Fraction PC1 (P.
colletti), (B) Fraction NM1b (N. melanoleuca), (C) Fraction BA2a (B. arietans), (D) Fraction
PC2b (P. colletti), (E) Fraction NM2b (N. melanoleuca), and (F) Fraction BA3 (B. arietans).
From Figure 3.4, a variety of protein families was identified across the six venom
fractions. Proteomic analysis of the P. colletti venom fractions revealed LAAO as the
predominant protein family in the fraction PC1, and PLA2 is the most abundant family in
fraction PC2b. For the N. melanoleuca venom fractions, a diverse variety of protein families
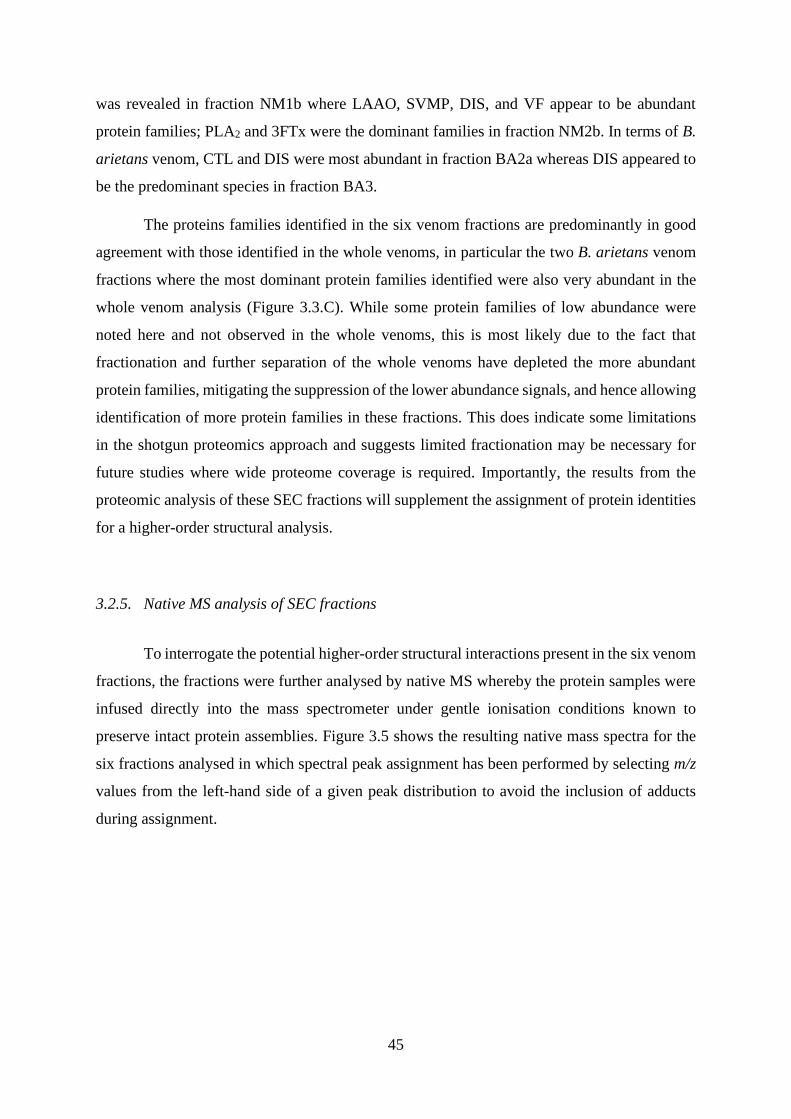
45
was revealed in fraction NM1b where LAAO, SVMP, DIS, and VF appear to be abundant
protein families; PLA2 and 3FTx were the dominant families in fraction NM2b. In terms of B.
arietans venom, CTL and DIS were most abundant in fraction BA2a whereas DIS appeared to
be the predominant species in fraction BA3.
The proteins families identified in the six venom fractions are predominantly in good
agreement with those identified in the whole venoms, in particular the two B. arietans venom
fractions where the most dominant protein families identified were also very abundant in the
whole venom analysis (Figure 3.3.C). While some protein families of low abundance were
noted here and not observed in the whole venoms, this is most likely due to the fact that
fractionation and further separation of the whole venoms have depleted the more abundant
protein families, mitigating the suppression of the lower abundance signals, and hence allowing
identification of more protein families in these fractions. This does indicate some limitations
in the shotgun proteomics approach and suggests limited fractionation may be necessary for
future studies where wide proteome coverage is required. Importantly, the results from the
proteomic analysis of these SEC fractions will supplement the assignment of protein identities
for a higher-order structural analysis.
3.2.5. Native MS analysis of SEC fractions
To interrogate the potential higher-order structural interactions present in the six venom
fractions, the fractions were further analysed by native MS whereby the protein samples were
infused directly into the mass spectrometer under gentle ionisation conditions known to
preserve intact protein assemblies. Figure 3.5 shows the resulting native mass spectra for the
six fractions analysed in which spectral peak assignment has been performed by selecting m/z
values from the left-hand side of a given peak distribution to avoid the inclusion of adducts
during assignment.
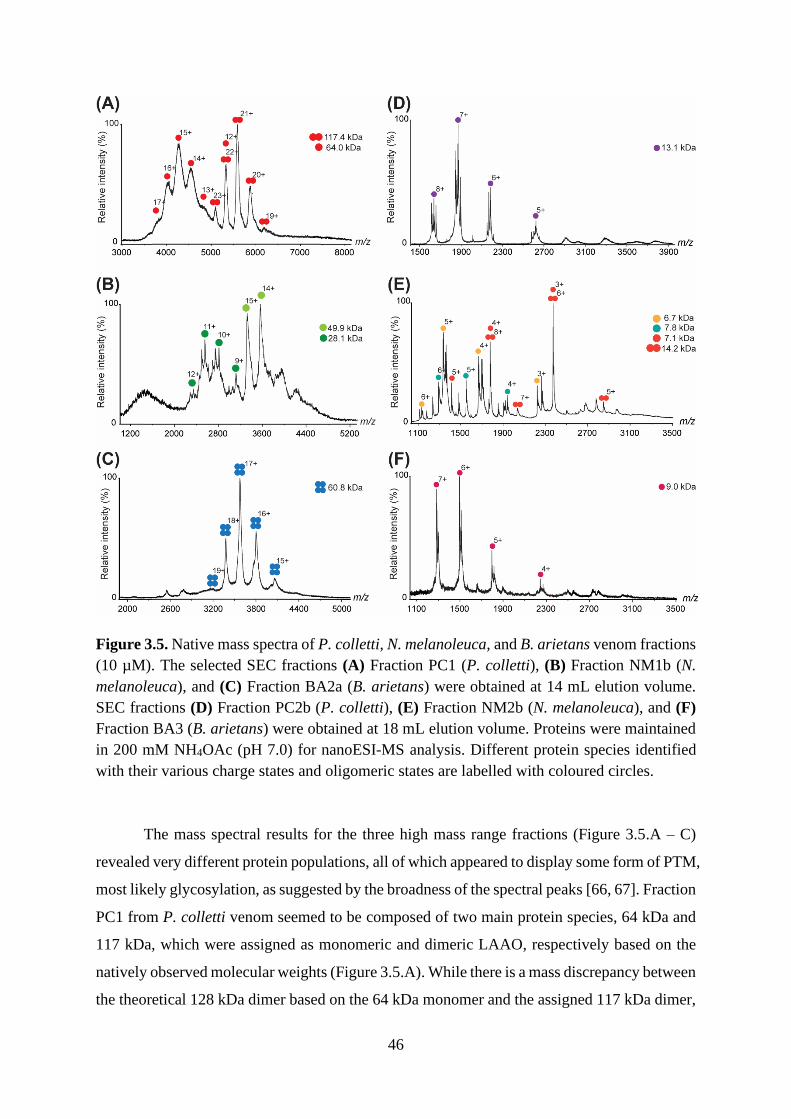
46
Figure 3.5. Native mass spectra of P. colletti, N. melanoleuca, and B. arietans venom fractions
(10 µM). The selected SEC fractions (A) Fraction PC1 (P. colletti), (B) Fraction NM1b (N.
melanoleuca), and (C) Fraction BA2a (B. arietans) were obtained at 14 mL elution volume.
SEC fractions (D) Fraction PC2b (P. colletti), (E) Fraction NM2b (N. melanoleuca), and (F)
Fraction BA3 (B. arietans) were obtained at 18 mL elution volume. Proteins were maintained
in 200 mM NH4OAc (pH 7.0) for nanoESI-MS analysis. Different protein species identified
with their various charge states and oligomeric states are labelled with coloured circles.
The mass spectral results for the three high mass range fractions (Figure 3.5.A – C)
revealed very different protein populations, all of which appeared to display some form of PTM,
most likely glycosylation, as suggested by the broadness of the spectral peaks [66, 67]. Fraction
PC1 from P. colletti venom seemed to be composed of two main protein species, 64 kDa and
117 kDa, which were assigned as monomeric and dimeric LAAO, respectively based on the
natively observed molecular weights (Figure 3.5.A). While there is a mass discrepancy between
the theoretical 128 kDa dimer based on the 64 kDa monomer and the assigned 117 kDa dimer,
47
this discrepancy is most likely due to the broadness and lower resolution of the spectral peaks
limiting accurate peak assignment. Nonetheless, these species can be confirmed to be
monomeric and dimer LAAOs given the additional information supplemented by the lack of a
protein band corresponding to 117 kDa in the SDS-PAGE analysis (Figure 3.1.B), and the
predominance of LAAO identified in this fraction by shotgun proteomics (Figure 3.4.A).
Further investigation of the interaction between the dimer will be discussed in Section 3.2.6.
Protein species at 28.1 kDa and 49.9 kDa were identified in fraction NM1b from N.
melanoleuca venom (Figure 3.5.B), which are rather different to what was observed in P.
colletti venom at the same elution volume, despite the similar SDS-PAGE results noted earlier
between the two venoms. While these protein species could correspond to CRISPs, SVSPs,
and LAAOs to name a few, based on molecular weight correlation to the proteomic analysis of
the fraction (Figure 3.4.B), the complexity and limited resolution of the native mass spectrum
implies that confident assignment of protein identities is difficult at this stage and further
separation of this fraction will be required.
A 60 kDa protein species was observed in the B. arietans venom fraction BA2a (Figure
3.5.C). This is interesting as the SDS-PAGE results showed a single 15 kDa protein band
(Figure 3.1.B). Based on this information and the corresponding proteomic analysis (Figure
3.4.C), this 60 kDa protein species is most likely a tetramer of 15 kDa monomeric CTL.
Moreover, CTLs are found abundantly in B. arietans venom as shown in the proteomic analysis
as well as in literature and are known to be capable of oligomerisation [6, 100, 101]. Again,
the higher-order interactions of this assigned tetramer will be further explored in Section 3.2.6.
Native MS analysis of the venom fractions that eluted in the intermediate mass range
showed that the proteins being identified in all three venoms were largely monomeric (Figure
3.5.D – F), which is in agreement with the previous SDS-PAGE results that showed protein
bands corresponding to 15 kDa or lower (Figure 3.1.B). The native mass spectrum of the P.
colletti venom fraction PC2b showed a predominant protein species at 13.1 kDa (Figure 3.5.D),
correlating well to a PLA2 enzyme based on the proteomic analysis of the fraction (Figure
3.4.D). In Figure 3.5.E, the native mass spectrum of the N. melanoleuca venom fraction NM2b
was substantially more complex, showing a variety of small protein species ranging from 6.7
– 7.8 kDa, which the proteomic analysis of the fraction suggested to be 3FTxs (Figure 3.4.E).
Interestingly, a 14.2 kDa species was also noted in this N. melanoleuca venom fraction which
could correspond to a dimeric 3FTx; covalent dimers have been reported in the past from other
48
cobra venoms such as Naja kaouthia [6, 102]. Alternatively, this protein species may also be a
PLA2; both 3FTx and PLA2 are reported to be abundant in the complementary proteomic
analysis (Figure 3.4.E). The predominant 9.0 kDa protein species identified in the B. arietans
venom fraction BA3 (Figure 3.5.F) corresponded to monomeric DIS which is in line with the
proteomic results for this fraction where DIS was the most abundant constituent (Figure 3.4.F).
Importantly, while the native MS spectra appeared simpler in terms of the number of
protein species observed in comparison to the various protein constituents identified in the
proteomic analysis of the corresponding venom fractions, it should be noted that the various
protein assignments in the native MS analysis highlights only the most prominent protein
species observed. Signal suppression of lower abundant protein ions may be contributing to the
absence of certain protein families that were noted in the proteomic analyses. In addition, the
intrinsic ionisation efficiency of different proteins is also a considerable factor determining
which proteins ions can be observed.
It should be reiterated that the purpose of this study is a preliminary overview of the
higher-order structures by native MS of venom fractions that have only undergone one
dimension of protein separation. At this point, it can be said that the study would benefit from
further purification of certain fractions to reduce the protein complexity and reveal new protein
complexes, but due to time constraints, such endeavours for a more rigorous structural
interrogation will be considered in future investigations. In addition, top-down protein
sequencing will be another useful approach to confirm the identities of proteins in the
aforementioned complexes.
3.2.3. Denatured MS analysis offers insight into the nature of higher-order protein structures
Having identified protein assemblies in the high molecular weight venom fractions,
denatured MS analysis was performed for the three venom fractions in order to further probe
the nature of the interactions between the protein subunits (Figure 3.6).
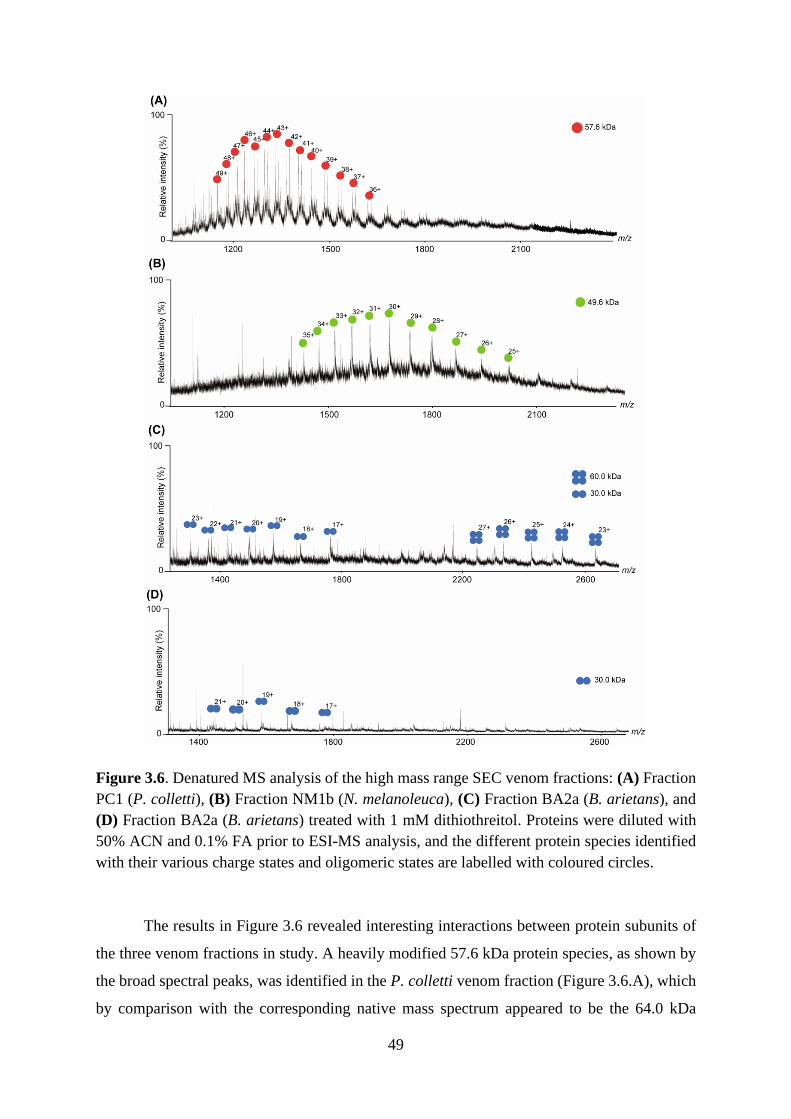
49
Figure 3.6. Denatured MS analysis of the high mass range SEC venom fractions: (A) Fraction
PC1 (P. colletti), (B) Fraction NM1b (N. melanoleuca), (C) Fraction BA2a (B. arietans), and
(D) Fraction BA2a (B. arietans) treated with 1 mM dithiothreitol. Proteins were diluted with
50% ACN and 0.1% FA prior to ESI-MS analysis, and the different protein species identified
with their various charge states and oligomeric states are labelled with coloured circles.
The results in Figure 3.6 revealed interesting interactions between protein subunits of
the three venom fractions in study. A heavily modified 57.6 kDa protein species, as shown by
the broad spectral peaks, was identified in the P. colletti venom fraction (Figure 3.6.A), which
by comparison with the corresponding native mass spectrum appeared to be the 64.0 kDa
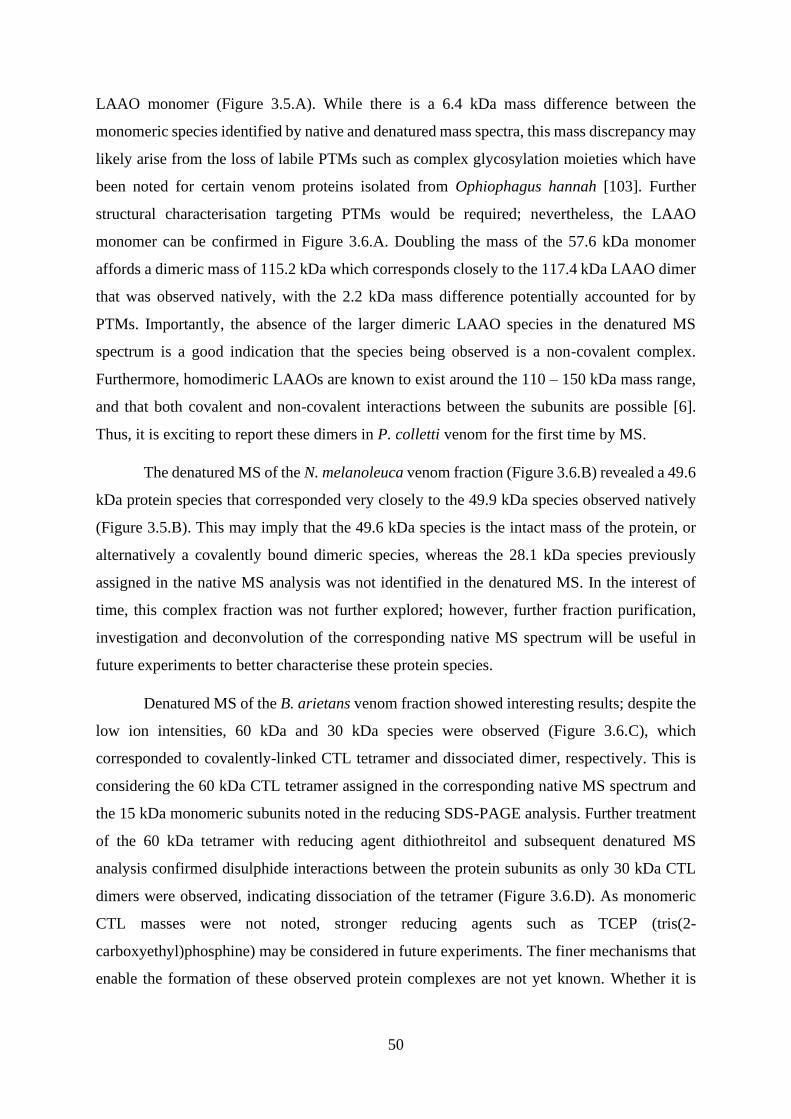
50
LAAO monomer (Figure 3.5.A). While there is a 6.4 kDa mass difference between the
monomeric species identified by native and denatured mass spectra, this mass discrepancy may
likely arise from the loss of labile PTMs such as complex glycosylation moieties which have
been noted for certain venom proteins isolated from Ophiophagus hannah [103]. Further
structural characterisation targeting PTMs would be required; nevertheless, the LAAO
monomer can be confirmed in Figure 3.6.A. Doubling the mass of the 57.6 kDa monomer
affords a dimeric mass of 115.2 kDa which corresponds closely to the 117.4 kDa LAAO dimer
that was observed natively, with the 2.2 kDa mass difference potentially accounted for by
PTMs. Importantly, the absence of the larger dimeric LAAO species in the denatured MS
spectrum is a good indication that the species being observed is a non-covalent complex.
Furthermore, homodimeric LAAOs are known to exist around the 110 – 150 kDa mass range,
and that both covalent and non-covalent interactions between the subunits are possible [6].
Thus, it is exciting to report these dimers in P. colletti venom for the first time by MS.
The denatured MS of the N. melanoleuca venom fraction (Figure 3.6.B) revealed a 49.6
kDa protein species that corresponded very closely to the 49.9 kDa species observed natively
(Figure 3.5.B). This may imply that the 49.6 kDa species is the intact mass of the protein, or
alternatively a covalently bound dimeric species, whereas the 28.1 kDa species previously
assigned in the native MS analysis was not identified in the denatured MS. In the interest of
time, this complex fraction was not further explored; however, further fraction purification,
investigation and deconvolution of the corresponding native MS spectrum will be useful in
future experiments to better characterise these protein species.
Denatured MS of the B. arietans venom fraction showed interesting results; despite the
low ion intensities, 60 kDa and 30 kDa species were observed (Figure 3.6.C), which
corresponded to covalently-linked CTL tetramer and dissociated dimer, respectively. This is
considering the 60 kDa CTL tetramer assigned in the corresponding native MS spectrum and
the 15 kDa monomeric subunits noted in the reducing SDS-PAGE analysis. Further treatment
of the 60 kDa tetramer with reducing agent dithiothreitol and subsequent denatured MS
analysis confirmed disulphide interactions between the protein subunits as only 30 kDa CTL
dimers were observed, indicating dissociation of the tetramer (Figure 3.6.D). As monomeric
CTL masses were not noted, stronger reducing agents such as TCEP (tris(2-
carboxyethyl)phosphine) may be considered in future experiments. The finer mechanisms that
enable the formation of these observed protein complexes are not yet known. Whether it is
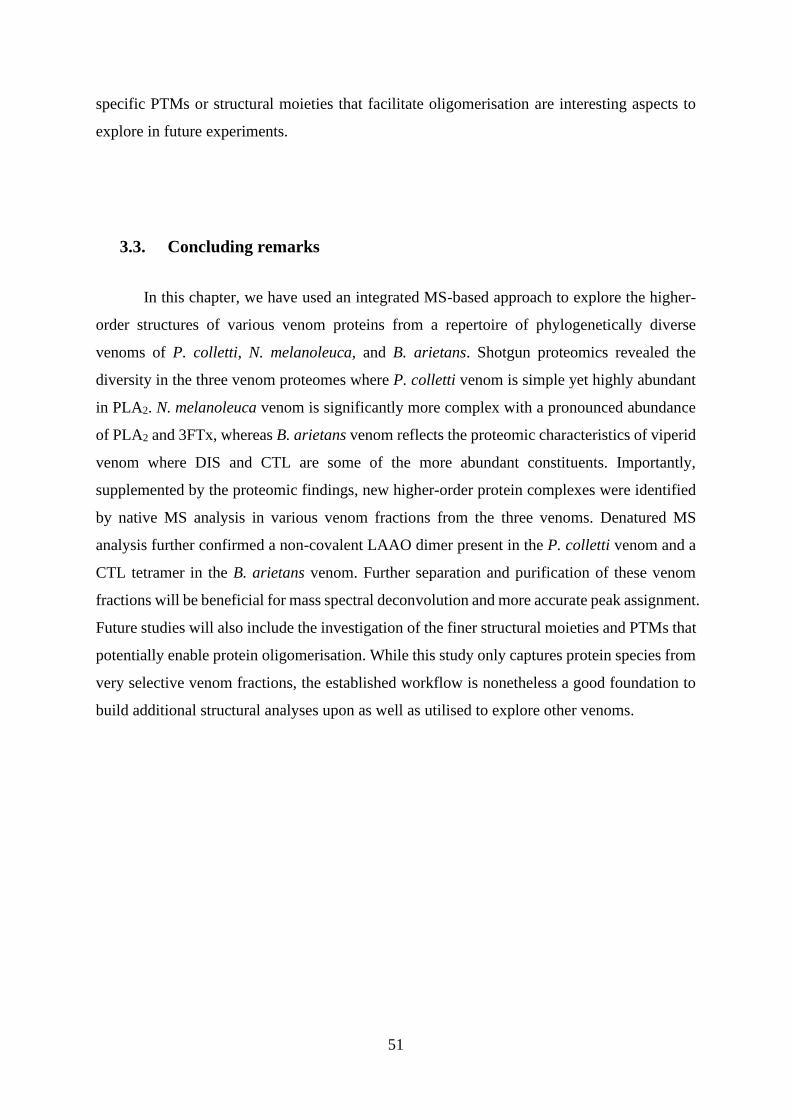
51
specific PTMs or structural moieties that facilitate oligomerisation are interesting aspects to
explore in future experiments.
3.3. Concluding remarks
In this chapter, we have used an integrated MS-based approach to explore the higher-
order structures of various venom proteins from a repertoire of phylogenetically diverse
venoms of P. colletti, N. melanoleuca, and B. arietans. Shotgun proteomics revealed the
diversity in the three venom proteomes where P. colletti venom is simple yet highly abundant
in PLA2. N. melanoleuca venom is significantly more complex with a pronounced abundance
of PLA2 and 3FTx, whereas B. arietans venom reflects the proteomic characteristics of viperid
venom where DIS and CTL are some of the more abundant constituents. Importantly,
supplemented by the proteomic findings, new higher-order protein complexes were identified
by native MS analysis in various venom fractions from the three venoms. Denatured MS
analysis further confirmed a non-covalent LAAO dimer present in the P. colletti venom and a
CTL tetramer in the B. arietans venom. Further separation and purification of these venom
fractions will be beneficial for mass spectral deconvolution and more accurate peak assignment.
Future studies will also include the investigation of the finer structural moieties and PTMs that
potentially enable protein oligomerisation. While this study only captures protein species from
very selective venom fractions, the established workflow is nonetheless a good foundation to
build additional structural analyses upon as well as utilised to explore other venoms.
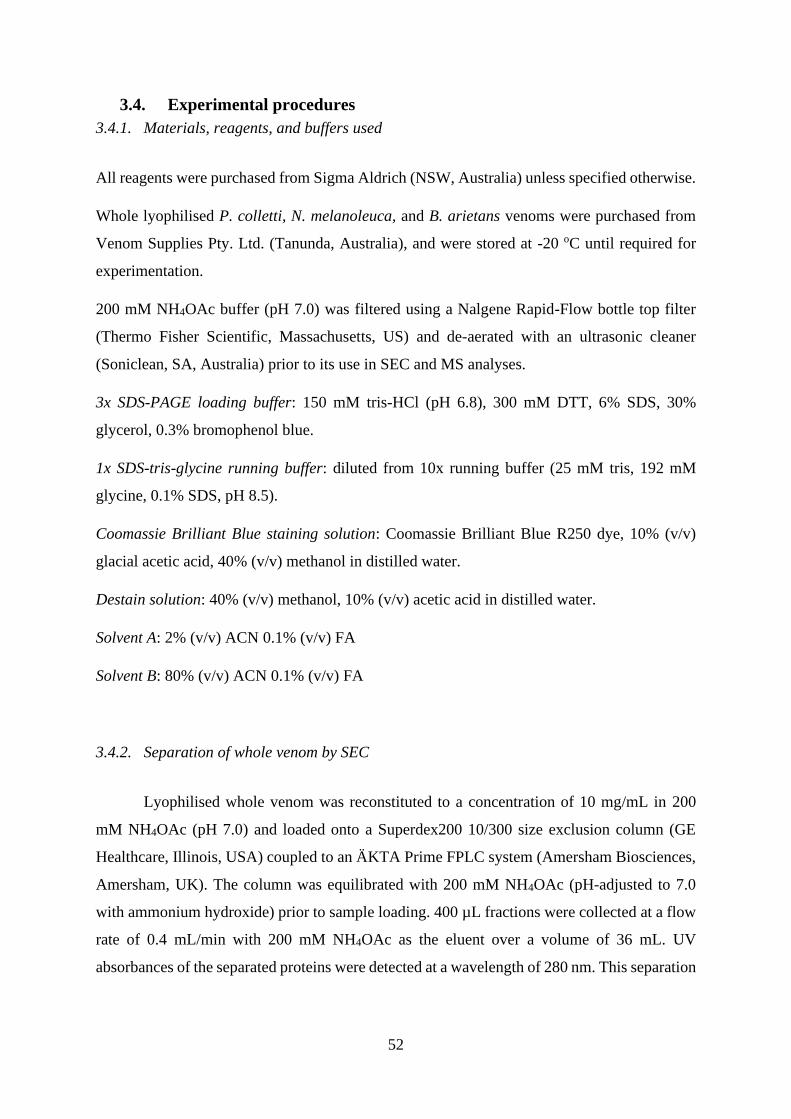
52
3.4. Experimental procedures
3.4.1. Materials, reagents, and buffers used
All reagents were purchased from Sigma Aldrich (NSW, Australia) unless specified otherwise.
Whole lyophilised P. colletti, N. melanoleuca, and B. arietans venoms were purchased from
Venom Supplies Pty. Ltd. (Tanunda, Australia), and were stored at -20 oC until required for
experimentation.
200 mM NH4OAc buffer (pH 7.0) was filtered using a Nalgene Rapid-Flow bottle top filter
(Thermo Fisher Scientific, Massachusetts, US) and de-aerated with an ultrasonic cleaner
(Soniclean, SA, Australia) prior to its use in SEC and MS analyses.
3x SDS-PAGE loading buffer: 150 mM tris-HCl (pH 6.8), 300 mM DTT, 6% SDS, 30%
glycerol, 0.3% bromophenol blue.
1x SDS-tris-glycine running buffer: diluted from 10x running buffer (25 mM tris, 192 mM
glycine, 0.1% SDS, pH 8.5).
Coomassie Brilliant Blue staining solution: Coomassie Brilliant Blue R250 dye, 10% (v/v)
glacial acetic acid, 40% (v/v) methanol in distilled water.
Destain solution: 40% (v/v) methanol, 10% (v/v) acetic acid in distilled water.
Solvent A: 2% (v/v) ACN 0.1% (v/v) FA
Solvent B: 80% (v/v) ACN 0.1% (v/v) FA
3.4.2. Separation of whole venom by SEC
Lyophilised whole venom was reconstituted to a concentration of 10 mg/mL in 200
mM NH4OAc (pH 7.0) and loaded onto a Superdex200 10/300 size exclusion column (GE
Healthcare, Illinois, USA) coupled to an ÄKTA Prime FPLC system (Amersham Biosciences,
Amersham, UK). The column was equilibrated with 200 mM NH4OAc (pH-adjusted to 7.0
with ammonium hydroxide) prior to sample loading. 400 µL fractions were collected at a flow
rate of 0.4 mL/min with 200 mM NH4OAc as the eluent over a volume of 36 mL. UV
absorbances of the separated proteins were detected at a wavelength of 280 nm. This separation
53
process was performed for P. colletti, N. melanoleuca, and B. arietans whole venoms. Fractions
were then stored at -20oC until required for further analysis.
3.4.3. 1D SDS-PAGE analysis
The venom fractions of interest were added to 3x reducing sample buffer in a 1:1 (v/v)
ratio and denatured at 95 oC for 15 min. The samples were then loaded onto 4 – 15% Mini-
Protean TGX tris-HCl polyacrylamide gels (Bio-Rad, California, US). Protein separation by
molecular weight was performed by gel electrophoresis at 140 V and 400 mA for 1 h, using 1x
SDS tris-glycine running buffer. Precision Plus Protein dual colour standards (Bio-Rad,
California, US) were used as molecular weight markers. The gels were then developed with
Coomassie Brilliant blue staining solution for 30 min, and destained with destaining solution
for 3 h before being imaged using an Imagescanner densitometer (Amersham Biosciences,
Amersham, UK).
3.4.4. Filter-aided, in-solution tryptic digestion
Venoms were digested using an in-solution, filter-aided tryptic digest protocol in
Amicon Ultra-0.5mL centrifugal filter units (MerckMillipore, Darmstadt, Germany) with a 10
kDa molecular weight cut-off. Venom (approximately 0.1 mg) in 200 μL of 7 M urea/100 mM
NH4HCO3 was incubated with 50 mM DTT for 1 h at room temperature, and further incubated
with 55 mM IAA for 20 min in darkness. Promega MS grade trypsin (Thermo Fisher Scientific,
Massachusetts, USA), resuspended at 100 ng/μL in 10 mM NH4HCO3, was added to the sample
so that a mass ratio of 1:50 (enzyme:protein) was achieved, and the sample was incubated at
37 oC overnight. The digested peptides were then eluted through the spin-filter, collected, and
dried using vacuum centrifugation, before being reconstituted in 100 µL of 2% (v/v) ACN 0.1%
(v/v) FA. The sample was then purified with a C18 Biospin column (Thermo Fisher Scientific,
Massachusetts, US) according to the manufacturer’s protocol, and concentrations were verified
on a NanoDrop 2000/2000c UV-Vis spectrophotometer (Thermo Scientific, Massachusetts, US)
at a wavelength of 205 nm, ε205 of 31 mL mg-1cm-1 as per the manufacturer’s instructions. All
samples were stored at -20 oC until required for LC-MS/MS. Acquisition and analysis of the
isolated venom fractions were performed by Miss Emily Bubner (The University of Adelaide).
54
3.4.5. LC-MS/MS analysis of venom samples
The digested venom samples were analysed by LC-MS/MS using an Ultimate 3000
nano-flow system (Thermo Fisher Scientific, California, US) coupled to a LTQ XL Orbitrap
ETD mass spectrometer (Thermo Fisher Scientific, California, US). 2 µg of each peptide
sample was pre-concentrated on a C18 trapping column (Acclaim PepMap 100 C18 75 µm x 20
mm, Thermo-Fisher Scientific); a flow rate of 5 µL/min with 2% (v/v) ACN 0.1% (v/v) TFA
was applied over 10 min. Peptides were then separated using a 75 µm ID C18 column (Acclaim
PepMap100 C18 75 µm x 50 cm, Thermo-Fisher Scientific) at a flow rate of 0.3 µL/min, where
a linear gradient of 5% to 45% Solvent B was applied over 60 min. This was followed by a 5
min wash with 90% Solvent B, and then a 15 min equilibration process with 5% Solvent B.
LC-MS/MS acquisitions were controlled by Xcalibur (version 2.1, Thermo Fisher
Scientific), and the mass spectrometer was operated in data-dependent acquisition mode.
Spectra were acquired in positive mode in the mass range of 300 – 2000 m/z at a resolution of
60 000 in FT mode. The 10 most intense precursor ions were selected for CID fragmentation
using a dynamic exclusion of 5 seconds where the dynamic exclusion criteria included:
minimum relative signal intensity of 1000 and ≥ 2 positive charge state. The isolation width
used was 3.0 m/z and a normalised collision energy of 35 was applied.
3.4.6. MASCOT analysis
MS/MS data was converted to MGF file format and submitted for qualitative protein
identification on the in-house Mascot server (version 2.3.01, Matrixscience). The data was
searched against all Chordata entries present in the Swiss-Prot database. Parameters for the
performed search were as follows: tryptic peptides with a maximum of 2 missed cleavages
were allowed, peptide mass tolerance of 30 ppm, fragment mass tolerance of 0.8 Da, cysteine
carbamidomethylation set as fixed modification and methionine oxidation, acetylation of the
protein N-terminus, and deamidation of glutamine and asparagine set as variable modifications.
Relative abundance values of the toxin groups in a given venom mixture were calculated from
the sum of the emPAI scores generated by Mascot for the given toxin group.
55
3.4.7. Native MS analysis of the venom samples
All native MS spectra were obtained using a Synapt G1 HDMS quadrupole ion mobility
time-of-flight mass spectrometer (Waters, Manchester, UK). 4 µL of sample was introduced
into the instrument by nano-electrospray from platinum-coated borosilicate capillaries,
prepared in-house. Mass spectra were acquired under the control of MassLynx software
(version 4.1, Waters). Instrument conditions were set to optimise maintenance of non-covalent
interactions as follows: scan range, 500 – 6000 m/z; polarity, positive; capillary voltage, 1.7
kV; sampling cone voltage, 50 kV; extraction cone, 3 kV; source temperature, 50 oC;
desolvation temperature; 180 oC; trap collision energy, 30 V; transfer collision energy, 30 V;
IMS wave velocity, 300 m/s; backing pressure, 4.07 mbar. The protein samples were
maintained in 200 mM NH4OAc buffer, pH 7.0 prior to analysis.
3.4.8. Denatured MS analysis of the venom samples
All denatured mass spectra were obtained using an Agilent 1260 LC system coupled to
an Agilent 6230 TOF mass spectrometer (Agilent Technologies, California, US) tuned in the
3200 m/z mass range. 2 µL of sample was directly injected into the instrument via the LC auto
sampler and eluted at a flow rate of 0.2 mL/min without chromatographic separation. An
isocratic elution of 50% Solvent B was used; Solvent A (0.1 % (v/v) FA in water) and Solvent
B (99.9% (v/v) ACN 0.1% (v/v) FA). The instrument conditions were set as follows: m/z range,
500 – 3200; polarity, positive; capillary voltage, 3.5 kV; nozzle voltage, 2 kV; gas temperature;
325 oC. Mass spectra were acquired under the control of MassHunter Workstation software
(version B.08.00, Agilent Technologies). MS data analysis was performed using MassHunter
Workstation software (version B.07.00, Agilent Technologies) where spectra were summed
over the time period of sample elution. For MS experiments under both reducing and denatured
conditions, the sample was first incubated with 1 mM DTT in 200 mM NH4OAc for 1 h prior
to MS analysis by the workflow described above.
56
~ Chapter 4 ~
Structural and Functional Insights into Phospholipase A2 Enzymes Isolated from
P. colletti Venom
4.1. Introduction
4.1.1. Significance and structure of phospholipase A2
Of the various protein families that constitute snake venoms, phospholipase A2 (PLA2,
Figure 4.1.A) is of significant interest owing to its abundance in elapid venoms and various
viperid venoms. Aside from its abundance and critical role in envenomation, PLA2 is an
extensive superfamily of enzymes highly expressed in insect venoms and are also expressed in
plants, bacteria, invertebrates and vertebrates [104]. PLA2 activity is characterised by the
hydrolysis of phospholipids at the sn-2 position on the glycerol backbone, liberating a lyso-
phospholipid and fatty acid (Figure 4.1.B) [104]. PLA2s are broadly classified into two forms:
an extracellular form known as secreted PLA2s (sPLA2s) and an intracellular form termed
cytosolic PLA2s (cPLA2s); this study focuses on the former class of PLA2s in the context of
snake venoms.
While human PLA2s are not known to have any toxic effects, but rather participate in
regulating phospholipid turnover and cell maturation, venom-derived PLA2s are extremely
potent [104]. They are known to elicit neuro- and myotoxic effects by hydrolysing cell
membrane phospholipids, resulting in the destruction of neuromuscular junctions and skeletal
muscles [104]. Downstream cellular pathways mediated by hydrolysed products of cell
membranes are also thought to contribute to the indirect toxicity of PLA2, leading to increased
neuro-, myo- and cardiotoxicity, disruption of haemostasis and platelet aggregation [2, 105].
Together, the role of PLA2 in envenomation and toxicity is highly complex, despite its straight-
forward function as a phospholipase. Therefore, it is increasingly vital to extensively
characterise PLA2s in order to provide a rationale for their numerous complex functions.
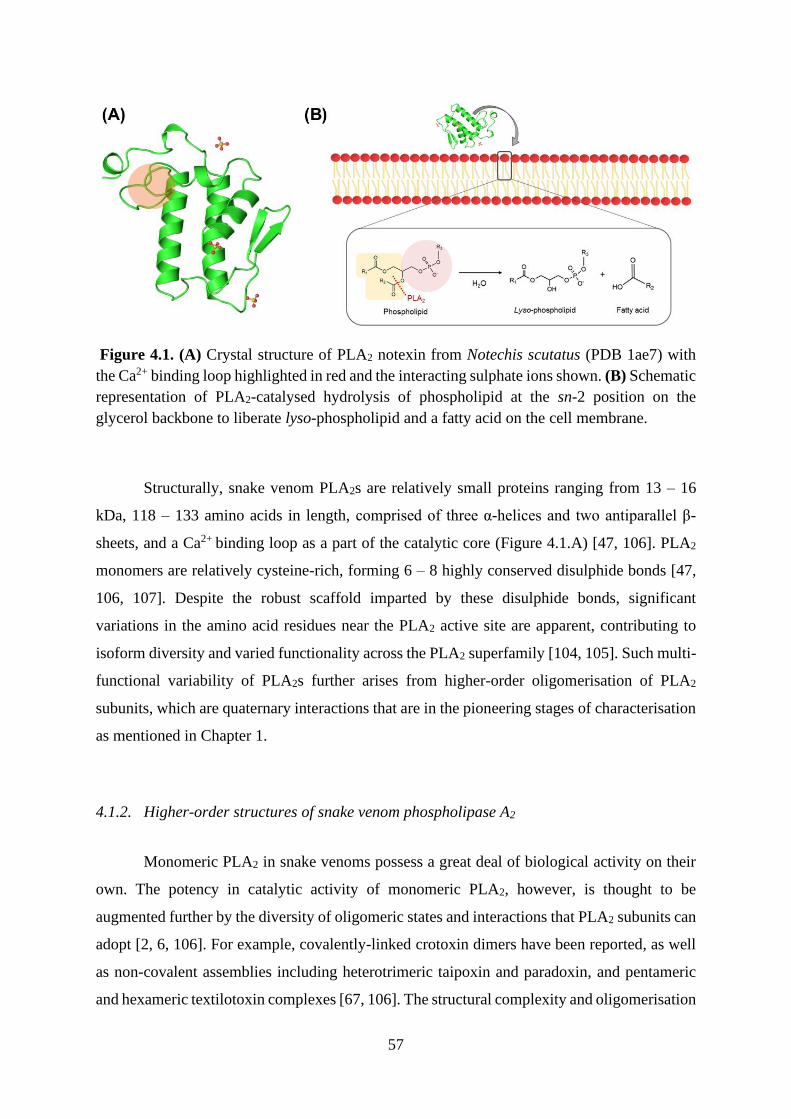
57
Figure 4.1. (A) Crystal structure of PLA2 notexin from Notechis scutatus (PDB 1ae7) with
the Ca2+ binding loop highlighted in red and the interacting sulphate ions shown. (B) Schematic
representation of PLA2-catalysed hydrolysis of phospholipid at the sn-2 position on the
glycerol backbone to liberate lyso-phospholipid and a fatty acid on the cell membrane.
Structurally, snake venom PLA2s are relatively small proteins ranging from 13 – 16
kDa, 118 – 133 amino acids in length, comprised of three α-helices and two antiparallel β-
sheets, and a Ca2+ binding loop as a part of the catalytic core (Figure 4.1.A) [47, 106]. PLA2
monomers are relatively cysteine-rich, forming 6 – 8 highly conserved disulphide bonds [47,
106, 107]. Despite the robust scaffold imparted by these disulphide bonds, significant
variations in the amino acid residues near the PLA2 active site are apparent, contributing to
isoform diversity and varied functionality across the PLA2 superfamily [104, 105]. Such multi-
functional variability of PLA2s further arises from higher-order oligomerisation of PLA2
subunits, which are quaternary interactions that are in the pioneering stages of characterisation
as mentioned in Chapter 1.
4.1.2. Higher-order structures of snake venom phospholipase A2
Monomeric PLA2 in snake venoms possess a great deal of biological activity on their
own. The potency in catalytic activity of monomeric PLA2, however, is thought to be
augmented further by the diversity of oligomeric states and interactions that PLA2 subunits can
adopt [2, 6, 106]. For example, covalently-linked crotoxin dimers have been reported, as well
as non-covalent assemblies including heterotrimeric taipoxin and paradoxin, and pentameric
and hexameric textilotoxin complexes [67, 106]. The structural complexity and oligomerisation
58
of PLA2 is speculated to finely regulate the degree of toxicity when compared to monomeric
PLA2. While the mechanisms responsible for enhanced potency in multimeric PLA2s are not
well understood, it is thought that binding affinity at the target site, which is at the phospholipid
bilayer of cell membranes, is increased by oligomerisation [6, 106]. PLA2s have also been
observed to oligomerise with other venom toxins such as 3-Finger toxins (3FTxs) and snake
venom metalloproteinases (SVMPs) to exert toxicity [6, 106]. Together, the promiscuous
nature of PLA2 oligomerisation contributes greatly to the myriad of complex downstream
pathophysiological effects that result in the diverse range of envenomation symptoms.
Despite the speculated importance of these higher-order structures in venom, only a
few of these complexes have been successfully characterised. There remains many other PLA2
complexes in medically significant snake species that are yet to be explored. As revealed in
Chapter 3, the venom of P. colletti is relatively simple in composition yet highly PLA2-
abundant. This renders it an ideal model venom to investigate PLA2 oligomerisation, in
addition to gaining further insight on PLA2 structure and function by IM-MS. The fact that P.
colletti envenomation results in potent systemic symptoms despite the lack of diversity in
venom composition raises interesting questions as to whether higher-order structural
interactions between PLA2s are potentially responsible for enhanced activity. In this chapter,
we interrogate the venom of P. colletti for higher-order PLA2 complexes by native IM-MS,
and gain insight on the effect of these interactions on PLA2 function.
4.2. Results and discussion
4.2.1. Purification of PLA2 oligomers from crude P. colletti venom
As described in Chapter 3, P. colletti venom was shown to be highly abundant in PLA2,
which predominantly eluted at approximately 18 mL during SEC fractionation (fraction P2,
Figure 4.2.A), corresponding to intermediate-sized protein species; the focus will thus be on
further purification and interrogation of PLA2 proteins in this chapter. As only P. colletti
venom will be explored, the SEC peaks labels are simplified to peak numbers for ease of
reference (Figure 4.2.A). Fractions corresponding to the P2 peak from SEC separation of P.
colletti whole venom (Figure 4.2.A, shaded box) were pooled for further separation by ion-
exchange chromatography (IEX) (Figure 4.2.B). Subsequent separation of P2 by IEX resulted

59
in the elution of four peaks (labelled 1 - 4), corresponding to potentially distinct PLA2
isoforms (Figure 4.2.B). Given the positively-charged stationary phase used during IEX
separation, proteins in peaks 1-4 are expected to elute in the order of most basic through to
neutral and most acidic PLA2 isoforms. Combined, this data demonstrates the structural
complexity of PLA2s in this seemingly simple venom mixture.
Figure 4.2. Purification of PLA2 proteins from crude P. colletti venom. (A) SEC elution profile
of P. colletti whole venom (10 mg/mL) in 200 mM NH4OAc (pH 7.0) with PLA2 highly
abundant in the P2 peak (shaded box). (B) IEX elution profile of the P2 peak containing PLA2
in 10 mM tris-HCl, 2 mM EDTA and 0.05% NaN3 (pH 8.5). Proteins were eluted using a 50%
1 M NaCl gradient (purple line).
4.2.2. Analysing the quaternary structure of P. colletti PLA2 by native IM-MS
The quaternary structures of isolated PLA2 proteins from IEX chromatography were
interrogated by native IM-MS. The majority of the PLA2 species across the fractions examined
are monomeric at approximately 13 kDa (Figure 4.3), consistent with the native MS data
described in Chapter 3. The observed molecular masses of these monomeric PLA2 are very
similar, ranging from 12.9 – 14 kDa with mass differences ranging from 0.1 – 1 kDa. The
observed variations in mass may be indicative of numerous PLA2 isoforms which differ by a
single amino acid or additionally due to post-translational modifications (PTMs), particularly
glycosylation. Previous studies have indicated glycosylation to be a common modification in
snake venoms, exhibiting heavily modified native MS spectra similar to the data presented [66,
60
67], with highly variable and often atypical glycosylation patterns, including sialic acid-
containing glycans that fall within the previously reported mass range [41, 42].
Interestingly, a 27.7 kDa species was also observed which is potentially indicative of
dimeric PLA2 based on its charge state distribution and molecular mass (Figure 4.3.C). The
presence of this dimeric species is novel as there is no structural data reporting the existence
of PLA2 dimers in P. colletti venom, although the presence of such dimers has been briefly
speculated in a previous study based on SDS-PAGE analysis of whole P. colletti venom [90].
To date therefore, this is the first observation of dimeric PLA2 in a venom thought to contain
monomeric PLA2, and indicates that quaternary structure and dynamics may be at play in
affecting PLA2 function.
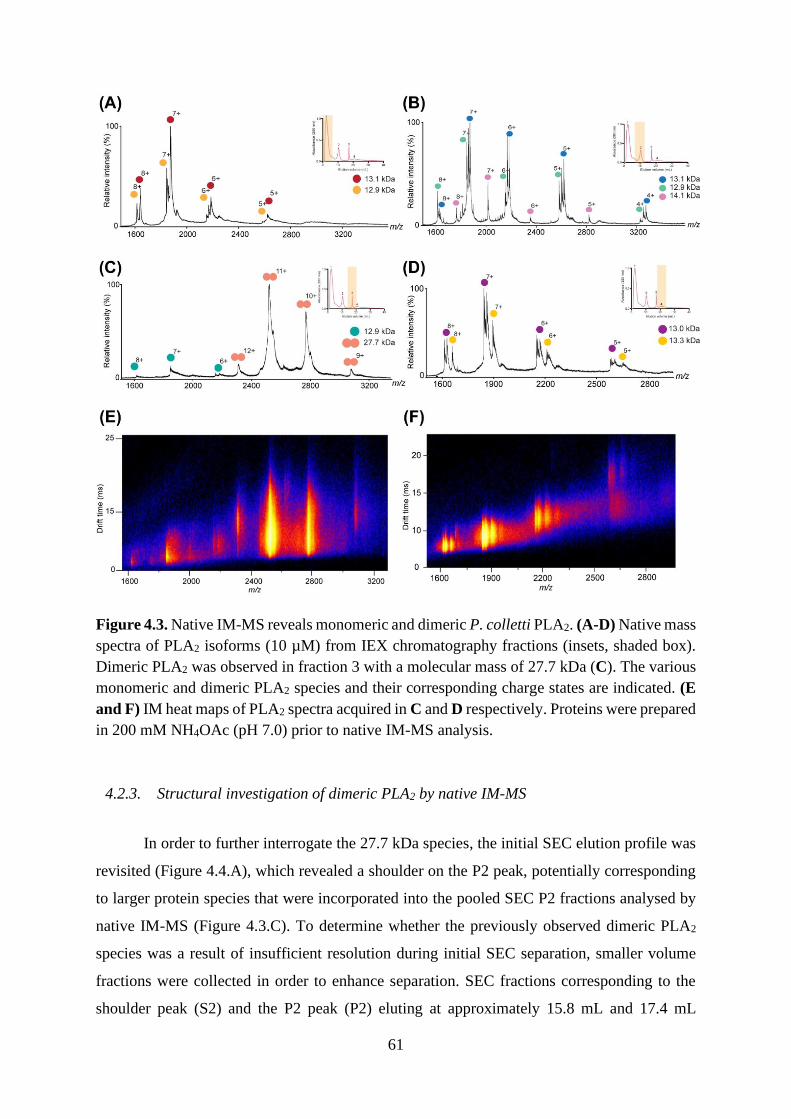
61
Figure 4.3. Native IM-MS reveals monomeric and dimeric P. colletti PLA2. (A-D) Native mass
spectra of PLA2 isoforms (10 µM) from IEX chromatography fractions (insets, shaded box).
Dimeric PLA2 was observed in fraction 3 with a molecular mass of 27.7 kDa (C). The various
monomeric and dimeric PLA2 species and their corresponding charge states are indicated. (E
and F) IM heat maps of PLA2 spectra acquired in C and D respectively. Proteins were prepared
in 200 mM NH4OAc (pH 7.0) prior to native IM-MS analysis.
4.2.3. Structural investigation of dimeric PLA2 by native IM-MS
In order to further interrogate the 27.7 kDa species, the initial SEC elution profile was
revisited (Figure 4.4.A), which revealed a shoulder on the P2 peak, potentially corresponding
to larger protein species that were incorporated into the pooled SEC P2 fractions analysed by
native IM-MS (Figure 4.3.C). To determine whether the previously observed dimeric PLA2
species was a result of insufficient resolution during initial SEC separation, smaller volume
fractions were collected in order to enhance separation. SEC fractions corresponding to the
shoulder peak (S2) and the P2 peak (P2) eluting at approximately 15.8 mL and 17.4 mL
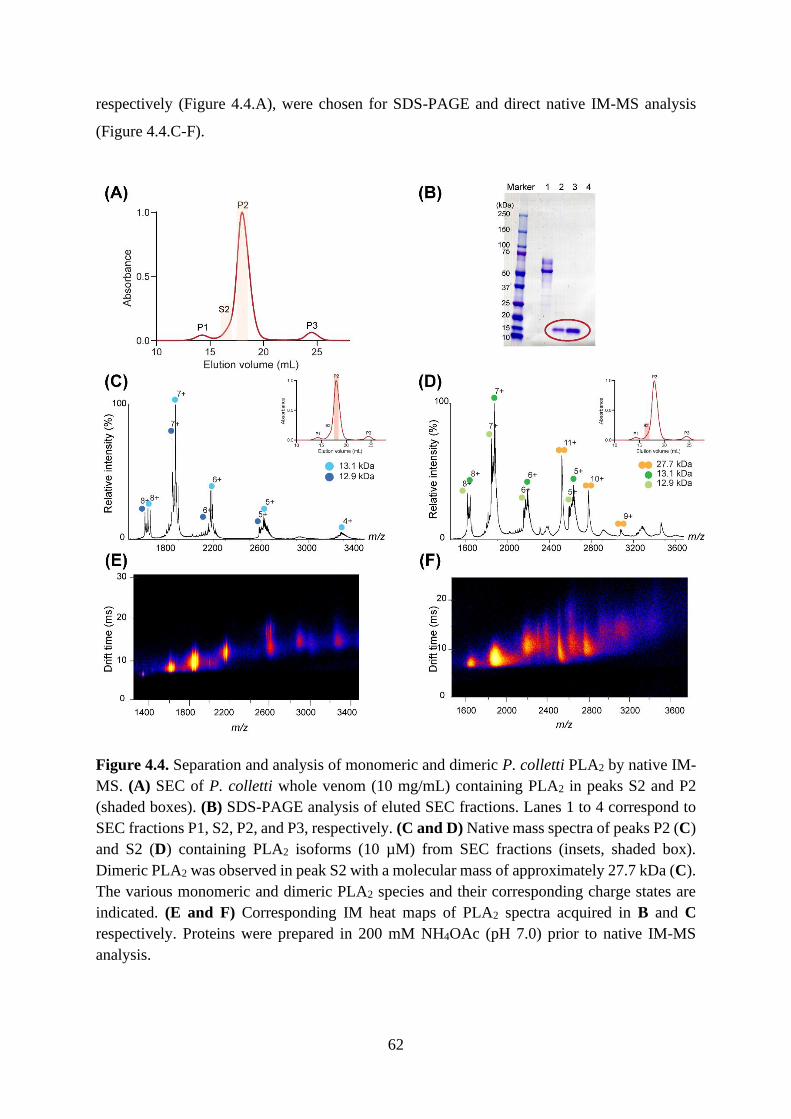
62
respectively (Figure 4.4.A), were chosen for SDS-PAGE and direct native IM-MS analysis
(Figure 4.4.C-F).
Figure 4.4. Separation and analysis of monomeric and dimeric P. colletti PLA2 by native IM-
MS. (A) SEC of P. colletti whole venom (10 mg/mL) containing PLA2 in peaks S2 and P2
(shaded boxes). (B) SDS-PAGE analysis of eluted SEC fractions. Lanes 1 to 4 correspond to
SEC fractions P1, S2, P2, and P3, respectively. (C and D) Native mass spectra of peaks P2 (C)
and S2 (D) containing PLA2 isoforms (10 µM) from SEC fractions (insets, shaded box).
Dimeric PLA2 was observed in peak S2 with a molecular mass of approximately 27.7 kDa (C).
The various monomeric and dimeric PLA2 species and their corresponding charge states are
indicated. (E and F) Corresponding IM heat maps of PLA2 spectra acquired in B and C
respectively. Proteins were prepared in 200 mM NH4OAc (pH 7.0) prior to native IM-MS
analysis.
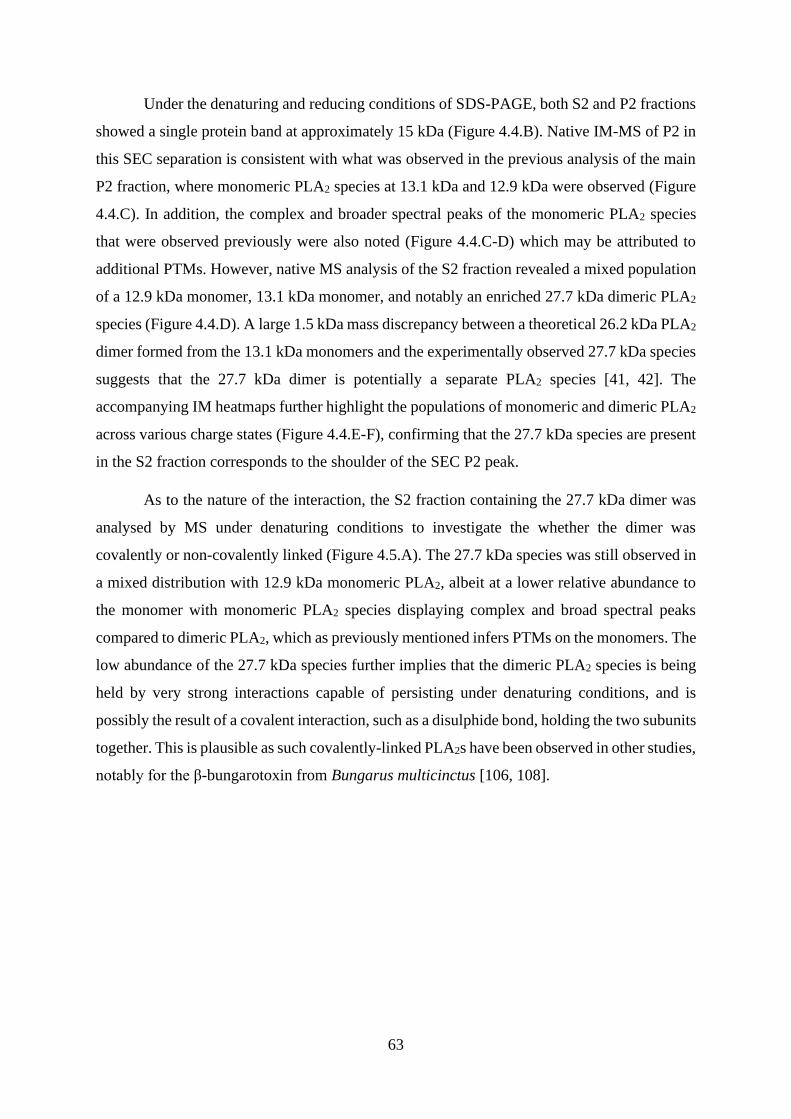
63
Under the denaturing and reducing conditions of SDS-PAGE, both S2 and P2 fractions
showed a single protein band at approximately 15 kDa (Figure 4.4.B). Native IM-MS of P2 in
this SEC separation is consistent with what was observed in the previous analysis of the main
P2 fraction, where monomeric PLA2 species at 13.1 kDa and 12.9 kDa were observed (Figure
4.4.C). In addition, the complex and broader spectral peaks of the monomeric PLA2 species
that were observed previously were also noted (Figure 4.4.C-D) which may be attributed to
additional PTMs. However, native MS analysis of the S2 fraction revealed a mixed population
of a 12.9 kDa monomer, 13.1 kDa monomer, and notably an enriched 27.7 kDa dimeric PLA2
species (Figure 4.4.D). A large 1.5 kDa mass discrepancy between a theoretical 26.2 kDa PLA2
dimer formed from the 13.1 kDa monomers and the experimentally observed 27.7 kDa species
suggests that the 27.7 kDa dimer is potentially a separate PLA2 species [41, 42]. The
accompanying IM heatmaps further highlight the populations of monomeric and dimeric PLA2
across various charge states (Figure 4.4.E-F), confirming that the 27.7 kDa species are present
in the S2 fraction corresponds to the shoulder of the SEC P2 peak.
As to the nature of the interaction, the S2 fraction containing the 27.7 kDa dimer was
analysed by MS under denaturing conditions to investigate the whether the dimer was
covalently or non-covalently linked (Figure 4.5.A). The 27.7 kDa species was still observed in
a mixed distribution with 12.9 kDa monomeric PLA2, albeit at a lower relative abundance to
the monomer with monomeric PLA2 species displaying complex and broad spectral peaks
compared to dimeric PLA2, which as previously mentioned infers PTMs on the monomers. The
low abundance of the 27.7 kDa species further implies that the dimeric PLA2 species is being
held by very strong interactions capable of persisting under denaturing conditions, and is
possibly the result of a covalent interaction, such as a disulphide bond, holding the two subunits
together. This is plausible as such covalently-linked PLA2s have been observed in other studies,
notably for the β-bungarotoxin from Bungarus multicinctus [106, 108].
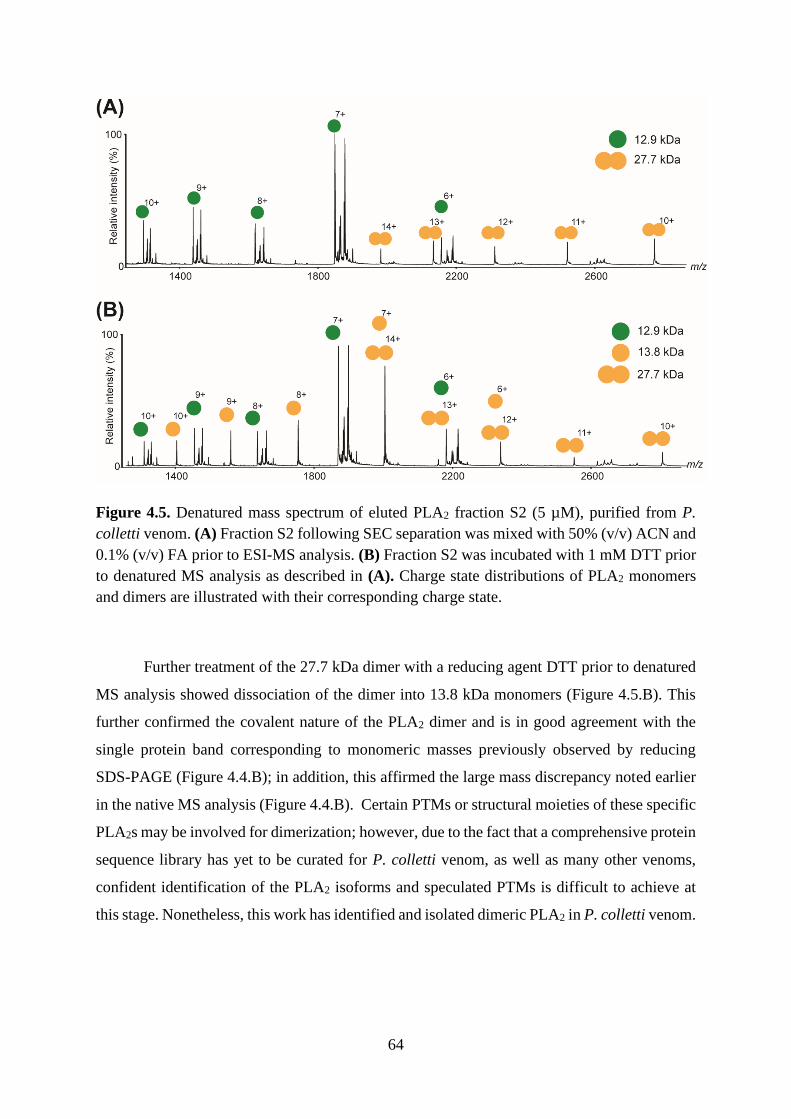
64
Figure 4.5. Denatured mass spectrum of eluted PLA2 fraction S2 (5 µM), purified from P.
colletti venom. (A) Fraction S2 following SEC separation was mixed with 50% (v/v) ACN and
0.1% (v/v) FA prior to ESI-MS analysis. (B) Fraction S2 was incubated with 1 mM DTT prior
to denatured MS analysis as described in (A). Charge state distributions of PLA2 monomers
and dimers are illustrated with their corresponding charge state.
Further treatment of the 27.7 kDa dimer with a reducing agent DTT prior to denatured
MS analysis showed dissociation of the dimer into 13.8 kDa monomers (Figure 4.5.B). This
further confirmed the covalent nature of the PLA2 dimer and is in good agreement with the
single protein band corresponding to monomeric masses previously observed by reducing
SDS-PAGE (Figure 4.4.B); in addition, this affirmed the large mass discrepancy noted earlier
in the native MS analysis (Figure 4.4.B). Certain PTMs or structural moieties of these specific
PLA2s may be involved for dimerization; however, due to the fact that a comprehensive protein
sequence library has yet to be curated for P. colletti venom, as well as many other venoms,
confident identification of the PLA2 isoforms and speculated PTMs is difficult to achieve at
this stage. Nonetheless, this work has identified and isolated dimeric PLA2 in P. colletti venom.
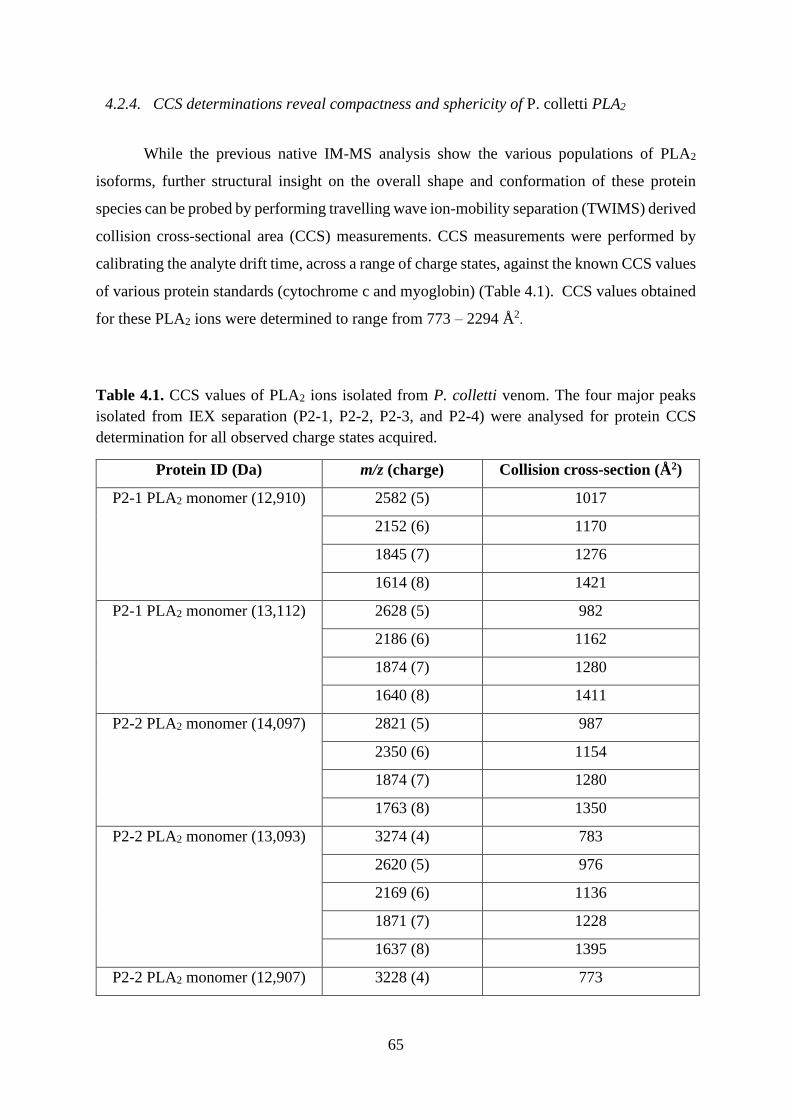
65
4.2.4. CCS determinations reveal compactness and sphericity of P. colletti PLA2
While the previous native IM-MS analysis show the various populations of PLA2
isoforms, further structural insight on the overall shape and conformation of these protein
species can be probed by performing travelling wave ion-mobility separation (TWIMS) derived
collision cross-sectional area (CCS) measurements. CCS measurements were performed by
calibrating the analyte drift time, across a range of charge states, against the known CCS values
of various protein standards (cytochrome c and myoglobin) (Table 4.1). CCS values obtained
for these PLA2 ions were determined to range from 773 – 2294 Å2.
Table 4.1. CCS values of PLA2 ions isolated from P. colletti venom. The four major peaks
isolated from IEX separation (P2-1, P2-2, P2-3, and P2-4) were analysed for protein CCS
determination for all observed charge states acquired.
Protein ID (Da) m/z (charge) Collision cross-section (Å2)
P2-1 PLA2 monomer (12,910) 2582 (5) 1017
2152 (6) 1170
1845 (7) 1276
1614 (8) 1421
P2-1 PLA2 monomer (13,112) 2628 (5) 982
2186 (6) 1162
1874 (7) 1280
1640 (8) 1411
P2-2 PLA2 monomer (14,097) 2821 (5) 987
2350 (6) 1154
1874 (7) 1280
1763 (8) 1350
P2-2 PLA2 monomer (13,093) 3274 (4) 783
2620 (5) 976
2169 (6) 1136
1871 (7) 1228
1637 (8) 1395
P2-2 PLA2 monomer (12,907) 3228 (4) 773
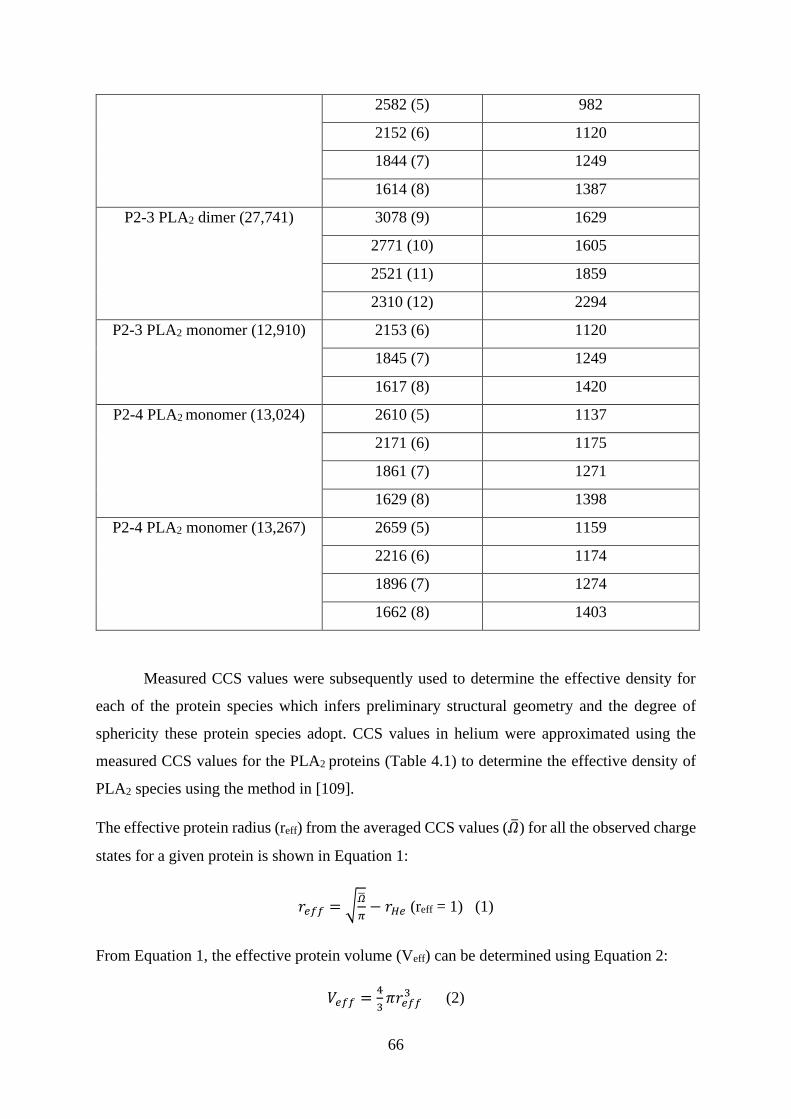
66
2582 (5) 982
2152 (6) 1120
1844 (7) 1249
1614 (8) 1387
P2-3 PLA2 dimer (27,741) 3078 (9) 1629
2771 (10) 1605
2521 (11) 1859
2310 (12) 2294
P2-3 PLA2 monomer (12,910) 2153 (6) 1120
1845 (7) 1249
1617 (8) 1420
P2-4 PLA2 monomer (13,024) 2610 (5) 1137
2171 (6) 1175
1861 (7) 1271
1629 (8) 1398
P2-4 PLA2 monomer (13,267) 2659 (5) 1159
2216 (6) 1174
1896 (7) 1274
1662 (8) 1403
Measured CCS values were subsequently used to determine the effective density for
each of the protein species which infers preliminary structural geometry and the degree of
sphericity these protein species adopt. CCS values in helium were approximated using the
measured CCS values for the PLA2 proteins (Table 4.1) to determine the effective density of
PLA2 species using the method in [109].
The effective protein radius (reff) from the averaged CCS values (�̅�) for all the observed charge
states for a given protein is shown in Equation 1:
𝑟𝑒𝑓𝑓 = √�̅�
𝜋− 𝑟𝐻𝑒 (reff = 1) (1)
From Equation 1, the effective protein volume (Veff) can be determined using Equation 2:
𝑉𝑒𝑓𝑓 =4
3𝜋𝑟𝑒𝑓𝑓
3 (2)
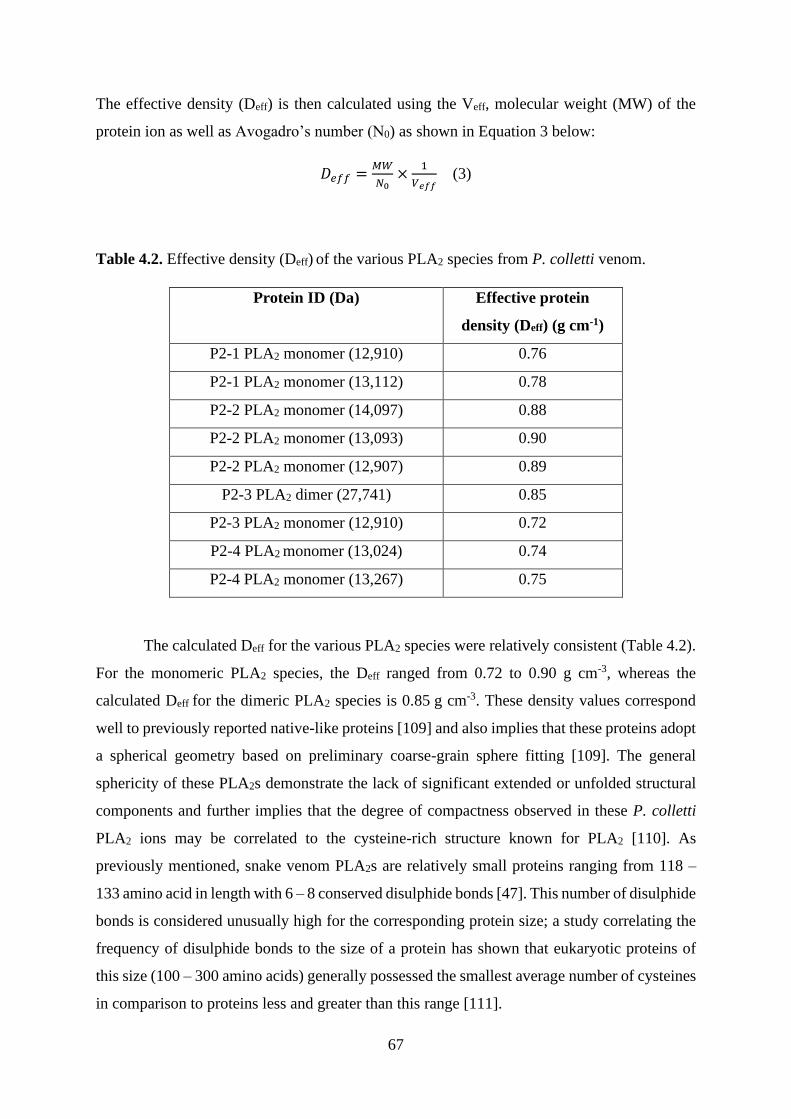
67
The effective density (Deff) is then calculated using the Veff, molecular weight (MW) of the
protein ion as well as Avogadro’s number (N0) as shown in Equation 3 below:
𝐷𝑒𝑓𝑓 =𝑀𝑊
𝑁0×
1
𝑉𝑒𝑓𝑓 (3)
Table 4.2. Effective density (Deff) of the various PLA2 species from P. colletti venom.
Protein ID (Da) Effective protein
density (Deff) (g cm-1)
P2-1 PLA2 monomer (12,910) 0.76
P2-1 PLA2 monomer (13,112) 0.78
P2-2 PLA2 monomer (14,097) 0.88
P2-2 PLA2 monomer (13,093) 0.90
P2-2 PLA2 monomer (12,907) 0.89
P2-3 PLA2 dimer (27,741) 0.85
P2-3 PLA2 monomer (12,910) 0.72
P2-4 PLA2 monomer (13,024) 0.74
P2-4 PLA2 monomer (13,267) 0.75
The calculated Deff for the various PLA2 species were relatively consistent (Table 4.2).
For the monomeric PLA2 species, the Deff ranged from 0.72 to 0.90 g cm-3, whereas the
calculated Deff for the dimeric PLA2 species is 0.85 g cm-3. These density values correspond
well to previously reported native-like proteins [109] and also implies that these proteins adopt
a spherical geometry based on preliminary coarse-grain sphere fitting [109]. The general
sphericity of these PLA2s demonstrate the lack of significant extended or unfolded structural
components and further implies that the degree of compactness observed in these P. colletti
PLA2 ions may be correlated to the cysteine-rich structure known for PLA2 [110]. As
previously mentioned, snake venom PLA2s are relatively small proteins ranging from 118 –
133 amino acid in length with 6 – 8 conserved disulphide bonds [47]. This number of disulphide
bonds is considered unusually high for the corresponding protein size; a study correlating the
frequency of disulphide bonds to the size of a protein has shown that eukaryotic proteins of
this size (100 – 300 amino acids) generally possessed the smallest average number of cysteines
in comparison to proteins less and greater than this range [111].
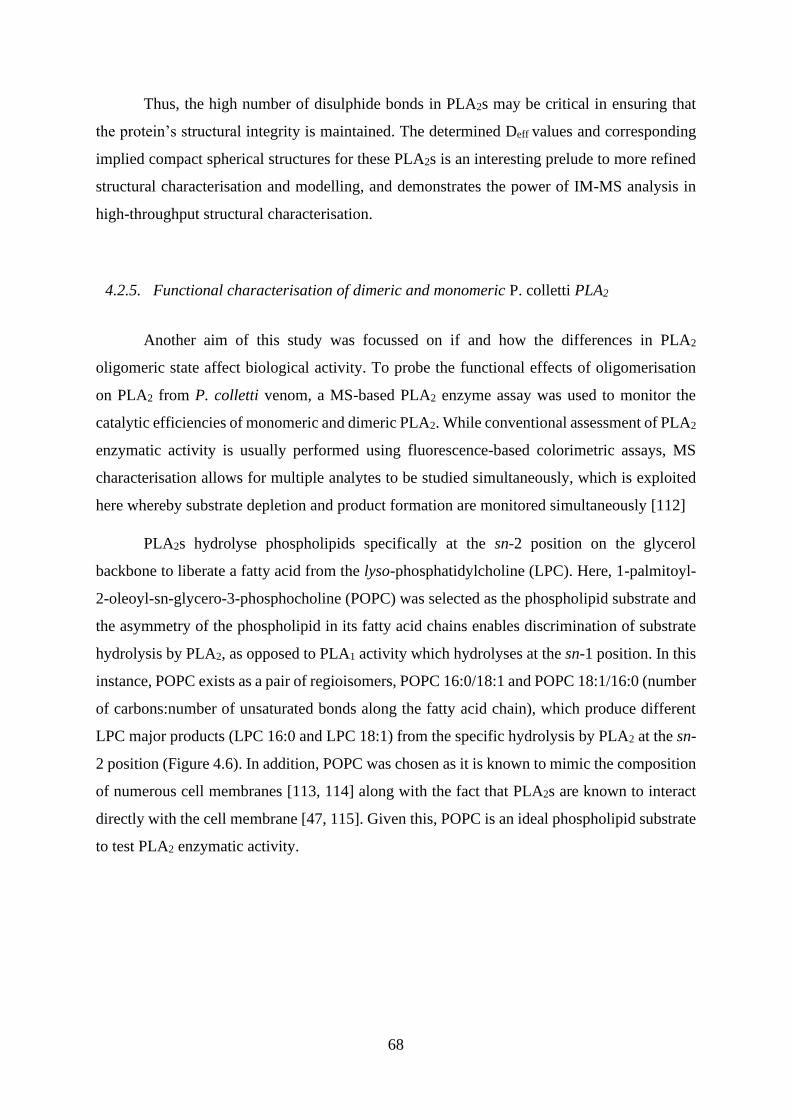
68
Thus, the high number of disulphide bonds in PLA2s may be critical in ensuring that
the protein’s structural integrity is maintained. The determined Deff values and corresponding
implied compact spherical structures for these PLA2s is an interesting prelude to more refined
structural characterisation and modelling, and demonstrates the power of IM-MS analysis in
high-throughput structural characterisation.
4.2.5. Functional characterisation of dimeric and monomeric P. colletti PLA2
Another aim of this study was focussed on if and how the differences in PLA2
oligomeric state affect biological activity. To probe the functional effects of oligomerisation
on PLA2 from P. colletti venom, a MS-based PLA2 enzyme assay was used to monitor the
catalytic efficiencies of monomeric and dimeric PLA2. While conventional assessment of PLA2
enzymatic activity is usually performed using fluorescence-based colorimetric assays, MS
characterisation allows for multiple analytes to be studied simultaneously, which is exploited
here whereby substrate depletion and product formation are monitored simultaneously [112]
PLA2s hydrolyse phospholipids specifically at the sn-2 position on the glycerol
backbone to liberate a fatty acid from the lyso-phosphatidylcholine (LPC). Here, 1-palmitoyl-
2-oleoyl-sn-glycero-3-phosphocholine (POPC) was selected as the phospholipid substrate and
the asymmetry of the phospholipid in its fatty acid chains enables discrimination of substrate
hydrolysis by PLA2, as opposed to PLA1 activity which hydrolyses at the sn-1 position. In this
instance, POPC exists as a pair of regioisomers, POPC 16:0/18:1 and POPC 18:1/16:0 (number
of carbons:number of unsaturated bonds along the fatty acid chain), which produce different
LPC major products (LPC 16:0 and LPC 18:1) from the specific hydrolysis by PLA2 at the sn-
2 position (Figure 4.6). In addition, POPC was chosen as it is known to mimic the composition
of numerous cell membranes [113, 114] along with the fact that PLA2s are known to interact
directly with the cell membrane [47, 115]. Given this, POPC is an ideal phospholipid substrate
to test PLA2 enzymatic activity.
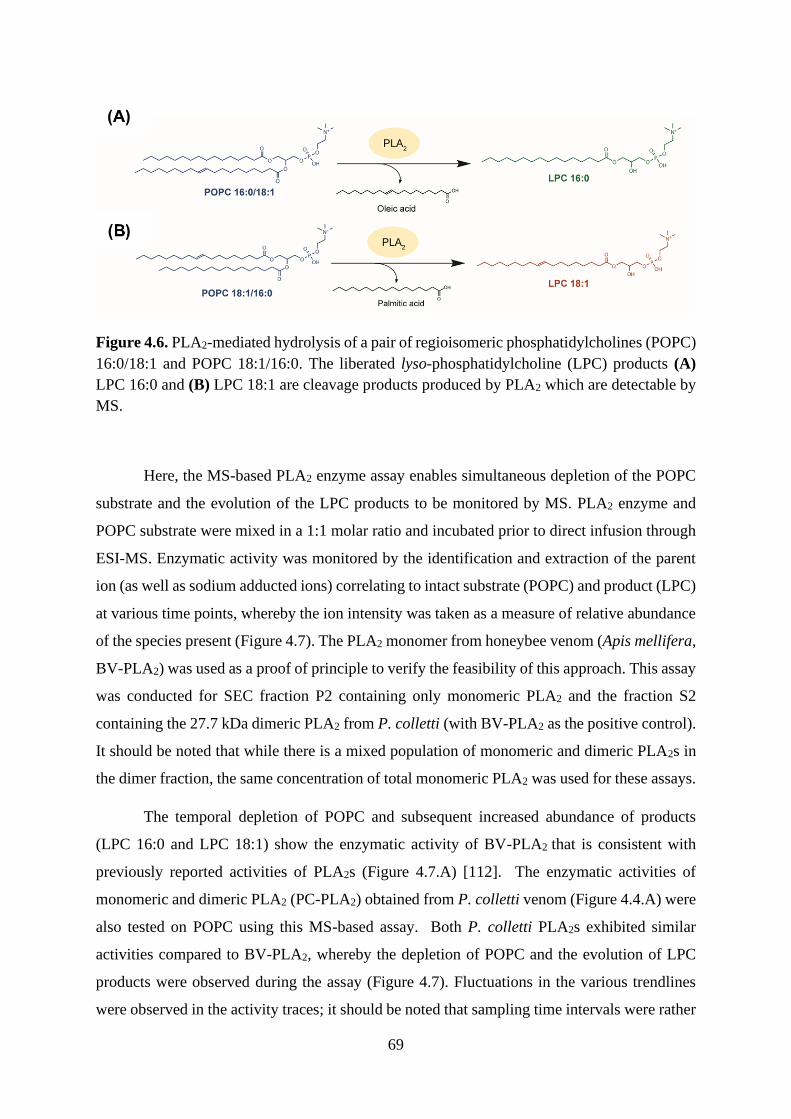
69
Figure 4.6. PLA2-mediated hydrolysis of a pair of regioisomeric phosphatidylcholines (POPC)
16:0/18:1 and POPC 18:1/16:0. The liberated lyso-phosphatidylcholine (LPC) products (A)
LPC 16:0 and (B) LPC 18:1 are cleavage products produced by PLA2 which are detectable by
MS.
Here, the MS-based PLA2 enzyme assay enables simultaneous depletion of the POPC
substrate and the evolution of the LPC products to be monitored by MS. PLA2 enzyme and
POPC substrate were mixed in a 1:1 molar ratio and incubated prior to direct infusion through
ESI-MS. Enzymatic activity was monitored by the identification and extraction of the parent
ion (as well as sodium adducted ions) correlating to intact substrate (POPC) and product (LPC)
at various time points, whereby the ion intensity was taken as a measure of relative abundance
of the species present (Figure 4.7). The PLA2 monomer from honeybee venom (Apis mellifera,
BV-PLA2) was used as a proof of principle to verify the feasibility of this approach. This assay
was conducted for SEC fraction P2 containing only monomeric PLA2 and the fraction S2
containing the 27.7 kDa dimeric PLA2 from P. colletti (with BV-PLA2 as the positive control).
It should be noted that while there is a mixed population of monomeric and dimeric PLA2s in
the dimer fraction, the same concentration of total monomeric PLA2 was used for these assays.
The temporal depletion of POPC and subsequent increased abundance of products
(LPC 16:0 and LPC 18:1) show the enzymatic activity of BV-PLA2 that is consistent with
previously reported activities of PLA2s (Figure 4.7.A) [112]. The enzymatic activities of
monomeric and dimeric PLA2 (PC-PLA2) obtained from P. colletti venom (Figure 4.4.A) were
also tested on POPC using this MS-based assay. Both P. colletti PLA2s exhibited similar
activities compared to BV-PLA2, whereby the depletion of POPC and the evolution of LPC
products were observed during the assay (Figure 4.7). Fluctuations in the various trendlines
were observed in the activity traces; it should be noted that sampling time intervals were rather
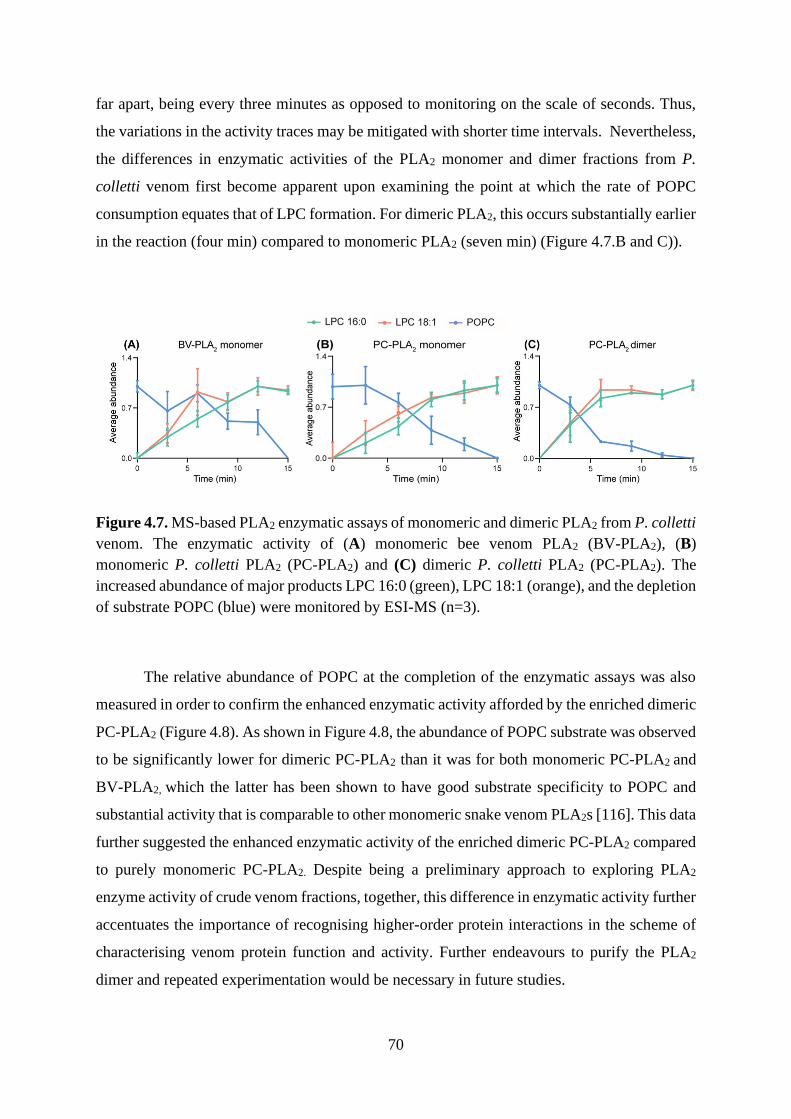
70
far apart, being every three minutes as opposed to monitoring on the scale of seconds. Thus,
the variations in the activity traces may be mitigated with shorter time intervals. Nevertheless,
the differences in enzymatic activities of the PLA2 monomer and dimer fractions from P.
colletti venom first become apparent upon examining the point at which the rate of POPC
consumption equates that of LPC formation. For dimeric PLA2, this occurs substantially earlier
in the reaction (four min) compared to monomeric PLA2 (seven min) (Figure 4.7.B and C)).
Figure 4.7. MS-based PLA2 enzymatic assays of monomeric and dimeric PLA2 from P. colletti
venom. The enzymatic activity of (A) monomeric bee venom PLA2 (BV-PLA2), (B)
monomeric P. colletti PLA2 (PC-PLA2) and (C) dimeric P. colletti PLA2 (PC-PLA2). The
increased abundance of major products LPC 16:0 (green), LPC 18:1 (orange), and the depletion
of substrate POPC (blue) were monitored by ESI-MS (n=3).
The relative abundance of POPC at the completion of the enzymatic assays was also
measured in order to confirm the enhanced enzymatic activity afforded by the enriched dimeric
PC-PLA2 (Figure 4.8). As shown in Figure 4.8, the abundance of POPC substrate was observed
to be significantly lower for dimeric PC-PLA2 than it was for both monomeric PC-PLA2 and
BV-PLA2, which the latter has been shown to have good substrate specificity to POPC and
substantial activity that is comparable to other monomeric snake venom PLA2s [116]. This data
further suggested the enhanced enzymatic activity of the enriched dimeric PC-PLA2 compared
to purely monomeric PC-PLA2. Despite being a preliminary approach to exploring PLA2
enzyme activity of crude venom fractions, together, this difference in enzymatic activity further
accentuates the importance of recognising higher-order protein interactions in the scheme of
characterising venom protein function and activity. Further endeavours to purify the PLA2
dimer and repeated experimentation would be necessary in future studies.
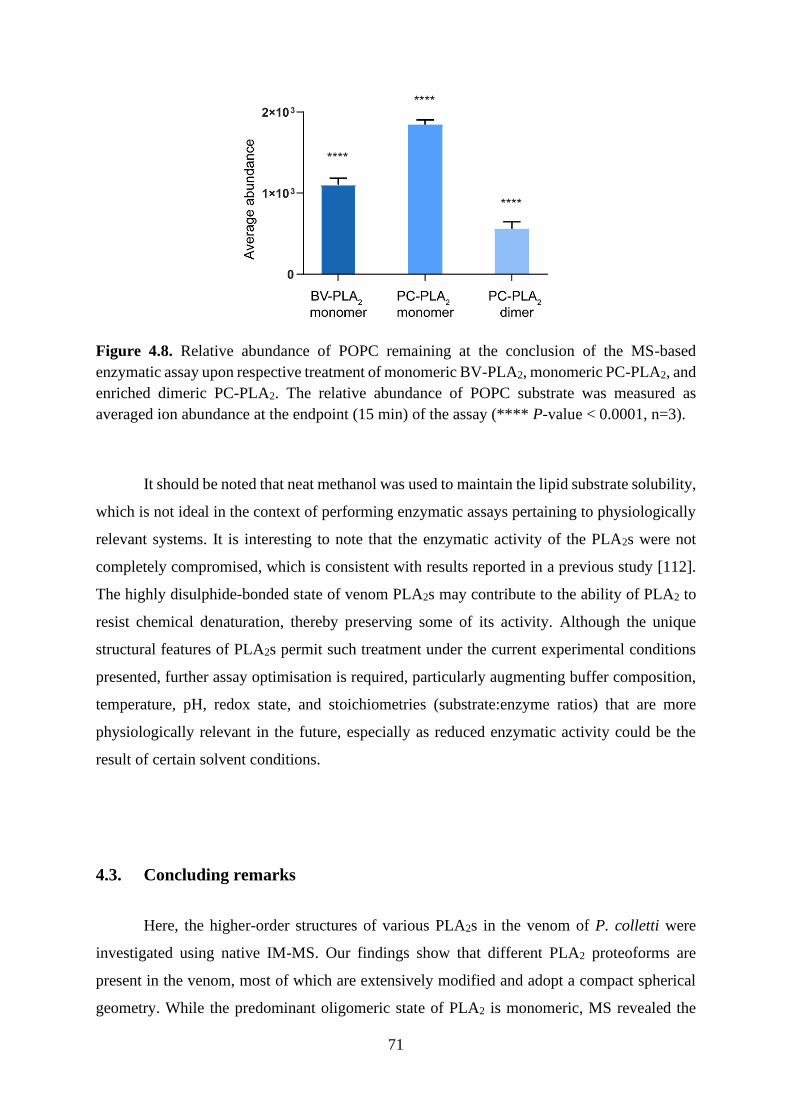
71
Figure 4.8. Relative abundance of POPC remaining at the conclusion of the MS-based
enzymatic assay upon respective treatment of monomeric BV-PLA2, monomeric PC-PLA2, and
enriched dimeric PC-PLA2. The relative abundance of POPC substrate was measured as
averaged ion abundance at the endpoint (15 min) of the assay (**** P-value < 0.0001, n=3).
It should be noted that neat methanol was used to maintain the lipid substrate solubility,
which is not ideal in the context of performing enzymatic assays pertaining to physiologically
relevant systems. It is interesting to note that the enzymatic activity of the PLA2s were not
completely compromised, which is consistent with results reported in a previous study [112].
The highly disulphide-bonded state of venom PLA2s may contribute to the ability of PLA2 to
resist chemical denaturation, thereby preserving some of its activity. Although the unique
structural features of PLA2s permit such treatment under the current experimental conditions
presented, further assay optimisation is required, particularly augmenting buffer composition,
temperature, pH, redox state, and stoichiometries (substrate:enzyme ratios) that are more
physiologically relevant in the future, especially as reduced enzymatic activity could be the
result of certain solvent conditions.
4.3. Concluding remarks
Here, the higher-order structures of various PLA2s in the venom of P. colletti were
investigated using native IM-MS. Our findings show that different PLA2 proteoforms are
present in the venom, most of which are extensively modified and adopt a compact spherical
geometry. While the predominant oligomeric state of PLA2 is monomeric, MS revealed the
72
presence of PLA2 dimers in the venom of P. colletti for the first time. Further analysis and
avenues of investigation are therefore necessary to answer finer mechanistic questions
regarding the formation of PLA2 dimers. Moreover, the development and use of a MS-based
PLA2 enzymatic assay to investigate enzymatic activity of dimeric and monomeric PLA2 in
SEC venom fractions on a phospholipid substrate, revealed a positive correlation between
higher-order states and activity. While further experimental optimisation is required to gain
accurate and more quantitative measurements, the data demonstrates not only the feasibility of
this MS-based approach, but importantly, showcases the changes in activity as a result of PLA2
dimerisation. In summation, this study further emphasises and establishes the importance of
understanding the formation of higher-order structures for snake venom proteins in order to
delineate their function.
73
4.4. Experimental procedures
4.4.1. Materials, reagents, and buffers used
All reagents were purchased from Sigma Aldrich (NSW, Australia) unless specified otherwise.
Whole lyophilised P. colletti venom was purchased from Venom Supplies Pty. Ltd. (Tanunda,
Australia), and were stored at -20 oC until required for experimentation.
200 mM NH4OAc buffer (pH 7.0) was filtered using a Nalgene Rapid-Flow bottle top filter
(Thermo Fisher Scientific, Massachusetts, US) and de-aerated with an ultrasonic cleaner
(Soniclean, SA, Australia) prior to its use in SEC and MS analyses.
3x SDS-PAGE loading buffer: 150 mM tris-HCl (pH 6.8), 300 mM DTT, 6% SDS, 30%
glycerol, 0.3% bromophenol blue.
1x SDS-tris-glycine running buffer: diluted from 10x running buffer (25 mM tris, 192 mM
glycine, 0.1% SDS, pH 8.5).
Coomassie Brilliant Blue staining solution: Coomassie Brilliant Blue R250 dye, 10% (v/v)
glacial acetic acid, 40% (v/v) methanol in distilled water.
Destain solution: 40% (v/v) methanol, 10% (v/v) acetic acid in distilled water.
4.4.2. Separation of whole P. colletti venom by SEC
Lyophilised whole P. colletti venom was reconstituted in 200 mM NH4OAc (pH 7.0)
at a concentration of 10 mg/mL and loaded onto a Superdex200 10/300 size-exclusion column
(GE Healthcare, Illinois, US) coupled to an ÄKTA Pure FPLC system (GE Healthcare, Illinois,
US). The column was equilibrated with 200 mM NH4OAc (pH 7.0) prior to sample loading
(400 µL). Fractions (400 µL) were collected at a flow rate of 0.4 mL/min.
4.4.3. Separation of P. colletti PLA2 fractions by IEX
SEC fractions of interest were pooled, freeze-dried and reconstituted in Buffer A (20
mM tris-HCl, 1 mM EDTA, 0.02% NaN3 in water). The sample was loaded onto a MonoQ
5/50 GL anion-exchange column (GE Healthcare, Illinois, US) coupled to an ÄKTA Pure
FPLC system (GE Healthcare, Illinois, US). The column was equilibrated with Buffer A at a

74
flow rate of 1 mL/min and a linear gradient to 50% Buffer B (Buffer A containing 2 M NaCl)
was applied over 20 mL, followed by a 15 mL elution with Buffer B. Fractions (2 mL) were
collected and buffer-exchanged into 200 mM NH4OAc (pH 7.0) using Vivaspin 2
centrifugation units (GE Healthcare, Illinois, US) with a molecular weight cut-off of 3 kDa.
Samples were stored at -20 oC until required for use.
4.4.4. 1D SDS-PAGE
Venom fractions of interest were added to 3x reducing sample buffer (1:1 v/v) and
denatured at 95 oC for 15 min prior to loading onto a 4 – 15% Mini-Protean TGX tris-HCl
polyacrylamide gel (Bio-Rad, California, US). Gel electrophoresis was performed at 140 V and
400 mA for 1 h in 1x SDS tris-glycine running buffer. Precision Plus Protein Dual Colour
standards (Bio-Rad, California, US) were used as molecular weight markers. SDS-PAGE gels
were stained with Coomassie Brilliant blue staining solution for 30 min and destained with
Coomassie Brilliant blue destain solution for 3 h prior to imaging using an Imagescanner
densitometer (Amersham Biosciences, Amersham, UK).
4.4.5. IM-MS analysis of venom subunits
All mass spectra were obtained using a Synapt G1 HDMS quadrupole ion mobility
time-of-flight mass spectrometer (Waters, Manchester, UK). Protein samples were buffer-
exchanged into 200 mM NH4OAc prior to MS analysis. 4 µL of sample (10 µM) was
introduced into the instrument by nano-ESI using platinum-coated borosilicate capillaries that
were prepared in-house. The instrument conditions were set to preserve non-covalent
interactions as follows: m/z range, 500 – 6000; polarity, positive; capillary voltage, 1.5 kV;
sample cone voltage, 50 kV; extraction cone, 3 kV; source temperature, 50 oC; desolvation
temperature; 180 oC; trap collision energy, 30 V; transfer collision energy, 30 V; IMS wave
velocity, 300 m/s; IMS wave height, 7 V; IMS gas flow, 28 mL/min; backing pressure, 4.07
mbar. All native mass spectra were analysed using MassLynx software (version 4.1, Waters)
and IM data was analysed using Driftscope software (version 2.1, Waters). Drift times which
correspond to the identified charge states of interest were extracted from IM heatmaps and
further analysed in MassLynx. CCS calculations for proteins of interest were determined as
described previously [64], using equine cytochrome C and equine myoglobin as calibrants.
75
4.4.6. Denatured MS analysis
All denatured mass spectra were obtained using an Agilent 1260 LC system coupled to
an Agilent 6230 TOF mass spectrometer (Agilent Technologies, California, US) tuned over a
3200 m/z mass range. 2 µL of sample (5 µM) was directly injected into the instrument via the
LC auto sampler and eluted at a flow rate of 0.2 mL/min without chromatographic separation.
An isocratic elution of 50% Solvent B was used; Solvent A (0.1 % (v/v) FA in water) and
Solvent B (99.9% (v/v) ACN 0.1% (v/v) FA). The instrument conditions were set as follows:
m/z range, 500 – 3200; polarity, positive; capillary voltage, 3.5 kV; nozzle voltage, 2 kV; gas
temperature; 325 oC. Mass spectra were acquired under the control of MassHunter Workstation
software (version B.08.00, Agilent Technologies). MS data analysis was performed using
MassHunter Workstation software (version B.07.00, Agilent Technologies) where spectra were
summed over the time period of sample elution. For MS experiments under both reducing and
denatured conditions, the sample was first incubated with 1 mM DTT in 200 mM NH4OAc for
1 h prior to MS analysis by the workflow described above.
4.4.7. MS-based PLA2 enzymatic assay
This assay was adapted from [112] with minor modifications. Essentially, P. colletti
dimeric and monomeric PLA2 samples were concentrated using Vivaspin 2 centrifugation units
(GE Healthcare, Illinois, US) with a molecular weight cut-off of 3 kDa, and protein
concentration was determined using a bicinchoninic (BCA) assay (Thermo Fisher Scientific,
SA, Australia) according to the manufacturer’s protocol. PLA2 from honeybee venom (Apis
mellifera) (Sigma Aldrich, NSW, Australia) was used as a positive control. PLA2 samples
were prepared to 0.84 µM (i.e. 0.016 mg/mL, corresponding to 20 units/mL for the positive
control) in 200 mM NH4OAc (pH 7.0). 9 µM of lipid substrate (POPC 16:0/18:1) (Avanti Polar
Lipids, Alabama, US) was prepared in 5 mM NH4OAc (pH 7.0) dissolved in neat methanol.
PLA2 (30 µL) was added to the lipid substrate (30 µL), followed by mixing by pipetting and a
3 min incubation at room temperature. All samples were analysed using an Agilent 1260 LC
system coupled to an Agilent 6230 TOF mass spectrometer (Agilent Technologies, California,
US) tuned over a 1700 m/z mass range. 5 µL of sample was directly injected into the instrument
via the LC auto sampler and eluted at a flow rate of 1 mL/min without chromatographic
separation. A linear gradient of 70% to 100% Solvent B was applied over 1 min and maintained
76
for 2 min to ensure elution of both POPC substrate and LPC products; Solvent A (0.1% (v/v)
FA in water) and Solvent B (99.9% (v/v) ACN 0.1% (v/v) FA). The reaction was monitored
every 3 min for a 15 min duration.
MS instrument conditions were set as follows: m/z range, 100 – 2000; polarity, positive;
capillary voltage, 1.2 kV; nozzle voltage, 1 kV; gas temperature; 325 oC. Mass spectra were
acquired under the control of MassHunter Workstation software (version B.08.00, Agilent
Technologies). MS data analysis was performed using MassHunter Workstation software
(version B.07.00, Agilent Technologies) where spectra were summed over the time period of
sample elution and the error tolerance was set to 60 ppm. The extracted ion count intensities of
intact POPC substrate (760.6 m/z), LPC 18:1 (522.3 m/z), and LPC 16:0 (496.3 m/z) product
ions along with the corresponding adducted ions were summed at a given timepoint and the
assay was performed in technical triplicate.
77
~ Chapter 5 ~
Summary
5.1. Investigation of proteomic variations in the venoms of different N. scutatus
populations
A study on the proteomic variations in the venom compositions of various N. scutatus
from different geographical regions was conducted using a shotgun proteomics pipeline, where
age-matched male N. scutatus were selected from five locations: Franklin Island, Reevesby
Island, Melbourne, Mt Gambier, and Tasmania. 2D SDS-PAGE and a qualitative proteomic
analysis revealed N. scutatus venom to be generally diverse and abundant in PLA2 toxins. A
more quantitative analysis of the five venom proteomes further established the high degree of
proteomic diversity in the venoms across various populations. Significant variation in the
relative abundance of 3FTxs was the greatest distinction identified across the five venoms;
Melbourne and Mt Gambier N. scutatus venoms were noted to possess the highest proportions
of 3FTxs while very little to none were observed in the Franklin Island, Reevesby Island, and
Tasmanian venoms. The possibility of a diet prey-type influence was considered for the stark
distinction in 3FTx abundance as the N. scutatus on the two island populations (Franklin and
Reevesby Islands) were noted to consume a more bird-specialised diet. The similarity of the
Tasmanian venom proteome to that of the two island populations despite having different diets,
however, suggested other ecological factors are likely to contribute to the observed variations.
Considerable intra-population proteomic variations at an individual protein level were
observed in a more focussed quantitative proteomic comparison of Franklin Island and Mt
Gambier N. scutatus venoms. Despite certain distinctions in protein expression levels across
populations, these variations inferred intrinsic venom variabilities between N. scutatus
individuals. A distinct variability in the venom compositions of different N. scutatus
populations was captured in this study. The complexity implies the contribution of multiple
factors aside from the diet prey-types consumed by different N. scutatus populations, including
climate, seasonal, or intrinsic individual variabilities. This further emphasises the importance
of characterising proteomic variations in venoms in an ecological context. To establish a more
comprehensive picture, further experimentation with a larger sample size as well as integration
of the proteomic results with transcriptomics data will be pursued in future studies.
78
5.2. Higher-order structural characterisation of venom proteins from P.
colletti, N. melanoleuca, and B. arietans venoms
An integrated MS-based approach was used to explore the higher-order structures of
venom proteins from a repertoire of phylogenetically diverse yet medically significant venoms
from P. colletti, N. melanoleuca, and B. arietans. Emerging differences between the two elapid
venoms (P. colletti and N. melanoleuca) and the viperid venom (B. arietans) were captured
during separation of the whole venoms by SEC and SDS-PAGE; these differences which are a
good reflection of the phylogenetic distinctions between the venoms were further enhanced by
shotgun proteomics, revealing significant diversities in the three venom proteomes. The simple
and extremely PLA2-abundant proteomic profile of the P. colletti venom was revealed; the
more diverse, PLA2 and 3FTx-rich venom of N. melanoleuca as well as the significantly
different B. arietans venom proteome abundant in DIS, CTL, 3FTx and VEGF were also
catalogued.
A combination of proteomic and native MS analysis of high and intermediate mass
range venom fractions revealed a 117 kDa dimeric LAAO species in the P. colletti venom and
a 60 kDa CTL tetramer in the B. arietans venom for the first time by MS. Denatured MS studies
further confirmed the nature of the dimeric LAAO and the CTL tetramer to be non-covalent
and covalent, respectively. This study offered preliminary insight into the structures of protein
complexes by MS. Further structural studies can be built on the foundation that this MS-based
workflow has established; these may include further separation of the venom fractions to
explore other venom proteins of interest as well as a more detailed analysis of the structural
moieties that facilitate the protein oligomerisations observed here.
5.3. Structural and functional insight on PLA2s from P. colletti venom
Investigation of the higher-order structure and function of PLA2s as an important toxin
family was conducted using P. colletti venom as a model venom. Native IM-MS analysis of
purified P. colletti venom fractions revealed a variety of PLA2 isoforms, the majority of which
were found to be structurally monomeric ranging from 12.9 – 14.0 kDa and likely highly
modified with various PTMs. A 27.7 kDa PLA2 dimer was reported in P. colletti venom for
the first time by MS, and while further investigation is necessary to give finer, mechanistic
insights on the dimerization process, reducing denatured MS experiments supplementing the
79
native MS analysis confirmed the PLA2 dimer to be a covalently-linked species. These PLA2
species were also found to adopt a highly compact and relatively spherical geometry based on
CCS-derived calculations, which may be attributed to the highly disulphide-bonded structure
of these proteins.
The difference in the catalytic efficiencies of monomeric and dimeric PLA2 was further
explored using a MS-based PLA2 enzyme assay using a phospholipid substrate. Dimeric PLA2
demonstrated substantially greater bioactivity than the monomeric PLA2; the difference in
activity infers the importance of understanding oligomeric protein species, PLA2 in the case of
this study, in augmenting venom protein bioactivity. Further experimental optimisation to
acquire more accurate and absolute quantitative measurements in this assay is a goal for future
studies.
5.4. Concluding remarks
The work presented in this thesis demonstrates the implementation of MS-based
techniques, namely shotgun proteomics and native IM-MS, to investigate various structural
biological and ecological questions surrounding snake venoms from a fundamental protein
structure perspective. The findings here provide a good foundation for further MS-based
investigation of venom proteins and can hopefully contribute towards the combined
interdisciplinary effort to bridge the knowledge gap in our current proteomic and structural
understanding of venoms.
80
~ References ~
1. Chan, Y.S., et al., Snake venom toxins: toxicity and medicinal applications. Appl
Microbiol Biotechnol, 2016. 100(14): p. 6165-81.
2. Xiong, S. and C. Huang, Synergistic strategies of predominant toxins in snake venoms.
Toxicol Lett, 2018. 287: p. 142-154.
3. Lister, C., et al., Catch a tiger snake by its tail: differential toxicity, co-factor
dependence and antivenom efficacy in a procoagulant clade of Australian venomous
snakes. Comp Biochem Physiol C Toxicol Pharmacol, 2017. 202: p. 39-54.
4. Kularatne, S.A. and N. Senanayake, Venomous snake bites, scorpions, and spiders.
Handb Clin Neurol, 2014. 120: p. 987-1001.
5. Kang, T.S., et al., Enzymatic toxins from snake venom: structural characterization and
mechanism of catalysis. FEBS J, 2011. 278(23): p. 4544-76.
6. Doley, R. and R.M. Kini, Protein complexes in snake venom. Cell Mol Life Sci, 2009.
66(17): p. 2851-71.
7. McCleary, R.J. and R.M. Kini, Non-enzymatic proteins from snake venoms: a gold mine
of pharmacological tools and drug leads. Toxicon, 2013. 62: p. 56-74.
8. Chippaux, J.P., V. Williams, and J. White, Snake venom variability: methods of study,
results and interpretation Toxicon 1991. 29(11): p. 1279-1303.
9. Vaiyapuri, S., et al., Purification and functional characterisation of rhiminopeptidase
A, a novel aminopeptidase from the venom of Bitis gabonica rhinoceros. PLoS Negl
Trop Dis, 2010. 4(8): p. e796.
10. Hodgson, W.C. and G.K. Isbister, The application of toxins and venoms to
cardiovascular drug discovery. Curr Opin Pharmacol, 2009. 9(2): p. 173-176.
11. Oldrati, V., et al., Advances in venomics. Mol Biosyst, 2016. 12(12): p. 3530-3543.
12. Utkin, Y.N., Animal venom studies: Current benefits and future developments. World
J Biol Chem, 2015. 6(2): p. 28-33.
13. Guo, C., et al., Past decade study of snake venom L-amino acid oxidase. Toxicon, 2012.
60(3): p. 302-11.
14. Vogel, C.W. and D.C. Fritzinger, Cobra venom factor: Structure, function, and
humanization for therapeutic complement depletion. Toxicon, 2010. 56(7): p. 1198-222.
15. Kostiza, T. and J. Meier, Nerve growth factors from snake venoms: chemical properties,
mode of action and biological significance. Toxicon 1996. 34(7): p. 787-806.
16. Pung, Y.F., et al., Ohanin, a novel protein from king cobra venom: its cDNA and
genomic organization. Gene, 2006. 371(2): p. 246-56.
17. Richards, R., et al., Cloning and characterisation of novel cystatins from elapid snake
venom glands. Biochimie, 2011. 93(4): p. 659-68.
18. Wiezel, G.A., et al., Identification of hyaluronidase and phospholipase B in Lachesis
muta rhombeata venom. Toxicon, 2015. 107(Pt B): p. 359-68.
19. Cousin, X., et al., Acetylcholinesterase from Bungarus venom: a monomeric species
FEBS Lett, 1996. 387(2-3): p. 196-200.
20. Harvey, A.L., Toxins and drug discovery. Toxicon, 2014. 92: p. 193-200.
21. Calvete, J.J., Venomics: digging into the evolution of venomous systems and learning
to twist nature to fight pathology. J Proteomics, 2009. 72(2): p. 121-6.
22. Calvete, J.J., Snake venomics: from the inventory of toxins to biology. Toxicon, 2013.
75: p. 44-62.
23. Pennington, M.W., A. Czerwinski, and R.S. Norton, Peptide therapeutics from venom:
Current status and potential. Bioorg Med Chem, 2018. 26(10): p. 2738-2758.
81
24. Peigneur, S. and J. Tytgat, Toxins in Drug Discovery and Pharmacology. Toxins 2018.
10(3): p. 126-130.
25. Opie, L.H. and H. Kowolik, The Discovery of Captopril: From Large Animals to Small
Molecules. Cardiovasc Res, 1995. 30(1): p. 18 - 25.
26. Koh, C.Y. and R.M. Kini, From snake venom toxins to therapeutics--cardiovascular
examples. Toxicon, 2012. 59(4): p. 497-506.
27. Camargo, A.C., et al., Bradykinin-potentiating peptides: beyond Captopril. Toxicon,
2012. 59(4): p. 516-523.
28. Gasanov, S.E., R.K. Ragda, and E.D. Rael, Snake venom cytotoxins, phospholipase A2s,
and Zn2+-dependent metalloprotinases: mechanisms of action and pharmacological
relevance J Clin Toxicol 2014. 4(1): p. 1-34.
29. Samy, R.P., et al., Viperatoxin-II: A novel viper venom protein as an effective
bactericidal agent. FEBS Open Bio, 2015. 5: p. 928-941.
30. Diochot, S., et al., Black mamba venom peptides target acid-sensing ion channels to
abolish pain. Nature, 2012. 490(7421): p. 552-5.
31. Casewell, N.R., et al., Complex cocktails: the evolutionary novelty of venoms. Trends
Ecol Evol, 2013. 28(4): p. 219-29.
32. Sunagar, K., et al., Ecological venomics: how genomics, transcriptomics and
proteomics can shed new light on the ecology and evolution of venom. J Proteomics,
2016. 135: p. 62-72.
33. Glenn, J.L. and R. Straight, Mojave rattlesnake Crotalus scutulatus scutulatus venom:
variation in toxicity with geographical origin Toxicon 1978. 16: p. 81-84.
34. Calvete, J.J., et al., Snake venomics of the Central American Rattlesnake Crotalus simus
and the South American Crotalus durissus complex points to neurotoxicity as an
adaptive paedomorphic trend along Crotalus dispersal in South America. J Proteome
Res 2010. 9: p. 528-544.
35. Menezes, M.C., et al., Sex-based individual variation of snake venom proteome among
eighteen Bothrops jararaca siblings. Toxicon, 2006. 47(3): p. 304-312.
36. Andrade, D.V. and A.S. Abe, Relationsip of venom ontogeny and diet in Bothrops
Herpetologica 1999. 55(2): p. 200-204.
37. Pawlak, J., et al., Denmotoxin, a three-finger toxin from the colubrid snake Boiga
dendrophila (Mangrove Catsnake) with bird-specific activity. J Biol Chem, 2006.
281(39): p. 29030-41.
38. Kasturiratne, A., et al., The global burden of snakebite: a literature analysis and
modelling based on regional estimates of envenoming and deaths. PLoS Med, 2008.
5(11): p. e218.
39. Laustsen, A.H., Toxin synergism in snake venoms. Toxin Reviews, 2016. 35(3-4): p.
165-170.
40. Heim, M., L. Romer, and T. Scheibel, Hierarchical structures made of proteins. The
complex architecture of spider webs and their constituent silk proteins. Chem Soc Rev,
2010. 39(1): p. 156-164.
41. Andrade-Silva, D., et al., Proteomic and glycoproteomic profilings reveal that post-
translational modifications of toxins contribute to venom phenotype in snakes. J
Proteome Res, 2016. 15(8): p. 2658-75.
42. Degueldre, M., et al., In-depth glyco-peptidomics approach reveals unexpected
diversity of glycosylated peptides and atypical post-translational modifications in
Dendroaspis angusticeps snake venom. Int J Mol Sci, 2017. 18(11): p. 2453-66.
43. Santos, K.F., et al., Crystallization and preliminary x-ray crystallographic analysis of
the heterodimeric crotoxin complex and the isolated subunits crotapotin and
82
phospholipase A2. Acta Crystallogr Sect F Struct Biol Cryst Commun, 2007. 63(Pt 4):
p. 287-90.
44. Chiappinelli, V.A., kappa-bungarotoxin: a probe for the neuronal nicotinic receptor in
the avian ciliary ganglion Brain Research 1983. 277: p. 9-21.
45. Matsui, T., J. Hamako, and K. Titani, Structure and function of snake venom proteins
affecting platelet plug formation. Toxins 2010. 2(1): p. 10-23.
46. Pukala, T., Ion mobility-mass spectrometry: an added dimension for structural biology
ASBMB, 2015. 46(3): p. 5 - 8.
47. Betzel, C., et al., Modulation of phospholipase A2 activity generated by molecular
evolution Cell Mol Life Sci, 1999. 56: p. 384-397.
48. Loo, J.A., Studying noncovalent protein complexes by electrospray ionization mass
spectrometry Mass Spectrom Rev, 1998. 16: p. 1-23.
49. Politis, A., et al., Integrating ion mobility mass spectrometry with molecular modelling
to determine the architecture of multiprotein complexes. PLoS One, 2010. 5(8): p.
e12080.
50. Benesch, J.L.P., et al., Protein complexes in the gas phase: technology for structural
genomics and proteomics. Chem Rev, 2007. 107(8): p. 3544-67.
51. Hilton, G.R. and J.L. Benesch, Two decades of studying non-covalent biomolecular
assemblies by means of electrospray ionization mass spectrometry. J R Soc Interface,
2012. 9(70): p. 801-16.
52. Wilm, M., Principles of electrospray ionization MCP, 2011. 10(7): p. M111.009407.
53. Han, X., A. Aslanian, and J.R. Yates, 3rd, Mass spectrometry for proteomics. Curr Opin
Chem Biol, 2008. 12(5): p. 483-90.
54. Geiger, T., J. Cox, and M. Mann, Proteomics on an Orbitrap benchtop mass
spectrometer using all-ion fragmentation. MCP, 2010. 9(10): p. 2252-61.
55. Douglas, D.J., A.J. Frank, and D. Mao, Linear ion traps in mass spectrometry. Mass
Spectrom Rev, 2005. 24(1): p. 1-29.
56. Wells, J.M. and S.A. McLuckey, Collision‐induced dissociation (CID) of peptides and
proteins. Method enzymol, 2005. 402: p. 148-185.
57. Wang, M., et al., Label-free mass spectrometry-based protein quantification
technologies in proteomic analysis. Brief Funct Genomic Proteomic, 2008. 7(5): p.
329-39.
58. Olsen, J.V., S.E. Ong, and M. Mann, Trypsin cleaves exclusively C-terminal to arginine
and lysine residues. Mol Cell Proteomics, 2004. 3(6): p. 608-14.
59. Zhang, C. and Y. Liu, Retrieving quantitative information of histone PTMs by mass
spectrometry. Methods Enzymol, 2017. 586: p. 165-191.
60. Aebersold, R. and M. Mann, Mass spectrometry-based proteomics. Nature, 2003. 422:
p. 198-207.
61. Chernushevich, I.V., A.V. Loboda, and B.A. Thomson, An introduction to quadrupole-
time-of-flight mass spectrometry. J Mass Spectrom, 2001. 36(8): p. 849-65.
62. Kanu, A.B., et al., Ion mobility-mass spectrometry. J Mass Spectrom, 2008. 43(1): p.
1-22.
63. Uetrecht, C., et al., Ion mobility mass spectrometry of proteins and protein assemblies.
Chem Soc Rev, 2010. 39(5): p. 1633-55.
64. Ruotolo, B.T., et al., Ion mobility-mass spectrometry analysis of large protein
complexes. Nat Protoc, 2008. 3(7): p. 1139-52.
65. Ben-Nissan, G. and M. Sharon, The application of ion-mobility mass spectrometry for
structure/function investigation of protein complexes. Curr Opin Chem Biol, 2018. 42:
p. 25-33.
83
66. Aquilina, J.A., The major toxin from the Australian common brown snake is a hexamer
with unusual gas-phase dissociation properties. Proteins, 2009. 75(2): p. 478-85.
67. Harrison, J.A. and J.A. Aquilina, Insights into the subunit arrangement and diversity of
paradoxin and taipoxin. Toxicon, 2016. 112: p. 45-50.
68. Shine, R., Ecological comparisons of island and mianland populations of Australian
tiger snakes Herpetologica, 1987. 43(2): p. 233-240.
69. Schwaner, T.D. and S.D. Sarre, Body size of tiger snakes in Southern Australia, with
particular reference to Notechis ater serventyi (Elapidae) on Chappell Island J
Herpetol 1988. 22(1): p. 24-33.
70. Schwaner, T.D. and S.D. Sarre, Body size and sexual dimorphism in mainland and
island tiger snakes. J Herpetol, 1990. 24(3): p. 320-322.
71. Aubret, F. and R. Shine, Rapid prey-induced shift in body size in an isolated snake
population (Notechis scutatus, Elapidae). Austral Ecology, 2007. 32(8): p. 889-899.
72. Keogh, J.S., I.A.W. Scott, and C. Hayes, Rapid and repeated origin of insular gigantism
and dwarfism in Australian tiger snakes Evolution 2005. 59(1): p. 226-233.
73. Fearn, S., J. Dowde, and D.F. Trembath, Body size and trophic divergence of two large
sympatric elapid snakes (Notechis scutatus and Austrelaps superbus)
(Serpentes:Elapidae) in Tasmania. Aust J Zool 2012. 60(3): p. 159-64.
74. Birrell, G.W., et al., The diversity of bioactive proteins in Australian snake venoms
MCP, 2007. 6(6): p. 973-986.
75. Tan, C.H., K.Y. Tan, and N.H. Tan, Revisiting Notechis scutatus venom: on shotgun
proteomics and neutralization by the "bivalent" sea snake antivenom. J Proteomics,
2016. 144: p. 33-38.
76. Cox, J. and M. Mann, MaxQuant enables high peptide identification rates,
individualized p.p.b.-range mass accuracies and proteome-wide protein quantification.
Nat Biotechnol, 2008. 26(12): p. 1367-72.
77. Cox, J., et al., Accurate proteome-wide label-free quantification by delayed
normalization and maximal peptide ratio extraction, termed MaxLFQ. MCP, 2014.
13(9): p. 2513-26.
78. Lomonte, B. and J.J. Calvete, Strategies in 'snake venomics' aiming at an integrative
view of compositional, functional, and immunological characteristics of venoms. J
Venom Anim Toxins Incl Trop Dis, 2017. 23: p. 26-38.
79. Inc., B.S., PEAKS X user manual 2018.
80. Oswald, R.E., et al., Solution structure of neuronal Bungarotoxin determined by two-
dimensional NMR spectroscopy: sequence-specific assignments, secondary structure,
and dimer formation Biochemistry 1991. 30(20): p. 4901-9.
81. Osipov, A.V., et al., Dimeric alpha-cobratoxin x-ray structure: localization of
intermolecular disulfides and possible mode of binding to nicotinic acetylcholine
receptors. J Biol Chem, 2012. 287(9): p. 6725-34.
82. Tasoulis, T. and G.K. Isbister, A review and database of snake venom proteomes.
Toxins (Basel), 2017. 9(9): p. 290-313.
83. Walker, J.R., et al., X-ray crystal structure of a galactose-specific C-type lectin
possessing a novel decameric quaternary structure Biochemistry 2004. 43(13): p.
3783-92.
84. Politis, A. and C. Schmidt, Structural characterisation of medically relevant protein
assemblies by integrating mass spectrometry with computational modelling. J
Proteomics, 2018. 175: p. 34-41.
85. Park, A.Y., et al., A single subunit directs the assembly of the Escherichia coli DNA
sliding clamp loader. Structure, 2010. 18(3): p. 285-92.
84
86. Uetrecht, C., et al., Stability and shape of hepatitis B virus capsids in vacuo. Angew
Chem Int Ed Engl, 2008. 47(33): p. 6247-51.
87. Johnston, C.I., et al., The Australian snakebite project, 2005-2015 (ASP-20). Med J
Aust, 2017. 207(3): p. 119-125.
88. Isbister, G.K., et al., Collett's snake (Pseudechis colletti) envenoming in snake handlers.
QJM, 2006. 99(2): p. 109-15.
89. Reeks, T., et al., Deep venomics of the Pseudonaja genus reveals inter- and intra-
specific variation. J Proteomics, 2016. 133: p. 20-32.
90. Georgieva, D., et al., Protein profile analysis of two Australian snake venoms by one-
dimensional gel electrophoresis and MS/MS experiments. Curr Med Chem, 2017.
24(17): p. 1892-1908.
91. Lauridsen, L.P., et al., Exploring the venom of the forest cobra snake: toxicovenomics
and antivenom profiling of Naja melanoleuca. J Proteomics, 2017. 150: p. 98-108.
92. Shine, R., et al., Ecology of cobras from southern Africa. J Zool 2007. 272(2): p. 183-
193.
93. Currier, R.B., et al., Intra-specific variation in venom of the African puff adder (Bitis
arietans): differential expression and activity of snake venom metalloproteinases
(SVMPs). Toxicon, 2010. 55(4): p. 864-73.
94. Fasoli, E., et al., Exploring the venom proteome of the African puff adder, Bitis arietans,
using a combinatorial peptide ligand library approach at different pHs. J Proteomics,
2010. 73(5): p. 932-42.
95. Warrell, D.A., L.D. Ormerod, and N.M. Davidson, Bites by puff-adder (Bitis arietans)
in Nigeria, and value of antivenom. BMJ, 1975. 4(5998): p. 697 - 700.
96. Juarez, P., et al., Molecular cloning of disintegrin-like transcript BA-5A from a Bitis
arietans venom gland cDNA library: a putative intermediate in the evolution of the long-
chain disintegrin bitistatin. J Mol Evol, 2006. 63(1): p. 142-52.
97. Ishihama, Y., et al., Exponentially modified protein abundance index (emPAI) for
estimation of absolute protein amount in proteomics by the number of sequenced
peptides per protein. MCP, 2005. 4(9): p. 1265-72.
98. Gutierrez, J.M. and B. Lomonte, Phospholipase A2: unveiling the secrets of a
functionally versatile group of snake venom toxins. Toxicon, 2013. 62: p. 27-39.
99. Dubovskii, P.V. and Y.N. Utkin, Cobra cytotoxins: structural organization and
antibacterial activity Acta Naturae 2014. 6(3): p. 11-18.
100. Paixao-Cavalcante, D., et al., African adders: partial characterization of snake venoms
from three Bitis species of medical importance and their neutralization by experimental
equine antivenoms. PLoS Negl Trop Dis, 2015. 9(2): p. 1 - 18.
101. Clemetson, K.J., Snaclecs (snake C-type lectins) that inhibit or activate platelets by
binding to receptors. Toxicon, 2010. 56(7): p. 1236-46.
102. Osipov, A.V., et al., Naturally occurring disulfide-bound dimers of three-fingered
toxins: a paradigm for biological activity diversification. J Biol Chem, 2008. 283(21):
p. 14571-80.
103. Melani, R.D., et al., Mapping proteoforms and protein complexes from king cobra
venom using both denaturing and native top-down proteomics. Mol Cell Proteomics,
2016. 15(7): p. 2423-34.
104. Harris, J.B. and T. Scott-Davey, Secreted phospholipase A2 of snake venoms: effects on
the peripheral neuromuscular system with comments on the role of phospholipase A2
in disorders of the CNS and their uses in industry. Toxins (Basel), 2013. 5(12): p. 2533-
71.
85
105. O'Brien, J., et al., Engineering the protein corona of a synthetic polymer nanoparticle
for broad-spectrum sequestration and neutralization of venomous biomacromolecules.
J Am Chem Soc, 2016. 138(51): p. 16604-07.
106. Cendron, L., et al., Structural analysis of trimeric phospholipase A2 neurotoxin from
the Australian taipan snake venom. FEBS J, 2012. 279(17): p. 3121-35.
107. Kini, R.M., Excitement ahead: structure, function and mechanism of snake venom
phospholipase A2 enzymes. Toxicon, 2003. 42(8): p. 827-40.
108. Kwong, P.D., et al., Structure of beta2-bungarotoxin: potassium channel binding by
kunitz modules and targeted phospholipase action Structure, 1995. 3(10): p. 1109-19.
109. Bush, M.F., et al., Collision cross sections of proteins and their complexes: a
calibration framework and database for gas-phase structural biology Anal Chem 2010.
82(22): p. 9557-9565.
110. Dennis, E.A., et al., Phospholipase A2 enzymes: physical structure, biological function,
disease implication, chemical inhibition, and therapeutic intervention. Chem Rev, 2011.
111(10): p. 6130-85.
111. Bosnjak, I., et al., Occurrence of protein disulfide bonds in different domains of life: a
comparison of proteins from the Protein Data Bank. Protein Eng Des Sel, 2014. 27(3):
p. 65-72.
112. Hamilton, B.R., et al., Mapping enzyme activity on tissue by functional-mass
spectrometry imaging. Angew Chem Int Ed 2019. 10.1002/anie.201911390.
113. Sani, M.A., J.D. Gehman, and F. Separovic, Lipid matrix plays a role in Abeta fibril
kinetics and morphology. FEBS Lett, 2011. 585(5): p. 749-54.
114. Dominguez, L., et al., Impact of membrane lipid composition on the structure and
stability of the transmembrane domain of amyloid precursor protein. Proc Natl Acad
Sci U S A, 2016. 113(36): p. E5281-7.
115. Saikia, D., et al., Differential mode of attack on membrane phospholipids by an acidic
phospholipase A(2) (RVVA-PLA(2)-I) from Daboia russelli venom. Biochim Biophys
Acta, 2012. 1818(12): p. 3149-57.
116. Napias, C. and E. Heilbronn, Phospholipase A2 activity and substrate specificity of
snake venom presynaptic toxins Biochemistry 1980. 19(6): p. 1146-51.
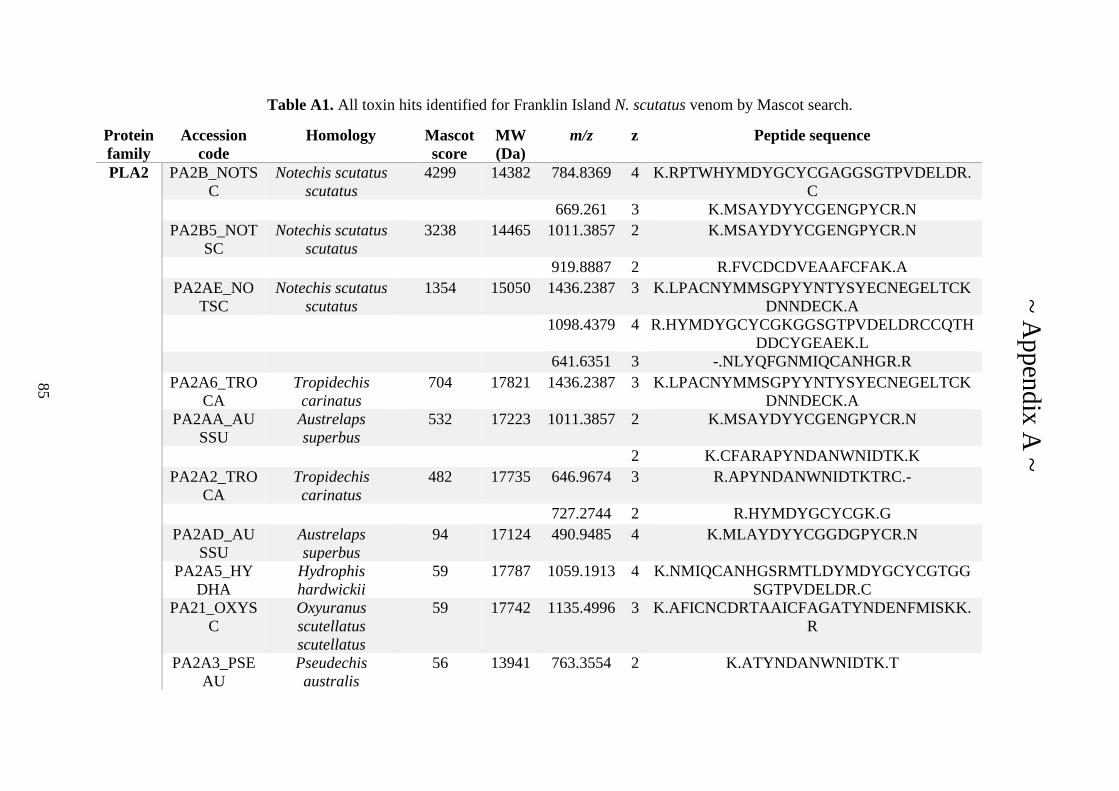
85
Table A1. All toxin hits identified for Franklin Island N. scutatus venom by Mascot search.
Protein
family
Accession
code
Homology Mascot
score
MW
(Da)
m/z z Peptide sequence
PLA2 PA2B_NOTS
C
Notechis scutatus
scutatus
4299 14382 784.8369 4 K.RPTWHYMDYGCYCGAGGSGTPVDELDR.
C 669.261 3 K.MSAYDYYCGENGPYCR.N
PA2B5_NOT
SC
Notechis scutatus
scutatus
3238 14465 1011.3857 2 K.MSAYDYYCGENGPYCR.N
919.8887 2 R.FVCDCDVEAAFCFAK.A
PA2AE_NO
TSC
Notechis scutatus
scutatus
1354 15050 1436.2387 3 K.LPACNYMMSGPYYNTYSYECNEGELTCK
DNNDECK.A 1098.4379 4 R.HYMDYGCYCGKGGSGTPVDELDRCCQTH
DDCYGEAEK.L 641.6351 3 -.NLYQFGNMIQCANHGR.R
PA2A6_TRO
CA
Tropidechis
carinatus
704 17821 1436.2387 3 K.LPACNYMMSGPYYNTYSYECNEGELTCK
DNNDECK.A PA2AA_AU
SSU
Austrelaps
superbus
532 17223 1011.3857 2 K.MSAYDYYCGENGPYCR.N
2 K.CFARAPYNDANWNIDTK.K
PA2A2_TRO
CA
Tropidechis
carinatus
482 17735 646.9674 3 R.APYNDANWNIDTKTRC.-
727.2744 2 R.HYMDYGCYCGK.G
PA2AD_AU
SSU
Austrelaps
superbus
94 17124 490.9485 4 K.MLAYDYYCGGDGPYCR.N
PA2A5_HY
DHA
Hydrophis
hardwickii
59 17787 1059.1913 4 K.NMIQCANHGSRMTLDYMDYGCYCGTGG
SGTPVDELDR.C PA21_OXYS
C
Oxyuranus
scutellatus
scutellatus
59 17742 1135.4996 3 K.AFICNCDRTAAICFAGATYNDENFMISKK.
R
PA2A3_PSE
AU
Pseudechis
australis
56 13941 763.3554 2 K.ATYNDANWNIDTK.T
~ A
ppen
dix
A ~
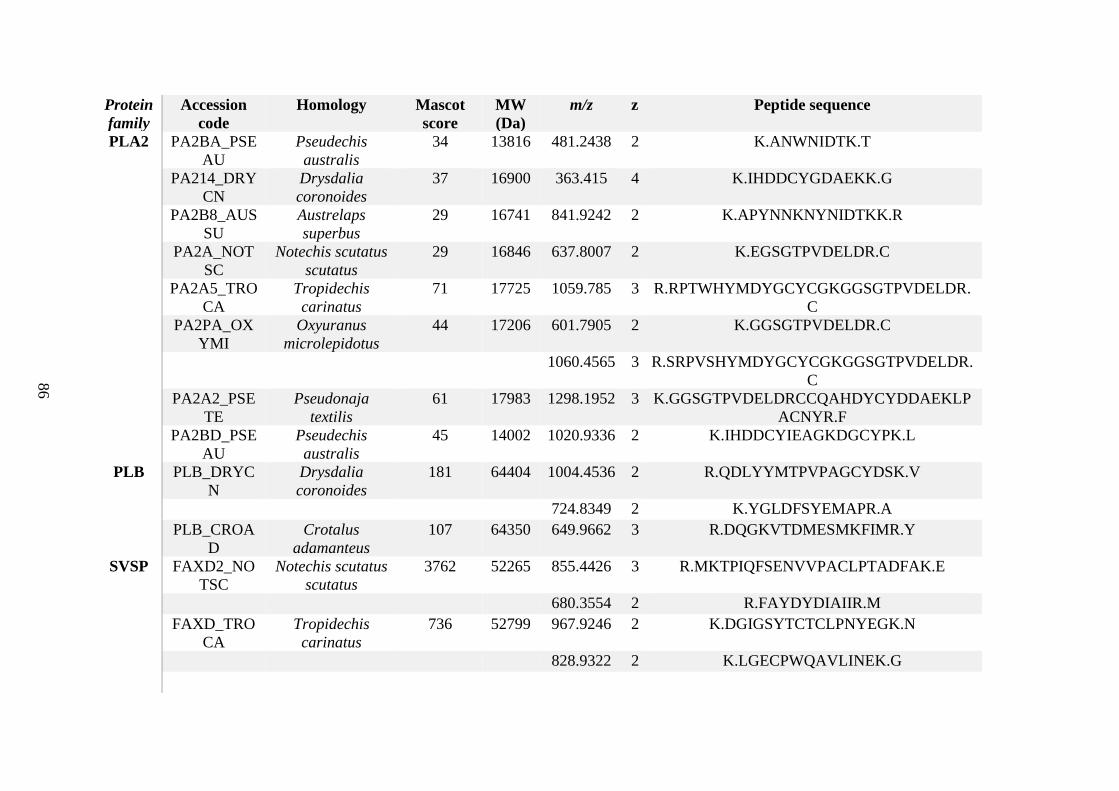
86
Protein
family
Accession
code
Homology Mascot
score
MW
(Da)
m/z z Peptide sequence
PLA2 PA2BA_PSE
AU
Pseudechis
australis
34 13816 481.2438 2 K.ANWNIDTK.T
PA214_DRY
CN
Drysdalia
coronoides
37 16900 363.415 4 K.IHDDCYGDAEKK.G
PA2B8_AUS
SU
Austrelaps
superbus
29 16741 841.9242 2 K.APYNNKNYNIDTKK.R
PA2A_NOT
SC
Notechis scutatus
scutatus
29 16846 637.8007 2 K.EGSGTPVDELDR.C
PA2A5_TRO
CA
Tropidechis
carinatus
71 17725 1059.785 3 R.RPTWHYMDYGCYCGKGGSGTPVDELDR.
C PA2PA_OX
YMI
Oxyuranus
microlepidotus
44 17206 601.7905 2 K.GGSGTPVDELDR.C
1060.4565 3 R.SRPVSHYMDYGCYCGKGGSGTPVDELDR.
C PA2A2_PSE
TE
Pseudonaja
textilis
61 17983 1298.1952 3 K.GGSGTPVDELDRCCQAHDYCYDDAEKLP
ACNYR.F PA2BD_PSE
AU
Pseudechis
australis
45 14002 1020.9336 2 K.IHDDCYIEAGKDGCYPK.L
PLB PLB_DRYC
N
Drysdalia
coronoides
181 64404 1004.4536 2 R.QDLYYMTPVPAGCYDSK.V
724.8349 2 K.YGLDFSYEMAPR.A
PLB_CROA
D
Crotalus
adamanteus
107 64350 649.9662 3 R.DQGKVTDMESMKFIMR.Y
SVSP FAXD2_NO
TSC
Notechis scutatus
scutatus
3762 52265 855.4426 3 R.MKTPIQFSENVVPACLPTADFAK.E
680.3554 2 R.FAYDYDIAIIR.M
FAXD_TRO
CA
Tropidechis
carinatus
736 52799 967.9246 2 K.DGIGSYTCTCLPNYEGK.N
828.9322 2 K.LGECPWQAVLINEK.G
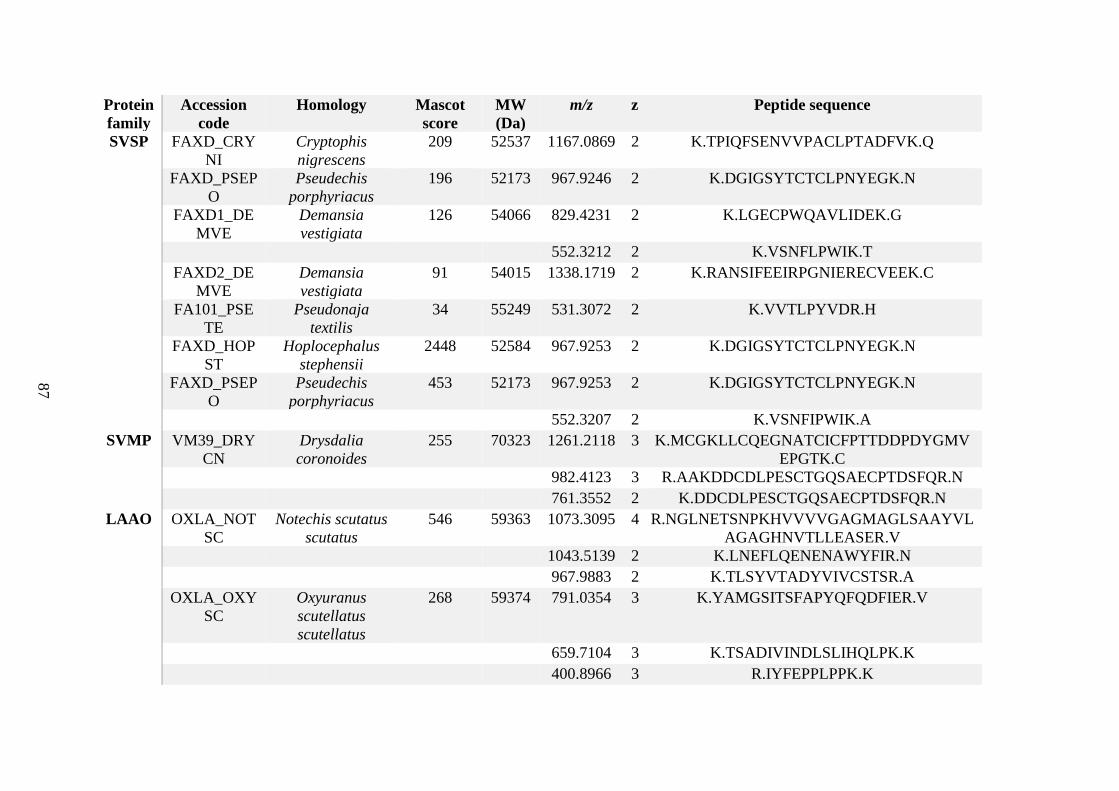
87
Protein
family
Accession
code
Homology Mascot
score
MW
(Da)
m/z z Peptide sequence
SVSP FAXD_CRY
NI
Cryptophis
nigrescens
209 52537 1167.0869 2 K.TPIQFSENVVPACLPTADFVK.Q
FAXD_PSEP
O
Pseudechis
porphyriacus
196 52173 967.9246 2 K.DGIGSYTCTCLPNYEGK.N
FAXD1_DE
MVE
Demansia
vestigiata
126 54066 829.4231 2 K.LGECPWQAVLIDEK.G
552.3212 2 K.VSNFLPWIK.T
FAXD2_DE
MVE
Demansia
vestigiata
91 54015 1338.1719 2 K.RANSIFEEIRPGNIERECVEEK.C
FA101_PSE
TE
Pseudonaja
textilis
34 55249 531.3072 2 K.VVTLPYVDR.H
FAXD_HOP
ST
Hoplocephalus
stephensii
2448 52584 967.9253 2 K.DGIGSYTCTCLPNYEGK.N
FAXD_PSEP
O
Pseudechis
porphyriacus
453 52173 967.9253 2 K.DGIGSYTCTCLPNYEGK.N
552.3207 2 K.VSNFIPWIK.A
SVMP VM39_DRY
CN
Drysdalia
coronoides
255 70323 1261.2118 3 K.MCGKLLCQEGNATCICFPTTDDPDYGMV
EPGTK.C 982.4123 3 R.AAKDDCDLPESCTGQSAECPTDSFQR.N 761.3552 2 K.DDCDLPESCTGQSAECPTDSFQR.N
LAAO OXLA_NOT
SC
Notechis scutatus
scutatus
546 59363 1073.3095 4 R.NGLNETSNPKHVVVVGAGMAGLSAAYVL
AGAGHNVTLLEASER.V 1043.5139 2 K.LNEFLQENENAWYFIR.N 967.9883 2 K.TLSYVTADYVIVCSTSR.A
OXLA_OXY
SC
Oxyuranus
scutellatus
scutellatus
268 59374 791.0354 3 K.YAMGSITSFAPYQFQDFIER.V
659.7104 3 K.TSADIVINDLSLIHQLPK.K 400.8966 3 R.IYFEPPLPPK.K
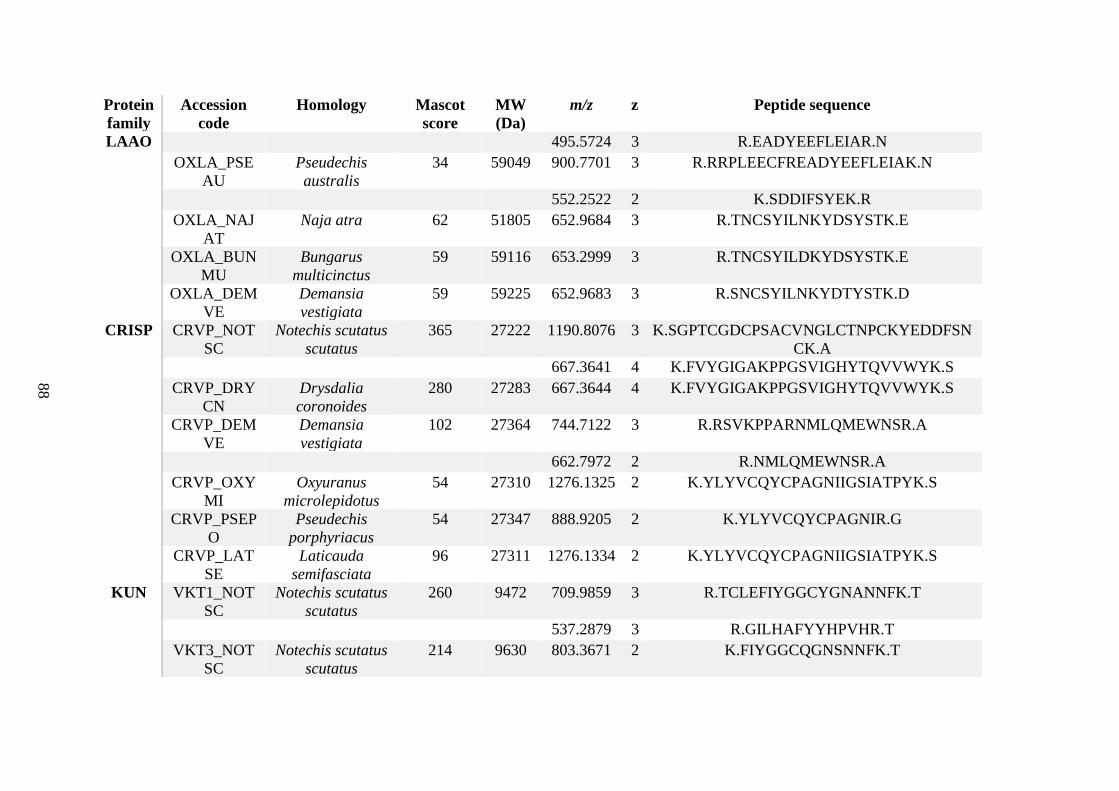
88
Protein
family
Accession
code
Homology Mascot
score
MW
(Da)
m/z z Peptide sequence
LAAO
495.5724 3 R.EADYEEFLEIAR.N OXLA_PSE
AU
Pseudechis
australis
34 59049 900.7701 3 R.RRPLEECFREADYEEFLEIAK.N
552.2522 2 K.SDDIFSYEK.R
OXLA_NAJ
AT
Naja atra 62 51805 652.9684 3 R.TNCSYILNKYDSYSTK.E
OXLA_BUN
MU
Bungarus
multicinctus
59 59116 653.2999 3 R.TNCSYILDKYDSYSTK.E
OXLA_DEM
VE
Demansia
vestigiata
59 59225 652.9683 3 R.SNCSYILNKYDTYSTK.D
CRISP CRVP_NOT
SC
Notechis scutatus
scutatus
365 27222 1190.8076 3 K.SGPTCGDCPSACVNGLCTNPCKYEDDFSN
CK.A 667.3641 4 K.FVYGIGAKPPGSVIGHYTQVVWYK.S
CRVP_DRY
CN
Drysdalia
coronoides
280 27283 667.3644 4 K.FVYGIGAKPPGSVIGHYTQVVWYK.S
CRVP_DEM
VE
Demansia
vestigiata
102 27364 744.7122 3 R.RSVKPPARNMLQMEWNSR.A
662.7972 2 R.NMLQMEWNSR.A
CRVP_OXY
MI
Oxyuranus
microlepidotus
54 27310 1276.1325 2 K.YLYVCQYCPAGNIIGSIATPYK.S
CRVP_PSEP
O
Pseudechis
porphyriacus
54 27347 888.9205 2 K.YLYVCQYCPAGNIR.G
CRVP_LAT
SE
Laticauda
semifasciata
96 27311 1276.1334 2 K.YLYVCQYCPAGNIIGSIATPYK.S
KUN VKT1_NOT
SC
Notechis scutatus
scutatus
260 9472 709.9859 3 R.TCLEFIYGGCYGNANNFK.T
537.2879 3 R.GILHAFYYHPVHR.T
VKT3_NOT
SC
Notechis scutatus
scutatus
214 9630 803.3671 2 K.FIYGGCQGNSNNFK.T
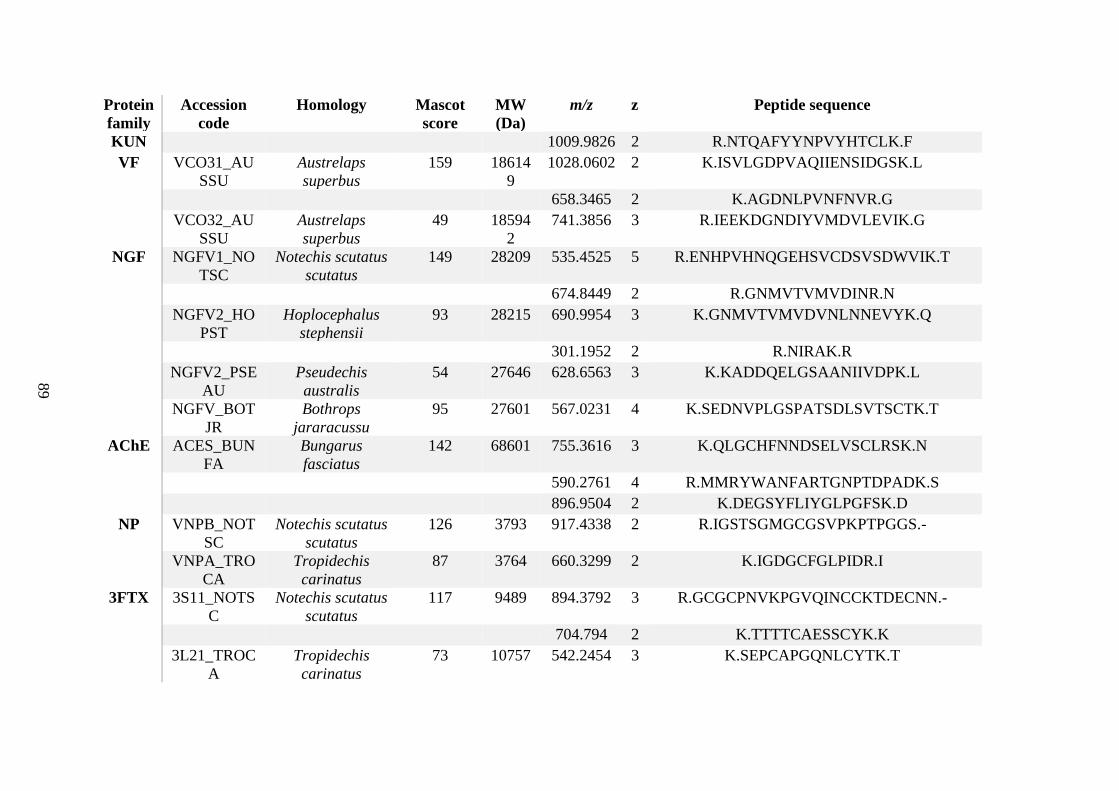
89
Protein
family
Accession
code
Homology Mascot
score
MW
(Da)
m/z z Peptide sequence
KUN
1009.9826 2 R.NTQAFYYNPVYHTCLK.F
VF VCO31_AU
SSU
Austrelaps
superbus
159 18614
9
1028.0602 2 K.ISVLGDPVAQIIENSIDGSK.L
658.3465 2 K.AGDNLPVNFNVR.G
VCO32_AU
SSU
Austrelaps
superbus
49 18594
2
741.3856 3 R.IEEKDGNDIYVMDVLEVIK.G
NGF NGFV1_NO
TSC
Notechis scutatus
scutatus
149 28209 535.4525 5 R.ENHPVHNQGEHSVCDSVSDWVIK.T
674.8449 2 R.GNMVTVMVDINR.N
NGFV2_HO
PST
Hoplocephalus
stephensii
93 28215 690.9954 3 K.GNMVTVMVDVNLNNEVYK.Q
301.1952 2 R.NIRAK.R
NGFV2_PSE
AU
Pseudechis
australis
54 27646 628.6563 3 K.KADDQELGSAANIIVDPK.L
NGFV_BOT
JR
Bothrops
jararacussu
95 27601 567.0231 4 K.SEDNVPLGSPATSDLSVTSCTK.T
AChE ACES_BUN
FA
Bungarus
fasciatus
142 68601 755.3616 3 K.QLGCHFNNDSELVSCLRSK.N
590.2761 4 R.MMRYWANFARTGNPTDPADK.S 896.9504 2 K.DEGSYFLIYGLPGFSK.D
NP VNPB_NOT
SC
Notechis scutatus
scutatus
126 3793 917.4338 2 R.IGSTSGMGCGSVPKPTPGGS.-
VNPA_TRO
CA
Tropidechis
carinatus
87 3764 660.3299 2 K.IGDGCFGLPIDR.I
3FTX 3S11_NOTS
C
Notechis scutatus
scutatus
117 9489 894.3792 3 R.GCGCPNVKPGVQINCCKTDECNN.-
704.794 2 K.TTTTCAESSCYK.K
3L21_TROC
A
Tropidechis
carinatus
73 10757 542.2454 3 K.SEPCAPGQNLCYTK.T
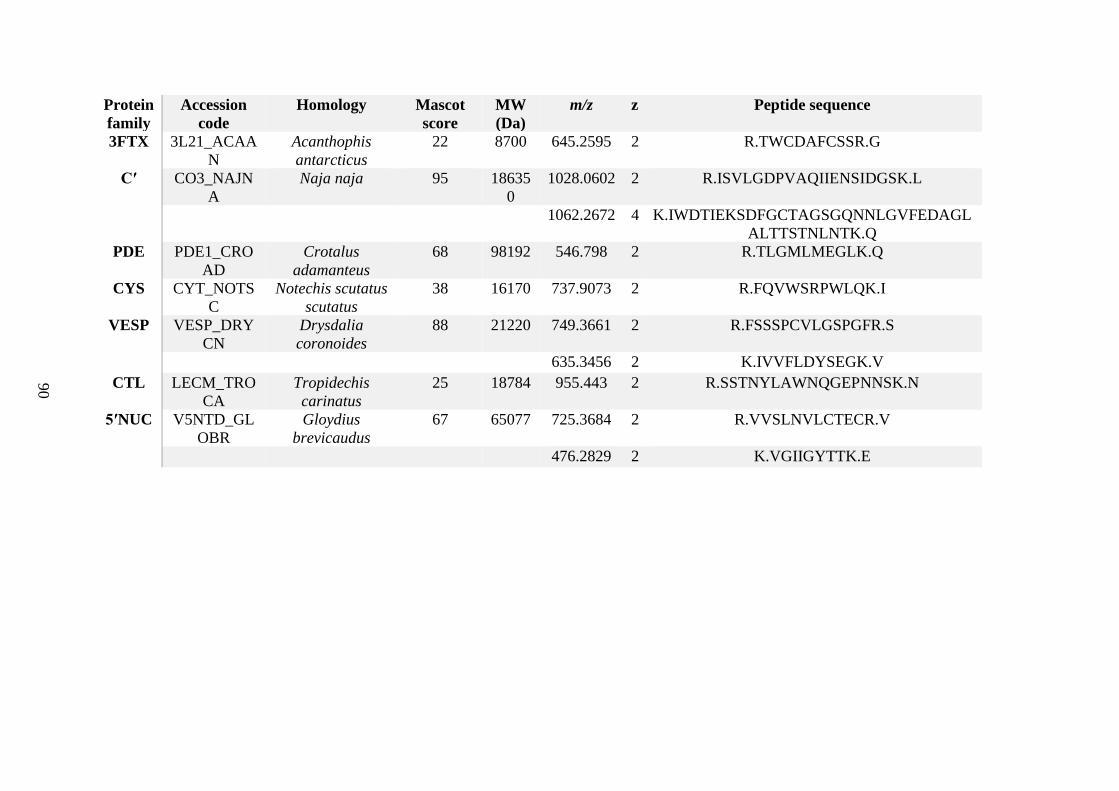
90
Protein
family
Accession
code
Homology Mascot
score
MW
(Da)
m/z z Peptide sequence
3FTX 3L21_ACAA
N
Acanthophis
antarcticus
22 8700 645.2595 2 R.TWCDAFCSSR.G
Cʹ CO3_NAJN
A
Naja naja 95 18635
0
1028.0602 2 R.ISVLGDPVAQIIENSIDGSK.L
1062.2672 4 K.IWDTIEKSDFGCTAGSGQNNLGVFEDAGL
ALTTSTNLNTK.Q
PDE PDE1_CRO
AD
Crotalus
adamanteus
68 98192 546.798 2 R.TLGMLMEGLK.Q
CYS CYT_NOTS
C
Notechis scutatus
scutatus
38 16170 737.9073 2 R.FQVWSRPWLQK.I
VESP VESP_DRY
CN
Drysdalia
coronoides
88 21220 749.3661 2 R.FSSSPCVLGSPGFR.S
635.3456 2 K.IVVFLDYSEGK.V
CTL LECM_TRO
CA
Tropidechis
carinatus
25 18784 955.443 2 R.SSTNYLAWNQGEPNNSK.N
5ʹNUC V5NTD_GL
OBR
Gloydius
brevicaudus
67 65077 725.3684 2 R.VVSLNVLCTECR.V
476.2829 2 K.VGIIGYTTK.E
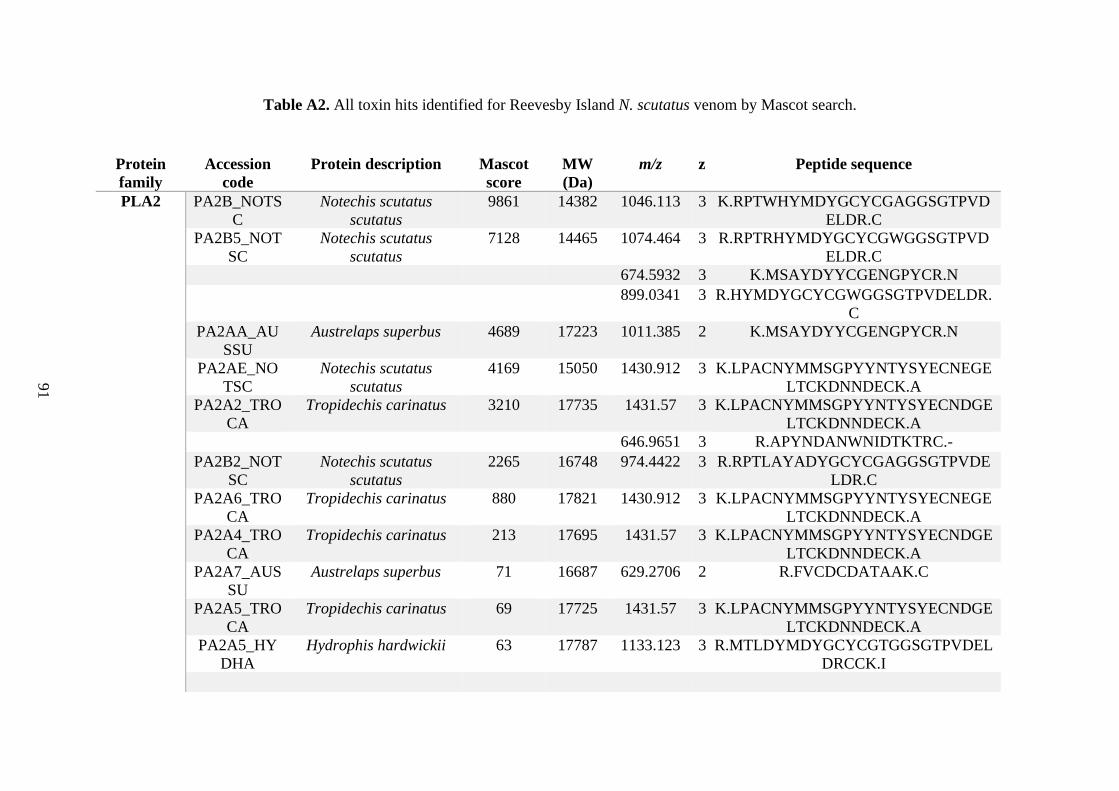
91
Table A2. All toxin hits identified for Reevesby Island N. scutatus venom by Mascot search.
Protein
family
Accession
code
Protein description Mascot
score
MW
(Da)
m/z z Peptide sequence
PLA2 PA2B_NOTS
C
Notechis scutatus
scutatus
9861 14382 1046.113 3 K.RPTWHYMDYGCYCGAGGSGTPVD
ELDR.C PA2B5_NOT
SC
Notechis scutatus
scutatus
7128 14465 1074.464 3 R.RPTRHYMDYGCYCGWGGSGTPVD
ELDR.C 674.5932 3 K.MSAYDYYCGENGPYCR.N 899.0341 3 R.HYMDYGCYCGWGGSGTPVDELDR.
C PA2AA_AU
SSU
Austrelaps superbus 4689 17223 1011.385 2 K.MSAYDYYCGENGPYCR.N
PA2AE_NO
TSC
Notechis scutatus
scutatus
4169 15050 1430.912 3 K.LPACNYMMSGPYYNTYSYECNEGE
LTCKDNNDECK.A PA2A2_TRO
CA
Tropidechis carinatus 3210 17735 1431.57 3 K.LPACNYMMSGPYYNTYSYECNDGE
LTCKDNNDECK.A 646.9651 3 R.APYNDANWNIDTKTRC.-
PA2B2_NOT
SC
Notechis scutatus
scutatus
2265 16748 974.4422 3 R.RPTLAYADYGCYCGAGGSGTPVDE
LDR.C PA2A6_TRO
CA
Tropidechis carinatus 880 17821 1430.912 3 K.LPACNYMMSGPYYNTYSYECNEGE
LTCKDNNDECK.A PA2A4_TRO
CA
Tropidechis carinatus 213 17695 1431.57 3 K.LPACNYMMSGPYYNTYSYECNDGE
LTCKDNNDECK.A PA2A7_AUS
SU
Austrelaps superbus 71 16687 629.2706 2 R.FVCDCDATAAK.C
PA2A5_TRO
CA
Tropidechis carinatus 69 17725 1431.57 3 K.LPACNYMMSGPYYNTYSYECNDGE
LTCKDNNDECK.A PA2A5_HY
DHA
Hydrophis hardwickii 63 17787 1133.123 3 R.MTLDYMDYGCYCGTGGSGTPVDEL
DRCCK.I
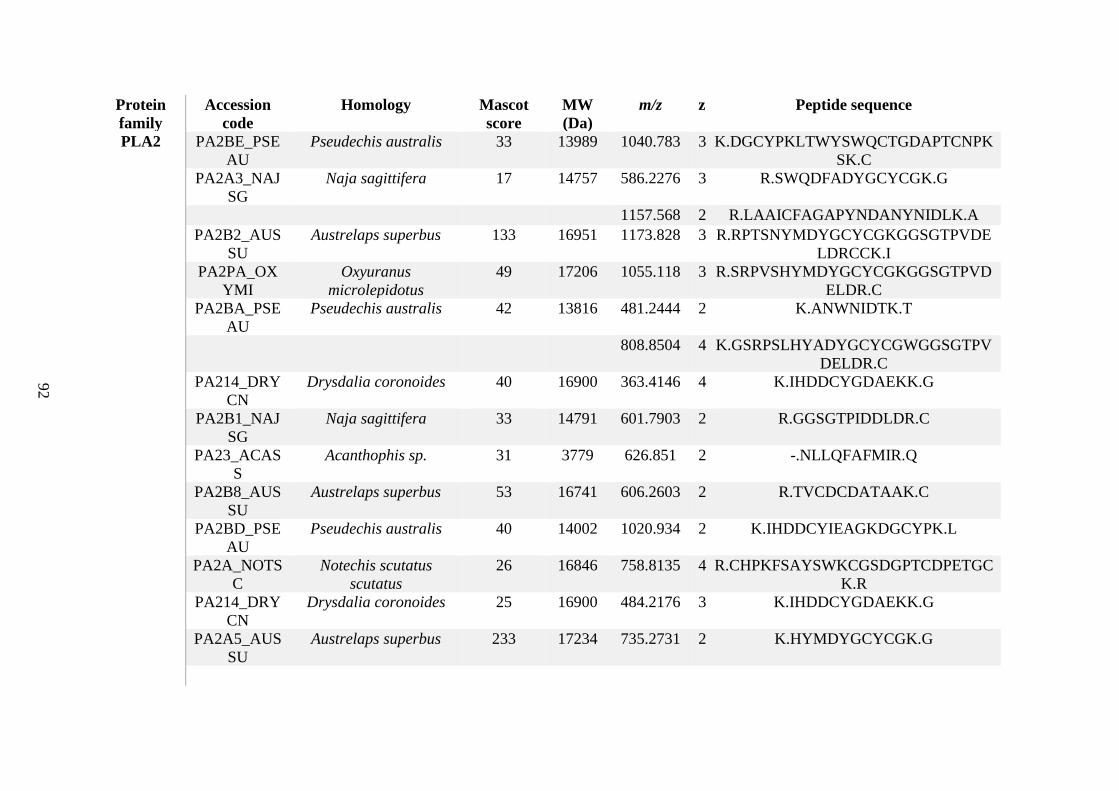
92
Protein
family
Accession
code
Homology Mascot
score
MW
(Da)
m/z z Peptide sequence
PLA2 PA2BE_PSE
AU
Pseudechis australis 33 13989 1040.783 3 K.DGCYPKLTWYSWQCTGDAPTCNPK
SK.C PA2A3_NAJ
SG
Naja sagittifera 17 14757 586.2276 3 R.SWQDFADYGCYCGK.G
1157.568 2 R.LAAICFAGAPYNDANYNIDLK.A
PA2B2_AUS
SU
Austrelaps superbus 133 16951 1173.828 3 R.RPTSNYMDYGCYCGKGGSGTPVDE
LDRCCK.I PA2PA_OX
YMI
Oxyuranus
microlepidotus
49 17206 1055.118 3 R.SRPVSHYMDYGCYCGKGGSGTPVD
ELDR.C PA2BA_PSE
AU
Pseudechis australis 42 13816 481.2444 2 K.ANWNIDTK.T
808.8504 4 K.GSRPSLHYADYGCYCGWGGSGTPV
DELDR.C PA214_DRY
CN
Drysdalia coronoides 40 16900 363.4146 4 K.IHDDCYGDAEKK.G
PA2B1_NAJ
SG
Naja sagittifera 33 14791 601.7903 2 R.GGSGTPIDDLDR.C
PA23_ACAS
S
Acanthophis sp. 31 3779 626.851 2 -.NLLQFAFMIR.Q
PA2B8_AUS
SU
Austrelaps superbus 53 16741 606.2603 2 R.TVCDCDATAAK.C
PA2BD_PSE
AU
Pseudechis australis 40 14002 1020.934 2 K.IHDDCYIEAGKDGCYPK.L
PA2A_NOTS
C
Notechis scutatus
scutatus
26 16846 758.8135 4 R.CHPKFSAYSWKCGSDGPTCDPETGC
K.R PA214_DRY
CN
Drysdalia coronoides 25 16900 484.2176 3 K.IHDDCYGDAEKK.G
PA2A5_AUS
SU
Austrelaps superbus 233 17234 735.2731 2 K.HYMDYGCYCGK.G
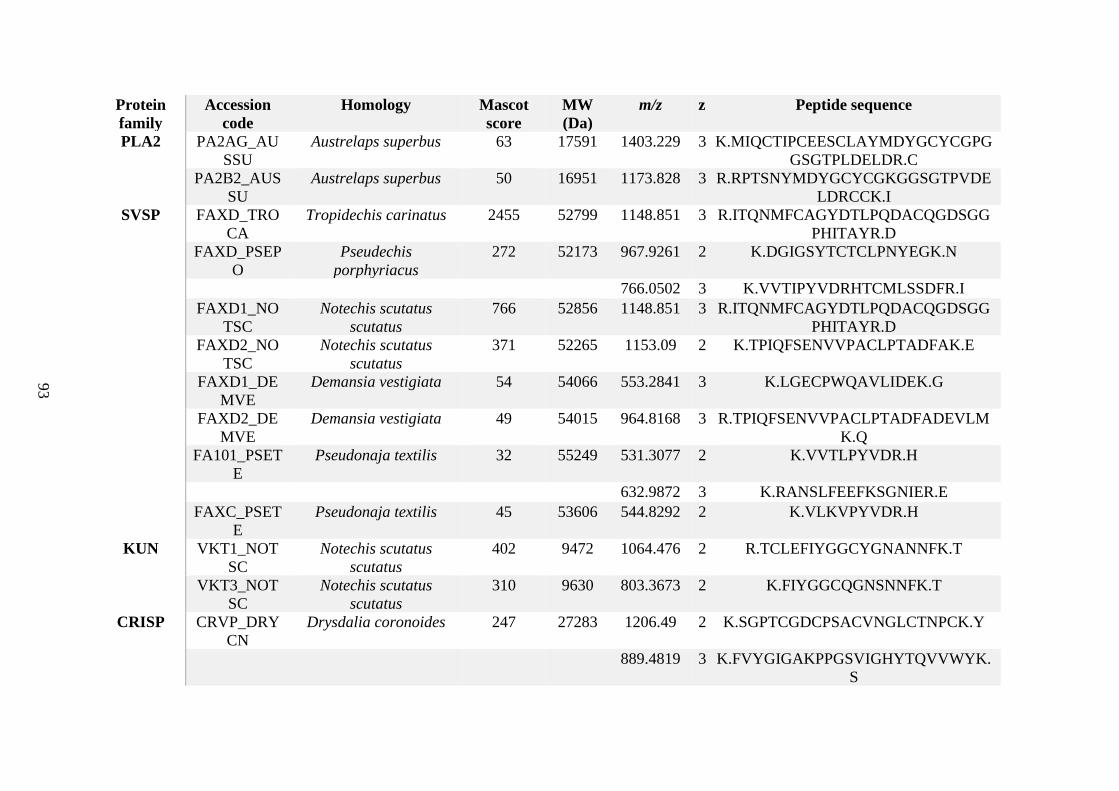
93
Protein
family
Accession
code
Homology Mascot
score
MW
(Da)
m/z z Peptide sequence
PLA2 PA2AG_AU
SSU
Austrelaps superbus 63 17591 1403.229 3 K.MIQCTIPCEESCLAYMDYGCYCGPG
GSGTPLDELDR.C PA2B2_AUS
SU
Austrelaps superbus 50 16951 1173.828 3 R.RPTSNYMDYGCYCGKGGSGTPVDE
LDRCCK.I
SVSP FAXD_TRO
CA
Tropidechis carinatus 2455 52799 1148.851 3 R.ITQNMFCAGYDTLPQDACQGDSGG
PHITAYR.D FAXD_PSEP
O
Pseudechis
porphyriacus
272 52173 967.9261 2 K.DGIGSYTCTCLPNYEGK.N
766.0502 3 K.VVTIPYVDRHTCMLSSDFR.I
FAXD1_NO
TSC
Notechis scutatus
scutatus
766 52856 1148.851 3 R.ITQNMFCAGYDTLPQDACQGDSGG
PHITAYR.D FAXD2_NO
TSC
Notechis scutatus
scutatus
371 52265 1153.09 2 K.TPIQFSENVVPACLPTADFAK.E
FAXD1_DE
MVE
Demansia vestigiata 54 54066 553.2841 3 K.LGECPWQAVLIDEK.G
FAXD2_DE
MVE
Demansia vestigiata 49 54015 964.8168 3 R.TPIQFSENVVPACLPTADFADEVLM
K.Q FA101_PSET
E
Pseudonaja textilis 32 55249 531.3077 2 K.VVTLPYVDR.H
632.9872 3 K.RANSLFEEFKSGNIER.E
FAXC_PSET
E
Pseudonaja textilis 45 53606 544.8292 2 K.VLKVPYVDR.H
KUN VKT1_NOT
SC
Notechis scutatus
scutatus
402 9472 1064.476 2 R.TCLEFIYGGCYGNANNFK.T
VKT3_NOT
SC
Notechis scutatus
scutatus
310 9630 803.3673 2 K.FIYGGCQGNSNNFK.T
CRISP CRVP_DRY
CN
Drysdalia coronoides 247 27283 1206.49 2 K.SGPTCGDCPSACVNGLCTNPCK.Y
889.4819 3 K.FVYGIGAKPPGSVIGHYTQVVWYK.
S
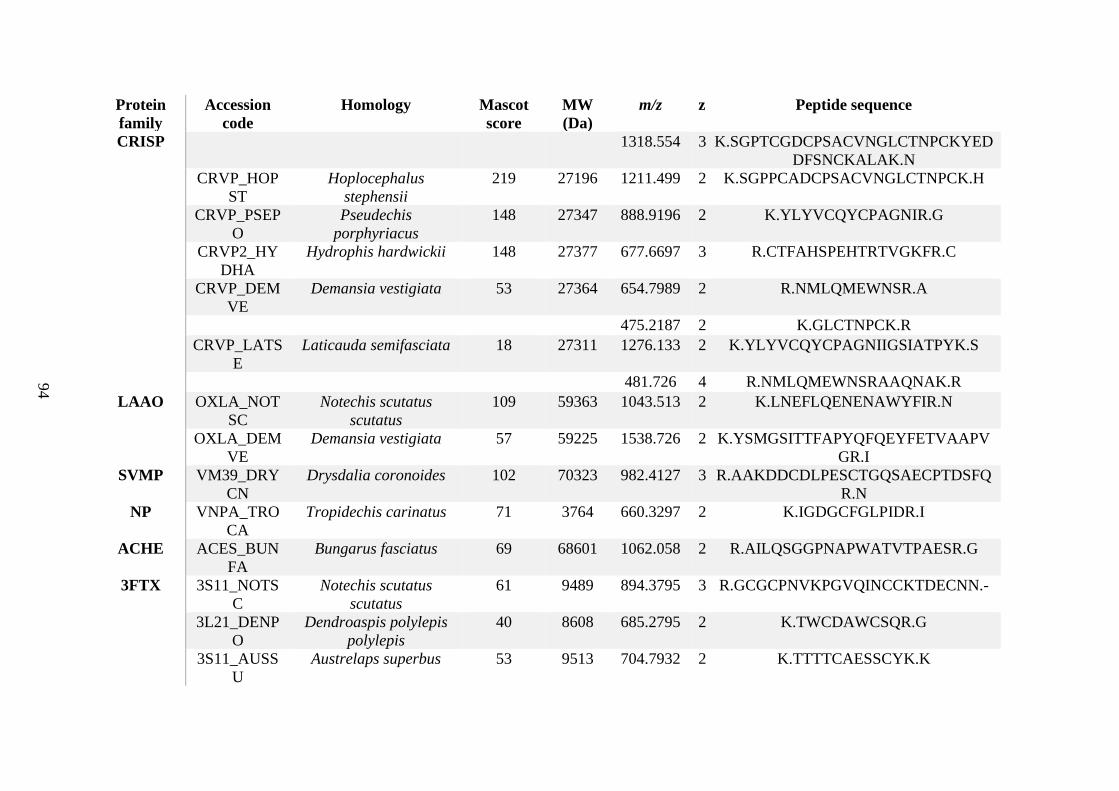
94
Protein
family
Accession
code
Homology Mascot
score
MW
(Da)
m/z z Peptide sequence
CRISP
1318.554 3 K.SGPTCGDCPSACVNGLCTNPCKYED
DFSNCKALAK.N CRVP_HOP
ST
Hoplocephalus
stephensii
219 27196 1211.499 2 K.SGPPCADCPSACVNGLCTNPCK.H
CRVP_PSEP
O
Pseudechis
porphyriacus
148 27347 888.9196 2 K.YLYVCQYCPAGNIR.G
CRVP2_HY
DHA
Hydrophis hardwickii 148 27377 677.6697 3 R.CTFAHSPEHTRTVGKFR.C
CRVP_DEM
VE
Demansia vestigiata 53 27364 654.7989 2 R.NMLQMEWNSR.A
475.2187 2 K.GLCTNPCK.R
CRVP_LATS
E
Laticauda semifasciata 18 27311 1276.133 2 K.YLYVCQYCPAGNIIGSIATPYK.S
481.726 4 R.NMLQMEWNSRAAQNAK.R
LAAO OXLA_NOT
SC
Notechis scutatus
scutatus
109 59363 1043.513 2 K.LNEFLQENENAWYFIR.N
OXLA_DEM
VE
Demansia vestigiata 57 59225 1538.726 2 K.YSMGSITTFAPYQFQEYFETVAAPV
GR.I
SVMP VM39_DRY
CN
Drysdalia coronoides 102 70323 982.4127 3 R.AAKDDCDLPESCTGQSAECPTDSFQ
R.N
NP VNPA_TRO
CA
Tropidechis carinatus 71 3764 660.3297 2 K.IGDGCFGLPIDR.I
ACHE ACES_BUN
FA
Bungarus fasciatus 69 68601 1062.058 2 R.AILQSGGPNAPWATVTPAESR.G
3FTX 3S11_NOTS
C
Notechis scutatus
scutatus
61 9489 894.3795 3 R.GCGCPNVKPGVQINCCKTDECNN.-
3L21_DENP
O
Dendroaspis polylepis
polylepis
40 8608 685.2795 2 K.TWCDAWCSQR.G
3S11_AUSS
U
Austrelaps superbus 53 9513 704.7932 2 K.TTTTCAESSCYK.K
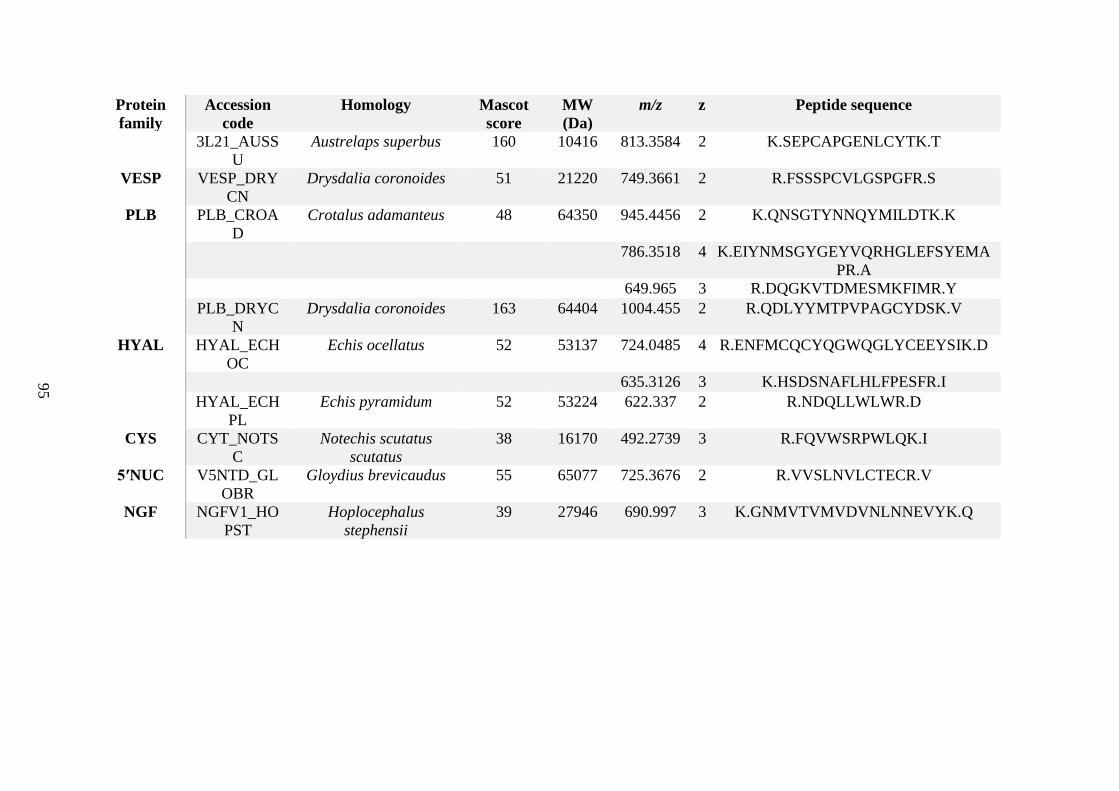
95
Protein
family
Accession
code
Homology Mascot
score
MW
(Da)
m/z z Peptide sequence
3L21_AUSS
U
Austrelaps superbus 160 10416 813.3584 2 K.SEPCAPGENLCYTK.T
VESP VESP_DRY
CN
Drysdalia coronoides 51 21220 749.3661 2 R.FSSSPCVLGSPGFR.S
PLB PLB_CROA
D
Crotalus adamanteus 48 64350 945.4456 2 K.QNSGTYNNQYMILDTK.K
786.3518 4 K.EIYNMSGYGEYVQRHGLEFSYEMA
PR.A 649.965 3 R.DQGKVTDMESMKFIMR.Y
PLB_DRYC
N
Drysdalia coronoides 163 64404 1004.455 2 R.QDLYYMTPVPAGCYDSK.V
HYAL HYAL_ECH
OC
Echis ocellatus 52 53137 724.0485 4 R.ENFMCQCYQGWQGLYCEEYSIK.D
635.3126 3 K.HSDSNAFLHLFPESFR.I
HYAL_ECH
PL
Echis pyramidum 52 53224 622.337 2 R.NDQLLWLWR.D
CYS CYT_NOTS
C
Notechis scutatus
scutatus
38 16170 492.2739 3 R.FQVWSRPWLQK.I
5ʹNUC V5NTD_GL
OBR
Gloydius brevicaudus 55 65077 725.3676 2 R.VVSLNVLCTECR.V
NGF NGFV1_HO
PST
Hoplocephalus
stephensii
39 27946 690.997 3 K.GNMVTVMVDVNLNNEVYK.Q
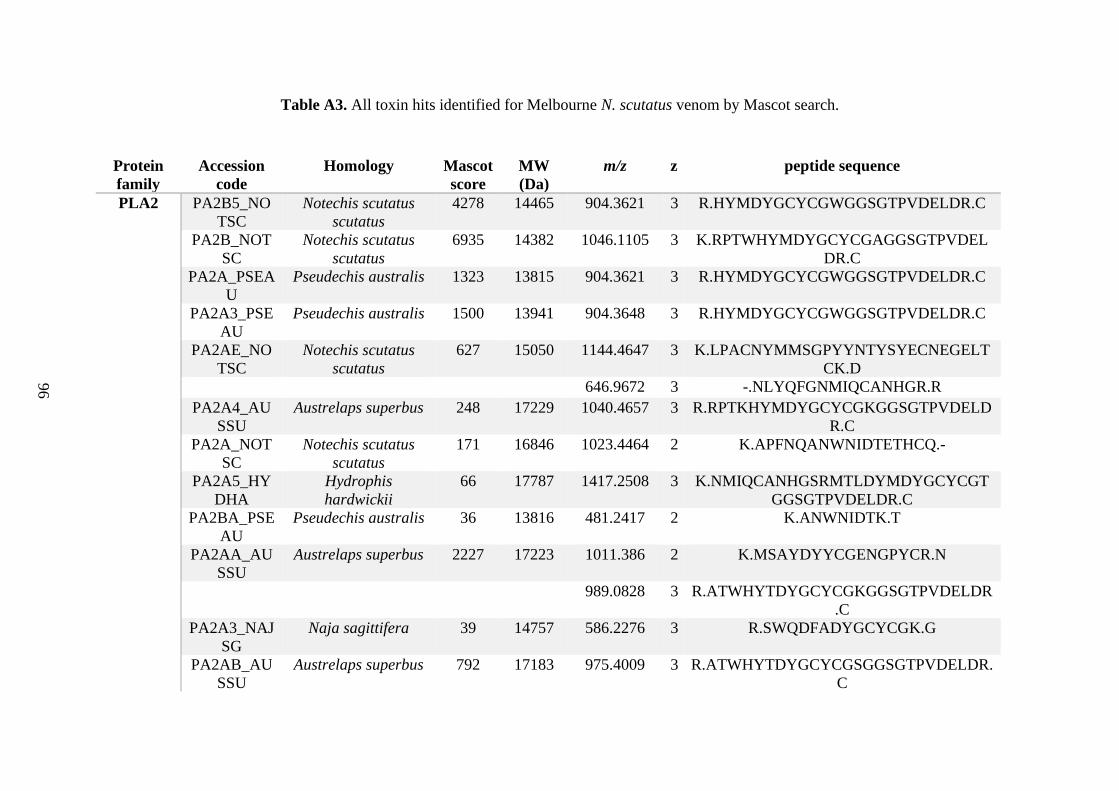
96
Table A3. All toxin hits identified for Melbourne N. scutatus venom by Mascot search.
Protein
family
Accession
code
Homology Mascot
score
MW
(Da)
m/z z peptide sequence
PLA2 PA2B5_NO
TSC
Notechis scutatus
scutatus
4278 14465 904.3621 3 R.HYMDYGCYCGWGGSGTPVDELDR.C
PA2B_NOT
SC
Notechis scutatus
scutatus
6935 14382 1046.1105 3 K.RPTWHYMDYGCYCGAGGSGTPVDEL
DR.C PA2A_PSEA
U
Pseudechis australis 1323 13815 904.3621 3 R.HYMDYGCYCGWGGSGTPVDELDR.C
PA2A3_PSE
AU
Pseudechis australis 1500 13941 904.3648 3 R.HYMDYGCYCGWGGSGTPVDELDR.C
PA2AE_NO
TSC
Notechis scutatus
scutatus
627 15050 1144.4647 3 K.LPACNYMMSGPYYNTYSYECNEGELT
CK.D 646.9672 3 -.NLYQFGNMIQCANHGR.R
PA2A4_AU
SSU
Austrelaps superbus 248 17229 1040.4657 3 R.RPTKHYMDYGCYCGKGGSGTPVDELD
R.C PA2A_NOT
SC
Notechis scutatus
scutatus
171 16846 1023.4464 2 K.APFNQANWNIDTETHCQ.-
PA2A5_HY
DHA
Hydrophis
hardwickii
66 17787 1417.2508 3 K.NMIQCANHGSRMTLDYMDYGCYCGT
GGSGTPVDELDR.C PA2BA_PSE
AU
Pseudechis australis 36 13816 481.2417 2 K.ANWNIDTK.T
PA2AA_AU
SSU
Austrelaps superbus 2227 17223 1011.386 2 K.MSAYDYYCGENGPYCR.N
989.0828 3 R.ATWHYTDYGCYCGKGGSGTPVDELDR
.C PA2A3_NAJ
SG
Naja sagittifera 39 14757 586.2276 3 R.SWQDFADYGCYCGK.G
PA2AB_AU
SSU
Austrelaps superbus 792 17183 975.4009 3 R.ATWHYTDYGCYCGSGGSGTPVDELDR.
C
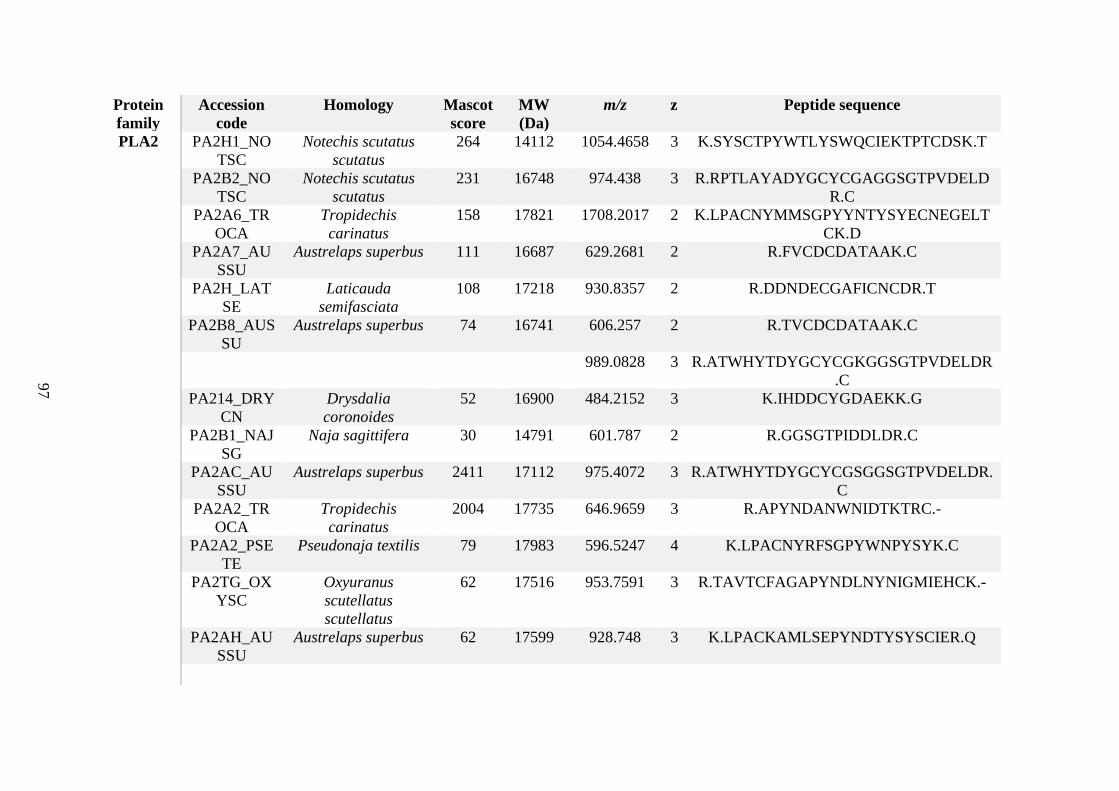
97
Protein
family
Accession
code
Homology Mascot
score
MW
(Da)
m/z z Peptide sequence
PLA2 PA2H1_NO
TSC
Notechis scutatus
scutatus
264 14112 1054.4658 3 K.SYSCTPYWTLYSWQCIEKTPTCDSK.T
PA2B2_NO
TSC
Notechis scutatus
scutatus
231 16748 974.438 3 R.RPTLAYADYGCYCGAGGSGTPVDELD
R.C PA2A6_TR
OCA
Tropidechis
carinatus
158 17821 1708.2017 2 K.LPACNYMMSGPYYNTYSYECNEGELT
CK.D PA2A7_AU
SSU
Austrelaps superbus 111 16687 629.2681 2 R.FVCDCDATAAK.C
PA2H_LAT
SE
Laticauda
semifasciata
108 17218 930.8357 2 R.DDNDECGAFICNCDR.T
PA2B8_AUS
SU
Austrelaps superbus 74 16741 606.257 2 R.TVCDCDATAAK.C
989.0828 3 R.ATWHYTDYGCYCGKGGSGTPVDELDR
.C PA214_DRY
CN
Drysdalia
coronoides
52 16900 484.2152 3 K.IHDDCYGDAEKK.G
PA2B1_NAJ
SG
Naja sagittifera 30 14791 601.787 2 R.GGSGTPIDDLDR.C
PA2AC_AU
SSU
Austrelaps superbus 2411 17112 975.4072 3 R.ATWHYTDYGCYCGSGGSGTPVDELDR.
C PA2A2_TR
OCA
Tropidechis
carinatus
2004 17735 646.9659 3 R.APYNDANWNIDTKTRC.-
PA2A2_PSE
TE
Pseudonaja textilis 79 17983 596.5247 4 K.LPACNYRFSGPYWNPYSYK.C
PA2TG_OX
YSC
Oxyuranus
scutellatus
scutellatus
62 17516 953.7591 3 R.TAVTCFAGAPYNDLNYNIGMIEHCK.-
PA2AH_AU
SSU
Austrelaps superbus 62 17599 928.748 3 K.LPACKAMLSEPYNDTYSYSCIER.Q
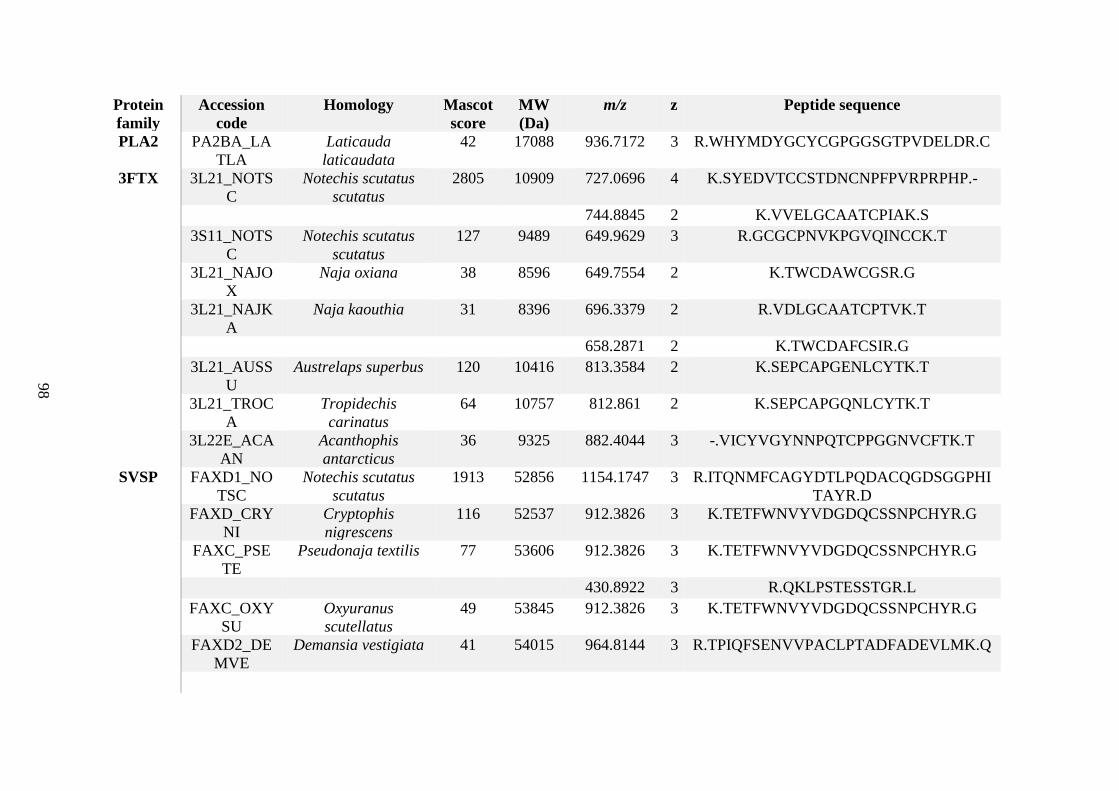
98
Protein
family
Accession
code
Homology Mascot
score
MW
(Da)
m/z z Peptide sequence
PLA2 PA2BA_LA
TLA
Laticauda
laticaudata
42 17088 936.7172 3 R.WHYMDYGCYCGPGGSGTPVDELDR.C
3FTX 3L21_NOTS
C
Notechis scutatus
scutatus
2805 10909 727.0696 4 K.SYEDVTCCSTDNCNPFPVRPRPHP.-
744.8845 2 K.VVELGCAATCPIAK.S
3S11_NOTS
C
Notechis scutatus
scutatus
127 9489 649.9629 3 R.GCGCPNVKPGVQINCCK.T
3L21_NAJO
X
Naja oxiana 38 8596 649.7554 2 K.TWCDAWCGSR.G
3L21_NAJK
A
Naja kaouthia 31 8396 696.3379 2 R.VDLGCAATCPTVK.T
658.2871 2 K.TWCDAFCSIR.G
3L21_AUSS
U
Austrelaps superbus 120 10416 813.3584 2 K.SEPCAPGENLCYTK.T
3L21_TROC
A
Tropidechis
carinatus
64 10757 812.861 2 K.SEPCAPGQNLCYTK.T
3L22E_ACA
AN
Acanthophis
antarcticus
36 9325 882.4044 3 -.VICYVGYNNPQTCPPGGNVCFTK.T
SVSP FAXD1_NO
TSC
Notechis scutatus
scutatus
1913 52856 1154.1747 3 R.ITQNMFCAGYDTLPQDACQGDSGGPHI
TAYR.D FAXD_CRY
NI
Cryptophis
nigrescens
116 52537 912.3826 3 K.TETFWNVYVDGDQCSSNPCHYR.G
FAXC_PSE
TE
Pseudonaja textilis 77 53606 912.3826 3 K.TETFWNVYVDGDQCSSNPCHYR.G
430.8922 3 R.QKLPSTESSTGR.L
FAXC_OXY
SU
Oxyuranus
scutellatus
49 53845 912.3826 3 K.TETFWNVYVDGDQCSSNPCHYR.G
FAXD2_DE
MVE
Demansia vestigiata 41 54015 964.8144 3 R.TPIQFSENVVPACLPTADFADEVLMK.Q
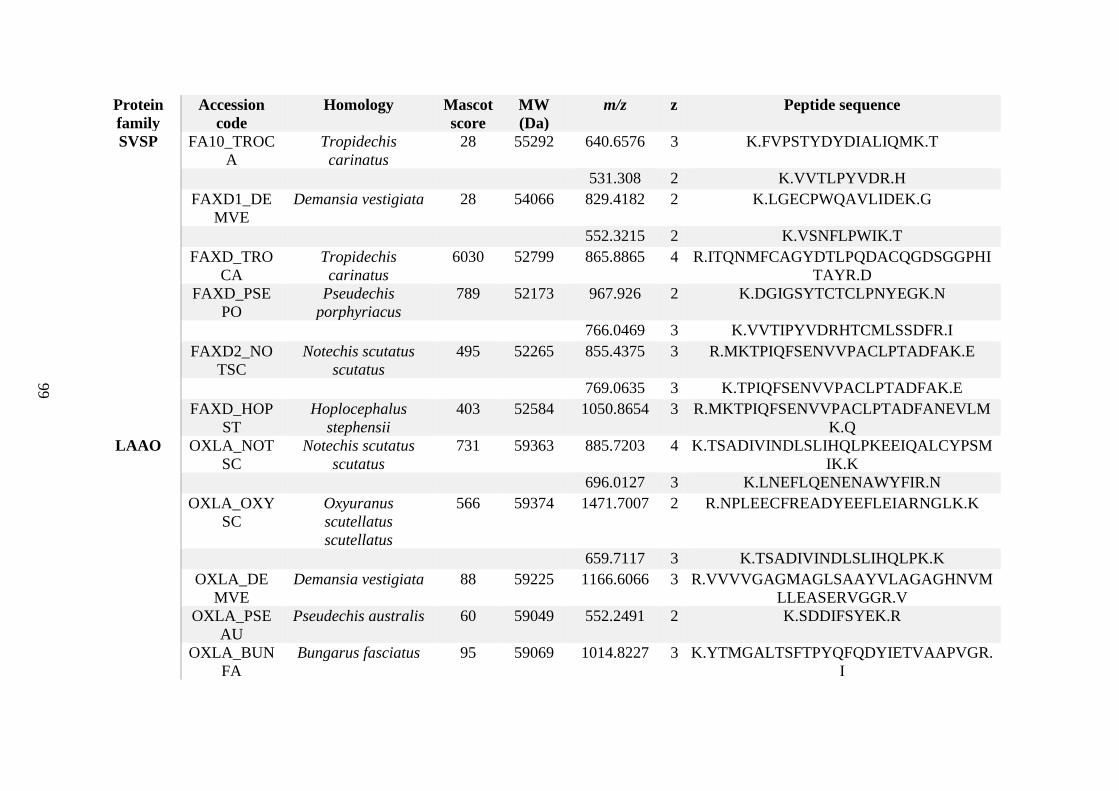
99
Protein
family
Accession
code
Homology Mascot
score
MW
(Da)
m/z z Peptide sequence
SVSP FA10_TROC
A
Tropidechis
carinatus
28 55292 640.6576 3 K.FVPSTYDYDIALIQMK.T
531.308 2 K.VVTLPYVDR.H
FAXD1_DE
MVE
Demansia vestigiata 28 54066 829.4182 2 K.LGECPWQAVLIDEK.G
552.3215 2 K.VSNFLPWIK.T
FAXD_TRO
CA
Tropidechis
carinatus
6030 52799 865.8865 4 R.ITQNMFCAGYDTLPQDACQGDSGGPHI
TAYR.D FAXD_PSE
PO
Pseudechis
porphyriacus
789 52173 967.926 2 K.DGIGSYTCTCLPNYEGK.N
766.0469 3 K.VVTIPYVDRHTCMLSSDFR.I
FAXD2_NO
TSC
Notechis scutatus
scutatus
495 52265 855.4375 3 R.MKTPIQFSENVVPACLPTADFAK.E
769.0635 3 K.TPIQFSENVVPACLPTADFAK.E
FAXD_HOP
ST
Hoplocephalus
stephensii
403 52584 1050.8654 3 R.MKTPIQFSENVVPACLPTADFANEVLM
K.Q
LAAO OXLA_NOT
SC
Notechis scutatus
scutatus
731 59363 885.7203 4 K.TSADIVINDLSLIHQLPKEEIQALCYPSM
IK.K 696.0127 3 K.LNEFLQENENAWYFIR.N
OXLA_OXY
SC
Oxyuranus
scutellatus
scutellatus
566 59374 1471.7007 2 R.NPLEECFREADYEEFLEIARNGLK.K
659.7117 3 K.TSADIVINDLSLIHQLPK.K
OXLA_DE
MVE
Demansia vestigiata 88 59225 1166.6066 3 R.VVVVGAGMAGLSAAYVLAGAGHNVM
LLEASERVGGR.V OXLA_PSE
AU
Pseudechis australis 60 59049 552.2491 2 K.SDDIFSYEK.R
OXLA_BUN
FA
Bungarus fasciatus 95 59069 1014.8227 3 K.YTMGALTSFTPYQFQDYIETVAAPVGR.
I

100
Protein
family
Accession
code
Homology Mascot
score
MW
(Da)
m/z z Peptide sequence
LAAO
659.7075 3 K.TSADIVINDLSLIHQLPK.N OXLA_BUN
MU
Bungarus
multicinctus
60 59116 1252.0686 2 R.SPLEECFREADYEEFLEIAR.N
KUN VKT1_NOT
SC
Notechis scutatus
scutatus
478 9472 1064.4712 2 R.TCLEFIYGGCYGNANNFK.T
VKT3_NOT
SC
Notechis scutatus
scutatus
216 9630 803.3612 2 K.FIYGGCQGNSNNFK.T
VKT3_CRY
NI
Cryptophis
nigrescens
29 9525 933.9291 2 R.LEFIYGGCYGNANNFK.T
VKT2_AUS
SU
Austrelaps superbus 33 9522 795.8572 2 K.FIYGGCEGNANNFK.T
PLB PLB_DRYC
N
Drysdalia
coronoides
202 64404 1009.486 2 K.KQNSGTYNNQYMILDTK.K
1004.4539 2 R.QDLYYMTPVPAGCYDSK.V 503.5865 3 K.GYWPSYNIPFHK.V
PLB_CROA
D
Crotalus adamanteus 26 64350 649.9741 3 R.DQGKVTDMESMKFIMR.Y
945.4449 2 K.QNSGTYNNQYMILDTK.K
NGF NGFV1_NO
TSC
Notechis scutatus
scutatus
190 28209 669.0604 4 R.ENHPVHNQGEHSVCDSVSDWVIK.T
NGFV5_TR
OCA
Tropidechis
carinatus
108 28032 900.9113 2 R.HWNSYCTTTQTFVR.A
NGFV1_HO
PST
Hoplocephalus
stephensii
68 27946 690.9932 3 K.GNMVTVMVDVNLNNEVYK.Q
NGFV2_HO
PST
Hoplocephalus
stephensii
64 28215 690.9932 3 K.GNMVTVMVDVNLNNEVYK.Q
NGFV_OXY
SC
Oxyuranus
scutellatus
scutellatus
64 27821 1182.5491 3 R.ETHPVHNLGEYSVCDSISVWVANKTEA
MDIK.G
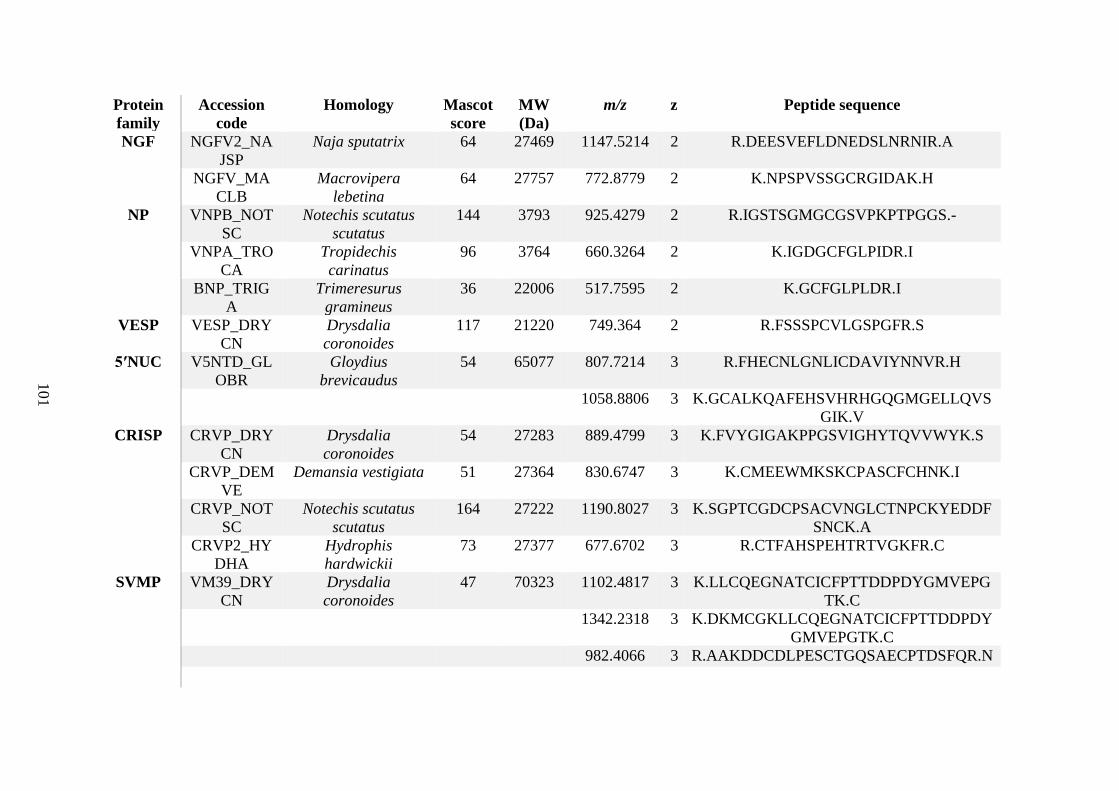
101
Protein
family
Accession
code
Homology Mascot
score
MW
(Da)
m/z z Peptide sequence
NGF NGFV2_NA
JSP
Naja sputatrix 64 27469 1147.5214 2 R.DEESVEFLDNEDSLNRNIR.A
NGFV_MA
CLB
Macrovipera
lebetina
64 27757 772.8779 2 K.NPSPVSSGCRGIDAK.H
NP VNPB_NOT
SC
Notechis scutatus
scutatus
144 3793 925.4279 2 R.IGSTSGMGCGSVPKPTPGGS.-
VNPA_TRO
CA
Tropidechis
carinatus
96 3764 660.3264 2 K.IGDGCFGLPIDR.I
BNP_TRIG
A
Trimeresurus
gramineus
36 22006 517.7595 2 K.GCFGLPLDR.I
VESP VESP_DRY
CN
Drysdalia
coronoides
117 21220 749.364 2 R.FSSSPCVLGSPGFR.S
5ʹNUC V5NTD_GL
OBR
Gloydius
brevicaudus
54 65077 807.7214 3 R.FHECNLGNLICDAVIYNNVR.H
1058.8806 3 K.GCALKQAFEHSVHRHGQGMGELLQVS
GIK.V
CRISP CRVP_DRY
CN
Drysdalia
coronoides
54 27283 889.4799 3 K.FVYGIGAKPPGSVIGHYTQVVWYK.S
CRVP_DEM
VE
Demansia vestigiata 51 27364 830.6747 3 K.CMEEWMKSKCPASCFCHNK.I
CRVP_NOT
SC
Notechis scutatus
scutatus
164 27222 1190.8027 3 K.SGPTCGDCPSACVNGLCTNPCKYEDDF
SNCK.A CRVP2_HY
DHA
Hydrophis
hardwickii
73 27377 677.6702 3 R.CTFAHSPEHTRTVGKFR.C
SVMP VM39_DRY
CN
Drysdalia
coronoides
47 70323 1102.4817 3 K.LLCQEGNATCICFPTTDDPDYGMVEPG
TK.C 1342.2318 3 K.DKMCGKLLCQEGNATCICFPTTDDPDY
GMVEPGTK.C 982.4066 3 R.AAKDDCDLPESCTGQSAECPTDSFQR.N
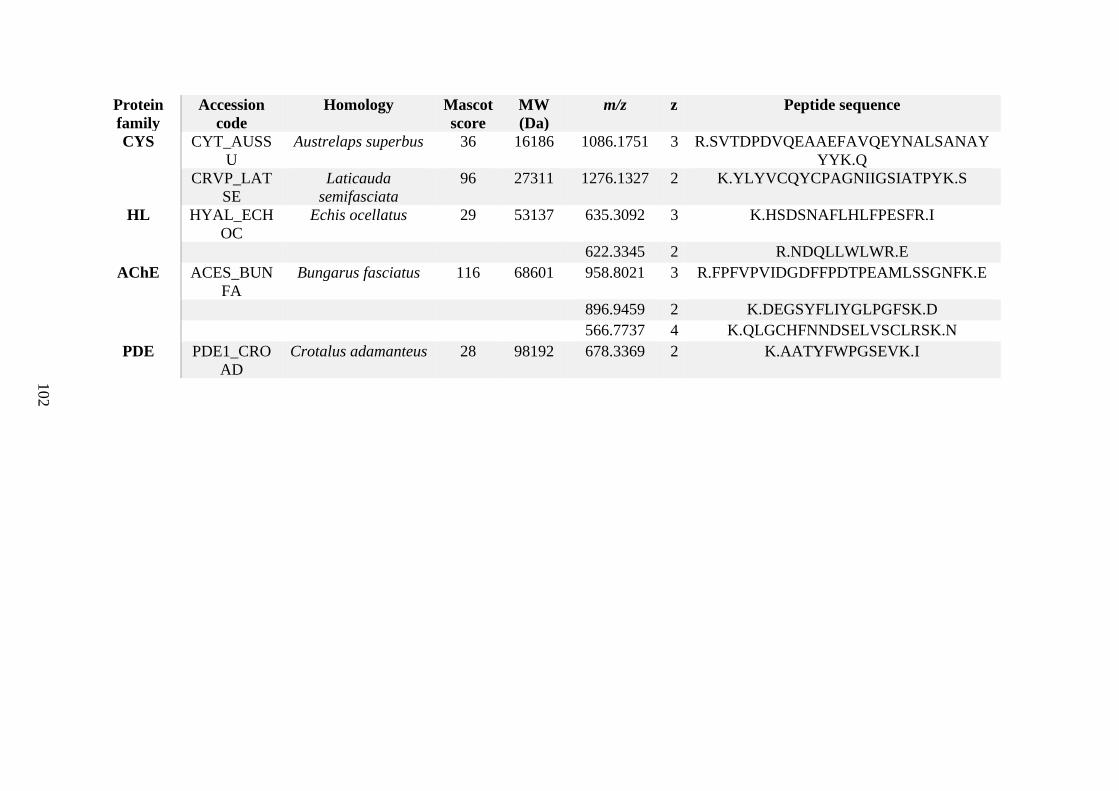
102
Protein
family
Accession
code
Homology Mascot
score
MW
(Da)
m/z z Peptide sequence
CYS CYT_AUSS
U
Austrelaps superbus 36 16186 1086.1751 3 R.SVTDPDVQEAAEFAVQEYNALSANAY
YYK.Q CRVP_LAT
SE
Laticauda
semifasciata
96 27311 1276.1327 2 K.YLYVCQYCPAGNIIGSIATPYK.S
HL HYAL_ECH
OC
Echis ocellatus 29 53137 635.3092 3 K.HSDSNAFLHLFPESFR.I
622.3345 2 R.NDQLLWLWR.E
AChE ACES_BUN
FA
Bungarus fasciatus 116 68601 958.8021 3 R.FPFVPVIDGDFFPDTPEAMLSSGNFK.E
896.9459 2 K.DEGSYFLIYGLPGFSK.D 566.7737 4 K.QLGCHFNNDSELVSCLRSK.N
PDE PDE1_CRO
AD
Crotalus adamanteus 28 98192 678.3369 2 K.AATYFWPGSEVK.I
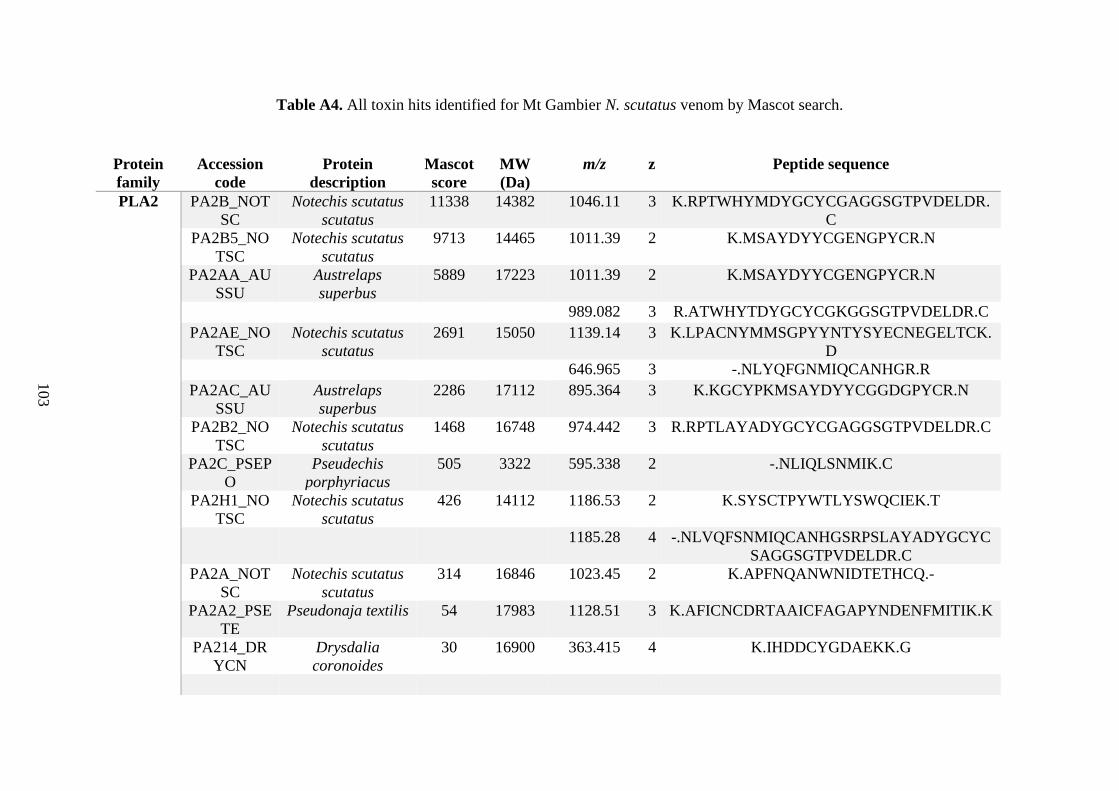
103
Table A4. All toxin hits identified for Mt Gambier N. scutatus venom by Mascot search.
Protein
family
Accession
code
Protein
description
Mascot
score
MW
(Da)
m/z z Peptide sequence
PLA2 PA2B_NOT
SC
Notechis scutatus
scutatus
11338 14382 1046.11 3 K.RPTWHYMDYGCYCGAGGSGTPVDELDR.
C PA2B5_NO
TSC
Notechis scutatus
scutatus
9713 14465 1011.39 2 K.MSAYDYYCGENGPYCR.N
PA2AA_AU
SSU
Austrelaps
superbus
5889 17223 1011.39 2 K.MSAYDYYCGENGPYCR.N
989.082 3 R.ATWHYTDYGCYCGKGGSGTPVDELDR.C
PA2AE_NO
TSC
Notechis scutatus
scutatus
2691 15050 1139.14 3 K.LPACNYMMSGPYYNTYSYECNEGELTCK.
D 646.965 3 -.NLYQFGNMIQCANHGR.R
PA2AC_AU
SSU
Austrelaps
superbus
2286 17112 895.364 3 K.KGCYPKMSAYDYYCGGDGPYCR.N
PA2B2_NO
TSC
Notechis scutatus
scutatus
1468 16748 974.442 3 R.RPTLAYADYGCYCGAGGSGTPVDELDR.C
PA2C_PSEP
O
Pseudechis
porphyriacus
505 3322 595.338 2 -.NLIQLSNMIK.C
PA2H1_NO
TSC
Notechis scutatus
scutatus
426 14112 1186.53 2 K.SYSCTPYWTLYSWQCIEK.T
1185.28 4 -.NLVQFSNMIQCANHGSRPSLAYADYGCYC
SAGGSGTPVDELDR.C PA2A_NOT
SC
Notechis scutatus
scutatus
314 16846 1023.45 2 K.APFNQANWNIDTETHCQ.-
PA2A2_PSE
TE
Pseudonaja textilis 54 17983 1128.51 3 K.AFICNCDRTAAICFAGAPYNDENFMITIK.K
PA214_DR
YCN
Drysdalia
coronoides
30 16900 363.415 4 K.IHDDCYGDAEKK.G
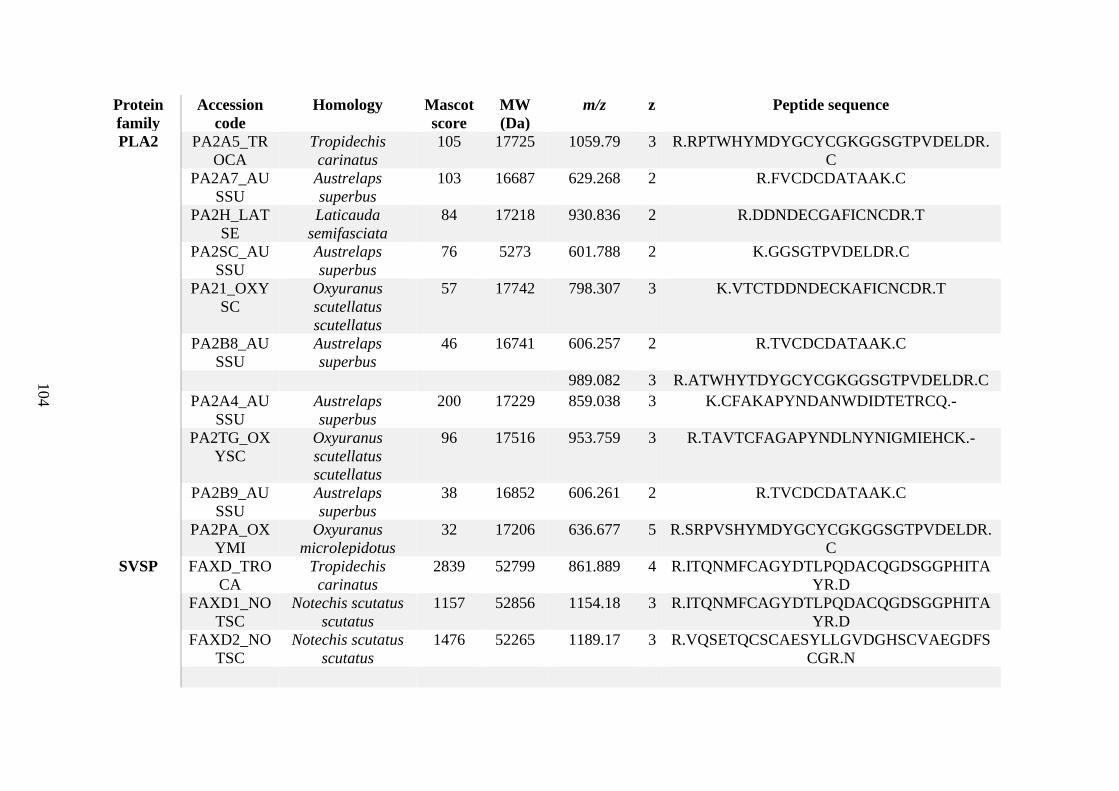
104
Protein
family
Accession
code
Homology Mascot
score
MW
(Da)
m/z z Peptide sequence
PLA2 PA2A5_TR
OCA
Tropidechis
carinatus
105 17725 1059.79 3 R.RPTWHYMDYGCYCGKGGSGTPVDELDR.
C PA2A7_AU
SSU
Austrelaps
superbus
103 16687 629.268 2 R.FVCDCDATAAK.C
PA2H_LAT
SE
Laticauda
semifasciata
84 17218 930.836 2 R.DDNDECGAFICNCDR.T
PA2SC_AU
SSU
Austrelaps
superbus
76 5273 601.788 2 K.GGSGTPVDELDR.C
PA21_OXY
SC
Oxyuranus
scutellatus
scutellatus
57 17742 798.307 3 K.VTCTDDNDECKAFICNCDR.T
PA2B8_AU
SSU
Austrelaps
superbus
46 16741 606.257 2 R.TVCDCDATAAK.C
989.082 3 R.ATWHYTDYGCYCGKGGSGTPVDELDR.C
PA2A4_AU
SSU
Austrelaps
superbus
200 17229 859.038 3 K.CFAKAPYNDANWDIDTETRCQ.-
PA2TG_OX
YSC
Oxyuranus
scutellatus
scutellatus
96 17516 953.759 3 R.TAVTCFAGAPYNDLNYNIGMIEHCK.-
PA2B9_AU
SSU
Austrelaps
superbus
38 16852 606.261 2 R.TVCDCDATAAK.C
PA2PA_OX
YMI
Oxyuranus
microlepidotus
32 17206 636.677 5 R.SRPVSHYMDYGCYCGKGGSGTPVDELDR.
C
SVSP FAXD_TRO
CA
Tropidechis
carinatus
2839 52799 861.889 4 R.ITQNMFCAGYDTLPQDACQGDSGGPHITA
YR.D FAXD1_NO
TSC
Notechis scutatus
scutatus
1157 52856 1154.18 3 R.ITQNMFCAGYDTLPQDACQGDSGGPHITA
YR.D FAXD2_NO
TSC
Notechis scutatus
scutatus
1476 52265 1189.17 3 R.VQSETQCSCAESYLLGVDGHSCVAEGDFS
CGR.N
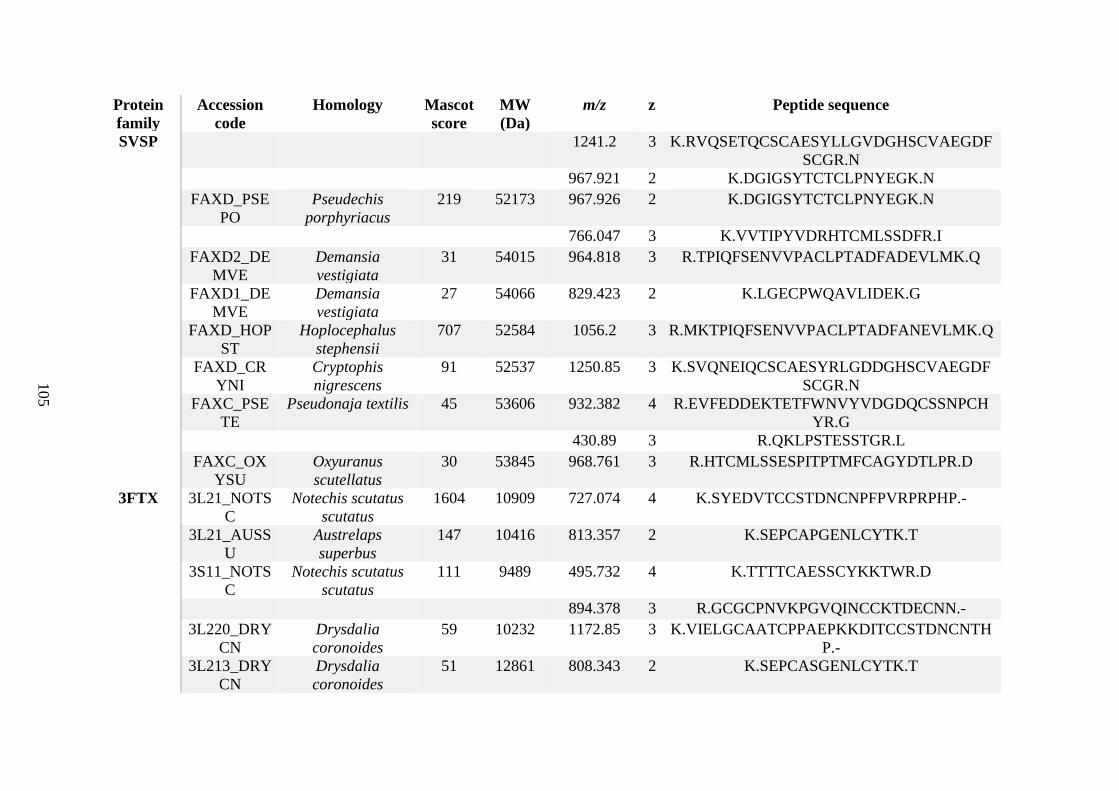
105
Protein
family
Accession
code
Homology Mascot
score
MW
(Da)
m/z z Peptide sequence
SVSP
1241.2 3 K.RVQSETQCSCAESYLLGVDGHSCVAEGDF
SCGR.N 967.921 2 K.DGIGSYTCTCLPNYEGK.N
FAXD_PSE
PO
Pseudechis
porphyriacus
219 52173 967.926 2 K.DGIGSYTCTCLPNYEGK.N
766.047 3 K.VVTIPYVDRHTCMLSSDFR.I
FAXD2_DE
MVE
Demansia
vestigiata
31 54015 964.818 3 R.TPIQFSENVVPACLPTADFADEVLMK.Q
FAXD1_DE
MVE
Demansia
vestigiata
27 54066 829.423 2 K.LGECPWQAVLIDEK.G
FAXD_HOP
ST
Hoplocephalus
stephensii
707 52584 1056.2 3 R.MKTPIQFSENVVPACLPTADFANEVLMK.Q
FAXD_CR
YNI
Cryptophis
nigrescens
91 52537 1250.85 3 K.SVQNEIQCSCAESYRLGDDGHSCVAEGDF
SCGR.N FAXC_PSE
TE
Pseudonaja textilis 45 53606 932.382 4 R.EVFEDDEKTETFWNVYVDGDQCSSNPCH
YR.G 430.89 3 R.QKLPSTESSTGR.L
FAXC_OX
YSU
Oxyuranus
scutellatus
30 53845 968.761 3 R.HTCMLSSESPITPTMFCAGYDTLPR.D
3FTX 3L21_NOTS
C
Notechis scutatus
scutatus
1604 10909 727.074 4 K.SYEDVTCCSTDNCNPFPVRPRPHP.-
3L21_AUSS
U
Austrelaps
superbus
147 10416 813.357 2 K.SEPCAPGENLCYTK.T
3S11_NOTS
C
Notechis scutatus
scutatus
111 9489 495.732 4 K.TTTTCAESSCYKKTWR.D
894.378 3 R.GCGCPNVKPGVQINCCKTDECNN.-
3L220_DRY
CN
Drysdalia
coronoides
59 10232 1172.85 3 K.VIELGCAATCPPAEPKKDITCCSTDNCNTH
P.- 3L213_DRY
CN
Drysdalia
coronoides
51 12861 808.343 2 K.SEPCASGENLCYTK.T
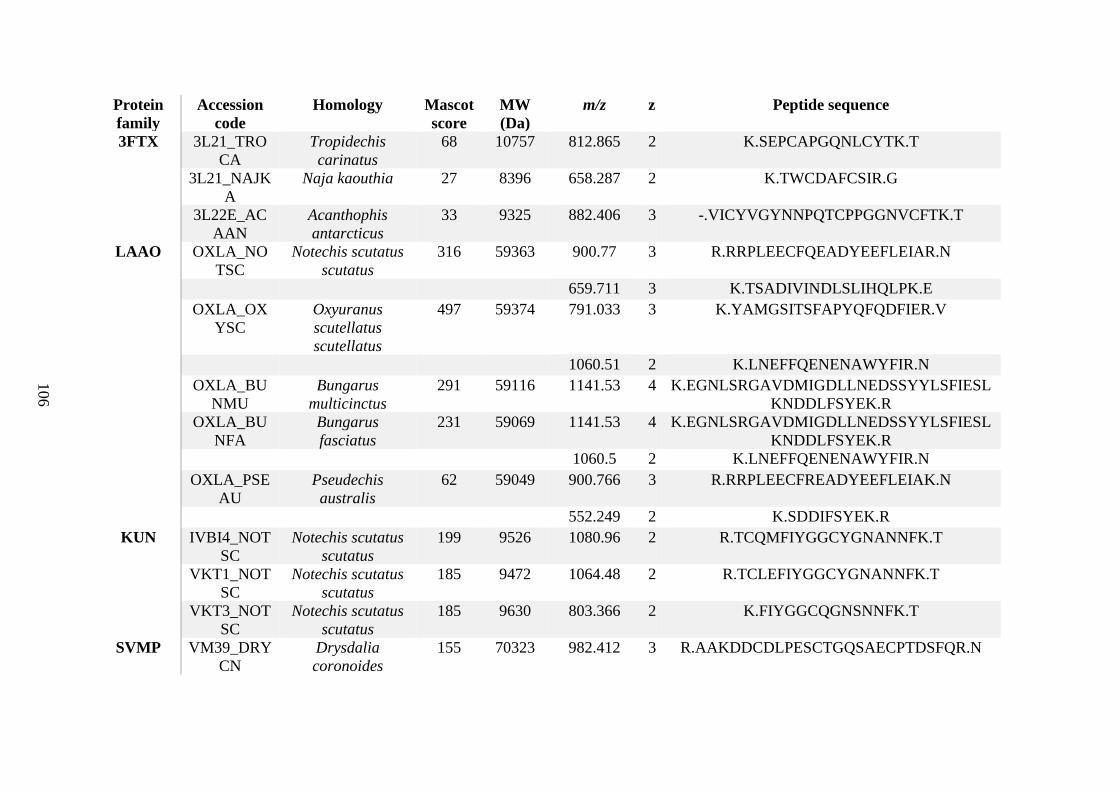
106
Protein
family
Accession
code
Homology Mascot
score
MW
(Da)
m/z z Peptide sequence
3FTX 3L21_TRO
CA
Tropidechis
carinatus
68 10757 812.865 2 K.SEPCAPGQNLCYTK.T
3L21_NAJK
A
Naja kaouthia 27 8396 658.287 2 K.TWCDAFCSIR.G
3L22E_AC
AAN
Acanthophis
antarcticus
33 9325 882.406 3 -.VICYVGYNNPQTCPPGGNVCFTK.T
LAAO OXLA_NO
TSC
Notechis scutatus
scutatus
316 59363 900.77 3 R.RRPLEECFQEADYEEFLEIAR.N
659.711 3 K.TSADIVINDLSLIHQLPK.E
OXLA_OX
YSC
Oxyuranus
scutellatus
scutellatus
497 59374 791.033 3 K.YAMGSITSFAPYQFQDFIER.V
1060.51 2 K.LNEFFQENENAWYFIR.N
OXLA_BU
NMU
Bungarus
multicinctus
291 59116 1141.53 4 K.EGNLSRGAVDMIGDLLNEDSSYYLSFIESL
KNDDLFSYEK.R OXLA_BU
NFA
Bungarus
fasciatus
231 59069 1141.53 4 K.EGNLSRGAVDMIGDLLNEDSSYYLSFIESL
KNDDLFSYEK.R 1060.5 2 K.LNEFFQENENAWYFIR.N
OXLA_PSE
AU
Pseudechis
australis
62 59049 900.766 3 R.RRPLEECFREADYEEFLEIAK.N
552.249 2 K.SDDIFSYEK.R
KUN IVBI4_NOT
SC
Notechis scutatus
scutatus
199 9526 1080.96 2 R.TCQMFIYGGCYGNANNFK.T
VKT1_NOT
SC
Notechis scutatus
scutatus
185 9472 1064.48 2 R.TCLEFIYGGCYGNANNFK.T
VKT3_NOT
SC
Notechis scutatus
scutatus
185 9630 803.366 2 K.FIYGGCQGNSNNFK.T
SVMP VM39_DRY
CN
Drysdalia
coronoides
155 70323 982.412 3 R.AAKDDCDLPESCTGQSAECPTDSFQR.N
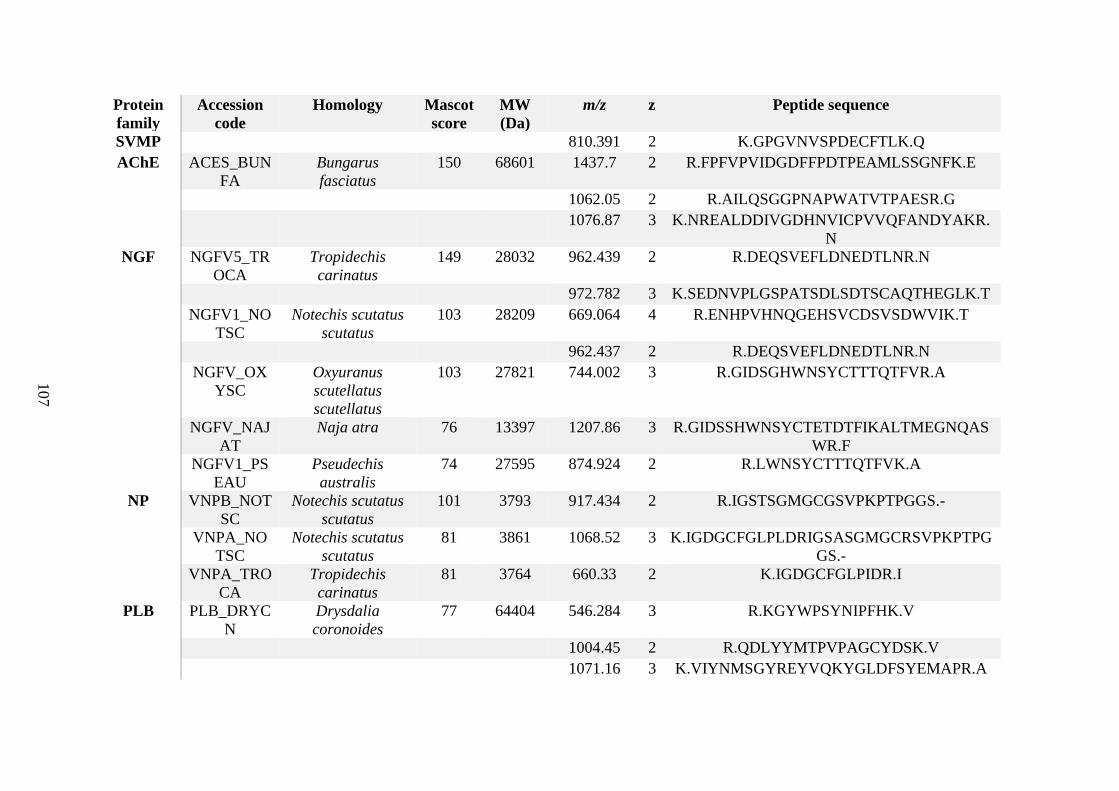
107
Protein
family
Accession
code
Homology Mascot
score
MW
(Da)
m/z z Peptide sequence
SVMP
810.391 2 K.GPGVNVSPDECFTLK.Q
AChE ACES_BUN
FA
Bungarus
fasciatus
150 68601 1437.7 2 R.FPFVPVIDGDFFPDTPEAMLSSGNFK.E
1062.05 2 R.AILQSGGPNAPWATVTPAESR.G 1076.87 3 K.NREALDDIVGDHNVICPVVQFANDYAKR.
N
NGF NGFV5_TR
OCA
Tropidechis
carinatus
149 28032 962.439 2 R.DEQSVEFLDNEDTLNR.N
972.782 3 K.SEDNVPLGSPATSDLSDTSCAQTHEGLK.T
NGFV1_NO
TSC
Notechis scutatus
scutatus
103 28209 669.064 4 R.ENHPVHNQGEHSVCDSVSDWVIK.T
962.437 2 R.DEQSVEFLDNEDTLNR.N
NGFV_OX
YSC
Oxyuranus
scutellatus
scutellatus
103 27821 744.002 3 R.GIDSGHWNSYCTTTQTFVR.A
NGFV_NAJ
AT
Naja atra 76 13397 1207.86 3 R.GIDSSHWNSYCTETDTFIKALTMEGNQAS
WR.F NGFV1_PS
EAU
Pseudechis
australis
74 27595 874.924 2 R.LWNSYCTTTQTFVK.A
NP VNPB_NOT
SC
Notechis scutatus
scutatus
101 3793 917.434 2 R.IGSTSGMGCGSVPKPTPGGS.-
VNPA_NO
TSC
Notechis scutatus
scutatus
81 3861 1068.52 3 K.IGDGCFGLPLDRIGSASGMGCRSVPKPTPG
GS.- VNPA_TRO
CA
Tropidechis
carinatus
81 3764 660.33 2 K.IGDGCFGLPIDR.I
PLB PLB_DRYC
N
Drysdalia
coronoides
77 64404 546.284 3 R.KGYWPSYNIPFHK.V
1004.45 2 R.QDLYYMTPVPAGCYDSK.V 1071.16 3 K.VIYNMSGYREYVQKYGLDFSYEMAPR.A
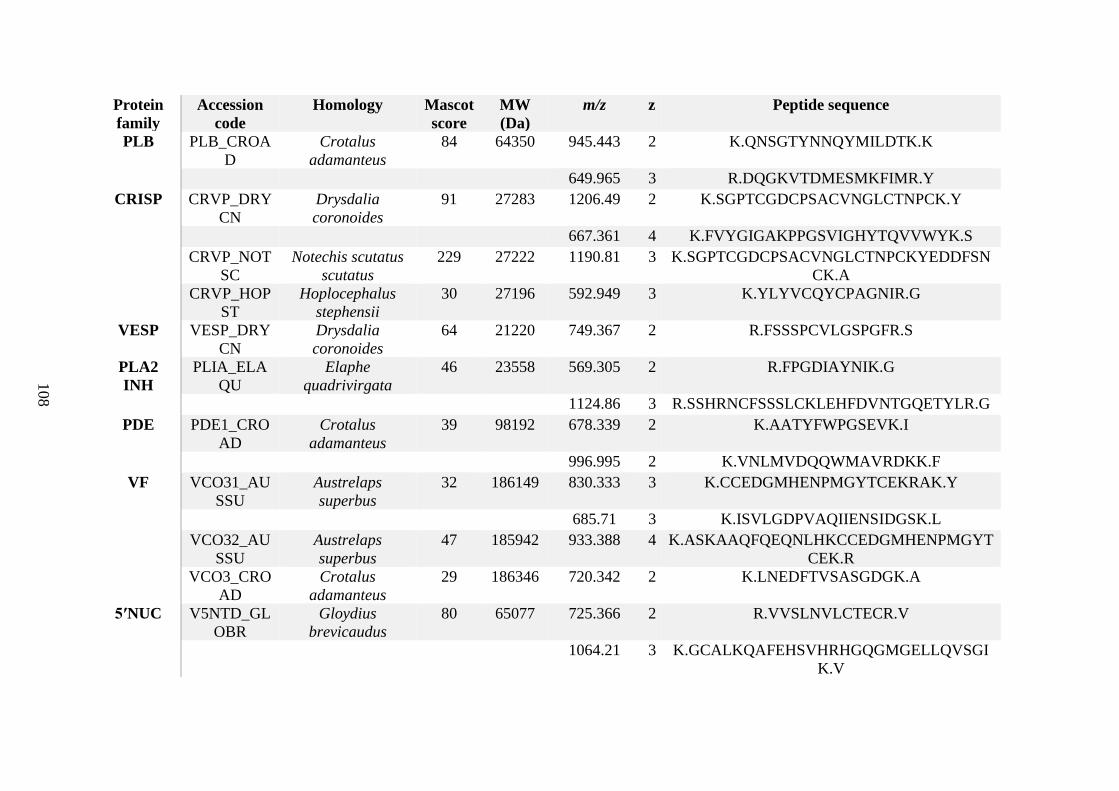
108
Protein
family
Accession
code
Homology Mascot
score
MW
(Da)
m/z z Peptide sequence
PLB PLB_CROA
D
Crotalus
adamanteus
84 64350 945.443 2 K.QNSGTYNNQYMILDTK.K
649.965 3 R.DQGKVTDMESMKFIMR.Y
CRISP CRVP_DRY
CN
Drysdalia
coronoides
91 27283 1206.49 2 K.SGPTCGDCPSACVNGLCTNPCK.Y
667.361 4 K.FVYGIGAKPPGSVIGHYTQVVWYK.S
CRVP_NOT
SC
Notechis scutatus
scutatus
229 27222 1190.81 3 K.SGPTCGDCPSACVNGLCTNPCKYEDDFSN
CK.A CRVP_HOP
ST
Hoplocephalus
stephensii
30 27196 592.949 3 K.YLYVCQYCPAGNIR.G
VESP VESP_DRY
CN
Drysdalia
coronoides
64 21220 749.367 2 R.FSSSPCVLGSPGFR.S
PLA2
INH
PLIA_ELA
QU
Elaphe
quadrivirgata
46 23558 569.305 2 R.FPGDIAYNIK.G
1124.86 3 R.SSHRNCFSSSLCKLEHFDVNTGQETYLR.G
PDE PDE1_CRO
AD
Crotalus
adamanteus
39 98192 678.339 2 K.AATYFWPGSEVK.I
996.995 2 K.VNLMVDQQWMAVRDKK.F
VF VCO31_AU
SSU
Austrelaps
superbus
32 186149 830.333 3 K.CCEDGMHENPMGYTCEKRAK.Y
685.71 3 K.ISVLGDPVAQIIENSIDGSK.L
VCO32_AU
SSU
Austrelaps
superbus
47 185942 933.388 4 K.ASKAAQFQEQNLHKCCEDGMHENPMGYT
CEK.R VCO3_CRO
AD
Crotalus
adamanteus
29 186346 720.342 2 K.LNEDFTVSASGDGK.A
5ʹNUC V5NTD_GL
OBR
Gloydius
brevicaudus
80 65077 725.366 2 R.VVSLNVLCTECR.V
1064.21 3 K.GCALKQAFEHSVHRHGQGMGELLQVSGI
K.V
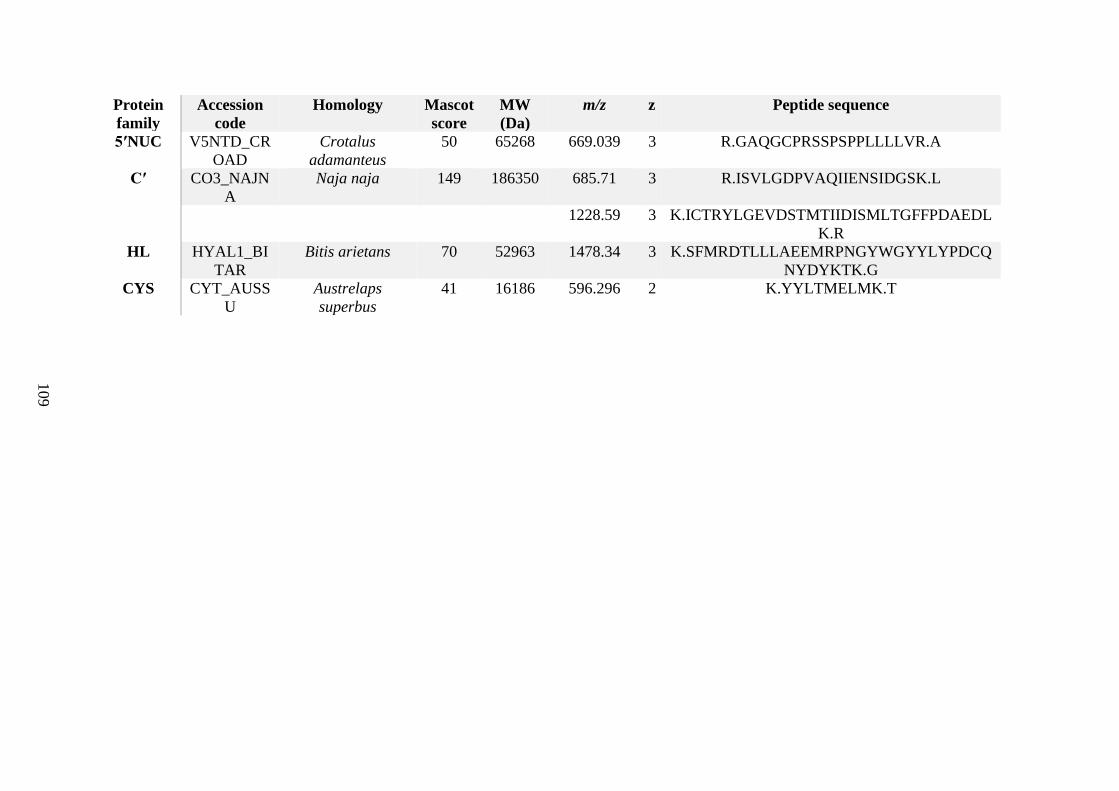
109
Protein
family
Accession
code
Homology Mascot
score
MW
(Da)
m/z z Peptide sequence
5ʹNUC V5NTD_CR
OAD
Crotalus
adamanteus
50 65268 669.039 3 R.GAQGCPRSSPSPPLLLLVR.A
Cʹ CO3_NAJN
A
Naja naja 149 186350 685.71 3 R.ISVLGDPVAQIIENSIDGSK.L
1228.59 3 K.ICTRYLGEVDSTMTIIDISMLTGFFPDAEDL
K.R
HL HYAL1_BI
TAR
Bitis arietans 70 52963 1478.34 3 K.SFMRDTLLLAEEMRPNGYWGYYLYPDCQ
NYDYKTK.G
CYS CYT_AUSS
U
Austrelaps
superbus
41 16186 596.296 2 K.YYLTMELMK.T
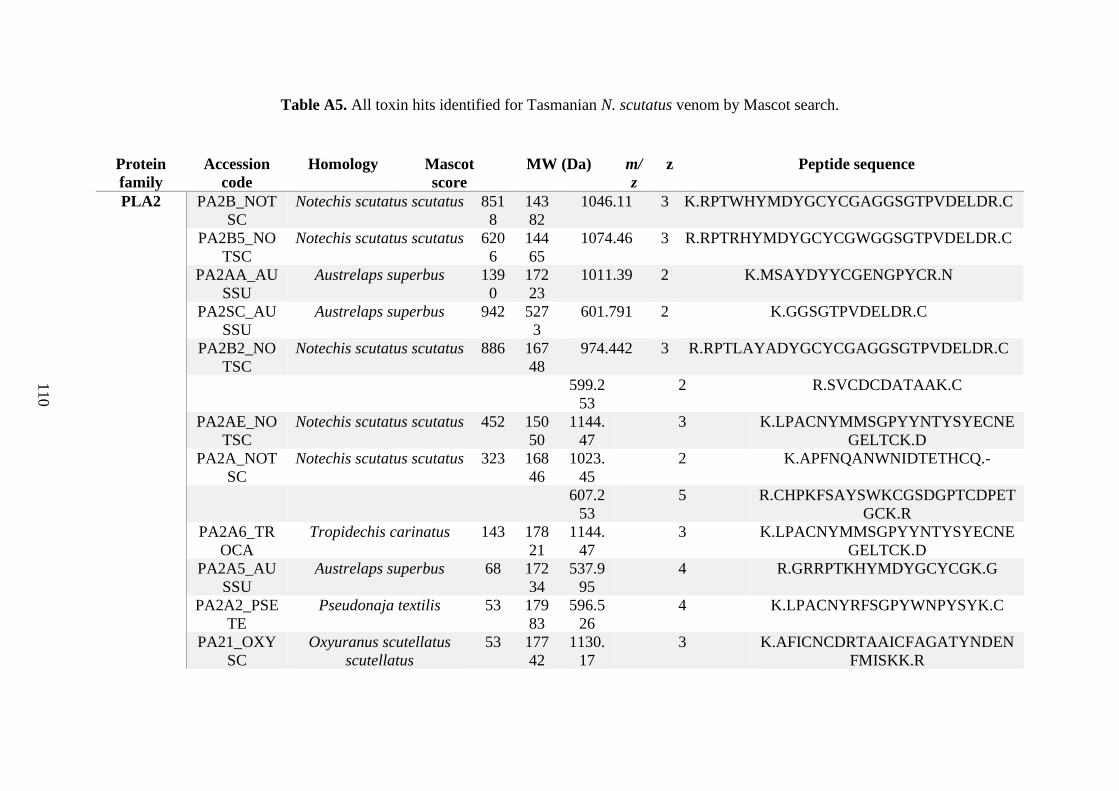
110
Table A5. All toxin hits identified for Tasmanian N. scutatus venom by Mascot search.
Protein
family
Accession
code
Homology Mascot
score
MW (Da) m/
z
z Peptide sequence
PLA2 PA2B_NOT
SC
Notechis scutatus scutatus 851
8
143
82
1046.11 3 K.RPTWHYMDYGCYCGAGGSGTPVDELDR.C
PA2B5_NO
TSC
Notechis scutatus scutatus 620
6
144
65
1074.46 3 R.RPTRHYMDYGCYCGWGGSGTPVDELDR.C
PA2AA_AU
SSU
Austrelaps superbus 139
0
172
23
1011.39 2 K.MSAYDYYCGENGPYCR.N
PA2SC_AU
SSU
Austrelaps superbus 942 527
3
601.791 2 K.GGSGTPVDELDR.C
PA2B2_NO
TSC
Notechis scutatus scutatus 886 167
48
974.442 3 R.RPTLAYADYGCYCGAGGSGTPVDELDR.C
599.2
53
2 R.SVCDCDATAAK.C
PA2AE_NO
TSC
Notechis scutatus scutatus 452 150
50
1144.
47
3 K.LPACNYMMSGPYYNTYSYECNE
GELTCK.D PA2A_NOT
SC
Notechis scutatus scutatus 323 168
46
1023.
45
2 K.APFNQANWNIDTETHCQ.-
607.2
53
5 R.CHPKFSAYSWKCGSDGPTCDPET
GCK.R PA2A6_TR
OCA
Tropidechis carinatus 143 178
21
1144.
47
3 K.LPACNYMMSGPYYNTYSYECNE
GELTCK.D PA2A5_AU
SSU
Austrelaps superbus 68 172
34
537.9
95
4 R.GRRPTKHYMDYGCYCGK.G
PA2A2_PSE
TE
Pseudonaja textilis 53 179
83
596.5
26
4 K.LPACNYRFSGPYWNPYSYK.C
PA21_OXY
SC
Oxyuranus scutellatus
scutellatus
53 177
42
1130.
17
3 K.AFICNCDRTAAICFAGATYNDEN
FMISKK.R
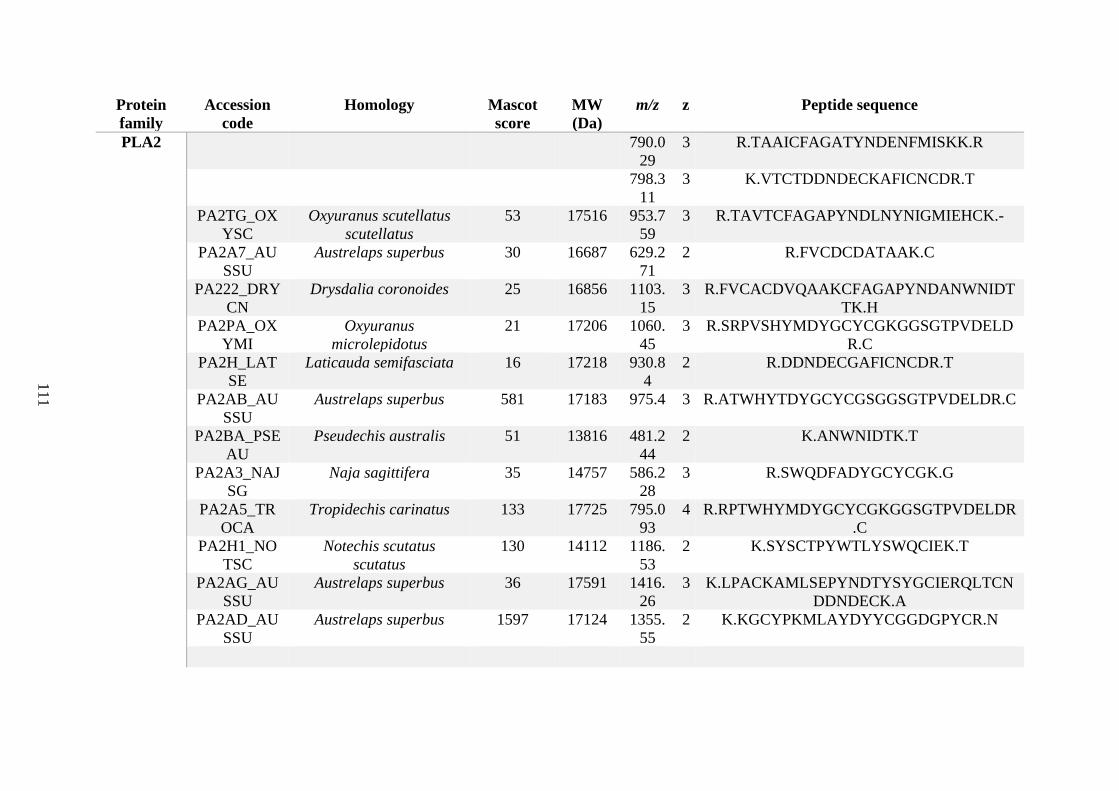
111
Protein
family
Accession
code
Homology Mascot
score
MW
(Da)
m/z z Peptide sequence
PLA2
790.0
29
3 R.TAAICFAGATYNDENFMISKK.R
798.3
11
3 K.VTCTDDNDECKAFICNCDR.T
PA2TG_OX
YSC
Oxyuranus scutellatus
scutellatus
53 17516 953.7
59
3 R.TAVTCFAGAPYNDLNYNIGMIEHCK.-
PA2A7_AU
SSU
Austrelaps superbus 30 16687 629.2
71
2 R.FVCDCDATAAK.C
PA222_DRY
CN
Drysdalia coronoides 25 16856 1103.
15
3 R.FVCACDVQAAKCFAGAPYNDANWNIDT
TK.H PA2PA_OX
YMI
Oxyuranus
microlepidotus
21 17206 1060.
45
3 R.SRPVSHYMDYGCYCGKGGSGTPVDELD
R.C PA2H_LAT
SE
Laticauda semifasciata 16 17218 930.8
4
2 R.DDNDECGAFICNCDR.T
PA2AB_AU
SSU
Austrelaps superbus 581 17183 975.4 3 R.ATWHYTDYGCYCGSGGSGTPVDELDR.C
PA2BA_PSE
AU
Pseudechis australis 51 13816 481.2
44
2 K.ANWNIDTK.T
PA2A3_NAJ
SG
Naja sagittifera 35 14757 586.2
28
3 R.SWQDFADYGCYCGK.G
PA2A5_TR
OCA
Tropidechis carinatus 133 17725 795.0
93
4 R.RPTWHYMDYGCYCGKGGSGTPVDELDR
.C PA2H1_NO
TSC
Notechis scutatus
scutatus
130 14112 1186.
53
2 K.SYSCTPYWTLYSWQCIEK.T
PA2AG_AU
SSU
Austrelaps superbus 36 17591 1416.
26
3 K.LPACKAMLSEPYNDTYSYGCIERQLTCN
DDNDECK.A PA2AD_AU
SSU
Austrelaps superbus 1597 17124 1355.
55
2 K.KGCYPKMLAYDYYCGGDGPYCR.N
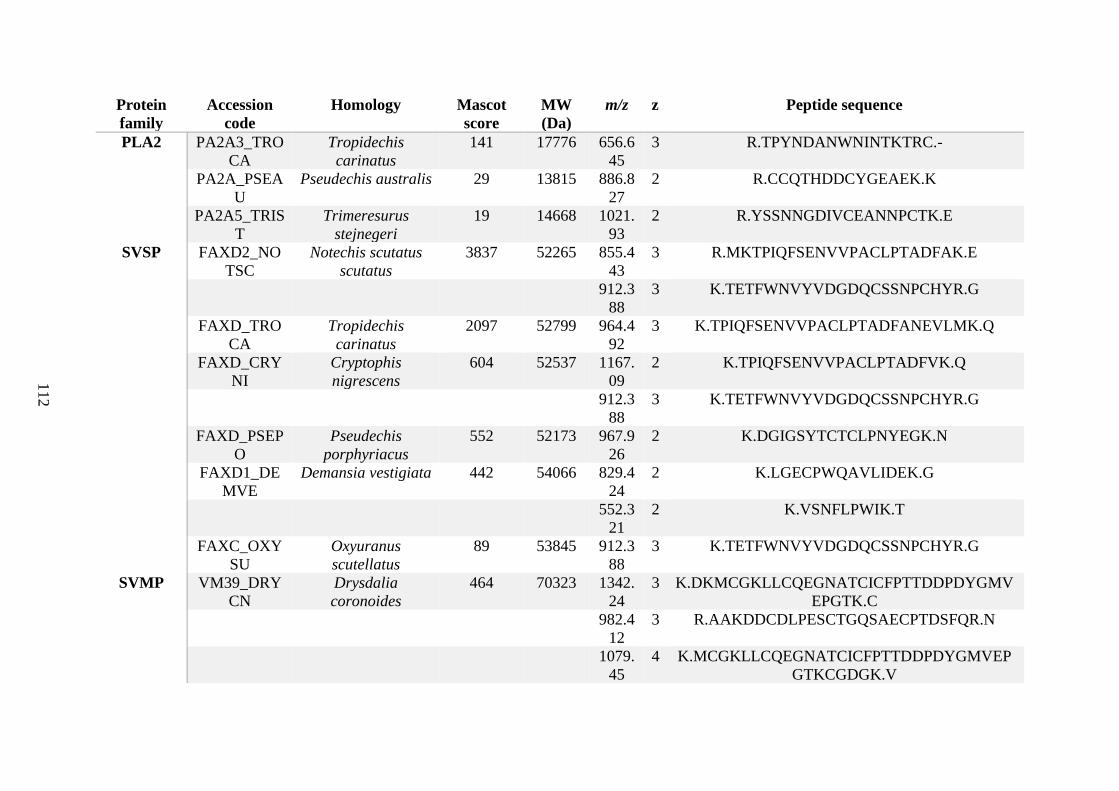
112
Protein
family
Accession
code
Homology Mascot
score
MW
(Da)
m/z z Peptide sequence
PLA2 PA2A3_TRO
CA
Tropidechis
carinatus
141 17776 656.6
45
3 R.TPYNDANWNINTKTRC.-
PA2A_PSEA
U
Pseudechis australis 29 13815 886.8
27
2 R.CCQTHDDCYGEAEK.K
PA2A5_TRIS
T
Trimeresurus
stejnegeri
19 14668 1021.
93
2 R.YSSNNGDIVCEANNPCTK.E
SVSP FAXD2_NO
TSC
Notechis scutatus
scutatus
3837 52265 855.4
43
3 R.MKTPIQFSENVVPACLPTADFAK.E
912.3
88
3 K.TETFWNVYVDGDQCSSNPCHYR.G
FAXD_TRO
CA
Tropidechis
carinatus
2097 52799 964.4
92
3 K.TPIQFSENVVPACLPTADFANEVLMK.Q
FAXD_CRY
NI
Cryptophis
nigrescens
604 52537 1167.
09
2 K.TPIQFSENVVPACLPTADFVK.Q
912.3
88
3 K.TETFWNVYVDGDQCSSNPCHYR.G
FAXD_PSEP
O
Pseudechis
porphyriacus
552 52173 967.9
26
2 K.DGIGSYTCTCLPNYEGK.N
FAXD1_DE
MVE
Demansia vestigiata 442 54066 829.4
24
2 K.LGECPWQAVLIDEK.G
552.3
21
2 K.VSNFLPWIK.T
FAXC_OXY
SU
Oxyuranus
scutellatus
89 53845 912.3
88
3 K.TETFWNVYVDGDQCSSNPCHYR.G
SVMP VM39_DRY
CN
Drysdalia
coronoides
464 70323 1342.
24
3 K.DKMCGKLLCQEGNATCICFPTTDDPDYGMV
EPGTK.C 982.4
12
3 R.AAKDDCDLPESCTGQSAECPTDSFQR.N
1079.
45
4 K.MCGKLLCQEGNATCICFPTTDDPDYGMVEP
GTKCGDGK.V
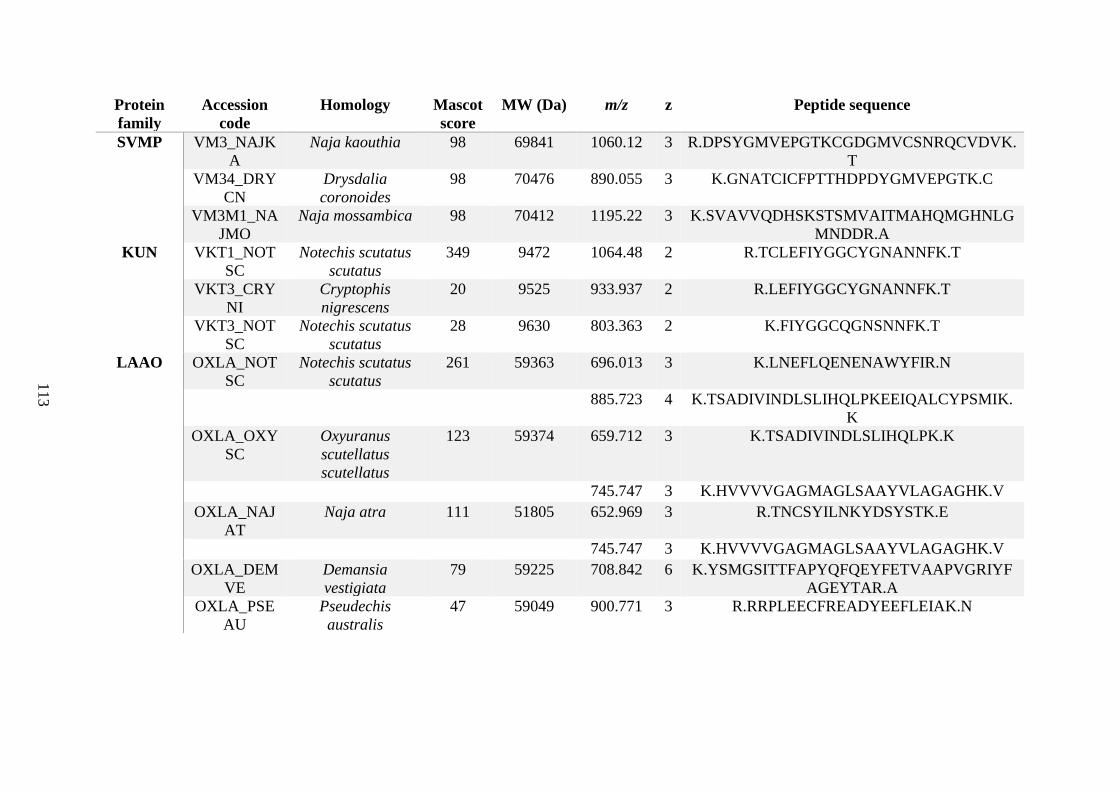
113
Protein
family
Accession
code
Homology Mascot
score
MW (Da) m/z z Peptide sequence
SVMP VM3_NAJK
A
Naja kaouthia 98 69841 1060.12 3 R.DPSYGMVEPGTKCGDGMVCSNRQCVDVK.
T VM34_DRY
CN
Drysdalia
coronoides
98 70476 890.055 3 K.GNATCICFPTTHDPDYGMVEPGTK.C
VM3M1_NA
JMO
Naja mossambica 98 70412 1195.22 3 K.SVAVVQDHSKSTSMVAITMAHQMGHNLG
MNDDR.A
KUN VKT1_NOT
SC
Notechis scutatus
scutatus
349 9472 1064.48 2 R.TCLEFIYGGCYGNANNFK.T
VKT3_CRY
NI
Cryptophis
nigrescens
20 9525 933.937 2 R.LEFIYGGCYGNANNFK.T
VKT3_NOT
SC
Notechis scutatus
scutatus
28 9630 803.363 2 K.FIYGGCQGNSNNFK.T
LAAO OXLA_NOT
SC
Notechis scutatus
scutatus
261 59363 696.013 3 K.LNEFLQENENAWYFIR.N
885.723 4 K.TSADIVINDLSLIHQLPKEEIQALCYPSMIK.
K OXLA_OXY
SC
Oxyuranus
scutellatus
scutellatus
123 59374 659.712 3 K.TSADIVINDLSLIHQLPK.K
745.747 3 K.HVVVVGAGMAGLSAAYVLAGAGHK.V
OXLA_NAJ
AT
Naja atra 111 51805 652.969 3 R.TNCSYILNKYDSYSTK.E
745.747 3 K.HVVVVGAGMAGLSAAYVLAGAGHK.V
OXLA_DEM
VE
Demansia
vestigiata
79 59225 708.842 6 K.YSMGSITTFAPYQFQEYFETVAAPVGRIYF
AGEYTAR.A OXLA_PSE
AU
Pseudechis
australis
47 59049 900.771 3 R.RRPLEECFREADYEEFLEIAK.N
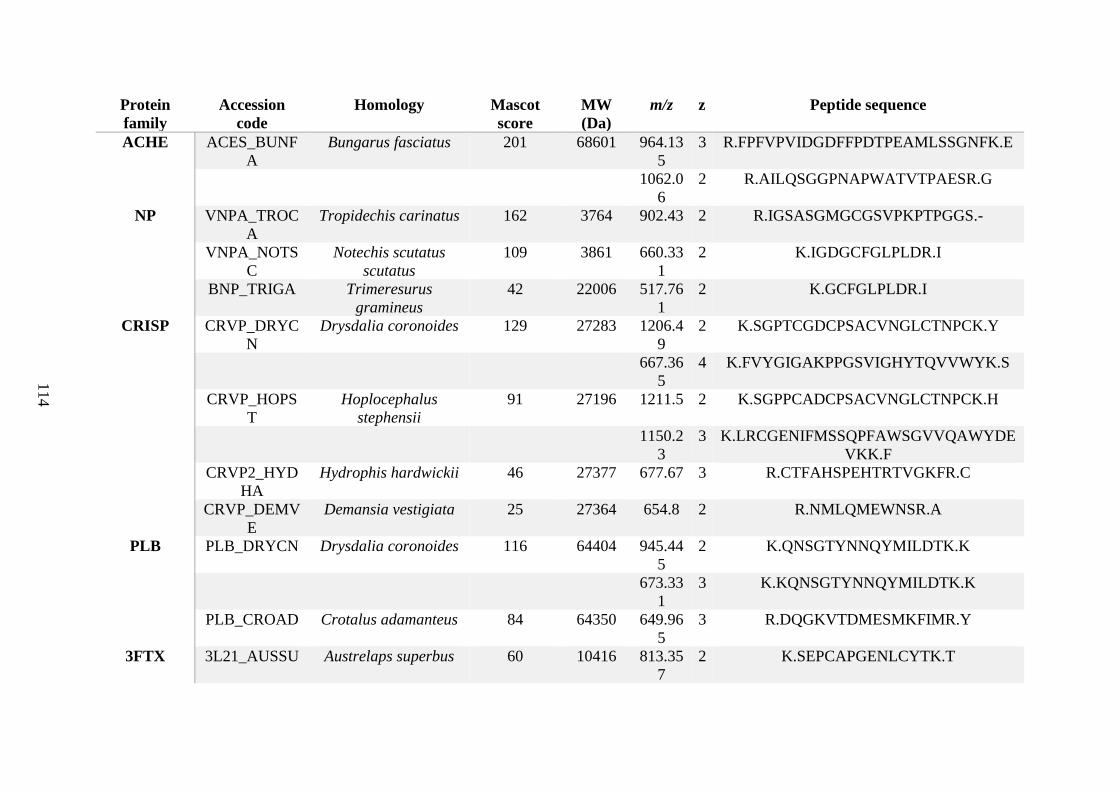
114
Protein
family
Accession
code
Homology Mascot
score
MW
(Da)
m/z z Peptide sequence
ACHE ACES_BUNF
A
Bungarus fasciatus 201 68601 964.13
5
3 R.FPFVPVIDGDFFPDTPEAMLSSGNFK.E
1062.0
6
2 R.AILQSGGPNAPWATVTPAESR.G
NP VNPA_TROC
A
Tropidechis carinatus 162 3764 902.43 2 R.IGSASGMGCGSVPKPTPGGS.-
VNPA_NOTS
C
Notechis scutatus
scutatus
109 3861 660.33
1
2 K.IGDGCFGLPLDR.I
BNP_TRIGA Trimeresurus
gramineus
42 22006 517.76
1
2 K.GCFGLPLDR.I
CRISP CRVP_DRYC
N
Drysdalia coronoides 129 27283 1206.4
9
2 K.SGPTCGDCPSACVNGLCTNPCK.Y
667.36
5
4 K.FVYGIGAKPPGSVIGHYTQVVWYK.S
CRVP_HOPS
T
Hoplocephalus
stephensii
91 27196 1211.5 2 K.SGPPCADCPSACVNGLCTNPCK.H
1150.2
3
3 K.LRCGENIFMSSQPFAWSGVVQAWYDE
VKK.F CRVP2_HYD
HA
Hydrophis hardwickii 46 27377 677.67 3 R.CTFAHSPEHTRTVGKFR.C
CRVP_DEMV
E
Demansia vestigiata 25 27364 654.8 2 R.NMLQMEWNSR.A
PLB PLB_DRYCN Drysdalia coronoides 116 64404 945.44
5
2 K.QNSGTYNNQYMILDTK.K
673.33
1
3 K.KQNSGTYNNQYMILDTK.K
PLB_CROAD Crotalus adamanteus 84 64350 649.96
5
3 R.DQGKVTDMESMKFIMR.Y
3FTX 3L21_AUSSU Austrelaps superbus 60 10416 813.35
7
2 K.SEPCAPGENLCYTK.T
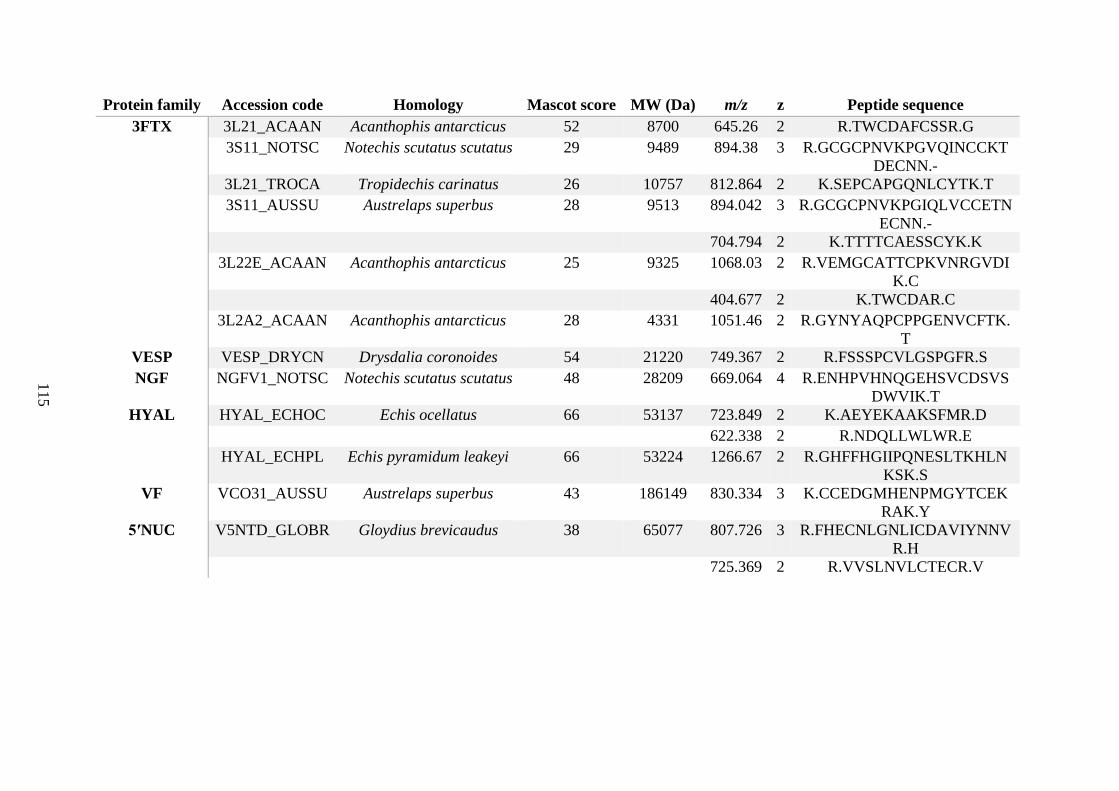
115
Protein family Accession code Homology Mascot score MW (Da) m/z z Peptide sequence
3FTX 3L21_ACAAN Acanthophis antarcticus 52 8700 645.26 2 R.TWCDAFCSSR.G 3S11_NOTSC Notechis scutatus scutatus 29 9489 894.38 3 R.GCGCPNVKPGVQINCCKT
DECNN.- 3L21_TROCA Tropidechis carinatus 26 10757 812.864 2 K.SEPCAPGQNLCYTK.T 3S11_AUSSU Austrelaps superbus 28 9513 894.042 3 R.GCGCPNVKPGIQLVCCETN
ECNN.- 704.794 2 K.TTTTCAESSCYK.K
3L22E_ACAAN Acanthophis antarcticus 25 9325 1068.03 2 R.VEMGCATTCPKVNRGVDI
K.C 404.677 2 K.TWCDAR.C
3L2A2_ACAAN Acanthophis antarcticus 28 4331 1051.46 2 R.GYNYAQPCPPGENVCFTK.
T
VESP VESP_DRYCN Drysdalia coronoides 54 21220 749.367 2 R.FSSSPCVLGSPGFR.S
NGF NGFV1_NOTSC Notechis scutatus scutatus 48 28209 669.064 4 R.ENHPVHNQGEHSVCDSVS
DWVIK.T
HYAL HYAL_ECHOC Echis ocellatus 66 53137 723.849 2 K.AEYEKAAKSFMR.D 622.338 2 R.NDQLLWLWR.E
HYAL_ECHPL Echis pyramidum leakeyi 66 53224 1266.67 2 R.GHFFHGIIPQNESLTKHLN
KSK.S
VF VCO31_AUSSU Austrelaps superbus 43 186149 830.334 3 K.CCEDGMHENPMGYTCEK
RAK.Y
5ʹNUC V5NTD_GLOBR Gloydius brevicaudus 38 65077 807.726 3 R.FHECNLGNLICDAVIYNNV
R.H 725.369 2 R.VVSLNVLCTECR.V
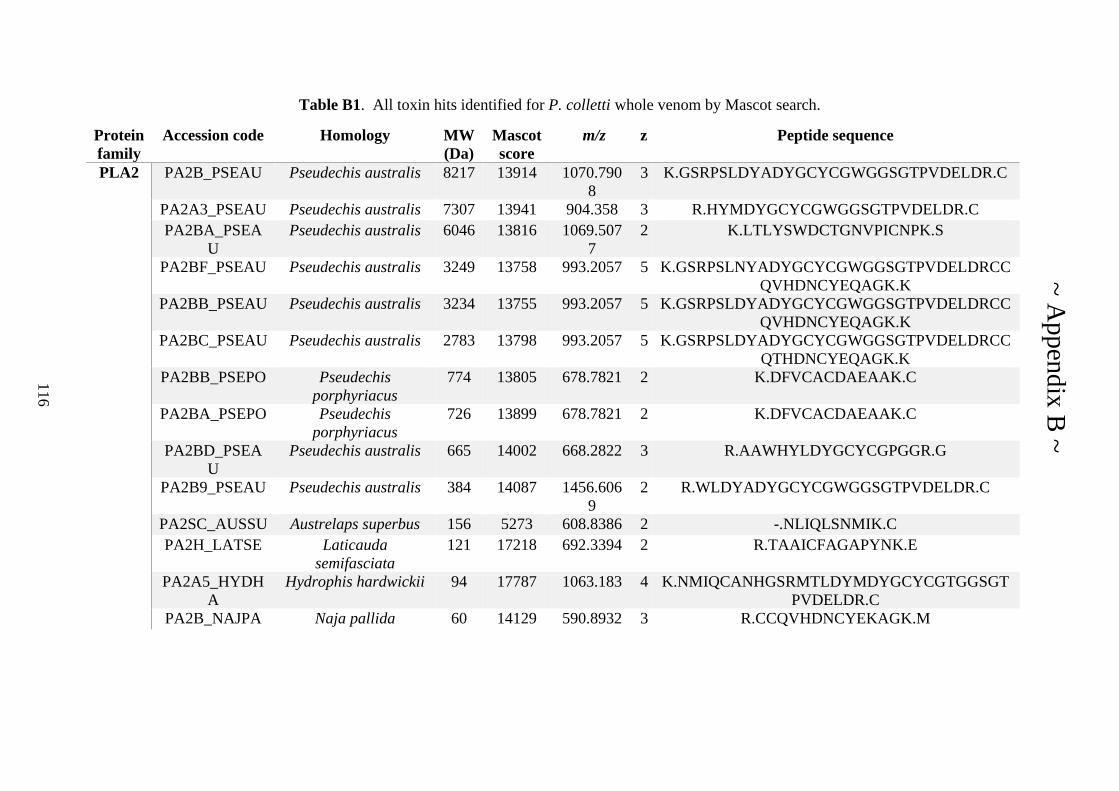
116
Table B1. All toxin hits identified for P. colletti whole venom by Mascot search.
Protein
family
Accession code Homology MW
(Da)
Mascot
score
m/z z Peptide sequence
PLA2 PA2B_PSEAU Pseudechis australis 8217 13914 1070.790
8
3 K.GSRPSLDYADYGCYCGWGGSGTPVDELDR.C
PA2A3_PSEAU Pseudechis australis 7307 13941 904.358 3 R.HYMDYGCYCGWGGSGTPVDELDR.C PA2BA_PSEA
U
Pseudechis australis 6046 13816 1069.507
7
2 K.LTLYSWDCTGNVPICNPK.S
PA2BF_PSEAU Pseudechis australis 3249 13758 993.2057 5 K.GSRPSLNYADYGCYCGWGGSGTPVDELDRCC
QVHDNCYEQAGK.K PA2BB_PSEAU Pseudechis australis 3234 13755 993.2057 5 K.GSRPSLDYADYGCYCGWGGSGTPVDELDRCC
QVHDNCYEQAGK.K PA2BC_PSEAU Pseudechis australis 2783 13798 993.2057 5 K.GSRPSLDYADYGCYCGWGGSGTPVDELDRCC
QTHDNCYEQAGK.K PA2BB_PSEPO Pseudechis
porphyriacus
774 13805 678.7821 2 K.DFVCACDAEAAK.C
PA2BA_PSEPO Pseudechis
porphyriacus
726 13899 678.7821 2 K.DFVCACDAEAAK.C
PA2BD_PSEA
U
Pseudechis australis 665 14002 668.2822 3 R.AAWHYLDYGCYCGPGGR.G
PA2B9_PSEAU Pseudechis australis 384 14087 1456.606
9
2 R.WLDYADYGCYCGWGGSGTPVDELDR.C
PA2SC_AUSSU Austrelaps superbus 156 5273 608.8386 2 -.NLIQLSNMIK.C PA2H_LATSE Laticauda
semifasciata
121 17218 692.3394 2 R.TAAICFAGAPYNK.E
PA2A5_HYDH
A
Hydrophis hardwickii 94 17787 1063.183 4 K.NMIQCANHGSRMTLDYMDYGCYCGTGGSGT
PVDELDR.C PA2B_NAJPA Naja pallida 60 14129 590.8932 3 R.CCQVHDNCYEKAGK.M
~ A
ppen
dix
B ~
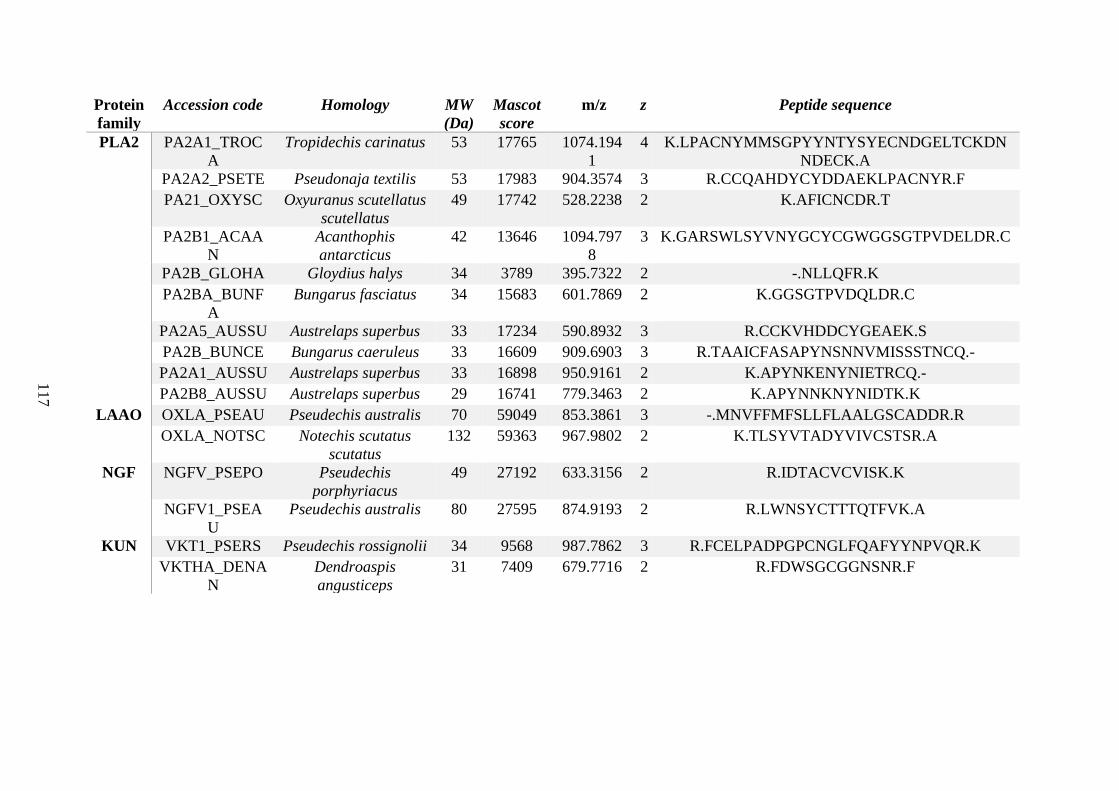
117
Protein
family
Accession code Homology MW
(Da)
Mascot
score
m/z z Peptide sequence
PLA2 PA2A1_TROC
A
Tropidechis carinatus 53 17765 1074.194
1
4 K.LPACNYMMSGPYYNTYSYECNDGELTCKDN
NDECK.A PA2A2_PSETE Pseudonaja textilis 53 17983 904.3574 3 R.CCQAHDYCYDDAEKLPACNYR.F PA21_OXYSC Oxyuranus scutellatus
scutellatus
49 17742 528.2238 2 K.AFICNCDR.T
PA2B1_ACAA
N
Acanthophis
antarcticus
42 13646 1094.797
8
3 K.GARSWLSYVNYGCYCGWGGSGTPVDELDR.C
PA2B_GLOHA Gloydius halys 34 3789 395.7322 2 -.NLLQFR.K PA2BA_BUNF
A
Bungarus fasciatus 34 15683 601.7869 2 K.GGSGTPVDQLDR.C
PA2A5_AUSSU Austrelaps superbus 33 17234 590.8932 3 R.CCKVHDDCYGEAEK.S PA2B_BUNCE Bungarus caeruleus 33 16609 909.6903 3 R.TAAICFASAPYNSNNVMISSSTNCQ.- PA2A1_AUSSU Austrelaps superbus 33 16898 950.9161 2 K.APYNKENYNIETRCQ.- PA2B8_AUSSU Austrelaps superbus 29 16741 779.3463 2 K.APYNNKNYNIDTK.K
LAAO OXLA_PSEAU Pseudechis australis 70 59049 853.3861 3 -.MNVFFMFSLLFLAALGSCADDR.R OXLA_NOTSC Notechis scutatus
scutatus
132 59363 967.9802 2 K.TLSYVTADYVIVCSTSR.A
NGF NGFV_PSEPO Pseudechis
porphyriacus
49 27192 633.3156 2 R.IDTACVCVISK.K
NGFV1_PSEA
U
Pseudechis australis 80 27595 874.9193 2 R.LWNSYCTTTQTFVK.A
KUN VKT1_PSERS Pseudechis rossignolii 34 9568 987.7862 3 R.FCELPADPGPCNGLFQAFYYNPVQR.K VKTHA_DENA
N
Dendroaspis
angusticeps
31 7409 679.7716 2 R.FDWSGCGGNSNR.F
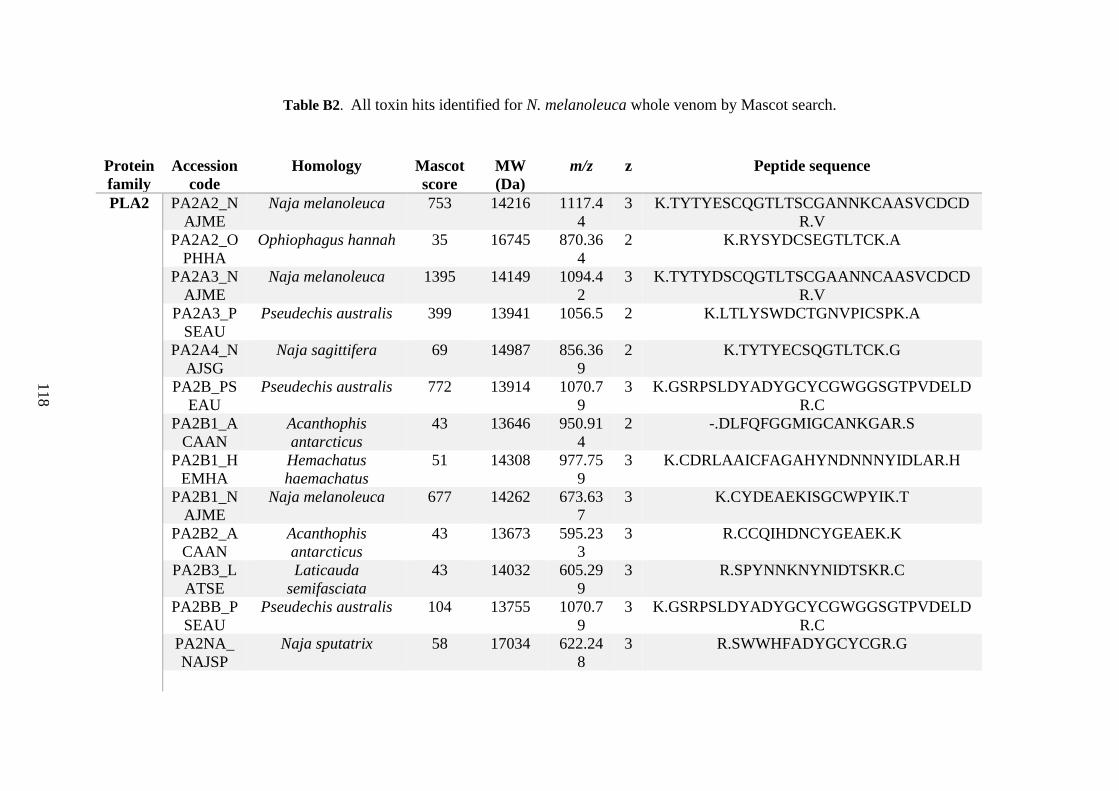
118
Table B2. All toxin hits identified for N. melanoleuca whole venom by Mascot search.
Protein
family
Accession
code
Homology Mascot
score
MW
(Da)
m/z z Peptide sequence
PLA2 PA2A2_N
AJME
Naja melanoleuca 753 14216 1117.4
4
3 K.TYTYESCQGTLTSCGANNKCAASVCDCD
R.V PA2A2_O
PHHA
Ophiophagus hannah 35 16745 870.36
4
2 K.RYSYDCSEGTLTCK.A
PA2A3_N
AJME
Naja melanoleuca 1395 14149 1094.4
2
3 K.TYTYDSCQGTLTSCGAANNCAASVCDCD
R.V PA2A3_P
SEAU
Pseudechis australis 399 13941 1056.5 2 K.LTLYSWDCTGNVPICSPK.A
PA2A4_N
AJSG
Naja sagittifera 69 14987 856.36
9
2 K.TYTYECSQGTLTCK.G
PA2B_PS
EAU
Pseudechis australis 772 13914 1070.7
9
3 K.GSRPSLDYADYGCYCGWGGSGTPVDELD
R.C PA2B1_A
CAAN
Acanthophis
antarcticus
43 13646 950.91
4
2 -.DLFQFGGMIGCANKGAR.S
PA2B1_H
EMHA
Hemachatus
haemachatus
51 14308 977.75
9
3 K.CDRLAAICFAGAHYNDNNNYIDLAR.H
PA2B1_N
AJME
Naja melanoleuca 677 14262 673.63
7
3 K.CYDEAEKISGCWPYIK.T
PA2B2_A
CAAN
Acanthophis
antarcticus
43 13673 595.23
3
3 R.CCQIHDNCYGEAEK.K
PA2B3_L
ATSE
Laticauda
semifasciata
43 14032 605.29
9
3 R.SPYNNKNYNIDTSKR.C
PA2BB_P
SEAU
Pseudechis australis 104 13755 1070.7
9
3 K.GSRPSLDYADYGCYCGWGGSGTPVDELD
R.C PA2NA_
NAJSP
Naja sputatrix 58 17034 622.24
8
3 R.SWWHFADYGCYCGR.G
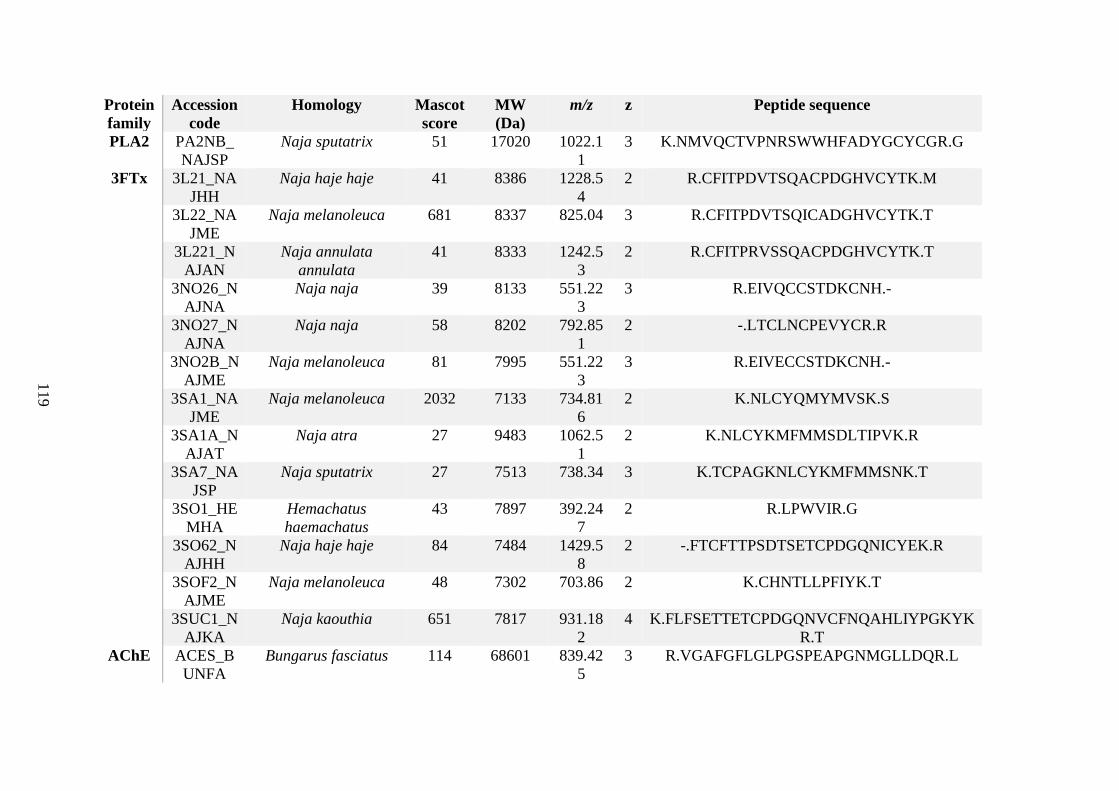
119
Protein
family
Accession
code
Homology Mascot
score
MW
(Da)
m/z z Peptide sequence
PLA2 PA2NB_
NAJSP
Naja sputatrix 51 17020 1022.1
1
3 K.NMVQCTVPNRSWWHFADYGCYCGR.G
3FTx 3L21_NA
JHH
Naja haje haje 41 8386 1228.5
4
2 R.CFITPDVTSQACPDGHVCYTK.M
3L22_NA
JME
Naja melanoleuca 681 8337 825.04 3 R.CFITPDVTSQICADGHVCYTK.T
3L221_N
AJAN
Naja annulata
annulata
41 8333 1242.5
3
2 R.CFITPRVSSQACPDGHVCYTK.T
3NO26_N
AJNA
Naja naja 39 8133 551.22
3
3 R.EIVQCCSTDKCNH.-
3NO27_N
AJNA
Naja naja 58 8202 792.85
1
2 -.LTCLNCPEVYCR.R
3NO2B_N
AJME
Naja melanoleuca 81 7995 551.22
3
3 R.EIVECCSTDKCNH.-
3SA1_NA
JME
Naja melanoleuca 2032 7133 734.81
6
2 K.NLCYQMYMVSK.S
3SA1A_N
AJAT
Naja atra 27 9483 1062.5
1
2 K.NLCYKMFMMSDLTIPVK.R
3SA7_NA
JSP
Naja sputatrix 27 7513 738.34 3 K.TCPAGKNLCYKMFMMSNK.T
3SO1_HE
MHA
Hemachatus
haemachatus
43 7897 392.24
7
2 R.LPWVIR.G
3SO62_N
AJHH
Naja haje haje 84 7484 1429.5
8
2 -.FTCFTTPSDTSETCPDGQNICYEK.R
3SOF2_N
AJME
Naja melanoleuca 48 7302 703.86 2 K.CHNTLLPFIYK.T
3SUC1_N
AJKA
Naja kaouthia 651 7817 931.18
2
4 K.FLFSETTETCPDGQNVCFNQAHLIYPGKYK
R.T
AChE ACES_B
UNFA
Bungarus fasciatus 114 68601 839.42
5
3 R.VGAFGFLGLPGSPEAPGNMGLLDQR.L
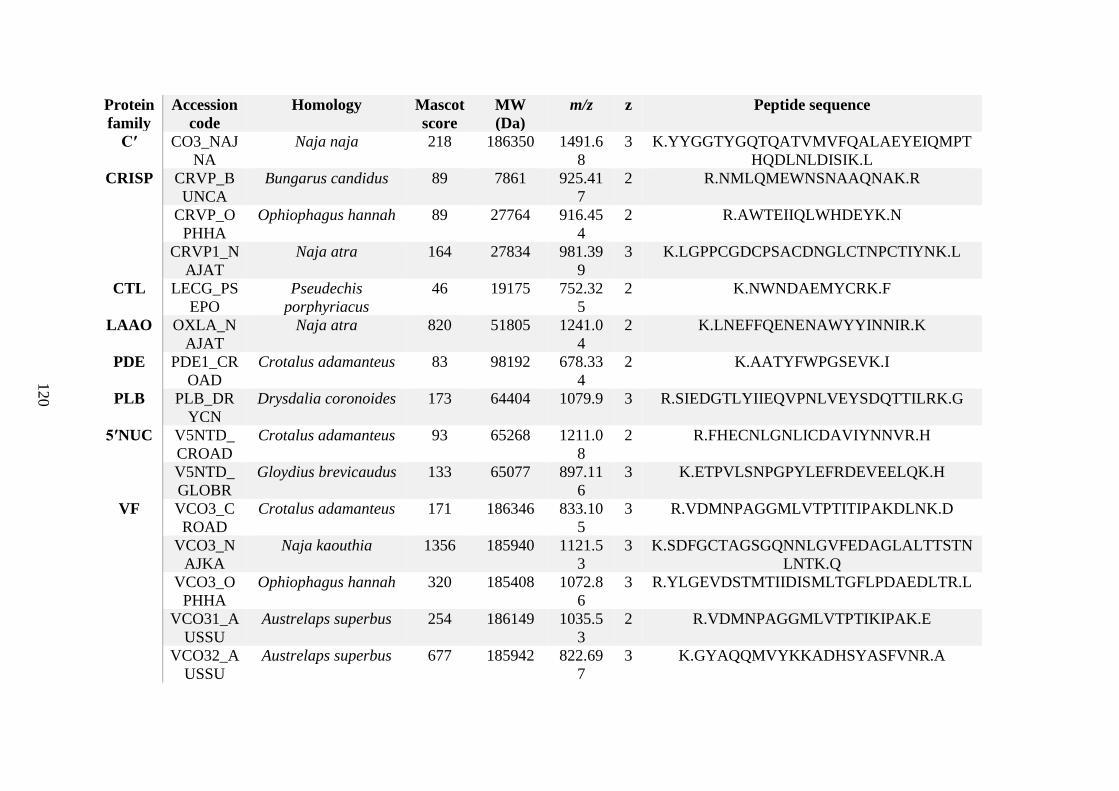
120
Protein
family
Accession
code
Homology Mascot
score
MW
(Da)
m/z z Peptide sequence
Cʹ CO3_NAJ
NA
Naja naja 218 186350 1491.6
8
3 K.YYGGTYGQTQATVMVFQALAEYEIQMPT
HQDLNLDISIK.L
CRISP CRVP_B
UNCA
Bungarus candidus 89 7861 925.41
7
2 R.NMLQMEWNSNAAQNAK.R
CRVP_O
PHHA
Ophiophagus hannah 89 27764 916.45
4
2 R.AWTEIIQLWHDEYK.N
CRVP1_N
AJAT
Naja atra 164 27834 981.39
9
3 K.LGPPCGDCPSACDNGLCTNPCTIYNK.L
CTL LECG_PS
EPO
Pseudechis
porphyriacus
46 19175 752.32
5
2 K.NWNDAEMYCRK.F
LAAO OXLA_N
AJAT
Naja atra 820 51805 1241.0
4
2 K.LNEFFQENENAWYYINNIR.K
PDE PDE1_CR
OAD
Crotalus adamanteus 83 98192 678.33
4
2 K.AATYFWPGSEVK.I
PLB PLB_DR
YCN
Drysdalia coronoides 173 64404 1079.9 3 R.SIEDGTLYIIEQVPNLVEYSDQTTILRK.G
5ʹNUC V5NTD_
CROAD
Crotalus adamanteus 93 65268 1211.0
8
2 R.FHECNLGNLICDAVIYNNVR.H
V5NTD_
GLOBR
Gloydius brevicaudus 133 65077 897.11
6
3 K.ETPVLSNPGPYLEFRDEVEELQK.H
VF VCO3_C
ROAD
Crotalus adamanteus 171 186346 833.10
5
3 R.VDMNPAGGMLVTPTITIPAKDLNK.D
VCO3_N
AJKA
Naja kaouthia 1356 185940 1121.5
3
3 K.SDFGCTAGSGQNNLGVFEDAGLALTTSTN
LNTK.Q VCO3_O
PHHA
Ophiophagus hannah 320 185408 1072.8
6
3 R.YLGEVDSTMTIIDISMLTGFLPDAEDLTR.L
VCO31_A
USSU
Austrelaps superbus 254 186149 1035.5
3
2 R.VDMNPAGGMLVTPTIKIPAK.E
VCO32_A
USSU
Austrelaps superbus 677 185942 822.69
7
3 K.GYAQQMVYKKADHSYASFVNR.A
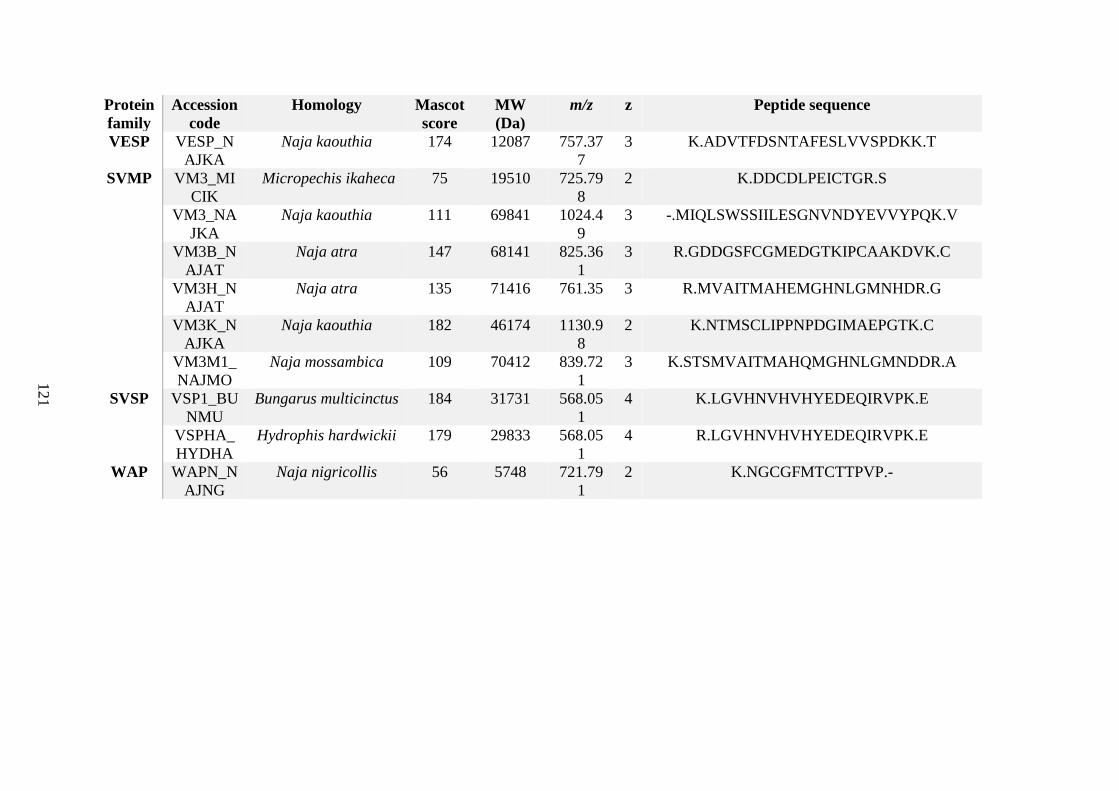
121
Protein
family
Accession
code
Homology Mascot
score
MW
(Da)
m/z z Peptide sequence
VESP VESP_N
AJKA
Naja kaouthia 174 12087 757.37
7
3 K.ADVTFDSNTAFESLVVSPDKK.T
SVMP VM3_MI
CIK
Micropechis ikaheca 75 19510 725.79
8
2 K.DDCDLPEICTGR.S
VM3_NA
JKA
Naja kaouthia 111 69841 1024.4
9
3 -.MIQLSWSSIILESGNVNDYEVVYPQK.V
VM3B_N
AJAT
Naja atra 147 68141 825.36
1
3 R.GDDGSFCGMEDGTKIPCAAKDVK.C
VM3H_N
AJAT
Naja atra 135 71416 761.35 3 R.MVAITMAHEMGHNLGMNHDR.G
VM3K_N
AJKA
Naja kaouthia 182 46174 1130.9
8
2 K.NTMSCLIPPNPDGIMAEPGTK.C
VM3M1_
NAJMO
Naja mossambica 109 70412 839.72
1
3 K.STSMVAITMAHQMGHNLGMNDDR.A
SVSP VSP1_BU
NMU
Bungarus multicinctus 184 31731 568.05
1
4 K.LGVHNVHVHYEDEQIRVPK.E
VSPHA_
HYDHA
Hydrophis hardwickii 179 29833 568.05
1
4 R.LGVHNVHVHYEDEQIRVPK.E
WAP WAPN_N
AJNG
Naja nigricollis 56 5748 721.79
1
2 K.NGCGFMTCTTPVP.-
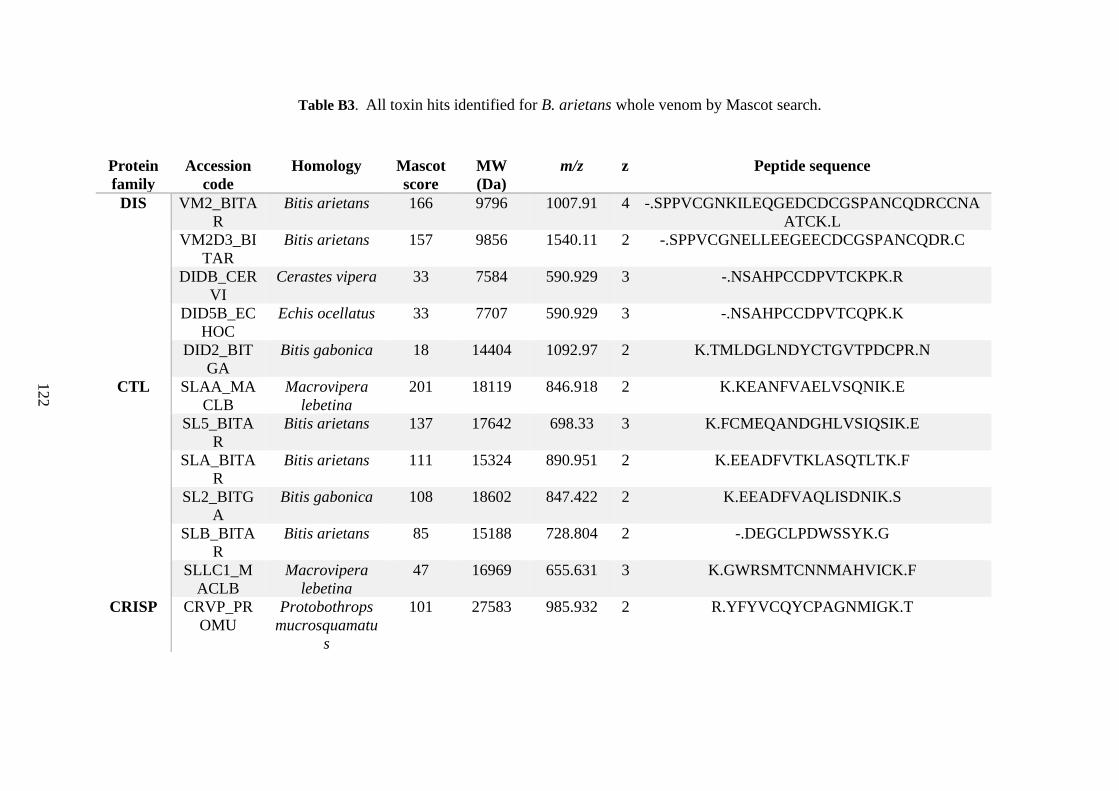
122
Table B3. All toxin hits identified for B. arietans whole venom by Mascot search.
Protein
family
Accession
code
Homology Mascot
score
MW
(Da)
m/z z Peptide sequence
DIS VM2_BITA
R
Bitis arietans 166 9796 1007.91 4 -.SPPVCGNKILEQGEDCDCGSPANCQDRCCNA
ATCK.L VM2D3_BI
TAR
Bitis arietans 157 9856 1540.11 2 -.SPPVCGNELLEEGEECDCGSPANCQDR.C
DIDB_CER
VI
Cerastes vipera 33 7584 590.929 3 -.NSAHPCCDPVTCKPK.R
DID5B_EC
HOC
Echis ocellatus 33 7707 590.929 3 -.NSAHPCCDPVTCQPK.K
DID2_BIT
GA
Bitis gabonica 18 14404 1092.97 2 K.TMLDGLNDYCTGVTPDCPR.N
CTL SLAA_MA
CLB
Macrovipera
lebetina
201 18119 846.918 2 K.KEANFVAELVSQNIK.E
SL5_BITA
R
Bitis arietans 137 17642 698.33 3 K.FCMEQANDGHLVSIQSIK.E
SLA_BITA
R
Bitis arietans 111 15324 890.951 2 K.EEADFVTKLASQTLTK.F
SL2_BITG
A
Bitis gabonica 108 18602 847.422 2 K.EEADFVAQLISDNIK.S
SLB_BITA
R
Bitis arietans 85 15188 728.804 2 -.DEGCLPDWSSYK.G
SLLC1_M
ACLB
Macrovipera
lebetina
47 16969 655.631 3 K.GWRSMTCNNMAHVICK.F
CRISP CRVP_PR
OMU
Protobothrops
mucrosquamatu
s
101 27583 985.932 2 R.YFYVCQYCPAGNMIGK.T
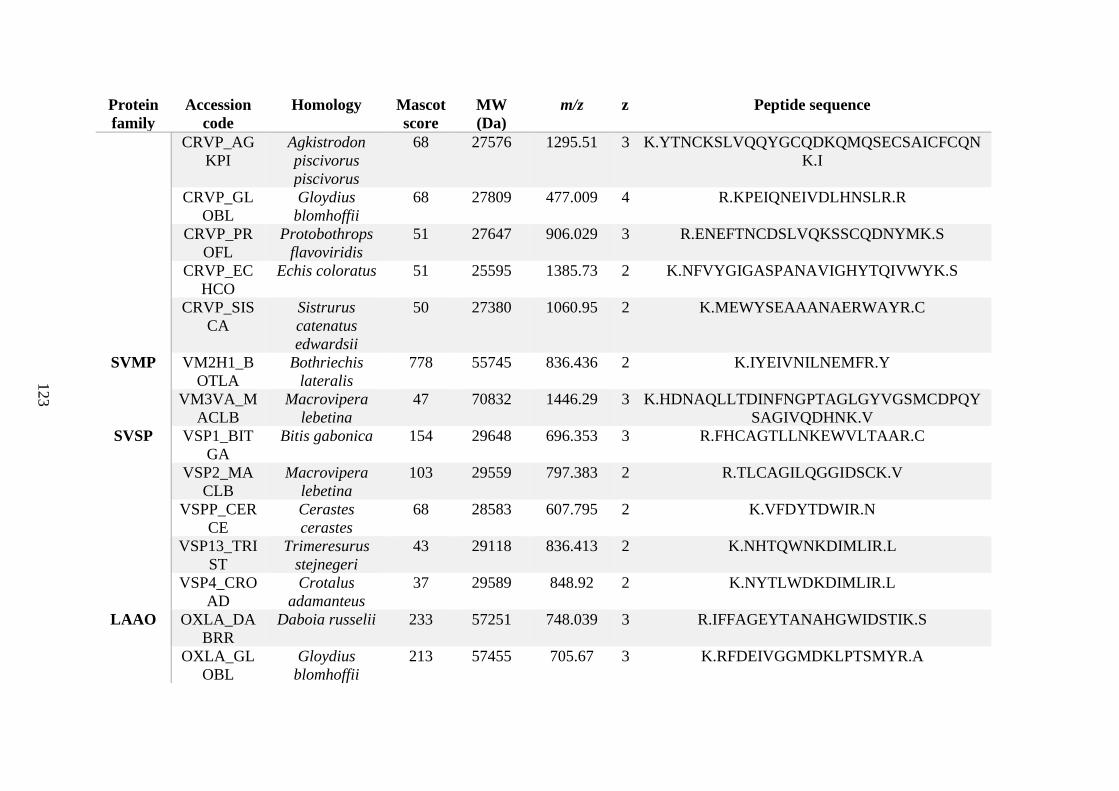
123
Protein
family
Accession
code
Homology Mascot
score
MW
(Da)
m/z z Peptide sequence
CRVP_AG
KPI
Agkistrodon
piscivorus
piscivorus
68 27576 1295.51 3 K.YTNCKSLVQQYGCQDKQMQSECSAICFCQN
K.I
CRVP_GL
OBL
Gloydius
blomhoffii
68 27809 477.009 4 R.KPEIQNEIVDLHNSLR.R
CRVP_PR
OFL
Protobothrops
flavoviridis
51 27647 906.029 3 R.ENEFTNCDSLVQKSSCQDNYMK.S
CRVP_EC
HCO
Echis coloratus 51 25595 1385.73 2 K.NFVYGIGASPANAVIGHYTQIVWYK.S
CRVP_SIS
CA
Sistrurus
catenatus
edwardsii
50 27380 1060.95 2 K.MEWYSEAAANAERWAYR.C
SVMP VM2H1_B
OTLA
Bothriechis
lateralis
778 55745 836.436 2 K.IYEIVNILNEMFR.Y
VM3VA_M
ACLB
Macrovipera
lebetina
47 70832 1446.29 3 K.HDNAQLLTDINFNGPTAGLGYVGSMCDPQY
SAGIVQDHNK.V
SVSP VSP1_BIT
GA
Bitis gabonica 154 29648 696.353 3 R.FHCAGTLLNKEWVLTAAR.C
VSP2_MA
CLB
Macrovipera
lebetina
103 29559 797.383 2 R.TLCAGILQGGIDSCK.V
VSPP_CER
CE
Cerastes
cerastes
68 28583 607.795 2 K.VFDYTDWIR.N
VSP13_TRI
ST
Trimeresurus
stejnegeri
43 29118 836.413 2 K.NHTQWNKDIMLIR.L
VSP4_CRO
AD
Crotalus
adamanteus
37 29589 848.92 2 K.NYTLWDKDIMLIR.L
LAAO OXLA_DA
BRR
Daboia russelii 233 57251 748.039 3 R.IFFAGEYTANAHGWIDSTIK.S
OXLA_GL
OBL
Gloydius
blomhoffii
213 57455 705.67 3 K.RFDEIVGGMDKLPTSMYR.A
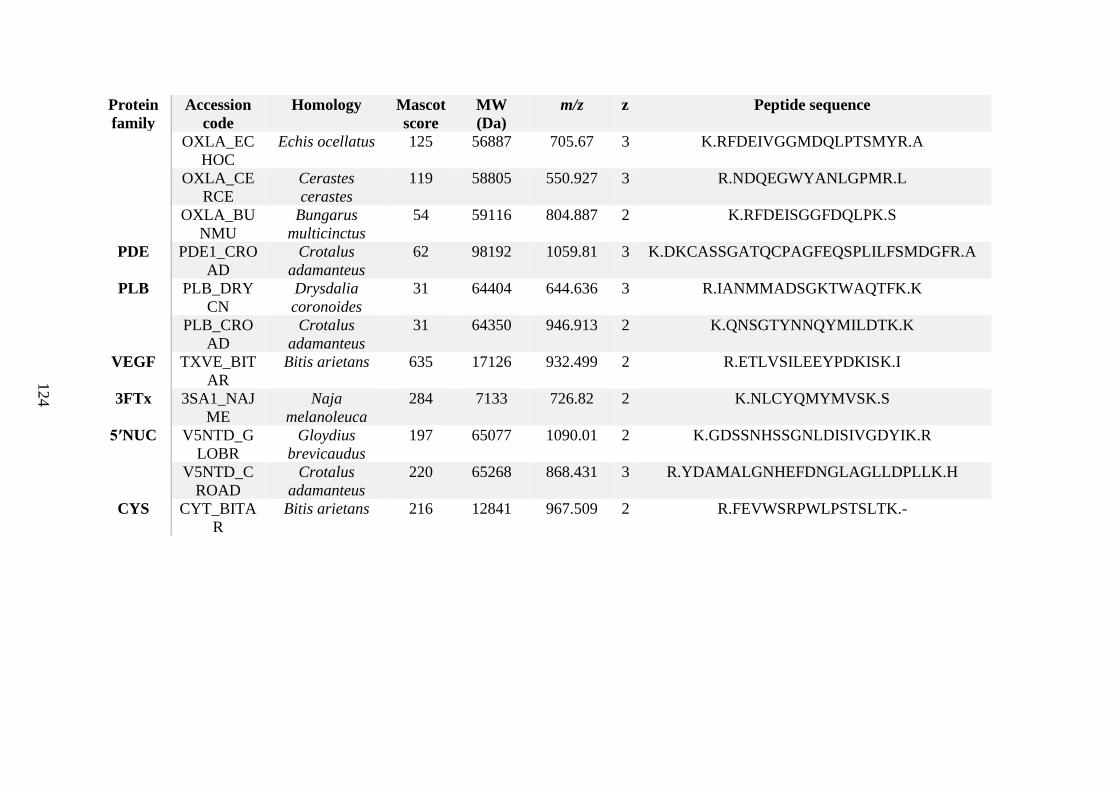
124
Protein
family
Accession
code
Homology Mascot
score
MW
(Da)
m/z z Peptide sequence
OXLA_EC
HOC
Echis ocellatus 125 56887 705.67 3 K.RFDEIVGGMDQLPTSMYR.A
OXLA_CE
RCE
Cerastes
cerastes
119 58805 550.927 3 R.NDQEGWYANLGPMR.L
OXLA_BU
NMU
Bungarus
multicinctus
54 59116 804.887 2 K.RFDEISGGFDQLPK.S
PDE PDE1_CRO
AD
Crotalus
adamanteus
62 98192 1059.81 3 K.DKCASSGATQCPAGFEQSPLILFSMDGFR.A
PLB PLB_DRY
CN
Drysdalia
coronoides
31 64404 644.636 3 R.IANMMADSGKTWAQTFK.K
PLB_CRO
AD
Crotalus
adamanteus
31 64350 946.913 2 K.QNSGTYNNQYMILDTK.K
VEGF TXVE_BIT
AR
Bitis arietans 635 17126 932.499 2 R.ETLVSILEEYPDKISK.I
3FTx 3SA1_NAJ
ME
Naja
melanoleuca
284 7133 726.82 2 K.NLCYQMYMVSK.S
5ʹNUC V5NTD_G
LOBR
Gloydius
brevicaudus
197 65077 1090.01 2 K.GDSSNHSSGNLDISIVGDYIK.R
V5NTD_C
ROAD
Crotalus
adamanteus
220 65268 868.431 3 R.YDAMALGNHEFDNGLAGLLDPLLK.H
CYS CYT_BITA
R
Bitis arietans 216 12841 967.509 2 R.FEVWSRPWLPSTSLTK.-
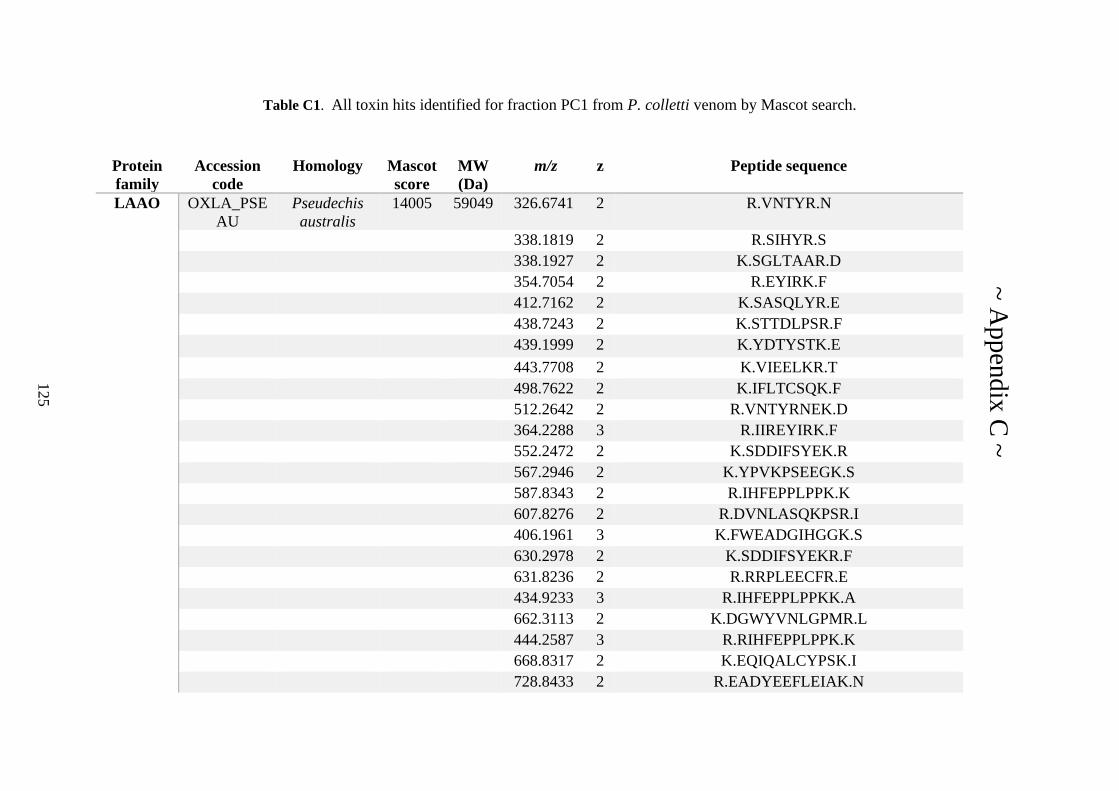
125
Table C1. All toxin hits identified for fraction PC1 from P. colletti venom by Mascot search.
Protein
family
Accession
code
Homology Mascot
score
MW
(Da)
m/z z Peptide sequence
LAAO OXLA_PSE
AU
Pseudechis
australis
14005 59049 326.6741 2 R.VNTYR.N
338.1819 2 R.SIHYR.S
338.1927 2 K.SGLTAAR.D
354.7054 2 R.EYIRK.F
412.7162 2 K.SASQLYR.E
438.7243 2 K.STTDLPSR.F
439.1999 2 K.YDTYSTK.E
443.7708 2 K.VIEELKR.T
498.7622 2 K.IFLTCSQK.F
512.2642 2 R.VNTYRNEK.D
364.2288 3 R.IIREYIRK.F
552.2472 2 K.SDDIFSYEK.R
567.2946 2 K.YPVKPSEEGK.S
587.8343 2 R.IHFEPPLPPK.K
607.8276 2 R.DVNLASQKPSR.I
406.1961 3 K.FWEADGIHGGK.S
630.2978 2 K.SDDIFSYEKR.F
631.8236 2 R.RRPLEECFR.E
434.9233 3 R.IHFEPPLPPKK.A
662.3113 2 K.DGWYVNLGPMR.L
444.2587 3 R.RIHFEPPLPPK.K
668.8317 2 K.EQIQALCYPSK.I
728.8433 2 R.EADYEEFLEIAK.N
~ A
ppen
dix
C ~
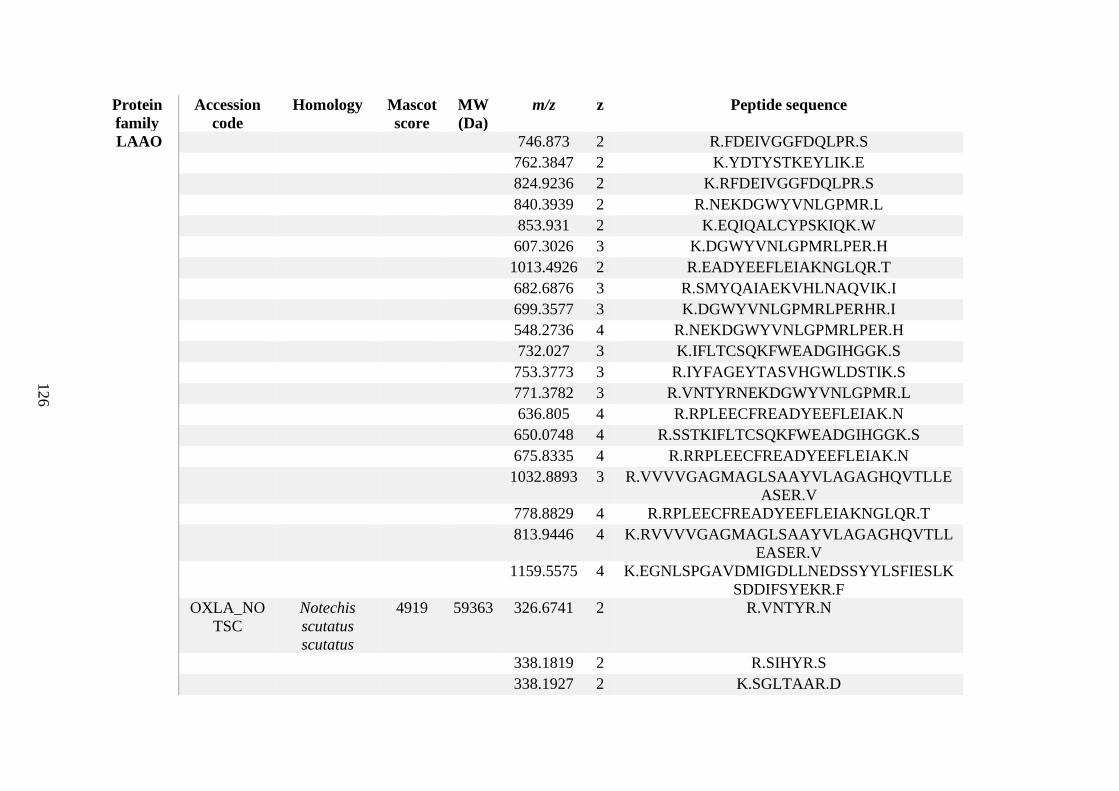
126
Protein
family
Accession
code
Homology Mascot
score
MW
(Da)
m/z z Peptide sequence
LAAO 746.873 2 R.FDEIVGGFDQLPR.S
762.3847 2 K.YDTYSTKEYLIK.E
824.9236 2 K.RFDEIVGGFDQLPR.S
840.3939 2 R.NEKDGWYVNLGPMR.L
853.931 2 K.EQIQALCYPSKIQK.W
607.3026 3 K.DGWYVNLGPMRLPER.H
1013.4926 2 R.EADYEEFLEIAKNGLQR.T
682.6876 3 R.SMYQAIAEKVHLNAQVIK.I
699.3577 3 K.DGWYVNLGPMRLPERHR.I
548.2736 4 R.NEKDGWYVNLGPMRLPER.H
732.027 3 K.IFLTCSQKFWEADGIHGGK.S
753.3773 3 R.IYFAGEYTASVHGWLDSTIK.S
771.3782 3 R.VNTYRNEKDGWYVNLGPMR.L
636.805 4 R.RPLEECFREADYEEFLEIAK.N
650.0748 4 R.SSTKIFLTCSQKFWEADGIHGGK.S
675.8335 4 R.RRPLEECFREADYEEFLEIAK.N
1032.8893 3 R.VVVVGAGMAGLSAAYVLAGAGHQVTLLE
ASER.V
778.8829 4 R.RPLEECFREADYEEFLEIAKNGLQR.T
813.9446 4 K.RVVVVGAGMAGLSAAYVLAGAGHQVTLL
EASER.V
1159.5575 4 K.EGNLSPGAVDMIGDLLNEDSSYYLSFIESLK
SDDIFSYEKR.F
OXLA_NO
TSC
Notechis
scutatus
scutatus
4919 59363 326.6741 2 R.VNTYR.N
338.1819 2 R.SIHYR.S
338.1927 2 K.SGLTAAR.D
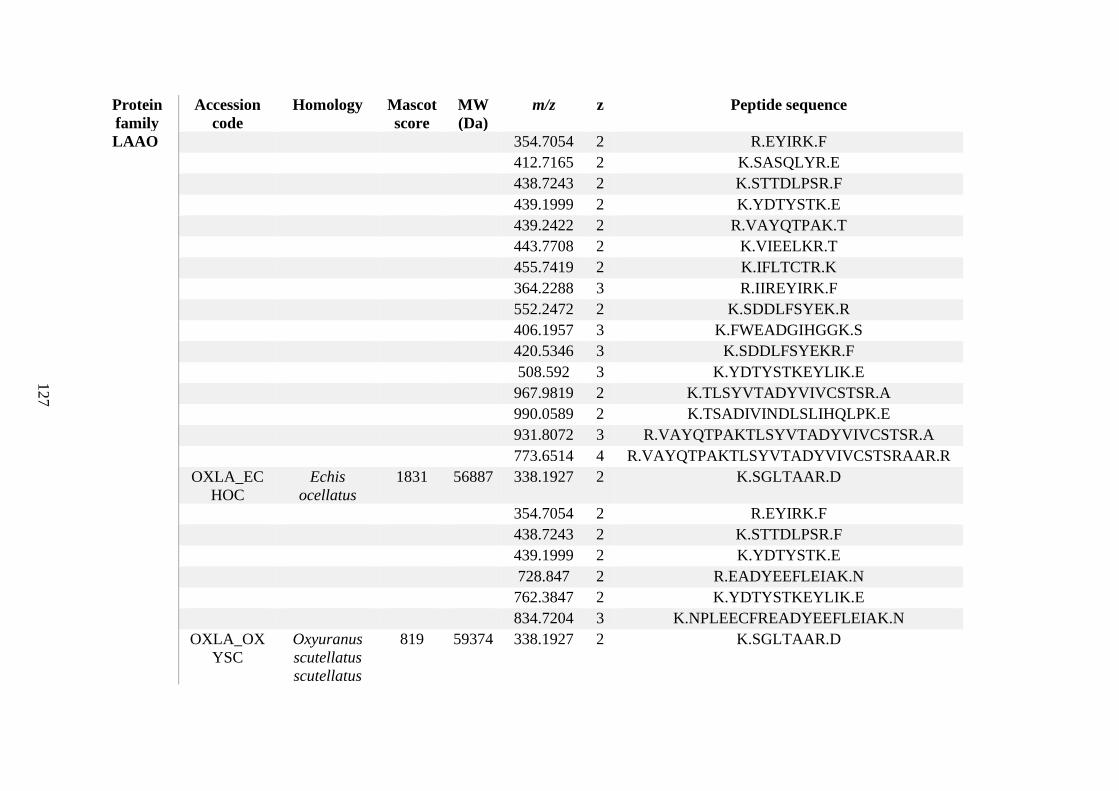
127
Protein
family
Accession
code
Homology Mascot
score
MW
(Da)
m/z z Peptide sequence
LAAO 354.7054 2 R.EYIRK.F
412.7165 2 K.SASQLYR.E
438.7243 2 K.STTDLPSR.F
439.1999 2 K.YDTYSTK.E
439.2422 2 R.VAYQTPAK.T
443.7708 2 K.VIEELKR.T
455.7419 2 K.IFLTCTR.K
364.2288 3 R.IIREYIRK.F
552.2472 2 K.SDDLFSYEK.R
406.1957 3 K.FWEADGIHGGK.S
420.5346 3 K.SDDLFSYEKR.F
508.592 3 K.YDTYSTKEYLIK.E
967.9819 2 K.TLSYVTADYVIVCSTSR.A
990.0589 2 K.TSADIVINDLSLIHQLPK.E
931.8072 3 R.VAYQTPAKTLSYVTADYVIVCSTSR.A
773.6514 4 R.VAYQTPAKTLSYVTADYVIVCSTSRAAR.R
OXLA_EC
HOC
Echis
ocellatus
1831 56887 338.1927 2 K.SGLTAAR.D
354.7054 2 R.EYIRK.F
438.7243 2 K.STTDLPSR.F
439.1999 2 K.YDTYSTK.E
728.847 2 R.EADYEEFLEIAK.N
762.3847 2 K.YDTYSTKEYLIK.E
834.7204 3 K.NPLEECFREADYEEFLEIAK.N
OXLA_OX
YSC
Oxyuranus
scutellatus
scutellatus
819 59374 338.1927 2 K.SGLTAAR.D
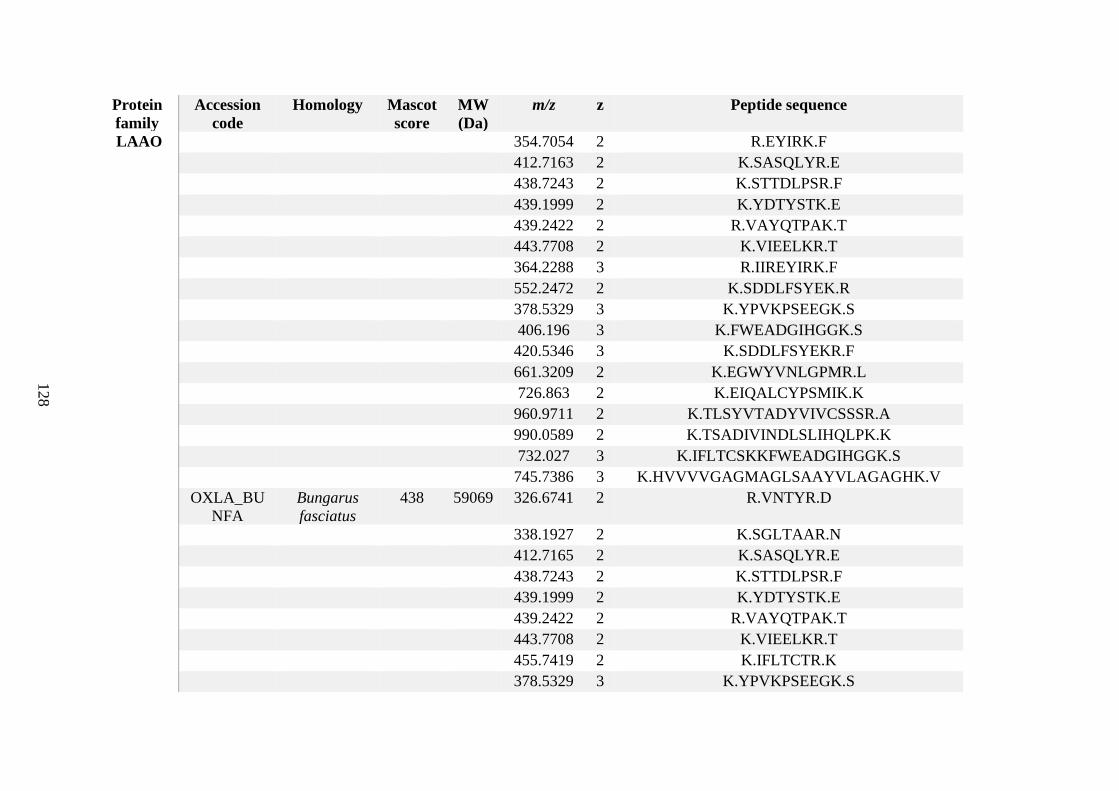
128
Protein
family
Accession
code
Homology Mascot
score
MW
(Da)
m/z z Peptide sequence
LAAO 354.7054 2 R.EYIRK.F
412.7163 2 K.SASQLYR.E
438.7243 2 K.STTDLPSR.F
439.1999 2 K.YDTYSTK.E
439.2422 2 R.VAYQTPAK.T
443.7708 2 K.VIEELKR.T
364.2288 3 R.IIREYIRK.F
552.2472 2 K.SDDLFSYEK.R
378.5329 3 K.YPVKPSEEGK.S
406.196 3 K.FWEADGIHGGK.S
420.5346 3 K.SDDLFSYEKR.F
661.3209 2 K.EGWYVNLGPMR.L
726.863 2 K.EIQALCYPSMIK.K
960.9711 2 K.TLSYVTADYVIVCSSSR.A
990.0589 2 K.TSADIVINDLSLIHQLPK.K
732.027 3 K.IFLTCSKKFWEADGIHGGK.S
745.7386 3 K.HVVVVGAGMAGLSAAYVLAGAGHK.V
OXLA_BU
NFA
Bungarus
fasciatus
438 59069 326.6741 2 R.VNTYR.D
338.1927 2 K.SGLTAAR.N
412.7165 2 K.SASQLYR.E
438.7243 2 K.STTDLPSR.F
439.1999 2 K.YDTYSTK.E
439.2422 2 R.VAYQTPAK.T
443.7708 2 K.VIEELKR.T
455.7419 2 K.IFLTCTR.K
378.5329 3 K.YPVKPSEEGK.S
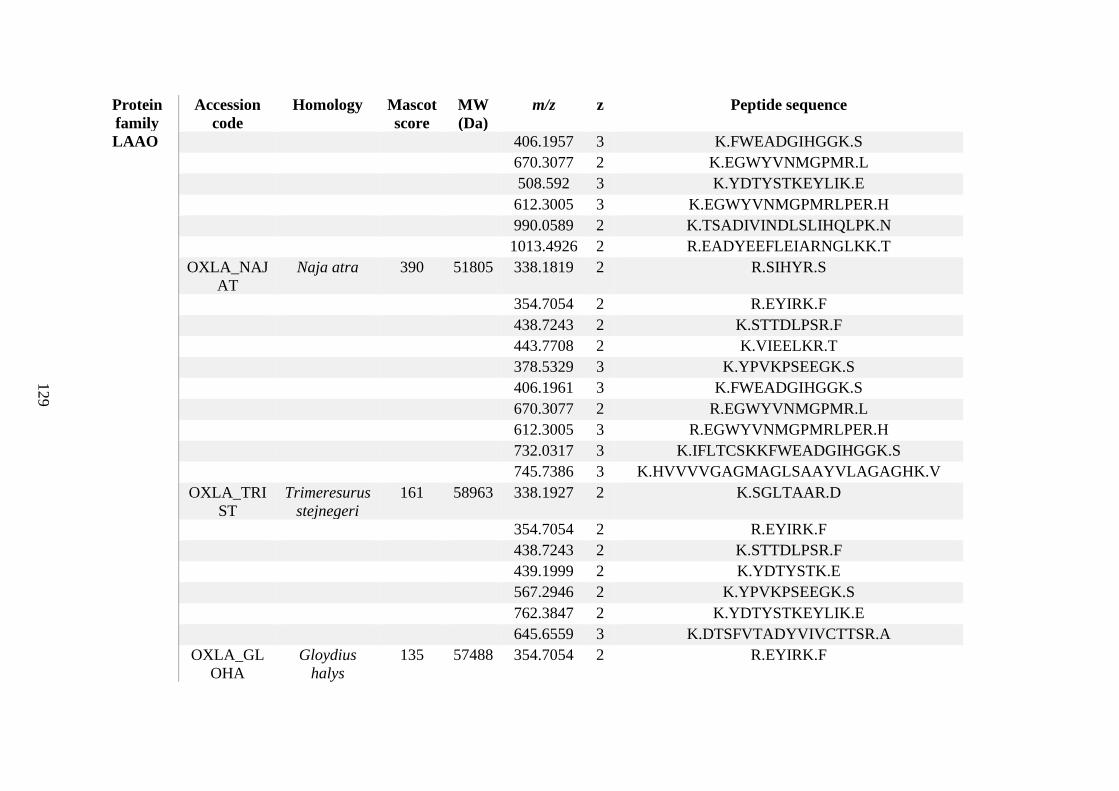
129
Protein
family
Accession
code
Homology Mascot
score
MW
(Da)
m/z z Peptide sequence
LAAO 406.1957 3 K.FWEADGIHGGK.S
670.3077 2 K.EGWYVNMGPMR.L
508.592 3 K.YDTYSTKEYLIK.E
612.3005 3 K.EGWYVNMGPMRLPER.H
990.0589 2 K.TSADIVINDLSLIHQLPK.N
1013.4926 2 R.EADYEEFLEIARNGLKK.T
OXLA_NAJ
AT
Naja atra 390 51805 338.1819 2 R.SIHYR.S
354.7054 2 R.EYIRK.F
438.7243 2 K.STTDLPSR.F
443.7708 2 K.VIEELKR.T
378.5329 3 K.YPVKPSEEGK.S
406.1961 3 K.FWEADGIHGGK.S
670.3077 2 R.EGWYVNMGPMR.L
612.3005 3 R.EGWYVNMGPMRLPER.H
732.0317 3 K.IFLTCSKKFWEADGIHGGK.S
745.7386 3 K.HVVVVGAGMAGLSAAYVLAGAGHK.V
OXLA_TRI
ST
Trimeresurus
stejnegeri
161 58963 338.1927 2 K.SGLTAAR.D
354.7054 2 R.EYIRK.F
438.7243 2 K.STTDLPSR.F
439.1999 2 K.YDTYSTK.E
567.2946 2 K.YPVKPSEEGK.S
762.3847 2 K.YDTYSTKEYLIK.E
645.6559 3 K.DTSFVTADYVIVCTTSR.A
OXLA_GL
OHA
Gloydius
halys
135 57488 354.7054 2 R.EYIRK.F
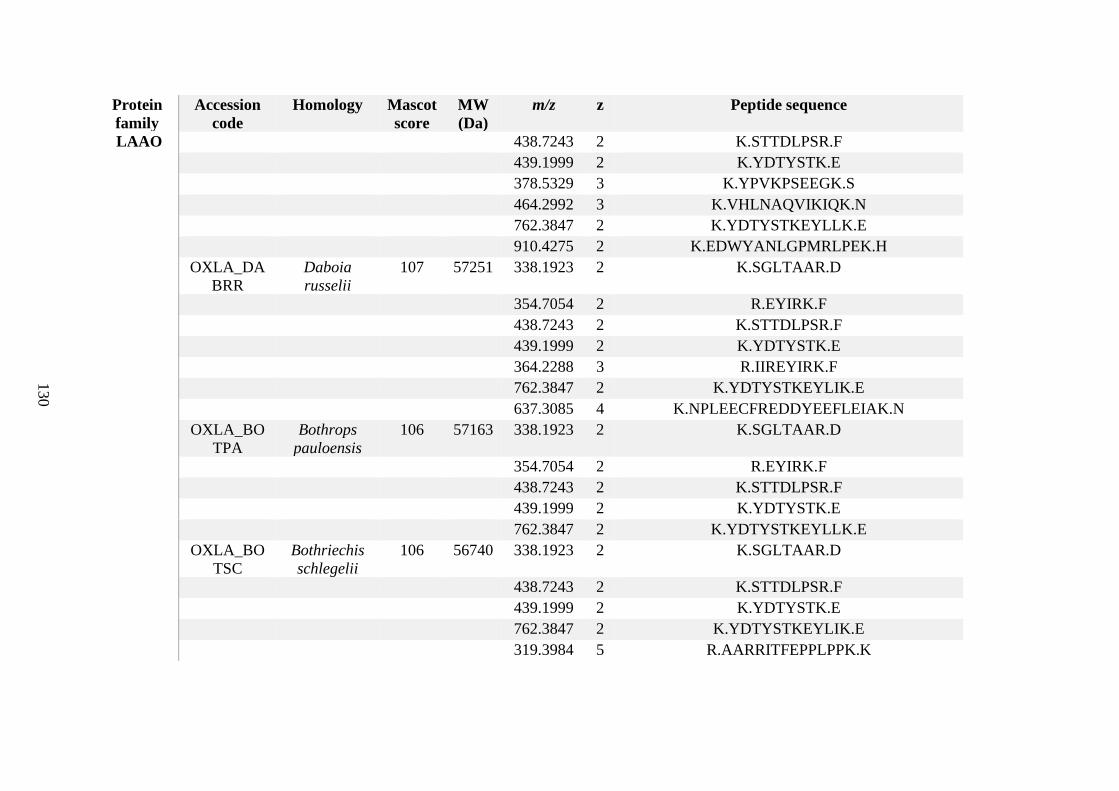
130
Protein
family
Accession
code
Homology Mascot
score
MW
(Da)
m/z z Peptide sequence
LAAO 438.7243 2 K.STTDLPSR.F
439.1999 2 K.YDTYSTK.E
378.5329 3 K.YPVKPSEEGK.S
464.2992 3 K.VHLNAQVIKIQK.N
762.3847 2 K.YDTYSTKEYLLK.E
910.4275 2 K.EDWYANLGPMRLPEK.H
OXLA_DA
BRR
Daboia
russelii
107 57251 338.1923 2 K.SGLTAAR.D
354.7054 2 R.EYIRK.F
438.7243 2 K.STTDLPSR.F
439.1999 2 K.YDTYSTK.E
364.2288 3 R.IIREYIRK.F
762.3847 2 K.YDTYSTKEYLIK.E
637.3085 4 K.NPLEECFREDDYEEFLEIAK.N
OXLA_BO
TPA
Bothrops
pauloensis
106 57163 338.1923 2 K.SGLTAAR.D
354.7054 2 R.EYIRK.F
438.7243 2 K.STTDLPSR.F
439.1999 2 K.YDTYSTK.E
762.3847 2 K.YDTYSTKEYLLK.E
OXLA_BO
TSC
Bothriechis
schlegelii
106 56740 338.1923 2 K.SGLTAAR.D
438.7243 2 K.STTDLPSR.F
439.1999 2 K.YDTYSTK.E
762.3847 2 K.YDTYSTKEYLIK.E
319.3984 5 R.AARRITFEPPLPPK.K
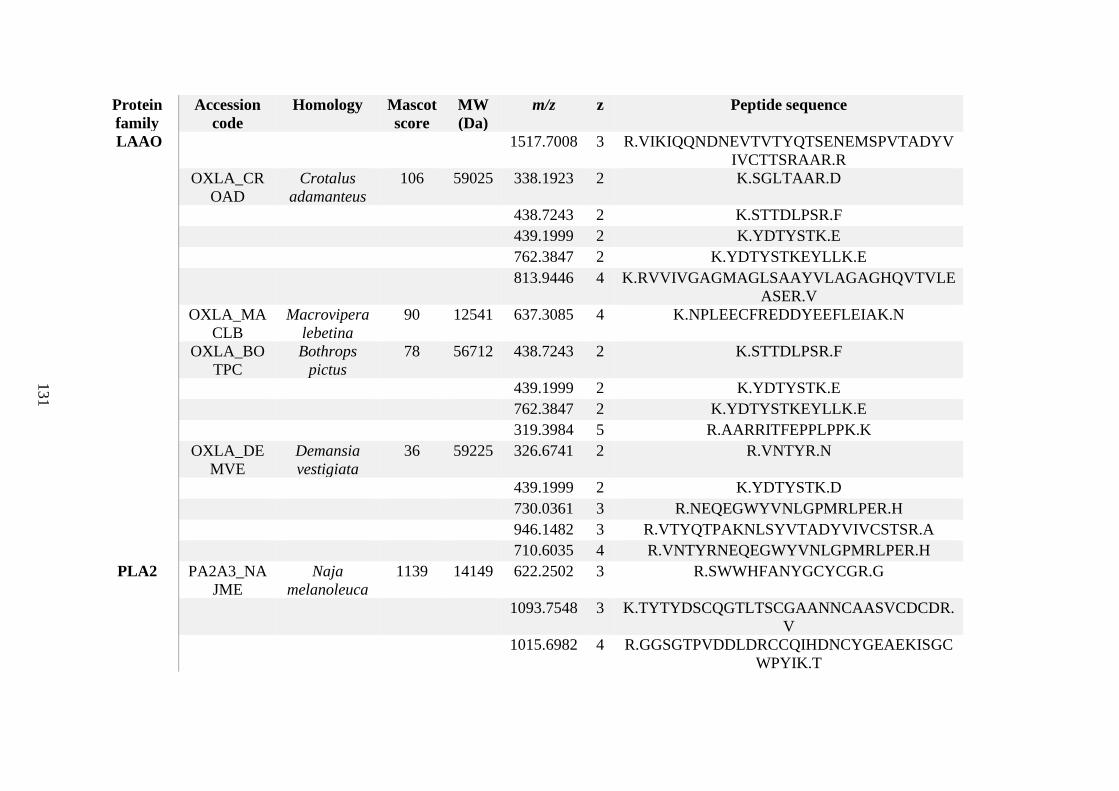
131
Protein
family
Accession
code
Homology Mascot
score
MW
(Da)
m/z z Peptide sequence
LAAO 1517.7008 3 R.VIKIQQNDNEVTVTYQTSENEMSPVTADYV
IVCTTSRAAR.R
OXLA_CR
OAD
Crotalus
adamanteus
106 59025 338.1923 2 K.SGLTAAR.D
438.7243 2 K.STTDLPSR.F
439.1999 2 K.YDTYSTK.E
762.3847 2 K.YDTYSTKEYLLK.E
813.9446 4 K.RVVIVGAGMAGLSAAYVLAGAGHQVTVLE
ASER.V
OXLA_MA
CLB
Macrovipera
lebetina
90 12541 637.3085 4 K.NPLEECFREDDYEEFLEIAK.N
OXLA_BO
TPC
Bothrops
pictus
78 56712 438.7243 2 K.STTDLPSR.F
439.1999 2 K.YDTYSTK.E
762.3847 2 K.YDTYSTKEYLLK.E
319.3984 5 R.AARRITFEPPLPPK.K
OXLA_DE
MVE
Demansia
vestigiata
36 59225 326.6741 2 R.VNTYR.N
439.1999 2 K.YDTYSTK.D
730.0361 3 R.NEQEGWYVNLGPMRLPER.H
946.1482 3 R.VTYQTPAKNLSYVTADYVIVCSTSR.A
710.6035 4 R.VNTYRNEQEGWYVNLGPMRLPER.H
PLA2 PA2A3_NA
JME
Naja
melanoleuca
1139 14149 622.2502 3 R.SWWHFANYGCYCGR.G
1093.7548 3 K.TYTYDSCQGTLTSCGAANNCAASVCDCDR.
V
1015.6982 4 R.GGSGTPVDDLDRCCQIHDNCYGEAEKISGC
WPYIK.T
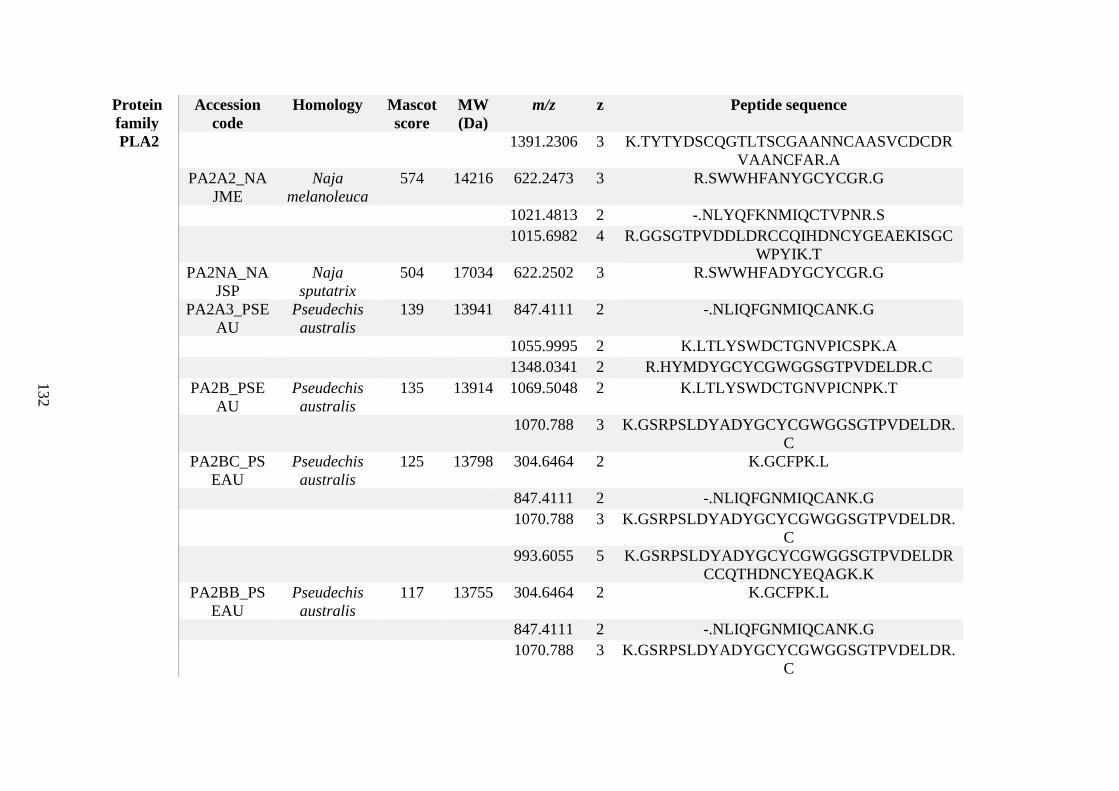
132
Protein
family
Accession
code
Homology Mascot
score
MW
(Da)
m/z z Peptide sequence
PLA2 1391.2306 3 K.TYTYDSCQGTLTSCGAANNCAASVCDCDR
VAANCFAR.A
PA2A2_NA
JME
Naja
melanoleuca
574 14216 622.2473 3 R.SWWHFANYGCYCGR.G
1021.4813 2 -.NLYQFKNMIQCTVPNR.S
1015.6982 4 R.GGSGTPVDDLDRCCQIHDNCYGEAEKISGC
WPYIK.T
PA2NA_NA
JSP
Naja
sputatrix
504 17034 622.2502 3 R.SWWHFADYGCYCGR.G
PA2A3_PSE
AU
Pseudechis
australis
139 13941 847.4111 2 -.NLIQFGNMIQCANK.G
1055.9995 2 K.LTLYSWDCTGNVPICSPK.A
1348.0341 2 R.HYMDYGCYCGWGGSGTPVDELDR.C
PA2B_PSE
AU
Pseudechis
australis
135 13914 1069.5048 2 K.LTLYSWDCTGNVPICNPK.T
1070.788 3 K.GSRPSLDYADYGCYCGWGGSGTPVDELDR.
C
PA2BC_PS
EAU
Pseudechis
australis
125 13798 304.6464 2 K.GCFPK.L
847.4111 2 -.NLIQFGNMIQCANK.G
1070.788 3 K.GSRPSLDYADYGCYCGWGGSGTPVDELDR.
C
993.6055 5 K.GSRPSLDYADYGCYCGWGGSGTPVDELDR
CCQTHDNCYEQAGK.K
PA2BB_PS
EAU
Pseudechis
australis
117 13755 304.6464 2 K.GCFPK.L
847.4111 2 -.NLIQFGNMIQCANK.G
1070.788 3 K.GSRPSLDYADYGCYCGWGGSGTPVDELDR.
C

133
Protein
family
Accession
code
Homology Mascot
score
MW
(Da)
m/z z Peptide sequence
PLA2 1241.2505 4 K.GSRPSLDYADYGCYCGWGGSGTPVDELDR
CCQVHDNCYEQAGK.K
PA2BF_PSE
AU
Pseudechis
australis
117 13758 304.6464 2 K.GCFPK.L
847.4111 2 -.NLIQFGNMIQCANK.G
1070.788 3 K.GSRPSLNYADYGCYCGWGGSGTPVDELDR.
C
1241.2505 4 K.GSRPSLNYADYGCYCGWGGSGTPVDELDR
CCQVHDNCYEQAGK.K
PA2BA_PS
EAU
Pseudechis
australis
74 13816 304.6464 2 K.GCFPK.L
1069.5052 2 K.LTLYSWDCTGNVPICNPK.S
PA2BD_PS
EAU
Pseudechis
australis
65 14002 668.2812 3 R.AAWHYLDYGCYCGPGGR.G
3FTx 3SA1_NAJ
ME
Naja
melanoleuca
764 7133 474.7176 2 R.GCIDVCPK.S
681.2545 2 K.YVCCNTDRCN.-
727.3216 2 K.NLCYQMYMVSK.S
3L22_NAJ
ME
Naja
melanoleuca
316 8337 1237.059 2 R.CFITPDVTSQICADGHVCYTK.T
686.3279 4 -.IRCFITPDVTSQICADGHVCYTK.T
3SO62_NAJ
HH
Naja haje
haje
301 7484 1430.5864 2 -.FTCFTTPSDTSETCPDGQNICYEK.R
3L27_NAJS
P
Naja
sputatrix
76 10461 1237.059 2 R.CFITPDVTSTDCPNGHVCYTK.T
SVMP VM39_DRY
CN
Drysdalia
coronoides
646 70323 325.697 2 R.YLQVK.K
331.176 2 K.VCINR.Q
393.5176 3 K.CGDGKVCINR.Q
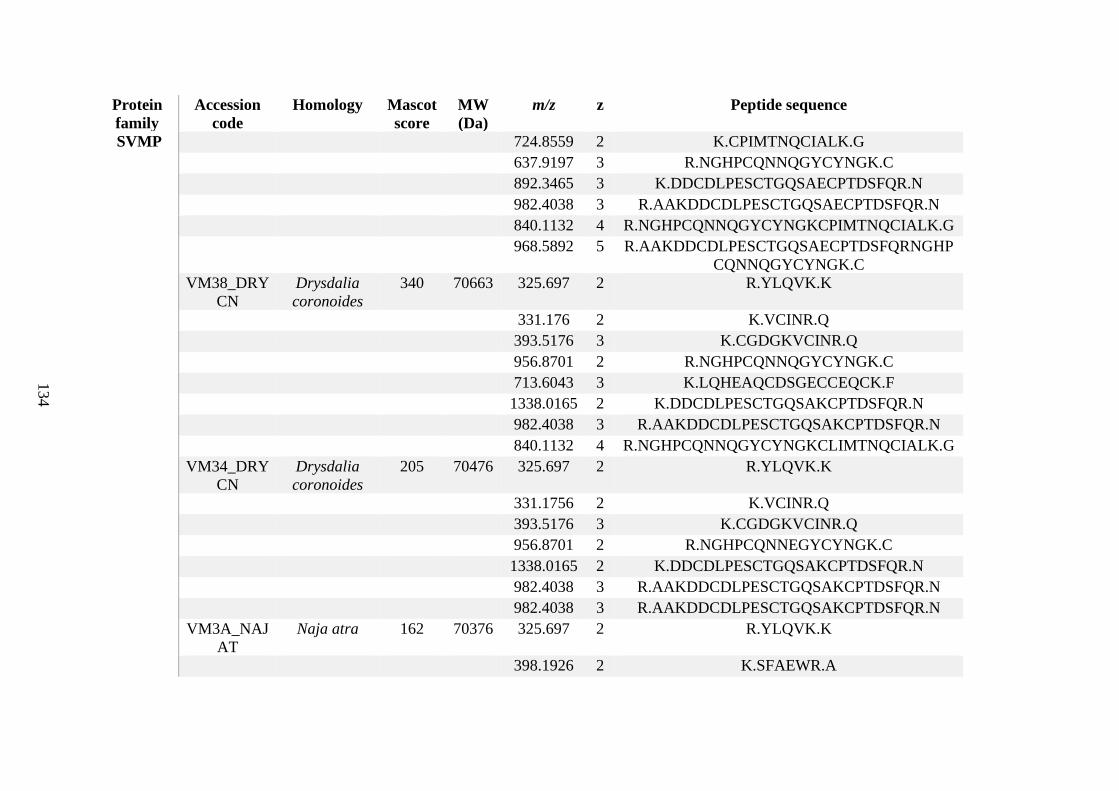
134
Protein
family
Accession
code
Homology Mascot
score
MW
(Da)
m/z z Peptide sequence
SVMP 724.8559 2 K.CPIMTNQCIALK.G
637.9197 3 R.NGHPCQNNQGYCYNGK.C
892.3465 3 K.DDCDLPESCTGQSAECPTDSFQR.N
982.4038 3 R.AAKDDCDLPESCTGQSAECPTDSFQR.N
840.1132 4 R.NGHPCQNNQGYCYNGKCPIMTNQCIALK.G
968.5892 5 R.AAKDDCDLPESCTGQSAECPTDSFQRNGHP
CQNNQGYCYNGK.C
VM38_DRY
CN
Drysdalia
coronoides
340 70663 325.697 2 R.YLQVK.K
331.176 2 K.VCINR.Q
393.5176 3 K.CGDGKVCINR.Q
956.8701 2 R.NGHPCQNNQGYCYNGK.C
713.6043 3 K.LQHEAQCDSGECCEQCK.F
1338.0165 2 K.DDCDLPESCTGQSAKCPTDSFQR.N
982.4038 3 R.AAKDDCDLPESCTGQSAKCPTDSFQR.N
840.1132 4 R.NGHPCQNNQGYCYNGKCLIMTNQCIALK.G
VM34_DRY
CN
Drysdalia
coronoides
205 70476 325.697 2 R.YLQVK.K
331.1756 2 K.VCINR.Q
393.5176 3 K.CGDGKVCINR.Q
956.8701 2 R.NGHPCQNNEGYCYNGK.C
1338.0165 2 K.DDCDLPESCTGQSAKCPTDSFQR.N
982.4038 3 R.AAKDDCDLPESCTGQSAKCPTDSFQR.N
982.4038 3 R.AAKDDCDLPESCTGQSAKCPTDSFQR.N
VM3A_NAJ
AT
Naja atra 162 70376 325.697 2 R.YLQVK.K
398.1926 2 K.SFAEWR.A
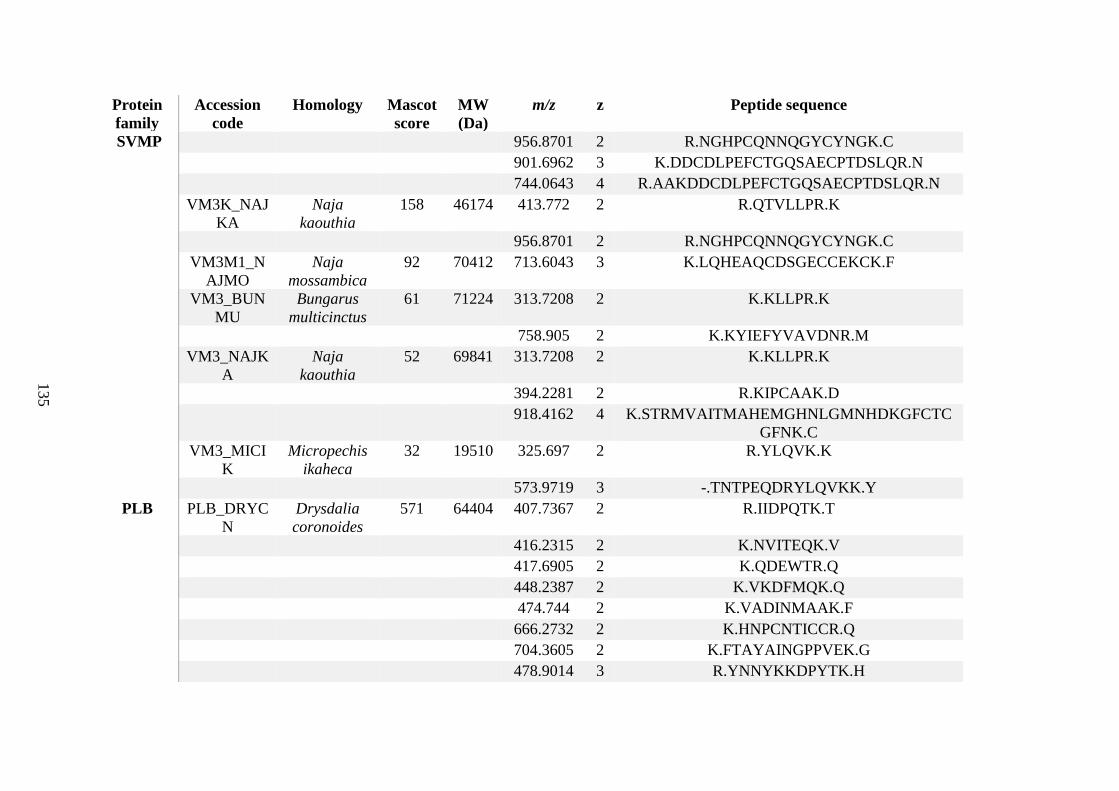
135
Protein
family
Accession
code
Homology Mascot
score
MW
(Da)
m/z z Peptide sequence
SVMP 956.8701 2 R.NGHPCQNNQGYCYNGK.C
901.6962 3 K.DDCDLPEFCTGQSAECPTDSLQR.N
744.0643 4 R.AAKDDCDLPEFCTGQSAECPTDSLQR.N
VM3K_NAJ
KA
Naja
kaouthia
158 46174 413.772 2 R.QTVLLPR.K
956.8701 2 R.NGHPCQNNQGYCYNGK.C
VM3M1_N
AJMO
Naja
mossambica
92 70412 713.6043 3 K.LQHEAQCDSGECCEKCK.F
VM3_BUN
MU
Bungarus
multicinctus
61 71224 313.7208 2 K.KLLPR.K
758.905 2 K.KYIEFYVAVDNR.M
VM3_NAJK
A
Naja
kaouthia
52 69841 313.7208 2 K.KLLPR.K
394.2281 2 R.KIPCAAK.D
918.4162 4 K.STRMVAITMAHEMGHNLGMNHDKGFCTC
GFNK.C
VM3_MICI
K
Micropechis
ikaheca
32 19510 325.697 2 R.YLQVK.K
573.9719 3 -.TNTPEQDRYLQVKK.Y
PLB PLB_DRYC
N
Drysdalia
coronoides
571 64404 407.7367 2 R.IIDPQTK.T
416.2315 2 K.NVITEQK.V
417.6905 2 K.QDEWTR.Q
448.2387 2 K.VKDFMQK.Q
474.744 2 K.VADINMAAK.F
666.2732 2 K.HNPCNTICCR.Q
704.3605 2 K.FTAYAINGPPVEK.G
478.9014 3 R.YNNYKKDPYTK.H
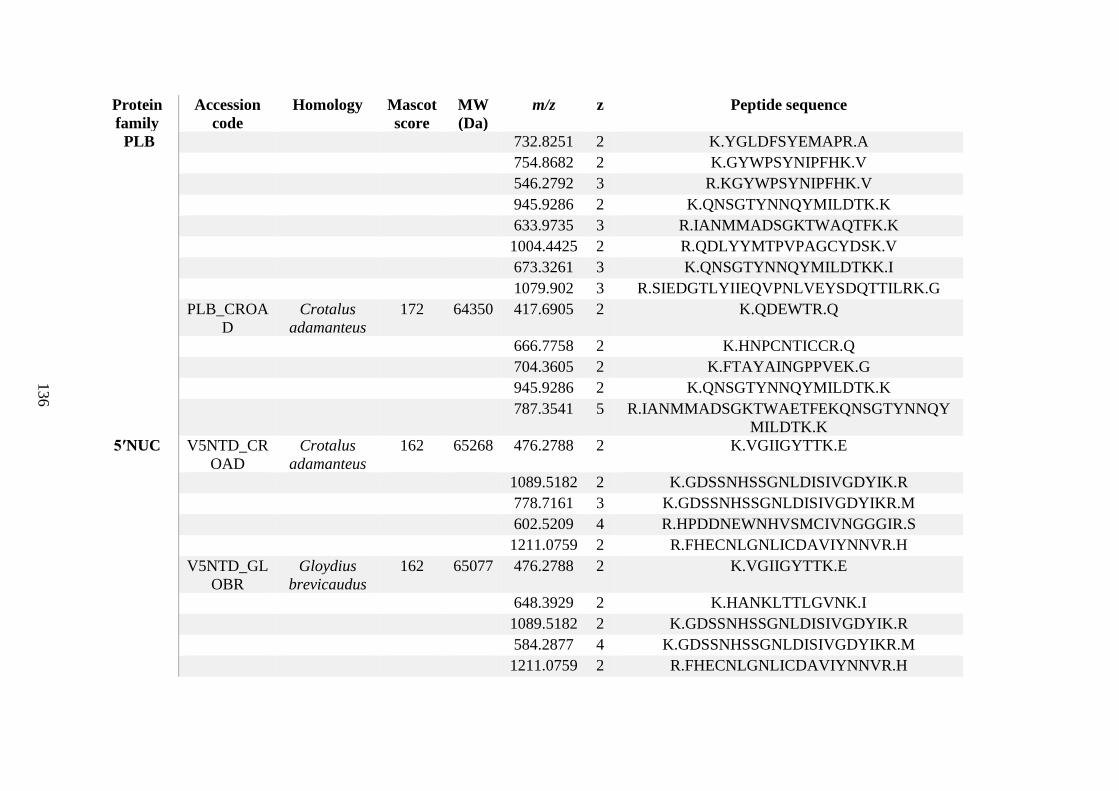
136
Protein
family
Accession
code
Homology Mascot
score
MW
(Da)
m/z z Peptide sequence
PLB 732.8251 2 K.YGLDFSYEMAPR.A
754.8682 2 K.GYWPSYNIPFHK.V
546.2792 3 R.KGYWPSYNIPFHK.V
945.9286 2 K.QNSGTYNNQYMILDTK.K
633.9735 3 R.IANMMADSGKTWAQTFK.K
1004.4425 2 R.QDLYYMTPVPAGCYDSK.V
673.3261 3 K.QNSGTYNNQYMILDTKK.I
1079.902 3 R.SIEDGTLYIIEQVPNLVEYSDQTTILRK.G
PLB_CROA
D
Crotalus
adamanteus
172 64350 417.6905 2 K.QDEWTR.Q
666.7758 2 K.HNPCNTICCR.Q
704.3605 2 K.FTAYAINGPPVEK.G
945.9286 2 K.QNSGTYNNQYMILDTK.K
787.3541 5 R.IANMMADSGKTWAETFEKQNSGTYNNQY
MILDTK.K
5ʹNUC V5NTD_CR
OAD
Crotalus
adamanteus
162 65268 476.2788 2 K.VGIIGYTTK.E
1089.5182 2 K.GDSSNHSSGNLDISIVGDYIK.R
778.7161 3 K.GDSSNHSSGNLDISIVGDYIKR.M
602.5209 4 R.HPDDNEWNHVSMCIVNGGGIR.S
1211.0759 2 R.FHECNLGNLICDAVIYNNVR.H
V5NTD_GL
OBR
Gloydius
brevicaudus
162 65077 476.2788 2 K.VGIIGYTTK.E
648.3929 2 K.HANKLTTLGVNK.I
1089.5182 2 K.GDSSNHSSGNLDISIVGDYIK.R
584.2877 4 K.GDSSNHSSGNLDISIVGDYIKR.M
1211.0759 2 R.FHECNLGNLICDAVIYNNVR.H
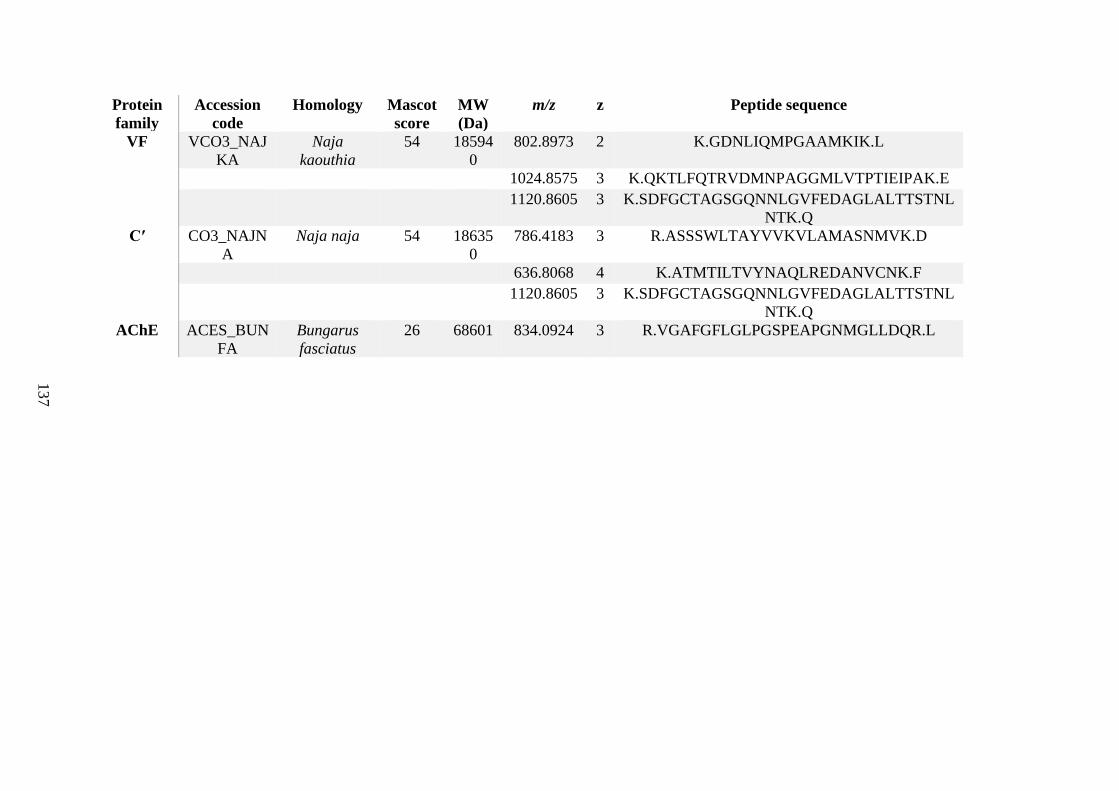
137
Protein
family
Accession
code
Homology Mascot
score
MW
(Da)
m/z z Peptide sequence
VF VCO3_NAJ
KA
Naja
kaouthia
54 18594
0
802.8973 2 K.GDNLIQMPGAAMKIK.L
1024.8575 3 K.QKTLFQTRVDMNPAGGMLVTPTIEIPAK.E
1120.8605 3 K.SDFGCTAGSGQNNLGVFEDAGLALTTSTNL
NTK.Q
Cʹ CO3_NAJN
A
Naja naja 54 18635
0
786.4183 3 R.ASSSWLTAYVVKVLAMASNMVK.D
636.8068 4 K.ATMTILTVYNAQLREDANVCNK.F
1120.8605 3 K.SDFGCTAGSGQNNLGVFEDAGLALTTSTNL
NTK.Q
AChE ACES_BUN
FA
Bungarus
fasciatus
26 68601 834.0924 3 R.VGAFGFLGLPGSPEAPGNMGLLDQR.L
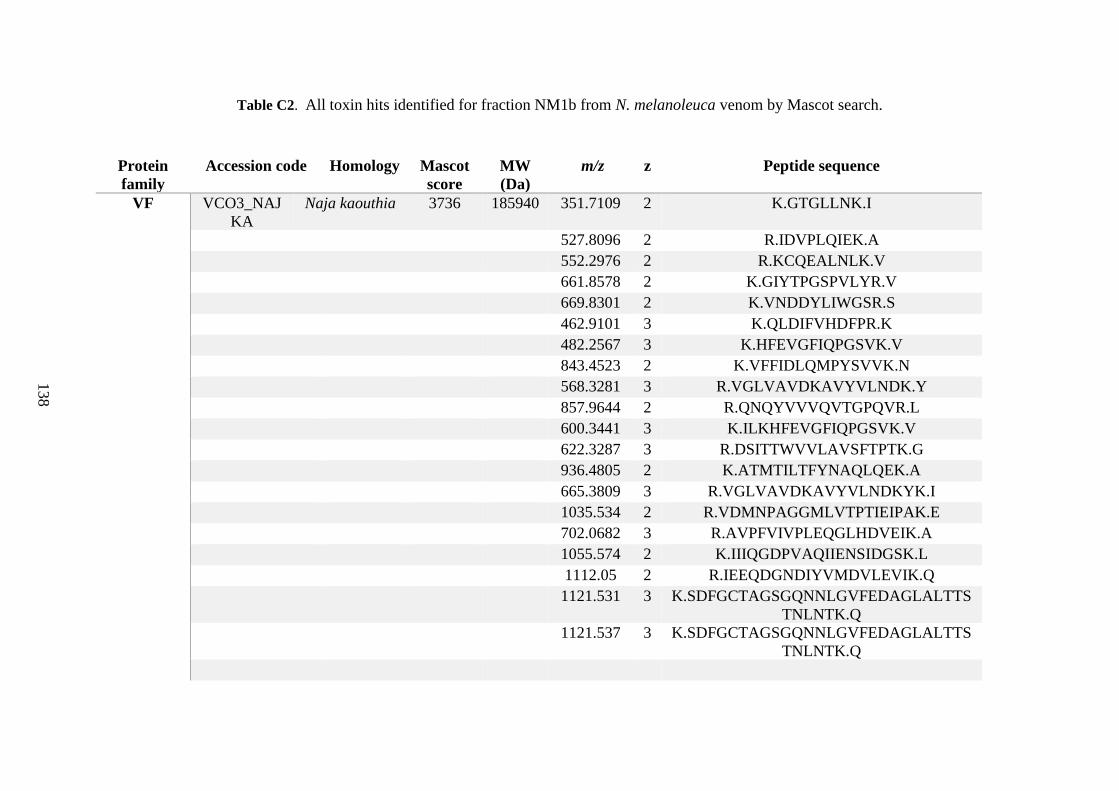
138
Table C2. All toxin hits identified for fraction NM1b from N. melanoleuca venom by Mascot search.
Protein
family
Accession code Homology Mascot
score
MW
(Da)
m/z z Peptide sequence
VF VCO3_NAJ
KA
Naja kaouthia 3736 185940 351.7109 2 K.GTGLLNK.I
527.8096 2 R.IDVPLQIEK.A
552.2976 2 R.KCQEALNLK.V
661.8578 2 K.GIYTPGSPVLYR.V
669.8301 2 K.VNDDYLIWGSR.S
462.9101 3 K.QLDIFVHDFPR.K
482.2567 3 K.HFEVGFIQPGSVK.V
843.4523 2 K.VFFIDLQMPYSVVK.N
568.3281 3 R.VGLVAVDKAVYVLNDK.Y
857.9644 2 R.QNQYVVVQVTGPQVR.L
600.3441 3 K.ILKHFEVGFIQPGSVK.V
622.3287 3 R.DSITTWVVLAVSFTPTK.G
936.4805 2 K.ATMTILTFYNAQLQEK.A
665.3809 3 R.VGLVAVDKAVYVLNDKYK.I
1035.534 2 R.VDMNPAGGMLVTPTIEIPAK.E
702.0682 3 R.AVPFVIVPLEQGLHDVEIK.A
1055.574 2 K.IIIQGDPVAQIIENSIDGSK.L
1112.05 2 R.IEEQDGNDIYVMDVLEVIK.Q
1121.531 3 K.SDFGCTAGSGQNNLGVFEDAGLALTTS
TNLNTK.Q
1121.537 3 K.SDFGCTAGSGQNNLGVFEDAGLALTTS
TNLNTK.Q
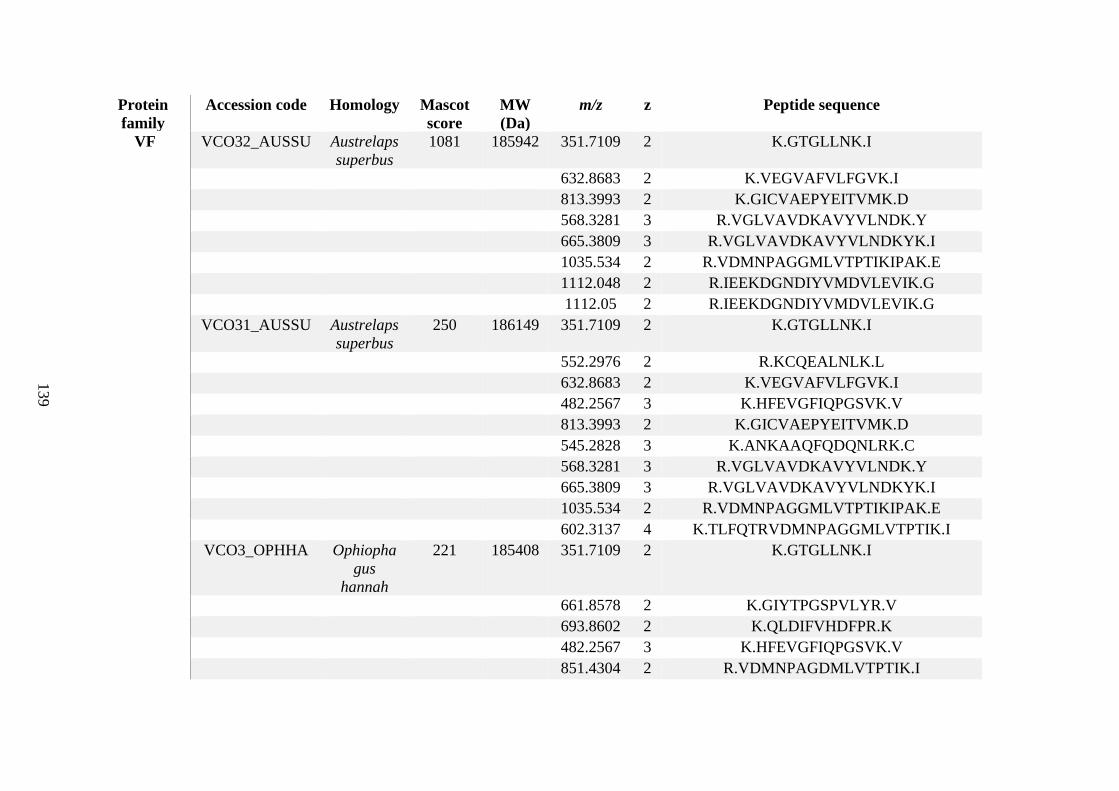
139
Protein
family
Accession code Homology Mascot
score
MW
(Da)
m/z z Peptide sequence
VF VCO32_AUSSU Austrelaps
superbus
1081 185942 351.7109 2 K.GTGLLNK.I
632.8683 2 K.VEGVAFVLFGVK.I
813.3993 2 K.GICVAEPYEITVMK.D
568.3281 3 R.VGLVAVDKAVYVLNDK.Y
665.3809 3 R.VGLVAVDKAVYVLNDKYK.I
1035.534 2 R.VDMNPAGGMLVTPTIKIPAK.E
1112.048 2 R.IEEKDGNDIYVMDVLEVIK.G
1112.05 2 R.IEEKDGNDIYVMDVLEVIK.G
VCO31_AUSSU Austrelaps
superbus
250 186149 351.7109 2 K.GTGLLNK.I
552.2976 2 R.KCQEALNLK.L
632.8683 2 K.VEGVAFVLFGVK.I
482.2567 3 K.HFEVGFIQPGSVK.V
813.3993 2 K.GICVAEPYEITVMK.D
545.2828 3 K.ANKAAQFQDQNLRK.C
568.3281 3 R.VGLVAVDKAVYVLNDK.Y
665.3809 3 R.VGLVAVDKAVYVLNDKYK.I
1035.534 2 R.VDMNPAGGMLVTPTIKIPAK.E
602.3137 4 K.TLFQTRVDMNPAGGMLVTPTIK.I
VCO3_OPHHA Ophiopha
gus
hannah
221 185408 351.7109 2 K.GTGLLNK.I
661.8578 2 K.GIYTPGSPVLYR.V
693.8602 2 K.QLDIFVHDFPR.K
482.2567 3 K.HFEVGFIQPGSVK.V
851.4304 2 R.VDMNPAGDMLVTPTIK.I
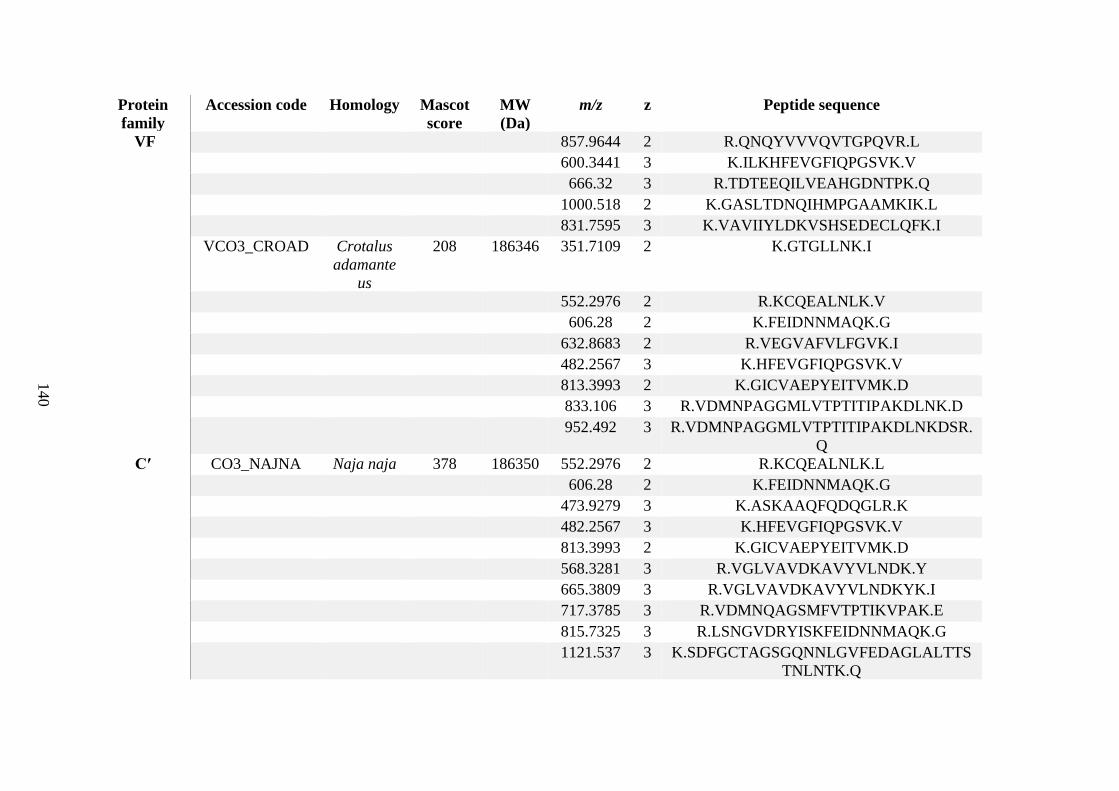
140
Protein
family
Accession code Homology Mascot
score
MW
(Da)
m/z z Peptide sequence
VF 857.9644 2 R.QNQYVVVQVTGPQVR.L
600.3441 3 K.ILKHFEVGFIQPGSVK.V
666.32 3 R.TDTEEQILVEAHGDNTPK.Q
1000.518 2 K.GASLTDNQIHMPGAAMKIK.L
831.7595 3 K.VAVIIYLDKVSHSEDECLQFK.I
VCO3_CROAD Crotalus
adamante
us
208 186346 351.7109 2 K.GTGLLNK.I
552.2976 2 R.KCQEALNLK.V
606.28 2 K.FEIDNNMAQK.G
632.8683 2 R.VEGVAFVLFGVK.I
482.2567 3 K.HFEVGFIQPGSVK.V
813.3993 2 K.GICVAEPYEITVMK.D
833.106 3 R.VDMNPAGGMLVTPTITIPAKDLNK.D
952.492 3 R.VDMNPAGGMLVTPTITIPAKDLNKDSR.
Q
Cʹ CO3_NAJNA Naja naja 378 186350 552.2976 2 R.KCQEALNLK.L
606.28 2 K.FEIDNNMAQK.G
473.9279 3 K.ASKAAQFQDQGLR.K
482.2567 3 K.HFEVGFIQPGSVK.V
813.3993 2 K.GICVAEPYEITVMK.D
568.3281 3 R.VGLVAVDKAVYVLNDK.Y
665.3809 3 R.VGLVAVDKAVYVLNDKYK.I
717.3785 3 R.VDMNQAGSMFVTPTIKVPAK.E
815.7325 3 R.LSNGVDRYISKFEIDNNMAQK.G
1121.537 3 K.SDFGCTAGSGQNNLGVFEDAGLALTTS
TNLNTK.Q
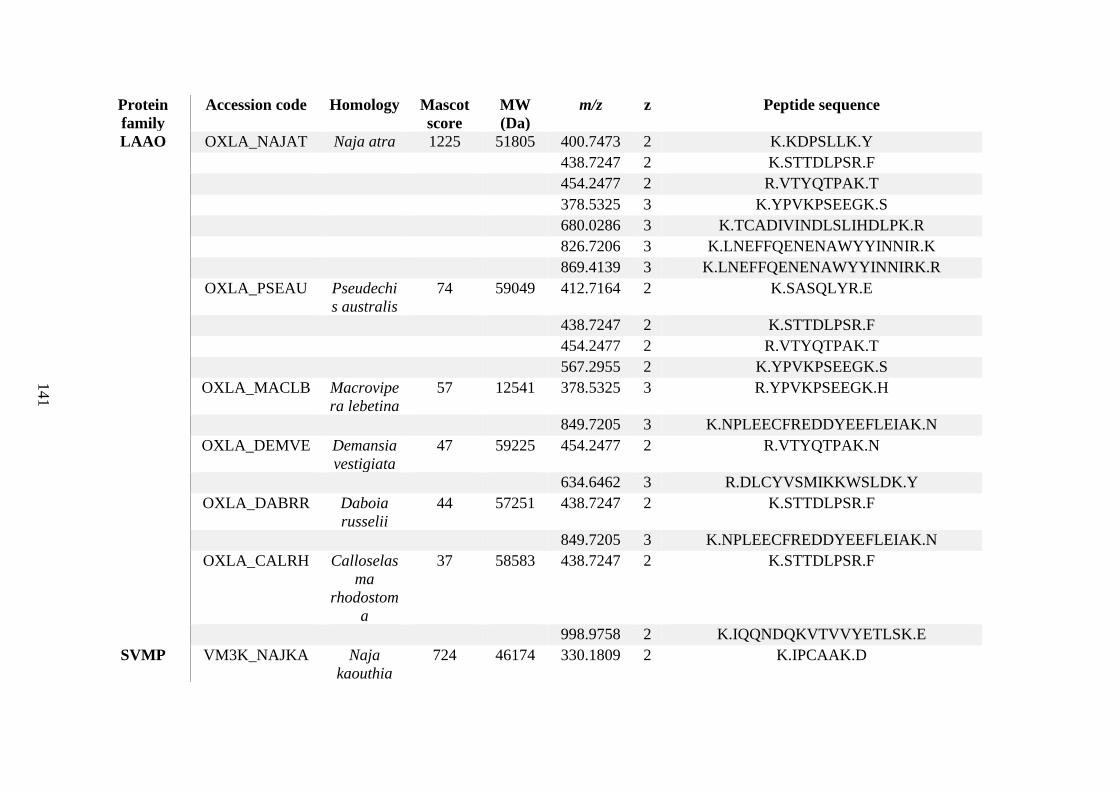
141
Protein
family
Accession code Homology Mascot
score
MW
(Da)
m/z z Peptide sequence
LAAO OXLA_NAJAT Naja atra 1225 51805 400.7473 2 K.KDPSLLK.Y
438.7247 2 K.STTDLPSR.F
454.2477 2 R.VTYQTPAK.T
378.5325 3 K.YPVKPSEEGK.S
680.0286 3 K.TCADIVINDLSLIHDLPK.R
826.7206 3 K.LNEFFQENENAWYYINNIR.K
869.4139 3 K.LNEFFQENENAWYYINNIRK.R
OXLA_PSEAU Pseudechi
s australis
74 59049 412.7164 2 K.SASQLYR.E
438.7247 2 K.STTDLPSR.F
454.2477 2 R.VTYQTPAK.T
567.2955 2 K.YPVKPSEEGK.S
OXLA_MACLB Macrovipe
ra lebetina
57 12541 378.5325 3 R.YPVKPSEEGK.H
849.7205 3 K.NPLEECFREDDYEEFLEIAK.N
OXLA_DEMVE Demansia
vestigiata
47 59225 454.2477 2 R.VTYQTPAK.N
634.6462 3 R.DLCYVSMIKKWSLDK.Y
OXLA_DABRR Daboia
russelii
44 57251 438.7247 2 K.STTDLPSR.F
849.7205 3 K.NPLEECFREDDYEEFLEIAK.N
OXLA_CALRH Calloselas
ma
rhodostom
a
37 58583 438.7247 2 K.STTDLPSR.F
998.9758 2 K.IQQNDQKVTVVYETLSK.E
SVMP VM3K_NAJKA Naja
kaouthia
724 46174 330.1809 2 K.IPCAAK.D
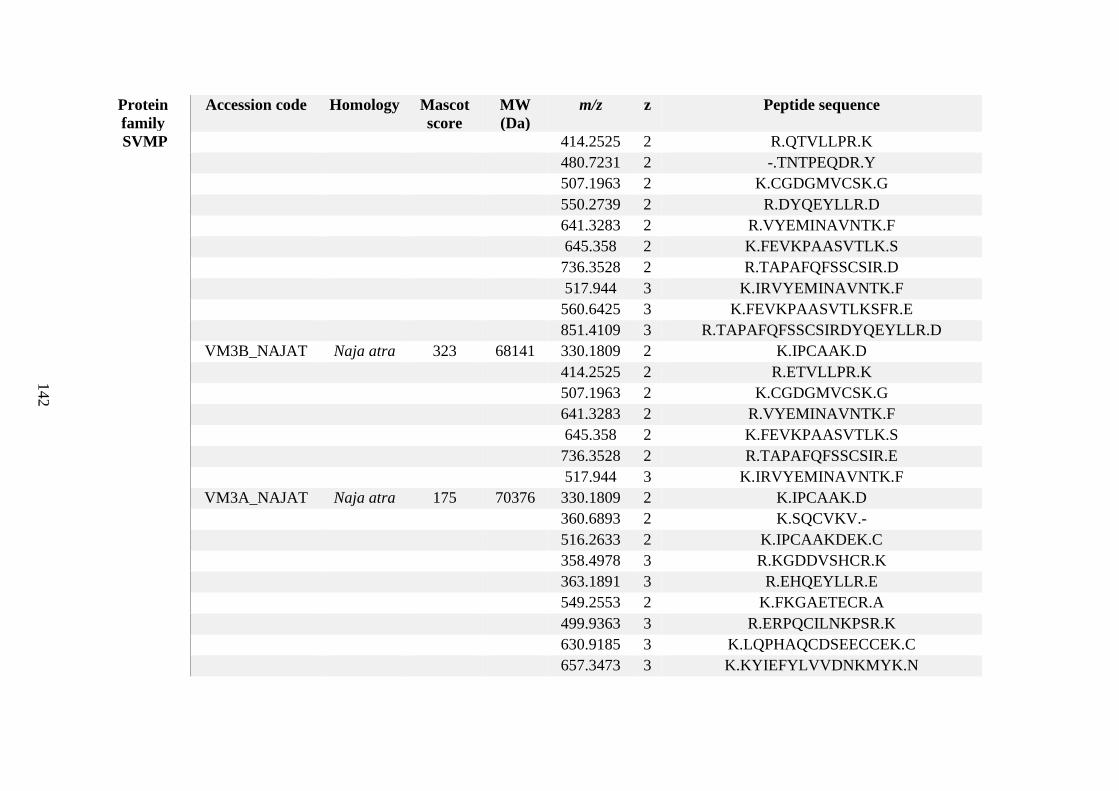
142
Protein
family
Accession code Homology Mascot
score
MW
(Da)
m/z z Peptide sequence
SVMP 414.2525 2 R.QTVLLPR.K
480.7231 2 -.TNTPEQDR.Y
507.1963 2 K.CGDGMVCSK.G
550.2739 2 R.DYQEYLLR.D
641.3283 2 R.VYEMINAVNTK.F
645.358 2 K.FEVKPAASVTLK.S
736.3528 2 R.TAPAFQFSSCSIR.D
517.944 3 K.IRVYEMINAVNTK.F
560.6425 3 K.FEVKPAASVTLKSFR.E
851.4109 3 R.TAPAFQFSSCSIRDYQEYLLR.D
VM3B_NAJAT Naja atra 323 68141 330.1809 2 K.IPCAAK.D
414.2525 2 R.ETVLLPR.K
507.1963 2 K.CGDGMVCSK.G
641.3283 2 R.VYEMINAVNTK.F
645.358 2 K.FEVKPAASVTLK.S
736.3528 2 R.TAPAFQFSSCSIR.E
517.944 3 K.IRVYEMINAVNTK.F
VM3A_NAJAT Naja atra 175 70376 330.1809 2 K.IPCAAK.D
360.6893 2 K.SQCVKV.-
516.2633 2 K.IPCAAKDEK.C
358.4978 3 R.KGDDVSHCR.K
363.1891 3 R.EHQEYLLR.E
549.2553 2 K.FKGAETECR.A
499.9363 3 R.ERPQCILNKPSR.K
630.9185 3 K.LQPHAQCDSEECCEK.C
657.3473 3 K.KYIEFYLVVDNKMYK.N
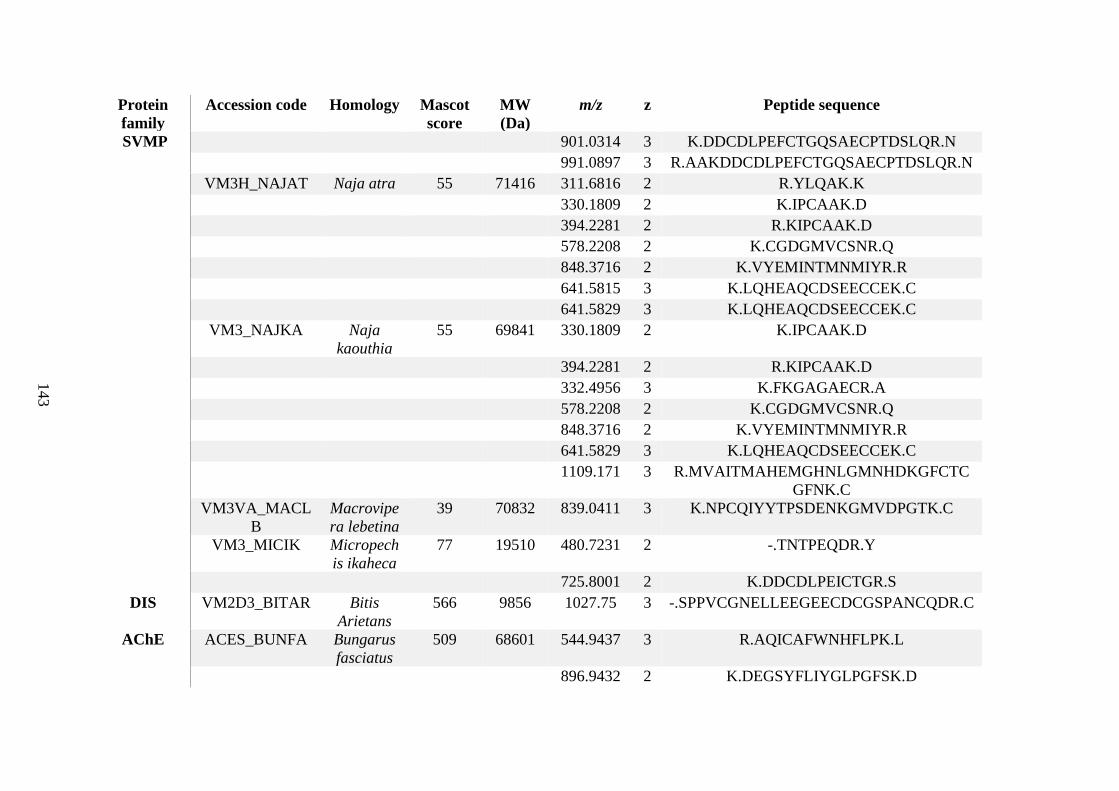
143
Protein
family
Accession code Homology Mascot
score
MW
(Da)
m/z z Peptide sequence
SVMP 901.0314 3 K.DDCDLPEFCTGQSAECPTDSLQR.N
991.0897 3 R.AAKDDCDLPEFCTGQSAECPTDSLQR.N
VM3H_NAJAT Naja atra 55 71416 311.6816 2 R.YLQAK.K
330.1809 2 K.IPCAAK.D
394.2281 2 R.KIPCAAK.D
578.2208 2 K.CGDGMVCSNR.Q
848.3716 2 K.VYEMINTMNMIYR.R
641.5815 3 K.LQHEAQCDSEECCEK.C
641.5829 3 K.LQHEAQCDSEECCEK.C
VM3_NAJKA Naja
kaouthia
55 69841 330.1809 2 K.IPCAAK.D
394.2281 2 R.KIPCAAK.D
332.4956 3 K.FKGAGAECR.A
578.2208 2 K.CGDGMVCSNR.Q
848.3716 2 K.VYEMINTMNMIYR.R
641.5829 3 K.LQHEAQCDSEECCEK.C
1109.171 3 R.MVAITMAHEMGHNLGMNHDKGFCTC
GFNK.C
VM3VA_MACL
B
Macrovipe
ra lebetina
39 70832 839.0411 3 K.NPCQIYYTPSDENKGMVDPGTK.C
VM3_MICIK Micropech
is ikaheca
77 19510 480.7231 2 -.TNTPEQDR.Y
725.8001 2 K.DDCDLPEICTGR.S
DIS VM2D3_BITAR Bitis
Arietans
566 9856 1027.75 3 -.SPPVCGNELLEEGEECDCGSPANCQDR.C
AChE ACES_BUNFA Bungarus
fasciatus
509 68601 544.9437 3 R.AQICAFWNHFLPK.L
896.9432 2 K.DEGSYFLIYGLPGFSK.D
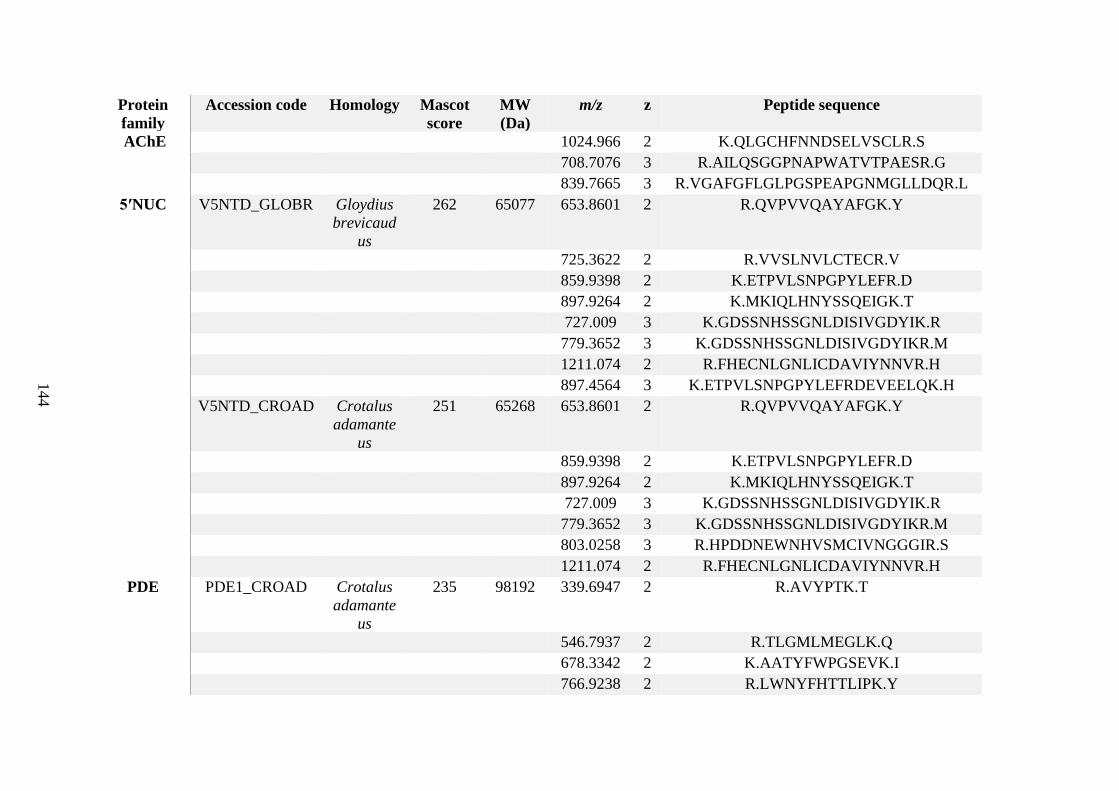
144
Protein
family
Accession code Homology Mascot
score
MW
(Da)
m/z z Peptide sequence
AChE 1024.966 2 K.QLGCHFNNDSELVSCLR.S
708.7076 3 R.AILQSGGPNAPWATVTPAESR.G
839.7665 3 R.VGAFGFLGLPGSPEAPGNMGLLDQR.L
5ʹNUC V5NTD_GLOBR Gloydius
brevicaud
us
262 65077 653.8601 2 R.QVPVVQAYAFGK.Y
725.3622 2 R.VVSLNVLCTECR.V
859.9398 2 K.ETPVLSNPGPYLEFR.D
897.9264 2 K.MKIQLHNYSSQEIGK.T
727.009 3 K.GDSSNHSSGNLDISIVGDYIK.R
779.3652 3 K.GDSSNHSSGNLDISIVGDYIKR.M
1211.074 2 R.FHECNLGNLICDAVIYNNVR.H
897.4564 3 K.ETPVLSNPGPYLEFRDEVEELQK.H
V5NTD_CROAD Crotalus
adamante
us
251 65268 653.8601 2 R.QVPVVQAYAFGK.Y
859.9398 2 K.ETPVLSNPGPYLEFR.D
897.9264 2 K.MKIQLHNYSSQEIGK.T
727.009 3 K.GDSSNHSSGNLDISIVGDYIK.R
779.3652 3 K.GDSSNHSSGNLDISIVGDYIKR.M
803.0258 3 R.HPDDNEWNHVSMCIVNGGGIR.S
1211.074 2 R.FHECNLGNLICDAVIYNNVR.H
PDE PDE1_CROAD Crotalus
adamante
us
235 98192 339.6947 2 R.AVYPTK.T
546.7937 2 R.TLGMLMEGLK.Q
678.3342 2 K.AATYFWPGSEVK.I
766.9238 2 R.LWNYFHTTLIPK.Y
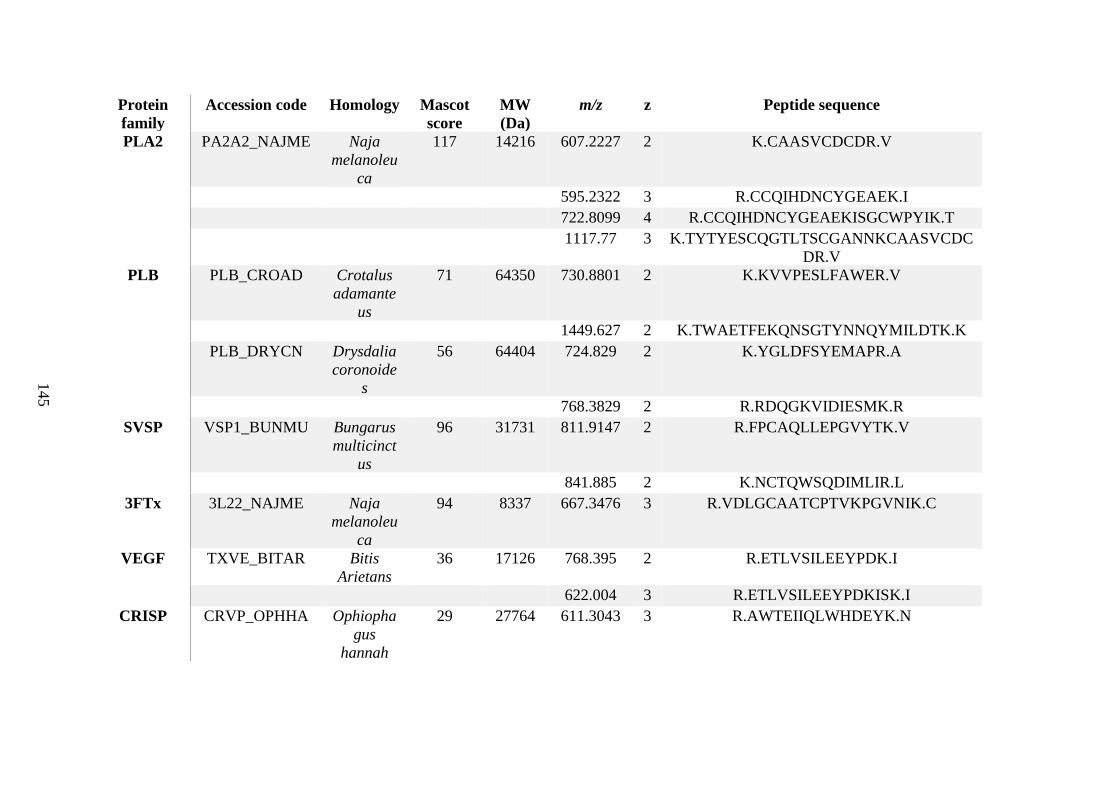
145
Protein
family
Accession code Homology Mascot
score
MW
(Da)
m/z z Peptide sequence
PLA2 PA2A2_NAJME Naja
melanoleu
ca
117 14216 607.2227 2 K.CAASVCDCDR.V
595.2322 3 R.CCQIHDNCYGEAEK.I
722.8099 4 R.CCQIHDNCYGEAEKISGCWPYIK.T
1117.77 3 K.TYTYESCQGTLTSCGANNKCAASVCDC
DR.V
PLB PLB_CROAD Crotalus
adamante
us
71 64350 730.8801 2 K.KVVPESLFAWER.V
1449.627 2 K.TWAETFEKQNSGTYNNQYMILDTK.K
PLB_DRYCN Drysdalia
coronoide
s
56 64404 724.829 2 K.YGLDFSYEMAPR.A
768.3829 2 R.RDQGKVIDIESMK.R
SVSP VSP1_BUNMU Bungarus
multicinct
us
96 31731 811.9147 2 R.FPCAQLLEPGVYTK.V
841.885 2 K.NCTQWSQDIMLIR.L
3FTx 3L22_NAJME Naja
melanoleu
ca
94 8337 667.3476 3 R.VDLGCAATCPTVKPGVNIK.C
VEGF TXVE_BITAR Bitis
Arietans
36 17126 768.395 2 R.ETLVSILEEYPDK.I
622.004 3 R.ETLVSILEEYPDKISK.I
CRISP CRVP_OPHHA Ophiopha
gus
hannah
29 27764 611.3043 3 R.AWTEIIQLWHDEYK.N
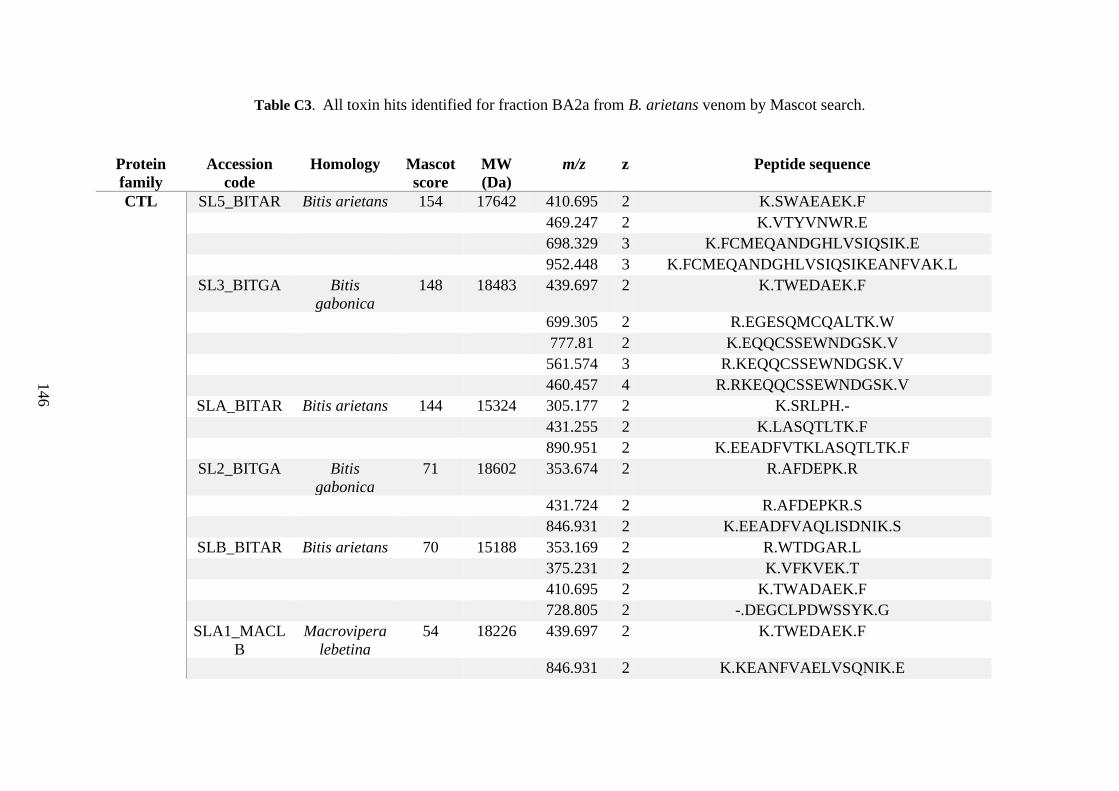
146
Table C3. All toxin hits identified for fraction BA2a from B. arietans venom by Mascot search.
Protein
family
Accession
code
Homology Mascot
score
MW
(Da)
m/z z Peptide sequence
CTL SL5_BITAR Bitis arietans 154 17642 410.695 2 K.SWAEAEK.F
469.247 2 K.VTYVNWR.E
698.329 3 K.FCMEQANDGHLVSIQSIK.E
952.448 3 K.FCMEQANDGHLVSIQSIKEANFVAK.L
SL3_BITGA Bitis
gabonica
148 18483 439.697 2 K.TWEDAEK.F
699.305 2 R.EGESQMCQALTK.W
777.81 2 K.EQQCSSEWNDGSK.V
561.574 3 R.KEQQCSSEWNDGSK.V
460.457 4 R.RKEQQCSSEWNDGSK.V
SLA_BITAR Bitis arietans 144 15324 305.177 2 K.SRLPH.-
431.255 2 K.LASQTLTK.F
890.951 2 K.EEADFVTKLASQTLTK.F
SL2_BITGA Bitis
gabonica
71 18602 353.674 2 R.AFDEPK.R
431.724 2 R.AFDEPKR.S
846.931 2 K.EEADFVAQLISDNIK.S
SLB_BITAR Bitis arietans 70 15188 353.169 2 R.WTDGAR.L
375.231 2 K.VFKVEK.T
410.695 2 K.TWADAEK.F
728.805 2 -.DEGCLPDWSSYK.G
SLA1_MACL
B
Macrovipera
lebetina
54 18226 439.697 2 K.TWEDAEK.F
846.931 2 K.KEANFVAELVSQNIK.E
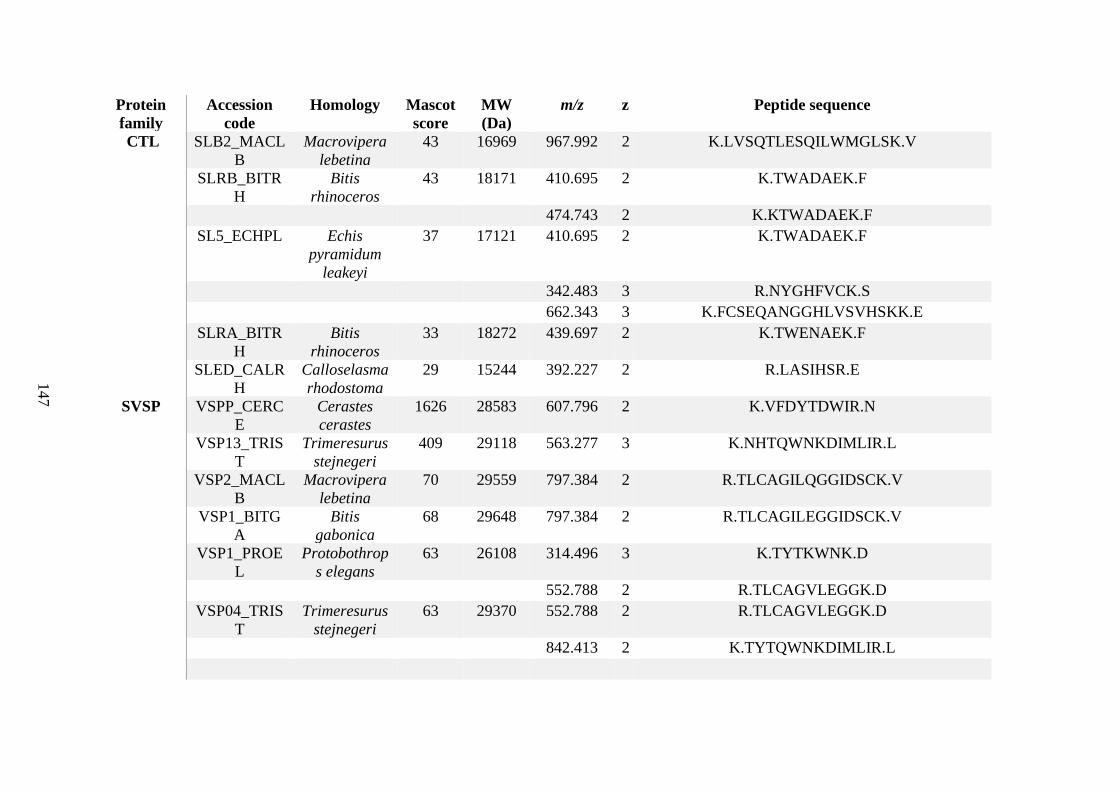
147
Protein
family
Accession
code
Homology Mascot
score
MW
(Da)
m/z z Peptide sequence
CTL SLB2_MACL
B
Macrovipera
lebetina
43 16969 967.992 2 K.LVSQTLESQILWMGLSK.V
SLRB_BITR
H
Bitis
rhinoceros
43 18171 410.695 2 K.TWADAEK.F
474.743 2 K.KTWADAEK.F
SL5_ECHPL Echis
pyramidum
leakeyi
37 17121 410.695 2 K.TWADAEK.F
342.483 3 R.NYGHFVCK.S
662.343 3 K.FCSEQANGGHLVSVHSKK.E
SLRA_BITR
H
Bitis
rhinoceros
33 18272 439.697 2 K.TWENAEK.F
SLED_CALR
H
Calloselasma
rhodostoma
29 15244 392.227 2 R.LASIHSR.E
SVSP VSPP_CERC
E
Cerastes
cerastes
1626 28583 607.796 2 K.VFDYTDWIR.N
VSP13_TRIS
T
Trimeresurus
stejnegeri
409 29118 563.277 3 K.NHTQWNKDIMLIR.L
VSP2_MACL
B
Macrovipera
lebetina
70 29559 797.384 2 R.TLCAGILQGGIDSCK.V
VSP1_BITG
A
Bitis
gabonica
68 29648 797.384 2 R.TLCAGILEGGIDSCK.V
VSP1_PROE
L
Protobothrop
s elegans
63 26108 314.496 3 K.TYTKWNK.D
552.788 2 R.TLCAGVLEGGK.D
VSP04_TRIS
T
Trimeresurus
stejnegeri
63 29370 552.788 2 R.TLCAGVLEGGK.D
842.413 2 K.TYTQWNKDIMLIR.L
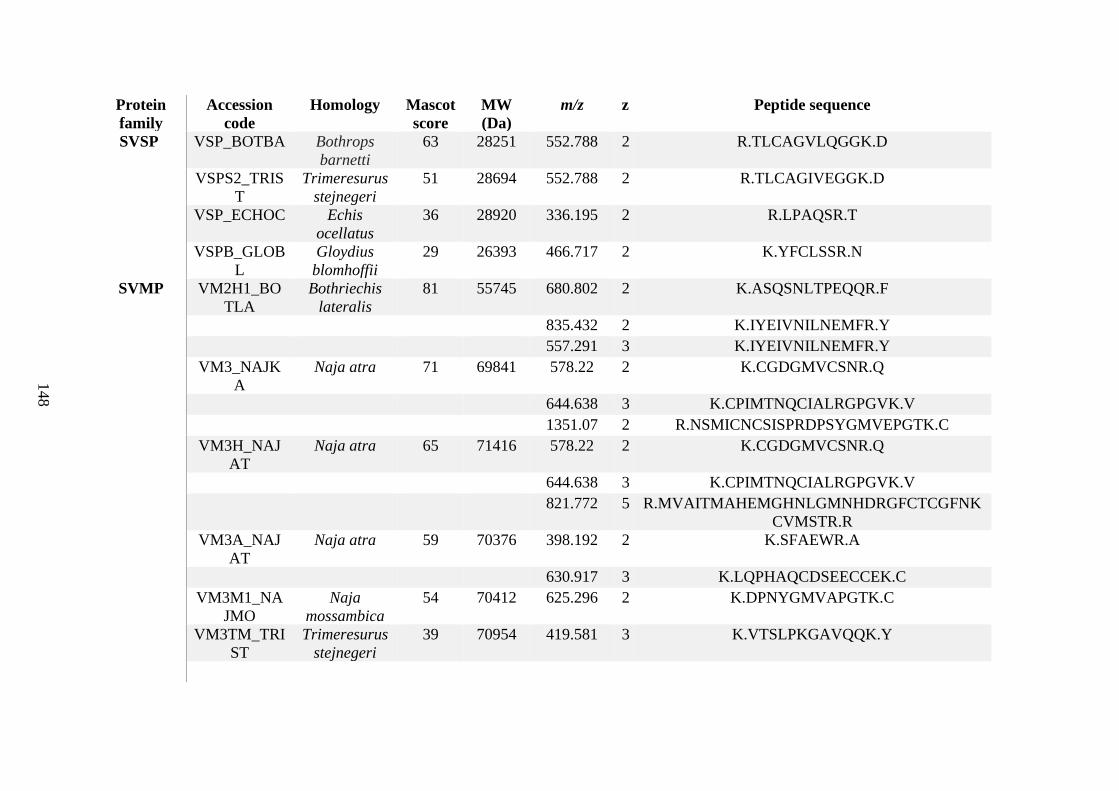
148
Protein
family
Accession
code
Homology Mascot
score
MW
(Da)
m/z z Peptide sequence
SVSP VSP_BOTBA Bothrops
barnetti
63 28251 552.788 2 R.TLCAGVLQGGK.D
VSPS2_TRIS
T
Trimeresurus
stejnegeri
51 28694 552.788 2 R.TLCAGIVEGGK.D
VSP_ECHOC Echis
ocellatus
36 28920 336.195 2 R.LPAQSR.T
VSPB_GLOB
L
Gloydius
blomhoffii
29 26393 466.717 2 K.YFCLSSR.N
SVMP VM2H1_BO
TLA
Bothriechis
lateralis
81 55745 680.802 2 K.ASQSNLTPEQQR.F
835.432 2 K.IYEIVNILNEMFR.Y
557.291 3 K.IYEIVNILNEMFR.Y
VM3_NAJK
A
Naja atra 71 69841 578.22 2 K.CGDGMVCSNR.Q
644.638 3 K.CPIMTNQCIALRGPGVK.V
1351.07 2 R.NSMICNCSISPRDPSYGMVEPGTK.C
VM3H_NAJ
AT
Naja atra 65 71416 578.22 2 K.CGDGMVCSNR.Q
644.638 3 K.CPIMTNQCIALRGPGVK.V
821.772 5 R.MVAITMAHEMGHNLGMNHDRGFCTCGFNK
CVMSTR.R
VM3A_NAJ
AT
Naja atra 59 70376 398.192 2 K.SFAEWR.A
630.917 3 K.LQPHAQCDSEECCEK.C
VM3M1_NA
JMO
Naja
mossambica
54 70412 625.296 2 K.DPNYGMVAPGTK.C
VM3TM_TRI
ST
Trimeresurus
stejnegeri
39 70954 419.581 3 K.VTSLPKGAVQQK.Y
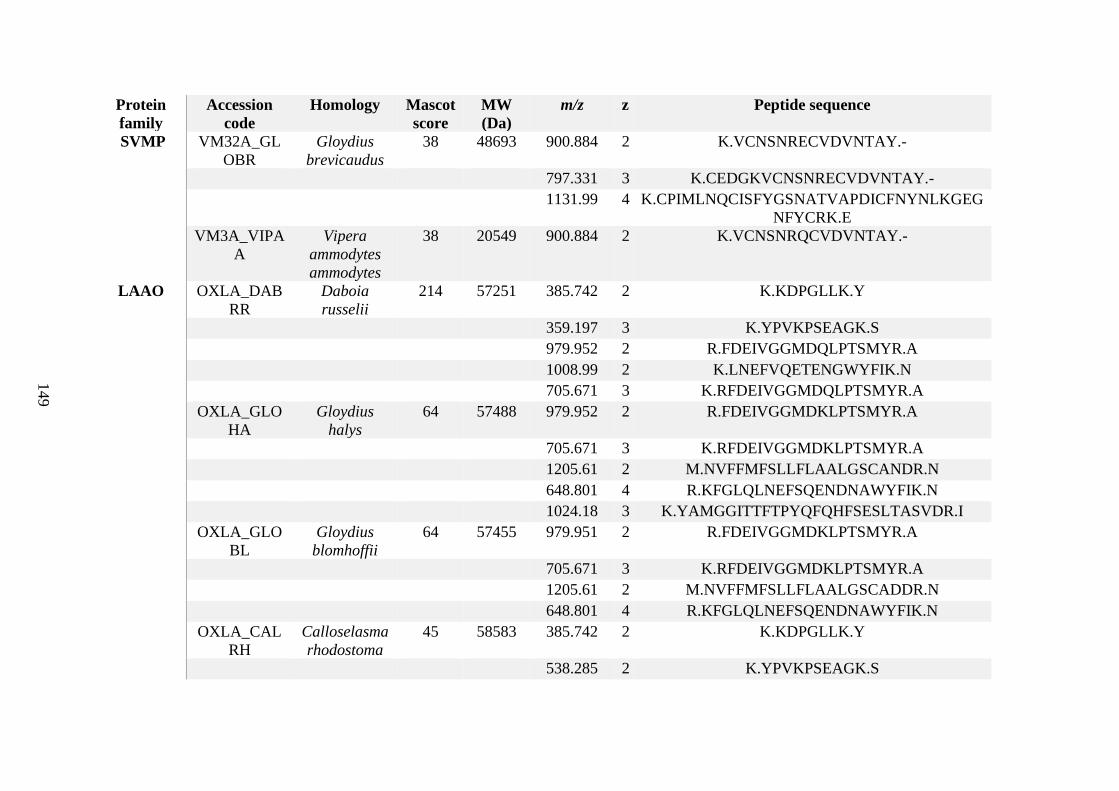
149
Protein
family
Accession
code
Homology Mascot
score
MW
(Da)
m/z z Peptide sequence
SVMP VM32A_GL
OBR
Gloydius
brevicaudus
38 48693 900.884 2 K.VCNSNRECVDVNTAY.-
797.331 3 K.CEDGKVCNSNRECVDVNTAY.-
1131.99 4 K.CPIMLNQCISFYGSNATVAPDICFNYNLKGEG
NFYCRK.E
VM3A_VIPA
A
Vipera
ammodytes
ammodytes
38 20549 900.884 2 K.VCNSNRQCVDVNTAY.-
LAAO OXLA_DAB
RR
Daboia
russelii
214 57251 385.742 2 K.KDPGLLK.Y
359.197 3 K.YPVKPSEAGK.S
979.952 2 R.FDEIVGGMDQLPTSMYR.A
1008.99 2 K.LNEFVQETENGWYFIK.N
705.671 3 K.RFDEIVGGMDQLPTSMYR.A
OXLA_GLO
HA
Gloydius
halys
64 57488 979.952 2 R.FDEIVGGMDKLPTSMYR.A
705.671 3 K.RFDEIVGGMDKLPTSMYR.A
1205.61 2 M.NVFFMFSLLFLAALGSCANDR.N
648.801 4 R.KFGLQLNEFSQENDNAWYFIK.N
1024.18 3 K.YAMGGITTFTPYQFQHFSESLTASVDR.I
OXLA_GLO
BL
Gloydius
blomhoffii
64 57455 979.951 2 R.FDEIVGGMDKLPTSMYR.A
705.671 3 K.RFDEIVGGMDKLPTSMYR.A
1205.61 2 M.NVFFMFSLLFLAALGSCADDR.N
648.801 4 R.KFGLQLNEFSQENDNAWYFIK.N
OXLA_CAL
RH
Calloselasma
rhodostoma
45 58583 385.742 2 K.KDPGLLK.Y
538.285 2 K.YPVKPSEAGK.S
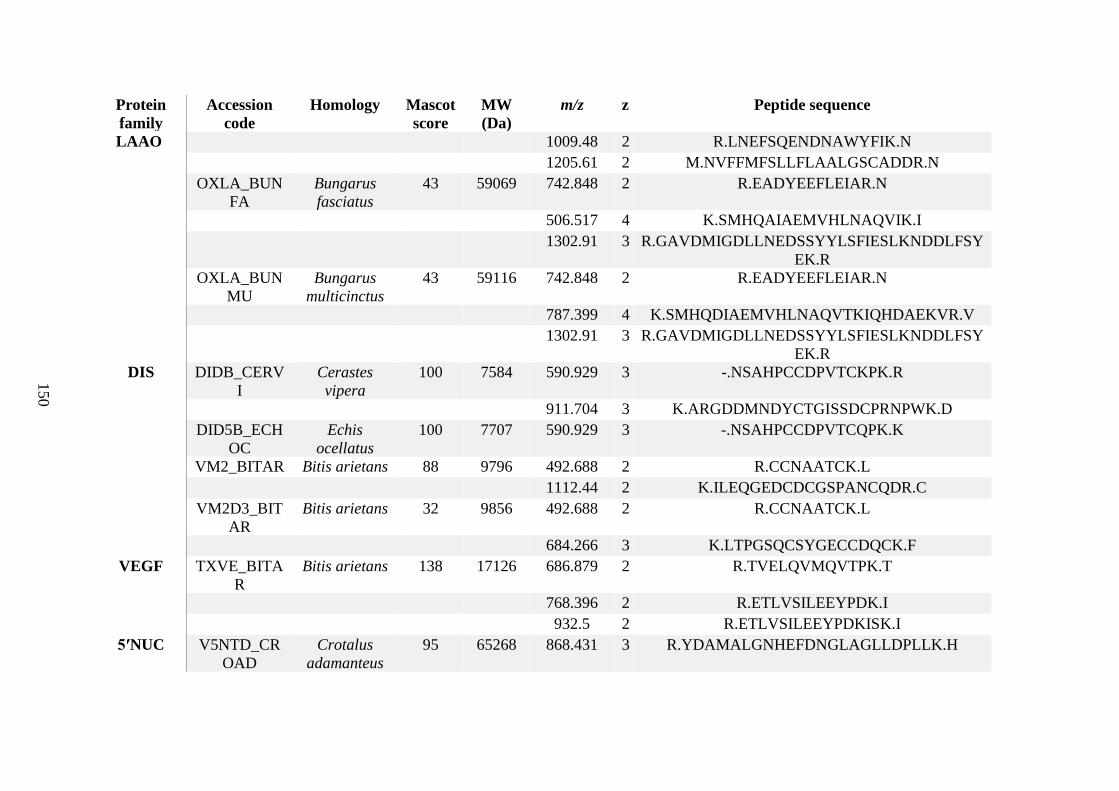
150
Protein
family
Accession
code
Homology Mascot
score
MW
(Da)
m/z z Peptide sequence
LAAO 1009.48 2 R.LNEFSQENDNAWYFIK.N
1205.61 2 M.NVFFMFSLLFLAALGSCADDR.N
OXLA_BUN
FA
Bungarus
fasciatus
43 59069 742.848 2 R.EADYEEFLEIAR.N
506.517 4 K.SMHQAIAEMVHLNAQVIK.I
1302.91 3 R.GAVDMIGDLLNEDSSYYLSFIESLKNDDLFSY
EK.R
OXLA_BUN
MU
Bungarus
multicinctus
43 59116 742.848 2 R.EADYEEFLEIAR.N
787.399 4 K.SMHQDIAEMVHLNAQVTKIQHDAEKVR.V
1302.91 3 R.GAVDMIGDLLNEDSSYYLSFIESLKNDDLFSY
EK.R
DIS DIDB_CERV
I
Cerastes
vipera
100 7584 590.929 3 -.NSAHPCCDPVTCKPK.R
911.704 3 K.ARGDDMNDYCTGISSDCPRNPWK.D
DID5B_ECH
OC
Echis
ocellatus
100 7707 590.929 3 -.NSAHPCCDPVTCQPK.K
VM2_BITAR Bitis arietans 88 9796 492.688 2 R.CCNAATCK.L
1112.44 2 K.ILEQGEDCDCGSPANCQDR.C
VM2D3_BIT
AR
Bitis arietans 32 9856 492.688 2 R.CCNAATCK.L
684.266 3 K.LTPGSQCSYGECCDQCK.F
VEGF TXVE_BITA
R
Bitis arietans 138 17126 686.879 2 R.TVELQVMQVTPK.T
768.396 2 R.ETLVSILEEYPDK.I
932.5 2 R.ETLVSILEEYPDKISK.I
5ʹNUC V5NTD_CR
OAD
Crotalus
adamanteus
95 65268 868.431 3 R.YDAMALGNHEFDNGLAGLLDPLLK.H
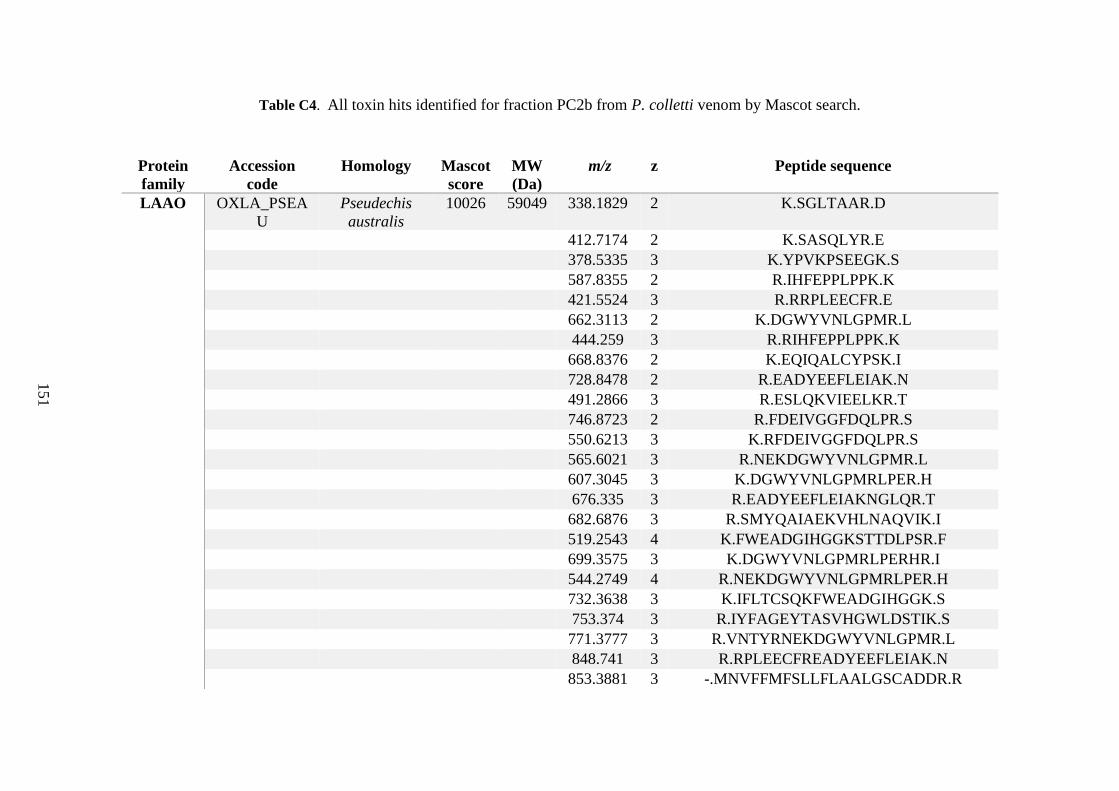
151
Table C4. All toxin hits identified for fraction PC2b from P. colletti venom by Mascot search.
Protein
family
Accession
code
Homology Mascot
score
MW
(Da)
m/z z Peptide sequence
LAAO OXLA_PSEA
U
Pseudechis
australis
10026 59049 338.1829 2 K.SGLTAAR.D
412.7174 2 K.SASQLYR.E
378.5335 3 K.YPVKPSEEGK.S
587.8355 2 R.IHFEPPLPPK.K
421.5524 3 R.RRPLEECFR.E
662.3113 2 K.DGWYVNLGPMR.L
444.259 3 R.RIHFEPPLPPK.K
668.8376 2 K.EQIQALCYPSK.I
728.8478 2 R.EADYEEFLEIAK.N
491.2866 3 R.ESLQKVIEELKR.T
746.8723 2 R.FDEIVGGFDQLPR.S
550.6213 3 K.RFDEIVGGFDQLPR.S
565.6021 3 R.NEKDGWYVNLGPMR.L
607.3045 3 K.DGWYVNLGPMRLPER.H
676.335 3 R.EADYEEFLEIAKNGLQR.T
682.6876 3 R.SMYQAIAEKVHLNAQVIK.I
519.2543 4 K.FWEADGIHGGKSTTDLPSR.F
699.3575 3 K.DGWYVNLGPMRLPERHR.I
544.2749 4 R.NEKDGWYVNLGPMRLPER.H
732.3638 3 K.IFLTCSQKFWEADGIHGGK.S
753.374 3 R.IYFAGEYTASVHGWLDSTIK.S
771.3777 3 R.VNTYRNEKDGWYVNLGPMR.L
848.741 3 R.RPLEECFREADYEEFLEIAK.N
853.3881 3 -.MNVFFMFSLLFLAALGSCADDR.R
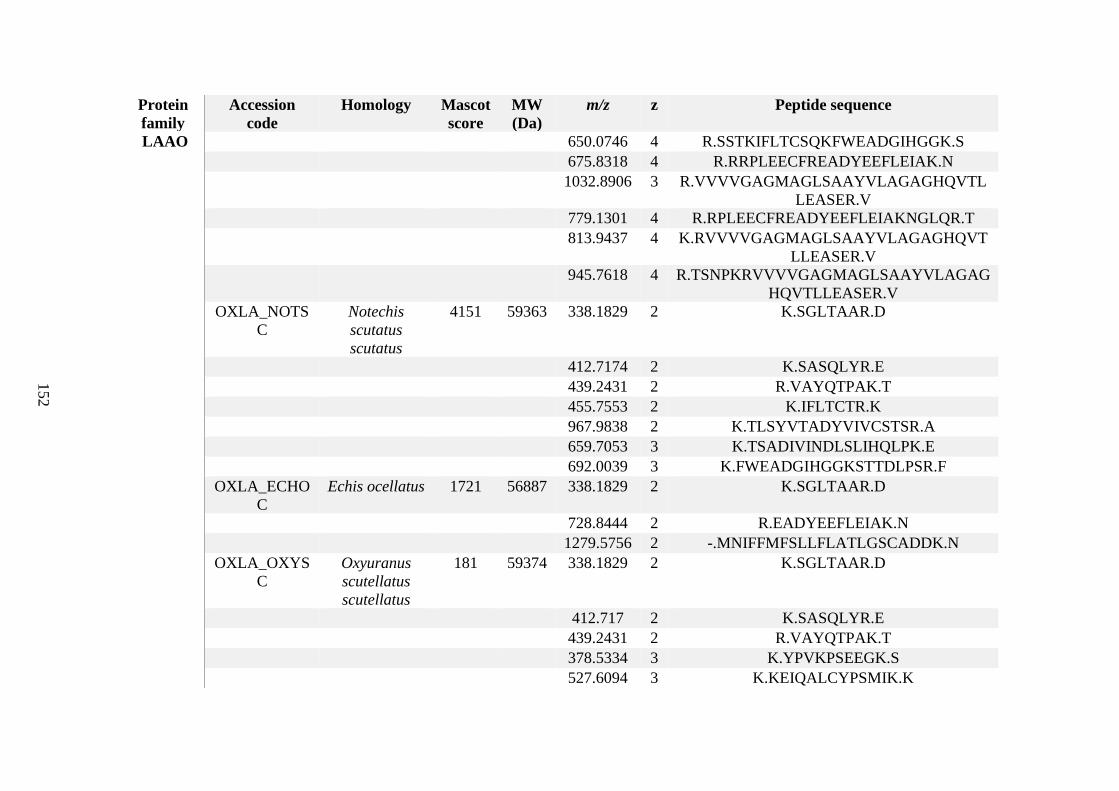
152
Protein
family
Accession
code
Homology Mascot
score
MW
(Da)
m/z z Peptide sequence
LAAO 650.0746 4 R.SSTKIFLTCSQKFWEADGIHGGK.S
675.8318 4 R.RRPLEECFREADYEEFLEIAK.N
1032.8906 3 R.VVVVGAGMAGLSAAYVLAGAGHQVTL
LEASER.V
779.1301 4 R.RPLEECFREADYEEFLEIAKNGLQR.T
813.9437 4 K.RVVVVGAGMAGLSAAYVLAGAGHQVT
LLEASER.V
945.7618 4 R.TSNPKRVVVVGAGMAGLSAAYVLAGAG
HQVTLLEASER.V
OXLA_NOTS
C
Notechis
scutatus
scutatus
4151 59363 338.1829 2 K.SGLTAAR.D
412.7174 2 K.SASQLYR.E
439.2431 2 R.VAYQTPAK.T
455.7553 2 K.IFLTCTR.K
967.9838 2 K.TLSYVTADYVIVCSTSR.A
659.7053 3 K.TSADIVINDLSLIHQLPK.E
692.0039 3 K.FWEADGIHGGKSTTDLPSR.F
OXLA_ECHO
C
Echis ocellatus 1721 56887 338.1829 2 K.SGLTAAR.D
728.8444 2 R.EADYEEFLEIAK.N
1279.5756 2 -.MNIFFMFSLLFLATLGSCADDK.N
OXLA_OXYS
C
Oxyuranus
scutellatus
scutellatus
181 59374 338.1829 2 K.SGLTAAR.D
412.717 2 K.SASQLYR.E
439.2431 2 R.VAYQTPAK.T
378.5334 3 K.YPVKPSEEGK.S
527.6094 3 K.KEIQALCYPSMIK.K
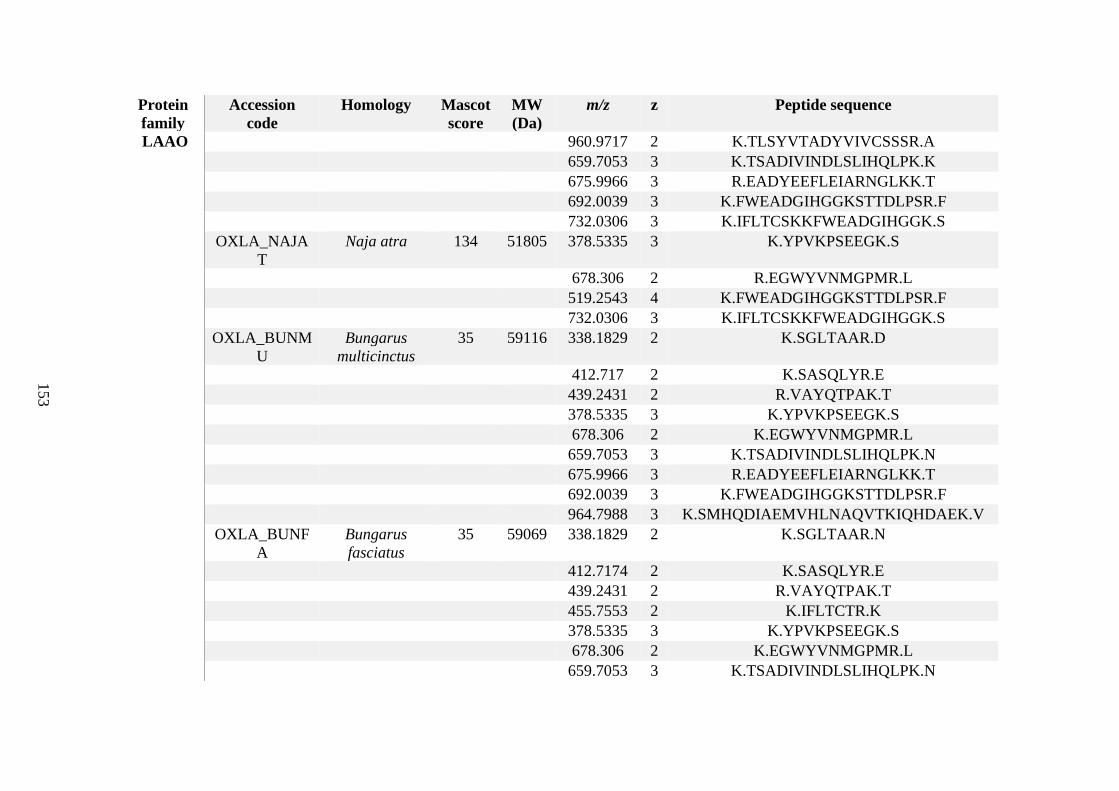
153
Protein
family
Accession
code
Homology Mascot
score
MW
(Da)
m/z z Peptide sequence
LAAO 960.9717 2 K.TLSYVTADYVIVCSSSR.A
659.7053 3 K.TSADIVINDLSLIHQLPK.K
675.9966 3 R.EADYEEFLEIARNGLKK.T
692.0039 3 K.FWEADGIHGGKSTTDLPSR.F
732.0306 3 K.IFLTCSKKFWEADGIHGGK.S
OXLA_NAJA
T
Naja atra 134 51805 378.5335 3 K.YPVKPSEEGK.S
678.306 2 R.EGWYVNMGPMR.L
519.2543 4 K.FWEADGIHGGKSTTDLPSR.F
732.0306 3 K.IFLTCSKKFWEADGIHGGK.S
OXLA_BUNM
U
Bungarus
multicinctus
35 59116 338.1829 2 K.SGLTAAR.D
412.717 2 K.SASQLYR.E
439.2431 2 R.VAYQTPAK.T
378.5335 3 K.YPVKPSEEGK.S
678.306 2 K.EGWYVNMGPMR.L
659.7053 3 K.TSADIVINDLSLIHQLPK.N
675.9966 3 R.EADYEEFLEIARNGLKK.T
692.0039 3 K.FWEADGIHGGKSTTDLPSR.F
964.7988 3 K.SMHQDIAEMVHLNAQVTKIQHDAEK.V
OXLA_BUNF
A
Bungarus
fasciatus
35 59069 338.1829 2 K.SGLTAAR.N
412.7174 2 K.SASQLYR.E
439.2431 2 R.VAYQTPAK.T
455.7553 2 K.IFLTCTR.K
378.5335 3 K.YPVKPSEEGK.S
678.306 2 K.EGWYVNMGPMR.L
659.7053 3 K.TSADIVINDLSLIHQLPK.N
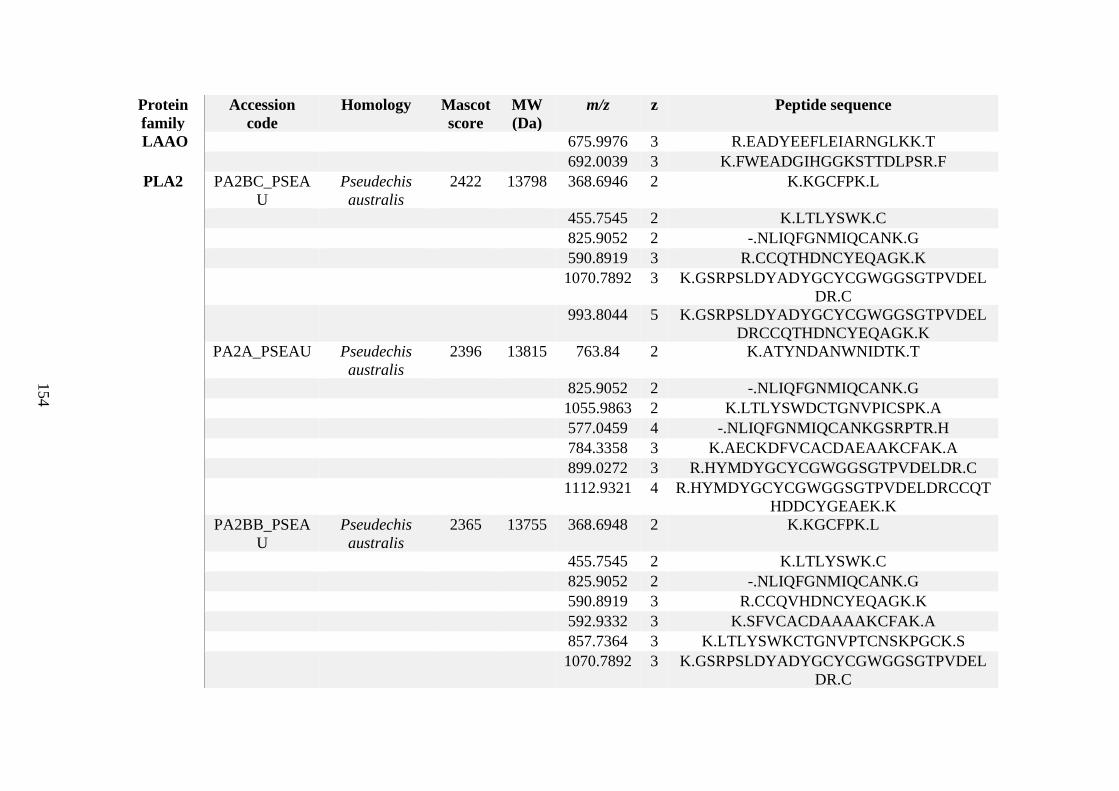
154
Protein
family
Accession
code
Homology Mascot
score
MW
(Da)
m/z z Peptide sequence
LAAO 675.9976 3 R.EADYEEFLEIARNGLKK.T
692.0039 3 K.FWEADGIHGGKSTTDLPSR.F
PLA2 PA2BC_PSEA
U
Pseudechis
australis
2422 13798 368.6946 2 K.KGCFPK.L
455.7545 2 K.LTLYSWK.C
825.9052 2 -.NLIQFGNMIQCANK.G
590.8919 3 R.CCQTHDNCYEQAGK.K
1070.7892 3 K.GSRPSLDYADYGCYCGWGGSGTPVDEL
DR.C
993.8044 5 K.GSRPSLDYADYGCYCGWGGSGTPVDEL
DRCCQTHDNCYEQAGK.K
PA2A_PSEAU Pseudechis
australis
2396 13815 763.84 2 K.ATYNDANWNIDTK.T
825.9052 2 -.NLIQFGNMIQCANK.G
1055.9863 2 K.LTLYSWDCTGNVPICSPK.A
577.0459 4 -.NLIQFGNMIQCANKGSRPTR.H
784.3358 3 K.AECKDFVCACDAEAAKCFAK.A
899.0272 3 R.HYMDYGCYCGWGGSGTPVDELDR.C
1112.9321 4 R.HYMDYGCYCGWGGSGTPVDELDRCCQT
HDDCYGEAEK.K
PA2BB_PSEA
U
Pseudechis
australis
2365 13755 368.6948 2 K.KGCFPK.L
455.7545 2 K.LTLYSWK.C
825.9052 2 -.NLIQFGNMIQCANK.G
590.8919 3 R.CCQVHDNCYEQAGK.K
592.9332 3 K.SFVCACDAAAAKCFAK.A
857.7364 3 K.LTLYSWKCTGNVPTCNSKPGCK.S
1070.7892 3 K.GSRPSLDYADYGCYCGWGGSGTPVDEL
DR.C
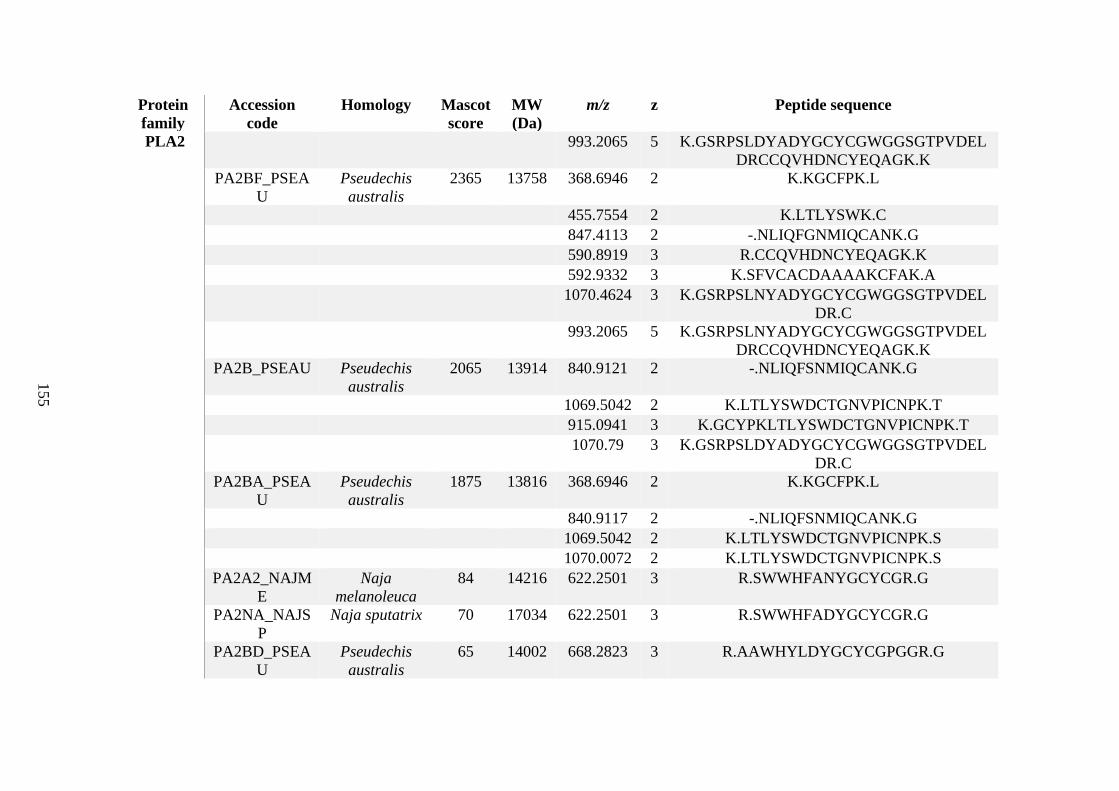
155
Protein
family
Accession
code
Homology Mascot
score
MW
(Da)
m/z z Peptide sequence
PLA2 993.2065 5 K.GSRPSLDYADYGCYCGWGGSGTPVDEL
DRCCQVHDNCYEQAGK.K
PA2BF_PSEA
U
Pseudechis
australis
2365 13758 368.6946 2 K.KGCFPK.L
455.7554 2 K.LTLYSWK.C
847.4113 2 -.NLIQFGNMIQCANK.G
590.8919 3 R.CCQVHDNCYEQAGK.K
592.9332 3 K.SFVCACDAAAAKCFAK.A
1070.4624 3 K.GSRPSLNYADYGCYCGWGGSGTPVDEL
DR.C
993.2065 5 K.GSRPSLNYADYGCYCGWGGSGTPVDEL
DRCCQVHDNCYEQAGK.K
PA2B_PSEAU Pseudechis
australis
2065 13914 840.9121 2 -.NLIQFSNMIQCANK.G
1069.5042 2 K.LTLYSWDCTGNVPICNPK.T
915.0941 3 K.GCYPKLTLYSWDCTGNVPICNPK.T
1070.79 3 K.GSRPSLDYADYGCYCGWGGSGTPVDEL
DR.C
PA2BA_PSEA
U
Pseudechis
australis
1875 13816 368.6946 2 K.KGCFPK.L
840.9117 2 -.NLIQFSNMIQCANK.G
1069.5042 2 K.LTLYSWDCTGNVPICNPK.S
1070.0072 2 K.LTLYSWDCTGNVPICNPK.S
PA2A2_NAJM
E
Naja
melanoleuca
84 14216 622.2501 3 R.SWWHFANYGCYCGR.G
PA2NA_NAJS
P
Naja sputatrix 70 17034 622.2501 3 R.SWWHFADYGCYCGR.G
PA2BD_PSEA
U
Pseudechis
australis
65 14002 668.2823 3 R.AAWHYLDYGCYCGPGGR.G
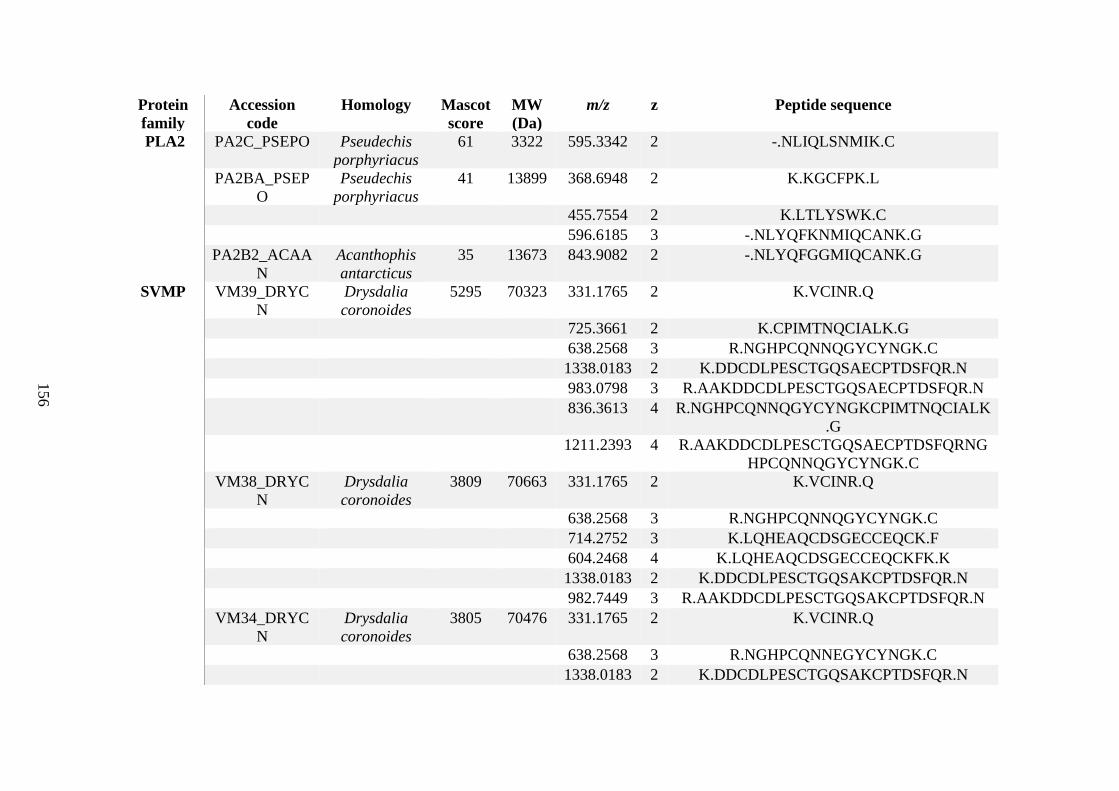
156
Protein
family
Accession
code
Homology Mascot
score
MW
(Da)
m/z z Peptide sequence
PLA2 PA2C_PSEPO Pseudechis
porphyriacus
61 3322 595.3342 2 -.NLIQLSNMIK.C
PA2BA_PSEP
O
Pseudechis
porphyriacus
41 13899 368.6948 2 K.KGCFPK.L
455.7554 2 K.LTLYSWK.C
596.6185 3 -.NLYQFKNMIQCANK.G
PA2B2_ACAA
N
Acanthophis
antarcticus
35 13673 843.9082 2 -.NLYQFGGMIQCANK.G
SVMP VM39_DRYC
N
Drysdalia
coronoides
5295 70323 331.1765 2 K.VCINR.Q
725.3661 2 K.CPIMTNQCIALK.G
638.2568 3 R.NGHPCQNNQGYCYNGK.C
1338.0183 2 K.DDCDLPESCTGQSAECPTDSFQR.N
983.0798 3 R.AAKDDCDLPESCTGQSAECPTDSFQR.N
836.3613 4 R.NGHPCQNNQGYCYNGKCPIMTNQCIALK
.G
1211.2393 4 R.AAKDDCDLPESCTGQSAECPTDSFQRNG
HPCQNNQGYCYNGK.C
VM38_DRYC
N
Drysdalia
coronoides
3809 70663 331.1765 2 K.VCINR.Q
638.2568 3 R.NGHPCQNNQGYCYNGK.C
714.2752 3 K.LQHEAQCDSGECCEQCK.F
604.2468 4 K.LQHEAQCDSGECCEQCKFK.K
1338.0183 2 K.DDCDLPESCTGQSAKCPTDSFQR.N
982.7449 3 R.AAKDDCDLPESCTGQSAKCPTDSFQR.N
VM34_DRYC
N
Drysdalia
coronoides
3805 70476 331.1765 2 K.VCINR.Q
638.2568 3 R.NGHPCQNNEGYCYNGK.C
1338.0183 2 K.DDCDLPESCTGQSAKCPTDSFQR.N
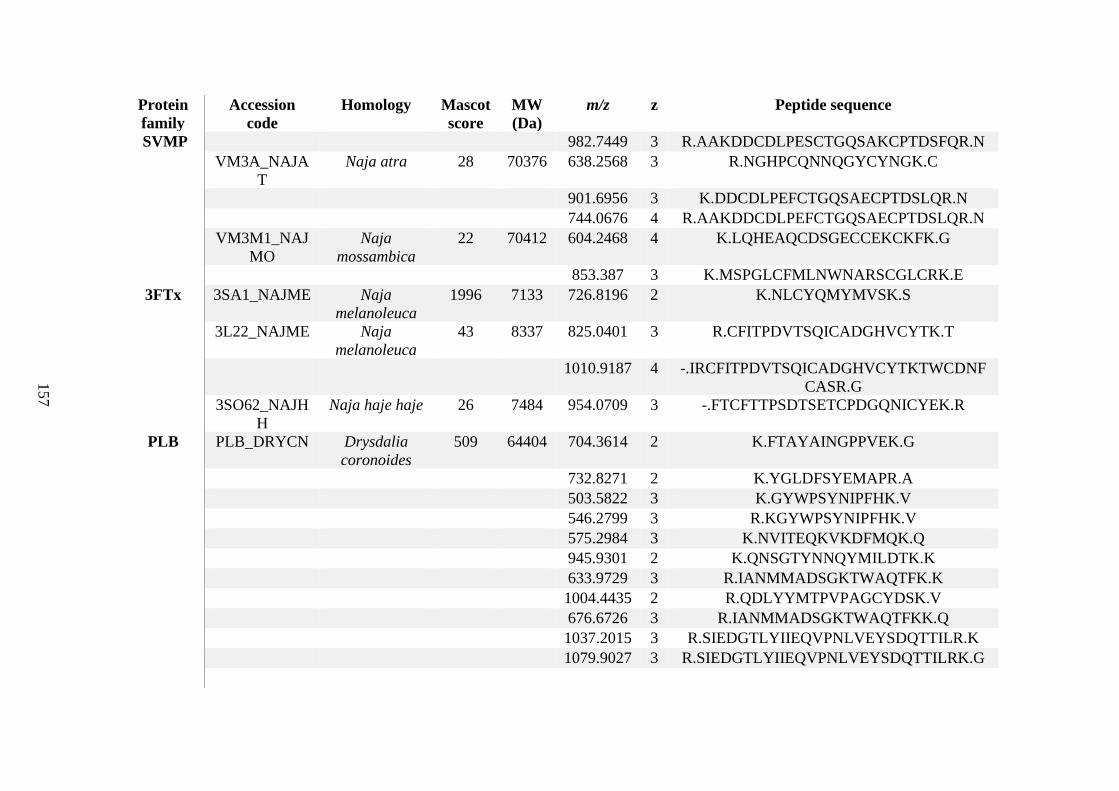
157
Protein
family
Accession
code
Homology Mascot
score
MW
(Da)
m/z z Peptide sequence
SVMP 982.7449 3 R.AAKDDCDLPESCTGQSAKCPTDSFQR.N
VM3A_NAJA
T
Naja atra 28 70376 638.2568 3 R.NGHPCQNNQGYCYNGK.C
901.6956 3 K.DDCDLPEFCTGQSAECPTDSLQR.N
744.0676 4 R.AAKDDCDLPEFCTGQSAECPTDSLQR.N
VM3M1_NAJ
MO
Naja
mossambica
22 70412 604.2468 4 K.LQHEAQCDSGECCEKCKFK.G
853.387 3 K.MSPGLCFMLNWNARSCGLCRK.E
3FTx 3SA1_NAJME Naja
melanoleuca
1996 7133 726.8196 2 K.NLCYQMYMVSK.S
3L22_NAJME Naja
melanoleuca
43 8337 825.0401 3 R.CFITPDVTSQICADGHVCYTK.T
1010.9187 4 -.IRCFITPDVTSQICADGHVCYTKTWCDNF
CASR.G
3SO62_NAJH
H
Naja haje haje 26 7484 954.0709 3 -.FTCFTTPSDTSETCPDGQNICYEK.R
PLB PLB_DRYCN Drysdalia
coronoides
509 64404 704.3614 2 K.FTAYAINGPPVEK.G
732.8271 2 K.YGLDFSYEMAPR.A
503.5822 3 K.GYWPSYNIPFHK.V
546.2799 3 R.KGYWPSYNIPFHK.V
575.2984 3 K.NVITEQKVKDFMQK.Q
945.9301 2 K.QNSGTYNNQYMILDTK.K
633.9729 3 R.IANMMADSGKTWAQTFK.K
1004.4435 2 R.QDLYYMTPVPAGCYDSK.V
676.6726 3 R.IANMMADSGKTWAQTFKK.Q
1037.2015 3 R.SIEDGTLYIIEQVPNLVEYSDQTTILR.K
1079.9027 3 R.SIEDGTLYIIEQVPNLVEYSDQTTILRK.G
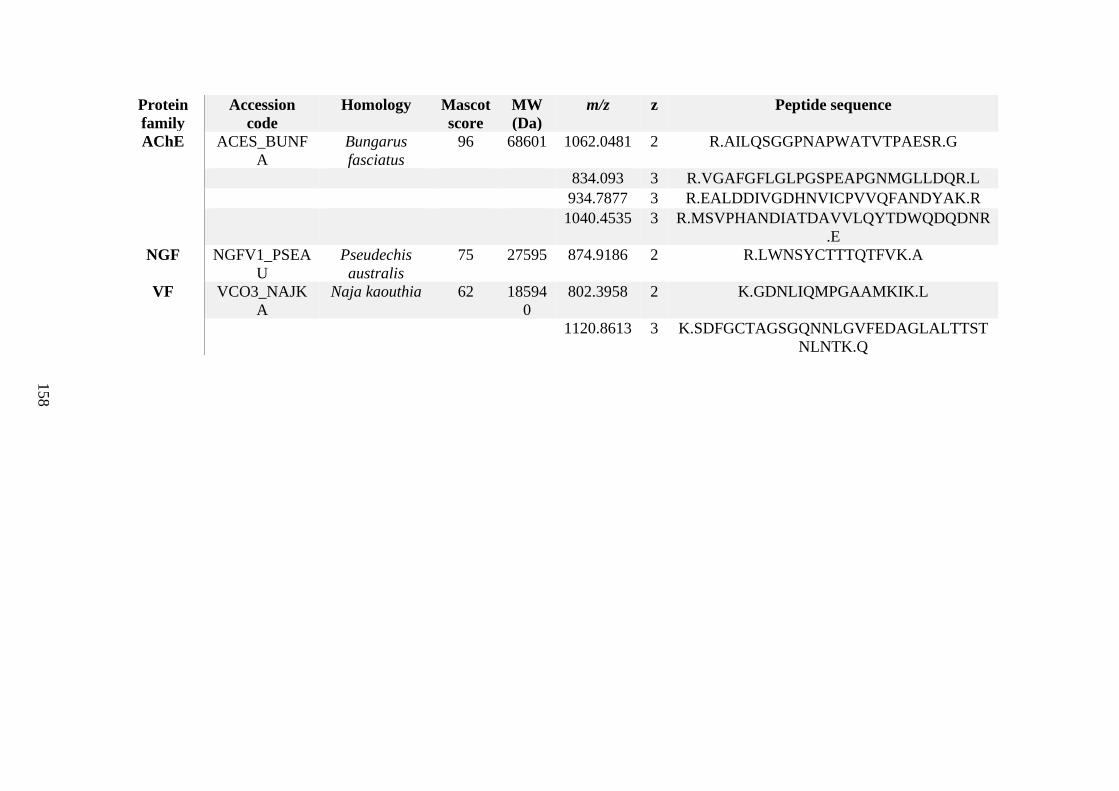
158
Protein
family
Accession
code
Homology Mascot
score
MW
(Da)
m/z z Peptide sequence
AChE ACES_BUNF
A
Bungarus
fasciatus
96 68601 1062.0481 2 R.AILQSGGPNAPWATVTPAESR.G
834.093 3 R.VGAFGFLGLPGSPEAPGNMGLLDQR.L
934.7877 3 R.EALDDIVGDHNVICPVVQFANDYAK.R
1040.4535 3 R.MSVPHANDIATDAVVLQYTDWQDQDNR
.E
NGF NGFV1_PSEA
U
Pseudechis
australis
75 27595 874.9186 2 R.LWNSYCTTTQTFVK.A
VF VCO3_NAJK
A
Naja kaouthia 62 18594
0
802.3958 2 K.GDNLIQMPGAAMKIK.L
1120.8613 3 K.SDFGCTAGSGQNNLGVFEDAGLALTTST
NLNTK.Q
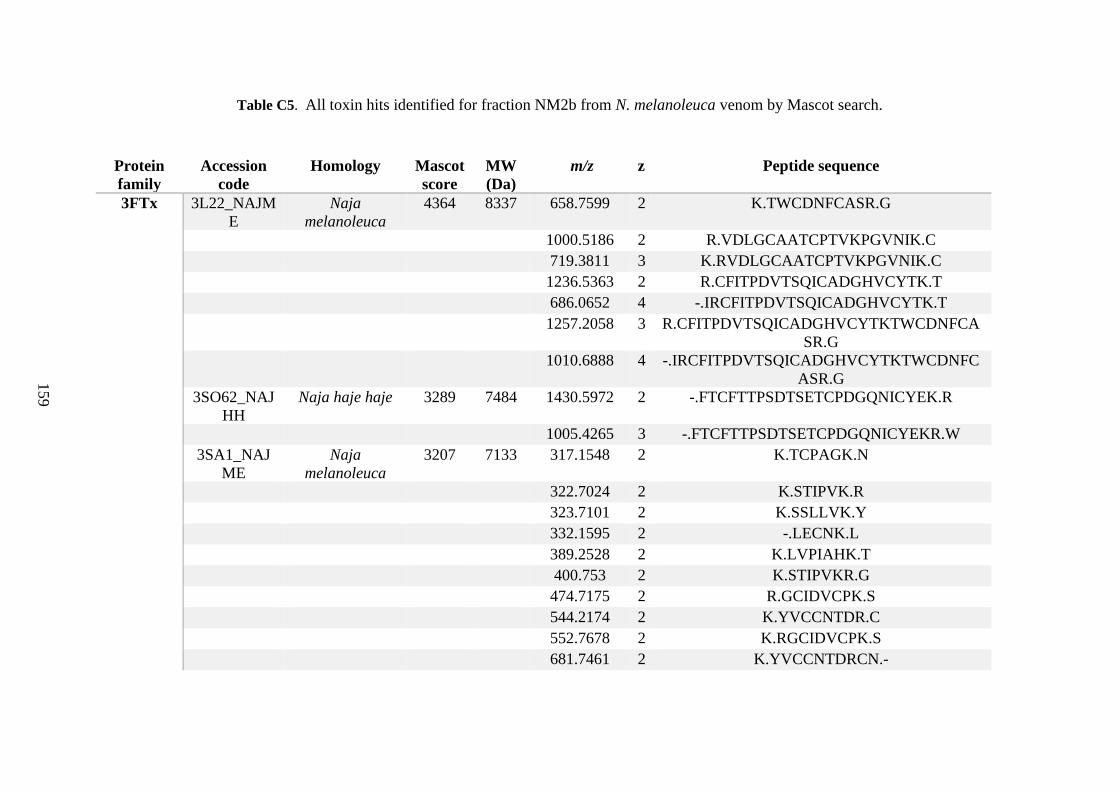
159
Table C5. All toxin hits identified for fraction NM2b from N. melanoleuca venom by Mascot search.
Protein
family
Accession
code
Homology Mascot
score
MW
(Da)
m/z z Peptide sequence
3FTx 3L22_NAJM
E
Naja
melanoleuca
4364 8337 658.7599 2 K.TWCDNFCASR.G
1000.5186 2 R.VDLGCAATCPTVKPGVNIK.C
719.3811 3 K.RVDLGCAATCPTVKPGVNIK.C
1236.5363 2 R.CFITPDVTSQICADGHVCYTK.T
686.0652 4 -.IRCFITPDVTSQICADGHVCYTK.T
1257.2058 3 R.CFITPDVTSQICADGHVCYTKTWCDNFCA
SR.G
1010.6888 4 -.IRCFITPDVTSQICADGHVCYTKTWCDNFC
ASR.G
3SO62_NAJ
HH
Naja haje haje 3289 7484 1430.5972 2 -.FTCFTTPSDTSETCPDGQNICYEK.R
1005.4265 3 -.FTCFTTPSDTSETCPDGQNICYEKR.W
3SA1_NAJ
ME
Naja
melanoleuca
3207 7133 317.1548 2 K.TCPAGK.N
322.7024 2 K.STIPVK.R
323.7101 2 K.SSLLVK.Y
332.1595 2 -.LECNK.L
389.2528 2 K.LVPIAHK.T
400.753 2 K.STIPVKR.G
474.7175 2 R.GCIDVCPK.S
544.2174 2 K.YVCCNTDR.C
552.7678 2 K.RGCIDVCPK.S
681.7461 2 K.YVCCNTDRCN.-
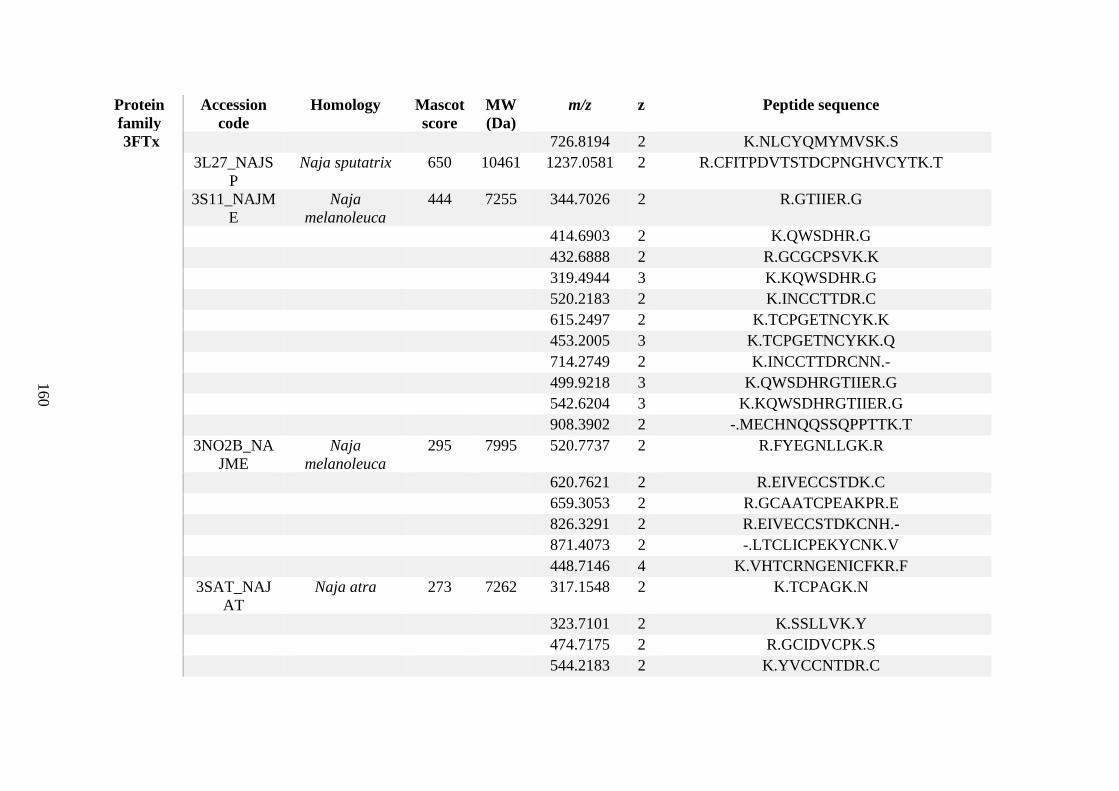
160
Protein
family
Accession
code
Homology Mascot
score
MW
(Da)
m/z z Peptide sequence
3FTx 726.8194 2 K.NLCYQMYMVSK.S
3L27_NAJS
P
Naja sputatrix 650 10461 1237.0581 2 R.CFITPDVTSTDCPNGHVCYTK.T
3S11_NAJM
E
Naja
melanoleuca
444 7255 344.7026 2 R.GTIIER.G
414.6903 2 K.QWSDHR.G
432.6888 2 R.GCGCPSVK.K
319.4944 3 K.KQWSDHR.G
520.2183 2 K.INCCTTDR.C
615.2497 2 K.TCPGETNCYK.K
453.2005 3 K.TCPGETNCYKK.Q
714.2749 2 K.INCCTTDRCNN.-
499.9218 3 K.QWSDHRGTIIER.G
542.6204 3 K.KQWSDHRGTIIER.G
908.3902 2 -.MECHNQQSSQPPTTK.T
3NO2B_NA
JME
Naja
melanoleuca
295 7995 520.7737 2 R.FYEGNLLGK.R
620.7621 2 R.EIVECCSTDK.C
659.3053 2 R.GCAATCPEAKPR.E
826.3291 2 R.EIVECCSTDKCNH.-
871.4073 2 -.LTCLICPEKYCNK.V
448.7146 4 K.VHTCRNGENICFKR.F
3SAT_NAJ
AT
Naja atra 273 7262 317.1548 2 K.TCPAGK.N
323.7101 2 K.SSLLVK.Y
474.7175 2 R.GCIDVCPK.S
544.2183 2 K.YVCCNTDR.C
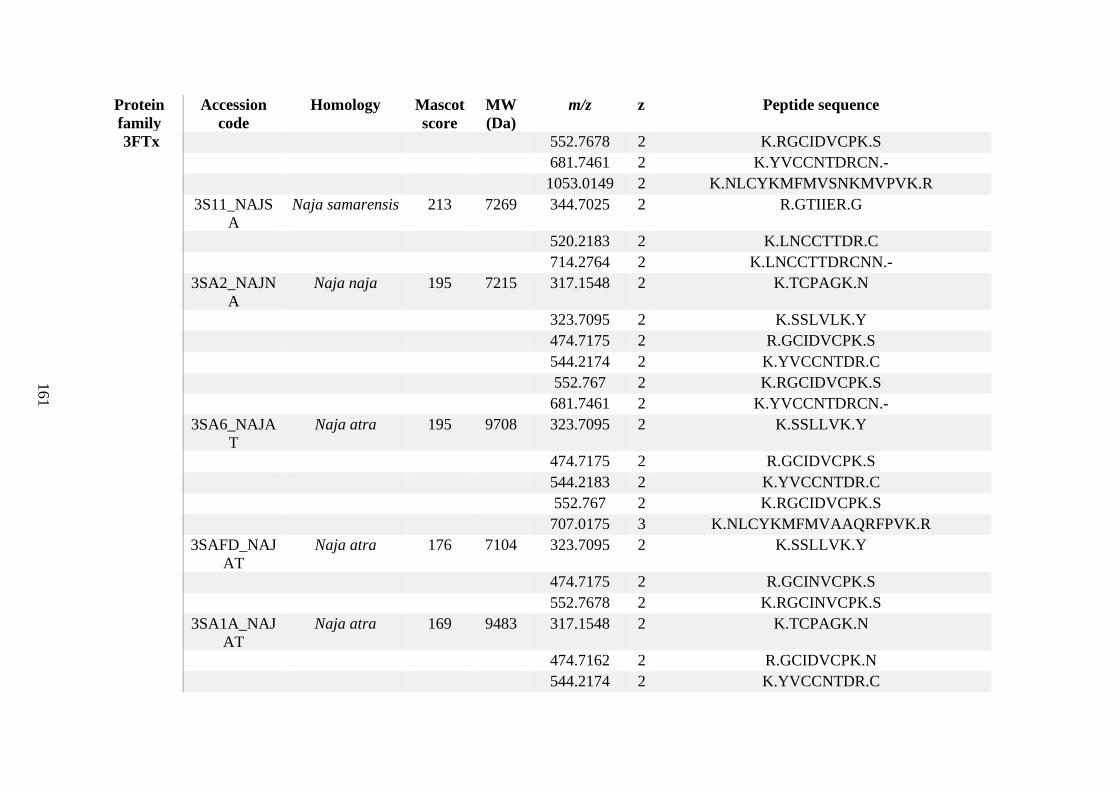
161
Protein
family
Accession
code
Homology Mascot
score
MW
(Da)
m/z z Peptide sequence
3FTx 552.7678 2 K.RGCIDVCPK.S
681.7461 2 K.YVCCNTDRCN.-
1053.0149 2 K.NLCYKMFMVSNKMVPVK.R
3S11_NAJS
A
Naja samarensis 213 7269 344.7025 2 R.GTIIER.G
520.2183 2 K.LNCCTTDR.C
714.2764 2 K.LNCCTTDRCNN.-
3SA2_NAJN
A
Naja naja 195 7215 317.1548 2 K.TCPAGK.N
323.7095 2 K.SSLVLK.Y
474.7175 2 R.GCIDVCPK.S
544.2174 2 K.YVCCNTDR.C
552.767 2 K.RGCIDVCPK.S
681.7461 2 K.YVCCNTDRCN.-
3SA6_NAJA
T
Naja atra 195 9708 323.7095 2 K.SSLLVK.Y
474.7175 2 R.GCIDVCPK.S
544.2183 2 K.YVCCNTDR.C
552.767 2 K.RGCIDVCPK.S
707.0175 3 K.NLCYKMFMVAAQRFPVK.R
3SAFD_NAJ
AT
Naja atra 176 7104 323.7095 2 K.SSLLVK.Y
474.7175 2 R.GCINVCPK.S
552.7678 2 K.RGCINVCPK.S
3SA1A_NAJ
AT
Naja atra 169 9483 317.1548 2 K.TCPAGK.N
474.7162 2 R.GCIDVCPK.N
544.2174 2 K.YVCCNTDR.C
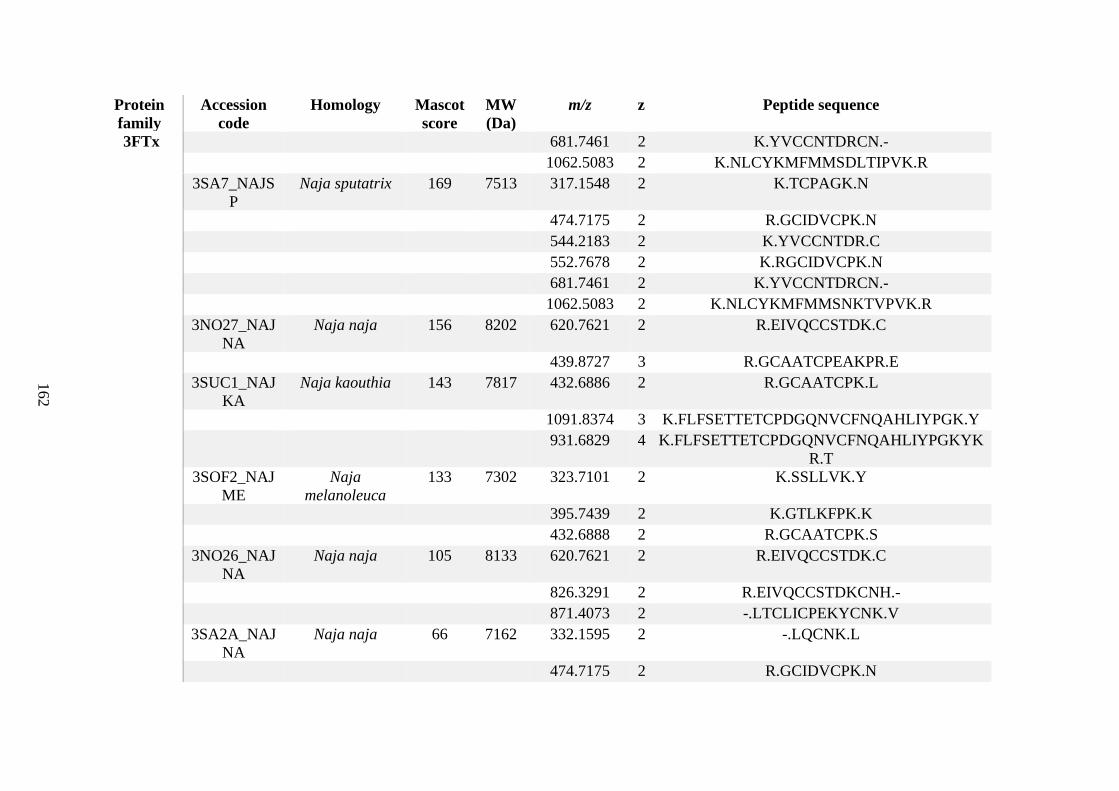
162
Protein
family
Accession
code
Homology Mascot
score
MW
(Da)
m/z z Peptide sequence
3FTx 681.7461 2 K.YVCCNTDRCN.-
1062.5083 2 K.NLCYKMFMMSDLTIPVK.R
3SA7_NAJS
P
Naja sputatrix 169 7513 317.1548 2 K.TCPAGK.N
474.7175 2 R.GCIDVCPK.N
544.2183 2 K.YVCCNTDR.C
552.7678 2 K.RGCIDVCPK.N
681.7461 2 K.YVCCNTDRCN.-
1062.5083 2 K.NLCYKMFMMSNKTVPVK.R
3NO27_NAJ
NA
Naja naja 156 8202 620.7621 2 R.EIVQCCSTDK.C
439.8727 3 R.GCAATCPEAKPR.E
3SUC1_NAJ
KA
Naja kaouthia 143 7817 432.6886 2 R.GCAATCPK.L
1091.8374 3 K.FLFSETTETCPDGQNVCFNQAHLIYPGK.Y
931.6829 4 K.FLFSETTETCPDGQNVCFNQAHLIYPGKYK
R.T
3SOF2_NAJ
ME
Naja
melanoleuca
133 7302 323.7101 2 K.SSLLVK.Y
395.7439 2 K.GTLKFPK.K
432.6888 2 R.GCAATCPK.S
3NO26_NAJ
NA
Naja naja 105 8133 620.7621 2 R.EIVQCCSTDK.C
826.3291 2 R.EIVQCCSTDKCNH.-
871.4073 2 -.LTCLICPEKYCNK.V
3SA2A_NAJ
NA
Naja naja 66 7162 332.1595 2 -.LQCNK.L
474.7175 2 R.GCIDVCPK.N
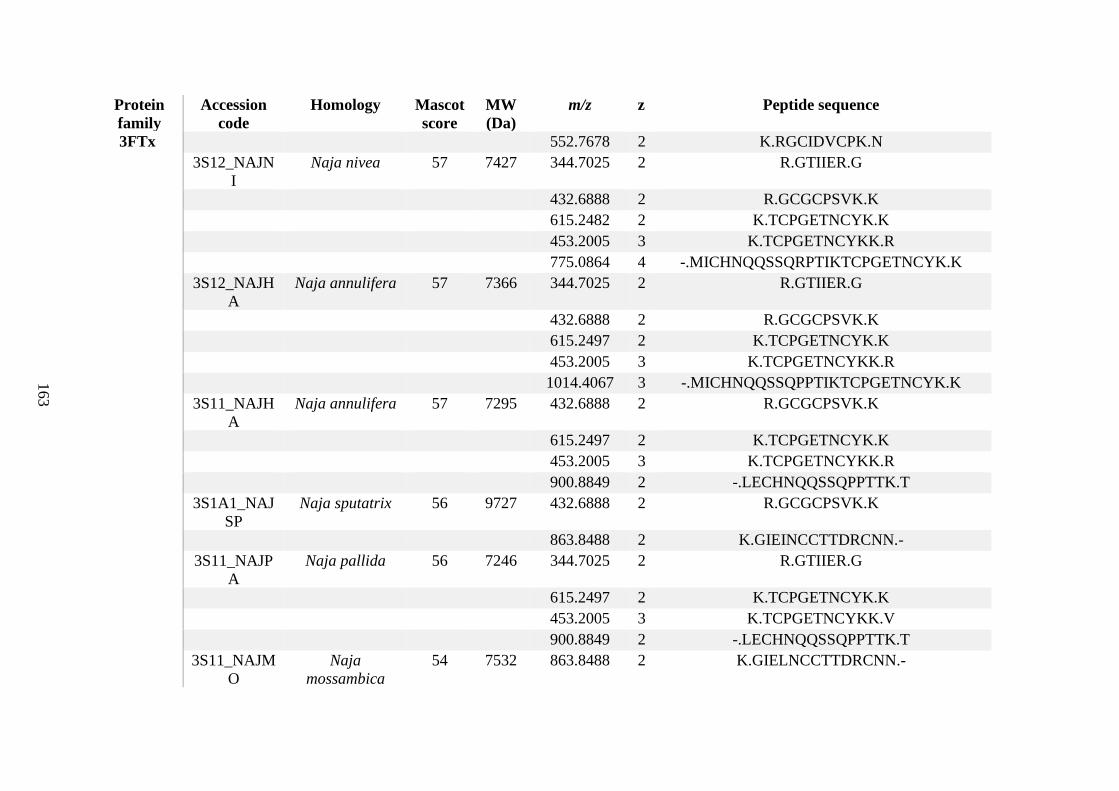
163
Protein
family
Accession
code
Homology Mascot
score
MW
(Da)
m/z z Peptide sequence
3FTx 552.7678 2 K.RGCIDVCPK.N
3S12_NAJN
I
Naja nivea 57 7427 344.7025 2 R.GTIIER.G
432.6888 2 R.GCGCPSVK.K
615.2482 2 K.TCPGETNCYK.K
453.2005 3 K.TCPGETNCYKK.R
775.0864 4 -.MICHNQQSSQRPTIKTCPGETNCYK.K
3S12_NAJH
A
Naja annulifera 57 7366 344.7025 2 R.GTIIER.G
432.6888 2 R.GCGCPSVK.K
615.2497 2 K.TCPGETNCYK.K
453.2005 3 K.TCPGETNCYKK.R
1014.4067 3 -.MICHNQQSSQPPTIKTCPGETNCYK.K
3S11_NAJH
A
Naja annulifera 57 7295 432.6888 2 R.GCGCPSVK.K
615.2497 2 K.TCPGETNCYK.K
453.2005 3 K.TCPGETNCYKK.R
900.8849 2 -.LECHNQQSSQPPTTK.T
3S1A1_NAJ
SP
Naja sputatrix 56 9727 432.6888 2 R.GCGCPSVK.K
863.8488 2 K.GIEINCCTTDRCNN.-
3S11_NAJP
A
Naja pallida 56 7246 344.7025 2 R.GTIIER.G
615.2497 2 K.TCPGETNCYK.K
453.2005 3 K.TCPGETNCYKK.V
900.8849 2 -.LECHNQQSSQPPTTK.T
3S11_NAJM
O
Naja
mossambica
54 7532 863.8488 2 K.GIELNCCTTDRCNN.-
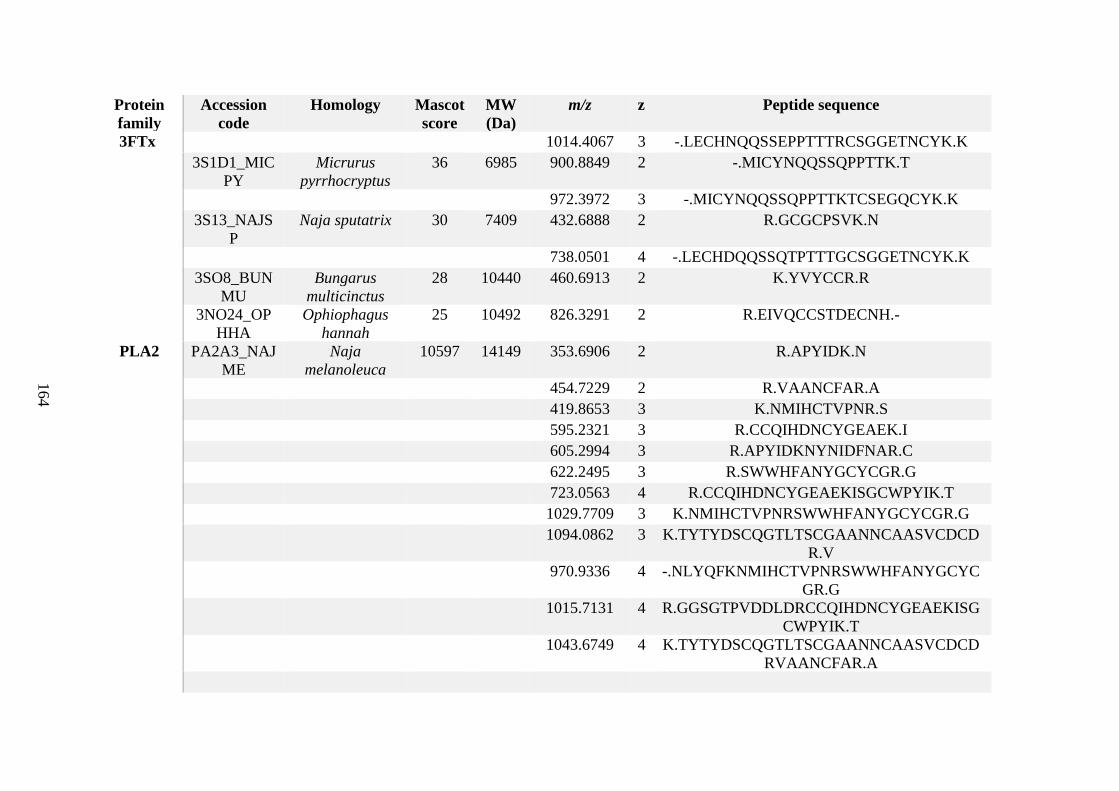
164
Protein
family
Accession
code
Homology Mascot
score
MW
(Da)
m/z z Peptide sequence
3FTx 1014.4067 3 -.LECHNQQSSEPPTTTRCSGGETNCYK.K
3S1D1_MIC
PY
Micrurus
pyrrhocryptus
36 6985 900.8849 2 -.MICYNQQSSQPPTTK.T
972.3972 3 -.MICYNQQSSQPPTTKTCSEGQCYK.K
3S13_NAJS
P
Naja sputatrix 30 7409 432.6888 2 R.GCGCPSVK.N
738.0501 4 -.LECHDQQSSQTPTTTGCSGGETNCYK.K
3SO8_BUN
MU
Bungarus
multicinctus
28 10440 460.6913 2 K.YVYCCR.R
3NO24_OP
HHA
Ophiophagus
hannah
25 10492 826.3291 2 R.EIVQCCSTDECNH.-
PLA2 PA2A3_NAJ
ME
Naja
melanoleuca
10597 14149 353.6906 2 R.APYIDK.N
454.7229 2 R.VAANCFAR.A
419.8653 3 K.NMIHCTVPNR.S
595.2321 3 R.CCQIHDNCYGEAEK.I
605.2994 3 R.APYIDKNYNIDFNAR.C
622.2495 3 R.SWWHFANYGCYCGR.G
723.0563 4 R.CCQIHDNCYGEAEKISGCWPYIK.T
1029.7709 3 K.NMIHCTVPNRSWWHFANYGCYCGR.G
1094.0862 3 K.TYTYDSCQGTLTSCGAANNCAASVCDCD
R.V
970.9336 4 -.NLYQFKNMIHCTVPNRSWWHFANYGCYC
GR.G
1015.7131 4 R.GGSGTPVDDLDRCCQIHDNCYGEAEKISG
CWPYIK.T
1043.6749 4 K.TYTYDSCQGTLTSCGAANNCAASVCDCD
RVAANCFAR.A
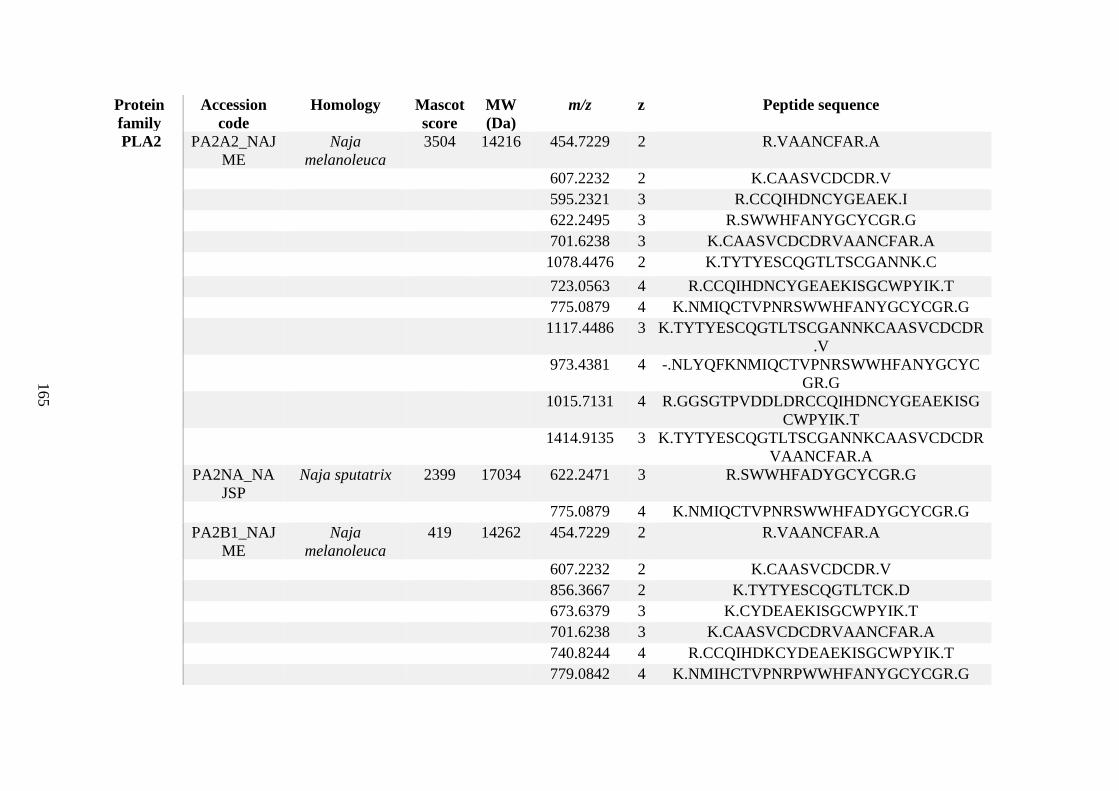
165
Protein
family
Accession
code
Homology Mascot
score
MW
(Da)
m/z z Peptide sequence
PLA2 PA2A2_NAJ
ME
Naja
melanoleuca
3504 14216 454.7229 2 R.VAANCFAR.A
607.2232 2 K.CAASVCDCDR.V
595.2321 3 R.CCQIHDNCYGEAEK.I
622.2495 3 R.SWWHFANYGCYCGR.G
701.6238 3 K.CAASVCDCDRVAANCFAR.A
1078.4476 2 K.TYTYESCQGTLTSCGANNK.C
723.0563 4 R.CCQIHDNCYGEAEKISGCWPYIK.T
775.0879 4 K.NMIQCTVPNRSWWHFANYGCYCGR.G
1117.4486 3 K.TYTYESCQGTLTSCGANNKCAASVCDCDR
.V
973.4381 4 -.NLYQFKNMIQCTVPNRSWWHFANYGCYC
GR.G
1015.7131 4 R.GGSGTPVDDLDRCCQIHDNCYGEAEKISG
CWPYIK.T
1414.9135 3 K.TYTYESCQGTLTSCGANNKCAASVCDCDR
VAANCFAR.A
PA2NA_NA
JSP
Naja sputatrix 2399 17034 622.2471 3 R.SWWHFADYGCYCGR.G
775.0879 4 K.NMIQCTVPNRSWWHFADYGCYCGR.G
PA2B1_NAJ
ME
Naja
melanoleuca
419 14262 454.7229 2 R.VAANCFAR.A
607.2232 2 K.CAASVCDCDR.V
856.3667 2 K.TYTYESCQGTLTCK.D
673.6379 3 K.CYDEAEKISGCWPYIK.T
701.6238 3 K.CAASVCDCDRVAANCFAR.A
740.8244 4 R.CCQIHDKCYDEAEKISGCWPYIK.T
779.0842 4 K.NMIHCTVPNRPWWHFANYGCYCGR.G
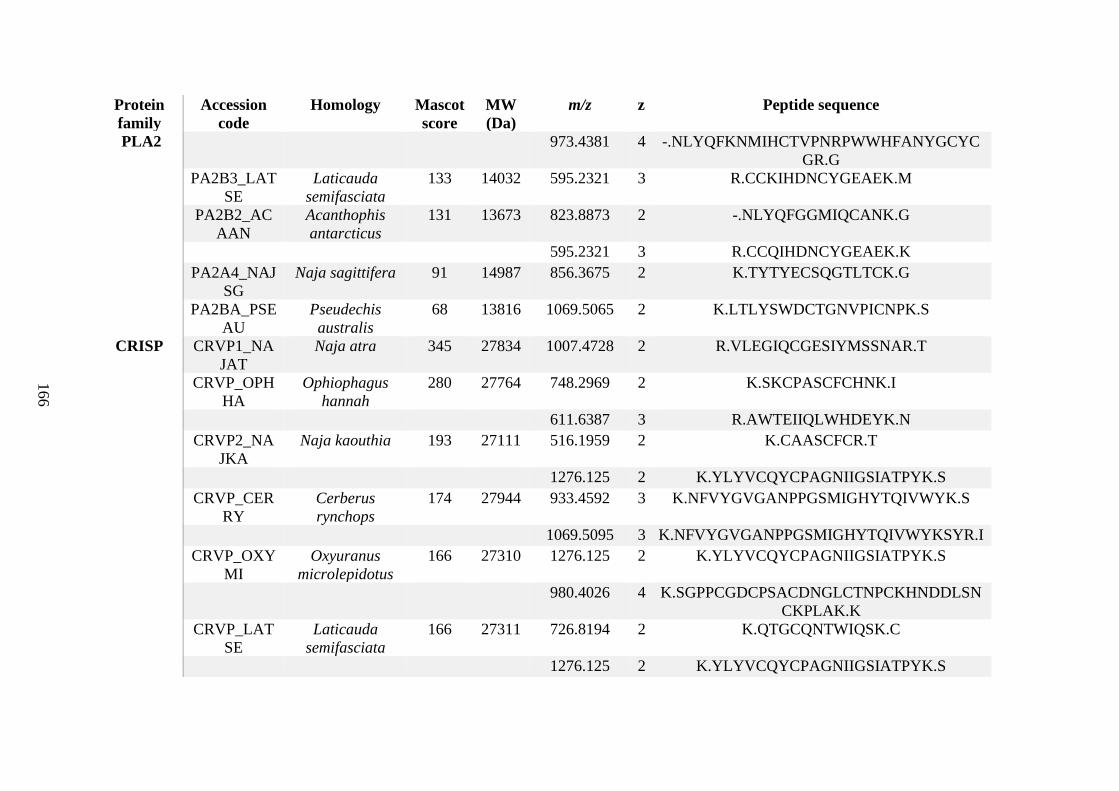
166
Protein
family
Accession
code
Homology Mascot
score
MW
(Da)
m/z z Peptide sequence
PLA2 973.4381 4 -.NLYQFKNMIHCTVPNRPWWHFANYGCYC
GR.G
PA2B3_LAT
SE
Laticauda
semifasciata
133 14032 595.2321 3 R.CCKIHDNCYGEAEK.M
PA2B2_AC
AAN
Acanthophis
antarcticus
131 13673 823.8873 2 -.NLYQFGGMIQCANK.G
595.2321 3 R.CCQIHDNCYGEAEK.K
PA2A4_NAJ
SG
Naja sagittifera 91 14987 856.3675 2 K.TYTYECSQGTLTCK.G
PA2BA_PSE
AU
Pseudechis
australis
68 13816 1069.5065 2 K.LTLYSWDCTGNVPICNPK.S
CRISP CRVP1_NA
JAT
Naja atra 345 27834 1007.4728 2 R.VLEGIQCGESIYMSSNAR.T
CRVP_OPH
HA
Ophiophagus
hannah
280 27764 748.2969 2 K.SKCPASCFCHNK.I
611.6387 3 R.AWTEIIQLWHDEYK.N
CRVP2_NA
JKA
Naja kaouthia 193 27111 516.1959 2 K.CAASCFCR.T
1276.125 2 K.YLYVCQYCPAGNIIGSIATPYK.S
CRVP_CER
RY
Cerberus
rynchops
174 27944 933.4592 3 K.NFVYGVGANPPGSMIGHYTQIVWYK.S
1069.5095 3 K.NFVYGVGANPPGSMIGHYTQIVWYKSYR.I
CRVP_OXY
MI
Oxyuranus
microlepidotus
166 27310 1276.125 2 K.YLYVCQYCPAGNIIGSIATPYK.S
980.4026 4 K.SGPPCGDCPSACDNGLCTNPCKHNDDLSN
CKPLAK.K
CRVP_LAT
SE
Laticauda
semifasciata
166 27311 726.8194 2 K.QTGCQNTWIQSK.C
1276.125 2 K.YLYVCQYCPAGNIIGSIATPYK.S
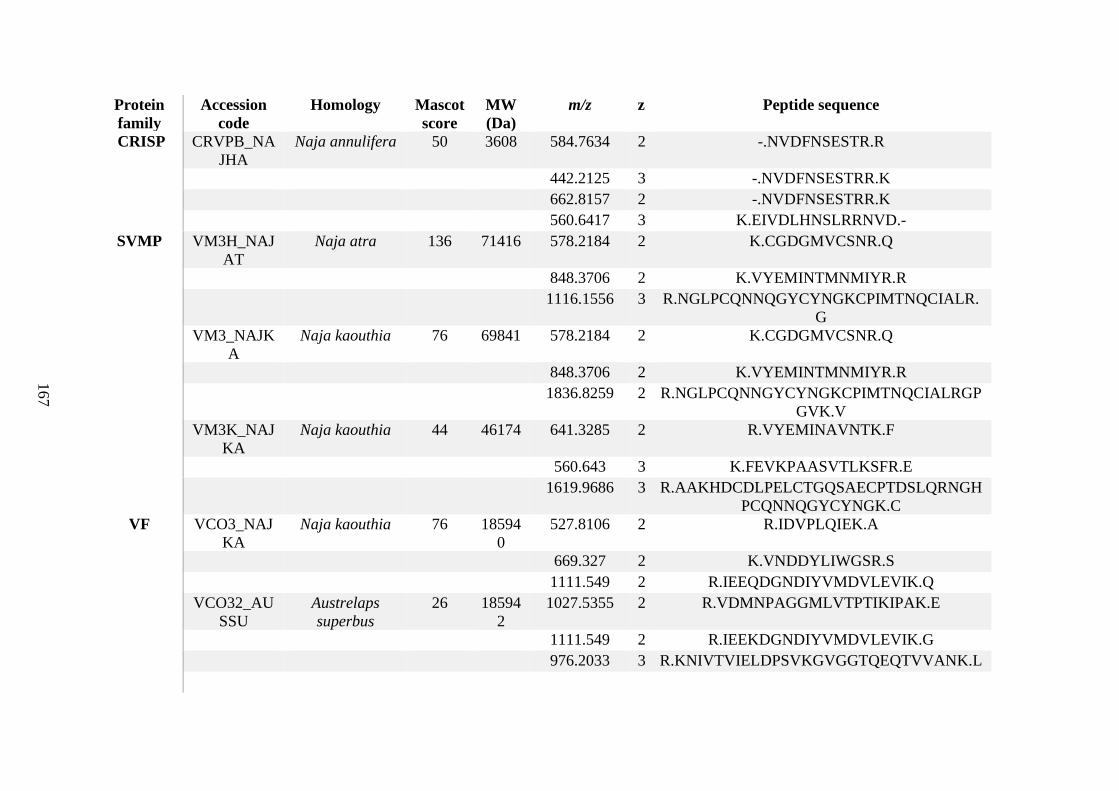
167
Protein
family
Accession
code
Homology Mascot
score
MW
(Da)
m/z z Peptide sequence
CRISP CRVPB_NA
JHA
Naja annulifera 50 3608 584.7634 2 -.NVDFNSESTR.R
442.2125 3 -.NVDFNSESTRR.K
662.8157 2 -.NVDFNSESTRR.K
560.6417 3 K.EIVDLHNSLRRNVD.-
SVMP VM3H_NAJ
AT
Naja atra 136 71416 578.2184 2 K.CGDGMVCSNR.Q
848.3706 2 K.VYEMINTMNMIYR.R
1116.1556 3 R.NGLPCQNNQGYCYNGKCPIMTNQCIALR.
G
VM3_NAJK
A
Naja kaouthia 76 69841 578.2184 2 K.CGDGMVCSNR.Q
848.3706 2 K.VYEMINTMNMIYR.R
1836.8259 2 R.NGLPCQNNGYCYNGKCPIMTNQCIALRGP
GVK.V
VM3K_NAJ
KA
Naja kaouthia 44 46174 641.3285 2 R.VYEMINAVNTK.F
560.643 3 K.FEVKPAASVTLKSFR.E
1619.9686 3 R.AAKHDCDLPELCTGQSAECPTDSLQRNGH
PCQNNQGYCYNGK.C
VF VCO3_NAJ
KA
Naja kaouthia 76 18594
0
527.8106 2 R.IDVPLQIEK.A
669.327 2 K.VNDDYLIWGSR.S
1111.549 2 R.IEEQDGNDIYVMDVLEVIK.Q
VCO32_AU
SSU
Austrelaps
superbus
26 18594
2
1027.5355 2 R.VDMNPAGGMLVTPTIKIPAK.E
1111.549 2 R.IEEKDGNDIYVMDVLEVIK.G
976.2033 3 R.KNIVTVIELDPSVKGVGGTQEQTVVANK.L
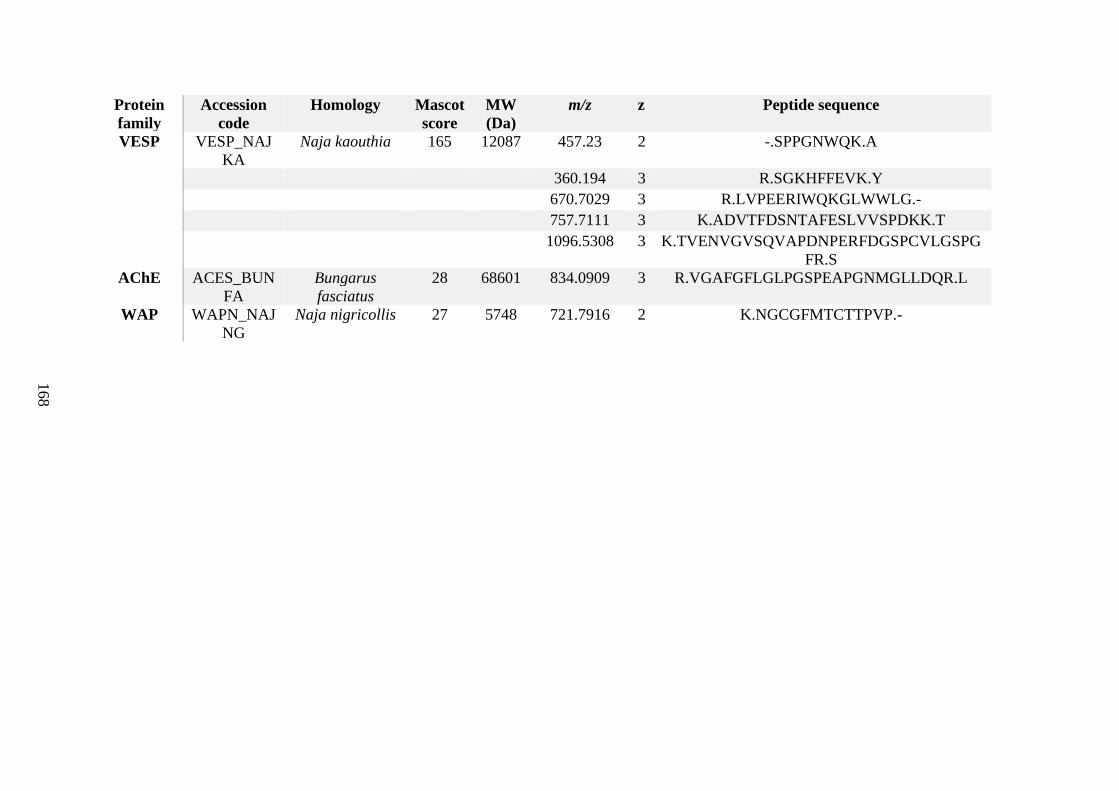
168
Protein
family
Accession
code
Homology Mascot
score
MW
(Da)
m/z z Peptide sequence
VESP VESP_NAJ
KA
Naja kaouthia 165 12087 457.23 2 -.SPPGNWQK.A
360.194 3 R.SGKHFFEVK.Y
670.7029 3 R.LVPEERIWQKGLWWLG.-
757.7111 3 K.ADVTFDSNTAFESLVVSPDKK.T
1096.5308 3 K.TVENVGVSQVAPDNPERFDGSPCVLGSPG
FR.S
AChE ACES_BUN
FA
Bungarus
fasciatus
28 68601 834.0909 3 R.VGAFGFLGLPGSPEAPGNMGLLDQR.L
WAP WAPN_NAJ
NG
Naja nigricollis 27 5748 721.7916 2 K.NGCGFMTCTTPVP.-
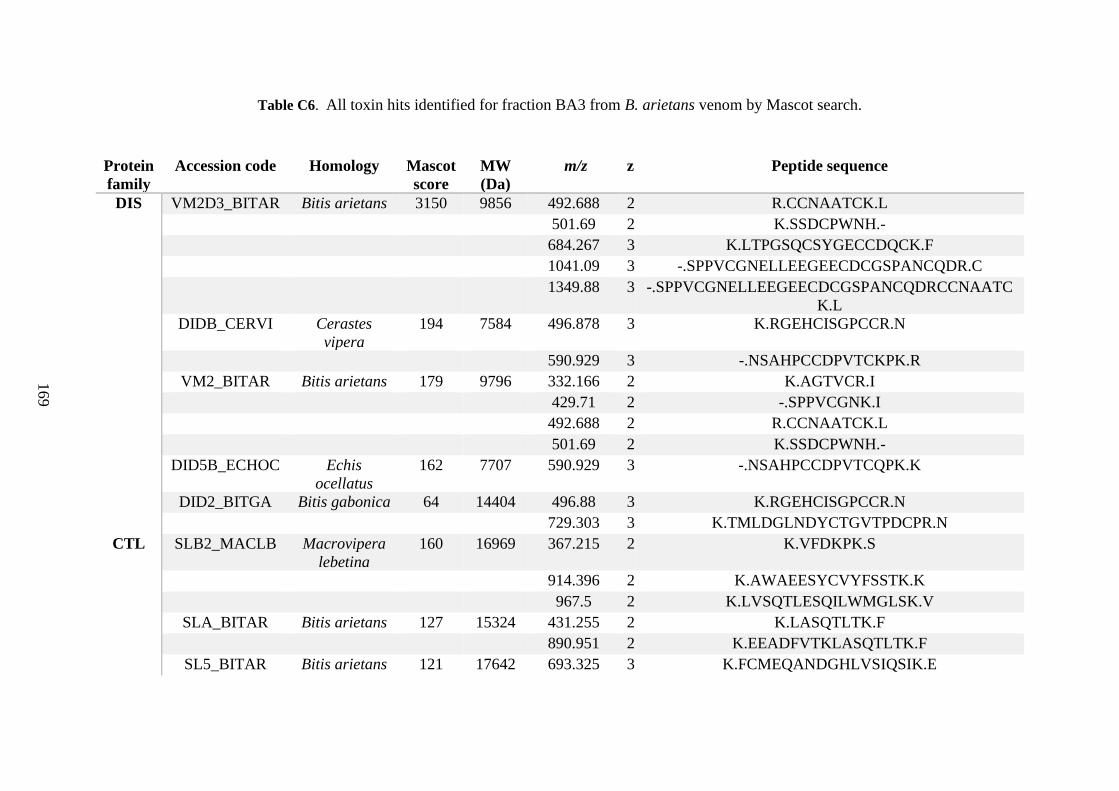
169
Table C6. All toxin hits identified for fraction BA3 from B. arietans venom by Mascot search.
Protein
family
Accession code Homology Mascot
score
MW
(Da)
m/z z Peptide sequence
DIS VM2D3_BITAR Bitis arietans 3150 9856 492.688 2 R.CCNAATCK.L
501.69 2 K.SSDCPWNH.-
684.267 3 K.LTPGSQCSYGECCDQCK.F
1041.09 3 -.SPPVCGNELLEEGEECDCGSPANCQDR.C
1349.88 3 -.SPPVCGNELLEEGEECDCGSPANCQDRCCNAATC
K.L
DIDB_CERVI Cerastes
vipera
194 7584 496.878 3 K.RGEHCISGPCCR.N
590.929 3 -.NSAHPCCDPVTCKPK.R
VM2_BITAR Bitis arietans 179 9796 332.166 2 K.AGTVCR.I
429.71 2 -.SPPVCGNK.I
492.688 2 R.CCNAATCK.L
501.69 2 K.SSDCPWNH.-
DID5B_ECHOC Echis
ocellatus
162 7707 590.929 3 -.NSAHPCCDPVTCQPK.K
DID2_BITGA Bitis gabonica 64 14404 496.88 3 K.RGEHCISGPCCR.N
729.303 3 K.TMLDGLNDYCTGVTPDCPR.N
CTL SLB2_MACLB Macrovipera
lebetina
160 16969 367.215 2 K.VFDKPK.S
914.396 2 K.AWAEESYCVYFSSTK.K
967.5 2 K.LVSQTLESQILWMGLSK.V
SLA_BITAR Bitis arietans 127 15324 431.255 2 K.LASQTLTK.F
890.951 2 K.EEADFVTKLASQTLTK.F
SL5_BITAR Bitis arietans 121 17642 693.325 3 K.FCMEQANDGHLVSIQSIK.E
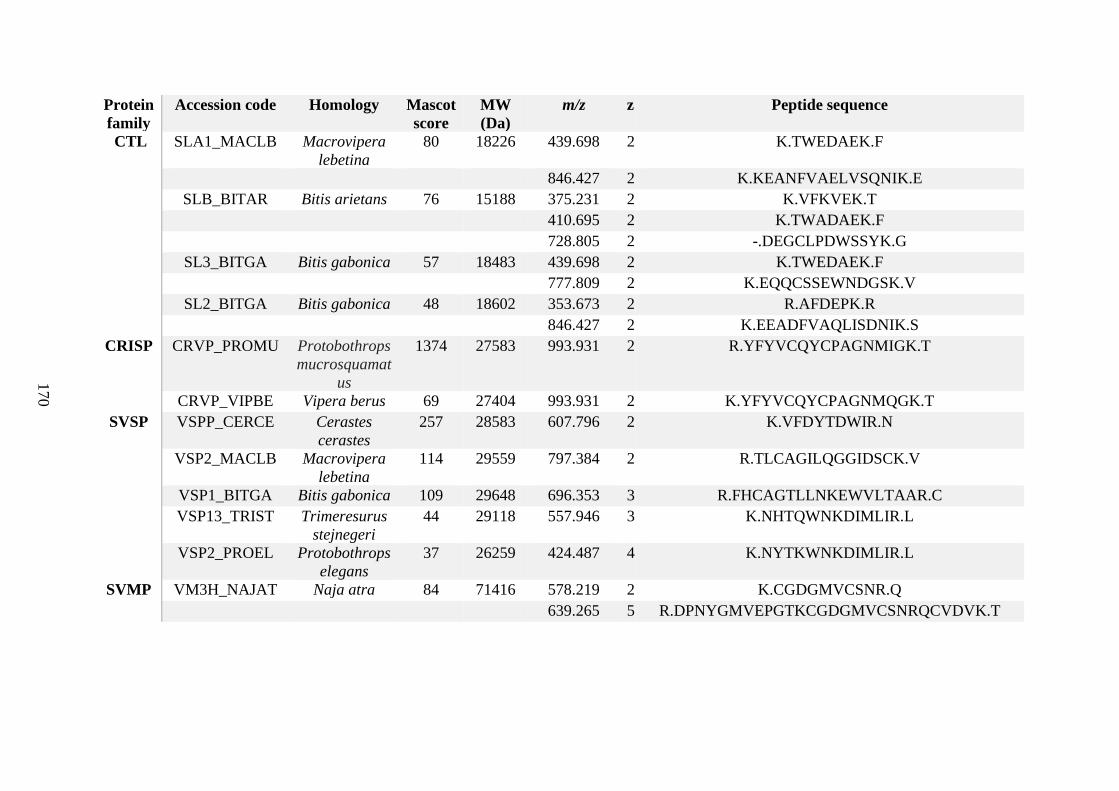
170
Protein
family
Accession code Homology Mascot
score
MW
(Da)
m/z z Peptide sequence
CTL SLA1_MACLB Macrovipera
lebetina
80 18226 439.698 2 K.TWEDAEK.F
846.427 2 K.KEANFVAELVSQNIK.E
SLB_BITAR Bitis arietans 76 15188 375.231 2 K.VFKVEK.T
410.695 2 K.TWADAEK.F
728.805 2 -.DEGCLPDWSSYK.G
SL3_BITGA Bitis gabonica 57 18483 439.698 2 K.TWEDAEK.F
777.809 2 K.EQQCSSEWNDGSK.V
SL2_BITGA Bitis gabonica 48 18602 353.673 2 R.AFDEPK.R
846.427 2 K.EEADFVAQLISDNIK.S
CRISP CRVP_PROMU Protobothrops
mucrosquamat
us
1374 27583 993.931 2 R.YFYVCQYCPAGNMIGK.T
CRVP_VIPBE Vipera berus 69 27404 993.931 2 K.YFYVCQYCPAGNMQGK.T
SVSP VSPP_CERCE Cerastes
cerastes
257 28583 607.796 2 K.VFDYTDWIR.N
VSP2_MACLB Macrovipera
lebetina
114 29559 797.384 2 R.TLCAGILQGGIDSCK.V
VSP1_BITGA Bitis gabonica 109 29648 696.353 3 R.FHCAGTLLNKEWVLTAAR.C
VSP13_TRIST Trimeresurus
stejnegeri
44 29118 557.946 3 K.NHTQWNKDIMLIR.L
VSP2_PROEL Protobothrops
elegans
37 26259 424.487 4 K.NYTKWNKDIMLIR.L
SVMP VM3H_NAJAT Naja atra 84 71416 578.219 2 K.CGDGMVCSNR.Q
639.265 5 R.DPNYGMVEPGTKCGDGMVCSNRQCVDVK.T
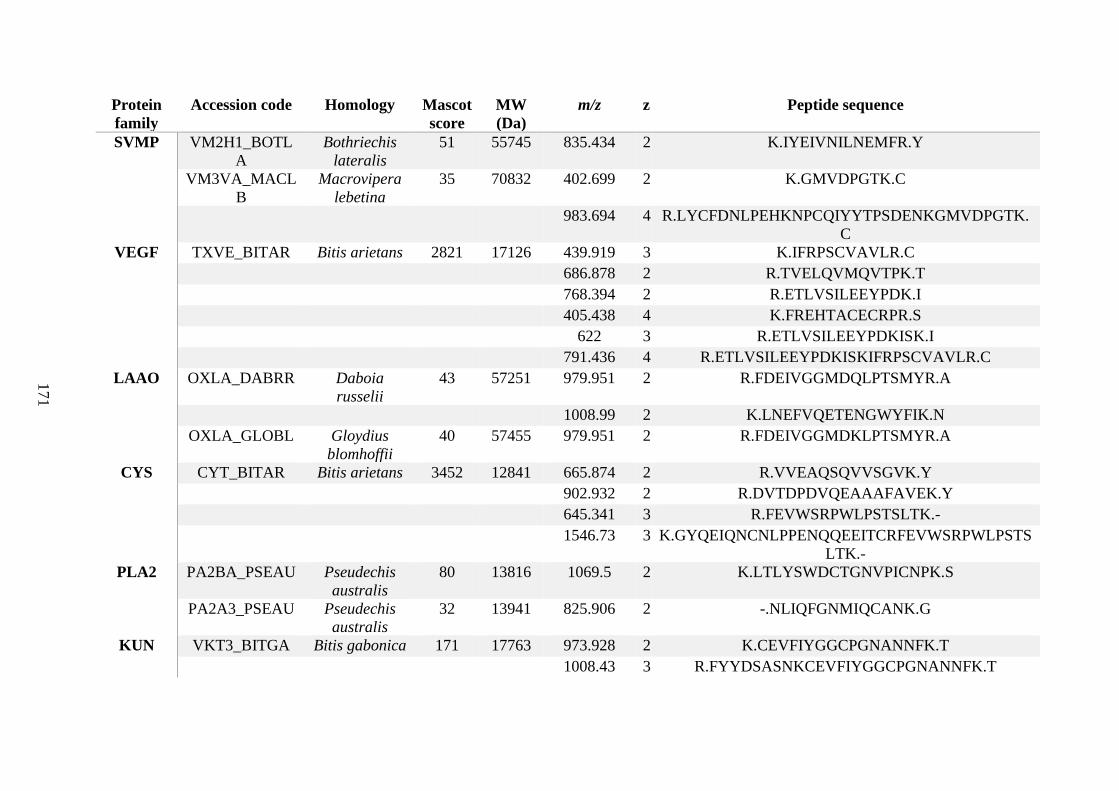
171
Protein
family
Accession code Homology Mascot
score
MW
(Da)
m/z z Peptide sequence
SVMP VM2H1_BOTL
A
Bothriechis
lateralis
51 55745 835.434 2 K.IYEIVNILNEMFR.Y
VM3VA_MACL
B
Macrovipera
lebetina
35 70832 402.699 2 K.GMVDPGTK.C
983.694 4 R.LYCFDNLPEHKNPCQIYYTPSDENKGMVDPGTK.
C
VEGF TXVE_BITAR Bitis arietans 2821 17126 439.919 3 K.IFRPSCVAVLR.C
686.878 2 R.TVELQVMQVTPK.T
768.394 2 R.ETLVSILEEYPDK.I
405.438 4 K.FREHTACECRPR.S
622 3 R.ETLVSILEEYPDKISK.I
791.436 4 R.ETLVSILEEYPDKISKIFRPSCVAVLR.C
LAAO OXLA_DABRR Daboia
russelii
43 57251 979.951 2 R.FDEIVGGMDQLPTSMYR.A
1008.99 2 K.LNEFVQETENGWYFIK.N
OXLA_GLOBL Gloydius
blomhoffii
40 57455 979.951 2 R.FDEIVGGMDKLPTSMYR.A
CYS CYT_BITAR Bitis arietans 3452 12841 665.874 2 R.VVEAQSQVVSGVK.Y
902.932 2 R.DVTDPDVQEAAAFAVEK.Y
645.341 3 R.FEVWSRPWLPSTSLTK.-
1546.73 3 K.GYQEIQNCNLPPENQQEEITCRFEVWSRPWLPSTS
LTK.-
PLA2 PA2BA_PSEAU Pseudechis
australis
80 13816 1069.5 2 K.LTLYSWDCTGNVPICNPK.S
PA2A3_PSEAU Pseudechis
australis
32 13941 825.906 2 -.NLIQFGNMIQCANK.G
KUN VKT3_BITGA Bitis gabonica 171 17763 973.928 2 K.CEVFIYGGCPGNANNFK.T
1008.43 3 R.FYYDSASNKCEVFIYGGCPGNANNFK.T