structural insights into xenobiotic and inhibitor ... - media.nature.com · ... faculdade de...
TRANSCRIPT
Structural insights into xenobiotic and inhibitor binding
to human Aldehyde Oxidase
Supplementary Information
Catarina Coelho1, Alessandro Foti2, Tobias Hartmann2, Teresa Santos-Silva1, Silke Leimkühler2 and Maria João Romão1
1UCIBIO@REQUIMTE – Departamento de Química, Faculdade de Ciências e Tecnologia, Universidade Nova de Lisboa, 2829-516 Caparica, Portugal
2Institute of Biochemistry and Biology, Department of Molecular Enzymology, University of Potsdam, D-14476 Potsdam, Germany
Nature Chemical Biology: doi:10.1038/nchembio.1895
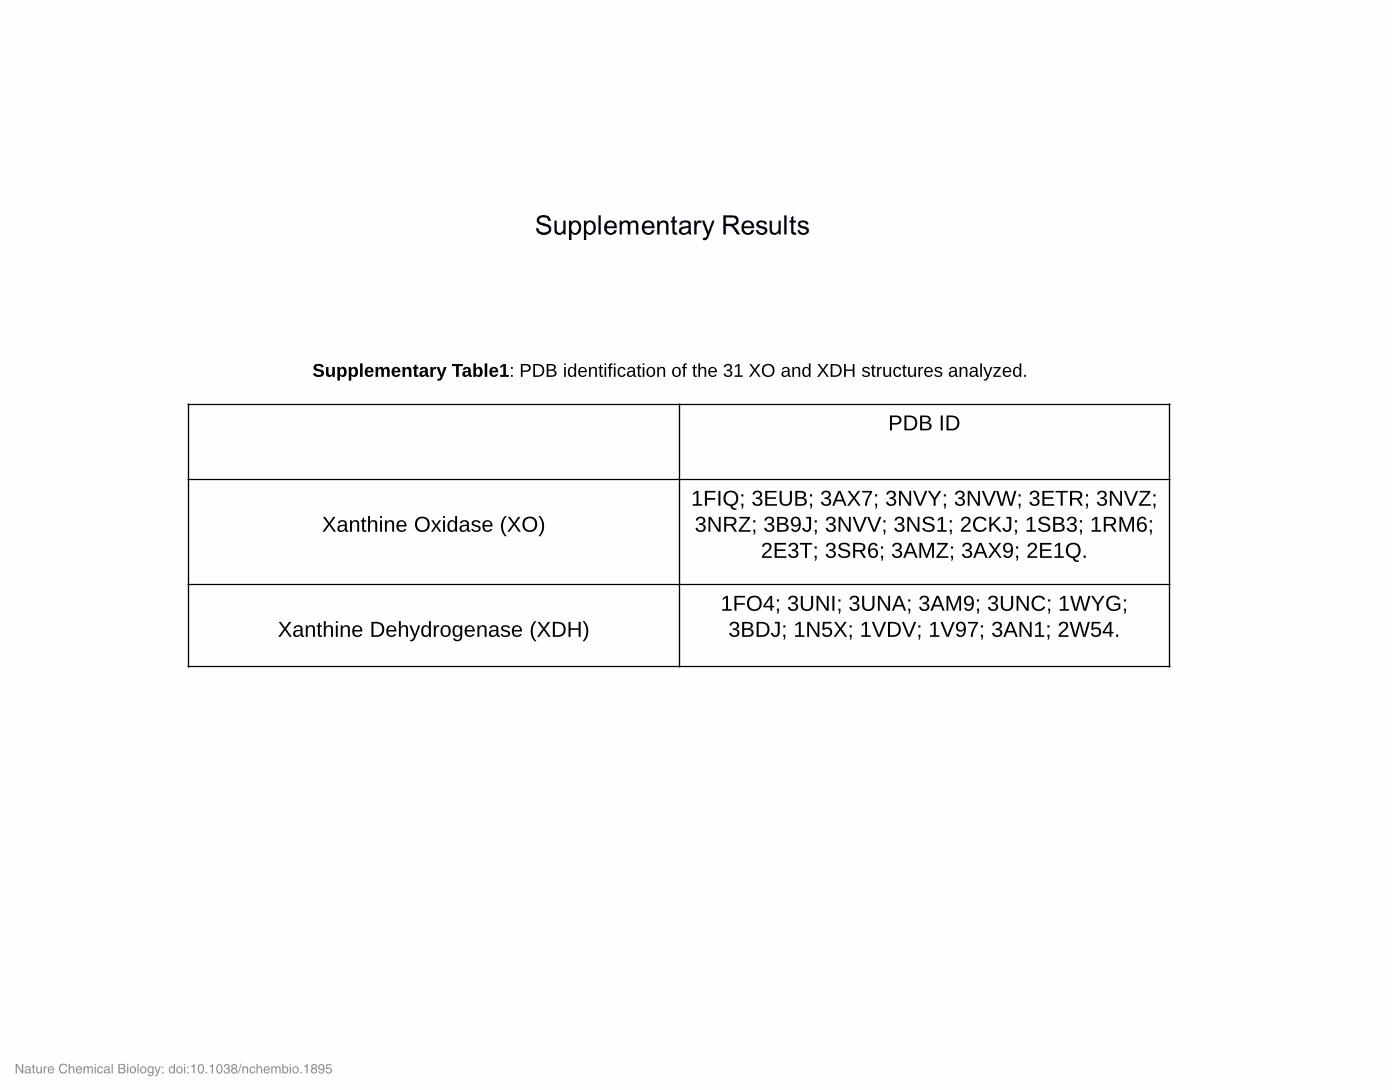
PDB ID
Xanthine Oxidase (XO)
1FIQ; 3EUB; 3AX7; 3NVY; 3NVW; 3ETR; 3NVZ;
3NRZ; 3B9J; 3NVV; 3NS1; 2CKJ; 1SB3; 1RM6;
2E3T; 3SR6; 3AMZ; 3AX9; 2E1Q.
Xanthine Dehydrogenase (XDH)
1FO4; 3UNI; 3UNA; 3AM9; 3UNC; 1WYG;
3BDJ; 1N5X; 1VDV; 1V97; 3AN1; 2W54.
Supplementary Table1: PDB identification of the 31 XO and XDH structures analyzed.
Nature Chemical Biology: doi:10.1038/nchembio.1895

hAOX1 hAOX1-Pht-Thi
Data collection
Space group P42212
Cell dimensions
a = b, c (Å) 148.90, 133.30 148.70, 132.80
Resolution (Å) 74.46-2.60 (2.69-
2.60)
49.58-2.70 (2.81-
2.70)
Rmerge 0.18 (2.73) 0.08 (1.08)
I / s(I) 11.20 (1.50) 22.20 (1.60)
Completeness (%) 100.00 (100.00) 99.80 (98.70)
Redundancy 16.10 (15.80) 12.00 (6.50)
Refinement
Resolution (Å) 2.60 2.70
No. reflections 46663 (4476) 41472 (4556)
Rwork / Rfree 18.8 / 23.3 19.7 / 24.4
No. atoms
Protein 10077 10089
Ligand/ion 14 74
Water 43 60
B-factors
Protein 47.39 53.14
Ligand/ion 50.42 85.58
Water 56.81 58.89
R.m.s. deviations
Bond lengths (Å) 0.008 0.007
Bond angles () 1.186 1.164
*Values in parentheses are for highest-resolution shell
Supplementary Table2: Data collection and refinement statistics
Nature Chemical Biology: doi:10.1038/nchembio.1895

I440
Q430
Q1235
T1230
FeSII
FAD Variable loop
hAOX1:430QAQRQENALAI440
mAOX3:430QAPRQQNAFAT440
bXO/bXDH:423QASRREDDIAK433bXO/bXDH:423**S*::::I*K433
Supplementary Figure1: Superposition of hAOX1 (4uhw, in blue), mAOX3 (3zyv, in gray), bXO (1fiq, in pink) and bXDH (1fo4, in orange) crystal
structures at the FAD binding site, viewed from the solvent. The FAD and the FeS II are represented color-coded and correspond to the hAOX1
crystal structure. Note the drastic change in the hAOX1 loop T1230-Q1235 (hAOX1 numbering) when comparing to mAOX3 and bXO/bXDH proteins.
FAD
Nature Chemical Biology: doi:10.1038/nchembio.1895

Thi-B
Thi-A
(R)-thioridazine
(S)-thioridazine
Supplementary Figure2: Bottom view of the surface representation of the hAOX1 homodimer highlighting the inhibitor thioridazine binding
pocket. Thioridazine is represented in space-filling-mode. At the bottom, the electron density of thioridazine is contoured at 1σ in the 2mFo–
DFc electron density map of the hAOX1 complex.
Nature Chemical Biology: doi:10.1038/nchembio.1895

S100B_Chl(3lk0)
MALT1_Thi(4i1r)
PrP_Chl(4ma8)
hAOX1_Ph_Thi(4uhx, this work)
Pim1_Thi(4iaa)
P450_Thi (substrate)(4wnw)
Supplementary Figure3: Structures of complexes with phenothiazine-related drugs, reported in the PDB (top to bottom, left to right):
Complexes with inhibitors: S100B-p53 31 with chlorpromazine (3lk0); caspase-IG3 (human MALT1 complexed with Thi, (4i1r)30, Ser/Thr
kinase Pim1 with thioridazine (4iaa), prion protein PrP with chlorpromazine (4ma8)26, hAOX1_Ph_Thi (4uhx, this work). Complex with
substrate: Cytochrome P450 with thioridazine 32 (4wnw).
Nature Chemical Biology: doi:10.1038/nchembio.1895
-0.05
0
0.05
0.1
0.15
-0.2 -0.15 -0.1 -0.05 0 0.05 0.1 0.15 0.2
1/V
1/[phthalazine] (μM -1)
b)
0
0.01
0.02
0.03
0.04
0.05
-20 -10 0 10 20
1/V
max
ap
p
[ thioridazine] μM
-0.03
0.02
0.07
0.12
0.17
-0.7 -0.2 0.3 0.8
1/V
1/[xanthine] (μM -1)
c)
0
0.005
0.01
0.015
0.02
0.025
0
0.02
0.04
0.06
0.08
0.1
0.12
0.14
-450 -350 -250 -150 -50 50
Inte
rce
pt
(1/V
max
)
[ thioridazine] μM
-0.2
-0.1
0
0.1
0.2
0.3
0.4
-0.4 -0.2 0 0.2 0.4 0.6 0.8 1
1/V
1/[phthalazine] (μM -1)
a)
0
0.01
0.02
-4 0 4 8 12 16 20
1/V
max
ap
p
[ thioridazine] μM
mAOX3 bXO
bXO:563:xxx*xx:*::* (…) :**:*::*::*:*K:::S::*
hAOX1:570IGPKQHPEDPIG (…) IQVVSRELRMPMSNVHLRGTS1076
mAOX3:570VDFQQPLQDPIG (…) IQVASRELKIPMSYIHLDEMS1072
bXO:563VPNGQSKEDTVG (…) VQVASKALKIPISKIYISETS1067
hAOX1
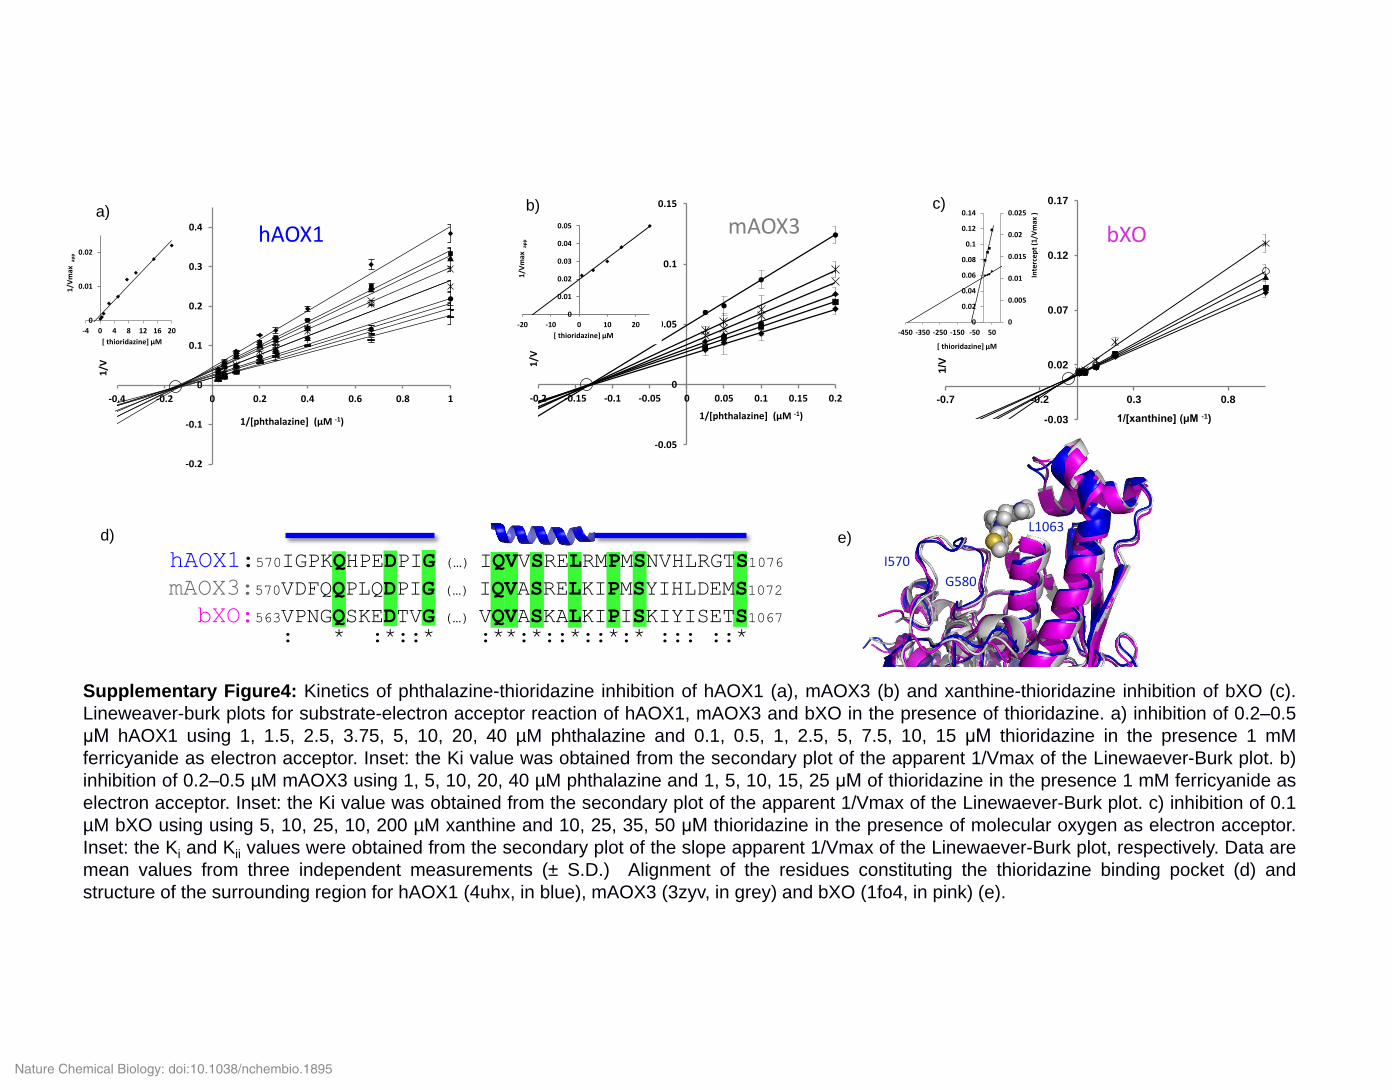
Supplementary Figure4: Kinetics of phthalazine-thioridazine inhibition of hAOX1 (a), mAOX3 (b) and xanthine-thioridazine inhibition of bXO (c).
Lineweaver-burk plots for substrate-electron acceptor reaction of hAOX1, mAOX3 and bXO in the presence of thioridazine. a) inhibition of 0.2–0.5
μM hAOX1 using 1, 1.5, 2.5, 3.75, 5, 10, 20, 40 µM phthalazine and 0.1, 0.5, 1, 2.5, 5, 7.5, 10, 15 μM thioridazine in the presence 1 mM
ferricyanide as electron acceptor. Inset: the Ki value was obtained from the secondary plot of the apparent 1/Vmax of the Linewaever-Burk plot. b)
inhibition of 0.2–0.5 µM mAOX3 using 1, 5, 10, 20, 40 µM phthalazine and 1, 5, 10, 15, 25 μM of thioridazine in the presence 1 mM ferricyanide as
electron acceptor. Inset: the Ki value was obtained from the secondary plot of the apparent 1/Vmax of the Linewaever-Burk plot. c) inhibition of 0.1
µM bXO using using 5, 10, 25, 10, 200 µM xanthine and 10, 25, 35, 50 μM thioridazine in the presence of molecular oxygen as electron acceptor.
Inset: the Ki and Kii values were obtained from the secondary plot of the slope apparent 1/Vmax of the Linewaever-Burk plot, respectively. Data are
mean values from three independent measurements (± S.D.) Alignment of the residues constituting the thioridazine binding pocket (d) and
structure of the surrounding region for hAOX1 (4uhx, in blue), mAOX3 (3zyv, in grey) and bXO (1fo4, in pink) (e).
d)
G580
I570
L1063e)
Nature Chemical Biology: doi:10.1038/nchembio.1895

hAOX1
mAOX1
mAOX3
mAOX2
mAOX4
hAOX1
mAOX1
mAOX3
mAOX2
mAOX4
hAOX1
mAOX1
mAOX3
mAOX2
mAOX4
hAOX1
mAOX1
mAOX3
mAOX2
mAOX4
hAOX1
mAOX1
mAOX3
mAOX2
mAOX4
hAOX1
mAOX1
mAOX3
mAOX2
mAOX4
hAOX1
mAOX1
mAOX3
mAOX2
mAOX4
hAOX1
mAOX1
mAOX3
mAOX2
mAOX4
hAOX1
mAOX1
mAOX3
mAOX2
mAOX4
hAOX1
mAOX1
mAOX3
mAOX2
mAOX4
GATE1
GATE2
600
l
620
l
640
l
660
l
700
l
720
l
740
l760
l
800
l820
l840
l
860
l
900
l
920
l
940
l960
l
1000
l
1020
l
1040
l1060
l
1100
l
1120
l
1140
l1160
l
1200
l
1220
l
1240
l1260
l
1300
l
1320
l
560
l
540
l
520
l
500
l
Supplementary Figure5: Comparison of
the amino acid sequence of human AOX1
and mouse AOX1, AOX3, AOX2 and AOX4
proteins. The hAOX1 Gate 1 and Gate 2
are highlighted in a red box and the
important active site residues are marked in
orange. The alignment was created with
using the clustalW2 server and represented
using the Jalview program.
Nature Chemical Biology: doi:10.1038/nchembio.1895