structural features of distributive trades and their impact on prices in
TRANSCRIPT

EURO
PEAN
CEN
TRAL
BAN
K
STRU
CTU
RAL
FEAT
URE
S O
F D
ISTR
IBU
TIVE
TRA
DES
SE
PTEM
BER
2011
STRUCTURAL FEATURES OF D I STR IBUT IVE TRADES AND THE IR IMPACT ON PR ICES IN THE EURO AREA
SEPTEMBER 2011
Structural Issues Report

STRUCTURAL FEATURES
OF DISTRIBUTIVE TRADES
AND THEIR IMPACT ON PRICES
IN THE EURO AREA
SEPTEMBER 2011
STRUCTURAL ISSUES REPORT
In 2011 all ECBpublications
feature a motiftaken from
the €100 banknote.

© European Central Bank, 2011
Address Kaiserstrasse 29
60311 Frankfurt am Main
Germany
Postal address Postfach 16 03 19
60066 Frankfurt am Main
Germany
Telephone +49 69 1344 0
Website http://www.ecb.europa.eu
Fax +49 69 1344 6000
All rights reserved. Any reproduction, publication or reprint in the form of a different publication, whether printed or produced electronically, in whole or in part, is permitted only with the explicit written authorisation of the ECB or the author(s).
ISBN 978-92-899-0820-7 (print)
ISBN 978-92-899-0821-4 (online)
3ECB
Structural features of distributive trades and their impact on prices in the euro area
September 2011
CONTENTS
EXECUTIVE SUMMARY 7
INTRODUCTION AND MOTIVATION 12
1 AN OVERVIEW OF THE DISTRIBUTIVE
TRADES: STRUCTURAL, REGULATORY
AND COMPETITION FEATURES 15
1.1 The importance, structure
and performance of the
distributive trades sector 15
1.1.1 Defi nitional issues 15
1.1.2 A closer look at the
grocery trade 17
1.1.3 Labour market
and productivity 34
1.1.4 Cost structure – the role of
product and channel 39
1.2 Regulation in the distributive
trades sector 40
1.3 Competition in the distributive
trades 43
1.3.1 Conceptual overview 44
1.3.2 Empirical measures
of competition using
national data 47
1.3.3 Empirical measures
of competition using
store-level data 50
2 THE IMPACT OF STRUCTURAL FEATURES
ON PRICE LEVELS, PRICE-SETTING
BEHAVIOUR, REGIONAL PRICE DYNAMICS
AND PASS-THROUGH 60
2.1 The impact of structural features
on price level differences 60
2.1.1 Introduction
and motivation 60
2.1.2 The degree of price
dispersion and convergence 61
2.1.3 Is there a “border effect”
on prices? 65
2.1.4 The impact of the structural
features of the distributive
trades sector 68
2.2 Competition, outlet type and the
frequency of price changes 71
2.3 Retail sector concentration
and price dynamics: a regional
level analysis 76
2.4 The retail trades
and pass-through 83
2.4.1 Pass-through into consumer
non-energy industrial
goods prices 84
2.4.2 Food price pass-through
and structural features
of the grocery market for
major euro area economies 92
ANNEXES 99
1 Additional country data
and background information 99
2 Additional technical
and background material 121
REFERENCES 131
LIST OF BOXES:
Online retail trade and the degree 1
of cross-border retail commerce 21
Implications of developments 2
in the retail trade structure
for infl ation measurement 27
Firm demographics, fi rm size and 3
performance analysis 32
Productivity in the euro area 4
and US distributive trades sectors 37
The distributive trades 5
in the new Member States 55
The impact of increased competition 6
in the distributive sector on employment
and output – a DSGE model analysis 81
Developments in clothing and footwear 7
prices 88
CONTENTS
4ECB
Structural features of distributive trades and their impact on prices in the euro area
September 2011
COUNTRIES
BE Belgium
DE Germany
EE Estonia
IE Ireland
GR Greece
ES Spain
FR France
IT Italy
CY Cyprus
LU Luxembourg
MT Malta
NL Netherlands
AT Austria
PT Portugal
SI Slovenia
SK Slovakia
FI Finland
ABBREVIATIONS AND GLOSSARY
OTHER
COGS cost of goods sold
COICOP Classifi cation of Individual Consumption According to Purpose
CPI Consumer Price Index
CRk k-fi rm concentration ratio
DSGE dynamic stochastic general equilibrium
ECB European Central Bank
EMU Economic and Monetary Union
EPL employment protection legislation
ESCB European System of Central Banks
EU European Union
FDI foreign direct investment
GDP gross domestic product
HHI Herfi ndahl-Hirschman Index
HICP Harmonised Index of Consumer Prices
ICT information and communication technology
IPN Infl ation Persistence Network
NACE statistical classifi cation of economic activities in the European Union
NCB national central bank
NUTS Nomenclature of Territorial Units for Statistics
OECD Organisation for Economic Co-operation and Development
PMR product market regulation
PPLD pseudo price level data
PPP purchasing power parity
RPLI relative price level index
SBS structural business statistics
TFP total factor productivity
VAT value added tax
WDN Wage Dynamics Network

5ECB
Structural features of distributive trades and their impact on prices in the euro area
September 2011
ABBREVIATIONS
AND
GLOSSARYGLOSSARY
Buying group: a group that uses the collective bargaining power of its members (fi rms and
entrepreneurs) to negotiate more competitive product prices.
Discounter: a retail entity that typically uses a relatively small sales area to offer a limited range of
products at a discounted price.
Hypermarket: a retail facility that combines a supermarket and a department store and usually has
a sales area of above 2,500m².
Non-fi nancial business sector: comprises the total economy, excluding the agriculture and fi shing,
fi nancial intermediation services and public services sectors.
Private label: the own company brand of a retailer (usually produced by an outside fi rm).
Quaranta table: a diagnostic tool for the checking and approval of purchasing power parity survey
results.

7ECB
Structural features of distributive trades and their impact on prices in the euro area
September 2011
EXECUTIVE
SUMMARYEXECUTIVE SUMMARY
The distributive trades sector, which is primarily
accounted for by wholesale and retail trade,
is not only economically important in its own
right, but also relevant to monetary policy.
Ultimately, it is retailers who set the actual
prices of most consumer goods. They are the
main interface between producers of consumer
goods and consumers, with around half of
private consumption accounted for by retail
trade. The “value added” of this intermediation
service can be substantial, as this accounts for,
on average, about 25% of consumer prices.
The purpose of this report is to analyse the
structural features of the distributive trades
sector and the developments within it, as well
as how these may infl uence prices and price
dynamics.
Several aspects are relevant. From a monetary
policy point of view, increasing the degree of
competition in the distributive trades sector
may have effects not only on price levels,
but also on price dynamics, via a reduction in
mark-ups, an increase in price fl exibility and a
greater and more rapid pass-through of changes
in costs to prices. Structural developments,
such as the increasing market penetration of
hard discounters, online trade and private label
brands, the role of buying groups and the relative
bargaining power between producers and
retailers are of great importance to consumers
and price determination. In addition, these
may have implications for the measurement of
consumer prices and infl ation. More generally,
the distributive trades sector plays an important
role in determining cross-country differentials
in productivity growth, both within and outside
Europe: the sector has accounted for over
one-third of the widening gap in aggregate
productivity between the euro area and the
United States since the mid-1990s.
A specifi c contribution of this report is the use
of a wide range of data sources,1 including a
unique dataset on the location of over 100,000
individual grocery stores across most of the euro
area, to investigate how to better measure the
degree of competition and concentration in this
sector, and to compare sector developments
from a national, regional and local perspective.
AN OVERVIEW OF THE DISTRIBUTIVE
TRADES SECTOR
The distributive trades sector covers three broad
sub-sectors: motor, wholesale and retail trade.
This report primarily focuses on wholesale and
retail trade. In general, wholesalers intermediate
between fi rms, whereas retailers intermediate
between fi rms and consumers. Depending on
which measure is considered, the distributive
trades account for a varying proportion of the
non-fi nancial business sector: around one-third
in terms of total turnover, number of fi rms and
self-employment and around 15% to 25% in
terms of other measures, such as value added
and overall employment. Although by some
measures (most notably value added) the
wholesale trade sub-sector is larger than the retail
trade sub-sector, this report focuses on the latter
owing to the fact that it is closer to consumers
and consumer prices; retail trade is also more
important with regard to direct employment.
The distributive trades in general, and retail trade
in particular, have a number of distinguishing
features in relation to the rest of the non-fi nancial
business sector. They are generally more labour-
intensive and have more lower-skilled workers
on average. Profi t margins in both retail and
wholesale trade are below average, but this
may simply refl ect a high degree of turnover
(per unit of capital employed) rather than strong
competitive pressures.
The retail trade sub-sector also displays
signifi cant diversity across both euro area
In particular, it utilises: (i) time series provided by national 1
statistical institutes on regional consumer price indices broken
down across a number of product groups, as well as information
from private databases (such as store location data from Nielsen
and retailing and consumer goods-related modules from
Euromonitor Passport); (ii) detailed data and the “Quaranta
tables” from Eurostat’s PPP database; (iii) individual price
and survey data collected under both the Infl ation Persistence
Network and Wage Dynamics Network of the Eurosystem; and
(iv) country-specifi c information provided by ESCB staff, which
is used to construct a new indicator of the degree of regulation on
shop opening times.
8ECB
Structural features of distributive trades and their impact on prices in the euro area
September 2011
countries and segments. Substantial price
differences exist between branded and private
label goods and also across store types. The
rapid growth of discounters, of private label
brands and of online trade, clearly visible to
consumers, has had a noteworthy impact, but this
has been of varying importance across countries.
Buying groups affecting the bargaining power
between producers and retailers, although less
well-known to consumers, are also important in
price-setting.
The acquisition cost of goods sold represents the
single biggest cost incurred by the distributive
trades sector, albeit with some notable variation
in magnitude across sectors. In terms of
importance, this is generally followed by labour
costs. The cost structure, as a whole, plays a
signifi cant role in explaining price-setting, and
analysing this can help explain differences in
the rate of pass-through of costs across sectors.
More generally, differences in cost structures
and the resulting profi t margins across countries
for given segments may be indicative of
differing degrees of competition.
As regards the labour market, the distributive
trades sector accounts for a high percentage of
self-employed and part-time workers, as well as
young and female workers. On average, these
account for a high proportion of low-skilled,
low-productivity and, consequently, low-paid
labour. They also account for a signifi cant
proportion of the new jobs created over the
last 15 years. Much of the growth in turnover
and employment within the sector has come
from larger fi rms, refl ecting the fact that this
historically fragmented sector is gradually
consolidating.
Although the report focuses on the distributive
trades sector in euro area countries, it also
considers developments in this sector in some of
the EU’s newer Member States. Many large euro
area retailers have invested substantially in the new
Member States and have undoubtedly contributed
strongly to the modernisation, expansion and
productivity of the distributive trades here.
Nonetheless, notwithstanding the substantial
changes and convergence that have already
occurred, there remains some heterogeneity, both
with regard to the euro area countries and within
the new Member States themselves.
MEASURING REGULATION AND COMPETITION
IN THE DISTRIBUTIVE TRADES SECTOR
Regulation and competition in the distributive
trades sector are key issues and are discussed
in some detail within this report. As regards
regulatory issues, there are a large number
of areas of activity that are subject to specifi c
regulations in the sector, covering issues as
diverse as the setting-up of establishments,
contractual relationships with suppliers, opening
hours, price controls, promotions and sale
conditions, and waste and recycling. These
vary substantially across countries and regions,
as well as in terms of products and store
type/size. An appropriate degree of regulation
is a necessary feature of a market economy;
however, excessive or badly designed regulation
can hinder competition and favour incumbents.
In addition, general planning regulations have
often been cited by competition authorities as
playing an important role in creating barriers
to entry or expansion in the distributive
trades. Fragmented national, regional and
local commercial planning frameworks, in
conjunction with different rules on property
and land ownership, are factors likely to
dissuade entrepreneurs and fi rms from entering
certain markets. These regulations may also
have unintended consequences. Indeed, some
commentators partly attribute the growth
of discounters to planning restrictions,
as discounters frequently fall below specifi ed
size thresholds subject to additional restrictions.
While they may facilitate cross-country
comparisons, summary measures of product
market regulation need to be interpreted with
caution and should not be taken at face value.
In this report, a new indicator of shop opening
time restrictions is developed using detailed
country-level information, which allows for
a more nuanced and differentiated view on
9ECB
Structural features of distributive trades and their impact on prices in the euro area
September 2011
EXECUTIVE
SUMMARYthis issue. More generally, while there is clear
evidence of an easing in the degree of product
market regulation in the distributive trades
sector across almost all countries, there remains
considerable scope for further progress.
Regulatory differences across countries may
also impede online commerce in general and
cross-border e-commerce in particular. The
strong growth, but relatively low market share,
of domestic online commerce and the importance
of physical cross-border retail shopping in many
parts of the euro area illustrate the potential for
cross-border e-commerce. This is all the more
so in view of the evidence that online prices
can differ signifi cantly across countries and
that consumer choice is often restricted because
domestic online suppliers only offer a limited
range of products.
Measuring effective competition in the
distributive trades sector is particularly diffi cult.
This report tries to improve our understanding
in this area. It considers a number of
different indicators (concentration, profi tability,
pass-through) at different levels of spatial (local,
regional and national) and organisational (store,
parent company and buying group) aggregation,
as well as both upstream (producer-related)
and downstream (consumer-related) aspects.
These can provide differing messages. At the
national level, a number of key results are
found. A general fi nding is that concentration is
relatively low at the national level in southern
European countries owing to the persistence of
a more traditional retail structure. The degree
of concentration also varies substantially
across the retail sub-sector, being highest for
electronics and appliances and grocery retailing.
Over time, a slight upward drift in concentration
has been observed for most retail segments,
refl ecting the ongoing consolidation in
European retail trade. Lastly, there tends to be a
positive correlation between concentration and
profi tability measures, possibly partly related to
effi ciency gains.
Regional and local measures of competition are
also constructed by using a unique dataset on
the location of over 100,000 individual grocery
stores spread across the euro area. As regards
which level is “best”, this may depend on the
perspective involved. For example, for large
producers, competition might be best considered
at the national or supranational level. For food
and grocery producers, competition might be
primarily regional, whereas, for consumers,
it might be local. Considering fi rst the results for
the downstream (consumer) market, while there
are some similarities with the results obtained
when using national data, there are also some
noteworthy differences: some markets that
appeared to be relatively fragmented at the
national level actually turned out to be quite
concentrated at the local level and vice versa.
As for the upstream market, concentration
measures using buying group information
generally provide a relatively similar picture
to store-level measures, albeit with certain
differences. Overall, the key message is that
measuring the degree of competition in retail
trade is not a straightforward matter; this is an
issue that should be carefully considered along a
number of different dimensions.
THE ROLE OF THE STRUCTURAL FEATURES OF THE
DISTRIBUTIVE TRADES SECTOR IN EXPLAINING
DIFFERENCES IN PRICE LEVELS AND DYNAMICS
Given that the intermediation services provided
by the distributive trades sector account
for a large part of consumer prices and that
distributive services are not generally traded
internationally, this report considers to what
extent the structural aspects of the retail sub-
sector, combined with other indicators, help
to explain differences in price levels, price
dynamics and convergence. The main fi ndings
are as follows.
There remains a 1) considerable degree of price dispersion across the euro area; this is
lower on average for goods than for services,
but it is still sizeable in most cases – tending
to be lower for electronics and for clothing
and footwear and higher for food products.
The evidence points to a limited degree of
price convergence that appears to come to a
halt around the period 2004 to 2006. There is
10ECB
Structural features of distributive trades and their impact on prices in the euro area
September 2011
also compelling evidence of a strong “border
effect” on price differentials across euro
area countries, which suggests ample scope
for further improving the Single Market.
The structural and regulatory features of
the distributive trades sector appear to help
explain differences in price levels across
countries.
Using information drawn from the Infl ation 2)
Persistence Network and the Wage Dynamics
Network of the Eurosystem, the report
considers price-setting behaviour. It fi nds that
higher competition is associated with more frequent price changes in the retail sub-sector.
Another fi nding is that price changes are more
frequent in supermarkets and hypermarkets,
though not larger in average magnitude.
These results hold across countries and
product types.
Using a combination of two unique datasets, 3)
the report examines the relationship between
price dynamics at the regional level and
competition (measured at different levels of
organisational and spatial aggregation and
across a number of product groups). It fi nds
that higher market concentration has, in recent times, been associated with higher price growth for food and drink products.
The interpretation of this correlation calls
for further research, but it does appear to
be robust and to hold across individual
countries.
This report also considers the magnitude and 4)
speed of cost pass-through. As a stylised
fact, producer prices show a stronger and faster reaction to cost shocks than consumer prices. However, there is large dispersion in
respect of the transmission of costs to prices
across countries and sectors. The degree of
competition appears to be positively related
to the long-run pass-through of import
prices to consumer prices. As regards food
prices, a more pronounced presence of
discounters seems to be associated with
a higher pass-through. In the clothing
segment, changes in import prices are not
fully transmitted to consumer prices.
CONCLUSIONS AND POLICY IMPLICATIONS
This report contributes to a better 1)
understanding of the impact of the structural
features of the distributive trades sector on
prices and price-setting behaviour, thereby
improving on previous research in this area.
From a policy perspective, it highlights the
importance of structural reforms that help
enhance competition in this sector.
The fi ndings regarding the impact of 2)
structural features on price-setting behaviour
and on price level differences across euro
area countries suggest that further progress
in improving effective competition in the
distributive trades sector could help reduce
border effects, narrow price differentials,
strengthen the Single Market and enhance
the effectiveness of monetary policy.
As concerns product market regulation, 3)
although there is evidence of an easing in the
degree of regulation impacting the distributive
trades sector across almost all euro area
countries, there remains considerable scope
for further progress. However, the indicators
available for this analysis may only capture
some aspects of regulation.
With regard to labour markets, the 4)
distributive trades sector has the potential
to be a major contributor to job growth,
particularly for specifi c groups of the labour
force, such as the low-skilled. Given the
“Europe 2020” growth strategy of the EU,
and in view of the high unemployment
rates arising from the crisis, this would be
an important point to consider. However,
sector-specifi c product market and more
general labour market structural rigidities
may impede productivity growth and job
creation in this sector.
11ECB
Structural features of distributive trades and their impact on prices in the euro area
September 2011
EXECUTIVE
SUMMARYAll in all, a crucial step towards further 5)
progress would be the full implementation of
the Services Directive. The benefi ts arising
from further liberalisation and harmonisation
of market conditions may be seen, in part,
from the report’s fi nding that higher product
market regulation is associated with higher
price levels. Moreover, structural reforms
in the distributive trades sector could
reduce mark-ups and give rise to substantial
increases in both output and real wages.
In order to unleash the full potential and
benefi ts of online and cross-border trade,
remaining regulatory and legislative barriers
(such as consumer law and VAT-related
issues) need to be addressed. This could also
contribute signifi cantly to improving the
functioning of the Single Market.
The implications of ongoing developments 6)
in the distributive trades sector for the
measurement of price levels and price
changes should also be considered by the
relevant bodies to avoid the emergence
of biases in measures of consumer price
infl ation. Relevant issues here would be the
analysis of alternative methods to consider
new outlets and new product characteristics
and prices, as well as how, and when, to
introduce them into the HICP basket (e.g. via
hedonic regressions or consumer surveys),
and the need to ensure that samples are
regularly updated and remain representative.
This report uses a wide range of data sources – 7)
some of which are unique – to study an area
that has been under-investigated, especially at
the European level. There is, however, ample
room for further research in this direction.
In particular, it is important to gain further
insight into how competition impacts retail
price levels at a more disaggregated level
(i.e. at the local or regional level rather than
at just the national level). In this regard, the
collection of more price level data at a highly
disaggregated level (e.g. across store types,
regions, etc.) would be particularly useful.
12ECB
Structural features of distributive trades and their impact on prices in the euro area
September 2011
INTRODUCTION AND MOTIVATION
The distributive trades, consisting of
wholesaling and retailing, are a key sector of
the economy. As the main interface between
producers and consumers, the sector is
particularly important from a monetary policy
point of view: this is where most consumer
goods prices are ultimately set. Despite almost
20 years of the Single Market, mark-ups in the
distributive trades sector can still be substantial
and differ considerably across countries,
while cross-border trade remains limited. This
report examines the structural features of the
distributive trades sector which are likely to
play an important role in determining price level
and infl ation differences across countries.
Given its key role in the economy, the
distributive trades sector has been studied
extensively by policy-makers, though generally
from a different perspective. The European
Commission recently published the results of its
market monitoring exercise, which covers a
wide range of issues affecting the retail trades,
such as consumer accessibility, relationships
with upstream producers, labour markets,
logistics and information and communication
technology (ICT), as well as energy use.2
Many national competition authorities have also
conducted comprehensive reviews of the
distributive trades sector in their countries –
for example, those of Ireland and the
United Kingdom.3 These reports illustrate the
challenging issues involved and the complex
interaction between upstream agents (producers
and wholesalers) and downstream agents
(retailers), as well as the importance of the
regulatory environment in supporting
competition in this sector.4 However, there is
relatively little research investigating the impact
of the structural features of the distributive
trades on prices and price-setting behaviour.
The objective of this report is to shed light on
these aspects by examining: (a) the main features
of, and issues relating to, the euro area
distributive trades sector from a monetary policy
perspective; and (b) the impact of these features
on price levels and infl ation behaviour.
The distributive trades sector has been
undergoing substantial changes, in terms
of, for example, growing consolidation and
internationalisation and changing retail
formats (e.g. the increasing market shares of
supermarkets and hypermarkets, the growth of
the discount sector and the expansion of private
label brands). These developments infl uence
competition and cost structure and play an
important role in determining mark-ups and,
thus, affect fi nal consumer prices in the euro
area. As regards labour market issues, this sector
has contributed signifi cantly to the improvement
in employment growth experienced by the
euro area during the past decade. However,
productivity is comparatively low and the sector
accounts for more than one-third of the widening
The European Commission’s Directorate-General for Health 2
and Consumer Policy also regularly studies the retail markets
in its Consumer Markets Scoreboard (CMS), focusing on the
integration of the retail internal market, particularly from the
consumer perspective. To date, fi ve editions of the CMS have
been published (European Commission, (2011b), (2010c),
(2010b), (2009) and (2008)). Each of these considers the general
progress made in the integration of the retail internal market as
well as specifi c topics. For example, the third and fi fth editions of
the CMS consider cross-border and online consumer purchases.
Both of these issues are discussed in Box 1 of this report.
In 2006, the UK Competition Commission (UKCC) initiated, 3
at the request of the country’s Offi ce of Fair Trading (OFT),
a comprehensive two-year study into the supply of groceries by
retailers in the United Kingdom. This is because the OFT believed
there were “reasonable grounds for suspecting that a feature…of the market…prevents, restricts or distorts competition”. The fi nal
report (UKCC, (2008)) concluded as follows: “…in many important respects, competition in the UK groceries industry is effective and delivers good outcomes for consumers, but not all is well. We have concerns in two principal areas. First, we found that several grocery retailers have strong positions in a number of local markets. Second, we found that the transfer of excessive risk and unexpected costs by grocery retailers to their suppliers through various supply chain practices…”. The Competition
Authority of Ireland has, in recent years, undertaken two studies
related to the distributive trades sector: the fi rst study – the
“Grocery Monitor Project” – was initiated following the abolition
of the Groceries Order in March 2006 to assess how the grocery
retail and wholesale trade in Ireland had responded to the new
legislative environment; the second – “Retail-related Import and
Distribution Study” – was published in 2009.
One key fi nding from the Irish study was that the retail planning 4
system made it diffi cult for new retailers to enter the Irish grocery
market and for existing retailers to expand their operations. A
similar conclusion was drawn by the French competition authority
(Autorité de la concurrence) in 2007, prompting a reform of the
authorisation procedure for large outlets in France a year later. In
February 2011 Germany’s federal cartel offi ce (Bundeskartellamt)
announced an investigation into the relationship between leading
grocery retailers and their suppliers.
13ECB
Structural features of distributive trades and their impact on prices in the euro area
September 2011
INTRODUCTION AND
MOTIVATIONin the aggregate productivity gap between the
United States and the euro area that has occurred
since the mid-1990s. These issues are presented
in more detail in Section 1.1 of the report.
As described in Section 1.2, regulation plays
a fundamental role in the distributive trades
sector, particularly in terms of barriers to
entry, operating restrictions and price controls.
Although regulation varies primarily at the
national level, in some countries, there is also
an important regional element, which may help
disentangle the effects of regulation from other
economy-wide factors. Section 1.3 considers
the empirical measurement of competition,
which is often assessed in terms of the degree
of concentration within a sector. However, the
relationship between concentration and price
levels and sector dynamics is ambiguous.
Regarding price levels, the presence of
economies of scale or scope can have a potential
downward impact on prices stemming from
large, effi cient players. But this effect has to be
assessed against the potential upward impact
from reduced competition. Other things being
equal, increased competition should improve
effi ciency and reduce mark-ups, and thereby
lead to lower prices. However, increased
competition may also give rise to ongoing
dynamic effects via higher productivity levels
and growth, which can result in lower infl ation
as well as lower price levels.
Having set the scene, the second part of the
report considers the impact of the structural
features of the distributive trades sector on
price level differences, price-setting behaviour,
regional price change dynamics and the
pass-through of costs. These are discussed in
Sections 2.1, 2.2, 2.3 and 2.4 respectively. The
signifi cance of the regulatory and structural
features of the distributive trades for price level
differences is underlined in Section 2.1, which
also investigates the “border effect” on price
differentials. Section 2.2 considers the impact
of store formats on price-setting and examines
the extent to which structural differences
and competition infl uence the frequency of
price changes. However, competition in the
distributive trades sector must also be considered
from a number of different perspectives – most
importantly, spatially (in terms of local, regional,
national or supranational markets) and from the
position of upstream and downstream agents
(although consumers interact with retailers at
the individual store level, producers usually
interact with retailers at the parent company or
even buying group level). Hence, Section 2.3
considers regional price dynamics and the extent
to which these are infl uenced by the measures
of concentration calculated at the regional and
local level in Section 1.3.
The link between competition and the degree of
cost pass-through is, to some extent, ambiguous.
In the (theoretical) case of perfect competition,
retailers have no option but to fully pass through
increases in upstream producer prices, as they
have no excess profi ts that can be used as a
buffer. In the case of imperfect competition,
where many competing producers sell products
that are differentiated from one another,
the degree of pass-through will depend on many
factors and the link between competition and
the extent of pass-through may be less clear.
The relationship between the structural aspects
of the distributive trades sector and the degree
of pass-through is considered in more detail in
Section 2.4. An empirical analysis is undertaken
for consumer goods in general, and for prices of
food and clothing and footwear in particular.
This report uses a wide range of data sources
and some unique datasets. More specifi cally, it
utilises: (i) detailed data and the “Quaranta
tables” from Eurostat’s purchasing power parity
(PPP) database to study the impact of
competition and regulation in the distributive
trades sector on price level differences across
countries; (ii) individual price and survey data
collected under the Eurosystem’s Infl ation
Persistence Network (IPN) and Wage Dynamics
Network (WDN) to consider the impact of
competition and the structural features of the
distributive trades sector on price-setting
behaviour; (iii) country-specifi c information
14ECB
Structural features of distributive trades and their impact on prices in the euro area
September 2011
provided by ESCB staff 5 to construct a new and
more refi ned indicator of the extent of regulation
on shop opening times; (iv) time series provided
by national statistical institutes on regional
consumer price dynamics (broken down across
a number of product groups), which are
combined with a unique “census-type” database
on grocery store locations. For a complete
overview of the main data sources used in this
report, see Table A19 in the Appendix.
Given the original and challenging nature of
much of the analysis contained in this report,
the fi ndings and conclusions in some areas must
be considered as preliminary. Nonetheless,
the research highlights the fact that the structural
features of the distributive trades sector, as well
as the degree of competition within it, are of
importance to monetary policy-makers whose
primary aim is to maintain price stability.
These staff are members of the Monetary Policy Committee task 5
force that was responsible for drafting this report.
15ECB
Structural features of distributive trades and their impact on prices in the euro area
September 2011
I AN OVERVIEW
OF THE DISTRIBUTIVE
TRADES: STRUCTURAL,
REGULATORY AND
COMPETITION FEATURES
1 AN OVERVIEW OF THE DISTRIBUTIVE
TRADES: STRUCTURAL, REGULATORY
AND COMPETITION FEATURES
This chapter provides an overview of the distributive trades sector in the euro area in order to give an insight into the key features of the sector that will underpin the analysis in Chapter 2.
1.1 THE IMPORTANCE, STRUCTURE
AND PERFORMANCE OF THE DISTRIBUTIVE
TRADES SECTOR
This section considers the macroeconomic importance and structure of the distributive trades, including their economic evolution, cost structures and labour market features.
The main fi ndings are that the distributive trades are of key importance in the macroeconomy, both directly and – functioning as intermediaries between producers and consumers – indirectly. They have a number of distinguishing features, generally being more labour-intensive and employing more lower-skilled workers. While profi t margins are below average, this may refl ect a high degree of turnover (per unit of capital employed) rather than strong competitive pressures. The retail trade sub-sector displays signifi cant diversity across both euro area countries and segments. Key issues are the growing internationalisation of retail trade along with the growth of discounters, of private label brands and of online trade.
1.1.1 DEFINITIONAL ISSUES
The distributive trades function as
“intermediaries” between economic agents that
are upstream (e.g. producers) and those that
are downstream (e.g. consumers). While they
generally do not produce goods themselves
(although that is changing 6), they clearly provide
a necessary economic service.
The distributive trades sector covers three
broad areas: motor, wholesale and retail trade.7
The motor trade is considered to be a separate
sub-sector with quite different characteristics,
partly because of the close link between the
companies in this fi eld and the automotive
industry.8 Wholesale trade companies generally
do not sell directly to consumers, but rather to
businesses and retailers. Retailers generally
sell directly to consumers, but not necessarily
exclusively so. As will be highlighted below,
wholesale and retail trade are by far the largest
sub-sectors within the distributive trades sector.
As a result, and given the specifi c nature of
the motor trade sub-sector, this report focuses
primarily on wholesale and retail trade.9
ECONOMIC IMPORTANCE OF THE DISTRIBUTIVE
TRADES
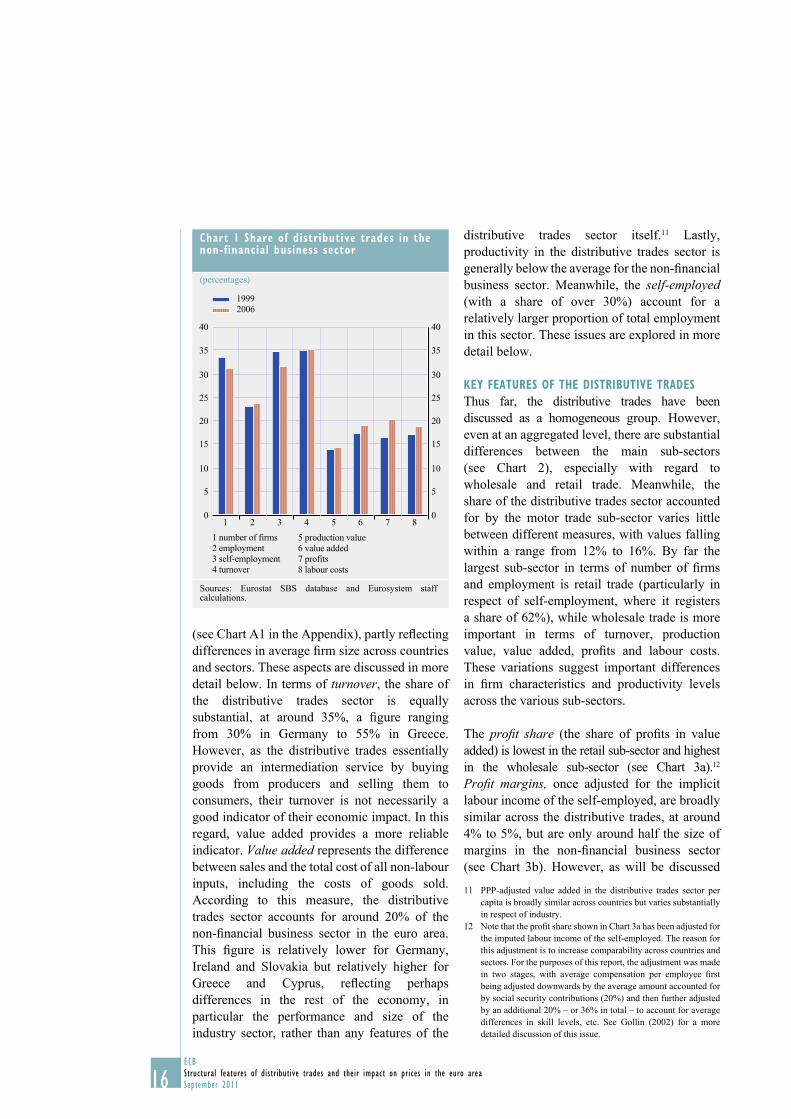
In the euro area as a whole, the distributive
trades sector accounts for approximately 33% of
fi rms in the non-fi nancial business sector
(see Chart 1).10 This is a fi gure that ranges from
around 25% in Germany to 40% in Slovakia
For example, with the increasing importance of private or own-6
label brands and with companies in the clothing and footwear
segment both producing and selling clothing.
Table A20 in the Appendix shows the breakdown and 7
composition of the distributive trades sector according
to the NACE Rev. 2 system used by EU institutions for
classifying economic activities, which was adopted in 2006
for implementation from 2008 onwards. For reasons of data
availability, the previous classifi cation system, NACE Rev. 1.1,
is largely used in this report. This is broadly similar to NACE
Rev. 2, but there are certain differences.
For a more detailed overview of the automotive sector, see the 8
website of the European Commission’s Directorate-General for
Competition (http://ec.europa.eu/competition/sectors/motor_
vehicles/overview_en.html).
This section primarily uses data from Eurostat’s Structural 9
Business Statistics (SBS) dataset; for an overview of the main
datasets used in this report, see Table A19. SBS data are used
owing to the rich level of disaggregation at which these data
are available, plus the fact that there is a separate module with
specifi c information on the features of the distributive trades.
However, it may also be the case that for some countries, owing
to changes in methodology, comparisons over long periods of
time should be made with caution. For example, as regards the
SBS data for Portugal, a gap exists for the period prior to 2004,
as the national statistical authority only had access to
administrative data from that year onwards. Hence, any
comparisons related to the pre-2004 period should be made with
care.
The non-fi nancial business sector is comprised of the total economy, 10
excluding the agriculture and fi shing, fi nancial intermediation
services and public services sectors. It includes the mining and
quarrying, manufacturing, utilities, construction, distributive trades,
hotels and restaurants, transport, storage and communication,
and real estate, renting and business activities sectors.
16ECB
Structural features of distributive trades and their impact on prices in the euro area
September 2011
(see Chart A1 in the Appendix), partly refl ecting
differences in average fi rm size across countries
and sectors. These aspects are discussed in more
detail below. In terms of turnover, the share of
the distributive trades sector is equally
substantial, at around 35%, a fi gure ranging
from 30% in Germany to 55% in Greece.
However, as the distributive trades essentially
provide an intermediation service by buying
goods from producers and selling them to
consumers, their turnover is not necessarily a
good indicator of their economic impact. In this
regard, value added provides a more reliable
indicator. Value added represents the difference
between sales and the total cost of all non-labour
inputs, including the costs of goods sold.
According to this measure, the distributive
trades sector accounts for around 20% of the
non-fi nancial business sector in the euro area.
This fi gure is relatively lower for Germany,
Ireland and Slovakia but relatively higher for
Greece and Cyprus, refl ecting perhaps
differences in the rest of the economy, in
particular the performance and size of the
industry sector, rather than any features of the
distributive trades sector itself.11 Lastly,
productivity in the distributive trades sector is
generally below the average for the non-fi nancial
business sector. Meanwhile, the self-employed (with a share of over 30%) account for a
relatively larger proportion of total employment
in this sector. These issues are explored in more
detail below.
KEY FEATURES OF THE DISTRIBUTIVE TRADES
Thus far, the distributive trades have been
discussed as a homogeneous group. However,
even at an aggregated level, there are substantial
differences between the main sub-sectors
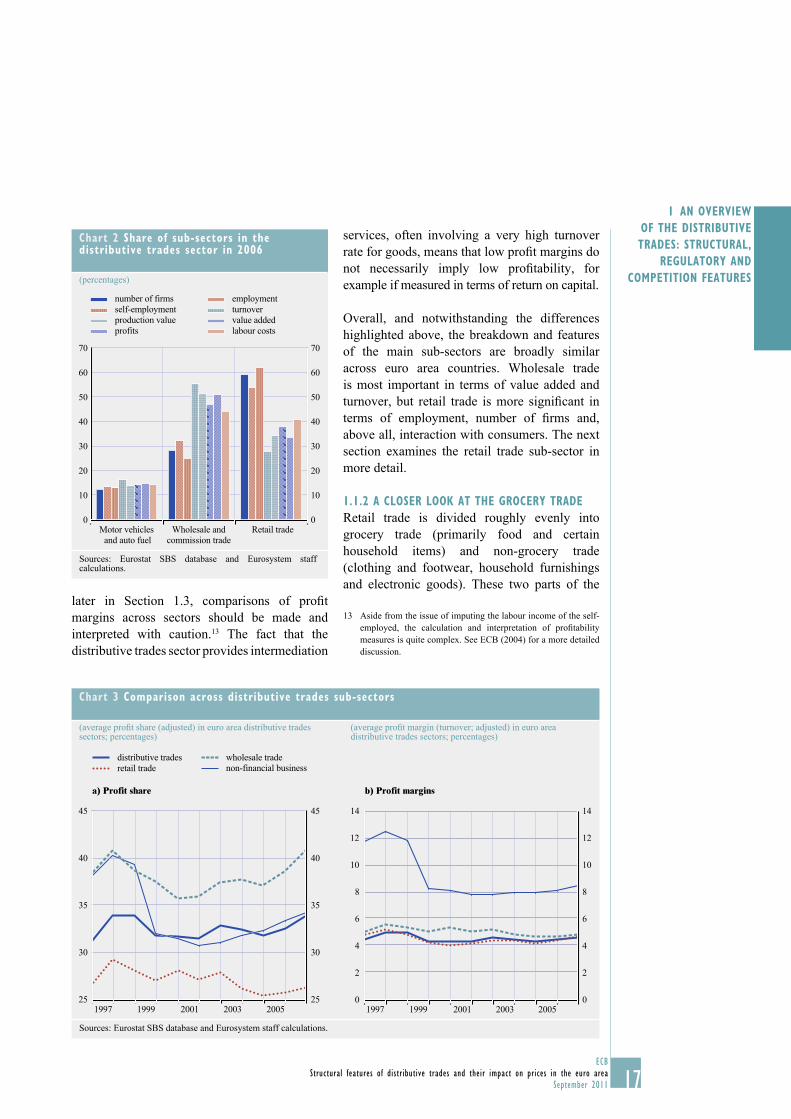
(see Chart 2), especially with regard to
wholesale and retail trade. Meanwhile, the
share of the distributive trades sector accounted
for by the motor trade sub-sector varies little
between different measures, with values falling
within a range from 12% to 16%. By far the
largest sub-sector in terms of number of fi rms
and employment is retail trade (particularly in
respect of self-employment, where it registers
a share of 62%), while wholesale trade is more
important in terms of turnover, production
value, value added, profi ts and labour costs.
These variations suggest important differences
in fi rm characteristics and productivity levels
across the various sub-sectors.
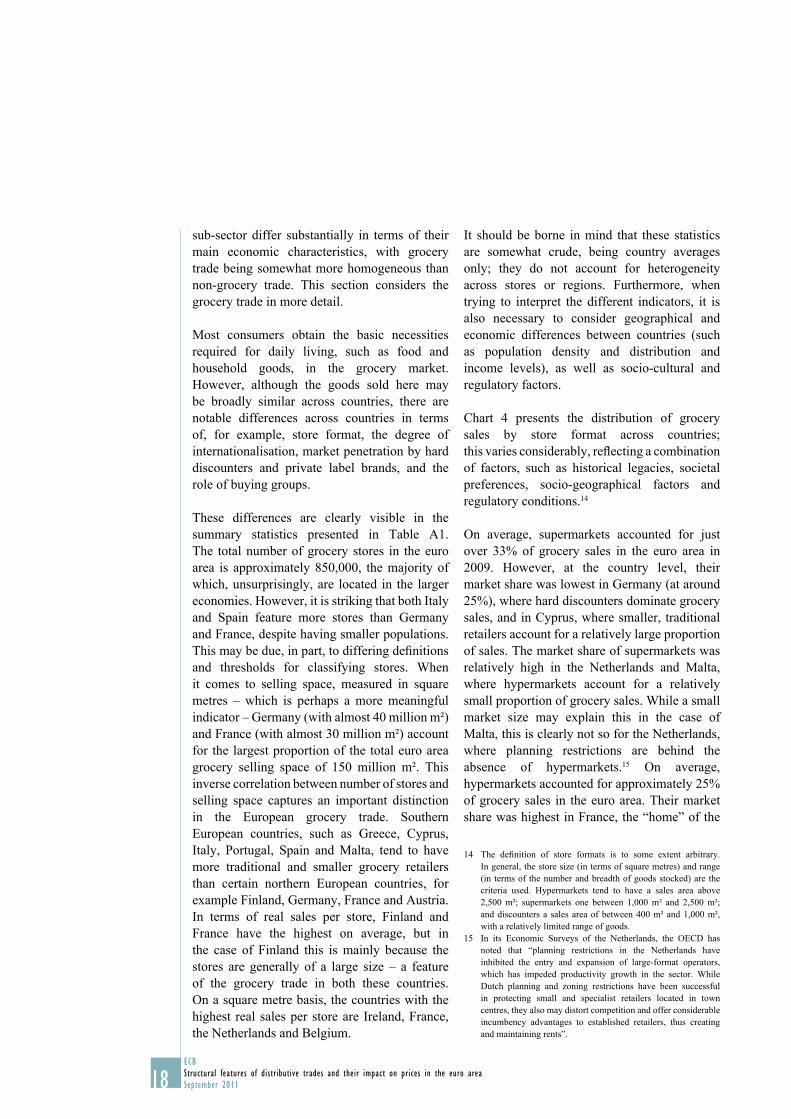
The profi t share (the share of profi ts in value
added) is lowest in the retail sub-sector and highest
in the wholesale sub-sector (see Chart 3a).12
Profi t margins, once adjusted for the implicit
labour income of the self-employed, are broadly
similar across the distributive trades, at around
4% to 5%, but are only around half the size of
margins in the non-fi nancial business sector
(see Chart 3b). However, as will be discussed
PPP-adjusted value added in the distributive trades sector per 11
capita is broadly similar across countries but varies substantially
in respect of industry.
Note that the profi t share shown in Chart 3a has been adjusted for 12
the imputed labour income of the self-employed. The reason for
this adjustment is to increase comparability across countries and
sectors. For the purposes of this report, the adjustment was made
in two stages, with average compensation per employee fi rst
being adjusted downwards by the average amount accounted for
by social security contributions (20%) and then further adjusted
by an additional 20% – or 36% in total – to account for average
differences in skill levels, etc. See Gollin (2002) for a more
detailed discussion of this issue.
Chart 1 Share of distributive trades in the non-financial business sector
(percentages)
0
5
10
15
20
25
30
35
40
0
5
10
15
20
25
30
35
40
1999
2006
2 employment
3 self-employment
4 turnover
1 number of firms
1 2 3 4 5 6 7 8
5 production value
6 value added
7 profits
8 labour costs
Sources: Eurostat SBS database and Eurosystem staff calculations.
17ECB
Structural features of distributive trades and their impact on prices in the euro area
September 2011
I AN OVERVIEW
OF THE DISTRIBUTIVE
TRADES: STRUCTURAL,
REGULATORY AND
COMPETITION FEATURES
later in Section 1.3, comparisons of profi t
margins across sectors should be made and
interpreted with caution.13 The fact that the
distributive trades sector provides intermediation
services, often involving a very high turnover
rate for goods, means that low profi t margins do
not necessarily imply low profi tability, for
example if measured in terms of return on capital.
Overall, and notwithstanding the differences
highlighted above, the breakdown and features
of the main sub-sectors are broadly similar
across euro area countries. Wholesale trade
is most important in terms of value added and
turnover, but retail trade is more signifi cant in
terms of employment, number of fi rms and,
above all, interaction with consumers. The next
section examines the retail trade sub-sector in
more detail.
1.1.2 A CLOSER LOOK AT THE GROCERY TRADE
Retail trade is divided roughly evenly into
grocery trade (primarily food and certain
household items) and non-grocery trade
(clothing and footwear, household furnishings
and electronic goods). These two parts of the
Aside from the issue of imputing the labour income of the self-13
employed, the calculation and interpretation of profi tability
measures is quite complex. See ECB (2004) for a more detailed
discussion.
Chart 2 Share of sub-sectors in the distributive trades sector in 2006
(percentages)
0
10
20
30
40
50
60
70
0
10
20
30
40
50
60
70
Motor vehicles
and auto fuel
Wholesale and
commission trade
Retail trade
number of firms
self-employment
production value
profits
employment
turnover
value added
labour costs
Sources: Eurostat SBS database and Eurosystem staff calculations.
Chart 3 Comparison across distributive trades sub-sectors
(average profi t share (adjusted) in euro area distributive trades sectors; percentages)
(average profi t margin (turnover; adjusted) in euro area distributive trades sectors; percentages)
distributive trades wholesale trade
retail trade non-financial business
a) Profit share b) Profit margins
25
30
35
40
45
25
30
35
40
45
1997 1999 2001 2003 20050
2
4
6
8
10
12
14
0
2
4
6
8
10
12
14
1997 1999 2001 2003 2005
Sources: Eurostat SBS database and Eurosystem staff calculations.
18ECB
Structural features of distributive trades and their impact on prices in the euro area
September 2011
sub-sector differ substantially in terms of their
main economic characteristics, with grocery
trade being somewhat more homogeneous than
non-grocery trade. This section considers the
grocery trade in more detail.
Most consumers obtain the basic necessities
required for daily living, such as food and
household goods, in the grocery market.
However, although the goods sold here may
be broadly similar across countries, there are
notable differences across countries in terms
of, for example, store format, the degree of
internationalisation, market penetration by hard
discounters and private label brands, and the
role of buying groups.
These differences are clearly visible in the
summary statistics presented in Table A1.
The total number of grocery stores in the euro
area is approximately 850,000, the majority of
which, unsurprisingly, are located in the larger
economies. However, it is striking that both Italy
and Spain feature more stores than Germany
and France, despite having smaller populations.
This may be due, in part, to differing defi nitions
and thresholds for classifying stores. When
it comes to selling space, measured in square
metres – which is perhaps a more meaningful
indicator – Germany (with almost 40 million m²)
and France (with almost 30 million m²) account
for the largest proportion of the total euro area
grocery selling space of 150 million m². This
inverse correlation between number of stores and
selling space captures an important distinction
in the European grocery trade. Southern
European countries, such as Greece, Cyprus,
Italy, Portugal, Spain and Malta, tend to have
more traditional and smaller grocery retailers
than certain northern European countries, for
example Finland, Germany, France and Austria.
In terms of real sales per store, Finland and
France have the highest on average, but in
the case of Finland this is mainly because the
stores are generally of a large size – a feature
of the grocery trade in both these countries.
On a square metre basis, the countries with the
highest real sales per store are Ireland, France,
the Netherlands and Belgium.
It should be borne in mind that these statistics
are somewhat crude, being country averages
only; they do not account for heterogeneity
across stores or regions. Furthermore, when
trying to interpret the different indicators, it is
also necessary to consider geographical and
economic differences between countries (such
as population density and distribution and
income levels), as well as socio-cultural and
regulatory factors.
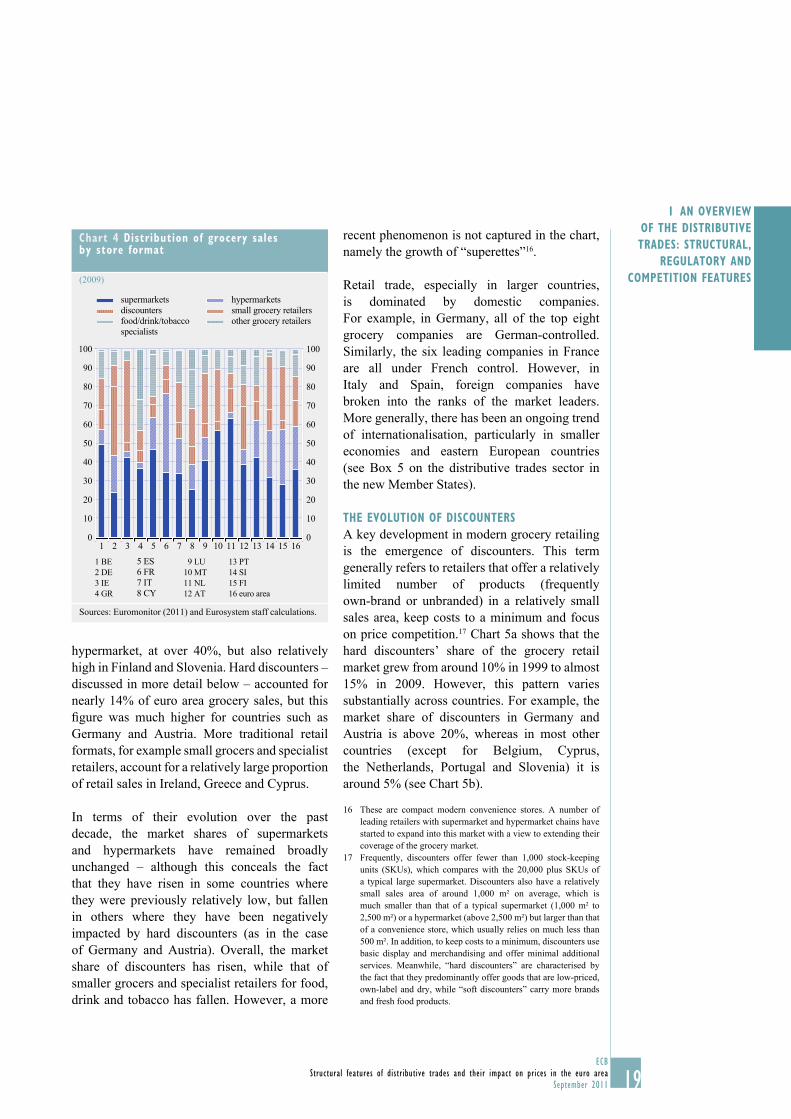
Chart 4 presents the distribution of grocery
sales by store format across countries;
this varies considerably, refl ecting a combination
of factors, such as historical legacies, societal
preferences, socio-geographical factors and
regulatory conditions.14
On average, supermarkets accounted for just
over 33% of grocery sales in the euro area in
2009. However, at the country level, their
market share was lowest in Germany (at around
25%), where hard discounters dominate grocery
sales, and in Cyprus, where smaller, traditional
retailers account for a relatively large proportion
of sales. The market share of supermarkets was
relatively high in the Netherlands and Malta,
where hypermarkets account for a relatively
small proportion of grocery sales. While a small
market size may explain this in the case of
Malta, this is clearly not so for the Netherlands,
where planning restrictions are behind the
absence of hypermarkets.15 On average,
hypermarkets accounted for approximately 25%
of grocery sales in the euro area. Their market
share was highest in France, the “home” of the
The defi nition of store formats is to some extent arbitrary. 14
In general, the store size (in terms of square metres) and range
(in terms of the number and breadth of goods stocked) are the
criteria used. Hypermarkets tend to have a sales area above
2,500 m²; supermarkets one between 1,000 m² and 2,500 m²;
and discounters a sales area of between 400 m² and 1,000 m²,
with a relatively limited range of goods.
In its Economic Surveys of the Netherlands, the OECD has 15
noted that “planning restrictions in the Netherlands have
inhibited the entry and expansion of large-format operators,
which has impeded productivity growth in the sector. While
Dutch planning and zoning restrictions have been successful
in protecting small and specialist retailers located in town
centres, they also may distort competition and offer considerable
incumbency advantages to established retailers, thus creating
and maintaining rents”.
19ECB
Structural features of distributive trades and their impact on prices in the euro area
September 2011
I AN OVERVIEW
OF THE DISTRIBUTIVE
TRADES: STRUCTURAL,
REGULATORY AND
COMPETITION FEATURES
hypermarket, at over 40%, but also relatively
high in Finland and Slovenia. Hard discounters –
discussed in more detail below – accounted for
nearly 14% of euro area grocery sales, but this
fi gure was much higher for countries such as
Germany and Austria. More traditional retail
formats, for example small grocers and specialist
retailers, account for a relatively large proportion
of retail sales in Ireland, Greece and Cyprus.
In terms of their evolution over the past
decade, the market shares of supermarkets
and hypermarkets have remained broadly
unchanged – although this conceals the fact
that they have risen in some countries where
they were previously relatively low, but fallen
in others where they have been negatively
impacted by hard discounters (as in the case
of Germany and Austria). Overall, the market
share of discounters has risen, while that of
smaller grocers and specialist retailers for food,
drink and tobacco has fallen. However, a more
recent phenomenon is not captured in the chart,
namely the growth of “superettes”16.
Retail trade, especially in larger countries,
is dominated by domestic companies.
For example, in Germany, all of the top eight
grocery companies are German-controlled.
Similarly, the six leading companies in France
are all under French control. However, in
Italy and Spain, foreign companies have
broken into the ranks of the market leaders.
More generally, there has been an ongoing trend
of internationalisation, particularly in smaller
economies and eastern European countries
(see Box 5 on the distributive trades sector in
the new Member States).
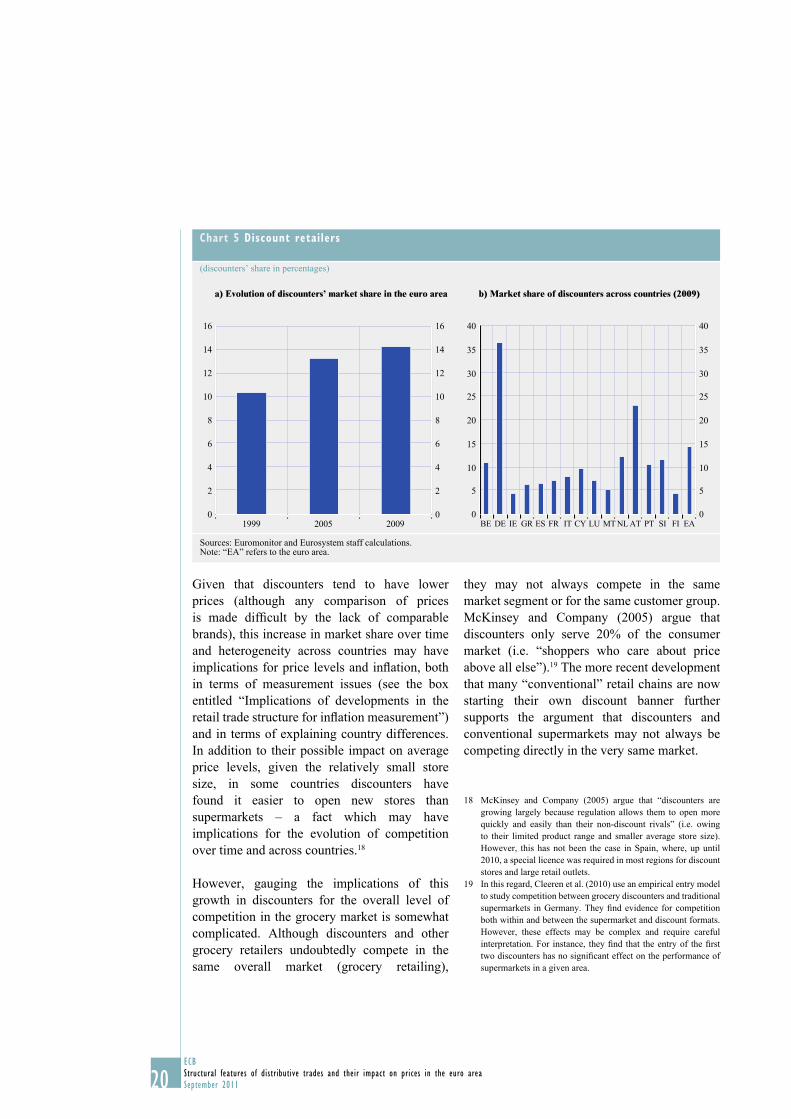
THE EVOLUTION OF DISCOUNTERS
A key development in modern grocery retailing
is the emergence of discounters. This term
generally refers to retailers that offer a relatively
limited number of products (frequently
own-brand or unbranded) in a relatively small
sales area, keep costs to a minimum and focus
on price competition.17 Chart 5a shows that the
hard discounters’ share of the grocery retail
market grew from around 10% in 1999 to almost
15% in 2009. However, this pattern varies
substantially across countries. For example, the
market share of discounters in Germany and
Austria is above 20%, whereas in most other
countries (except for Belgium, Cyprus,
the Netherlands, Portugal and Slovenia) it is
around 5% (see Chart 5b).
These are compact modern convenience stores. A number of 16
leading retailers with supermarket and hypermarket chains have
started to expand into this market with a view to extending their
coverage of the grocery market.
Frequently, discounters offer fewer than 1,000 stock-keeping 17
units (SKUs), which compares with the 20,000 plus SKUs of
a typical large supermarket. Discounters also have a relatively
small sales area of around 1,000 m² on average, which is
much smaller than that of a typical supermarket (1,000 m² to
2,500 m²) or a hypermarket (above 2,500 m²) but larger than that
of a convenience store, which usually relies on much less than
500 m². In addition, to keep costs to a minimum, discounters use
basic display and merchandising and offer minimal additional
services. Meanwhile, “hard discounters” are characterised by
the fact that they predominantly offer goods that are low-priced,
own-label and dry, while “soft discounters” carry more brands
and fresh food products.
Chart 4 Distribution of grocery sales by store format
(2009)
0
10
20
30
40
50
60
70
80
90
100
0
10
20
30
40
50
60
70
80
90
100
supermarkets
discounters
food/drink/tobacco
specialists
hypermarkets
small grocery retailers
other grocery retailers
1 BE
2 DE
3 IE
4 GR
5 ES
6 FR
7 IT
8 CY
9 LU
10 MT
11 NL
12 AT
13 PT
14 SI
15 FI
16 euro area
1 2 3 4 5 6 7 8 9 10 11 12 13 14 15 16
Sources: Euromonitor (2011) and Eurosystem staff calculations.
20ECB
Structural features of distributive trades and their impact on prices in the euro area
September 2011
Given that discounters tend to have lower
prices (although any comparison of prices
is made diffi cult by the lack of comparable
brands), this increase in market share over time
and heterogeneity across countries may have
implications for price levels and infl ation, both
in terms of measurement issues (see the box
entitled “Implications of developments in the
retail trade structure for infl ation measurement”)
and in terms of explaining country differences.
In addition to their possible impact on average
price levels, given the relatively small store
size, in some countries discounters have
found it easier to open new stores than
supermarkets – a fact which may have
implications for the evolution of competition
over time and across countries.18
However, gauging the implications of this
growth in discounters for the overall level of
competition in the grocery market is somewhat
complicated. Although discounters and other
grocery retailers undoubtedly compete in the
same overall market (grocery retailing),
they may not always compete in the same
market segment or for the same customer group.
McKinsey and Company (2005) argue that
discounters only serve 20% of the consumer
market (i.e. “shoppers who care about price
above all else”).19 The more recent development
that many “conventional” retail chains are now
starting their own discount banner further
supports the argument that discounters and
conventional supermarkets may not always be
competing directly in the very same market.
McKinsey and Company (2005) argue that “discounters are 18
growing largely because regulation allows them to open more
quickly and easily than their non-discount rivals” (i.e. owing
to their limited product range and smaller average store size).
However, this has not been the case in Spain, where, up until
2010, a special licence was required in most regions for discount
stores and large retail outlets.
In this regard, Cleeren et al. (2010) use an empirical entry model 19
to study competition between grocery discounters and traditional
supermarkets in Germany. They fi nd evidence for competition
both within and between the supermarket and discount formats.
However, these effects may be complex and require careful
interpretation. For instance, they fi nd that the entry of the fi rst
two discounters has no signifi cant effect on the performance of
supermarkets in a given area.
Chart 5 Discount retailers
(discounters’ share in percentages)
a) Evolution of discounters’ market share in the euro area b) Market share of discounters across countries (2009)
0
2
4
6
8
10
12
14
16
0
2
4
6
8
10
12
14
16
1999 2005 20090
5
10
15
20
25
30
35
40
0
5
10
15
20
25
30
35
40
BE DE IE GR ES FR IT CY LU MT NL AT PT SI FI EA
Sources: Euromonitor and Eurosystem staff calculations.Note: “EA” refers to the euro area.
21ECB
Structural features of distributive trades and their impact on prices in the euro area
September 2011
I AN OVERVIEW
OF THE DISTRIBUTIVE
TRADES: STRUCTURAL,
REGULATORY AND
COMPETITION FEATURES
Box 1
ONLINE RETAIL TRADE AND THE DEGREE OF CROSS-BORDER RETAIL COMMERCE
Online retail trade is often regarded as the epitome of a “perfect” market and associated with
improved possibilities for market participants to compare prices 1 (increased transparency) and with
a dramatic decrease in the importance of geographical proximity for consumption expenditure.
The evolution of online retail trade should contribute to lower prices, less (local) pricing power
on the part of individual market participants and increased competition. In addition, sellers would
have a better chance of reaching more customers, which would allow for economies of scale.
Consumers would have access to a wider range of products, as their product choice would not be
limited to the supply of goods available in local sellers’ stores. From a monetary policy perspective,
the evolution of online retail trade is interesting for two main reasons: the potential for lower and
regionally (but also internationally) less divergent prices for equal or comparable products and
the possibility of more fl exible prices (i.e. more frequent price changes).2
The e-commerce market of the EU has grown considerably compared with that of other
economies. In 2006, it was estimated to have reached a value of €106 billion, which was roughly
comparable to its US counterpart. Around 60% of internet users in the EU shopped online
in 2010, though fi gures vary strongly across countries.3 In particular markets, such as airline
travel, the emergence of online trade has completely altered the traditional operating models,
for example airline companies selling their services via travel agents. Today, some EU low-cost
carriers basically only sell their services online. The internet is also the fastest growing retail
channel. In 2008, only direct retail sales (used by 79% of retailers) were more common than sales
via e-commerce (used by 51% of retailers), and e-commerce was signifi cantly more popular than
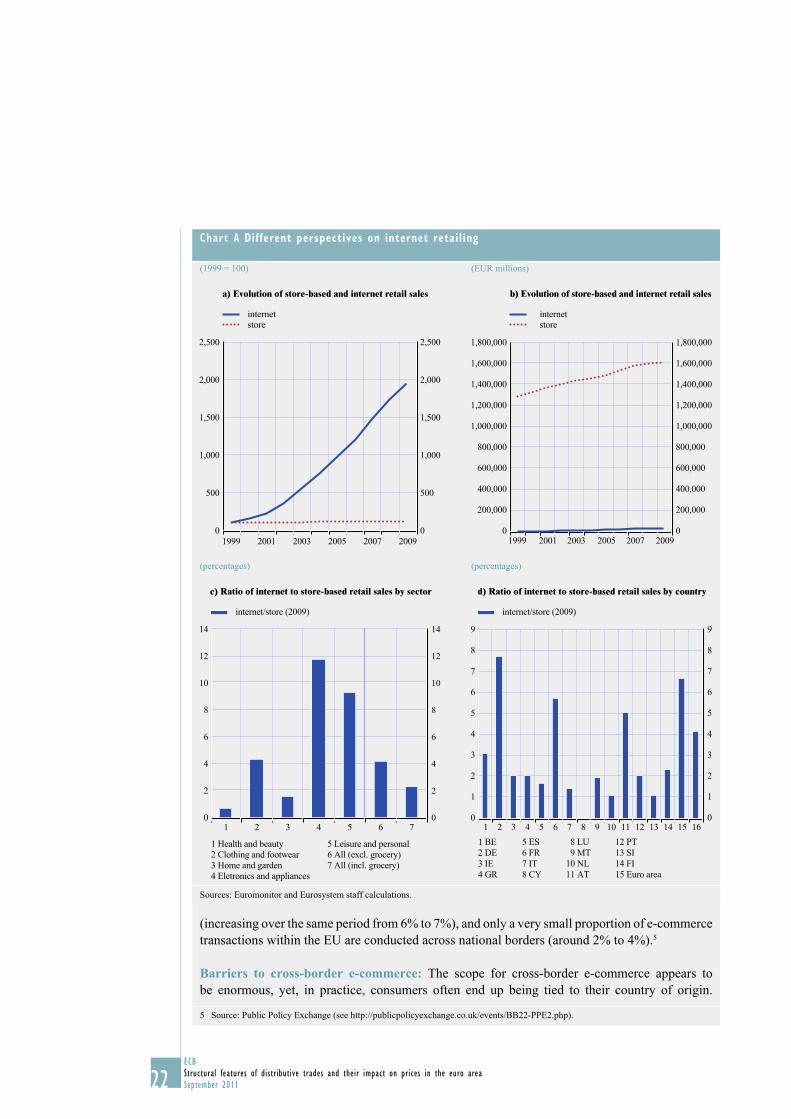
mail order trade (30%). Although online trade is growing rapidly, it still accounts for just a small
proportion of overall retail trade (see Chart A(a) and Chart A(b)), with some notable exceptions
across markets and countries (see Chart A(c) and Chart A(d)). The markets with the highest
penetration of online trade are electronics and appliances (12%), leisure and personal goods
(10%) and clothing and footwear.4 Penetration remains relatively low in the health and beauty,
house and garden and grocery markets. Meanwhile, the ratio of online to store-based retail sales
is highest in Germany, Finland, France and the Netherlands, but relatively low in Spain, Italy,
Cyprus, Malta and Portugal.
One noticeable fact is the widening discrepancy between domestic and cross-border e-commerce. From 2006 to 2008, the share of all EU consumers purchasing at least one item over the internet
rose from 27% to 33%. Meanwhile, cross-border e-commerce remains much less important
1 According to the European Commission, the internet has become a convenient alternative to “window shopping” and is shaping the
way that consumers approach their purchasing activity: three out of fi ve Europeans with internet access at home compare prices online
before making a purchase, either online or in a physical store.
2 However, Lünnemann and Wintr (2011) have found that internet prices are not necessarily more fl exible than those of traditional
“brick and mortar” stores. Instead, there is substantial heterogeneity in the frequency of price changes across shop types and product
categories.
3 In Romania, for example, only 9% of internet users were found to shop online, while the corresponding fi gure for the United Kingdom
was much higher, at 79%. Meanwhile, 69% of the EU population is comprised of “internet users”, with 60% being “regular internet users”
(see Eurostat (2010)).
4 According to Nielsen (2010), internet sales are particularly popular in specifi c product categories, such as books, clothing and footwear,
electronics and music.
22ECB
Structural features of distributive trades and their impact on prices in the euro area
September 2011
(increasing over the same period from 6% to 7%), and only a very small proportion of e-commerce
transactions within the EU are conducted across national borders (around 2% to 4%).5
Barriers to cross-border e-commerce: The scope for cross-border e-commerce appears to
be enormous, yet, in practice, consumers often end up being tied to their country of origin.
5 Source: Public Policy Exchange (see http://publicpolicyexchange.co.uk/events/BB22-PPE2.php).
Chart A Different perspectives on internet retailing
(1999 = 100) (EUR millions)
a) Evolution of store-based and internet retail sales b) Evolution of store-based and internet retail sales
0
500
1,000
1,500
2,000
2,500
0
500
1,000
1,500
2,000
2,500
1999 2001 2003 2005 2007 2009
internet
store
0
200,000
400,000
600,000
800,000
1,000,000
1,200,000
1,400,000
1,600,000
1,800,000
0
200,000
400,000
600,000
800,000
1,000,000
1,200,000
1,400,000
1,600,000
1,800,000
1999 2001 2003 2005 2007 2009
internet
store
(percentages) (percentages)
c) Ratio of internet to store-based retail sales by sector d) Ratio of internet to store-based retail sales by country
0
2
4
6
8
10
12
14
0
2
4
6
8
10
12
14
internet/store (2009)
1 Health and beauty
2 Clothing and footwear
3 Home and garden
4 Eletronics and appliances
5 Leisure and personal
6 All (excl. grocery)
7 All (incl. grocery)
1 2 3 4 5 6 70
1
2
3
4
5
6
7
8
9
0
1
2
3
4
5
6
7
8
9
internet/store (2009)
1 BE
2 DE
3 IE
4 GR
5 ES
6 FR
7 IT
8 CY
8 LU
9 MT
10 NL
11 AT
12 PT
13 SI
14 FI
15 Euro area
1 2 3 4 5 6 7 8 9 1110 12 13 14 15 16
Sources: Euromonitor and Eurosystem staff calculations.
23ECB
Structural features of distributive trades and their impact on prices in the euro area
September 2011
I AN OVERVIEW
OF THE DISTRIBUTIVE
TRADES: STRUCTURAL,
REGULATORY AND
COMPETITION FEATURES
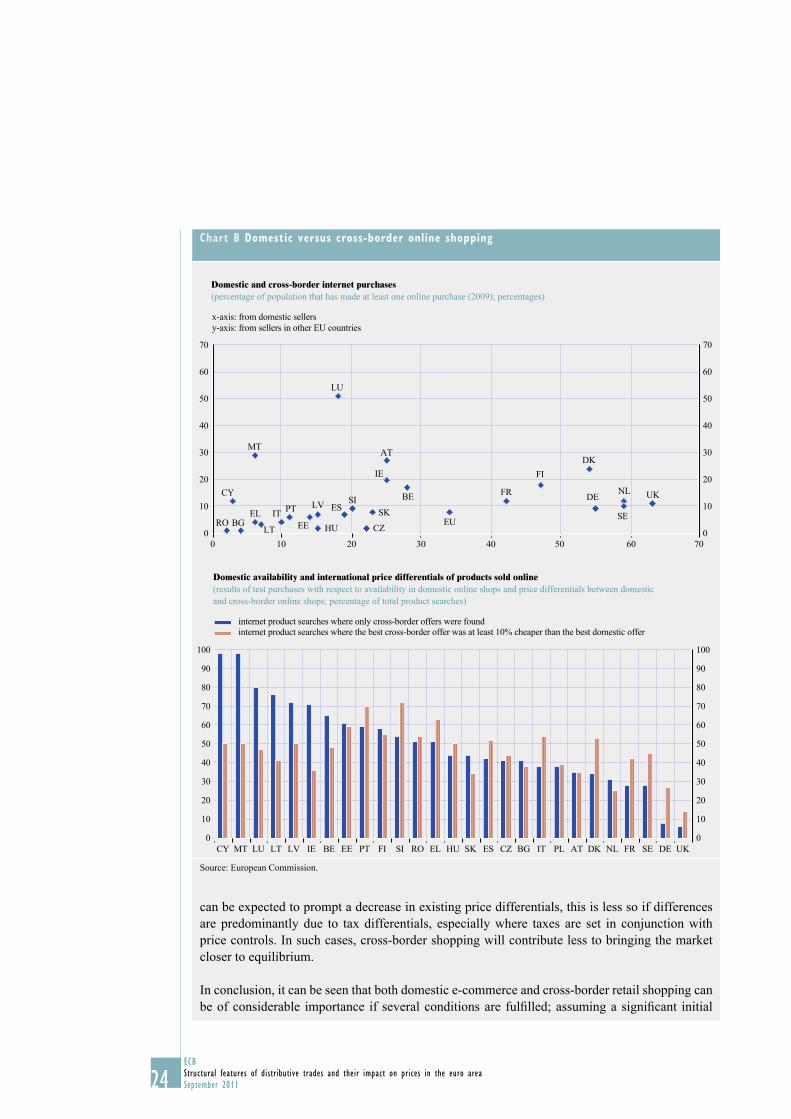
Frequently, they are either redirected to national sites or refused a sale. In an EU-wide test of
online shops, it was possible in only 39% of cases to place an order with an online shop that
was not located in the same country as the buyer. The remaining 61% of orders failed either
because traders refused to serve the consumer’s country or for other reasons (technical problems
or because a particular payment option was not available). Language barriers may also have been
an issue here, but their importance is not easy to quantify.
Regulatory barriers contribute to signifi cant market fragmentation at the EU level. Consumer
law, electronic waste regulations and postal systems are affected by regulatory fragmentation.
Complex value added tax (VAT) requirements for traders selling across borders make it diffi cult
for smaller brands and retailers to do business across the EU. These restrictions are directly
hindering the growth and competitiveness of small and medium-sized enterprises now active in
this sector or aspiring to be so in the future.
Thus, barriers to cross-border trading appear to be the biggest obstacle to the growth of
e-commerce in the EU. Nevertheless, the potential for more cross-border online shopping and,
hence, for increased competition, lower prices and greater price fl exibility seems to be there.
In 2008, one-third of EU citizens indicated that they would consider buying goods or services
from another Member State online if these were cheaper or better. In addition, in more than half
of all Member States, at least 50% of the products tested were found to be at least 10% cheaper
in a foreign internet shop (shipping costs included). Furthermore, it was generally the case that
half of the tested products could not be found in any domestic internet shop.
Cross-border shopping could play a signifi cant role in the development of the Single Market.
The potential effect of an improved regulatory environment – with suffi cient trust between market
participants – on cross-border online trade can also be seen from examples of particularly intense
“traditional” cross-border retail shopping, e.g. between the Republic of Ireland and Northern
Ireland and within the “Grande Région” encompassing Luxembourg and the surrounding regions
of Belgium, Germany and France.6
There are several drivers of cross-border retail shopping. Of course, price differentials (owing
to matters of taxation (e.g. VAT), exchange rates, and perhaps also factors such as differences
in labour costs, living standards, and in the rent levels or pricing practices of wholesalers) play
a role. Differences in the range of available products or simply (additional) transport costs close
to zero (e.g. if people cross the border anyway as they work in the neighbouring country or in
the case of particular geographical proximity) are further drivers.7 Cross-border retail trade can
increase competition and thus contribute to reducing price level differences across countries and
regions (Section 2.1 discusses the fact that prices appear to vary more across borders/countries
than within borders/countries). The potential impact on price levels and divergence between
prices obviously depends on the determinants of this divergence. While cross-border shopping
6 In Luxembourg, 9.5% of consumption expenditure by resident households took place outside national borders in 2009 (rising
from 5.4% in 2002). Consumption by non-resident households reached 22% of total private consumption in the country.
Thus, cross-border shopping can clearly be a bi-directional phenomenon. Some goods are cheaper in Luxembourg, while others can
be purchased for less abroad. For instance, at its normal rate of 15%, VAT is lower in Luxembourg than in the surrounding countries,
but some sellers complain about not having the possibility of importing goods from the most competitive foreign supplier and about
being forced to make imports via Belgium – some of the producers here have assigned a certain “territorial exclusivity” regarding
Luxembourg to Belgian intermediaries, which leads to additional costs. In addition, some goods produced for the German market,
for example, cannot be offered by domestic fi rms, as these goods are not traded by the Belgian intermediary and are only offered by
German intermediaries.
7 See European Commission (2003), p. 8.
24ECB
Structural features of distributive trades and their impact on prices in the euro area
September 2011
can be expected to prompt a decrease in existing price differentials, this is less so if differences
are predominantly due to tax differentials, especially where taxes are set in conjunction with
price controls. In such cases, cross-border shopping will contribute less to bringing the market
closer to equilibrium.
In conclusion, it can be seen that both domestic e-commerce and cross-border retail shopping can
be of considerable importance if several conditions are fulfi lled; assuming a signifi cant initial
Chart B Domestic versus cross-border online shopping
Domestic and cross-border internet purchases(percentage of population that has made at least one online purchase (2009); percentages)
UK
SE
NLDE
DK
FI
FR
EU
BE
IE
AT
SK
CZ
SIES
LU
HU
LV
EE
PTIT
LT
EL
MT
BG
CY
RO0
10
20
30
40
50
60
70
0
10
20
30
40
50
60
70
0 10 20 30 40 50 60 70
x-axis: from domestic sellers
y-axis: from sellers in other EU countries
Domestic availability and international price differentials of products sold online(results of test purchases with respect to availability in domestic online shops and price differentials between domestic
and cross-border online shops; percentage of total product searches)
0
10
20
30
40
50
60
70
80
90
100
0
10
20
30
40
50
60
70
80
90
100
internet product searches where only cross-border offers were found
internet product searches where the best cross-border offer was at least 10% cheaper than the best domestic offer
CY SI AT DK NL FR SE DE UKRO EL HU SK ES CZ BG IT PLMT LU LT LV IE BE EE PT FI
Source: European Commission.
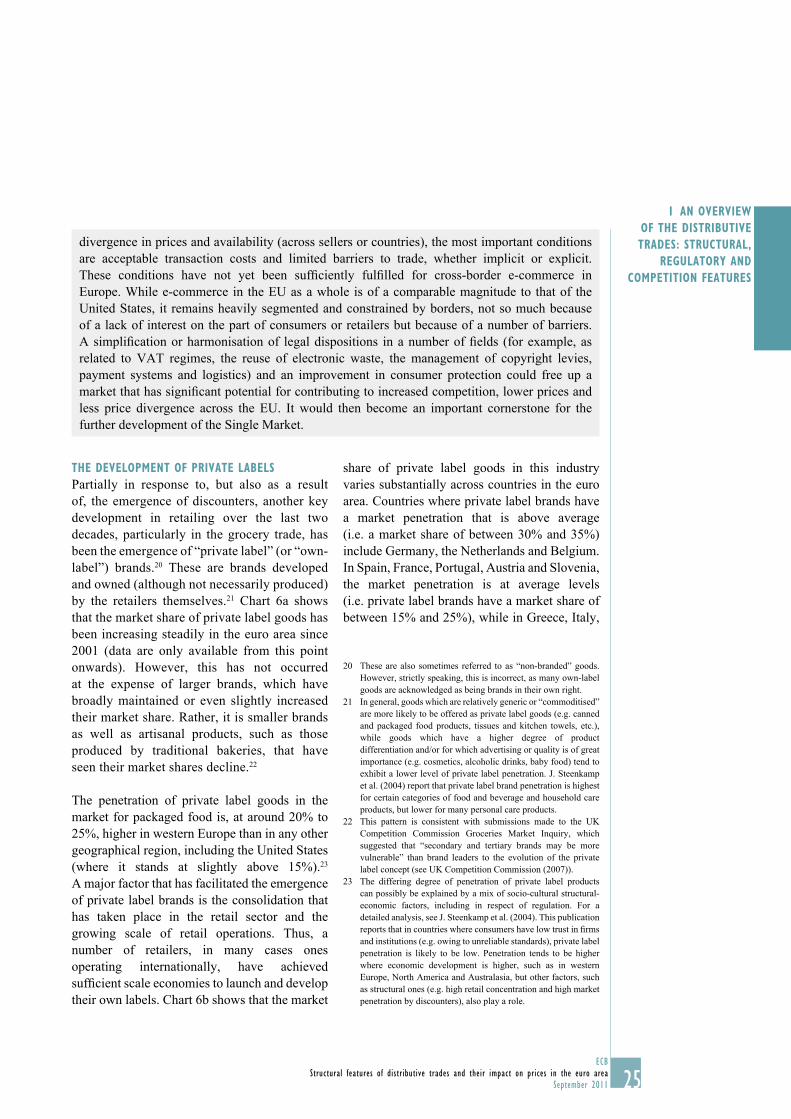
25ECB
Structural features of distributive trades and their impact on prices in the euro area
September 2011
I AN OVERVIEW
OF THE DISTRIBUTIVE
TRADES: STRUCTURAL,
REGULATORY AND
COMPETITION FEATURES
THE DEVELOPMENT OF PRIVATE LABELS
Partially in response to, but also as a result
of, the emergence of discounters, another key
development in retailing over the last two
decades, particularly in the grocery trade, has
been the emergence of “private label” (or “own-
label”) brands.20 These are brands developed
and owned (although not necessarily produced)
by the retailers themselves.21 Chart 6a shows
that the market share of private label goods has
been increasing steadily in the euro area since
2001 (data are only available from this point
onwards). However, this has not occurred
at the expense of larger brands, which have
broadly maintained or even slightly increased
their market share. Rather, it is smaller brands
as well as artisanal products, such as those
produced by traditional bakeries, that have
seen their market shares decline.22
The penetration of private label goods in the
market for packaged food is, at around 20% to
25%, higher in western Europe than in any other
geographical region, including the United States
(where it stands at slightly above 15%).23
A major factor that has facilitated the emergence
of private label brands is the consolidation that
has taken place in the retail sector and the
growing scale of retail operations. Thus, a
number of retailers, in many cases ones
operating internationally, have achieved
suffi cient scale economies to launch and develop
their own labels. Chart 6b shows that the market
share of private label goods in this industry
varies substantially across countries in the euro
area. Countries where private label brands have
a market penetration that is above average
(i.e. a market share of between 30% and 35%)
include Germany, the Netherlands and Belgium.
In Spain, France, Portugal, Austria and Slovenia,
the market penetration is at average levels
(i.e. private label brands have a market share of
between 15% and 25%), while in Greece, Italy,
These are also sometimes referred to as “non-branded” goods. 20
However, strictly speaking, this is incorrect, as many own-label
goods are acknowledged as being brands in their own right.
In general, goods which are relatively generic or “commoditised” 21
are more likely to be offered as private label goods (e.g. canned
and packaged food products, tissues and kitchen towels, etc.),
while goods which have a higher degree of product
differentiation and/or for which advertising or quality is of great
importance (e.g. cosmetics, alcoholic drinks, baby food) tend to
exhibit a lower level of private label penetration. J. Steenkamp
et al. (2004) report that private label brand penetration is highest
for certain categories of food and beverage and household care
products, but lower for many personal care products.
This pattern is consistent with submissions made to the UK 22
Competition Commission Groceries Market Inquiry, which
suggested that “secondary and tertiary brands may be more
vulnerable” than brand leaders to the evolution of the private
label concept (see UK Competition Commission (2007)).
The differing degree of penetration of private label products 23
can possibly be explained by a mix of socio-cultural structural-
economic factors, including in respect of regulation. For a
detailed analysis, see J. Steenkamp et al. (2004). This publication
reports that in countries where consumers have low trust in fi rms
and institutions (e.g. owing to unreliable standards), private label
penetration is likely to be low. Penetration tends to be higher
where economic development is higher, such as in western
Europe, North America and Australasia, but other factors, such
as structural ones (e.g. high retail concentration and high market
penetration by discounters), also play a role.
divergence in prices and availability (across sellers or countries), the most important conditions
are acceptable transaction costs and limited barriers to trade, whether implicit or explicit.
These conditions have not yet been suffi ciently fulfi lled for cross-border e-commerce in
Europe. While e-commerce in the EU as a whole is of a comparable magnitude to that of the
United States, it remains heavily segmented and constrained by borders, not so much because
of a lack of interest on the part of consumers or retailers but because of a number of barriers.
A simplifi cation or harmonisation of legal dispositions in a number of fi elds (for example, as
related to VAT regimes, the reuse of electronic waste, the management of copyright levies,
payment systems and logistics) and an improvement in consumer protection could free up a
market that has signifi cant potential for contributing to increased competition, lower prices and
less price divergence across the EU. It would then become an important cornerstone for the
further development of the Single Market.
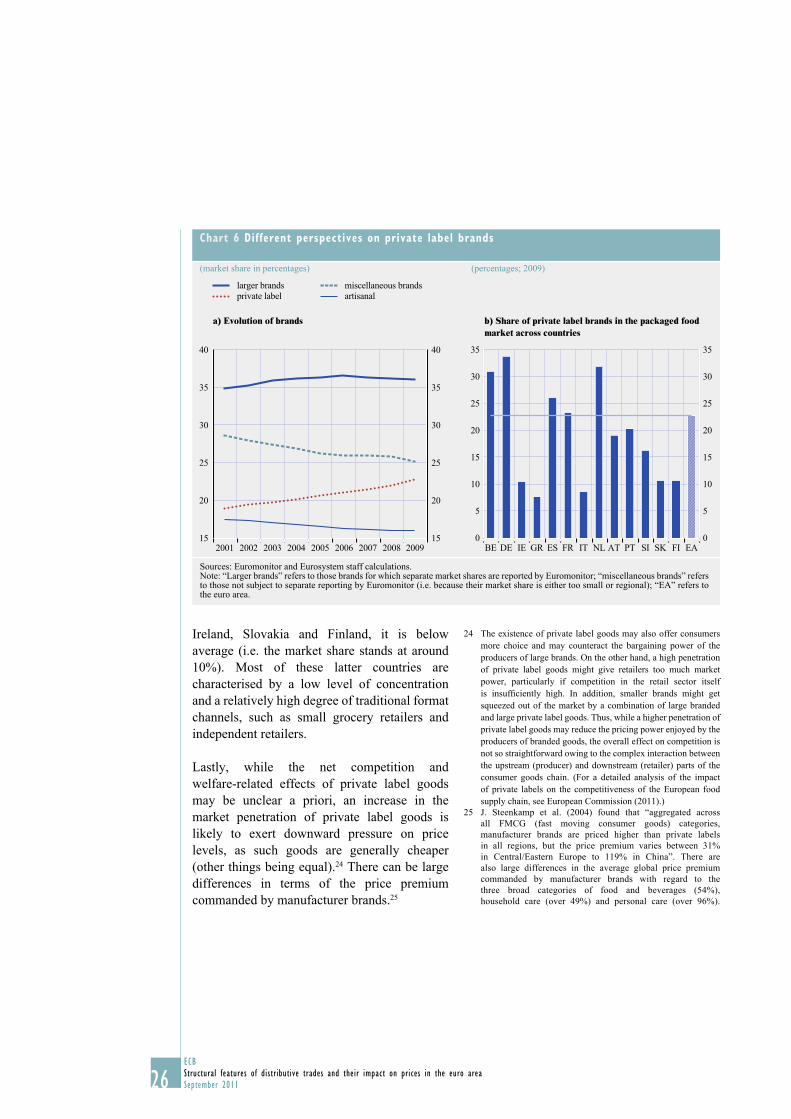
26ECB
Structural features of distributive trades and their impact on prices in the euro area
September 2011
Ireland, Slovakia and Finland, it is below
average (i.e. the market share stands at around
10%). Most of these latter countries are
characterised by a low level of concentration
and a relatively high degree of traditional format
channels, such as small grocery retailers and
independent retailers.
Lastly, while the net competition and
welfare-related effects of private label goods
may be unclear a priori, an increase in the
market penetration of private label goods is
likely to exert downward pressure on price
levels, as such goods are generally cheaper
(other things being equal).24 There can be large
differences in terms of the price premium
commanded by manufacturer brands.25
The existence of private label goods may also offer consumers 24
more choice and may counteract the bargaining power of the
producers of large brands. On the other hand, a high penetration
of private label goods might give retailers too much market
power, particularly if competition in the retail sector itself
is insuffi ciently high. In addition, smaller brands might get
squeezed out of the market by a combination of large branded
and large private label goods. Thus, while a higher penetration of
private label goods may reduce the pricing power enjoyed by the
producers of branded goods, the overall effect on competition is
not so straightforward owing to the complex interaction between
the upstream (producer) and downstream (retailer) parts of the
consumer goods chain. (For a detailed analysis of the impact
of private labels on the competitiveness of the European food
supply chain, see European Commission (2011).)
J. Steenkamp et al. (2004) found that “aggregated across 25
all FMCG (fast moving consumer goods) categories,
manufacturer brands are priced higher than private labels
in all regions, but the price premium varies between 31%
in Central/Eastern Europe to 119% in China”. There are
also large differences in the average global price premium
commanded by manufacturer brands with regard to the
three broad categories of food and beverages (54%),
household care (over 49%) and personal care (over 96%).
Chart 6 Different perspectives on private label brands
(market share in percentages) (percentages; 2009)
larger brands miscellaneous brands
private label artisanal
a) Evolution of brands b) Share of private label brands in the packaged food market across countries
15
20
25
30
35
40
15
20
25
30
35
40
2001 2002 2003 2004 2005 2006 2007 2008 20090
5
10
15
20
25
30
35
0
5
10
15
20
25
30
35
BE DE IE GR ES FR IT NL AT PT SI SK FI EA
Sources: Euromonitor and Eurosystem staff calculations.Note: “Larger brands” refers to those brands for which separate market shares are reported by Euromonitor; “miscellaneous brands” refers to those not subject to separate reporting by Euromonitor (i.e. because their market share is either too small or regional); “EA” refers to the euro area.
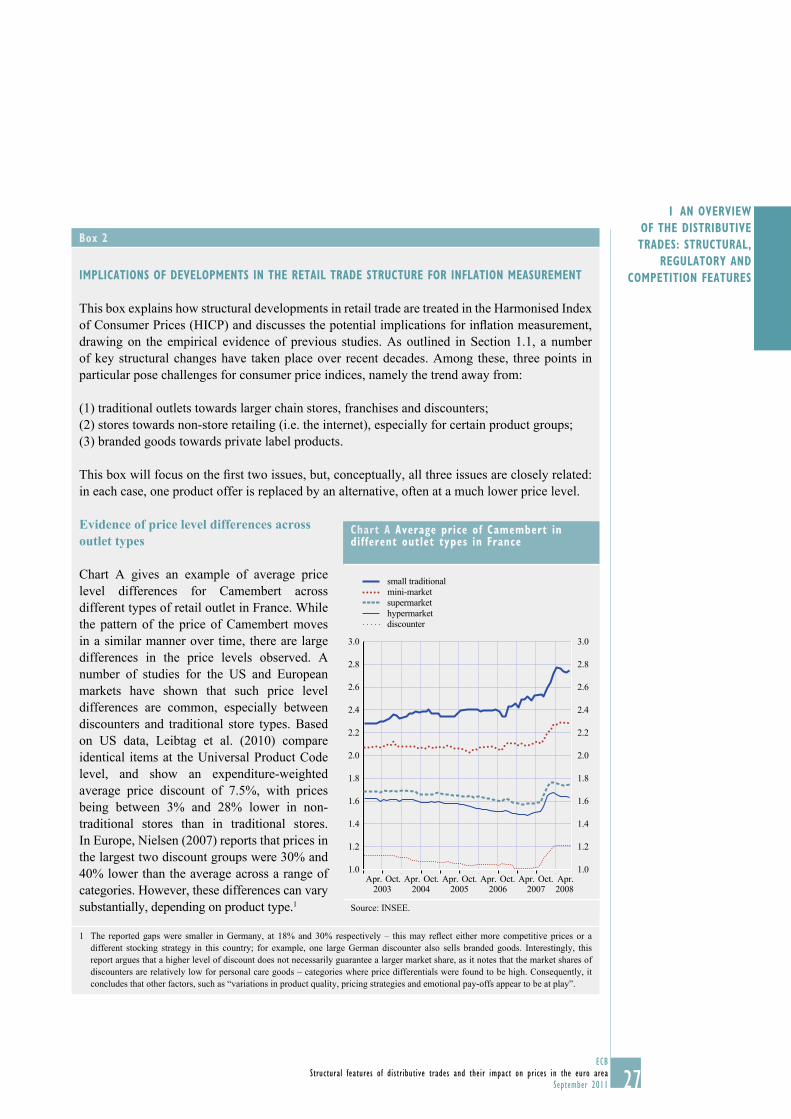
27ECB
Structural features of distributive trades and their impact on prices in the euro area
September 2011
I AN OVERVIEW
OF THE DISTRIBUTIVE
TRADES: STRUCTURAL,
REGULATORY AND
COMPETITION FEATURES
Box 2
IMPLICATIONS OF DEVELOPMENTS IN THE RETAIL TRADE STRUCTURE FOR INFLATION MEASUREMENT
This box explains how structural developments in retail trade are treated in the Harmonised Index
of Consumer Prices (HICP) and discusses the potential implications for infl ation measurement,
drawing on the empirical evidence of previous studies. As outlined in Section 1.1, a number
of key structural changes have taken place over recent decades. Among these, three points in
particular pose challenges for consumer price indices, namely the trend away from:
(1) traditional outlets towards larger chain stores, franchises and discounters;
(2) stores towards non-store retailing (i.e. the internet), especially for certain product groups;
(3) branded goods towards private label products.
This box will focus on the fi rst two issues, but, conceptually, all three issues are closely related:
in each case, one product offer is replaced by an alternative, often at a much lower price level.
Evidence of price level differences across outlet types
Chart A gives an example of average price
level differences for Camembert across
different types of retail outlet in France. While
the pattern of the price of Camembert moves
in a similar manner over time, there are large
differences in the price levels observed. A
number of studies for the US and European
markets have shown that such price level
differences are common, especially between
discounters and traditional store types. Based
on US data, Leibtag et al. (2010) compare
identical items at the Universal Product Code
level, and show an expenditure-weighted
average price discount of 7.5%, with prices
being between 3% and 28% lower in non-
traditional stores than in traditional stores.
In Europe, Nielsen (2007) reports that prices in
the largest two discount groups were 30% and
40% lower than the average across a range of
categories. However, these differences can vary
substantially, depending on product type.1
1 The reported gaps were smaller in Germany, at 18% and 30% respectively – this may refl ect either more competitive prices or a
different stocking strategy in this country; for example, one large German discounter also sells branded goods. Interestingly, this
report argues that a higher level of discount does not necessarily guarantee a larger market share, as it notes that the market shares of
discounters are relatively low for personal care goods – categories where price differentials were found to be high. Consequently, it
concludes that other factors, such as “variations in product quality, pricing strategies and emotional pay-offs appear to be at play”.
Chart A Average price of Camembert in different outlet types in France
1.0
1.2
1.4
1.6
1.8
2.0
2.2
2.4
2.6
2.8
3.0
1.0
1.2
1.4
1.6
1.8
2.0
2.2
2.4
2.6
2.8
3.0
2003 2004 2005 2006 2007 2008
small traditional
mini-market
supermarket
hypermarket
discounter
Apr. Oct. Apr. Oct. Apr. Oct. Apr. Oct. Apr. Apr.Oct.
Source: INSEE.
28ECB
Structural features of distributive trades and their impact on prices in the euro area
September 2011
Structural changes over time in the variety of retail outlets and their respective market shares can
pose two distinct challenges for infl ation measurement:
First, such changes can mean that, after some time, the sample of outlets used for compiling •
the consumer price index (CPI) is no longer representative. Measurement errors may then
occur because price changes in the outlets excluded from the sample may differ from those
taking place in outlets covered by the sample or because movements in the market shares of
different outlet types result in the weights applied to different outlets becoming outdated.
Such errors do not necessarily move in a particular direction.2 One reason why sample
weights may become outdated is that consumers may shift their purchases away from outlets
which have relatively high price increases in favour of outlets which have relatively low price
increases (outlet substitution effects). If such shifts are to be refl ected in a price index, this
effect would, under normal circumstances, lead to an upward bias in the index.3
A second distinct issue is the method by which new outlets with a different average price •
level are introduced into the sample. How such price level differences should be refl ected
in the HICP depends, in principle, on the extent to which the lower prices are due to an
inferior retail service on the part of the seller. In practice, statistical offi ces generally use
a linking technique which attributes the whole of the price difference to differences in the
quality of retail services – the new lower prices thus have no impact on the level of the index.
The likelihood that this is an over-adjustment suggests an upward bias affecting not only the
HICP, but almost all CPIs used around the world.
Treatment in the HICP
In constructing their HICPs, national statistical offi ces select a sample of products and outlets
which aims to be representative of all transactions (and therefore all outlets) within the scope
of the index. There is no specifi c regulation regarding the frequency of sample updates, but
currently the eight euro area countries accounting for around 49% of the euro area HICP
update their outlet samples annually or on a continuous basis, with most of the remaining
countries conducting an update once every fi ve years. Only four euro area countries have a
wide coverage of internet retailers in their HICP samples for goods. In some cases, internet
retailers are included, though only for a very limited number of products (e.g. personal
computers and books).4 With regard to substitution between outlets in the sample, the main
statistical approach to tackling lower level substitution – the use of the geometric mean at
the lower levels of index compilation – is employed by the majority of euro area countries,
2 Linz (2009) reports on the introduction of a new explicit weighting system in the German CPI which gave a much higher weight to discounters
than that used previously. Since this change occurred during a period marked by strong increases in food commodity prices, for many food
product price changes (as distinct from price levels) were substantially higher for discounters than for other retailers (for an analysis regarding
the pass-through of food commodity prices and the retail structure, see Section 2.4.2). This led to upward revisions of the German CPI in
2008. The proper representation of different outlet types in the index thus has important consequences for index dynamics, since pass-through
may be expected to be more pronounced for low-cost outlet types, where material inputs account for a larger share of the fi nal price.
3 The HICP measures the ratio of expenditure necessary to maintain a certain fi xed consumption pattern and thus it is often assumed
that such shifts in expenditure patterns are not relevant. Nevertheless, these consumption patterns do not refer to specifi c products in
specifi c outlets, but rather to “consumption segments” which serve a common purpose (see Article 1 of Commission Regulation (EC)
No 1334/2007). This would suggest that the HICP should refl ect lower level substitution, i.e. substitution within a single consumption
segment to the extent that consumers may chose between different product offers (which may be in different outlet types) in order to
fulfi l the same underlying objective (“purpose of consumption”).
4 As regards services, many countries include air tickets, hotels, tickets for cultural events, etc., but these are beyond the scope
of this report.
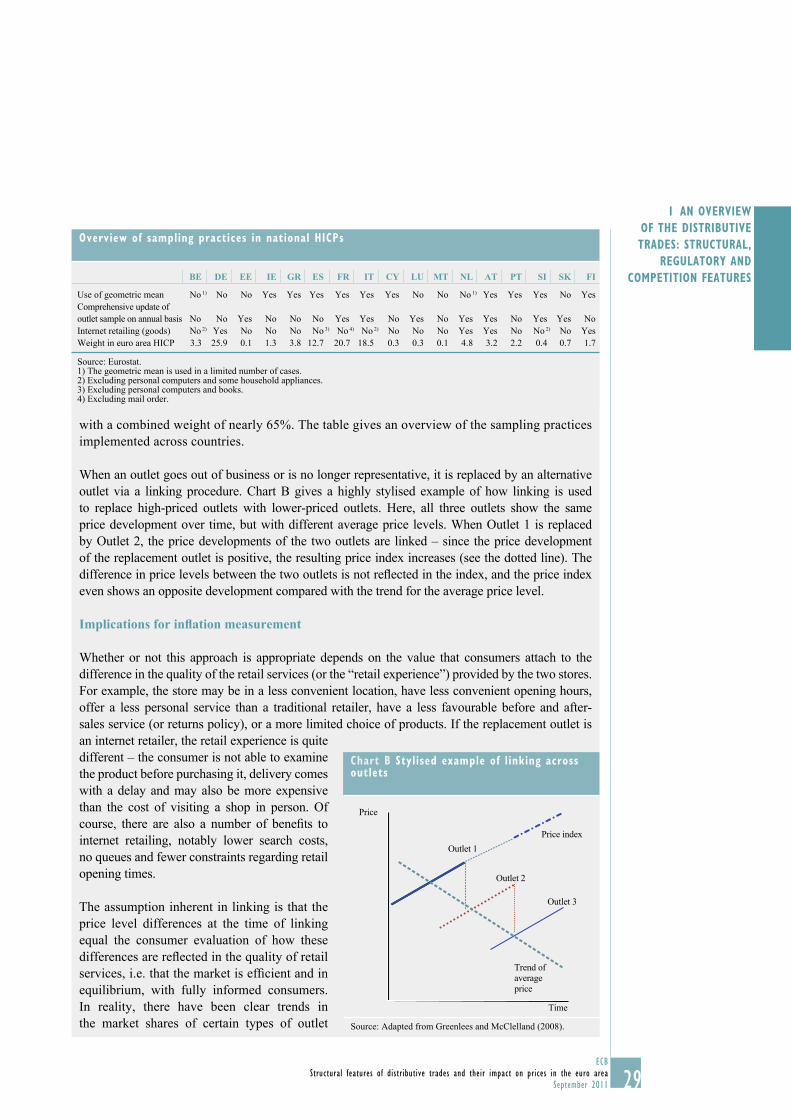
29ECB
Structural features of distributive trades and their impact on prices in the euro area
September 2011
I AN OVERVIEW
OF THE DISTRIBUTIVE
TRADES: STRUCTURAL,
REGULATORY AND
COMPETITION FEATURES
with a combined weight of nearly 65%. The table gives an overview of the sampling practices
implemented across countries.
When an outlet goes out of business or is no longer representative, it is replaced by an alternative
outlet via a linking procedure. Chart B gives a highly stylised example of how linking is used
to replace high-priced outlets with lower-priced outlets. Here, all three outlets show the same
price development over time, but with different average price levels. When Outlet 1 is replaced
by Outlet 2, the price developments of the two outlets are linked – since the price development
of the replacement outlet is positive, the resulting price index increases (see the dotted line). The
difference in price levels between the two outlets is not refl ected in the index, and the price index
even shows an opposite development compared with the trend for the average price level.
Implications for infl ation measurement
Whether or not this approach is appropriate depends on the value that consumers attach to the
difference in the quality of the retail services (or the “retail experience”) provided by the two stores.
For example, the store may be in a less convenient location, have less convenient opening hours,
offer a less personal service than a traditional retailer, have a less favourable before and after-
sales service (or returns policy), or a more limited choice of products. If the replacement outlet is
an internet retailer, the retail experience is quite
different – the consumer is not able to examine
the product before purchasing it, delivery comes
with a delay and may also be more expensive
than the cost of visiting a shop in person. Of
course, there are also a number of benefi ts to
internet retailing, notably lower search costs,
no queues and fewer constraints regarding retail
opening times.
The assumption inherent in linking is that the
price level differences at the time of linking
equal the consumer evaluation of how these
differences are refl ected in the quality of retail
services, i.e. that the market is effi cient and in
equilibrium, with fully informed consumers.
In reality, there have been clear trends in
the market shares of certain types of outlet
Overview of sampling practices in national HICPs
BE DE EE IE GR ES FR IT CY LU MT NL AT PT SI SK FI
Use of geometric mean No 1) No No Yes Yes Yes Yes Yes Yes No No No 1) Yes Yes Yes No Yes
Comprehensive update of
outlet sample on annual basis No No Yes No No No Yes Yes No Yes No Yes Yes No Yes Yes No
Internet retailing (goods) No 2) Yes No No No No 3) No 4) No 2) No No No Yes Yes No No 2) No Yes
Weight in euro area HICP 3.3 25.9 0.1 1.3 3.8 12.7 20.7 18.5 0.3 0.3 0.1 4.8 3.2 2.2 0.4 0.7 1.7
Source: Eurostat.1) The geometric mean is used in a limited number of cases.2) Excluding personal computers and some household appliances.3) Excluding personal computers and books.4) Excluding mail order.
Chart B Stylised example of linking across outlets
Price index
Time
Price
Outlet 1
Outlet 2
Outlet 3
Trend of
average
price
Source: Adapted from Greenlees and McClelland (2008).
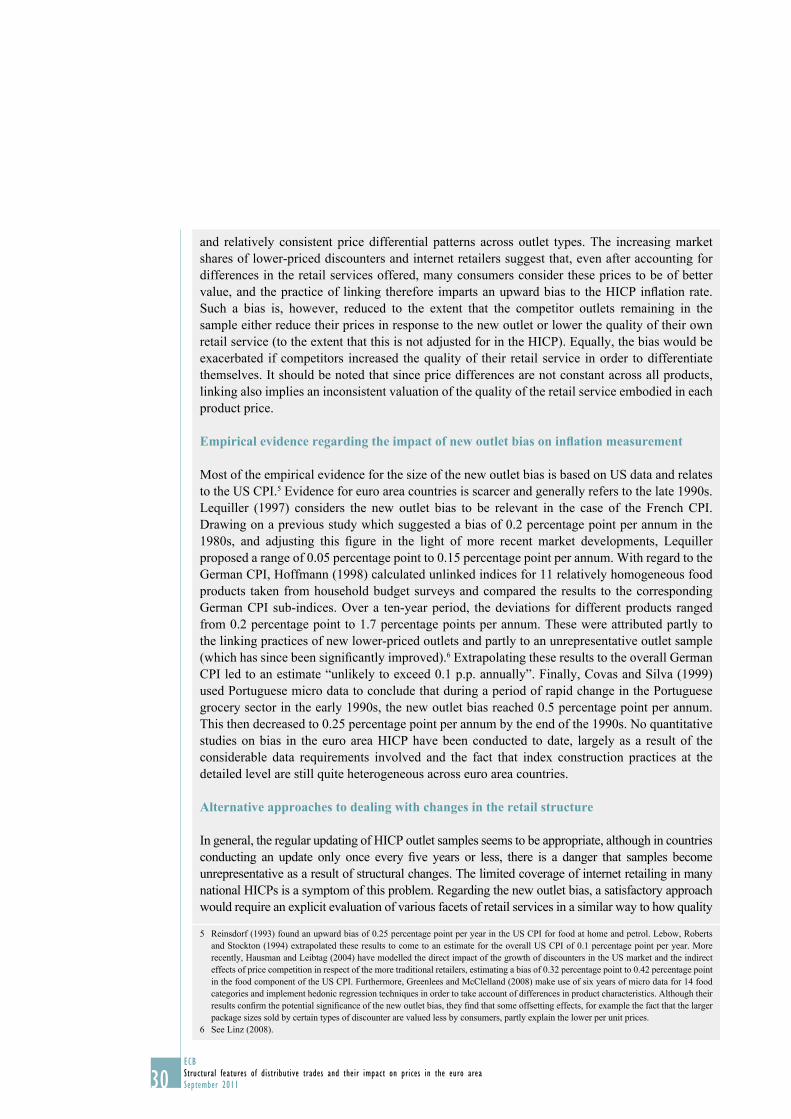
30ECB
Structural features of distributive trades and their impact on prices in the euro area
September 2011
and relatively consistent price differential patterns across outlet types. The increasing market
shares of lower-priced discounters and internet retailers suggest that, even after accounting for
differences in the retail services offered, many consumers consider these prices to be of better
value, and the practice of linking therefore imparts an upward bias to the HICP infl ation rate.
Such a bias is, however, reduced to the extent that the competitor outlets remaining in the
sample either reduce their prices in response to the new outlet or lower the quality of their own
retail service (to the extent that this is not adjusted for in the HICP). Equally, the bias would be
exacerbated if competitors increased the quality of their retail service in order to differentiate
themselves. It should be noted that since price differences are not constant across all products,
linking also implies an inconsistent valuation of the quality of the retail service embodied in each
product price.
Empirical evidence regarding the impact of new outlet bias on infl ation measurement
Most of the empirical evidence for the size of the new outlet bias is based on US data and relates
to the US CPI.5 Evidence for euro area countries is scarcer and generally refers to the late 1990s.
Lequiller (1997) considers the new outlet bias to be relevant in the case of the French CPI.
Drawing on a previous study which suggested a bias of 0.2 percentage point per annum in the
1980s, and adjusting this fi gure in the light of more recent market developments, Lequiller
proposed a range of 0.05 percentage point to 0.15 percentage point per annum. With regard to the
German CPI, Hoffmann (1998) calculated unlinked indices for 11 relatively homogeneous food
products taken from household budget surveys and compared the results to the corresponding
German CPI sub-indices. Over a ten-year period, the deviations for different products ranged
from 0.2 percentage point to 1.7 percentage points per annum. These were attributed partly to
the linking practices of new lower-priced outlets and partly to an unrepresentative outlet sample
(which has since been signifi cantly improved).6 Extrapolating these results to the overall German
CPI led to an estimate “unlikely to exceed 0.1 p.p. annually”. Finally, Covas and Silva (1999)
used Portuguese micro data to conclude that during a period of rapid change in the Portuguese
grocery sector in the early 1990s, the new outlet bias reached 0.5 percentage point per annum.
This then decreased to 0.25 percentage point per annum by the end of the 1990s. No quantitative
studies on bias in the euro area HICP have been conducted to date, largely as a result of the
considerable data requirements involved and the fact that index construction practices at the
detailed level are still quite heterogeneous across euro area countries.
Alternative approaches to dealing with changes in the retail structure
In general, the regular updating of HICP outlet samples seems to be appropriate, although in countries
conducting an update only once every fi ve years or less, there is a danger that samples become
unrepresentative as a result of structural changes. The limited coverage of internet retailing in many
national HICPs is a symptom of this problem. Regarding the new outlet bias, a satisfactory approach
would require an explicit evaluation of various facets of retail services in a similar way to how quality
5 Reinsdorf (1993) found an upward bias of 0.25 percentage point per year in the US CPI for food at home and petrol. Lebow, Roberts
and Stockton (1994) extrapolated these results to come to an estimate for the overall US CPI of 0.1 percentage point per year. More
recently, Hausman and Leibtag (2004) have modelled the direct impact of the growth of discounters in the US market and the indirect
effects of price competition in respect of the more traditional retailers, estimating a bias of 0.32 percentage point to 0.42 percentage point
in the food component of the US CPI. Furthermore, Greenlees and McClelland (2008) make use of six years of micro data for 14 food
categories and implement hedonic regression techniques in order to take account of differences in product characteristics. Although their
results confi rm the potential signifi cance of the new outlet bias, they fi nd that some offsetting effects, for example the fact that the larger
package sizes sold by certain types of discounter are valued less by consumers, partly explain the lower per unit prices.
6 See Linz (2008).
31ECB
Structural features of distributive trades and their impact on prices in the euro area
September 2011
I AN OVERVIEW
OF THE DISTRIBUTIVE
TRADES: STRUCTURAL,
REGULATORY AND
COMPETITION FEATURES
THE ROLE OF BUYING GROUPS
Another key feature of the grocery sector (and
other distributive trades sub-sectors 26) – one
not often known outside the consumer goods
producing and distributive trades sectors – is
the role of buying groups. A buying group is an
organisation of retailers that combines the buying
power of its members in order to be able to
purchase goods at a more advantageous rate than
might be achieved through individual negotiation.
Buying groups are important because, by
combining the buying power of their individual
members, they can achieve very large economies
of scale and potentially alter the balance of power
in negotiations between retailers and suppliers.27
Their existence also implies that measures of
competition based on company-level data may
overstate the true level of competition and
understate the bargaining power of buying groups
relative to suppliers.28 For example, the largest
buying group in Europe is comprised of more
than ten national supermarket chains operating
across 19 countries, with a combined turnover
of approximately €120 billion. To put this into
perspective, the largest European retailer, which
is also the second largest retailer in the world, has
a total global turnover of around €90 billion.
The net impact of buying groups on competition
and social welfare is not straightforward. On the
one hand, proponents would argue that buying
groups help national retail chains compete with
large multinational producers and pass on cost
savings to consumers. Furthermore, they may
enable smaller manufacturers to access a larger
market and provide them with opportunities for
producing private brands that can then be
distributed across Europe.29 On the other hand, it
could be argued that their massive scale provides
them with too much bargaining power, especially
in relation to smaller producers and smaller
retailers.30 Dobson (1999) argues that although
the net effects are uncertain a priori, the
anti-competitive effects are likely to be limited.
Buying groups exist in most other industries, for example in 26
consumer electronics and in consumer recreation.
Balan (2007) cites the major factors behind the emergence of 27
buying groups as: (a) the increased power of manufacturers;
and (b) the need to compete with hard discounters. With
regard to the former, she notes that “in France, the fi rst eight
global industrial groups in the agro-food sector have a market
capitalization higher than the largest retailer and that the degree
of concentration is very high in some food industries”.
It should be noted that buying groups are usually structured in such 28
a way as to avoid competing members. Thus, for international
buying groups, in general, no two members come from the same
country and spheres of operation tend not to overlap too much.
Dobson (1999) cites three possible pro-competitive effects 29
resulting from the presence of buying groups. First, they may
facilitate the Single Market, as the sharing of buying price
information is likely to increase pressure on suppliers to
reduce inter-state price discrimination and enable new branded
products to be introduced more quickly across a number of
Member States. He argues that other forms of sharing retailer
know-how within alliances may speed up the process of
implementing best practice (e.g. as regards distribution and IT
systems) and have positive effects on productivity. Second, they
may provide countervailing market power to large suppliers.
Lastly, they may result in the more effi cient development of
private label products.
On the other hand, Dobson (1999) also indicates potential anti-30
competitive effects: (1) monopsony (i.e. monopoly buying)
power; (2) opportunistic buyer behaviour that works against
suppliers who have incurred sunk costs; (3) distortions in retail
competition; and (4) mutual forbearance between members.
adjustments for product characteristics are approached. Hedonic approaches which regress price
information on a range of characteristics of retail services may be one avenue that warrants further
research. Alternatively, consumer surveys could be conducted in order to obtain direct evaluations of
different aspects of retail services. While both approaches appear to be resource-intensive, it should
perhaps be noted that structural changes in the retail trade sector are relatively gradual and innovations
are much less frequent or varied than those in respect of product characteristics. Therefore, such
research and valuations would need to be estimated relatively infrequently, but could nonetheless be
applied to the HICP (which is calculated on a monthly basis).
Although evidence from the 1990s suggests that new outlet bias was not a source of signifi cant
bias, recent developments in the market shares of discounters and online retailers and the growth
of private label brands suggest that the challenges these structural developments pose for infl ation
measurement should remain a concern for policy-makers and are worthy of further research.
32ECB
Structural features of distributive trades and their impact on prices in the euro area
September 2011
Box 3
FIRM DEMOGRAPHICS, FIRM SIZE AND PERFORMANCE ANALYSIS
This box considers the demographic features – from fi rm “births” (creation of new fi rms) to
fi rm “deaths” (fi rms ceasing to exist) – of companies in the distributive trades sector in terms
of size, and assesses the contribution of these elements to growth developments. Understanding
fi rm dynamics may provide some insight into the reasons behind the relatively poor productivity
performance of the distributive trades in the euro area.1
Demographic analysis
According to information from the Eurostat SBS database related to fi rm demographics, between
1998 and 2006 (the last year for which data are available) in the euro area as a whole, about 2.6 million
enterprises were “born” in the distributive trades sector and 2.2 million “died”, or ceased to exist,
implying a net increase of about 400,000 fi rms.2 In comparison, in 2006, there were approximately
4.5 million enterprises in the sector. Since 2003, the difference between the birth rate and the
death rate (the net turnover rate) has been constantly positive in the euro area, albeit with marked
differences across countries.3 Most (around 98%) of births and deaths take place within the small
fi rm categories (which feature fi rms with up to four employees), while very few larger fi rms
enter the market. Nevertheless, the latter have a higher probability of surviving.
Most euro area countries have experienced a decrease in the number of small fi rms and an increase
in the number of larger ones, i.e. a consolidation process. This trend was most evident in those
countries where micro fi rms are predominant (Italy, Portugal and Spain). The aforementioned
consolidation process can be explained by either within class effects (small fi rms having a
negative net turnover rate and/or large fi rms having a positive net turnover rate) or between class effects (there are more small fi rms becoming large than there are large fi rms becoming small).4
The data reported in the table allow an understanding of how these two effects contributed to the
consolidation process between 1998 and 2006.5 In Italy, for example, both these effects were at
work: in particular, the smallest fi rms were characterised by both a negative net turnover rate and
an outfl ow of existing fi rms towards upper categories. In Portugal and Spain, the between class
1 It has been argued (e.g. in ECB (2011) and Bartelsman and Doms (2000)) that the shedding of less productive fi rms and the entry of
more productive ones (“creative destruction”) is a process that is an important driver of productivity, especially total factor productivity
growth.
2 Eurostat provides the number of active enterprises, the number of fi rm births and the number of fi rm deaths for the period from
1998 to 2007. According to the metadata, active fi rms are those ones whose value added is strictly positive, whereas fi rms are said
to have ceased to exist when they have not been active for at least two years. Employment class data are also available, but follow
an aggregation criterion which differs from the one adopted in the general SBS database: zero (the entrepreneur alone); one to four
workers; fi ve to nine workers; and above ten workers. Survival rates, plus the number of persons employed, are available for the non-
zero classes.
3 The distributive trades sector was more dynamic than average in Spain and France, where the net turnover rate was positive throughout
the whole sample (1998 to 2006), averaging 1.6 and 1.4 respectively. Finland and the Netherlands also recorded a positive turnover
rate. By contrast, the number of fi rm deaths exceeded the number of fi rm births in Italy, mainly owing to the strong contraction
experienced in the retail trade market here. Data for Germany are only available for 2005 and 2006 (thus a direct comparison with other
countries is inappropriate): the net turnover rate was close to zero in 2005 and slightly negative in 2006.
4 The between class effect is calculated as the difference between growth rates and turnover rates. For instance, it is generally observed
that the fi rst class is characterised by a positive turnover rate and a negative growth rate, implying migration towards upper classes.
5 The time series is not complete for all countries: the data for France are available from 1999, and those for Austria and Germany from
2004, while only the last two years are available for Belgium and Ireland.
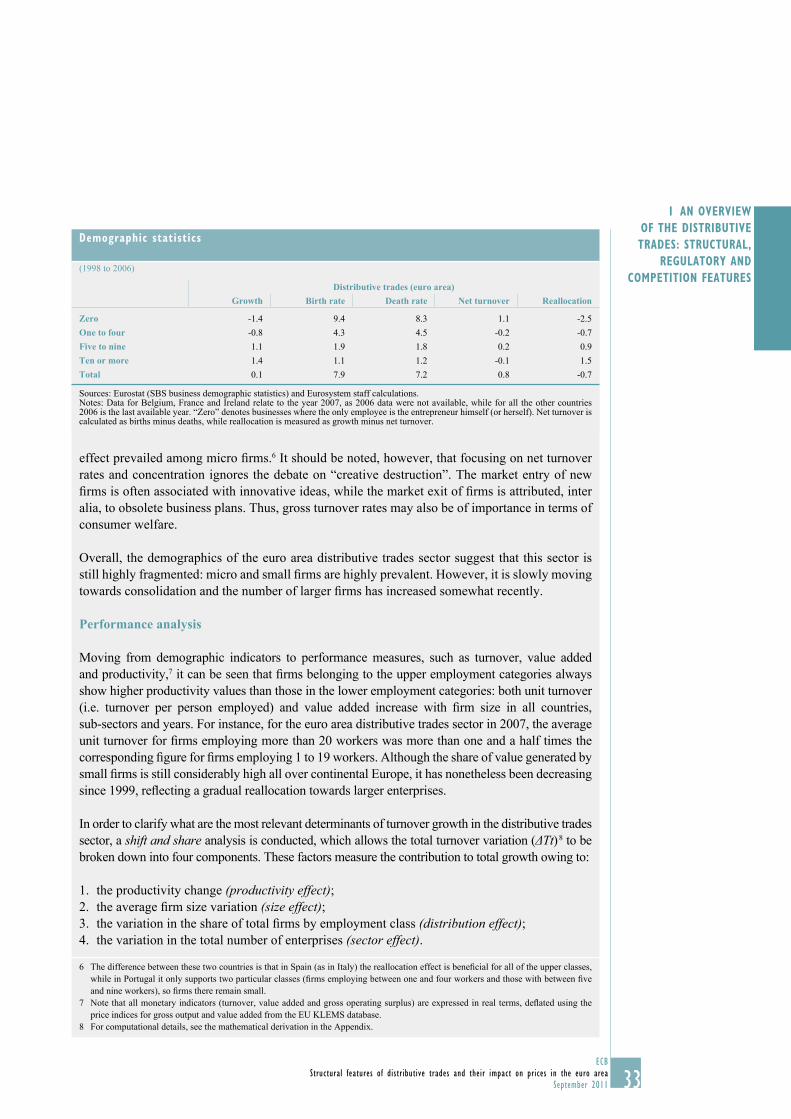
33ECB
Structural features of distributive trades and their impact on prices in the euro area
September 2011
I AN OVERVIEW
OF THE DISTRIBUTIVE
TRADES: STRUCTURAL,
REGULATORY AND
COMPETITION FEATURES
effect prevailed among micro fi rms.6 It should be noted, however, that focusing on net turnover
rates and concentration ignores the debate on “creative destruction”. The market entry of new
fi rms is often associated with innovative ideas, while the market exit of fi rms is attributed, inter
alia, to obsolete business plans. Thus, gross turnover rates may also be of importance in terms of
consumer welfare.
Overall, the demographics of the euro area distributive trades sector suggest that this sector is
still highly fragmented: micro and small fi rms are highly prevalent. However, it is slowly moving
towards consolidation and the number of larger fi rms has increased somewhat recently.
Performance analysis
Moving from demographic indicators to performance measures, such as turnover, value added
and productivity,7 it can be seen that fi rms belonging to the upper employment categories always
show higher productivity values than those in the lower employment categories: both unit turnover
(i.e. turnover per person employed) and value added increase with fi rm size in all countries,
sub-sectors and years. For instance, for the euro area distributive trades sector in 2007, the average
unit turnover for fi rms employing more than 20 workers was more than one and a half times the
corresponding fi gure for fi rms employing 1 to 19 workers. Although the share of value generated by
small fi rms is still considerably high all over continental Europe, it has nonetheless been decreasing
since 1999, refl ecting a gradual reallocation towards larger enterprises.
In order to clarify what are the most relevant determinants of turnover growth in the distributive trades
sector, a shift and share analysis is conducted, which allows the total turnover variation (ΔTt) 8 to be
broken down into four components. These factors measure the contribution to total growth owing to:
the productivity change 1. (productivity effect);the average fi rm size variation 2. (size effect);the variation in the share of total fi rms by employment class3. (distribution effect);the variation in the total number of enterprises 4. (sector effect).
6 The difference between these two countries is that in Spain (as in Italy) the reallocation effect is benefi cial for all of the upper classes,
while in Portugal it only supports two particular classes (fi rms employing between one and four workers and those with between fi ve
and nine workers), so fi rms there remain small.
7 Note that all monetary indicators (turnover, value added and gross operating surplus) are expressed in real terms, defl ated using the
price indices for gross output and value added from the EU KLEMS database.
8 For computational details, see the mathematical derivation in the Appendix.
Demographic statistics
(1998 to 2006)
Distributive trades (euro area)Growth Birth rate Death rate Net turnover Reallocation
Zero -1.4 9.4 8.3 1.1 -2.5
One to four -0.8 4.3 4.5 -0.2 -0.7
Five to nine 1.1 1.9 1.8 0.2 0.9
Ten or more 1.4 1.1 1.2 -0.1 1.5
Total 0.1 7.9 7.2 0.8 -0.7
Sources: Eurostat (SBS business demographic statistics) and Eurosystem staff calculations.Notes: Data for Belgium, France and Ireland relate to the year 2007, as 2006 data were not available, while for all the other countries 2006 is the last available year. “Zero” denotes businesses where the only employee is the entrepreneur himself (or herself). Net turnover is calculated as births minus deaths, while reallocation is measured as growth minus net turnover.
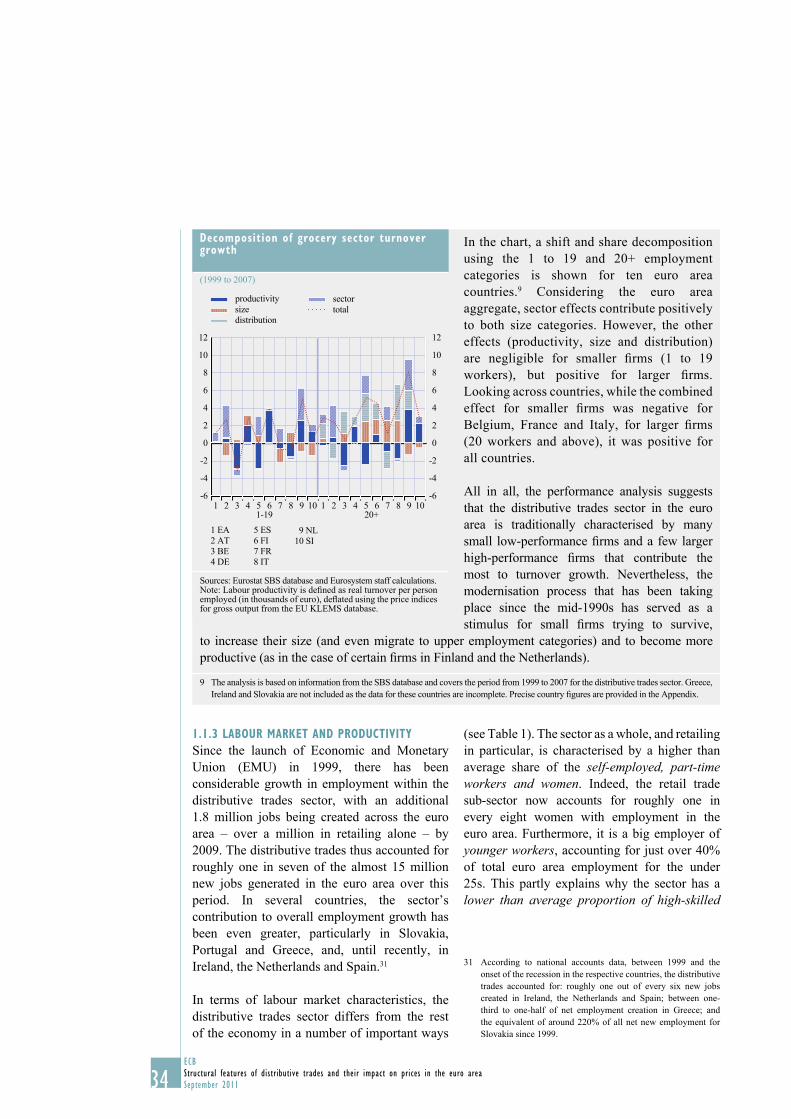
34ECB
Structural features of distributive trades and their impact on prices in the euro area
September 2011
1.1.3 LABOUR MARKET AND PRODUCTIVITY
Since the launch of Economic and Monetary
Union (EMU) in 1999, there has been
considerable growth in employment within the
distributive trades sector, with an additional
1.8 million jobs being created across the euro
area – over a million in retailing alone – by
2009. The distributive trades thus accounted for
roughly one in seven of the almost 15 million
new jobs generated in the euro area over this
period. In several countries, the sector’s
contribution to overall employment growth has
been even greater, particularly in Slovakia,
Portugal and Greece, and, until recently, in
Ireland, the Netherlands and Spain.31
In terms of labour market characteristics, the
distributive trades sector differs from the rest
of the economy in a number of important ways
(see Table 1). The sector as a whole, and retailing
in particular, is characterised by a higher than
average share of the self-employed, part-time workers and women. Indeed, the retail trade
sub-sector now accounts for roughly one in
every eight women with employment in the
euro area. Furthermore, it is a big employer of
younger workers, accounting for just over 40%
of total euro area employment for the under
25s. This partly explains why the sector has a
lower than average proportion of high-skilled
According to national accounts data, between 1999 and the 31
onset of the recession in the respective countries, the distributive
trades accounted for: roughly one out of every six new jobs
created in Ireland, the Netherlands and Spain; between one-
third to one-half of net employment creation in Greece; and
the equivalent of around 220% of all net new employment for
Slovakia since 1999.
In the chart, a shift and share decomposition
using the 1 to 19 and 20+ employment
categories is shown for ten euro area
countries.9 Considering the euro area
aggregate, sector effects contribute positively
to both size categories. However, the other
effects (productivity, size and distribution)
are negligible for smaller fi rms (1 to 19
workers), but positive for larger fi rms.
Looking across countries, while the combined
effect for smaller fi rms was negative for
Belgium, France and Italy, for larger fi rms
(20 workers and above), it was positive for
all countries.
All in all, the performance analysis suggests
that the distributive trades sector in the euro
area is traditionally characterised by many
small low-performance fi rms and a few larger
high-performance fi rms that contribute the
most to turnover growth. Nevertheless, the
modernisation process that has been taking
place since the mid-1990s has served as a
stimulus for small fi rms trying to survive,
to increase their size (and even migrate to upper employment categories) and to become more
productive (as in the case of certain fi rms in Finland and the Netherlands).
9 The analysis is based on information from the SBS database and covers the period from 1999 to 2007 for the distributive trades sector. Greece,
Ireland and Slovakia are not included as the data for these countries are incomplete. Precise country fi gures are provided in the Appendix.
Decomposition of grocery sector turnover growth
(1999 to 2007)
-6
-4
-2
0
2
4
6
8
10
12
-6
-4
-2
0
2
4
6
8
10
12
1 2 3 4 5 6 7 8 9 10 1 2 3 4 5 6 7 8 9 10
1 EA
2 AT
3 BE
4 DE
5 ES
6 FI
7 FR
8 IT
9 NL
10 SI
1-19 20+
productivity
size
distribution
sector
total
Sources: Eurostat SBS database and Eurosystem staff calculations.Note: Labour productivity is defi ned as real turnover per person employed (in thousands of euro), defl ated using the price indices for gross output from the EU KLEMS database.
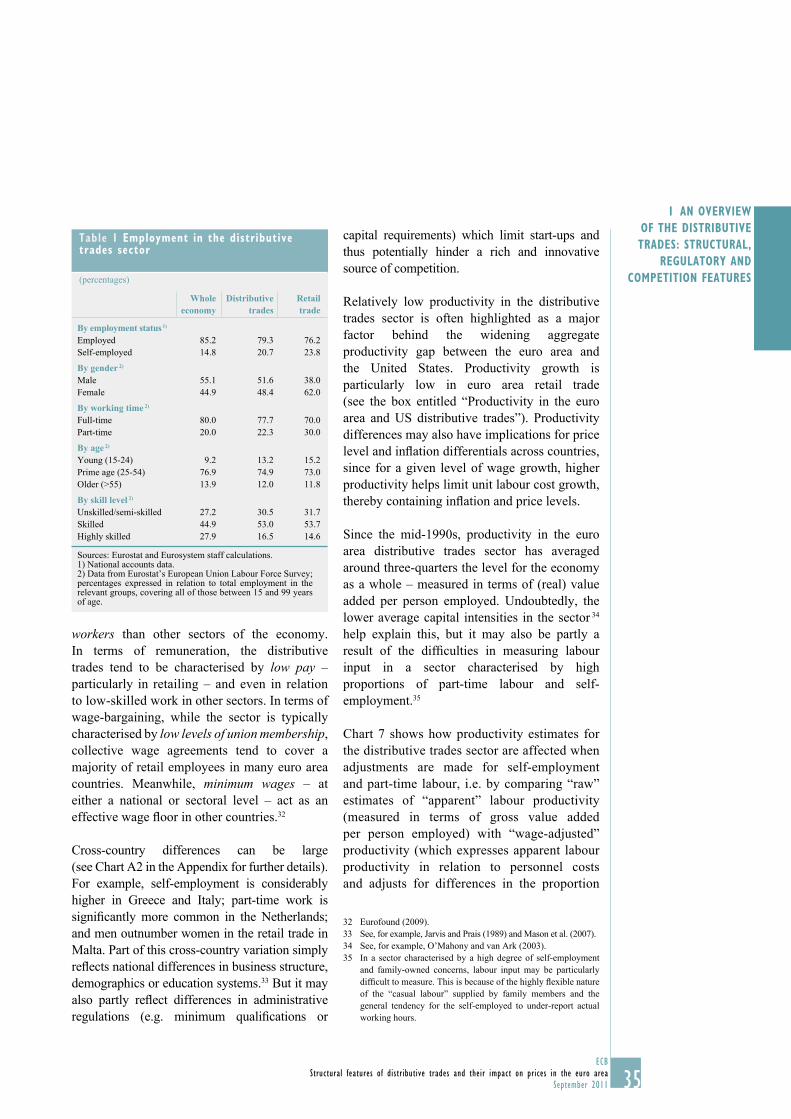
35ECB
Structural features of distributive trades and their impact on prices in the euro area
September 2011
I AN OVERVIEW
OF THE DISTRIBUTIVE
TRADES: STRUCTURAL,
REGULATORY AND
COMPETITION FEATURES
workers than other sectors of the economy.
In terms of remuneration, the distributive
trades tend to be characterised by low pay –
particularly in retailing – and even in relation
to low-skilled work in other sectors. In terms of
wage-bargaining, while the sector is typically
characterised by low levels of union membership,
collective wage agreements tend to cover a
majority of retail employees in many euro area
countries. Meanwhile, minimum wages – at
either a national or sectoral level – act as an
effective wage fl oor in other countries.32
Cross-country differences can be large
(see Chart A2 in the Appendix for further details).
For example, self-employment is considerably
higher in Greece and Italy; part-time work is
signifi cantly more common in the Netherlands;
and men outnumber women in the retail trade in
Malta. Part of this cross-country variation simply
refl ects national differences in business structure,
demographics or education systems.33 But it may
also partly refl ect differences in administrative
regulations (e.g. minimum qualifi cations or
capital requirements) which limit start-ups and
thus potentially hinder a rich and innovative
source of competition.
Relatively low productivity in the distributive
trades sector is often highlighted as a major
factor behind the widening aggregate
productivity gap between the euro area and
the United States. Productivity growth is
particularly low in euro area retail trade
(see the box entitled “Productivity in the euro
area and US distributive trades”). Productivity
differences may also have implications for price
level and infl ation differentials across countries,
since for a given level of wage growth, higher
productivity helps limit unit labour cost growth,
thereby containing infl ation and price levels.
Since the mid-1990s, productivity in the euro
area distributive trades sector has averaged
around three-quarters the level for the economy
as a whole – measured in terms of (real) value
added per person employed. Undoubtedly, the
lower average capital intensities in the sector 34
help explain this, but it may also be partly a
result of the diffi culties in measuring labour
input in a sector characterised by high
proportions of part-time labour and self-
employment.35
Chart 7 shows how productivity estimates for
the distributive trades sector are affected when
adjustments are made for self-employment
and part-time labour, i.e. by comparing “raw”
estimates of “apparent” labour productivity
(measured in terms of gross value added
per person employed) with “wage-adjusted”
productivity (which expresses apparent labour
productivity in relation to personnel costs
and adjusts for differences in the proportion
Eurofound (2009).32
See, for example, Jarvis and Prais (1989) and Mason et al. (2007).33
See, for example, O’Mahony and van Ark (2003).34
In a sector characterised by a high degree of self-employment 35
and family-owned concerns, labour input may be particularly
diffi cult to measure. This is because of the highly fl exible nature
of the “casual labour” supplied by family members and the
general tendency for the self-employed to under-report actual
working hours.
Table 1 Employment in the distributive trades sector
(percentages)
Whole economy
Distributive trades
Retail trade
By employment status 1)
Employed 85.2 79.3 76.2
Self-employed 14.8 20.7 23.8
By gender 2)
Male 55.1 51.6 38.0
Female 44.9 48.4 62.0
By working time 2)
Full-time 80.0 77.7 70.0
Part-time 20.0 22.3 30.0
By age 2)
Young (15-24) 9.2 13.2 15.2
Prime age (25-54) 76.9 74.9 73.0
Older (>55) 13.9 12.0 11.8
By skill level 2)
Unskilled/semi-skilled 27.2 30.5 31.7
Skilled 44.9 53.0 53.7
Highly skilled 27.9 16.5 14.6
Sources: Eurostat and Eurosystem staff calculations.1) National accounts data.2) Data from Eurostat’s European Union Labour Force Survey; percentages expressed in relation to total employment in the relevant groups, covering all of those between 15 and 99 years of age.
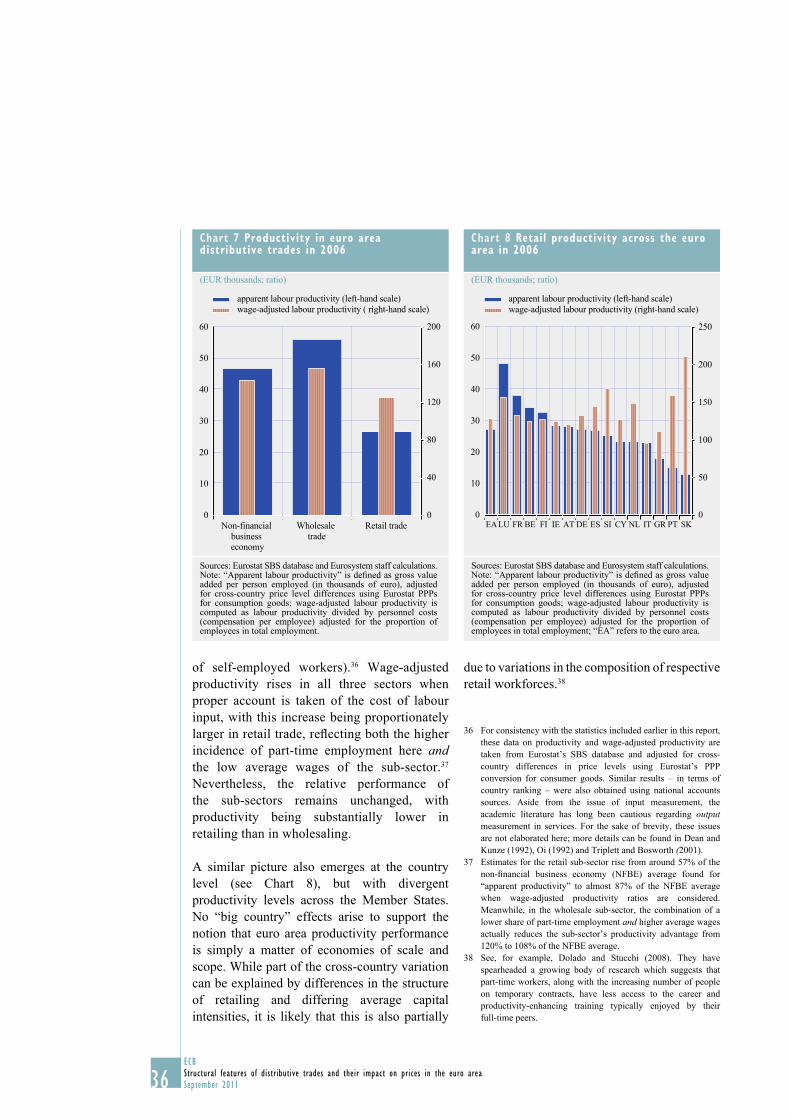
36ECB
Structural features of distributive trades and their impact on prices in the euro area
September 2011
of self-employed workers).36 Wage-adjusted
productivity rises in all three sectors when
proper account is taken of the cost of labour
input, with this increase being proportionately
larger in retail trade, refl ecting both the higher
incidence of part-time employment here and
the low average wages of the sub-sector.37
Nevertheless, the relative performance of
the sub-sectors remains unchanged, with
productivity being substantially lower in
retailing than in wholesaling.
A similar picture also emerges at the country
level (see Chart 8), but with divergent
productivity levels across the Member States.
No “big country” effects arise to support the
notion that euro area productivity performance
is simply a matter of economies of scale and
scope. While part of the cross-country variation
can be explained by differences in the structure
of retailing and differing average capital
intensities, it is likely that this is also partially
due to variations in the composition of respective
retail workforces.38
For consistency with the statistics included earlier in this report, 36
these data on productivity and wage-adjusted productivity are
taken from Eurostat’s SBS database and adjusted for cross-
country differences in price levels using Eurostat’s PPP
conversion for consumer goods. Similar results – in terms of
country ranking – were also obtained using national accounts
sources. Aside from the issue of input measurement, the
academic literature has long been cautious regarding output measurement in services. For the sake of brevity, these issues
are not elaborated here; more details can be found in Dean and
Kunze (1992), Oi (1992) and Triplett and Bosworth (2001).
Estimates for the retail sub-sector rise from around 57% of the 37
non-fi nancial business economy (NFBE) average found for
“apparent productivity” to almost 87% of the NFBE average
when wage-adjusted productivity ratios are considered.
Meanwhile, in the wholesale sub-sector, the combination of a
lower share of part-time employment and higher average wages
actually reduces the sub-sector’s productivity advantage from
120% to 108% of the NFBE average.
See, for example, Dolado and Stucchi (2008). They have 38
spearheaded a growing body of research which suggests that
part-time workers, along with the increasing number of people
on temporary contracts, have less access to the career and
productivity-enhancing training typically enjoyed by their
full-time peers.
Chart 7 Productivity in euro area distributive trades in 2006
(EUR thousands; ratio)
0
10
20
30
40
50
60
0
40
80
120
160
200
Non-financial
business
economy
Wholesale
trade
Retail trade
apparent labour productivity (left-hand scale)
wage-adjusted labour productivity ( right-hand scale)
Sources: Eurostat SBS database and Eurosystem staff calculations.Note: “Apparent labour productivity” is defi ned as gross value added per person employed (in thousands of euro), adjusted for cross-country price level differences using Eurostat PPPs for consumption goods; wage-adjusted labour productivity is computed as labour productivity divided by personnel costs (compensation per employee) adjusted for the proportion of employees in total employment.
Chart 8 Retail productivity across the euro area in 2006
(EUR thousands; ratio)
0
10
20
30
40
50
60
EALU FR BE FI IE AT DE ES SI CY NL IT GR PT SK 0
50
100
150
200
250
apparent labour productivity (left-hand scale)
wage-adjusted labour productivity (right-hand scale)
Sources: Eurostat SBS database and Eurosystem staff calculations.Note: “Apparent labour productivity” is defi ned as gross value added per person employed (in thousands of euro), adjusted for cross-country price level differences using Eurostat PPPs for consumption goods; wage-adjusted labour productivity is computed as labour productivity divided by personnel costs (compensation per employee) adjusted for the proportion of employees in total employment; “EA” refers to the euro area.
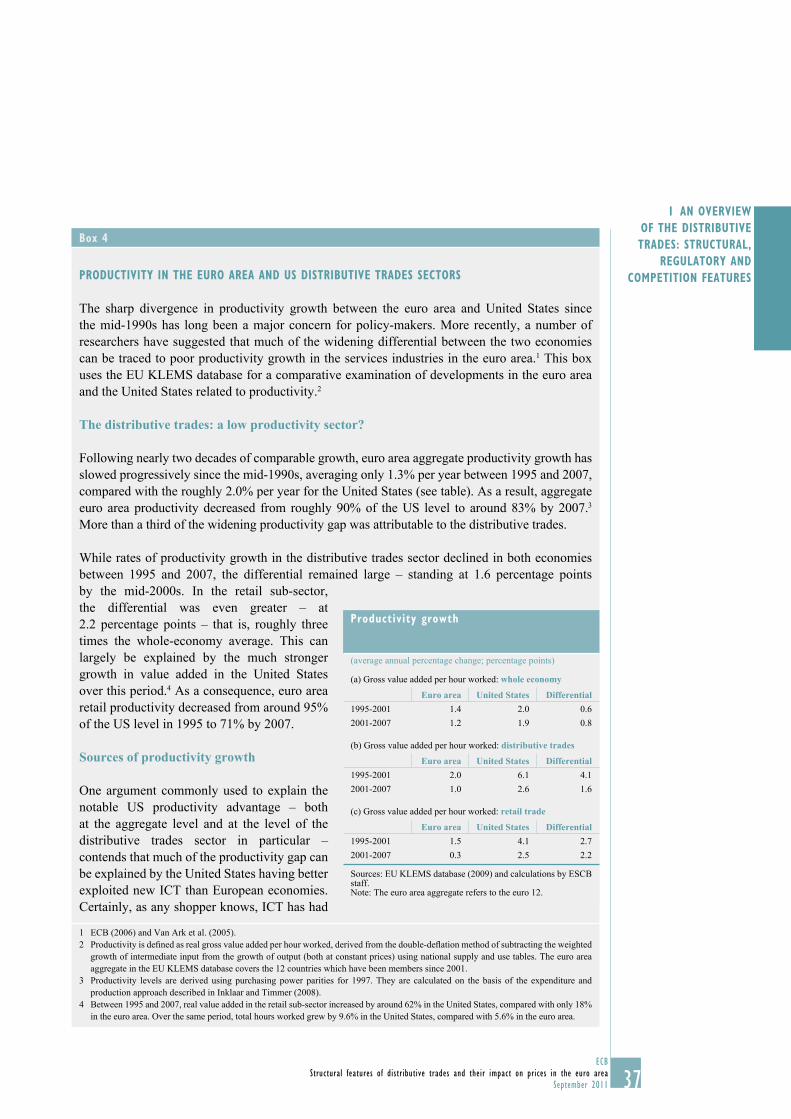
37ECB
Structural features of distributive trades and their impact on prices in the euro area
September 2011
I AN OVERVIEW
OF THE DISTRIBUTIVE
TRADES: STRUCTURAL,
REGULATORY AND
COMPETITION FEATURES
Box 4
PRODUCTIVITY IN THE EURO AREA AND US DISTRIBUTIVE TRADES SECTORS
The sharp divergence in productivity growth between the euro area and United States since
the mid-1990s has long been a major concern for policy-makers. More recently, a number of
researchers have suggested that much of the widening differential between the two economies
can be traced to poor productivity growth in the services industries in the euro area.1 This box
uses the EU KLEMS database for a comparative examination of developments in the euro area
and the United States related to productivity.2
The distributive trades: a low productivity sector?
Following nearly two decades of comparable growth, euro area aggregate productivity growth has
slowed progressively since the mid-1990s, averaging only 1.3% per year between 1995 and 2007,
compared with the roughly 2.0% per year for the United States (see table). As a result, aggregate
euro area productivity decreased from roughly 90% of the US level to around 83% by 2007.3
More than a third of the widening productivity gap was attributable to the distributive trades.
While rates of productivity growth in the distributive trades sector declined in both economies
between 1995 and 2007, the differential remained large – standing at 1.6 percentage points
by the mid-2000s. In the retail sub-sector,
the differential was even greater – at
2.2 percentage points – that is, roughly three
times the whole-economy average. This can
largely be explained by the much stronger
growth in value added in the United States
over this period.4 As a consequence, euro area
retail productivity decreased from around 95%
of the US level in 1995 to 71% by 2007.
Sources of productivity growth
One argument commonly used to explain the
notable US productivity advantage – both
at the aggregate level and at the level of the
distributive trades sector in particular –
contends that much of the productivity gap can
be explained by the United States having better
exploited new ICT than European economies.
Certainly, as any shopper knows, ICT has had
1 ECB (2006) and Van Ark et al. (2005).
2 Productivity is defi ned as real gross value added per hour worked, derived from the double-defl ation method of subtracting the weighted
growth of intermediate input from the growth of output (both at constant prices) using national supply and use tables. The euro area
aggregate in the EU KLEMS database covers the 12 countries which have been members since 2001.
3 Productivity levels are derived using purchasing power parities for 1997. They are calculated on the basis of the expenditure and
production approach described in Inklaar and Timmer (2008).
4 Between 1995 and 2007, real value added in the retail sub-sector increased by around 62% in the United States, compared with only 18%
in the euro area. Over the same period, total hours worked grew by 9.6% in the United States, compared with 5.6% in the euro area.
Productivity growth
(average annual percentage change; percentage points)
(a) Gross value added per hour worked: whole economy
Euro area United States Differential1995-2001 1.4 2.0 0.6
2001-2007 1.2 1.9 0.8
(b) Gross value added per hour worked: distributive trades
Euro area United States Differential1995-2001 2.0 6.1 4.1
2001-2007 1.0 2.6 1.6
(c) Gross value added per hour worked: retail trade
Euro area United States Differential1995-2001 1.5 4.1 2.7
2001-2007 0.3 2.5 2.2
Sources: EU KLEMS database (2009) and calculations by ESCB staff.Note: The euro area aggregate refers to the euro 12.
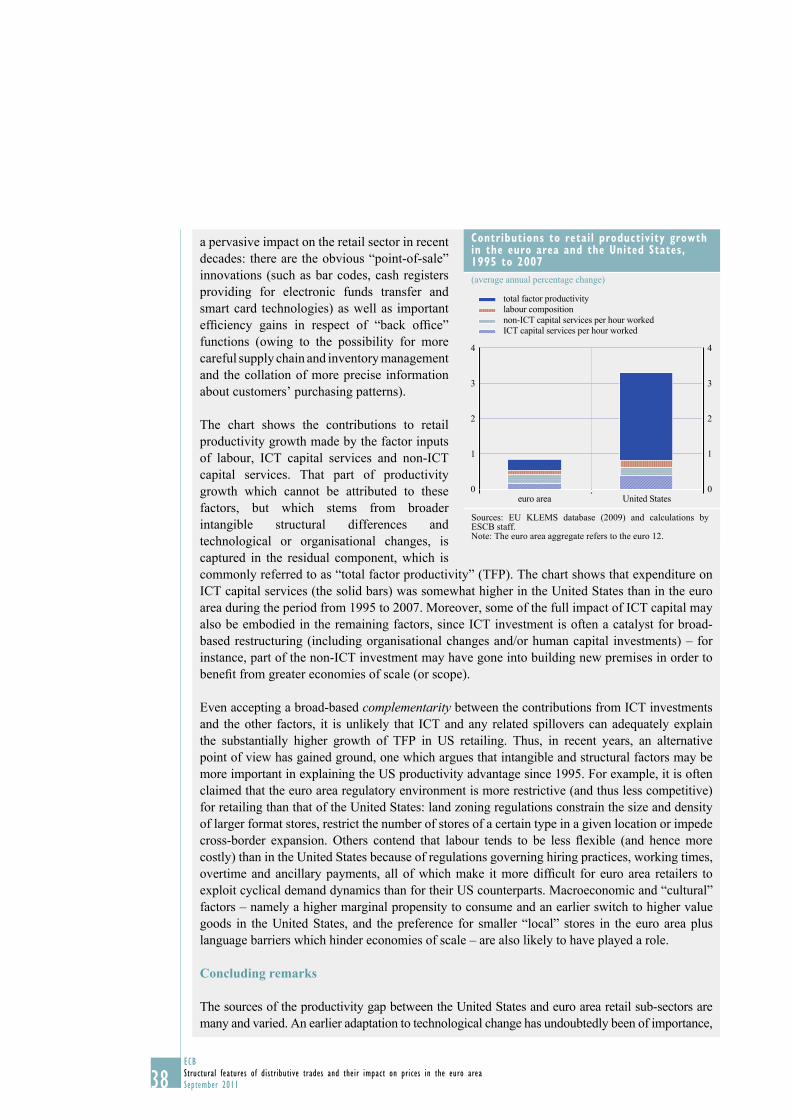
38ECB
Structural features of distributive trades and their impact on prices in the euro area
September 2011
a pervasive impact on the retail sector in recent
decades: there are the obvious “point-of-sale”
innovations (such as bar codes, cash registers
providing for electronic funds transfer and
smart card technologies) as well as important
effi ciency gains in respect of “back offi ce”
functions (owing to the possibility for more
careful supply chain and inventory management
and the collation of more precise information
about customers’ purchasing patterns).
The chart shows the contributions to retail
productivity growth made by the factor inputs
of labour, ICT capital services and non-ICT
capital services. That part of productivity
growth which cannot be attributed to these
factors, but which stems from broader
intangible structural differences and
technological or organisational changes, is
captured in the residual component, which is
commonly referred to as “total factor productivity” (TFP). The chart shows that expenditure on
ICT capital services (the solid bars) was somewhat higher in the United States than in the euro
area during the period from 1995 to 2007. Moreover, some of the full impact of ICT capital may
also be embodied in the remaining factors, since ICT investment is often a catalyst for broad-
based restructuring (including organisational changes and/or human capital investments) – for
instance, part of the non-ICT investment may have gone into building new premises in order to
benefi t from greater economies of scale (or scope).
Even accepting a broad-based complementarity between the contributions from ICT investments
and the other factors, it is unlikely that ICT and any related spillovers can adequately explain
the substantially higher growth of TFP in US retailing. Thus, in recent years, an alternative
point of view has gained ground, one which argues that intangible and structural factors may be
more important in explaining the US productivity advantage since 1995. For example, it is often
claimed that the euro area regulatory environment is more restrictive (and thus less competitive)
for retailing than that of the United States: land zoning regulations constrain the size and density
of larger format stores, restrict the number of stores of a certain type in a given location or impede
cross-border expansion. Others contend that labour tends to be less fl exible (and hence more
costly) than in the United States because of regulations governing hiring practices, working times,
overtime and ancillary payments, all of which make it more diffi cult for euro area retailers to
exploit cyclical demand dynamics than for their US counterparts. Macroeconomic and “cultural”
factors – namely a higher marginal propensity to consume and an earlier switch to higher value
goods in the United States, and the preference for smaller “local” stores in the euro area plus
language barriers which hinder economies of scale – are also likely to have played a role.
Concluding remarks
The sources of the productivity gap between the United States and euro area retail sub-sectors are
many and varied. An earlier adaptation to technological change has undoubtedly been of importance,
Contributions to retail productivity growth in the euro area and the United States, 1995 to 2007
(average annual percentage change)
0
1
2
3
4
0
1
2
3
4
euro area United States
total factor productivity
labour composition
non-ICT capital services per hour worked
ICT capital services per hour worked
Sources: EU KLEMS database (2009) and calculations by ESCB staff.Note: The euro area aggregate refers to the euro 12.
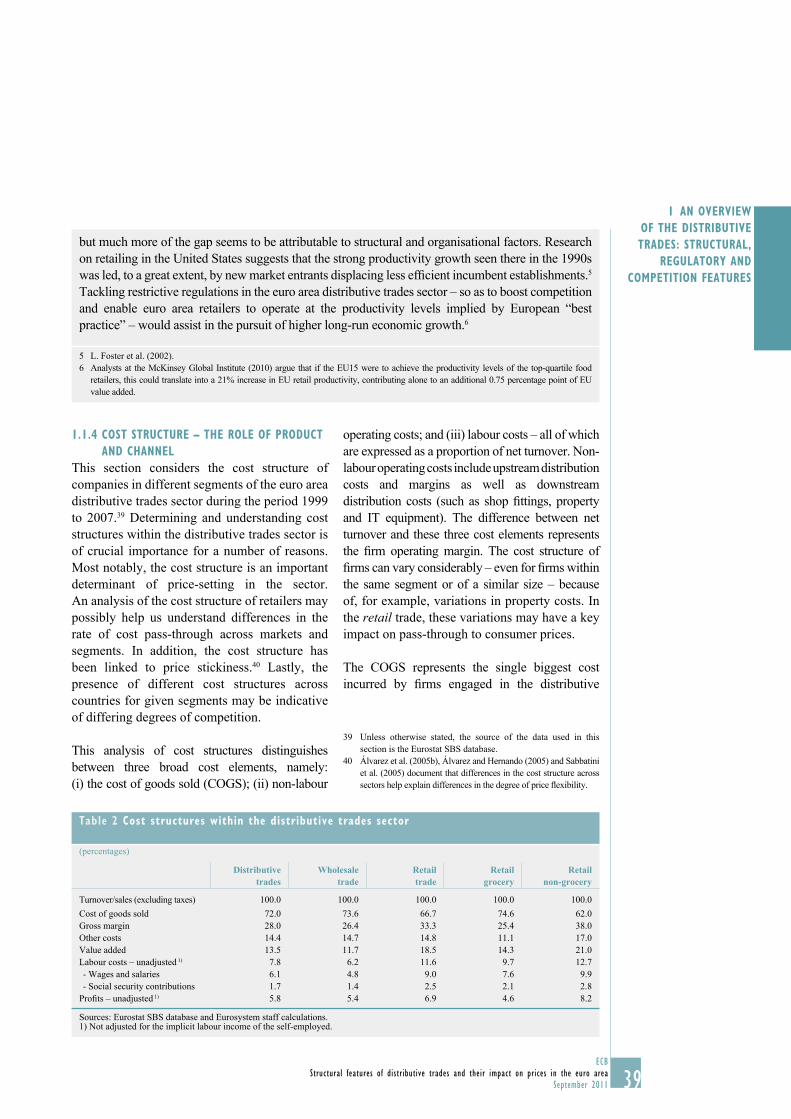
39ECB
Structural features of distributive trades and their impact on prices in the euro area
September 2011
I AN OVERVIEW
OF THE DISTRIBUTIVE
TRADES: STRUCTURAL,
REGULATORY AND
COMPETITION FEATURES
1.1.4 COST STRUCTURE – THE ROLE OF PRODUCT
AND CHANNEL
This section considers the cost structure of
companies in different segments of the euro area
distributive trades sector during the period 1999
to 2007.39 Determining and understanding cost
structures within the distributive trades sector is
of crucial importance for a number of reasons.
Most notably, the cost structure is an important
determinant of price-setting in the sector.
An analysis of the cost structure of retailers may
possibly help us understand differences in the
rate of cost pass-through across markets and
segments. In addition, the cost structure has
been linked to price stickiness.40 Lastly, the
presence of different cost structures across
countries for given segments may be indicative
of differing degrees of competition.
This analysis of cost structures distinguishes
between three broad cost elements, namely:
(i) the cost of goods sold (COGS); (ii) non-labour
operating costs; and (iii) labour costs – all of which
are expressed as a proportion of net turnover. Non-
labour operating costs include upstream distribution
costs and margins as well as downstream
distribution costs (such as shop fi ttings, property
and IT equipment). The difference between net
turnover and these three cost elements represents
the fi rm operating margin. The cost structure of
fi rms can vary considerably – even for fi rms within
the same segment or of a similar size – because
of, for example, variations in property costs. In
the retail trade, these variations may have a key
impact on pass-through to consumer prices.
The COGS represents the single biggest cost
incurred by fi rms engaged in the distributive
Unless otherwise stated, the source of the data used in this 39
section is the Eurostat SBS database.
Álvarez et al. (2005b), Álvarez and Hernando (2005) and Sabbatini 40
et al. (2005) document that differences in the cost structure across
sectors help explain differences in the degree of price fl exibility.
but much more of the gap seems to be attributable to structural and organisational factors. Research
on retailing in the United States suggests that the strong productivity growth seen there in the 1990s
was led, to a great extent, by new market entrants displacing less effi cient incumbent establishments.5
Tackling restrictive regulations in the euro area distributive trades sector – so as to boost competition
and enable euro area retailers to operate at the productivity levels implied by European “best
practice” – would assist in the pursuit of higher long-run economic growth.6
5 L. Foster et al. (2002).
6 Analysts at the McKinsey Global Institute (2010) argue that if the EU15 were to achieve the productivity levels of the top-quartile food
retailers, this could translate into a 21% increase in EU retail productivity, contributing alone to an additional 0.75 percentage point of EU
value added.
Table 2 Cost structures within the distributive trades sector
(percentages)
Distributive trades
Wholesaletrade
Retail trade
Retail grocery
Retail non-grocery
Turnover/sales (excluding taxes) 100.0 100.0 100.0 100.0 100.0
Cost of goods sold 72.0 73.6 66.7 74.6 62.0
Gross margin 28.0 26.4 33.3 25.4 38.0
Other costs 14.4 14.7 14.8 11.1 17.0
Value added 13.5 11.7 18.5 14.3 21.0
Labour costs – unadjusted 1) 7.8 6.2 11.6 9.7 12.7
- Wages and salaries 6.1 4.8 9.0 7.6 9.9
- Social security contributions 1.7 1.4 2.5 2.1 2.8
Profi ts – unadjusted 1) 5.8 5.4 6.9 4.6 8.2
Sources: Eurostat SBS database and Eurosystem staff calculations.1) Not adjusted for the implicit labour income of the self-employed.
40ECB
Structural features of distributive trades and their impact on prices in the euro area
September 2011
trades, albeit with some variation in its share of
turnover being evident across the individual sub-
sectors (see Table 2). Within retailing, a further
difference is to be found between the grocery
trade, which covers the sale of non-specialised
food, beverages and tobacco products, and other
retail trades. The 75% COGS share for grocery
retailing is substantially higher than that for
most other retail markets, which varies between
55.5% for textiles and 62.6% for DIY (hardware,
paints and glass) – see Table A4 and Table A5
in the Appendix. The electronics and appliances
market is a notable exception: here, the COGS
accounts for around 72% of sales. The higher
COGS share for grocery and electronics and
appliances retailing most likely refl ects the more
internationalised, effi cient and concentrated
nature of these retail markets (see Section 1.3 on
concentration and competition), which helps to
drive down costs, including unit labour costs.
Value added accounts for 13.5% of total turnover
for the distributive trades. Of the main sub-
sectors, retail trade has the highest ratio of value
added to total turnover, at 18.5%, and within the
retail sub-sector itself this ratio is highest for the
clothing trade, at 23.6%. In line with the labour-
intensive nature of activity within the distributive
trades sector, value added is largely attributed
to labour costs (58%). The magnitude of the
labour cost component differs somewhat across
the various distributive trades; for example, it
amounts to 9.7% for grocery retailing and to
12.7% for non-grocery retailing.
Some variation in profi t margins across the
distributive trades sector is also evident. Profi t
margins are highest in the retail sub-sector, at
6.9%. However, this is partly due to the higher
degree of self-employment in this sub-sector
and its impact on unadjusted profi t margins –
see Section 1.3 for a more detailed discussion of
profi t margins. Within the retail sub-sector, the
specialised food, beverages and tobacco trade
has the highest retail margin, at 10.3%. This is
followed by the pharmacy trade, which delivers
a margin of 9.2%. Conversely, profi t margin
levels in the grocery trade were lower, at 4.6%.
It should be noted, however, that an analysis of
the profi tability of the grocery market solely on
the basis of profi t margins can prove somewhat
misleading, as it is necessary to take into
consideration the typically high turnover (per
unit of capital employed) involved. Hence, in
this case, the rate of return on capital may
provide a more realistic picture of profi tability.
Table A6 and Table A7 in the Appendix present
a breakdown of the cost structure for,
respectively, grocery retailing and non-grocery
retailing in euro area countries. Furthermore, it
should be noted that the analysis of the cost
structure presented in this section refers to
average fi gures for all fi rms, irrespective of size.
A study of the operating cost profi les of retail
operations in Ireland suggests that operating
costs can vary considerably with fi rm size.41
1.2 REGULATION IN THE DISTRIBUTIVE TRADES
SECTOR
This section considers the regulatory features of the distributive trades sector. A large number of areas of activity are subject to specifi c regulations in this sector, covering issues as diverse as planning permission, the setting-up of establishments, contractual relationships with suppliers, price controls and conditions for promotions and sales. While there is clear evidence of an easing in the degree of product market regulation across almost all countries, there remains scope for further progress.
Although some regulation is required to ensure
the smooth functioning of markets, too much of
it can generate numerous obstacles that hinder
competition and overly favour incumbents.
According to Forfás (2008), labour and property costs 41
represented the two largest costs, regardless of the size of the
retail outlet, albeit with considerable variation in terms of the
proportion of operating costs absorbed. In the case of labour
costs, the variance ranged from 32% for retail parks to a high of
60% for multiples. Another cost differing sharply across retail
formats was property costs, which varied from 16% for multiple
retailers to 32% for the convenience store format. Variability in
transportation and distribution costs was also quite pronounced,
with such costs being largest for retail parks.
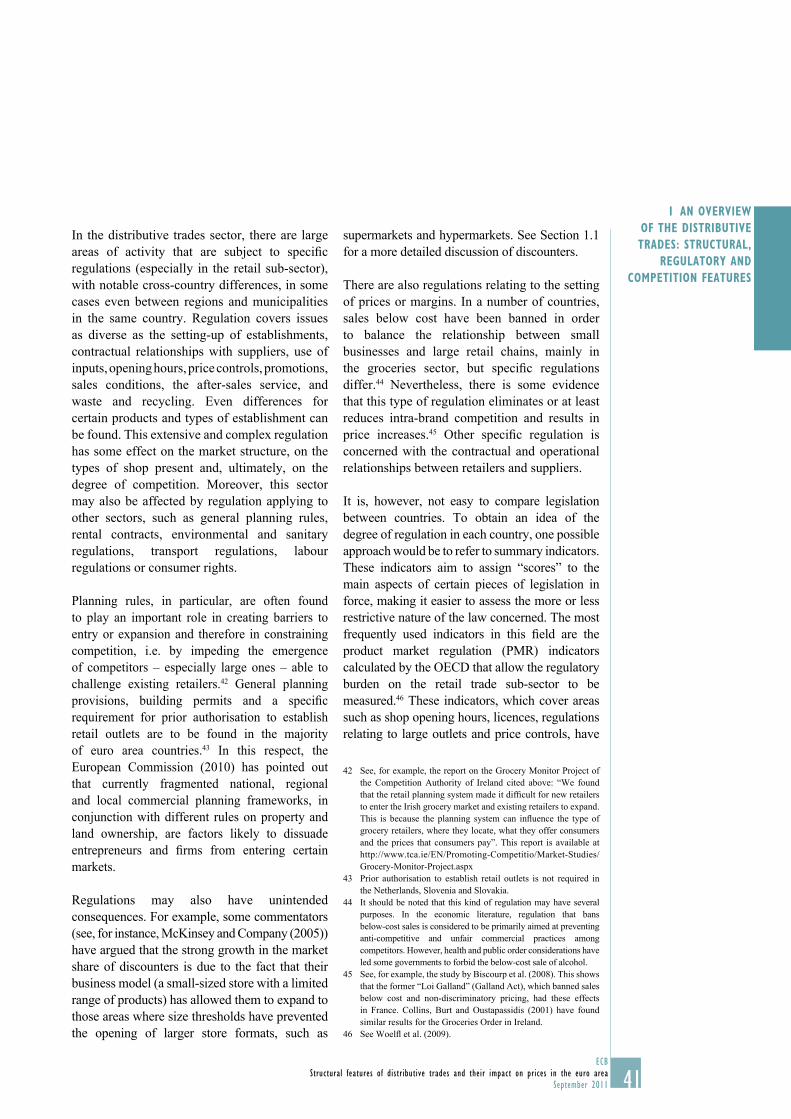
41ECB
Structural features of distributive trades and their impact on prices in the euro area
September 2011
I AN OVERVIEW
OF THE DISTRIBUTIVE
TRADES: STRUCTURAL,
REGULATORY AND
COMPETITION FEATURES
In the distributive trades sector, there are large
areas of activity that are subject to specifi c
regulations (especially in the retail sub-sector),
with notable cross-country differences, in some
cases even between regions and municipalities
in the same country. Regulation covers issues
as diverse as the setting-up of establishments,
contractual relationships with suppliers, use of
inputs, opening hours, price controls, promotions,
sales conditions, the after-sales service, and
waste and recycling. Even differences for
certain products and types of establishment can
be found. This extensive and complex regulation
has some effect on the market structure, on the
types of shop present and, ultimately, on the
degree of competition. Moreover, this sector
may also be affected by regulation applying to
other sectors, such as general planning rules,
rental contracts, environmental and sanitary
regulations, transport regulations, labour
regulations or consumer rights.
Planning rules, in particular, are often found
to play an important role in creating barriers to
entry or expansion and therefore in constraining
competition, i.e. by impeding the emergence
of competitors – especially large ones – able to
challenge existing retailers.42 General planning
provisions, building permits and a specifi c
requirement for prior authorisation to establish
retail outlets are to be found in the majority
of euro area countries.43 In this respect, the
European Commission (2010) has pointed out
that currently fragmented national, regional
and local commercial planning frameworks, in
conjunction with different rules on property and
land ownership, are factors likely to dissuade
entrepreneurs and fi rms from entering certain
markets.
Regulations may also have unintended
consequences. For example, some commentators
(see, for instance, McKinsey and Company (2005))
have argued that the strong growth in the market
share of discounters is due to the fact that their
business model (a small-sized store with a limited
range of products) has allowed them to expand to
those areas where size thresholds have prevented
the opening of larger store formats, such as
supermarkets and hypermarkets. See Section 1.1
for a more detailed discussion of discounters.
There are also regulations relating to the setting
of prices or margins. In a number of countries,
sales below cost have been banned in order
to balance the relationship between small
businesses and large retail chains, mainly in
the groceries sector, but specifi c regulations
differ.44 Nevertheless, there is some evidence
that this type of regulation eliminates or at least
reduces intra-brand competition and results in
price increases.45 Other specifi c regulation is
concerned with the contractual and operational
relationships between retailers and suppliers.
It is, however, not easy to compare legislation
between countries. To obtain an idea of the
degree of regulation in each country, one possible
approach would be to refer to summary indicators.
These indicators aim to assign “scores” to the
main aspects of certain pieces of legislation in
force, making it easier to assess the more or less
restrictive nature of the law concerned. The most
frequently used indicators in this fi eld are the
product market regulation (PMR) indicators
calculated by the OECD that allow the regulatory
burden on the retail trade sub-sector to be
measured.46 These indicators, which cover areas
such as shop opening hours, licences, regulations
relating to large outlets and price controls, have
See, for example, the report on the Grocery Monitor Project of 42
the Competition Authority of Ireland cited above: “We found
that the retail planning system made it diffi cult for new retailers
to enter the Irish grocery market and existing retailers to expand.
This is because the planning system can infl uence the type of
grocery retailers, where they locate, what they offer consumers
and the prices that consumers pay”. This report is available at
http://www.tca.ie/EN/Promoting-Competitio/Market-Studies/
Grocery-Monitor-Project.aspx
Prior authorisation to establish retail outlets is not required in 43
the Netherlands, Slovenia and Slovakia.
It should be noted that this kind of regulation may have several 44
purposes. In the economic literature, regulation that bans
below-cost sales is considered to be primarily aimed at preventing
anti-competitive and unfair commercial practices among
competitors. However, health and public order considerations have
led some governments to forbid the below-cost sale of alcohol.
See, for example, the study by Biscourp et al. (2008). This shows 45
that the former “Loi Galland” (Galland Act), which banned sales
below cost and non-discriminatory pricing, had these effects
in France. Collins, Burt and Oustapassidis (2001) have found
similar results for the Groceries Order in Ireland.
See Woelfl et al. (2009).46
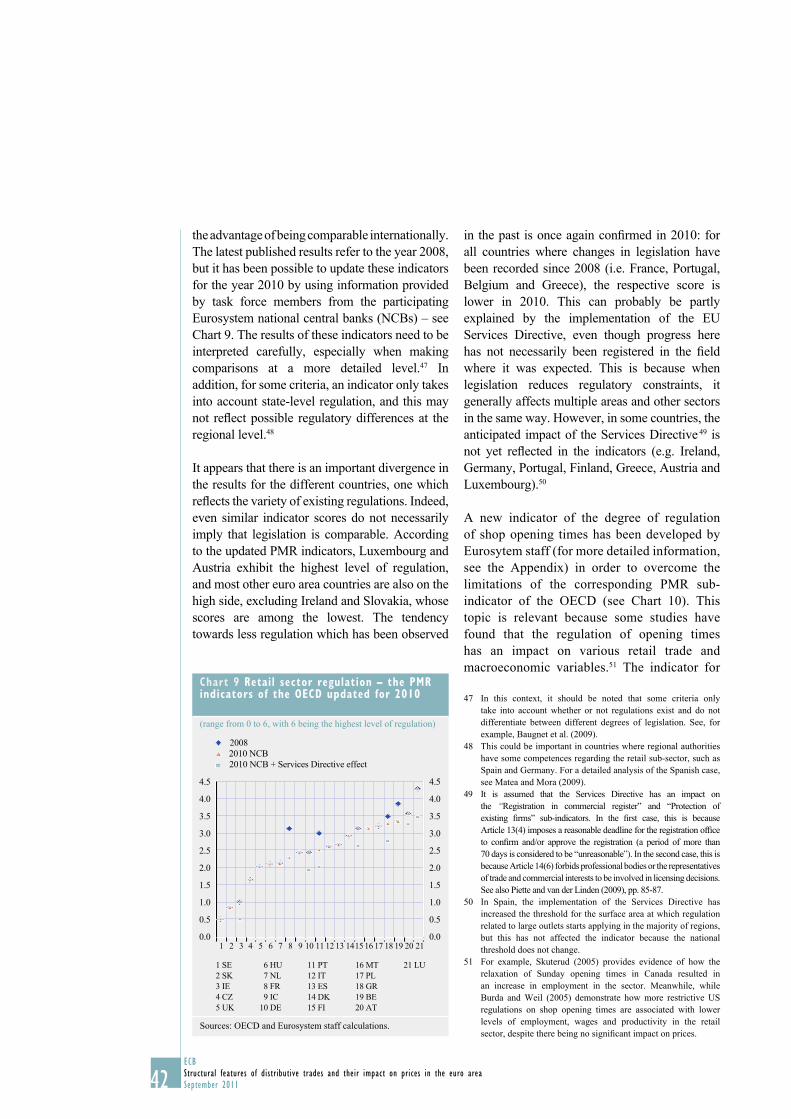
42ECB
Structural features of distributive trades and their impact on prices in the euro area
September 2011
the advantage of being comparable internationally.
The latest published results refer to the year 2008,
but it has been possible to update these indicators
for the year 2010 by using information provided
by task force members from the participating
Eurosystem national central banks (NCBs) – see
Chart 9. The results of these indicators need to be
interpreted carefully, especially when making
comparisons at a more detailed level.47 In
addition, for some criteria, an indicator only takes
into account state-level regulation, and this may
not refl ect possible regulatory differences at the
regional level.48
It appears that there is an important divergence in
the results for the different countries, one which
refl ects the variety of existing regulations. Indeed,
even similar indicator scores do not necessarily
imply that legislation is comparable. According
to the updated PMR indicators, Luxembourg and
Austria exhibit the highest level of regulation,
and most other euro area countries are also on the
high side, excluding Ireland and Slovakia, whose
scores are among the lowest. The tendency
towards less regulation which has been observed
in the past is once again confi rmed in 2010: for
all countries where changes in legislation have
been recorded since 2008 (i.e. France, Portugal,
Belgium and Greece), the respective score is
lower in 2010. This can probably be partly
explained by the implementation of the EU
Services Directive, even though progress here
has not necessarily been registered in the fi eld
where it was expected. This is because when
legislation reduces regulatory constraints, it
generally affects multiple areas and other sectors
in the same way. However, in some countries, the
anticipated impact of the Services Directive 49 is
not yet refl ected in the indicators (e.g. Ireland,
Germany, Portugal, Finland, Greece, Austria and
Luxembourg).50
A new indicator of the degree of regulation
of shop opening times has been developed by
Eurosytem staff (for more detailed information,
see the Appendix) in order to overcome the
limitations of the corresponding PMR sub-
indicator of the OECD (see Chart 10). This
topic is relevant because some studies have
found that the regulation of opening times
has an impact on various retail trade and
macroeconomic variables.51 The indicator for
In this context, it should be noted that some criteria only 47
take into account whether or not regulations exist and do not
differentiate between different degrees of legislation. See, for
example, Baugnet et al. (2009).
This could be important in countries where regional authorities 48
have some competences regarding the retail sub-sector, such as
Spain and Germany. For a detailed analysis of the Spanish case,
see Matea and Mora (2009).
It is assumed that the Services Directive has an impact on 49
the “Registration in commercial register” and “Protection of
existing fi rms” sub-indicators. In the fi rst case, this is because
Article 13(4) imposes a reasonable deadline for the registration offi ce
to confi rm and/or approve the registration (a period of more than
70 days is considered to be “unreasonable”). In the second case, this is
because Article 14(6) forbids professional bodies or the representatives
of trade and commercial interests to be involved in licensing decisions.
See also Piette and van der Linden (2009), pp. 85-87.
In Spain, the implementation of the Services Directive has 50
increased the threshold for the surface area at which regulation
related to large outlets starts applying in the majority of regions,
but this has not affected the indicator because the national
threshold does not change.
For example, Skuterud (2005) provides evidence of how the 51
relaxation of Sunday opening times in Canada resulted in
an increase in employment in the sector. Meanwhile, while
Burda and Weil (2005) demonstrate how more restrictive US
regulations on shop opening times are associated with lower
levels of employment, wages and productivity in the retail
sector, despite there being no signifi cant impact on prices.
Chart 9 Retail sector regulation – the PMR indicators of the OECD updated for 2010
(range from 0 to 6, with 6 being the highest level of regulation)
0.0
0.5
1.0
1.5
2.0
2.5
3.0
3.5
4.0
4.5
0.0
0.5
1.0
1.5
2.0
2.5
3.0
3.5
4.0
4.5
1 SE
2 SK
3 IE
4 CZ
5 UK
6 HU
7 NL
8 FR
9 IC
10 DE
11 PT
12 IT
13 ES
14 DK
15 FI
21 LU
2008
2010 NCB
2010 NCB + Services Directive effect
16 MT
17 PL
18 GR
19 BE
20 AT
1 2 3 4 5 6 7 8 9 10 11 12 13 1415 16 17 18 19 20 21
Sources: OECD and Eurosystem staff calculations.
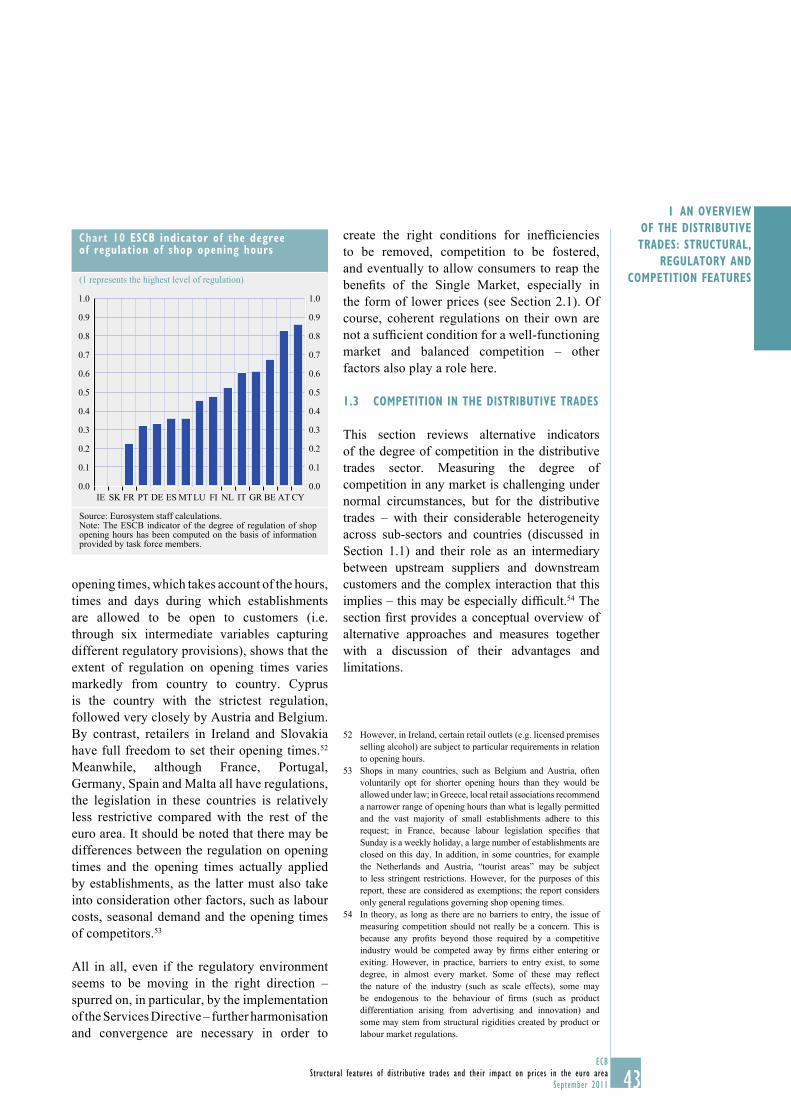
43ECB
Structural features of distributive trades and their impact on prices in the euro area
September 2011
I AN OVERVIEW
OF THE DISTRIBUTIVE
TRADES: STRUCTURAL,
REGULATORY AND
COMPETITION FEATURES
opening times, which takes account of the hours,
times and days during which establishments
are allowed to be open to customers (i.e.
through six intermediate variables capturing
different regulatory provisions), shows that the
extent of regulation on opening times varies
markedly from country to country. Cyprus
is the country with the strictest regulation,
followed very closely by Austria and Belgium.
By contrast, retailers in Ireland and Slovakia
have full freedom to set their opening times.52
Meanwhile, although France, Portugal,
Germany, Spain and Malta all have regulations,
the legislation in these countries is relatively
less restrictive compared with the rest of the
euro area. It should be noted that there may be
differences between the regulation on opening
times and the opening times actually applied
by establishments, as the latter must also take
into consideration other factors, such as labour
costs, seasonal demand and the opening times
of competitors.53
All in all, even if the regulatory environment
seems to be moving in the right direction –
spurred on, in particular, by the implementation
of the Services Directive – further harmonisation
and convergence are necessary in order to
create the right conditions for ineffi ciencies
to be removed, competition to be fostered,
and eventually to allow consumers to reap the
benefi ts of the Single Market, especially in
the form of lower prices (see Section 2.1). Of
course, coherent regulations on their own are
not a suffi cient condition for a well-functioning
market and balanced competition – other
factors also play a role here.
1.3 COMPETITION IN THE DISTRIBUTIVE TRADES
This section reviews alternative indicators
of the degree of competition in the distributive
trades sector. Measuring the degree of
competition in any market is challenging under
normal circumstances, but for the distributive
trades – with their considerable heterogeneity
across sub-sectors and countries (discussed in
Section 1.1) and their role as an intermediary
between upstream suppliers and downstream
customers and the complex interaction that this
implies – this may be especially diffi cult.54 The
section fi rst provides a conceptual overview of
alternative approaches and measures together
with a discussion of their advantages and
limitations.
However, in Ireland, certain retail outlets (e.g. licensed premises 52
selling alcohol) are subject to particular requirements in relation
to opening hours.
Shops in many countries, such as Belgium and Austria, often 53
voluntarily opt for shorter opening hours than they would be
allowed under law; in Greece, local retail associations recommend
a narrower range of opening hours than what is legally permitted
and the vast majority of small establishments adhere to this
request; in France, because labour legislation specifi es that
Sunday is a weekly holiday, a large number of establishments are
closed on this day. In addition, in some countries, for example
the Netherlands and Austria, “tourist areas” may be subject
to less stringent restrictions. However, for the purposes of this
report, these are considered as exemptions; the report considers
only general regulations governing shop opening times.
In theory, as long as there are no barriers to entry, the issue of 54
measuring competition should not really be a concern. This is
because any profi ts beyond those required by a competitive
industry would be competed away by fi rms either entering or
exiting. However, in practice, barriers to entry exist, to some
degree, in almost every market. Some of these may refl ect
the nature of the industry (such as scale effects), some may
be endogenous to the behaviour of fi rms (such as product
differentiation arising from advertising and innovation) and
some may stem from structural rigidities created by product or
labour market regulations.
Chart 10 ESCB indicator of the degree of regulation of shop opening hours
(1 represents the highest level of regulation)
0.0
0.1
0.2
0.3
0.4
0.5
0.6
0.7
0.8
0.9
1.0
0.0
0.1
0.2
0.3
0.4
0.5
0.6
0.7
0.8
0.9
1.0
IE SK FR PT DE ES MTLU FI NL IT GR BE AT CY
Source: Eurosystem staff calculations.Note: The ESCB indicator of the degree of regulation of shop opening hours has been computed on the basis of information provided by task force members.
44ECB
Structural features of distributive trades and their impact on prices in the euro area
September 2011
A number of different indicators are considered
(concentration, profi tability, pass-through) at
different levels of spatial (local, regional and
national) and organisational (store, parent
company and buying group) aggregation,
as well as both upstream (producer-related)
and downstream (consumer-related) aspects.
A general fi nding is that concentration at the
national level is relatively low in the southern
European countries owing to the persistence
of a more traditional retail structure. However,
a unique dataset encompassing the location of
over 100,000 individual grocery stores across
the euro area is also used to construct regional
and local measures of competition. While there
are some similarities with the results using
national data, there are also some noteworthy
differences, with some markets that appear to
be relatively fragmented at the national level
turning out to be quite concentrated at the local
level and vice versa. Overall, the key message
is that measuring the degree of competition in
the retail trades is not a straightforward matter;
it is an issue that should be carefully considered
along a number of different dimensions.
1.3.1 CONCEPTUAL OVERVIEW
Given the increasing degree of consolidation in
the distributive trades sector highlighted in
Section 1.1, it is not surprising that competition
authorities around Europe have considered the
issue of how to measure competition in this
sector from both a conceptual and empirical
perspective.55 Therefore, much of what follows
draws on works undertaken by international
competition authorities to address a number of
key questions. From a conceptual point of view,
the section discusses: (a) what the relevant
market is; and (b) which, if any, measure of
competition is best.
With regard to the relevant market, markets may
be defi ned in many ways, including in terms of
geography, sector and segment. As concerns
the geographical dimension, does it make
most sense to consider competition at the local,
regional, national, or even international level,
or some combination of these? As concerns
the sectoral dimension, not all retailers are
competitors. For example, a pharmacy is
presumably not competing with a clothing and
footwear retailer. However, the situation may be
more complex for other goods and services. For
example, a grocer may be competing in many
segments, for instance with petrol, specialist
food, online or department store retailers,
while the latter two may, in turn, be competing
with retailers of clothing and footwear or
electronics and appliances. Lastly, as concerns
the segmental dimension, it may be the case
that within the grocery trade different types of
retailer are not really competing with each other
for the same market segment. For example,
large supermarkets, which generally carry a
wide range of products of varying quality,
price and brand, and hard discounters, which
generally carry a limited range of unbranded
products, may not be in direct competition with
each other. Another issue particularly relevant
to the distributive trades sector is the distinction
between upstream competition in respect of
buying power and downstream competition in
respect of selling power. It could be the case
that, owing to competition from other retailers,
a large retailer has little power downstream, but
if it is large relative to a local supplier it may
have complete buying (or monopsony) power
upstream, at least for certain products.
With regard to the question of which measure
of competition is best, the following sections
consider two broad measures of competition
based on: (i) concentration and (ii) profi tability.
As mentioned above, the Competition Authority of Ireland 55
conducted two studies on the Irish retail market in 2008 and 2009.
The UK Competition Commission completed a comprehensive
two-year inquiry into the UK grocery sector in 2008. More
recently, in 2010, Austria’s federal competition authority
(Bundeswettbewerbsbehörde) conducted some work on the liquid
fuels market; in Spain, the National Competition Commission
(Comisión Nacional de la Competencia) studied the automotive
fuel sector in 2008 and 2011; in Bulgaria, the Commission
on Protection of Competition has analysed the relationship
between supermarket chains and suppliers; and in Portugal, the
Competition Authority (Autoridade da Concorrência) concluded
the “Relationship between the Large Retail Groups and their
Suppliers” report in 2010. Only recently, in February 2011,
Germany’s federal cartel offi ce (Bundeskartellamt) announced
that it had started investigating the relationship that the country’s
leading grocery retailers had with their suppliers.
45ECB
Structural features of distributive trades and their impact on prices in the euro area
September 2011
I AN OVERVIEW
OF THE DISTRIBUTIVE
TRADES: STRUCTURAL,
REGULATORY AND
COMPETITION FEATURES
EX ANTE CONCENTRATION VERSUS
EX POST PROFITABILITY
Concentration measures
Concentration measures may be considered as
an ex ante indicator of potential competition.
This is because, although a market with low
concentration (i.e. many fi rms with low market
shares) is likely to be more competitive than one
with high concentration (i.e. few fi rms with a
high market share), it could actually be the case
that a market with only two players features
more fi erce competition than one with many
players where explicit or implicit collusion has
developed.56
The concept of industry concentration and the
construction of indices measuring concentration
has been widely analysed in the economic
literature. The two elements that characterise
these measures are: number (“fewness”) of
fi rms and market share equality/inequality.
Whenever such indicators are used, it is
implicitly assumed that the degree of
competition of a market structure is higher if
the share of demand served by each fi rm is
lower. The most commonly employed
concentration measures are: (1) the k-fi rm concentration ratio – CRk,
57 involving the sum
of the market shares of the k largest fi rms,
which are all given an equal weight; limitations
of this measure arise from the arbitrariness in
the choice of k and the bias induced by
excluding the other fi rms (n-k) in the market;
and (2) the Herfi ndahl-Hirschman Index –
HHI;58 here, the weights increase with fi rm size
and all the n fi rms are considered.
The CRk indicator is calculated as the
cumulated market share of the top k companies
in a given market (e.g. CR1 is the market
share of the leading company, whereas CR5
is the combined market share of the top fi ve
leading companies in the market). Although
there is no fi xed rule as to which k to select,
Dobson (1999), in his study of buyer power
and its impact on competition in the food retail
sector, uses the CR5 indicator. In Chapter 2,
it is found that the CR5 indicator may contain
the most information regarding price level
differentials.59
The HHI is the most widely used concentration
measure, and is frequently the reference
market power index for competition authority
guidelines relating to the evaluation of mergers
and acquisitions. Theoretically, this measure can
range between zero and 100 (zero being where
there are an “infi nite” number of “infi nitely”
small fi rms, and 100 being where there is a
monopoly with a market share of 100). The HHI
takes into account both the relative size and the
distribution of the fi rms in a particular market.
While there is no set rule for interpreting
the HHI, and the caveats about interpreting
concentration as a measure of competition must
be kept in mind, a rule of thumb is to consider
a market with an HHI below one as highly
competitive, a market with an HHI below ten as
relatively unconcentrated, a market with an HHI
between 10 to 18 as moderately concentrated,
and a market with an HHI above 18 as highly
concentrated.
Profitability measures
Profi tability measures may be considered as
ex post indicators of competition, as they are
the outcome of decisions made by competing
fi rms. In principle, profi tability in a highly
competitive market should be driven down
An additional complicating factor in respect of using concentration 56
measures to gauge the degree of competition and social welfare
is that it could be the case that, owing to restrictions related to
entry and expansion, a market is highly fragmented and has
many small incumbent players plus local monopolies that operate
relatively ineffi ciently. In contrast, in another market – one that
has developed with “free” entry and exit – there may be a smaller
number of larger players who compete strongly against each other
and have operations that are relatively effi cient.k
i=1wisiCRk , where si is the market share of firm i =Σ57
100 and wi =0<Si0
1{<-∀i =1,...,k
∀i = k+1,...,n
/100. Note that n
i=1
si2HHI= 100 ≤ HHI ≤ 1n[ [
∑58 The minimum (zero)
is attained in the case of perfect competition, whereas the
maximum implies a monopolistic market structure. Note that,
depending on how the market share is defi ned, the HHI is also
sometimes presented on a scale of zero to unity or zero to 10,000.
Choosing a low “k” may place too much emphasis on the leading 59
fi rms, whereas choosing a high “k” may not provide much additional
information as the market share tends to tail off at around four to
six companies in most sectors.
46ECB
Structural features of distributive trades and their impact on prices in the euro area
September 2011
to a minimum acceptable level. However, in
practice, measuring profi tability is challenging,
and the more easily calculated measures have
limitations and thus need to be interpreted with
caution. An ideal measure would be a fi rm’s
rate of return on capital as, ultimately, this
is what investors in fi rms should be trying to
maximise. However, measuring a fi rm’s capital
is also an extremely challenging task, one with
many potential pitfalls.60 Therefore, this section
focuses primarily on profi t margins, even if
these have limitations.61, 62
Equation 1 below shows that there is a
relationship between a fi rm’s return on capital
and its profi t margin, which is determined by
the “capital turnover” (or “turnover per unit
of capital employed”). Given that competitive
behaviour by investors should give rise to a
tendency to equalise (risk-adjusted) rates of
return on capital, equation 1 suggests that
profi t margins may be a useful indicator of our
preferred measure of profi tability. However,
there is one important caveat. Equation 1
underlines that this relationship depends on the
capital turnover, which may vary substantially,
particularly across sectors. For example, in the
retail trade sub-sector, it is a well-known fact
that the degree of capital turnover is quite high.
Therefore, comparing profi t margins across
sectors is risky, even when they are seemingly
similar (for example, as discussed in Section 1.1,
profi t margins in the grocery and non-grocery
retail trade are quite different), and may also be
misleading if interpreted at face value.63
(1) Return on capital (P/K) = profi t margin (P/S)
* capital turnover (S/K),
where P = profi t, K = capital, S = turnover or sales
SHOULD COMPETITION BE ANALYSED
AT THE NATIONAL OR LOCAL LEVEL?
As discussed above, an important issue when
measuring competition is to defi ne the relevant
market. A key aspect of this is the geographical dimension. Should the market be considered at a
local, regional, national or international level?
A priori, the answer to this question is not so
clear-cut, as retailers operate at all these levels
(local – store; regional – logistics; national –
parent company administration; international –
large players and big buying groups).
From an individual consumer’s point of view,
what probably matters most is competition in
his/her local catchment area.64 Furthermore, there
is evidence to suggest that the number of rivals
located close to a store affect its performance
(defi ned as store-level margins excluding fi xed
costs).65 The issue of price-setting behaviour is
clearly one of interest to monetary policy-
makers. If competition is truly local, one would
expect that retailers set prices according to local
demand and supply (cost and competition)
factors. However, it has been found that many
large retail chains set prices at the national level,
while perhaps allowing for some degree of price
variation at the local store level via variable
discounting. Another way retail chains may alter
local margins without changing prices is by
varying costs, for example in terms of the quality
These pitfalls include, for example, the following questions: how 60
is capital valued; how does a fi rm treat its property holdings (are
they embedded with the main group or held by a separate entity,
or does it simply rent the bulk of its property requirements); and
whether it is possible to measure intangible capital, such as that
generated by advertising, research and development.
The UK Competition Commission, in its 2006 to 2008 inquiry 61
into the UK grocery sector, relied extensively on an analysis of
margins calculated at the store level – using data provided by
retailers themselves. For a more complete discussion of the use
of profi tability analysis to determine the degree of competition,
see Felet and Moiloa (2009).
This report does not discuss another profi tability-based indicator 62
of competition, namely the “Boone indicator” or “profi t elasticity
indicator”. However, the analysis of pass-through in Section 2.4
would accord with this indicator.
Another caveat to be mentioned is that the data for the 63
concentration and profi tability indicators come from
different sources (Euromonitor and Eurostat’s SBS database
respectively), which use different classifi cation systems (such as
size, characteristics, sector, store/non-store). This unfortunately
makes it diffi cult to compare and cross-check measures.
According to the European Commission (2010), pp. 30-31, “the 64
application of competition law to retail sales of daily consumer
goods (i.e. hypermarkets, supermarkets and discount chains) has
found that from the consumer perspective, the boundaries of a
catchment area where the outlets can be reached easily concern
a radius of approximately 20 to 30 minutes driving time”.
UK Competition Commission, “Note on store margin analysis”, 65
prepared as part of the 2006 to 2008 inquiry into the grocery sector.
47ECB
Structural features of distributive trades and their impact on prices in the euro area
September 2011
I AN OVERVIEW
OF THE DISTRIBUTIVE
TRADES: STRUCTURAL,
REGULATORY AND
COMPETITION FEATURES
of service offered via staffi ng levels, in-store
display and design.66
Empirical evidence on national and local pricing
First, considering the international evidence, it
appears that there is a degree of national pricing.
In the United Kingdom, the Competition
Commission, in its 2006 to 2008 Grocery Sector
Inquiry, reported that uniform national pricing
was predominant. It found limited variation in
prices across store networks, and nearly all of
the main grocery retailers surveyed stated that
they set national prices;67 national prices have
largely been introduced here since 2000.
However, the report also added that “vouchering”
was a means by which grocery retailers might
adjust prices locally in the context of national
pricing. In Australia, in 2010, all of the major
supermarket chains had a national pricing
policy. In South Africa, Myburgh et al. (2007)
note that in a number of retail mergers the South
African competition authorities have relied on
the principle that national retail chains that set
prices centrally compete in a national market.68
In the United States, Nakamura et al. (2010) use
a large scanner price dataset to study grocery
price dynamics and fi nd evidence in favour of
national pricing.69
Given the importance of this issue, this report
takes an agnostic stance, preferring to rely
on empirical and survey evidence and to
allow for the fact that some fi rms may adopt
national pricing whereas others may adopt local
pricing. Therefore, it fi rst reports on measures
of competition based on national data and
then turns to measures of competition based
on local data.
1.3.2 EMPIRICAL MEASURES OF COMPETITION
USING NATIONAL DATA
CONCENTRATION
This section presents empirical measures
of market concentration based on data from
Euromonitor, which, in terms of the distributive
trades sector, are only available for the retail sub-
sector. It fi rst considers the different measures
(HHI and CRk) outlined above and how these
correspond to each other. Thereafter, the ranking
of concentration measures across sectors is
considered. The patterns of concentration across
sectors and their evolution over time are also
discussed.
As regards the different concentration measures,
both the HHI and a range of CRk measures of
concentration for grocery retail trade are fi rst
considered to illustrate their relationship and
interpretation. Table A8 in the Appendix presents
both the HHI and a number of CRk measures for
grocery retailing. Generally, the cross-country
pattern of the HHI and CRk measures is relatively
similar, with the last row in Table A8 showing a
high correlation between the CRk measures and
the HHI. Chart 11, which shows the cumulated
CRk measures for euro area countries, illustrates
that the CRk measures tend to tail off very
quickly after the fourth-largest fi rm, with the
possible exception of the larger economies. The
pattern across time is also relatively similar.
A general result, regardless of which measure
is used, is that concentration is relatively low in
the southern European countries (Greece, Italy,
Spain and Portugal), followed by Slovakia and
Belgium. The highly fragmented nature of the
Greek grocery trade is illustrated by the fact that
the market share of the nine leading companies
Cotteril (2007) argues that “local market cost and demand 66
conditions vary. The fact that fi rms charge the same shelf price
for a product throughout the country strongly suggests the
following alternatives. Either fi rms vary the product mix and use
local vouchers to correspond to cost and demand changes or one
has coordinated pricing among fi rms.”
The report also clarifi ed that, although for some retailers, such 67
as Tesco and Sainsbury’s, prices may vary between their smaller
(convenience) and larger (supermarket) format stores, these
price variations refl ect the higher operating costs of smaller
stores rather than local competitive conditions (this information
was provided by the retailers themselves).
Note that this study also argues that the use of the “national pricing 68
principle” to justify analysis of competition at the national level
is “an example of a heuristic. One which reduces the complexity
of the enquiry (a region by region analysis does not need to be
done) but increases the likelihood of error (the anticompetitive
consequences of mergers may be over or under-estimated)”.
Although they document large differences in price movements 69
across different grocery store chains, they note that a variance
decomposition indicates that characteristics at the chain level
(as opposed to the level of individual stores) explain a large
fraction of the total variation in price dynamics. It appears that
this pattern also applies to sales discounting.
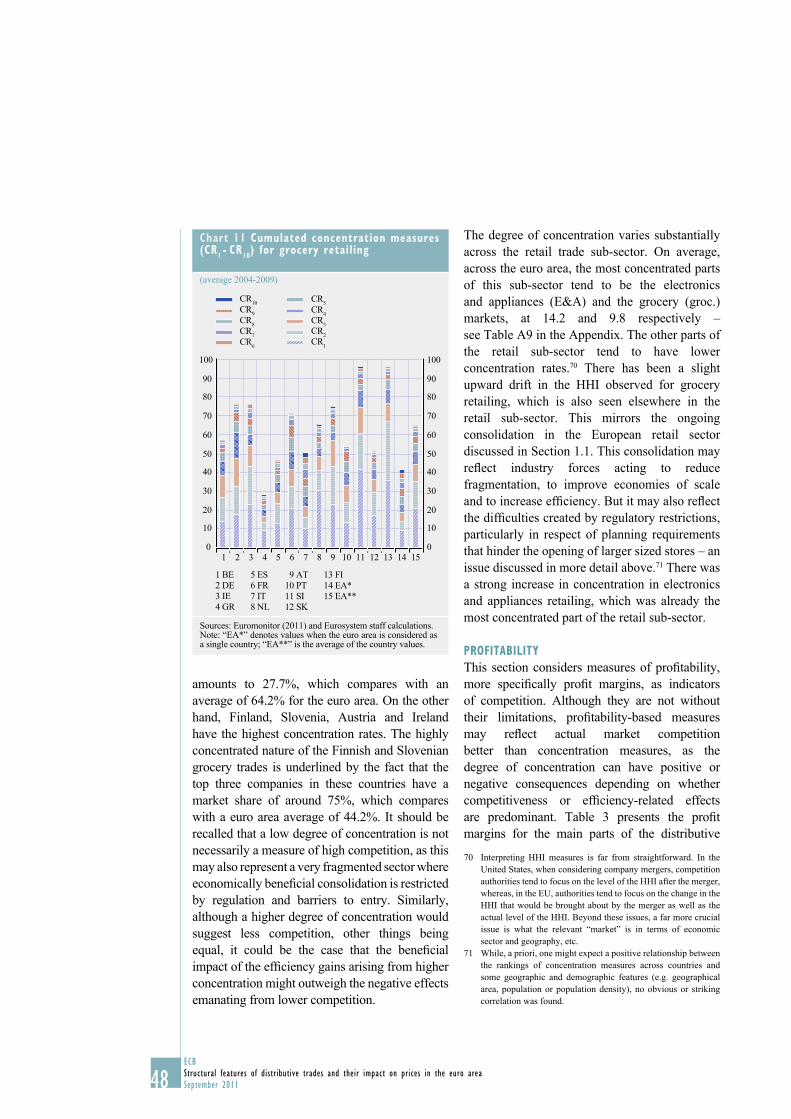
48ECB
Structural features of distributive trades and their impact on prices in the euro area
September 2011
amounts to 27.7%, which compares with an
average of 64.2% for the euro area. On the other
hand, Finland, Slovenia, Austria and Ireland
have the highest concentration rates. The highly
concentrated nature of the Finnish and Slovenian
grocery trades is underlined by the fact that the
top three companies in these countries have a
market share of around 75%, which compares
with a euro area average of 44.2%. It should be
recalled that a low degree of concentration is not
necessarily a measure of high competition, as this
may also represent a very fragmented sector where
economically benefi cial consolidation is restricted
by regulation and barriers to entry. Similarly,
although a higher degree of concentration would
suggest less competition, other things being
equal, it could be the case that the benefi cial
impact of the effi ciency gains arising from higher
concentration might outweigh the negative effects
emanating from lower competition.
The degree of concentration varies substantially
across the retail trade sub-sector. On average,
across the euro area, the most concentrated parts
of this sub-sector tend to be the electronics
and appliances (E&A) and the grocery (groc.)
markets, at 14.2 and 9.8 respectively –
see Table A9 in the Appendix. The other parts of
the retail sub-sector tend to have lower
concentration rates.70 There has been a slight
upward drift in the HHI observed for grocery
retailing, which is also seen elsewhere in the
retail sub-sector. This mirrors the ongoing
consolidation in the European retail sector
discussed in Section 1.1. This consolidation may
refl ect industry forces acting to reduce
fragmentation, to improve economies of scale
and to increase effi ciency. But it may also refl ect
the diffi culties created by regulatory restrictions,
particularly in respect of planning requirements
that hinder the opening of larger sized stores – an
issue discussed in more detail above.71 There was
a strong increase in concentration in electronics
and appliances retailing, which was already the
most concentrated part of the retail sub-sector.
PROFITABILITY
This section considers measures of profi tability,
more specifi cally profi t margins, as indicators
of competition. Although they are not without
their limitations, profi tability-based measures
may refl ect actual market competition
better than concentration measures, as the
degree of concentration can have positive or
negative consequences depending on whether
competitiveness or effi ciency-related effects
are predominant. Table 3 presents the profi t
margins for the main parts of the distributive
Interpreting HHI measures is far from straightforward. In the 70
United States, when considering company mergers, competition
authorities tend to focus on the level of the HHI after the merger,
whereas, in the EU, authorities tend to focus on the change in the
HHI that would be brought about by the merger as well as the
actual level of the HHI. Beyond these issues, a far more crucial
issue is what the relevant “market” is in terms of economic
sector and geography, etc.
While, a priori, one might expect a positive relationship between 71
the rankings of concentration measures across countries and
some geographic and demographic features (e.g. geographical
area, population or population density), no obvious or striking
correlation was found.
Chart 11 Cumulated concentration measures (CR
1 - CR
10) for grocery retailing
(average 2004-2009)
0
10
20
30
40
50
60
70
80
90
100
0
10
20
30
40
50
60
70
80
90
100
1 2 3 4 5 6 7 8 9 10 11 12 13 14 15
1 BE
2 DE
3 IE
4 GR
5 ES
6 FR
7 IT
8 NL
9 AT
10 PT
11 SI
12 SK
13 FI
14 EA*
15 EA**
CR10
CR9
CR8
CR7
CR6
CR5
CR4
CR3
CR2
CR1
Sources: Euromonitor (2011) and Eurosystem staff calculations.Note: “EA*” denotes values when the euro area is considered as a single country; “EA**” is the average of the country values.
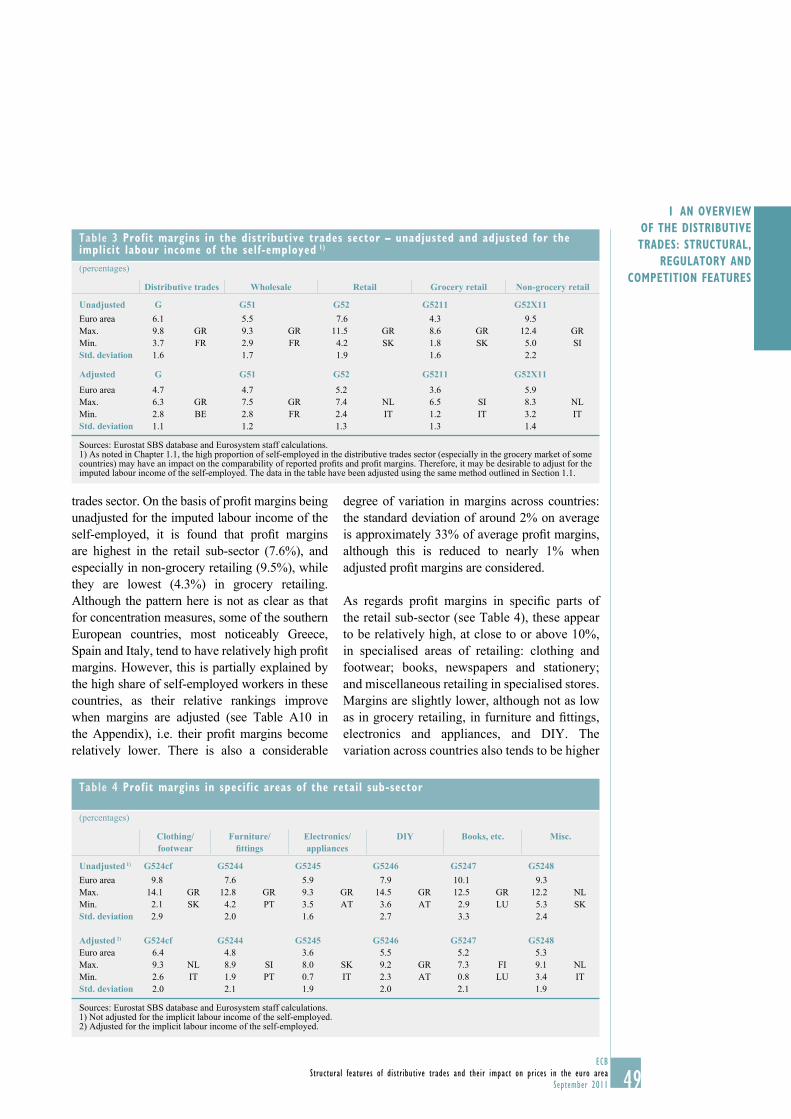
49ECB
Structural features of distributive trades and their impact on prices in the euro area
September 2011
I AN OVERVIEW
OF THE DISTRIBUTIVE
TRADES: STRUCTURAL,
REGULATORY AND
COMPETITION FEATURES
trades sector. On the basis of profi t margins being
unadjusted for the imputed labour income of the
self-employed, it is found that profi t margins
are highest in the retail sub-sector (7.6%), and
especially in non-grocery retailing (9.5%), while
they are lowest (4.3%) in grocery retailing.
Although the pattern here is not as clear as that
for concentration measures, some of the southern
European countries, most noticeably Greece,
Spain and Italy, tend to have relatively high profi t
margins. However, this is partially explained by
the high share of self-employed workers in these
countries, as their relative rankings improve
when margins are adjusted (see Table A10 in
the Appendix), i.e. their profi t margins become
relatively lower. There is also a considerable
degree of variation in margins across countries:
the standard deviation of around 2% on average
is approximately 33% of average profi t margins,
although this is reduced to nearly 1% when
adjusted profi t margins are considered.
As regards profi t margins in specifi c parts of
the retail sub-sector (see Table 4), these appear
to be relatively high, at close to or above 10%,
in specialised areas of retailing: clothing and
footwear; books, newspapers and stationery;
and miscellaneous retailing in specialised stores.
Margins are slightly lower, although not as low
as in grocery retailing, in furniture and fi ttings,
electronics and appliances, and DIY. The
variation across countries also tends to be higher
Table 3 Profit margins in the distributive trades sector – unadjusted and adjusted for the implicit labour income of the self-employed 1)
(percentages)
Distributive trades Wholesale Retail Grocery retail Non-grocery retail
Unadjusted G G51 G52 G5211 G52X11Euro area 6.1 5.5 7.6 4.3 9.5
Max. 9.8 GR 9.3 GR 11.5 GR 8.6 GR 12.4 GR
Min. 3.7 FR 2.9 FR 4.2 SK 1.8 SK 5.0 SI
Std. deviation 1.6 1.7 1.9 1.6 2.2
Adjusted G G51 G52 G5211 G52X11
Euro area 4.7 4.7 5.2 3.6 5.9
Max. 6.3 GR 7.5 GR 7.4 NL 6.5 SI 8.3 NL
Min. 2.8 BE 2.8 FR 2.4 IT 1.2 IT 3.2 IT
Std. deviation 1.1 1.2 1.3 1.3 1.4
Sources: Eurostat SBS database and Eurosystem staff calculations.1) As noted in Chapter 1.1, the high proportion of self-employed in the distributive trades sector (especially in the grocery market of some countries) may have an impact on the comparability of reported profi ts and profi t margins. Therefore, it may be desirable to adjust for the imputed labour income of the self-employed. The data in the table have been adjusted using the same method outlined in Section 1.1.
Table 4 Profit margins in specific areas of the retail sub-sector
(percentages)
Clothing/footwear
Furniture/fi ttings
Electronics/appliances
DIY Books, etc. Misc.
Unadjusted 1) G524cf G5244 G5245 G5246 G5247 G5248Euro area 9.8 7.6 5.9 7.9 10.1 9.3
Max. 14.1 GR 12.8 GR 9.3 GR 14.5 GR 12.5 GR 12.2 NL
Min. 2.1 SK 4.2 PT 3.5 AT 3.6 AT 2.9 LU 5.3 SK
Std. deviation 2.9 2.0 1.6 2.7 3.3 2.4
Adjusted 2) G524cf G5244 G5245 G5246 G5247 G5248Euro area 6.4 4.8 3.6 5.5 5.2 5.3
Max. 9.3 NL 8.9 SI 8.0 SK 9.2 GR 7.3 FI 9.1 NL
Min. 2.6 IT 1.9 PT 0.7 IT 2.3 AT 0.8 LU 3.4 IT
Std. deviation 2.0 2.1 1.9 2.0 2.1 1.9
Sources: Eurostat SBS database and Eurosystem staff calculations.1) Not adjusted for the implicit labour income of the self-employed.2) Adjusted for the implicit labour income of the self-employed.
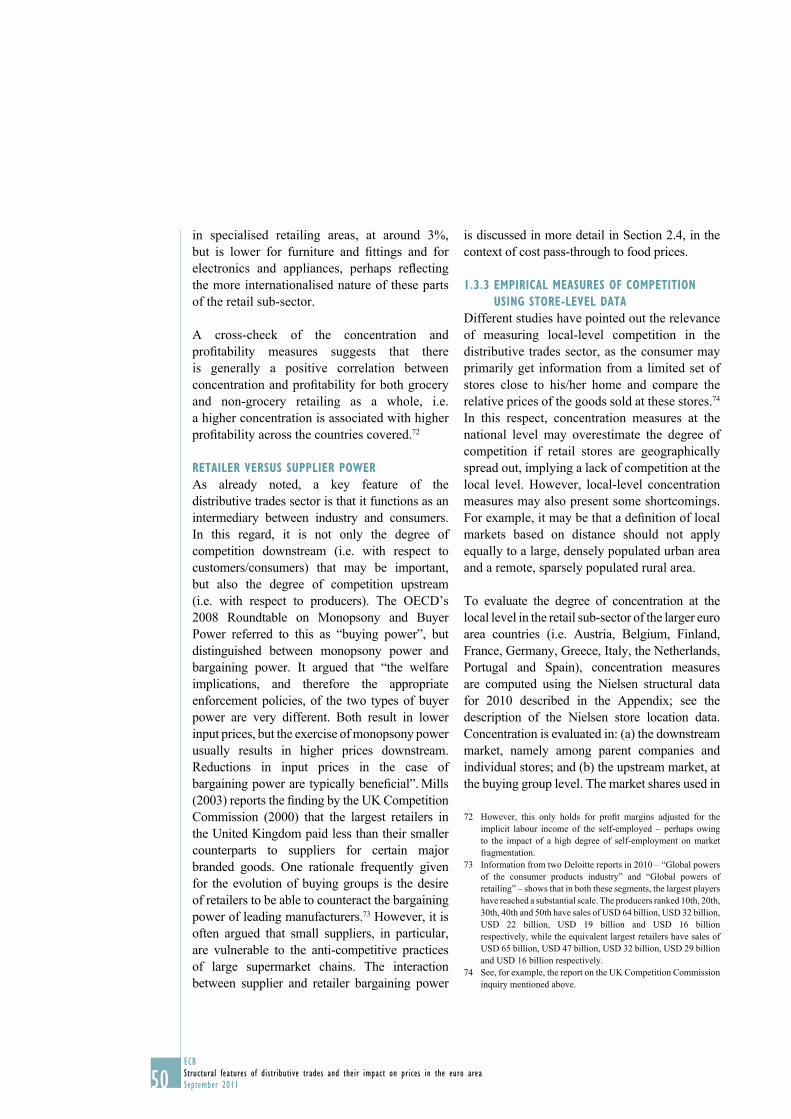
50ECB
Structural features of distributive trades and their impact on prices in the euro area
September 2011
in specialised retailing areas, at around 3%,
but is lower for furniture and fi ttings and for
electronics and appliances, perhaps refl ecting
the more internationalised nature of these parts
of the retail sub-sector.
A cross-check of the concentration and
profi tability measures suggests that there
is generally a positive correlation between
concentration and profi tability for both grocery
and non-grocery retailing as a whole, i.e.
a higher concentration is associated with higher
profi tability across the countries covered.72
RETAILER VERSUS SUPPLIER POWER
As already noted, a key feature of the
distributive trades sector is that it functions as an
intermediary between industry and consumers.
In this regard, it is not only the degree of
competition downstream (i.e. with respect to
customers/consumers) that may be important,
but also the degree of competition upstream
(i.e. with respect to producers). The OECD’s
2008 Roundtable on Monopsony and Buyer
Power referred to this as “buying power”, but
distinguished between monopsony power and
bargaining power. It argued that “the welfare
implications, and therefore the appropriate
enforcement policies, of the two types of buyer
power are very different. Both result in lower
input prices, but the exercise of monopsony power
usually results in higher prices downstream.
Reductions in input prices in the case of
bargaining power are typically benefi cial”. Mills
(2003) reports the fi nding by the UK Competition
Commission (2000) that the largest retailers in
the United Kingdom paid less than their smaller
counterparts to suppliers for certain major
branded goods. One rationale frequently given
for the evolution of buying groups is the desire
of retailers to be able to counteract the bargaining
power of leading manufacturers.73 However, it is
often argued that small suppliers, in particular,
are vulnerable to the anti-competitive practices
of large supermarket chains. The interaction
between supplier and retailer bargaining power
is discussed in more detail in Section 2.4, in the
context of cost pass-through to food prices.
1.3.3 EMPIRICAL MEASURES OF COMPETITION
USING STORE-LEVEL DATA
Different studies have pointed out the relevance
of measuring local-level competition in the
distributive trades sector, as the consumer may
primarily get information from a limited set of
stores close to his/her home and compare the
relative prices of the goods sold at these stores.74
In this respect, concentration measures at the
national level may overestimate the degree of
competition if retail stores are geographically
spread out, implying a lack of competition at the
local level. However, local-level concentration
measures may also present some shortcomings.
For example, it may be that a defi nition of local
markets based on distance should not apply
equally to a large, densely populated urban area
and a remote, sparsely populated rural area.
To evaluate the degree of concentration at the
local level in the retail sub-sector of the larger euro
area countries (i.e. Austria, Belgium, Finland,
France, Germany, Greece, Italy, the Netherlands,
Portugal and Spain), concentration measures
are computed using the Nielsen structural data
for 2010 described in the Appendix; see the
description of the Nielsen store location data.
Concentration is evaluated in: (a) the downstream
market, namely among parent companies and
individual stores; and (b) the upstream market, at
the buying group level. The market shares used in
However, this only holds for profi t margins adjusted for the 72
implicit labour income of the self-employed – perhaps owing
to the impact of a high degree of self-employment on market
fragmentation.
Information from two Deloitte reports in 2010 – “Global powers 73
of the consumer products industry” and “Global powers of
retailing” – shows that in both these segments, the largest players
have reached a substantial scale. The producers ranked 10th, 20th,
30th, 40th and 50th have sales of USD 64 billion, USD 32 billion,
USD 22 billion, USD 19 billion and USD 16 billion
respectively, while the equivalent largest retailers have sales of
USD 65 billion, USD 47 billion, USD 32 billion, USD 29 billion
and USD 16 billion respectively.
See, for example, the report on the UK Competition Commission 74
inquiry mentioned above.
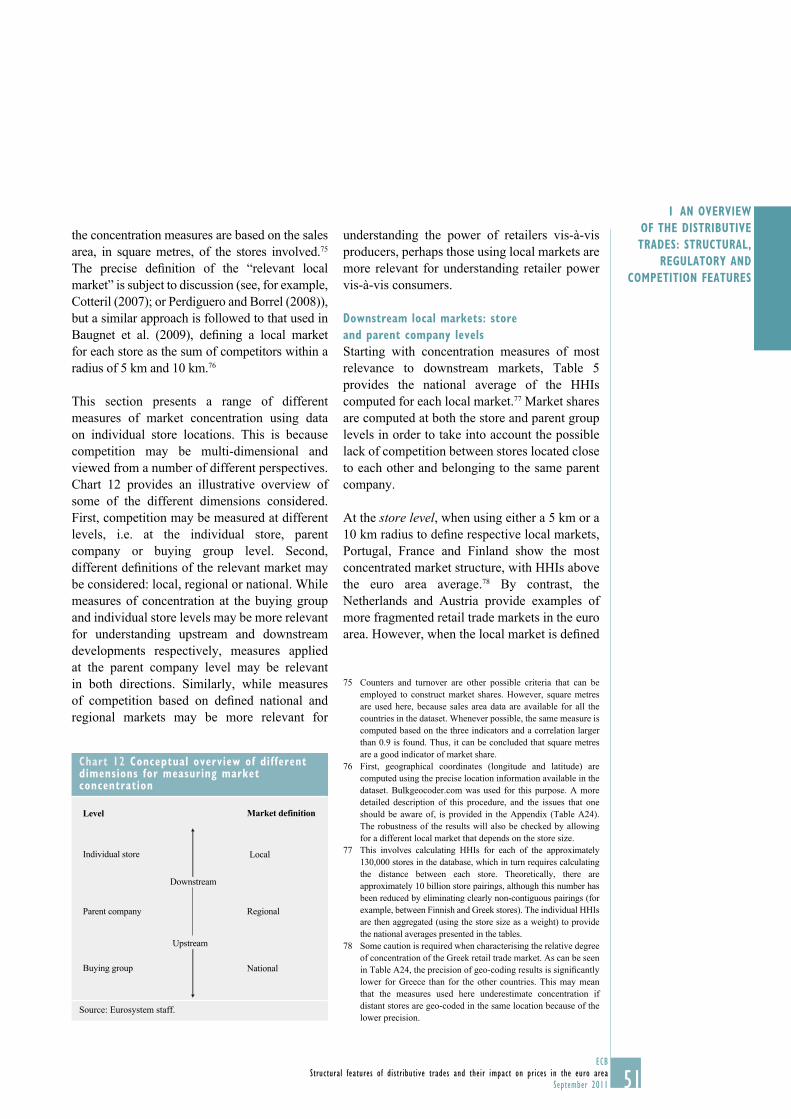
51ECB
Structural features of distributive trades and their impact on prices in the euro area
September 2011
I AN OVERVIEW
OF THE DISTRIBUTIVE
TRADES: STRUCTURAL,
REGULATORY AND
COMPETITION FEATURES
the concentration measures are based on the sales
area, in square metres, of the stores involved.75
The precise defi nition of the “relevant local
market” is subject to discussion (see, for example,
Cotteril (2007); or Perdiguero and Borrel (2008)),
but a similar approach is followed to that used in
Baugnet et al. (2009), defi ning a local market
for each store as the sum of competitors within a
radius of 5 km and 10 km.76
This section presents a range of different
measures of market concentration using data
on individual store locations. This is because
competition may be multi-dimensional and
viewed from a number of different perspectives.
Chart 12 provides an illustrative overview of
some of the different dimensions considered.
First, competition may be measured at different
levels, i.e. at the individual store, parent
company or buying group level. Second,
different defi nitions of the relevant market may
be considered: local, regional or national. While
measures of concentration at the buying group
and individual store levels may be more relevant
for understanding upstream and downstream
developments respectively, measures applied
at the parent company level may be relevant
in both directions. Similarly, while measures
of competition based on defi ned national and
regional markets may be more relevant for
understanding the power of retailers vis-à-vis
producers, perhaps those using local markets are
more relevant for understanding retailer power
vis-à-vis consumers.
Downstream local markets: store
and parent company levels
Starting with concentration measures of most
relevance to downstream markets, Table 5
provides the national average of the HHIs
computed for each local market.77 Market shares
are computed at both the store and parent group
levels in order to take into account the possible
lack of competition between stores located close
to each other and belonging to the same parent
company.
At the store level, when using either a 5 km or a
10 km radius to defi ne respective local markets,
Portugal, France and Finland show the most
concentrated market structure, with HHIs above
the euro area average.78 By contrast, the
Netherlands and Austria provide examples of
more fragmented retail trade markets in the euro
area. However, when the local market is defi ned
Counters and turnover are other possible criteria that can be 75
employed to construct market shares. However, square metres
are used here, because sales area data are available for all the
countries in the dataset. Whenever possible, the same measure is
computed based on the three indicators and a correlation larger
than 0.9 is found. Thus, it can be concluded that square metres
are a good indicator of market share.
First, geographical coordinates (longitude and latitude) are 76
computed using the precise location information available in the
dataset. Bulkgeocoder.com was used for this purpose. A more
detailed description of this procedure, and the issues that one
should be aware of, is provided in the Appendix (Table A24).
The robustness of the results will also be checked by allowing
for a different local market that depends on the store size.
This involves calculating HHIs for each of the approximately 77
130,000 stores in the database, which in turn requires calculating
the distance between each store. Theoretically, there are
approximately 10 billion store pairings, although this number has
been reduced by eliminating clearly non-contiguous pairings (for
example, between Finnish and Greek stores). The individual HHIs
are then aggregated (using the store size as a weight) to provide
the national averages presented in the tables.
Some caution is required when characterising the relative degree 78
of concentration of the Greek retail trade market. As can be seen
in Table A24, the precision of geo-coding results is signifi cantly
lower for Greece than for the other countries. This may mean
that the measures used here underestimate concentration if
distant stores are geo-coded in the same location because of the
lower precision.
Chart 12 Conceptual overview of different dimensions for measuring market concentration
Individual store
Parent company
Buying group
Downstream
Upstream
Local
Regional
National
Market definitionLevel
Source: Eurosystem staff.
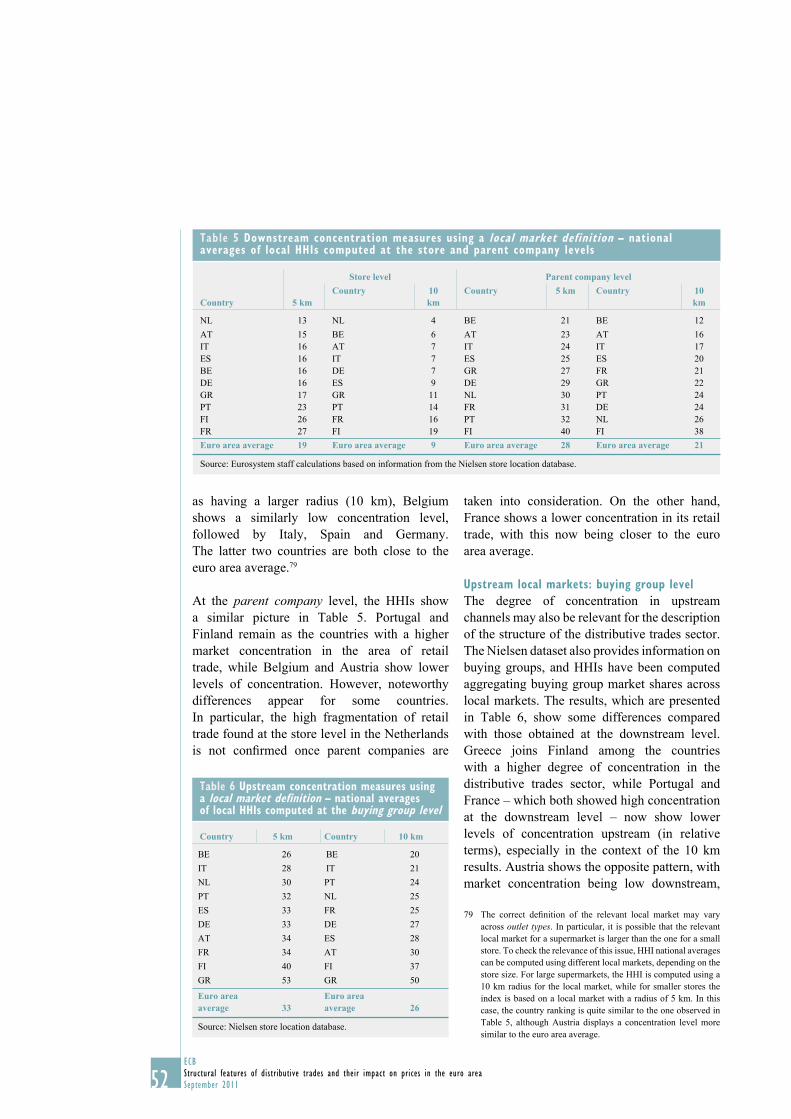
52ECB
Structural features of distributive trades and their impact on prices in the euro area
September 2011
as having a larger radius (10 km), Belgium
shows a similarly low concentration level,
followed by Italy, Spain and Germany.
The latter two countries are both close to the
euro area average.79
At the parent company level, the HHIs show
a similar picture in Table 5. Portugal and
Finland remain as the countries with a higher
market concentration in the area of retail
trade, while Belgium and Austria show lower
levels of concentration. However, noteworthy
differences appear for some countries.
In particular, the high fragmentation of retail
trade found at the store level in the Netherlands
is not confi rmed once parent companies are
taken into consideration. On the other hand,
France shows a lower concentration in its retail
trade, with this now being closer to the euro
area average.
Upstream local markets: buying group level
The degree of concentration in upstream
channels may also be relevant for the description
of the structure of the distributive trades sector.
The Nielsen dataset also provides information on
buying groups, and HHIs have been computed
aggregating buying group market shares across
local markets. The results, which are presented
in Table 6, show some differences compared
with those obtained at the downstream level.
Greece joins Finland among the countries
with a higher degree of concentration in the
distributive trades sector, while Portugal and
France – which both showed high concentration
at the downstream level – now show lower
levels of concentration upstream (in relative
terms), especially in the context of the 10 km
results. Austria shows the opposite pattern, with
market concentration being low downstream,
The correct defi nition of the relevant local market may vary 79
across outlet types. In particular, it is possible that the relevant
local market for a supermarket is larger than the one for a small
store. To check the relevance of this issue, HHI national averages
can be computed using different local markets, depending on the
store size. For large supermarkets, the HHI is computed using a
10 km radius for the local market, while for smaller stores the
index is based on a local market with a radius of 5 km. In this
case, the country ranking is quite similar to the one observed in
Table 5, although Austria displays a concentration level more
similar to the euro area average.
Table 5 Downstream concentration measures using a local market definition – national averages of local HHIs computed at the store and parent company levels
Store level Parent company level
Country 5 kmCountry 10
kmCountry 5 km Country 10
km
NL 13 NL 4 BE 21 BE 12
AT 15 BE 6 AT 23 AT 16
IT 16 AT 7 IT 24 IT 17
ES 16 IT 7 ES 25 ES 20
BE 16 DE 7 GR 27 FR 21
DE 16 ES 9 DE 29 GR 22
GR 17 GR 11 NL 30 PT 24
PT 23 PT 14 FR 31 DE 24
FI 26 FR 16 PT 32 NL 26
FR 27 FI 19 FI 40 FI 38
Euro area average 19 Euro area average 9 Euro area average 28 Euro area average 21
Source: Eurosystem staff calculations based on information from the Nielsen store location database.
Table 6 Upstream concentration measures using a local market definition – national averages of local HHIs computed at the buying group level
Country 5 km Country 10 km
BE 26 BE 20
IT 28 IT 21
NL 30 PT 24
PT 32 NL 25
ES 33 FR 25
DE 33 DE 27
AT 34 ES 28
FR 34 AT 30
FI 40 FI 37
GR 53 GR 50
Euro area average 33
Euro area average 26
Source: Nielsen store location database.
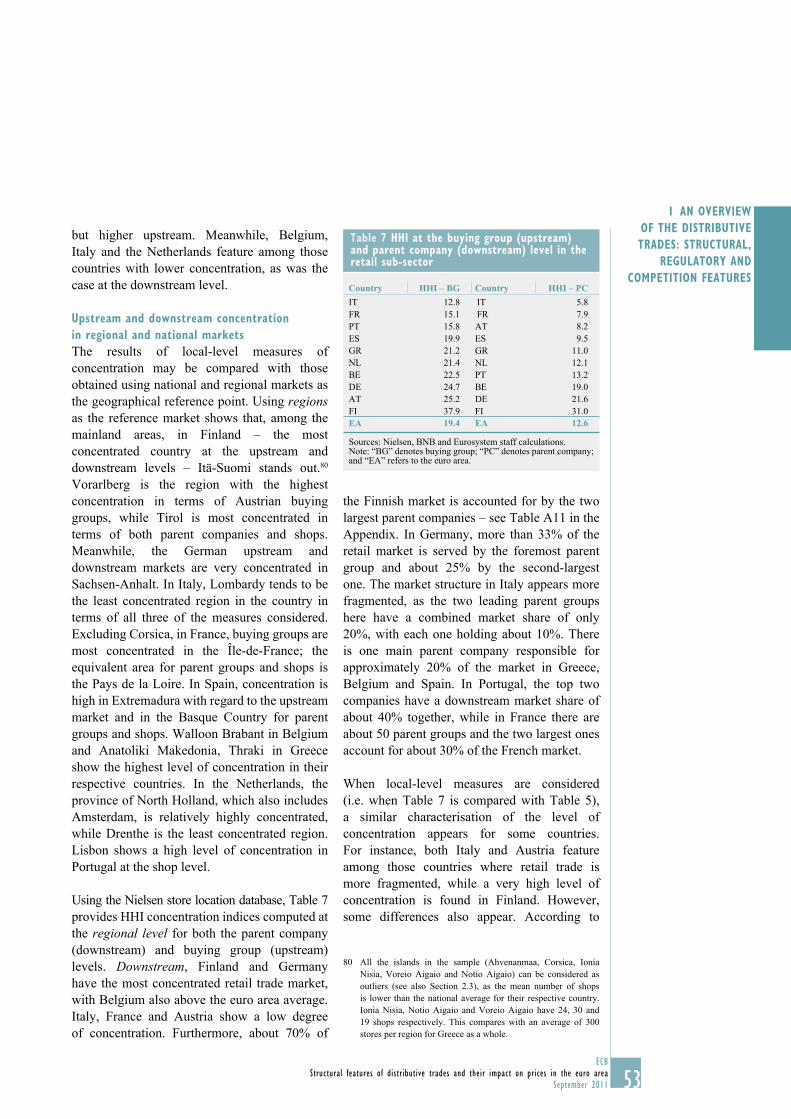
53ECB
Structural features of distributive trades and their impact on prices in the euro area
September 2011
I AN OVERVIEW
OF THE DISTRIBUTIVE
TRADES: STRUCTURAL,
REGULATORY AND
COMPETITION FEATURES
but higher upstream. Meanwhile, Belgium,
Italy and the Netherlands feature among those
countries with lower concentration, as was the
case at the downstream level.
Upstream and downstream concentration
in regional and national markets
The results of local-level measures of
concentration may be compared with those
obtained using national and regional markets as
the geographical reference point. Using regions
as the reference market shows that, among the
mainland areas, in Finland – the most
concentrated country at the upstream and
downstream levels – Itä-Suomi stands out.80
Vorarlberg is the region with the highest
concentration in terms of Austrian buying
groups, while Tirol is most concentrated in
terms of both parent companies and shops.
Meanwhile, the German upstream and
downstream markets are very concentrated in
Sachsen-Anhalt. In Italy, Lombardy tends to be
the least concentrated region in the country in
terms of all three of the measures considered.
Excluding Corsica, in France, buying groups are
most concentrated in the Île-de-France; the
equivalent area for parent groups and shops is
the Pays de la Loire. In Spain, concentration is
high in Extremadura with regard to the upstream
market and in the Basque Country for parent
groups and shops. Walloon Brabant in Belgium
and Anatoliki Makedonia, Thraki in Greece
show the highest level of concentration in their
respective countries. In the Netherlands, the
province of North Holland, which also includes
Amsterdam, is relatively highly concentrated,
while Drenthe is the least concentrated region.
Lisbon shows a high level of concentration in
Portugal at the shop level.
Using the Nielsen store location database, Table 7
provides HHI concentration indices computed at
the regional level for both the parent company
(downstream) and buying group (upstream)
levels. Downstream, Finland and Germany
have the most concentrated retail trade market,
with Belgium also above the euro area average.
Italy, France and Austria show a low degree
of concentration. Furthermore, about 70% of
the Finnish market is accounted for by the two
largest parent companies – see Table A11 in the
Appendix. In Germany, more than 33% of the
retail market is served by the foremost parent
group and about 25% by the second-largest
one. The market structure in Italy appears more
fragmented, as the two leading parent groups
here have a combined market share of only
20%, with each one holding about 10%. There
is one main parent company responsible for
approximately 20% of the market in Greece,
Belgium and Spain. In Portugal, the top two
companies have a downstream market share of
about 40% together, while in France there are
about 50 parent groups and the two largest ones
account for about 30% of the French market.
When local-level measures are considered
(i.e. when Table 7 is compared with Table 5),
a similar characterisation of the level of
concentration appears for some countries.
For instance, both Italy and Austria feature
among those countries where retail trade is
more fragmented, while a very high level of
concentration is found in Finland. However,
some differences also appear. According to
All the islands in the sample (Ahvenanmaa, Corsica, Ionia 80
Nisia, Voreio Aigaio and Notio Aigaio) can be considered as
outliers (see also Section 2.3), as the mean number of shops
is lower than the national average for their respective country.
Ionia Nisia, Notio Aigaio and Voreio Aigaio have 24, 30 and
19 shops respectively. This compares with an average of 300
stores per region for Greece as a whole.
Table 7 HHI at the buying group (upstream) and parent company (downstream) level in the retail sub-sector
Country HHI – BG Country HHI – PCIT 12.8 IT 5.8
FR 15.1 FR 7.9
PT 15.8 AT 8.2
ES 19.9 ES 9.5
GR 21.2 GR 11.0
NL 21.4 NL 12.1
BE 22.5 PT 13.2
DE 24.7 BE 19.0
AT 25.2 DE 21.6
FI 37.9 FI 31.0
EA 19.4 EA 12.6
Sources: Nielsen, BNB and Eurosystem staff calculations. Note: “BG” denotes buying group; “PC” denotes parent company; and “EA” refers to the euro area.
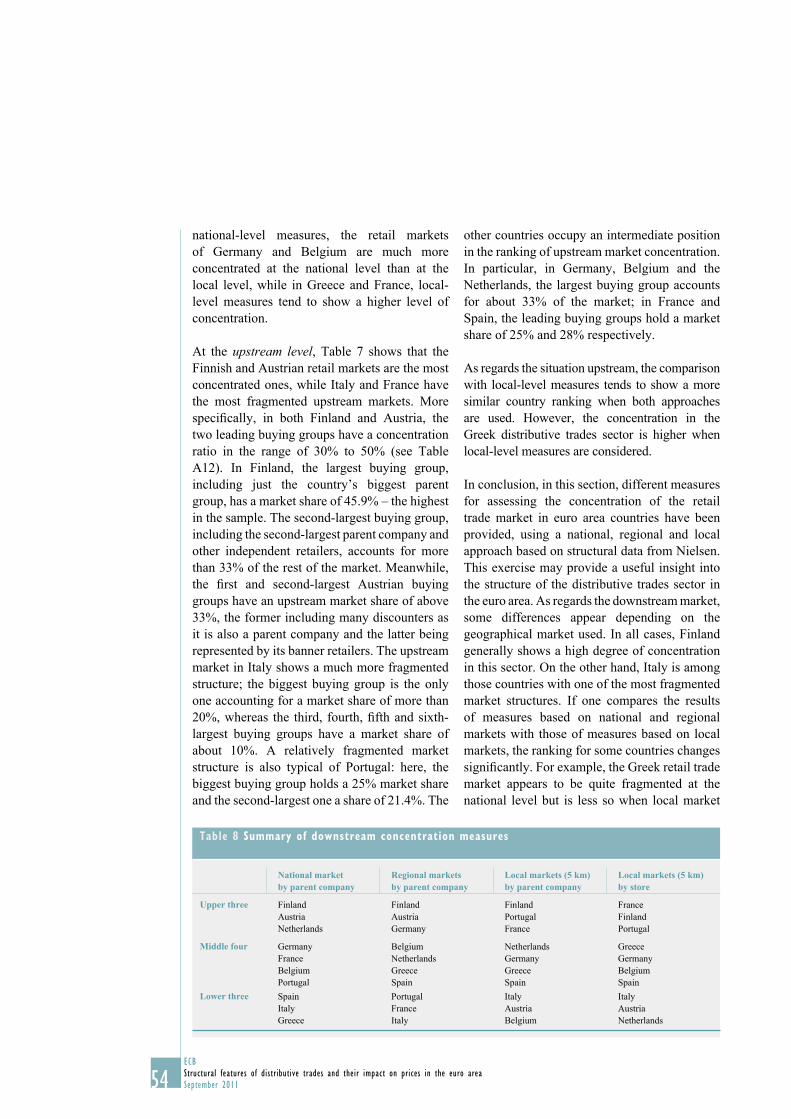
54ECB
Structural features of distributive trades and their impact on prices in the euro area
September 2011
national-level measures, the retail markets
of Germany and Belgium are much more
concentrated at the national level than at the
local level, while in Greece and France, local-
level measures tend to show a higher level of
concentration.
At the upstream level, Table 7 shows that the
Finnish and Austrian retail markets are the most
concentrated ones, while Italy and France have
the most fragmented upstream markets. More
specifi cally, in both Finland and Austria, the
two leading buying groups have a concentration
ratio in the range of 30% to 50% (see Table
A12). In Finland, the largest buying group,
including just the country’s biggest parent
group, has a market share of 45.9% – the highest
in the sample. The second-largest buying group,
including the second-largest parent company and
other independent retailers, accounts for more
than 33% of the rest of the market. Meanwhile,
the fi rst and second-largest Austrian buying
groups have an upstream market share of above
33%, the former including many discounters as
it is also a parent company and the latter being
represented by its banner retailers. The upstream
market in Italy shows a much more fragmented
structure; the biggest buying group is the only
one accounting for a market share of more than
20%, whereas the third, fourth, fi fth and sixth-
largest buying groups have a market share of
about 10%. A relatively fragmented market
structure is also typical of Portugal: here, the
biggest buying group holds a 25% market share
and the second-largest one a share of 21.4%. The
other countries occupy an intermediate position
in the ranking of upstream market concentration.
In particular, in Germany, Belgium and the
Netherlands, the largest buying group accounts
for about 33% of the market; in France and
Spain, the leading buying groups hold a market
share of 25% and 28% respectively.
As regards the situation upstream, the comparison
with local-level measures tends to show a more
similar country ranking when both approaches
are used. However, the concentration in the
Greek distributive trades sector is higher when
local-level measures are considered.
In conclusion, in this section, different measures
for assessing the concentration of the retail
trade market in euro area countries have been
provided, using a national, regional and local
approach based on structural data from Nielsen.
This exercise may provide a useful insight into
the structure of the distributive trades sector in
the euro area. As regards the downstream market,
some differences appear depending on the
geographical market used. In all cases, Finland
generally shows a high degree of concentration
in this sector. On the other hand, Italy is among
those countries with one of the most fragmented
market structures. If one compares the results
of measures based on national and regional
markets with those of measures based on local
markets, the ranking for some countries changes
signifi cantly. For example, the Greek retail trade
market appears to be quite fragmented at the
national level but is less so when local market
Table 8 Summary of downstream concentration measures
National market by parent company
Regional markets by parent company
Local markets (5 km) by parent company
Local markets (5 km) by store
Upper three Finland
Austria
Netherlands
Finland
Austria
Germany
Finland
Portugal
France
France
Finland
Portugal
Middle four Germany
France
Belgium
Portugal
Belgium
Netherlands
Greece
Spain
Netherlands
Germany
Greece
Spain
Greece
Germany
Belgium
Spain
Lower three Spain
Italy
Greece
Portugal
France
Italy
Italy
Austria
Belgium
Italy
Austria
Netherlands
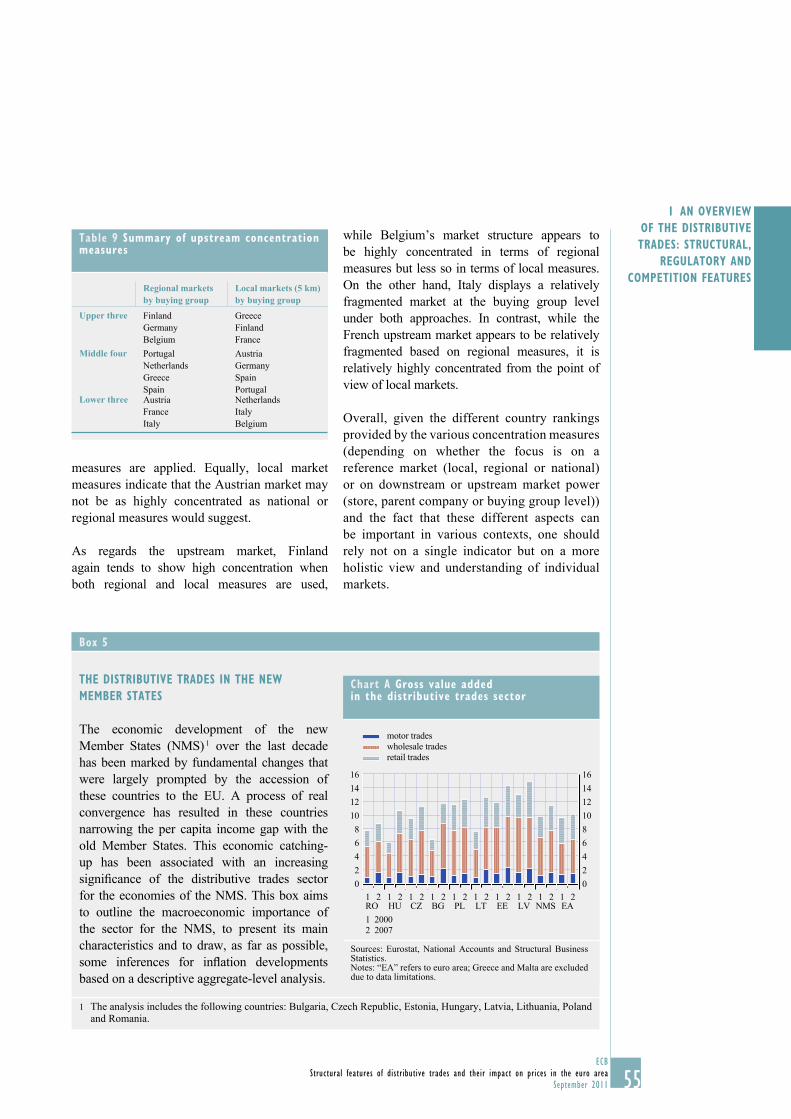
55ECB
Structural features of distributive trades and their impact on prices in the euro area
September 2011
I AN OVERVIEW
OF THE DISTRIBUTIVE
TRADES: STRUCTURAL,
REGULATORY AND
COMPETITION FEATURES
measures are applied. Equally, local market
measures indicate that the Austrian market may
not be as highly concentrated as national or
regional measures would suggest.
As regards the upstream market, Finland
again tends to show high concentration when
both regional and local measures are used,
while Belgium’s market structure appears to
be highly concentrated in terms of regional
measures but less so in terms of local measures.
On the other hand, Italy displays a relatively
fragmented market at the buying group level
under both approaches. In contrast, while the
French upstream market appears to be relatively
fragmented based on regional measures, it is
relatively highly concentrated from the point of
view of local markets.
Overall, given the different country rankings
provided by the various concentration measures
(depending on whether the focus is on a
reference market (local, regional or national)
or on downstream or upstream market power
(store, parent company or buying group level))
and the fact that these different aspects can
be important in various contexts, one should
rely not on a single indicator but on a more
holistic view and understanding of individual
markets.
Box 5
THE DISTRIBUTIVE TRADES IN THE NEW
MEMBER STATES
The economic development of the new
Member States (NMS) 1 over the last decade
has been marked by fundamental changes that
were largely prompted by the accession of
these countries to the EU. A process of real
convergence has resulted in these countries
narrowing the per capita income gap with the
old Member States. This economic catching-
up has been associated with an increasing
signifi cance of the distributive trades sector
for the economies of the NMS. This box aims
to outline the macroeconomic importance of
the sector for the NMS, to present its main
characteristics and to draw, as far as possible,
some inferences for infl ation developments
based on a descriptive aggregate-level analysis.
1 The analysis includes the following countries: Bulgaria, Czech Republic, Estonia, Hungary, Latvia, Lithuania, Poland and Romania.
Table 9 Summary of upstream concentration measures
Regional markets by buying group
Local markets (5 km) by buying group
Upper three Finland
Germany
Belgium
Greece
Finland
France
Middle four Portugal
Netherlands
Greece
Spain
Austria
Germany
Spain
PortugalLower three Austria
France
Italy
Netherlands
Italy
Belgium
Chart A Gross value added in the distributive trades sector
0
2
4
6
8
10
12
14
16
0
2
4
6
8
10
12
14
16
RO HU CZ BG PL LT EE LV NMS EA1 1 1 1 1 1 1 1 1 12 2 2 2 2 2 2 2 2 2
1 2000
2 2007
motor trades
wholesale trades
retail trades
Sources: Eurostat, National Accounts and Structural Business Statistics. Notes: “EA” refers to euro area; Greece and Malta are excluded due to data limitations.
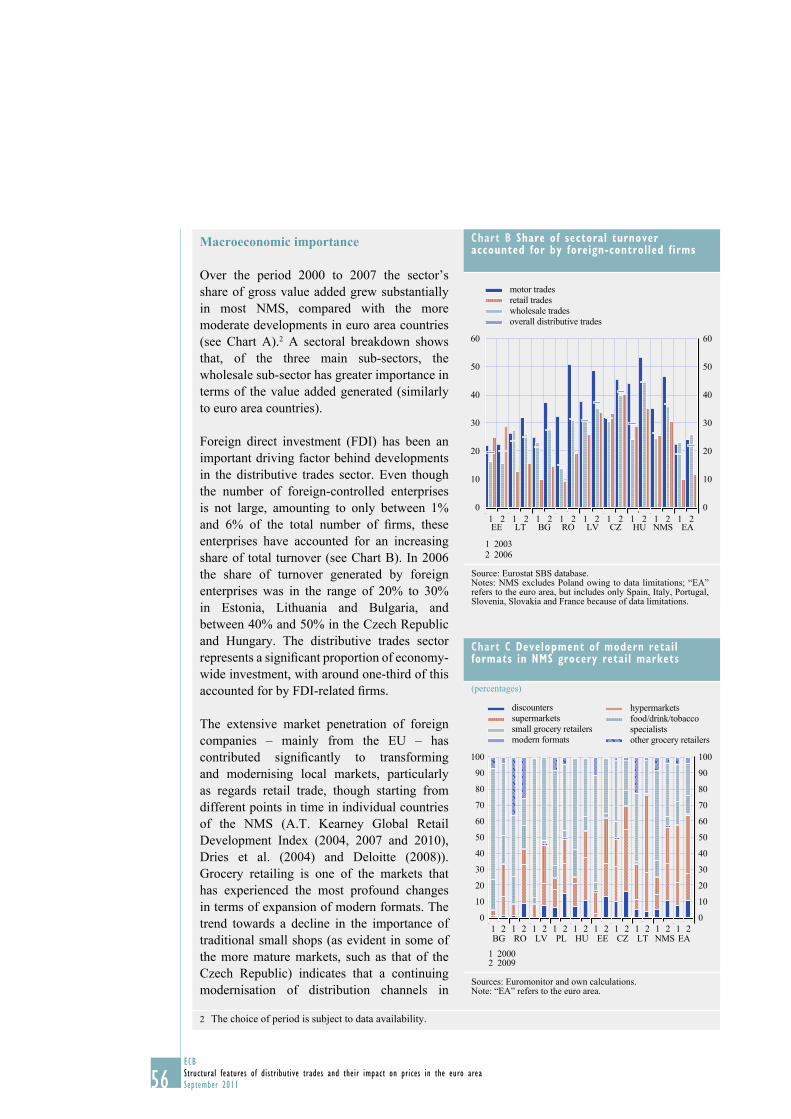
56ECB
Structural features of distributive trades and their impact on prices in the euro area
September 2011
Macroeconomic importance
Over the period 2000 to 2007 the sector’s
share of gross value added grew substantially
in most NMS, compared with the more
moderate developments in euro area countries
(see Chart A).2 A sectoral breakdown shows
that, of the three main sub-sectors, the
wholesale sub-sector has greater importance in
terms of the value added generated (similarly
to euro area countries).
Foreign direct investment (FDI) has been an
important driving factor behind developments
in the distributive trades sector. Even though
the number of foreign-controlled enterprises
is not large, amounting to only between 1%
and 6% of the total number of fi rms, these
enterprises have accounted for an increasing
share of total turnover (see Chart B). In 2006
the share of turnover generated by foreign
enterprises was in the range of 20% to 30%
in Estonia, Lithuania and Bulgaria, and
between 40% and 50% in the Czech Republic
and Hungary. The distributive trades sector
represents a signifi cant proportion of economy-
wide investment, with around one-third of this
accounted for by FDI-related fi rms.
The extensive market penetration of foreign
companies – mainly from the EU – has
contributed signifi cantly to transforming
and modernising local markets, particularly
as regards retail trade, though starting from
different points in time in individual countries
of the NMS (A.T. Kearney Global Retail
Development Index (2004, 2007 and 2010),
Dries et al. (2004) and Deloitte (2008)).
Grocery retailing is one of the markets that
has experienced the most profound changes
in terms of expansion of modern formats. The
trend towards a decline in the importance of
traditional small shops (as evident in some of
the more mature markets, such as that of the
Czech Republic) indicates that a continuing
modernisation of distribution channels in
2 The choice of period is subject to data availability.
Chart B Share of sectoral turnover accounted for by foreign-controlled firms
0
10
20
30
40
50
60
0
10
20
30
40
50
60
EE LT BG RO LV CZ HU NMS EA
motor trades
wholesale trades
retail trades
overall distributive trades
1 2003
2 2006
21 21 21 21 21 21 21 21 21
Source: Eurostat SBS database.Notes: NMS excludes Poland owing to data limitations; “EA” refers to the euro area, but includes only Spain, Italy, Portugal, Slovenia, Slovakia and France because of data limitations.
Chart C Development of modern retail formats in NMS grocery retail markets
(percentages)
0
10
20
30
40
50
60
70
80
90
100
0
10
20
30
40
50
60
70
80
90
100
1 20002 2009
BG RO LV PL HU EE CZ LT NMS EA
discounters hypermarketssupermarkets food/drink/tobacco
specialistssmall grocery retailers
other grocery retailersmodern formats
1 2 1 2 1 2 1 2 1 2 1 2 1 2 1 2 1 2 1 2
Sources: Euromonitor and own calculations.Note: “EA” refers to the euro area.
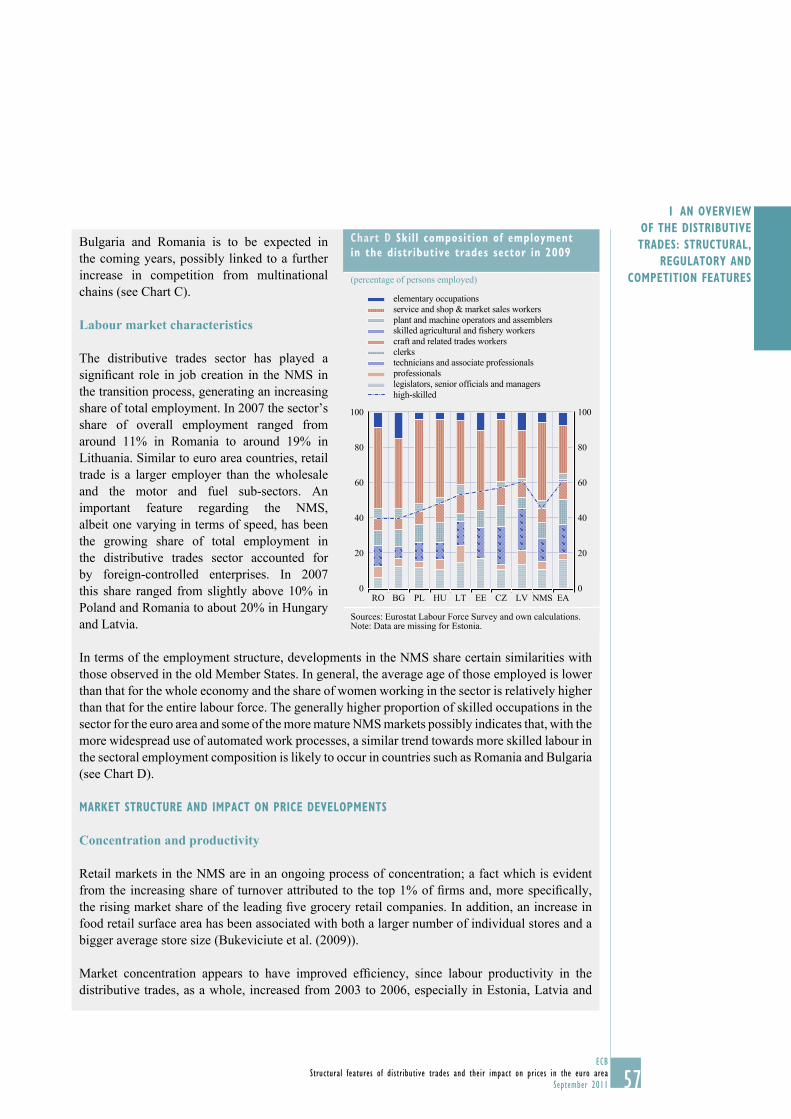
57ECB
Structural features of distributive trades and their impact on prices in the euro area
September 2011
I AN OVERVIEW
OF THE DISTRIBUTIVE
TRADES: STRUCTURAL,
REGULATORY AND
COMPETITION FEATURES
Bulgaria and Romania is to be expected in
the coming years, possibly linked to a further
increase in competition from multinational
chains (see Chart C).
Labour market characteristics
The distributive trades sector has played a
signifi cant role in job creation in the NMS in
the transition process, generating an increasing
share of total employment. In 2007 the sector’s
share of overall employment ranged from
around 11% in Romania to around 19% in
Lithuania. Similar to euro area countries, retail
trade is a larger employer than the wholesale
and the motor and fuel sub-sectors. An
important feature regarding the NMS,
albeit one varying in terms of speed, has been
the growing share of total employment in
the distributive trades sector accounted for
by foreign-controlled enterprises. In 2007
this share ranged from slightly above 10% in
Poland and Romania to about 20% in Hungary
and Latvia.
In terms of the employment structure, developments in the NMS share certain similarities with
those observed in the old Member States. In general, the average age of those employed is lower
than that for the whole economy and the share of women working in the sector is relatively higher
than that for the entire labour force. The generally higher proportion of skilled occupations in the
sector for the euro area and some of the more mature NMS markets possibly indicates that, with the
more widespread use of automated work processes, a similar trend towards more skilled labour in
the sectoral employment composition is likely to occur in countries such as Romania and Bulgaria
(see Chart D).
MARKET STRUCTURE AND IMPACT ON PRICE DEVELOPMENTS
Concentration and productivity
Retail markets in the NMS are in an ongoing process of concentration; a fact which is evident
from the increasing share of turnover attributed to the top 1% of fi rms and, more specifi cally,
the rising market share of the leading fi ve grocery retail companies. In addition, an increase in
food retail surface area has been associated with both a larger number of individual stores and a
bigger average store size (Bukeviciute et al. (2009)).
Market concentration appears to have improved effi ciency, since labour productivity in the
distributive trades, as a whole, increased from 2003 to 2006, especially in Estonia, Latvia and
Chart D Skill composition of employment
in the distributive trades sector in 2009
(percentage of persons employed)
0
20
40
60
80
100
0
20
40
60
80
100
RO BG PL HU LT EE CZ LV NMS EA
elementary occupations
service and shop & market sales workers
plant and machine operators and assemblers
skilled agricultural and fishery workers
craft and related trades workers
clerks
technicians and associate professionals
professionals
legislators, senior officials and managers
high-skilled
Sources: Eurostat Labour Force Survey and own calculations. Note: Data are missing for Estonia.
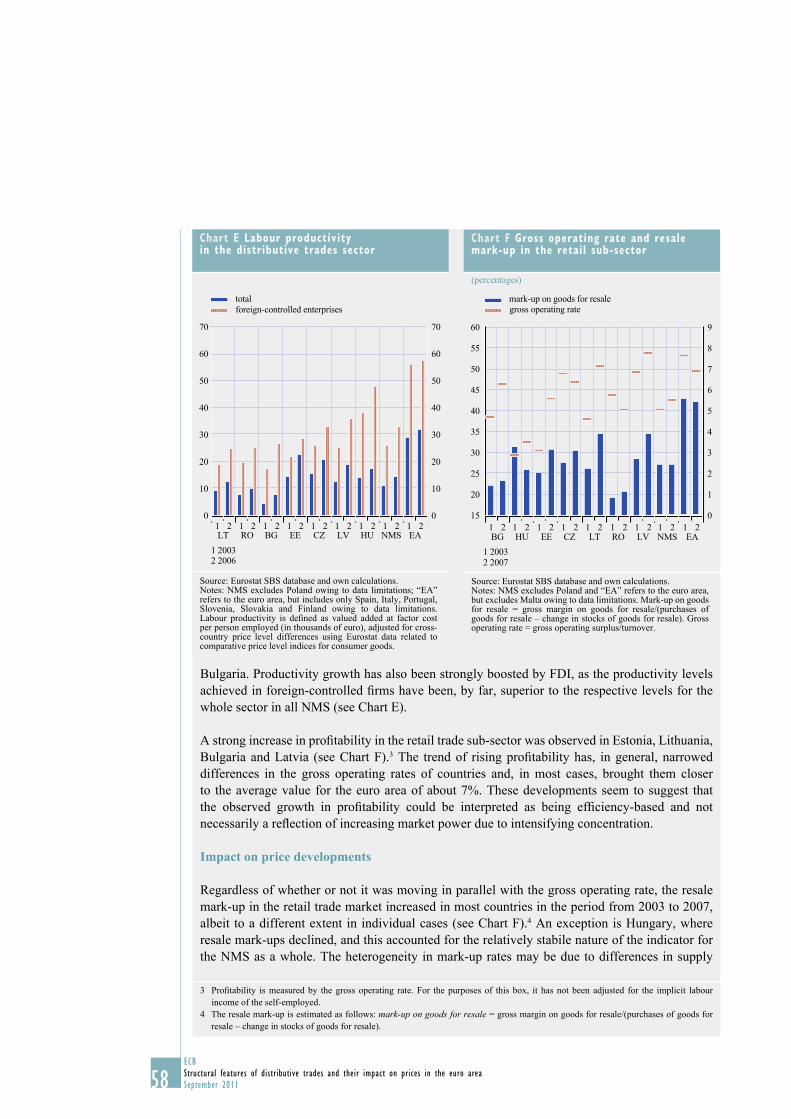
58ECB
Structural features of distributive trades and their impact on prices in the euro area
September 2011
Bulgaria. Productivity growth has also been strongly boosted by FDI, as the productivity levels
achieved in foreign-controlled fi rms have been, by far, superior to the respective levels for the
whole sector in all NMS (see Chart E).
A strong increase in profi tability in the retail trade sub-sector was observed in Estonia, Lithuania,
Bulgaria and Latvia (see Chart F).3 The trend of rising profi tability has, in general, narrowed
differences in the gross operating rates of countries and, in most cases, brought them closer
to the average value for the euro area of about 7%. These developments seem to suggest that
the observed growth in profi tability could be interpreted as being effi ciency-based and not
necessarily a refl ection of increasing market power due to intensifying concentration.
Impact on price developments
Regardless of whether or not it was moving in parallel with the gross operating rate, the resale
mark-up in the retail trade market increased in most countries in the period from 2003 to 2007,
albeit to a different extent in individual cases (see Chart F).4 An exception is Hungary, where
resale mark-ups declined, and this accounted for the relatively stabile nature of the indicator for
the NMS as a whole. The heterogeneity in mark-up rates may be due to differences in supply
3 Profi tability is measured by the gross operating rate. For the purposes of this box, it has not been adjusted for the implicit labour
income of the self-employed.
4 The resale mark-up is estimated as follows: mark-up on goods for resale = gross margin on goods for resale/(purchases of goods for
resale – change in stocks of goods for resale).
Chart E Labour productivity in the distributive trades sector
0
10
20
30
40
50
60
70
0
10
20
30
40
50
60
70
21 21 21 21 21 21 2121 21
1 20032 2006
LT RO BG EE CZ LV HU NMS EA
total
foreign-controlled enterprises
Source: Eurostat SBS database and own calculations.Notes: NMS excludes Poland owing to data limitations; “EA” refers to the euro area, but includes only Spain, Italy, Portugal, Slovenia, Slovakia and Finland owing to data limitations. Labour productivity is defi ned as valued added at factor cost per person employed (in thousands of euro), adjusted for cross-country price level differences using Eurostat data related to comparative price level indices for consumer goods.
Chart F Gross operating rate and resale mark-up in the retail sub-sector
(percentages)
15
20
25
30
35
40
45
50
55
60
BG HU EE CZ LT RO LV NMS EA
0
1
2
3
4
5
6
7
8
9
mark-up on goods for resalegross operating rate
1 2003
2 2007
1 2 1 2 1 2 1 2 1 2 1 2 1 2 1 2 1 2
Source: Eurostat SBS database and own calculations.Notes: NMS excludes Poland and “EA” refers to the euro area, but excludes Malta owing to data limitations. Mark-up on goods for resale = gross margin on goods for resale/(purchases of goods for resale – change in stocks of goods for resale). Gross operating rate = gross operating surplus/turnover.
59ECB
Structural features of distributive trades and their impact on prices in the euro area
September 2011
I AN OVERVIEW
OF THE DISTRIBUTIVE
TRADES: STRUCTURAL,
REGULATORY AND
COMPETITION FEATURES
chains, relationships with service providers, subcontractors, etc. Hence, it is diffi cult to tell
whether resale mark-up dynamics alone can explain infl ation developments in these countries.
Whilst rising mark-up rates may be one of the driving factors behind infl ation in the Baltic
countries, in the case of Bulgaria, infl ation rates were elevated despite modest mark-up rates.
It is also hard to disentangle developments in the structure of retail markets and in mark-ups from
other conjunctural or fundamental factors, such as the business cycle, the input cost structure
relating to production, the labour market, convergence processes, etc.
The empirical evidence on the implications of retail pricing policies for consumer prices in
the NMS is rather limited. Podpiera and Raková (2008) fi nd that, in the Czech Republic, the
increasing number of stores in the fast-moving consumer goods market over the period 2000 to
2005 resulted in prices declining, on average, by 0.8 percentage point a year. In contrast, they
expect the strengthening of the consolidation processes will lead to overall infl ation increasing
by 0.5 percentage point a year by 2020. When examining the functioning of the food supply
chain, Bukeviciute et al. (2009) indicate that the lack of suffi cient competitive pressures at the
retail level could be one of the factors behind the higher price increases in NMS, compared with
the euro area. The authors argue that consolidation processes may be associated with effi ciency
gains and result in lower prices, but emphasise that increasing concentration could also lead to
anti-competitive developments and price increases. In the case of the NMS, the authors fi nd that
the growing number of retail stores had a certain dampening effect on consumer food prices in
the period from 2003 to 2007.
In conclusion, the distributive trades sector has been of increasing importance to the economies
of the NMS, playing a signifi cant role in job creation during the transition process. Prompted
by the accession of these countries to the EU and their growth prospects, FDI has been
instrumental in the fast development and modernisation of this sector. FDI has contributed
strongly to enhancing productivity in all countries. At present, NMS retail markets are in an
ongoing process of consolidation which, in most cases, has been accompanied by a general
trend of increasing profi tability. This has led to a narrowing of profi tability differentials and has
pushed profi t levels closer to the average for the euro area. Although resale mark-ups in the retail
sub-sector have been on the rise in most countries, the possible implications of these
developments for overall infl ation at an aggregate level are hard to disentangle from specifi c
local factors as well as from other factors, such as the business cycle and convergence processes.
Nonetheless, looking forward, given the ongoing trend towards consolidation, it is imperative that
policymakers ensure adequate competition and “smart” regulation to minimise infl ationary
tendencies.
60ECB
Structural features of distributive trades and their impact on prices in the euro area
September 2011
2 THE IMPACT OF STRUCTURAL FEATURES
ON PRICE LEVELS, PRICE-SETTING
BEHAVIOUR, REGIONAL PRICE DYNAMICS
AND PASS-THROUGH
2.1 THE IMPACT OF STRUCTURAL FEATURES
ON PRICE LEVEL DIFFERENCES
The aim of this section is threefold: (1) to provide a descriptive overview of price level differences across the euro area in terms of their magnitude and characteristics across countries and products; (2) to examine the degree of convergence or otherwise in price levels; and (3) to combine information on the structural aspects of the retail sub-sector with other indicators in order to assess the extent to which these structural aspects help us to understand price level differences and convergence.
The main fi ndings are as follows. (1) There remains a considerable degree of price dispersion across the euro area. Whilst this is lower, on average, for goods than for services, it is still sizeable in most cases – it tends to be lower for electronics and for clothing and footwear goods but higher for food products. (2) Even though different measures suggest differing degrees of convergence, it seems that a limited degree of convergence has indeed taken place, but that this came to a halt around the period 2004 to 2006. (3) There is compelling evidence of a strong “border effect” across euro area countries, which suggests ample scope for further improving the Single Market. (4) Even after controlling for factors such as income levels and VAT rates, the structural and regulatory features of the distributive trades sector appear to play a role in explaining differences in price levels across countries.
2.1.1 INTRODUCTION AND MOTIVATION
There have been numerous studies of price
level differences and dispersion in Europe,
but the evidence about the link between
cross-country price differentials and the
structural features of the distributive trades
sector is scarce.
Faber and Stokman (2009) consider price level
convergence at an aggregated level by combining
overall HICP/CPI and PPP data over a long time
period (from 1960 to 2003) as well as at a slightly
more disaggregated level 81 over a shorter time
period (from 1980 to 2003). They fi nd evidence
of price level convergence in Europe over a long
period of 40 to 50 years, which they attribute to
the harmonisation of indirect taxes and to non-
traded and traded input costs (via exchange rates
and economic openness). They also fi nd that
price level dispersion in the United States over
the same period was broadly stable; at a level
that was only reached in the EU towards the end
of their sample period in 2003. They also “note
that price level dispersion between the EMU
countries already converged close to that in the
United States before the introduction of the euro”,
perhaps implying that further substantial progress
in price convergence could not be expected.
Similarly, in a comprehensive study of the impact
of the euro on prices, Sturm et al. (2009) conclude
that “overall, the results from the literature are
fairly conclusive. There is generally little evidence
that price levels among EMU member countries
have converged due to the introduction of a
common currency. For one thing, price dispersion
among EMU member countries was already
disproportionately low at the time when the euro
was adopted.” In their own analysis, they also
argue that there is not much evidence in favour of
price convergence in the post-EMU period, despite
there being some convergence for specifi c products.
Similarly, the Deutsche Bundesbank (2009) has
also investigated price convergence in the euro
area in the fi rst decade of EMU, concluding that
“the empirical fi ndings point, at most, to a marginal
convergence of prices as an underlying trend”.82
They looked at seven sub-components: food, alcoholic beverages 81
and tobacco, clothing and footwear, housing, furnishings,
transport and communications, and recreation and culture.
Berka and Devereux (2010) also combine PPP data with HICP 82
data to study price level convergence. They fi nd that price
dispersion is higher for non-tradables than tradables. They
report little or no convergence for euro area countries but some
for new Member States.
61ECB
Structural features of distributive trades and their impact on prices in the euro area
September 2011
2 THE IMPACT OF
STRUCTURAL FEATURES
ON PRICE LEVELS,
PRICE-SETTING
BEHAVIOUR, REGIONAL
PRICE DYNAMICS AND
PASS-THROUGH
In terms of the determinants of price
differences, Berka and Devereux (2010) argue
that real exchange rates are very closely tied
to relative GDP per capita within Europe,
both across countries and over time. In this
regard, Andersson et al. (2009) also fi nd
that price level differences are a function of
GDP per capita, whilst arguing that infl ation
differences are a function of the business cycle
and persistence and that the latter is, in turn,
a function of administered prices and product
market regulation.
At a more sectoral and micro level, there have
been a number of studies that have looked at the
structural features of the distributive trades
sector and their impact on price levels, pricing
behaviour and infl ation. However, many of these
have been country-specifi c.83 In Italy, Schivardi
and Viviano (2010), in a study of regional data,
fi nd that entry barriers are associated with
substantially larger profi t margins and lower
productivity on the part of existing incumbent
fi rms. In areas with more stringent market entry
regulation, lower productivity coupled with
larger margins results in higher consumer prices.
For Spain, Matea and Mora (2009) fi nd that an
increase in the level of regulation at the regional
level increases infl ation and also diminishes
employment in the retail trades.84 In Finland,
Kotilainen et al. (2010) have found that VAT
and cost disadvantages, such as a northern
location and low population density, were
signifi cant factors behind higher prices here.85
In a recent study, the European Commission
(2010) highlighted considerable price
differences within the internal market,
prompting the suggestion that the internal
market is still fragmented. For example, the
Commission noted that the price of food and
non-alcoholic beverages is, on average, 28.4%
higher in Belgium than in the Netherlands, and
that for certain common retail pharmaceutical
products, the price difference can reach a factor
of one to fi ve. On the other hand, with regard
to the clothing retail market, the Commission
commented that “it is surprising to note that
prices in Ireland, France and the United Kingdom
are below the EU average whilst those in the
Czech Republic and Slovakia are considerably
higher than average”. This suggests that several
factors, such as differences in average household
disposable income or VAT, explain certain
price differences, whilst other factors related
to competition, the regulatory framework or
commercial practices (e.g. territorial supply
constraints or obstacles to parallel trade), also
play a role. However, the comparability of price
level data is sometimes questioned.
Before trying to assess the impact of the
structural features of the distributive trades
sector on price level differences across euro area
countries, there is fi rst a descriptive analysis of
price dispersion.
2.1.2 THE DEGREE OF PRICE DISPERSION
AND CONVERGENCE
This section analyses the pattern of price
dispersion over the past decade for a set of
consumer prices and investigates the degree,
if any, of convergence. More specifi cally, it
uses data containing information on relative
price levels for a detailed set of products
made available from Eurostat’s PPP database
and derives simple statistics of convergence
for these products. This analysis provides a
fi rst impression of the extent to which price
convergence prevails across countries and
classes of products, such as tradables and non-
tradables. A number of different indicators
A notable exception is Francois et al. (2008) who study the 83
pass-through from producer and import prices across a range
of consumer goods products and countries, fi nding “signifi cant
interaction between various measures of retail structure and the
rate of pass-through”.
In Finland, Rantala (2007) measures competition using the price 84
cost margin and the Boone competition indicators discussed in
Chapter 1.3 and shows that competition in the Finnish private
service sectors is roughly equal to competition in other EU and
OECD countries. Thus, it is argued that the high consumer price
level in Finland cannot be explained by the lack of competition
in the Finnish service sectors. As regards Spain, Hoffmeister
(2009) argues that “price convergence emerges in Spain once
regional barriers to entry have been accounted for”. However,
it should be noted that this study looks at infl ation rather than
price levels.
They suggest that the most important reasons why the consumer 85
price level is higher in Finland than in other EU countries are the
high level of housing prices and value added and other product
tax rates in this country.
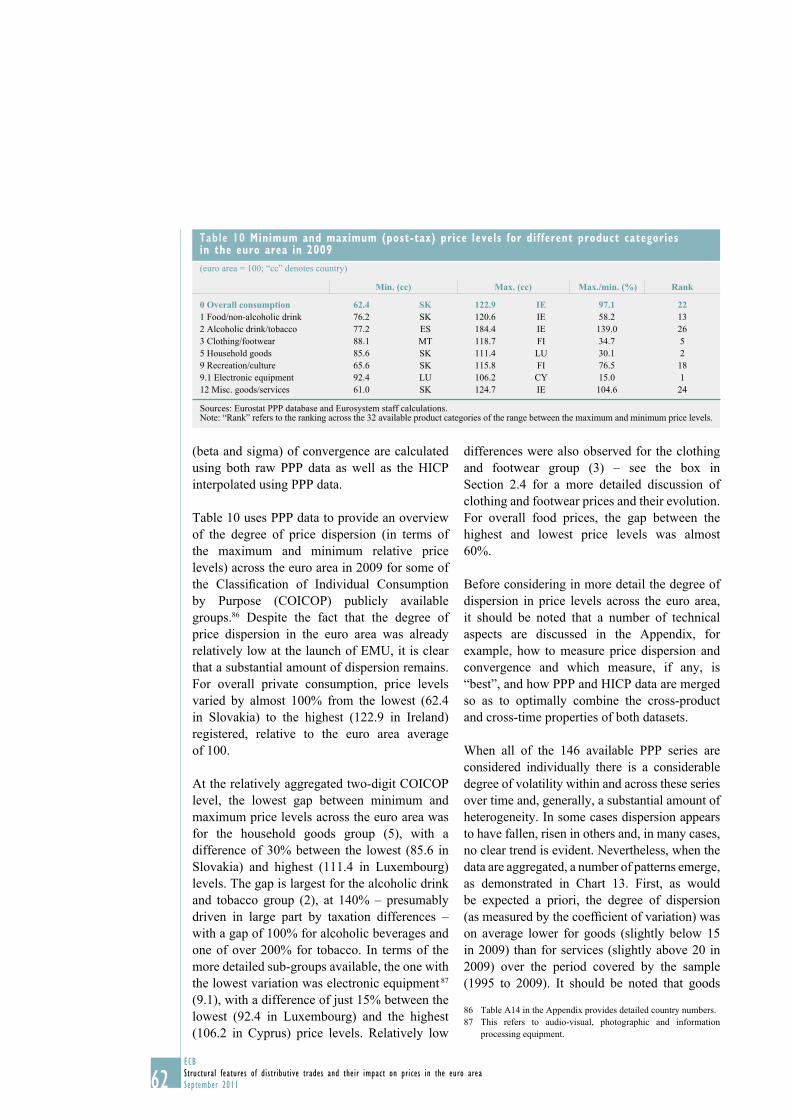
62ECB
Structural features of distributive trades and their impact on prices in the euro area
September 2011
(beta and sigma) of convergence are calculated
using both raw PPP data as well as the HICP
interpolated using PPP data.
Table 10 uses PPP data to provide an overview
of the degree of price dispersion (in terms of
the maximum and minimum relative price
levels) across the euro area in 2009 for some of
the Classifi cation of Individual Consumption
by Purpose (COICOP) publicly available
groups.86 Despite the fact that the degree of
price dispersion in the euro area was already
relatively low at the launch of EMU, it is clear
that a substantial amount of dispersion remains.
For overall private consumption, price levels
varied by almost 100% from the lowest (62.4
in Slovakia) to the highest (122.9 in Ireland)
registered, relative to the euro area average
of 100.
At the relatively aggregated two-digit COICOP
level, the lowest gap between minimum and
maximum price levels across the euro area was
for the household goods group (5), with a
difference of 30% between the lowest (85.6 in
Slovakia) and highest (111.4 in Luxembourg)
levels. The gap is largest for the alcoholic drink
and tobacco group (2), at 140% – presumably
driven in large part by taxation differences –
with a gap of 100% for alcoholic beverages and
one of over 200% for tobacco. In terms of the
more detailed sub-groups available, the one with
the lowest variation was electronic equipment 87
(9.1), with a difference of just 15% between the
lowest (92.4 in Luxembourg) and the highest
(106.2 in Cyprus) price levels. Relatively low
differences were also observed for the clothing
and footwear group (3) – see the box in
Section 2.4 for a more detailed discussion of
clothing and footwear prices and their evolution.
For overall food prices, the gap between the
highest and lowest price levels was almost
60%.
Before considering in more detail the degree of
dispersion in price levels across the euro area,
it should be noted that a number of technical
aspects are discussed in the Appendix, for
example, how to measure price dispersion and
convergence and which measure, if any, is
“best”, and how PPP and HICP data are merged
so as to optimally combine the cross-product
and cross-time properties of both datasets.
When all of the 146 available PPP series are
considered individually there is a considerable
degree of volatility within and across these series
over time and, generally, a substantial amount of
heterogeneity. In some cases dispersion appears
to have fallen, risen in others and, in many cases,
no clear trend is evident. Nevertheless, when the
data are aggregated, a number of patterns emerge,
as demonstrated in Chart 13. First, as would
be expected a priori, the degree of dispersion
(as measured by the coeffi cient of variation) was
on average lower for goods (slightly below 15
in 2009) than for services (slightly above 20 in
2009) over the period covered by the sample
(1995 to 2009). It should be noted that goods
Table A14 in the Appendix provides detailed country numbers.86
This refers to audio-visual, photographic and information 87
processing equipment.
Table 10 Minimum and maximum (post-tax) price levels for different product categories in the euro area in 2009
(euro area = 100; “cc” denotes country)
Min. (cc) Max. (cc) Max./min. (%) Rank
0 Overall consumption 62.4 SK 122.9 IE 97.1 221 Food/non-alcoholic drink 76.2 SK 120.6 IE 58.2 13
2 Alcoholic drink/tobacco 77.2 ES 184.4 IE 139.0 26
3 Clothing/footwear 88.1 MT 118.7 FI 34.7 5
5 Household goods 85.6 SK 111.4 LU 30.1 2
9 Recreation/culture 65.6 SK 115.8 FI 76.5 18
9.1 Electronic equipment 92.4 LU 106.2 CY 15.0 1
12 Misc. goods/services 61.0 SK 124.7 IE 104.6 24
Sources: Eurostat PPP database and Eurosystem staff calculations.Note: “Rank” refers to the ranking across the 32 available product categories of the range between the maximum and minimum price levels.
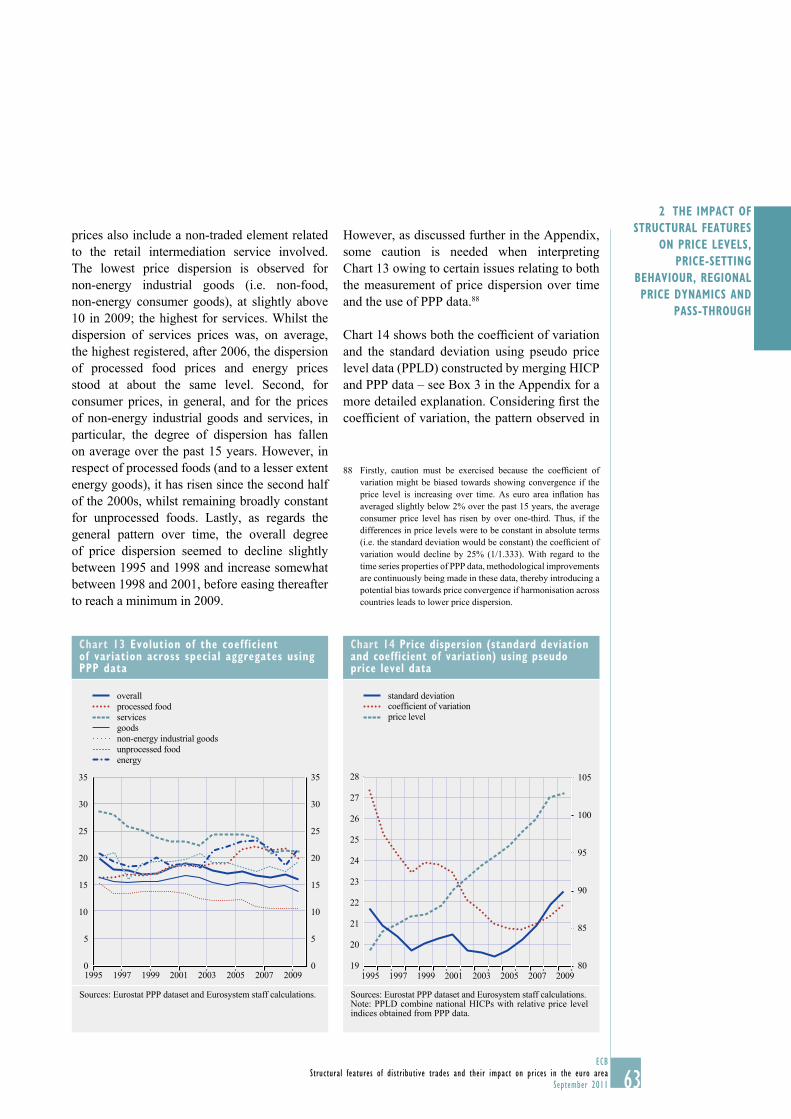
63ECB
Structural features of distributive trades and their impact on prices in the euro area
September 2011
2 THE IMPACT OF
STRUCTURAL FEATURES
ON PRICE LEVELS,
PRICE-SETTING
BEHAVIOUR, REGIONAL
PRICE DYNAMICS AND
PASS-THROUGH
prices also include a non-traded element related
to the retail intermediation service involved.
The lowest price dispersion is observed for
non-energy industrial goods (i.e. non-food,
non-energy consumer goods), at slightly above
10 in 2009; the highest for services. Whilst the
dispersion of services prices was, on average,
the highest registered, after 2006, the dispersion
of processed food prices and energy prices
stood at about the same level. Second, for
consumer prices, in general, and for the prices
of non-energy industrial goods and services, in
particular, the degree of dispersion has fallen
on average over the past 15 years. However, in
respect of processed foods (and to a lesser extent
energy goods), it has risen since the second half
of the 2000s, whilst remaining broadly constant
for unprocessed foods. Lastly, as regards the
general pattern over time, the overall degree
of price dispersion seemed to decline slightly
between 1995 and 1998 and increase somewhat
between 1998 and 2001, before easing thereafter
to reach a minimum in 2009.
However, as discussed further in the Appendix,
some caution is needed when interpreting
Chart 13 owing to certain issues relating to both
the measurement of price dispersion over time
and the use of PPP data.88
Chart 14 shows both the coeffi cient of variation
and the standard deviation using pseudo price
level data (PPLD) constructed by merging HICP
and PPP data – see Box 3 in the Appendix for a
more detailed explanation. Considering fi rst the
coeffi cient of variation, the pattern observed in
Firstly, caution must be exercised because the coeffi cient of 88
variation might be biased towards showing convergence if the
price level is increasing over time. As euro area infl ation has
averaged slightly below 2% over the past 15 years, the average
consumer price level has risen by over one-third. Thus, if the
differences in price levels were to be constant in absolute terms
(i.e. the standard deviation would be constant) the coeffi cient of
variation would decline by 25% (1/1.333). With regard to the
time series properties of PPP data, methodological improvements
are continuously being made in these data, thereby introducing a
potential bias towards price convergence if harmonisation across
countries leads to lower price dispersion.
Chart 13 Evolution of the coefficient of variation across special aggregates using PPP data
0
5
10
15
20
25
30
35
0
5
10
15
20
25
30
35
1995 1997 1999 2001 2003 2005 2007 2009
overall
goods
unprocessed food
processed food
non-energy industrial goods
energy
services
Sources: Eurostat PPP dataset and Eurosystem staff calculations.
Chart 14 Price dispersion (standard deviation and coefficient of variation) using pseudo price level data
19
20
21
22
23
24
25
26
27
28
1995 1997 1999 2001 2003 2005 2007 200980
85
90
95
100
105
standard deviationcoefficient of variation
price level
Sources: Eurostat PPP dataset and Eurosystem staff calculations.Note: PPLD combine national HICPs with relative price level indices obtained from PPP data.
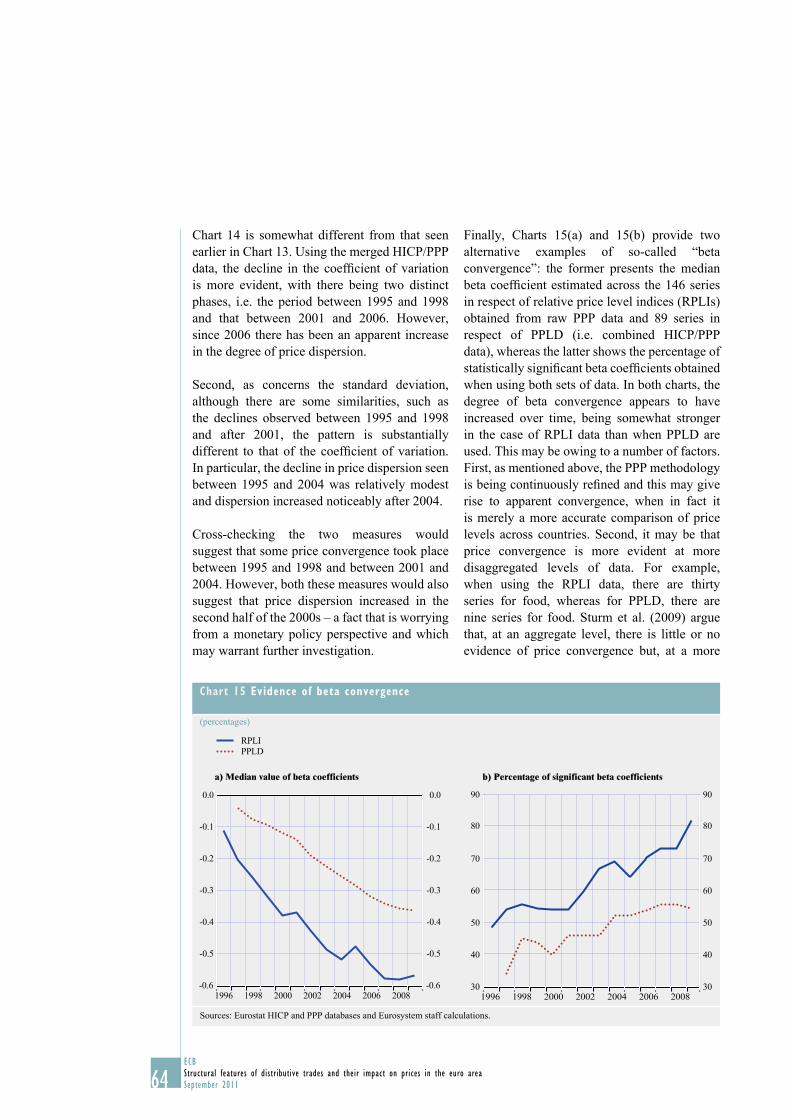
64ECB
Structural features of distributive trades and their impact on prices in the euro area
September 2011
Chart 14 is somewhat different from that seen
earlier in Chart 13. Using the merged HICP/PPP
data, the decline in the coeffi cient of variation
is more evident, with there being two distinct
phases, i.e. the period between 1995 and 1998
and that between 2001 and 2006. However,
since 2006 there has been an apparent increase
in the degree of price dispersion.
Second, as concerns the standard deviation,
although there are some similarities, such as
the declines observed between 1995 and 1998
and after 2001, the pattern is substantially
different to that of the coeffi cient of variation.
In particular, the decline in price dispersion seen
between 1995 and 2004 was relatively modest
and dispersion increased noticeably after 2004.
Cross-checking the two measures would
suggest that some price convergence took place
between 1995 and 1998 and between 2001 and
2004. However, both these measures would also
suggest that price dispersion increased in the
second half of the 2000s – a fact that is worrying
from a monetary policy perspective and which
may warrant further investigation.
Finally, Charts 15(a) and 15(b) provide two
alternative examples of so-called “beta
convergence”: the former presents the median
beta coeffi cient estimated across the 146 series
in respect of relative price level indices (RPLIs)
obtained from raw PPP data and 89 series in
respect of PPLD (i.e. combined HICP/PPP
data), whereas the latter shows the percentage of
statistically signifi cant beta coeffi cients obtained
when using both sets of data. In both charts, the
degree of beta convergence appears to have
increased over time, being somewhat stronger
in the case of RPLI data than when PPLD are
used. This may be owing to a number of factors.
First, as mentioned above, the PPP methodology
is being continuously refi ned and this may give
rise to apparent convergence, when in fact it
is merely a more accurate comparison of price
levels across countries. Second, it may be that
price convergence is more evident at more
disaggregated levels of data. For example,
when using the RPLI data, there are thirty
series for food, whereas for PPLD, there are
nine series for food. Sturm et al. (2009) argue
that, at an aggregate level, there is little or no
evidence of price convergence but, at a more
Chart 15 Evidence of beta convergence
(percentages)
RPLI
PPLD
a) Median value of beta coefficients b) Percentage of significant beta coefficients
-0.6
-0.5
-0.4
-0.3
-0.2
-0.1
0.0
-0.6
-0.5
-0.4
-0.3
-0.2
-0.1
0.0
1996 1998 2000 2002 2004 2006 200830
40
50
60
70
80
90
30
40
50
60
70
80
90
1996 1998 2000 2002 2004 2006 2008
Sources: Eurostat HICP and PPP databases and Eurosystem staff calculations.
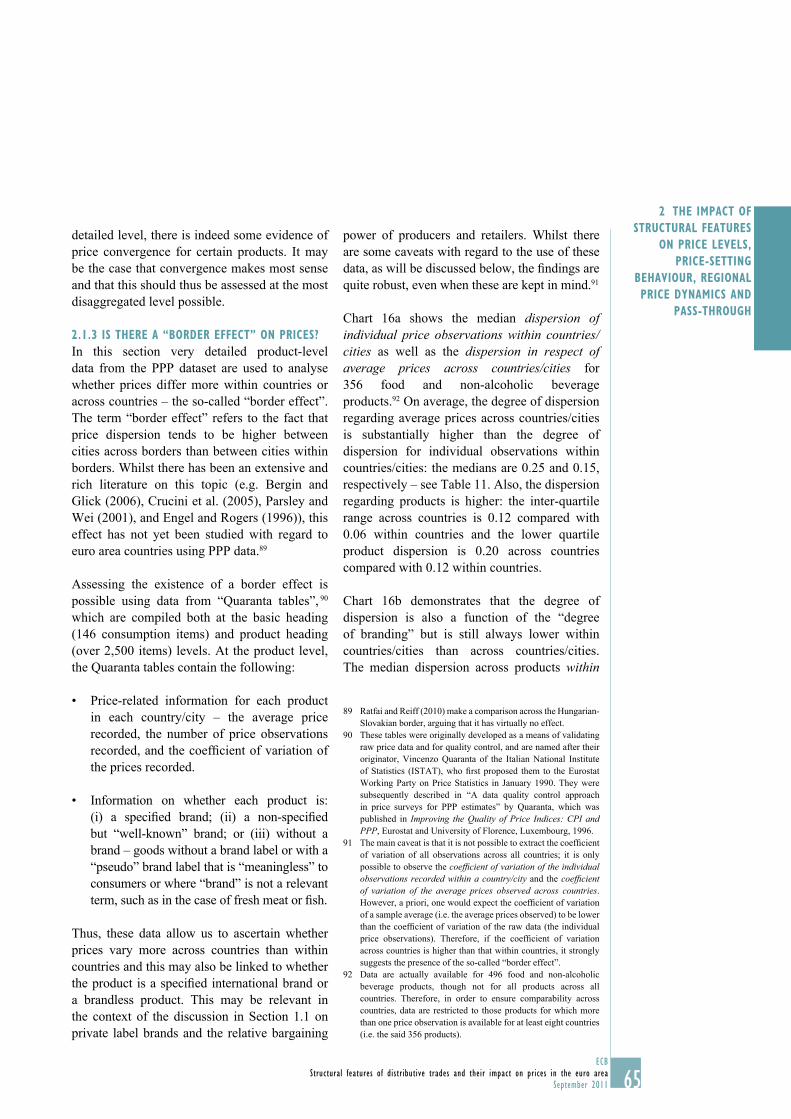
65ECB
Structural features of distributive trades and their impact on prices in the euro area
September 2011
2 THE IMPACT OF
STRUCTURAL FEATURES
ON PRICE LEVELS,
PRICE-SETTING
BEHAVIOUR, REGIONAL
PRICE DYNAMICS AND
PASS-THROUGH
detailed level, there is indeed some evidence of
price convergence for certain products. It may
be the case that convergence makes most sense
and that this should thus be assessed at the most
disaggregated level possible.
2.1.3 IS THERE A “BORDER EFFECT” ON PRICES?
In this section very detailed product-level
data from the PPP dataset are used to analyse
whether prices differ more within countries or
across countries – the so-called “border effect”.
The term “border effect” refers to the fact that
price dispersion tends to be higher between
cities across borders than between cities within
borders. Whilst there has been an extensive and
rich literature on this topic (e.g. Bergin and
Glick (2006), Crucini et al. (2005), Parsley and
Wei (2001), and Engel and Rogers (1996)), this
effect has not yet been studied with regard to
euro area countries using PPP data.89
Assessing the existence of a border effect is
possible using data from “Quaranta tables”, 90
which are compiled both at the basic heading
(146 consumption items) and product heading
(over 2,500 items) levels. At the product level,
the Quaranta tables contain the following:
Price-related information for each product •
in each country/city – the average price
recorded, the number of price observations
recorded, and the coeffi cient of variation of
the prices recorded.
Information on whether each product is: •
(i) a specifi ed brand; (ii) a non-specifi ed
but “well-known” brand; or (iii) without a
brand – goods without a brand label or with a
“pseudo” brand label that is “meaningless” to
consumers or where “brand” is not a relevant
term, such as in the case of fresh meat or fi sh.
Thus, these data allow us to ascertain whether
prices vary more across countries than within
countries and this may also be linked to whether
the product is a specifi ed international brand or
a brandless product. This may be relevant in
the context of the discussion in Section 1.1 on
private label brands and the relative bargaining
power of producers and retailers. Whilst there
are some caveats with regard to the use of these
data, as will be discussed below, the fi ndings are
quite robust, even when these are kept in mind.91
Chart 16a shows the median dispersion of individual price observations within countries/cities as well as the dispersion in respect of average prices across countries/cities for
356 food and non-alcoholic beverage
products.92 On average, the degree of dispersion
regarding average prices across countries/cities
is substantially higher than the degree of
dispersion for individual observations within
countries/cities: the medians are 0.25 and 0.15,
respectively – see Table 11. Also, the dispersion
regarding products is higher: the inter-quartile
range across countries is 0.12 compared with
0.06 within countries and the lower quartile
product dispersion is 0.20 across countries
compared with 0.12 within countries.
Chart 16b demonstrates that the degree of
dispersion is also a function of the “degree
of branding” but is still always lower within
countries/cities than across countries/cities.
The median dispersion across products within
Ratfai and Reiff (2010) make a comparison across the Hungarian-89
Slovakian border, arguing that it has virtually no effect.
These tables were originally developed as a means of validating 90
raw price data and for quality control, and are named after their
originator, Vincenzo Quaranta of the Italian National Institute
of Statistics (ISTAT), who fi rst proposed them to the Eurostat
Working Party on Price Statistics in January 1990. They were
subsequently described in “A data quality control approach
in price surveys for PPP estimates” by Quaranta, which was
published in Improving the Quality of Price Indices: CPI and PPP, Eurostat and University of Florence, Luxembourg, 1996.
The main caveat is that it is not possible to extract the coeffi cient 91
of variation of all observations across all countries; it is only
possible to observe the coeffi cient of variation of the individual observations recorded within a country/city and the coeffi cient of variation of the average prices observed across countries.
However, a priori, one would expect the coeffi cient of variation
of a sample average (i.e. the average prices observed) to be lower
than the coeffi cient of variation of the raw data (the individual
price observations). Therefore, if the coeffi cient of variation
across countries is higher than that within countries, it strongly
suggests the presence of the so-called “border effect”.
Data are actually available for 496 food and non-alcoholic 92
beverage products, though not for all products across all
countries. Therefore, in order to ensure comparability across
countries, data are restricted to those products for which more
than one price observation is available for at least eight countries
(i.e. the said 356 products).
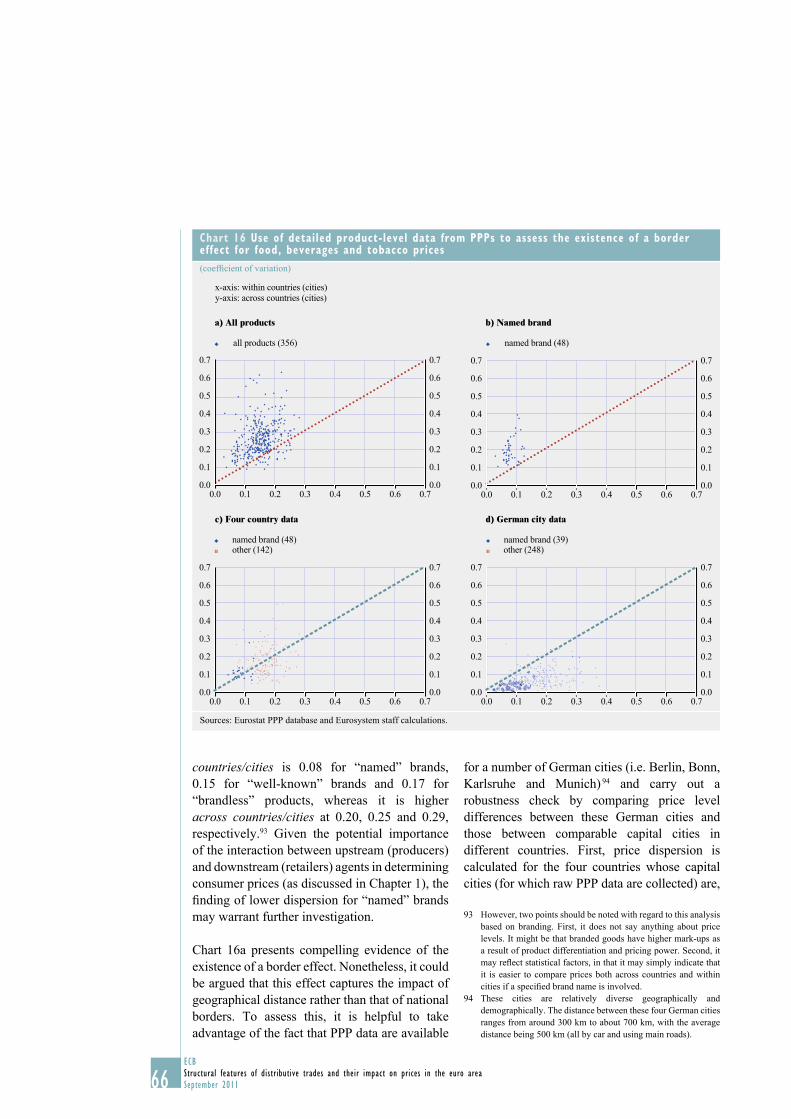
66ECB
Structural features of distributive trades and their impact on prices in the euro area
September 2011
countries/cities is 0.08 for “named” brands,
0.15 for “well-known” brands and 0.17 for
“brandless” products, whereas it is higher
across countries/cities at 0.20, 0.25 and 0.29,
respectively.93 Given the potential importance
of the interaction between upstream (producers)
and downstream (retailers) agents in determining
consumer prices (as discussed in Chapter 1), the
fi nding of lower dispersion for “named” brands
may warrant further investigation.
Chart 16a presents compelling evidence of the
existence of a border effect. Nonetheless, it could
be argued that this effect captures the impact of
geographical distance rather than that of national
borders. To assess this, it is helpful to take
advantage of the fact that PPP data are available
for a number of German cities (i.e. Berlin, Bonn,
Karlsruhe and Munich) 94 and carry out a
robustness check by comparing price level
differences between these German cities and
those between comparable capital cities in
different countries. First, price dispersion is
calculated for the four countries whose capital
cities (for which raw PPP data are collected) are,
However, two points should be noted with regard to this analysis 93
based on branding. First, it does not say anything about price
levels. It might be that branded goods have higher mark-ups as
a result of product differentiation and pricing power. Second, it
may refl ect statistical factors, in that it may simply indicate that
it is easier to compare prices both across countries and within
cities if a specifi ed brand name is involved.
These cities are relatively diverse geographically and 94
demographically. The distance between these four German cities
ranges from around 300 km to about 700 km, with the average
distance being 500 km (all by car and using main roads).
Chart 16 Use of detailed product-level data from PPPs to assess the existence of a border effect for food, beverages and tobacco prices
(coeffi cient of variation)
x-axis: within countries (cities)
y-axis: across countries (cities)
a) All products b) Named brand
0.0
0.1
0.2
0.3
0.4
0.5
0.6
0.7
0.0
0.1
0.2
0.3
0.4
0.5
0.6
0.7
0.0 0.1 0.2 0.3 0.4 0.5 0.6 0.7
all products (356)
0.0
0.1
0.2
0.3
0.4
0.5
0.6
0.7
0.0
0.1
0.2
0.3
0.4
0.5
0.6
0.7
0.0 0.1 0.2 0.3 0.4 0.5 0.6 0.7
named brand (48)
c) Four country data d) German city data
0.0
0.1
0.2
0.3
0.4
0.5
0.6
0.7
0.0
0.1
0.2
0.3
0.4
0.5
0.6
0.7
0.0 0.1 0.2 0.3 0.4 0.5 0.6 0.7
named brand (48)other (142)
0.0
0.1
0.2
0.3
0.4
0.5
0.6
0.7
0.0
0.1
0.2
0.3
0.4
0.5
0.6
0.7
0.0 0.1 0.2 0.3 0.4 0.5 0.6 0.7
named brand (39)other (248)
Sources: Eurostat PPP database and Eurosystem staff calculations.
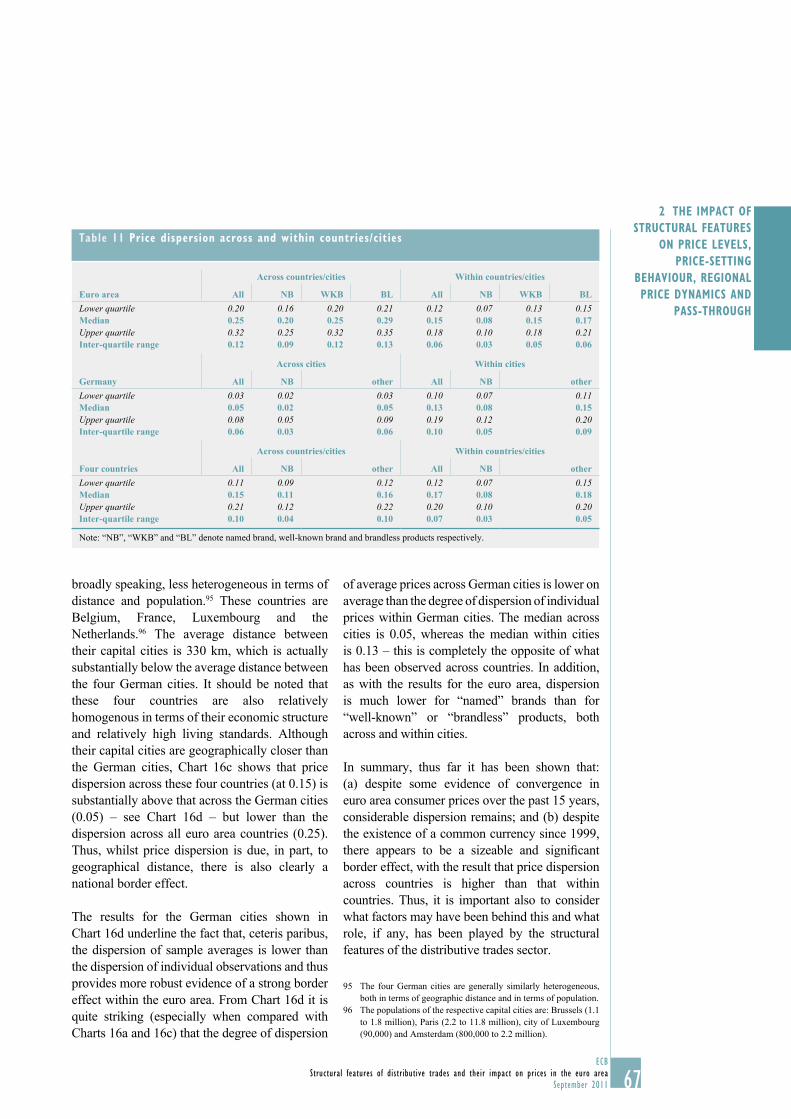
67ECB
Structural features of distributive trades and their impact on prices in the euro area
September 2011
2 THE IMPACT OF
STRUCTURAL FEATURES
ON PRICE LEVELS,
PRICE-SETTING
BEHAVIOUR, REGIONAL
PRICE DYNAMICS AND
PASS-THROUGH
broadly speaking, less heterogeneous in terms of
distance and population.95 These countries are
Belgium, France, Luxembourg and the
Netherlands.96 The average distance between
their capital cities is 330 km, which is actually
substantially below the average distance between
the four German cities. It should be noted that
these four countries are also relatively
homogenous in terms of their economic structure
and relatively high living standards. Although
their capital cities are geographically closer than
the German cities, Chart 16c shows that price
dispersion across these four countries (at 0.15) is
substantially above that across the German cities
(0.05) – see Chart 16d – but lower than the
dispersion across all euro area countries (0.25).
Thus, whilst price dispersion is due, in part, to
geographical distance, there is also clearly a
national border effect.
The results for the German cities shown in
Chart 16d underline the fact that, ceteris paribus,
the dispersion of sample averages is lower than
the dispersion of individual observations and thus
provides more robust evidence of a strong border
effect within the euro area. From Chart 16d it is
quite striking (especially when compared with
Charts 16a and 16c) that the degree of dispersion
of average prices across German cities is lower on
average than the degree of dispersion of individual
prices within German cities. The median across
cities is 0.05, whereas the median within cities
is 0.13 – this is completely the opposite of what
has been observed across countries. In addition,
as with the results for the euro area, dispersion
is much lower for “named” brands than for
“well-known” or “brandless” products, both
across and within cities.
In summary, thus far it has been shown that:
(a) despite some evidence of convergence in
euro area consumer prices over the past 15 years,
considerable dispersion remains; and (b) despite
the existence of a common currency since 1999,
there appears to be a sizeable and signifi cant
border effect, with the result that price dispersion
across countries is higher than that within
countries. Thus, it is important also to consider
what factors may have been behind this and what
role, if any, has been played by the structural
features of the distributive trades sector.
The four German cities are generally similarly heterogeneous, 95
both in terms of geographic distance and in terms of population.
The populations of the respective capital cities are: Brussels (1.1 96
to 1.8 million), Paris (2.2 to 11.8 million), city of Luxembourg
(90,000) and Amsterdam (800,000 to 2.2 million).
Table 11 Price dispersion across and within countries/cities
Across countries/cities Within countries/cities
Euro area All NB WKB BL All NB WKB BLLower quartile 0.20 0.16 0.20 0.21 0.12 0.07 0.13 0.15Median 0.25 0.20 0.25 0.29 0.15 0.08 0.15 0.17Upper quartile 0.32 0.25 0.32 0.35 0.18 0.10 0.18 0.21Inter-quartile range 0.12 0.09 0.12 0.13 0.06 0.03 0.05 0.06
Across cities Within cities
Germany All NB other All NB otherLower quartile 0.03 0.02 0.03 0.10 0.07 0.11Median 0.05 0.02 0.05 0.13 0.08 0.15Upper quartile 0.08 0.05 0.09 0.19 0.12 0.20Inter-quartile range 0.06 0.03 0.06 0.10 0.05 0.09
Across countries/cities Within countries/cities
Four countries All NB other All NB otherLower quartile 0.11 0.09 0.12 0.12 0.07 0.15Median 0.15 0.11 0.16 0.17 0.08 0.18Upper quartile 0.21 0.12 0.22 0.20 0.10 0.20Inter-quartile range 0.10 0.04 0.10 0.07 0.03 0.05
Note: “NB”, “WKB” and “BL” denote named brand, well-known brand and brandless products respectively.
68ECB
Structural features of distributive trades and their impact on prices in the euro area
September 2011
2.1.4 THE IMPACT OF THE STRUCTURAL FEATURES
OF THE DISTRIBUTIVE TRADES SECTOR
This section fi rst draws on the existing
literature, discussed above, modelling price
level differences across countries to construct
a benchmark model. Thereafter, the benchmark
model is augmented with indicators of the
structural features of the distributive trades
sector in order to discover whether these
features of the sector itself can help to
explain price differentials across countries.
This benchmark model draws on different
strands of the literature.
Firstly, by far the most common element in this
literature is the hypothesised link between price
levels and living standards, which is usually
prompted by the Balassa-Samuelson type of
argument. Under this way of thinking, high
living standards are driven to a large extent by
strong productivity in the traded goods sector.
Within this context, and given broadly constant
wages differentials across the traded and non-
traded goods sectors, price levels, especially
in respect of the non-traded goods sector, are
pushed up. Therefore, relative real GDP per capita is included in the benchmark model.97
Secondly, although there has been some degree of
harmonisation of indirect taxes in the EU, some
differences remain across countries. Therefore,
VAT rates are included in the benchmark model.
To do so, the VAT bands (zero, reduced or
standard) now generally used have been applied
to each of the 146 series available to us from
the PPP dataset. A time series of the different
rates used within each band (zero, reduced and
standard) has also been constructed that goes
back to 1995.98
Thirdly, drawing on the “rational inattention”
literature, the relative expenditure share of
a specifi c product in a country relative to
the euro area average is added to capture the
expenditure intensity and presumably “attention
intensity” for each product. For example, if
Italian households consume proportionally
more pasta than households in other countries,
presumably they will invest more effort in
searching and comparing the prices of pasta
products. Thus, other things being equal,
(and perhaps being helped by scale and
competition effects) prices for pasta should be
lower in Italy. Finally, population density is
included as a control for potential effi ciencies
driven by high/low population density.
Notes: t-statistics are in parentheses; “PLI” denotes
the relative price level index (country, product
group and time); “rgdppcr” denotes relative GDP
per capita (country and time); 99 “vatrate” denotes
the VAT rate (country, product group and time);
“expsr” denotes the share of expenditure on a
product relative to the euro area average (country,
product group and time); “dens” denotes population
density (country and time); “emhhi” denotes the
HHI from Euromonitor relating to average data for
the period 2004 to 2009 (country and sector-
specifi c); “emc5” denotes the CR5 indicator from
Euromonitor relating to average data from the
period 2004 to 2009 (country and sector-specifi c);
“sbsm2” denotes the profi t margin adjusted for the
implicit labour income of the self-employed;
“pmrr” denotes the OECD PMR indicator for the
whole retail sector (country and time –
interpolated); “pmrrbe” denotes the OECD retail
sector PMR indicator relating to barriers to entry
(country and time); “pmrrpc” denotes the OECD
retail sector PMR indicator relating to price
controls (country and time); “pmrror” denotes the
OECD retail sector PMR indicator relating to
operating restrictions (country and time); and “epl”
denotes the OECD employment protection
indicator relative to the euro area average
(country and time).
A panel equation is estimated pooling the data
across both products and countries, including
fi xed effects for products and countries.
The results of the baseline model – see column
As a robustness check, relative real gross national income (GNI) 97
per capita is also used, as in some countries (most notably
Ireland and Luxembourg) GDP per capita which is much higher
than GNI per capita, may be distorted.
For the sake of tractability, it has been assumed that products 98
do not move from one band to another. This assumption is not
expected to have a material impact on the results.
The model was also run with relative real GNI per capita with 99
broadly similar results.
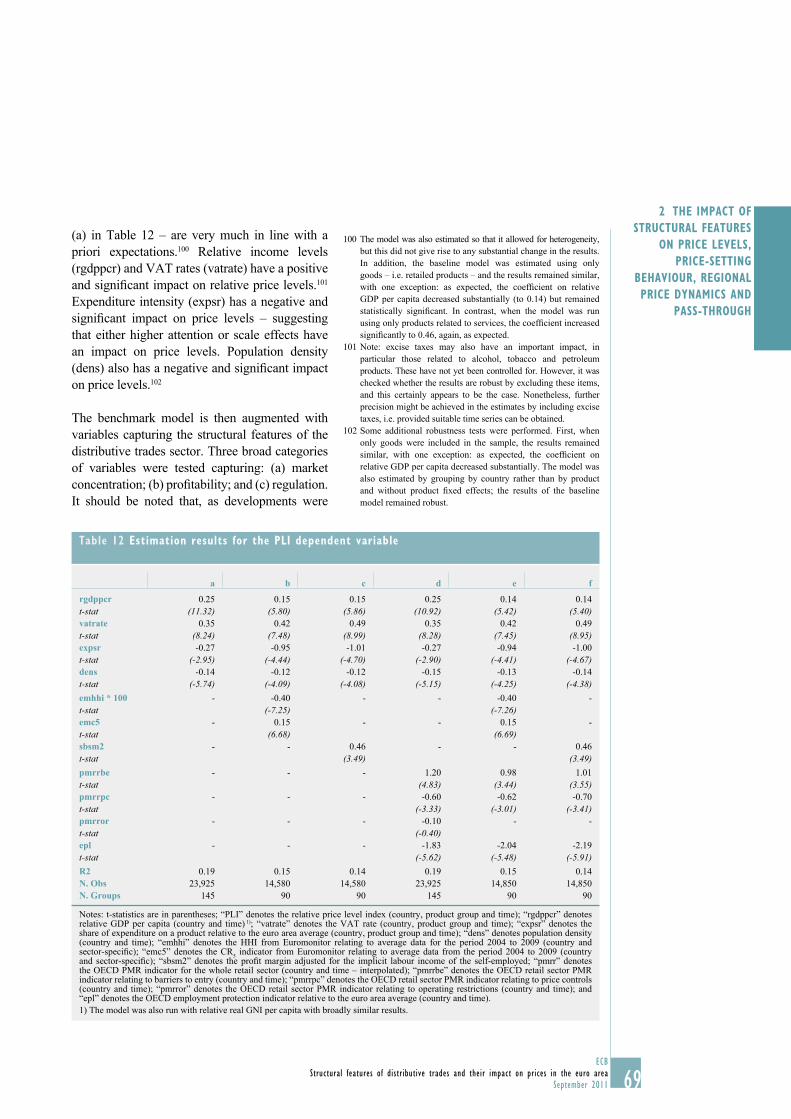
69ECB
Structural features of distributive trades and their impact on prices in the euro area
September 2011
2 THE IMPACT OF
STRUCTURAL FEATURES
ON PRICE LEVELS,
PRICE-SETTING
BEHAVIOUR, REGIONAL
PRICE DYNAMICS AND
PASS-THROUGH
Table 12 Estimation results for the PLI dependent variable
a b c d e f
rgdppcr 0.25 0.15 0.15 0.25 0.14 0.14
t-stat (11.32) (5.80) (5.86) (10.92) (5.42) (5.40)vatrate 0.35 0.42 0.49 0.35 0.42 0.49
t-stat (8.24) (7.48) (8.99) (8.28) (7.45) (8.95)expsr -0.27 -0.95 -1.01 -0.27 -0.94 -1.00
t-stat (-2.95) (-4.44) (-4.70) (-2.90) (-4.41) (-4.67)dens -0.14 -0.12 -0.12 -0.15 -0.13 -0.14
t-stat (-5.74) (-4.09) (-4.08) (-5.15) (-4.25) (-4.38)emhhi * 100 - -0.40 - - -0.40 -
t-stat (-7.25) (-7.26)emc5 - 0.15 - - 0.15 -
t-stat (6.68) (6.69)sbsm2 - - 0.46 - - 0.46
t-stat (3.49) (3.49)pmrrbe - - - 1.20 0.98 1.01
t-stat (4.83) (3.44) (3.55)pmrrpc - - - -0.60 -0.62 -0.70
t-stat (-3.33) (-3.01) (-3.41)pmrror - - - -0.10 - -
t-stat (-0.40)epl - - - -1.83 -2.04 -2.19
t-stat (-5.62) (-5.48) (-5.91)R2 0.19 0.15 0.14 0.19 0.15 0.14
N. Obs 23,925 14,580 14,580 23,925 14,850 14,850
N. Groups 145 90 90 145 90 90
Notes: t-statistics are in parentheses; “PLI” denotes the relative price level index (country, product group and time); “rgdppcr” denotes relative GDP per capita (country and time) 1); “vatrate” denotes the VAT rate (country, product group and time); “expsr” denotes the share of expenditure on a product relative to the euro area average (country, product group and time); “dens” denotes population density (country and time); “emhhi” denotes the HHI from Euromonitor relating to average data for the period 2004 to 2009 (country and sector-specifi c); “emc5” denotes the CR
5 indicator from Euromonitor relating to average data from the period 2004 to 2009 (country
and sector-specifi c); “sbsm2” denotes the profi t margin adjusted for the implicit labour income of the self-employed; “pmrr” denotes the OECD PMR indicator for the whole retail sector (country and time – interpolated); “pmrrbe” denotes the OECD retail sector PMR indicator relating to barriers to entry (country and time); “pmrrpc” denotes the OECD retail sector PMR indicator relating to price controls (country and time); “pmrror” denotes the OECD retail sector PMR indicator relating to operating restrictions (country and time); and “epl” denotes the OECD employment protection indicator relative to the euro area average (country and time).
1) The model was also run with relative real GNI per capita with broadly similar results.
(a) in Table 12 – are very much in line with a
priori expectations.100 Relative income levels
(rgdppcr) and VAT rates (vatrate) have a positive
and signifi cant impact on relative price levels.101
Expenditure intensity (expsr) has a negative and
signifi cant impact on price levels – suggesting
that either higher attention or scale effects have
an impact on price levels. Population density
(dens) also has a negative and signifi cant impact
on price levels.102
The benchmark model is then augmented with
variables capturing the structural features of the
distributive trades sector. Three broad categories
of variables were tested capturing: (a) market
concentration; (b) profi tability; and (c) regulation.
It should be noted that, as developments were
The model was also estimated so that it allowed for heterogeneity, 100
but this did not give rise to any substantial change in the results.
In addition, the baseline model was estimated using only
goods – i.e. retailed products – and the results remained similar,
with one exception: as expected, the coeffi cient on relative
GDP per capita decreased substantially (to 0.14) but remained
statistically signifi cant. In contrast, when the model was run
using only products related to services, the coeffi cient increased
signifi cantly to 0.46, again, as expected.
Note: excise taxes may also have an important impact, in 101
particular those related to alcohol, tobacco and petroleum
products. These have not yet been controlled for. However, it was
checked whether the results are robust by excluding these items,
and this certainly appears to be the case. Nonetheless, further
precision might be achieved in the estimates by including excise
taxes, i.e. provided suitable time series can be obtained.
Some additional robustness tests were performed. First, when 102
only goods were included in the sample, the results remained
similar, with one exception: as expected, the coeffi cient on
relative GDP per capita decreased substantially. The model was
also estimated by grouping by country rather than by product
and without product fi xed effects; the results of the baseline
model remained robust.
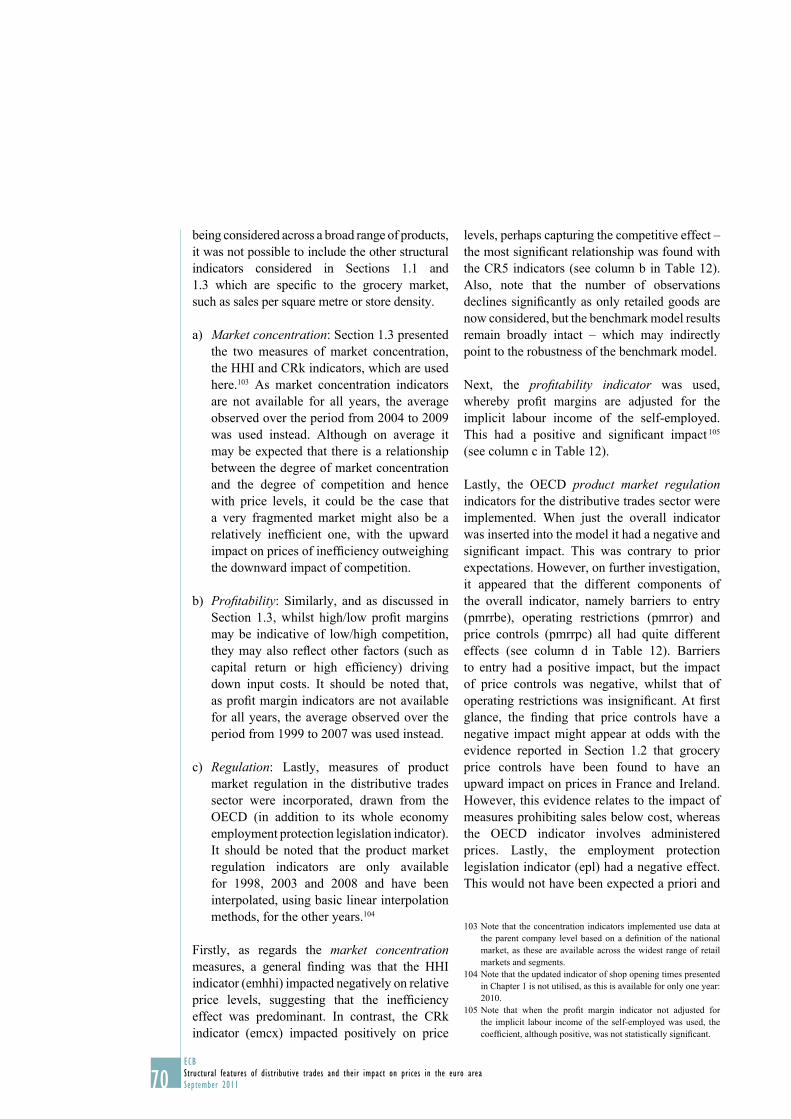
70ECB
Structural features of distributive trades and their impact on prices in the euro area
September 2011
being considered across a broad range of products,
it was not possible to include the other structural
indicators considered in Sections 1.1 and
1.3 which are specifi c to the grocery market,
such as sales per square metre or store density.
a) Market concentration: Section 1.3 presented
the two measures of market concentration,
the HHI and CRk indicators, which are used
here.103 As market concentration indicators
are not available for all years, the average
observed over the period from 2004 to 2009
was used instead. Although on average it
may be expected that there is a relationship
between the degree of market concentration
and the degree of competition and hence
with price levels, it could be the case that
a very fragmented market might also be a
relatively ineffi cient one, with the upward
impact on prices of ineffi ciency outweighing
the downward impact of competition.
b) Profi tability: Similarly, and as discussed in
Section 1.3, whilst high/low profi t margins
may be indicative of low/high competition,
they may also refl ect other factors (such as
capital return or high effi ciency) driving
down input costs. It should be noted that,
as profi t margin indicators are not available
for all years, the average observed over the
period from 1999 to 2007 was used instead.
c) Regulation: Lastly, measures of product
market regulation in the distributive trades
sector were incorporated, drawn from the
OECD (in addition to its whole economy
employment protection legislation indicator).
It should be noted that the product market
regulation indicators are only available
for 1998, 2003 and 2008 and have been
interpolated, using basic linear interpolation
methods, for the other years.104
Firstly, as regards the market concentration
measures, a general fi nding was that the HHI
indicator (emhhi) impacted negatively on relative
price levels, suggesting that the ineffi ciency
effect was predominant. In contrast, the CRk
indicator (emcx) impacted positively on price
levels, perhaps capturing the competitive effect –
the most signifi cant relationship was found with
the CR5 indicators (see column b in Table 12).
Also, note that the number of observations
declines signifi cantly as only retailed goods are
now considered, but the benchmark model results
remain broadly intact – which may indirectly
point to the robustness of the benchmark model.
Next, the profi tability indicator was used,
whereby profi t margins are adjusted for the
implicit labour income of the self-employed.
This had a positive and signifi cant impact 105
(see column c in Table 12).
Lastly, the OECD product market regulation
indicators for the distributive trades sector were
implemented. When just the overall indicator
was inserted into the model it had a negative and
signifi cant impact. This was contrary to prior
expectations. However, on further investigation,
it appeared that the different components of
the overall indicator, namely barriers to entry
(pmrrbe), operating restrictions (pmrror) and
price controls (pmrrpc) all had quite different
effects (see column d in Table 12). Barriers
to entry had a positive impact, but the impact
of price controls was negative, whilst that of
operating restrictions was insignifi cant. At fi rst
glance, the fi nding that price controls have a
negative impact might appear at odds with the
evidence reported in Section 1.2 that grocery
price controls have been found to have an
upward impact on prices in France and Ireland.
However, this evidence relates to the impact of
measures prohibiting sales below cost, whereas
the OECD indicator involves administered
prices. Lastly, the employment protection
legislation indicator (epl) had a negative effect.
This would not have been expected a priori and
Note that the concentration indicators implemented use data at 103
the parent company level based on a defi nition of the national
market, as these are available across the widest range of retail
markets and segments.
Note that the updated indicator of shop opening times presented 104
in Chapter 1 is not utilised, as this is available for only one year:
2010.
Note that when the profi t margin indicator not adjusted for 105
the implicit labour income of the self-employed was used, the
coeffi cient, although positive, was not statistically signifi cant.
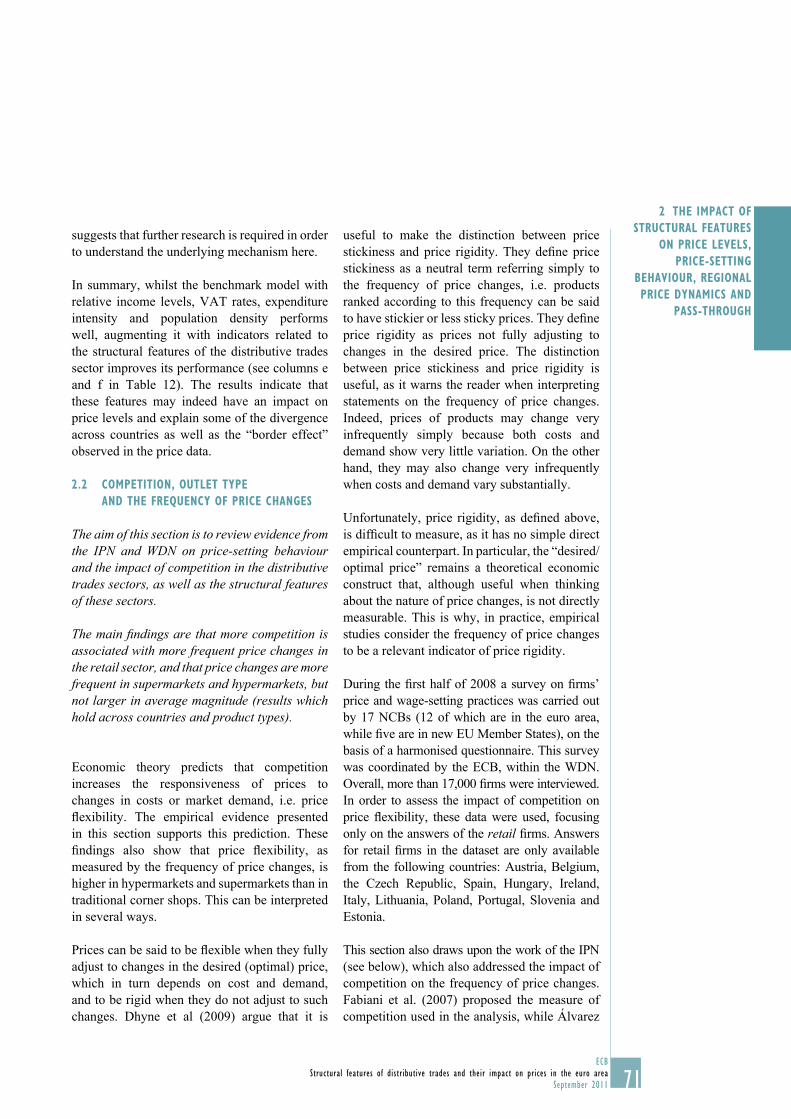
71ECB
Structural features of distributive trades and their impact on prices in the euro area
September 2011
2 THE IMPACT OF
STRUCTURAL FEATURES
ON PRICE LEVELS,
PRICE-SETTING
BEHAVIOUR, REGIONAL
PRICE DYNAMICS AND
PASS-THROUGH
suggests that further research is required in order
to understand the underlying mechanism here.
In summary, whilst the benchmark model with
relative income levels, VAT rates, expenditure
intensity and population density performs
well, augmenting it with indicators related to
the structural features of the distributive trades
sector improves its performance (see columns e
and f in Table 12). The results indicate that
these features may indeed have an impact on
price levels and explain some of the divergence
across countries as well as the “border effect”
observed in the price data.
2.2 COMPETITION, OUTLET TYPE
AND THE FREQUENCY OF PRICE CHANGES
The aim of this section is to review evidence from the IPN and WDN on price-setting behaviour and the impact of competition in the distributive trades sectors, as well as the structural features of these sectors.
The main fi ndings are that more competition is associated with more frequent price changes in the retail sector, and that price changes are more frequent in supermarkets and hypermarkets, but not larger in average magnitude (results which hold across countries and product types).
Economic theory predicts that competition
increases the responsiveness of prices to
changes in costs or market demand, i.e. price
fl exibility. The empirical evidence presented
in this section supports this prediction. These
fi ndings also show that price fl exibility, as
measured by the frequency of price changes, is
higher in hypermarkets and supermarkets than in
traditional corner shops. This can be interpreted
in several ways.
Prices can be said to be fl exible when they fully
adjust to changes in the desired (optimal) price,
which in turn depends on cost and demand,
and to be rigid when they do not adjust to such
changes. Dhyne et al (2009) argue that it is
useful to make the distinction between price
stickiness and price rigidity. They defi ne price
stickiness as a neutral term referring simply to
the frequency of price changes, i.e. products
ranked according to this frequency can be said
to have stickier or less sticky prices. They defi ne
price rigidity as prices not fully adjusting to
changes in the desired price. The distinction
between price stickiness and price rigidity is
useful, as it warns the reader when interpreting
statements on the frequency of price changes.
Indeed, prices of products may change very
infrequently simply because both costs and
demand show very little variation. On the other
hand, they may also change very infrequently
when costs and demand vary substantially.
Unfortunately, price rigidity, as defi ned above,
is diffi cult to measure, as it has no simple direct
empirical counterpart. In particular, the “desired/
optimal price” remains a theoretical economic
construct that, although useful when thinking
about the nature of price changes, is not directly
measurable. This is why, in practice, empirical
studies consider the frequency of price changes
to be a relevant indicator of price rigidity.
During the fi rst half of 2008 a survey on fi rms’
price and wage-setting practices was carried out
by 17 NCBs (12 of which are in the euro area,
while fi ve are in new EU Member States), on the
basis of a harmonised questionnaire. This survey
was coordinated by the ECB, within the WDN.
Overall, more than 17,000 fi rms were interviewed.
In order to assess the impact of competition on
price fl exibility, these data were used, focusing
only on the answers of the retail fi rms. Answers
for retail fi rms in the dataset are only available
from the following countries: Austria, Belgium,
the Czech Republic, Spain, Hungary, Ireland,
Italy, Lithuania, Poland, Portugal, Slovenia and
Estonia.
This section also draws upon the work of the IPN
(see below), which also addressed the impact of
competition on the frequency of price changes.
Fabiani et al. (2007) proposed the measure of
competition used in the analysis, while Álvarez
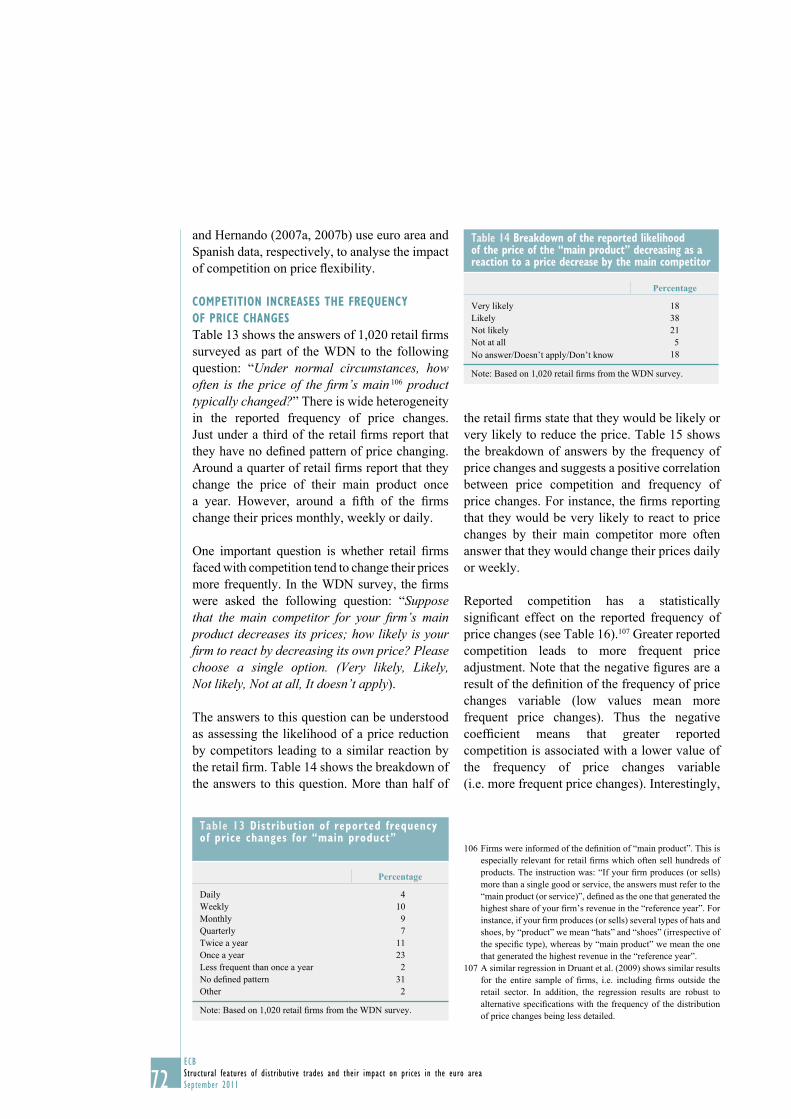
72ECB
Structural features of distributive trades and their impact on prices in the euro area
September 2011
and Hernando (2007a, 2007b) use euro area and
Spanish data, respectively, to analyse the impact
of competition on price fl exibility.
COMPETITION INCREASES THE FREQUENCY
OF PRICE CHANGES
Table 13 shows the answers of 1,020 retail fi rms
surveyed as part of the WDN to the following
question: “Under normal circumstances, how often is the price of the fi rm’s main 106 product typically changed?” There is wide heterogeneity
in the reported frequency of price changes.
Just under a third of the retail fi rms report that
they have no defi ned pattern of price changing.
Around a quarter of retail fi rms report that they
change the price of their main product once
a year. However, around a fi fth of the fi rms
change their prices monthly, weekly or daily.
One important question is whether retail fi rms
faced with competition tend to change their prices
more frequently. In the WDN survey, the fi rms
were asked the following question: “Suppose that the main competitor for your fi rm’s main product decreases its prices; how likely is your fi rm to react by decreasing its own price? Please choose a single option. (Very likely, Likely, Not likely, Not at all, It doesn’t apply).
The answers to this question can be understood
as assessing the likelihood of a price reduction
by competitors leading to a similar reaction by
the retail fi rm. Table 14 shows the breakdown of
the answers to this question. More than half of
the retail fi rms state that they would be likely or
very likely to reduce the price. Table 15 shows
the breakdown of answers by the frequency of
price changes and suggests a positive correlation
between price competition and frequency of
price changes. For instance, the fi rms reporting
that they would be very likely to react to price
changes by their main competitor more often
answer that they would change their prices daily
or weekly.
Reported competition has a statistically
signifi cant effect on the reported frequency of
price changes (see Table 16).107 Greater reported
competition leads to more frequent price
adjustment. Note that the negative fi gures are a
result of the defi nition of the frequency of price
changes variable (low values mean more
frequent price changes). Thus the negative
coeffi cient means that greater reported
competition is associated with a lower value of
the frequency of price changes variable
(i.e. more frequent price changes). Interestingly,
Firms were informed of the defi nition of “main product”. This is 106
especially relevant for retail fi rms which often sell hundreds of
products. The instruction was: “If your fi rm produces (or sells)
more than a single good or service, the answers must refer to the
“main product (or service)”, defi ned as the one that generated the
highest share of your fi rm’s revenue in the “reference year”. For
instance, if your fi rm produces (or sells) several types of hats and
shoes, by “product” we mean “hats” and “shoes” (irrespective of
the specifi c type), whereas by “main product” we mean the one
that generated the highest revenue in the “reference year”.
A similar regression in Druant et al. (2009) shows similar results 107
for the entire sample of fi rms, i.e. including fi rms outside the
retail sector. In addition, the regression results are robust to
alternative specifi cations with the frequency of the distribution
of price changes being less detailed.
Table 13 Distribution of reported frequency of price changes for “main product”
Percentage
Daily 4
Weekly 10
Monthly 9
Quarterly 7
Twice a year 11
Once a year 23
Less frequent than once a year 2
No defi ned pattern 31
Other 2
Note: Based on 1,020 retail fi rms from the WDN survey.
Table 14 Breakdown of the reported likelihood of the price of the “main product” decreasing as a reaction to a price decrease by the main competitor
Percentage
Very likely 18
Likely 38
Not likely 21
Not at all 5
No answer/Doesn̓t apply/Don’t know 18
Note: Based on 1,020 retail fi rms from the WDN survey.
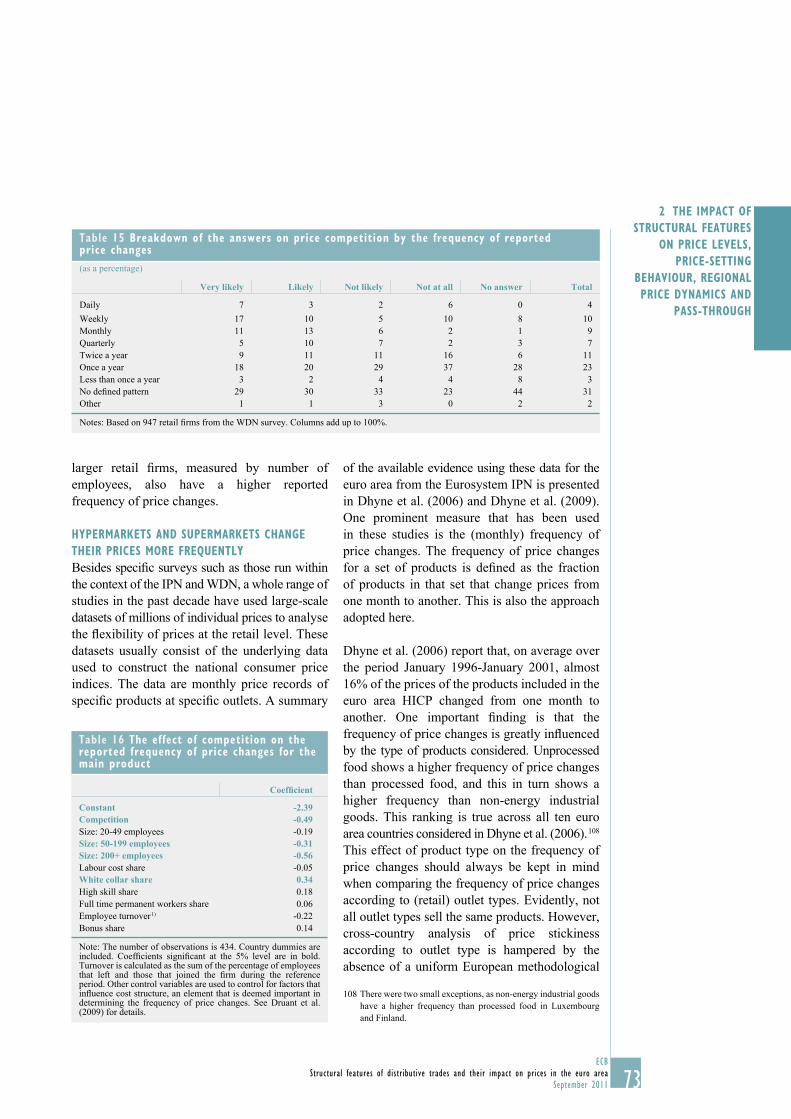
73ECB
Structural features of distributive trades and their impact on prices in the euro area
September 2011
2 THE IMPACT OF
STRUCTURAL FEATURES
ON PRICE LEVELS,
PRICE-SETTING
BEHAVIOUR, REGIONAL
PRICE DYNAMICS AND
PASS-THROUGH
larger retail fi rms, measured by number of
employees, also have a higher reported
frequency of price changes.
HYPERMARKETS AND SUPERMARKETS CHANGE
THEIR PRICES MORE FREQUENTLY
Besides specifi c surveys such as those run within
the context of the IPN and WDN, a whole range of
studies in the past decade have used large-scale
datasets of millions of individual prices to analyse
the fl exibility of prices at the retail level. These
datasets usually consist of the underlying data
used to construct the national consumer price
indices. The data are monthly price records of
specifi c products at specifi c outlets. A summary
of the available evidence using these data for the
euro area from the Eurosystem IPN is presented
in Dhyne et al. (2006) and Dhyne et al. (2009).
One prominent measure that has been used
in these studies is the (monthly) frequency of
price changes. The frequency of price changes
for a set of products is defi ned as the fraction
of products in that set that change prices from
one month to another. This is also the approach
adopted here.
Dhyne et al. (2006) report that, on average over
the period January 1996-January 2001, almost
16% of the prices of the products included in the
euro area HICP changed from one month to
another. One important fi nding is that the
frequency of price changes is greatly infl uenced
by the type of products considered. Unprocessed
food shows a higher frequency of price changes
than processed food, and this in turn shows a
higher frequency than non-energy industrial
goods. This ranking is true across all ten euro
area countries considered in Dhyne et al. (2006). 108
This effect of product type on the frequency of
price changes should always be kept in mind
when comparing the frequency of price changes
according to (retail) outlet types. Evidently, not
all outlet types sell the same products. However,
cross-country analysis of price stickiness
according to outlet type is hampered by the
absence of a uniform European methodological
There were two small exceptions, as non-energy industrial goods 108
have a higher frequency than processed food in Luxembourg
and Finland.
Table 15 Breakdown of the answers on price competition by the frequency of reported price changes
(as a percentage)
Very likely Likely Not likely Not at all No answer Total
Daily 7 3 2 6 0 4
Weekly 17 10 5 10 8 10
Monthly 11 13 6 2 1 9
Quarterly 5 10 7 2 3 7
Twice a year 9 11 11 16 6 11
Once a year 18 20 29 37 28 23
Less than once a year 3 2 4 4 8 3
No defi ned pattern 29 30 33 23 44 31
Other 1 1 3 0 2 2
Notes: Based on 947 retail fi rms from the WDN survey. Columns add up to 100%.
Table 16 The effect of competition on the reported frequency of price changes for the main product
Coeffi cient
Constant -2.39Competition -0.49Size: 20-49 employees -0.19
Size: 50-199 employees -0.31Size: 200+ employees -0.56Labour cost share -0.05
White collar share 0.34High skill share 0.18
Full time permanent workers share 0.06
Employee turnover 1) -0.22
Bonus share 0.14
Note: The number of observations is 434. Country dummies are included. Coeffi cients signifi cant at the 5% level are in bold. Turnover is calculated as the sum of the percentage of employees that left and those that joined the fi rm during the reference period. Other control variables are used to control for factors that infl uence cost structure, an element that is deemed important in determining the frequency of price changes. See Druant et al. (2009) for details.
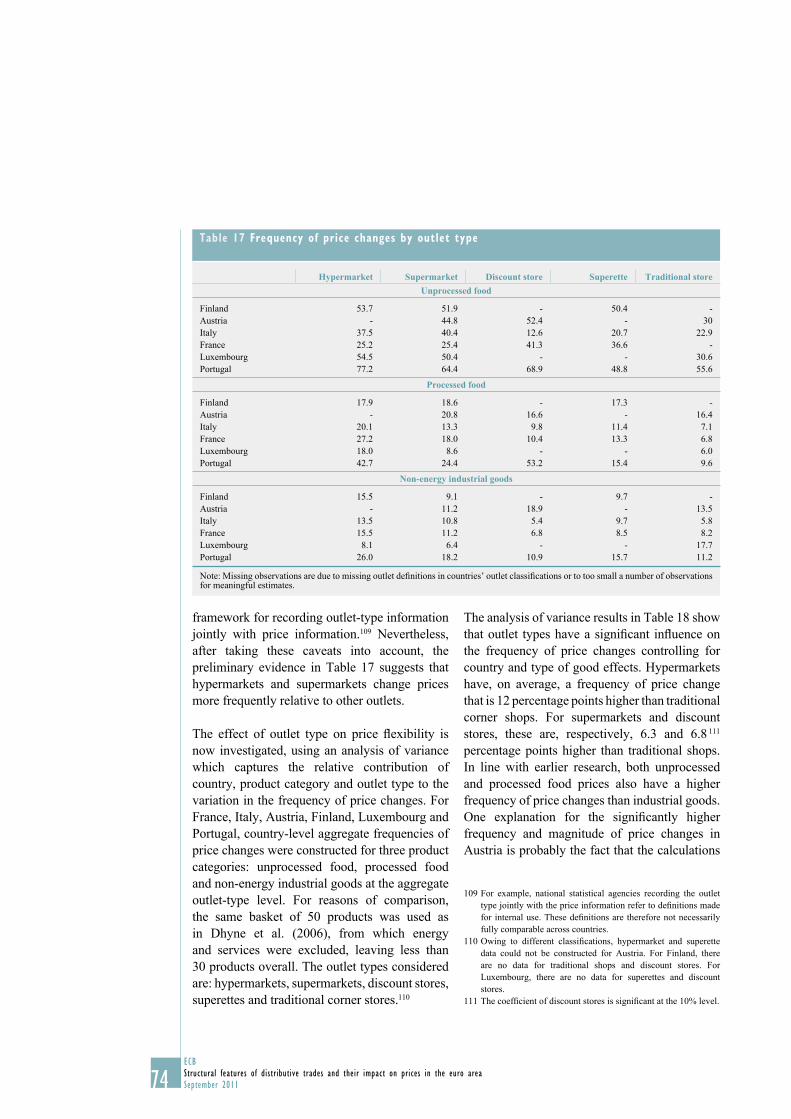
74ECB
Structural features of distributive trades and their impact on prices in the euro area
September 2011
framework for recording outlet-type information
jointly with price information.109 Nevertheless,
after taking these caveats into account, the
preliminary evidence in Table 17 suggests that
hypermarkets and supermarkets change prices
more frequently relative to other outlets.
The effect of outlet type on price fl exibility is
now investigated, using an analysis of variance
which captures the relative contribution of
country, product category and outlet type to the
variation in the frequency of price changes. For
France, Italy, Austria, Finland, Luxembourg and
Portugal, country-level aggregate frequencies of
price changes were constructed for three product
categories: unprocessed food, processed food
and non-energy industrial goods at the aggregate
outlet-type level. For reasons of comparison,
the same basket of 50 products was used as
in Dhyne et al. (2006), from which energy
and services were excluded, leaving less than
30 products overall. The outlet types considered
are: hypermarkets, supermarkets, discount stores,
superettes and traditional corner stores.110
The analysis of variance results in Table 18 show
that outlet types have a signifi cant infl uence on
the frequency of price changes controlling for
country and type of good effects. Hypermarkets
have, on average, a frequency of price change
that is 12 percentage points higher than traditional
corner shops. For supermarkets and discount
stores, these are, respectively, 6.3 and 6.8 111
percentage points higher than traditional shops.
In line with earlier research, both unprocessed
and processed food prices also have a higher
frequency of price changes than industrial goods.
One explanation for the signifi cantly higher
frequency and magnitude of price changes in
Austria is probably the fact that the calculations
For example, national statistical agencies recording the outlet 109
type jointly with the price information refer to defi nitions made
for internal use. These defi nitions are therefore not necessarily
fully comparable across countries.
Owing to different classifi cations, hypermarket and superette 110
data could not be constructed for Austria. For Finland, there
are no data for traditional shops and discount stores. For
Luxembourg, there are no data for superettes and discount
stores.
The coeffi cient of discount stores is signifi cant at the 10% level.111
Table 17 Frequency of price changes by outlet type
Hypermarket Supermarket Discount store Superette Traditional storeUnprocessed food
Finland 53.7 51.9 - 50.4 -
Austria - 44.8 52.4 - 30
Italy 37.5 40.4 12.6 20.7 22.9
France 25.2 25.4 41.3 36.6 -
Luxembourg 54.5 50.4 - - 30.6
Portugal 77.2 64.4 68.9 48.8 55.6
Processed food
Finland 17.9 18.6 - 17.3 -
Austria - 20.8 16.6 - 16.4
Italy 20.1 13.3 9.8 11.4 7.1
France 27.2 18.0 10.4 13.3 6.8
Luxembourg 18.0 8.6 - - 6.0
Portugal 42.7 24.4 53.2 15.4 9.6
Non-energy industrial goods
Finland 15.5 9.1 - 9.7 -
Austria - 11.2 18.9 - 13.5
Italy 13.5 10.8 5.4 9.7 5.8
France 15.5 11.2 6.8 8.5 8.2
Luxembourg 8.1 6.4 - - 17.7
Portugal 26.0 18.2 10.9 15.7 11.2
Note: Missing observations are due to missing outlet defi nitions in countries’ outlet classifi cations or to too small a number of observations for meaningful estimates.
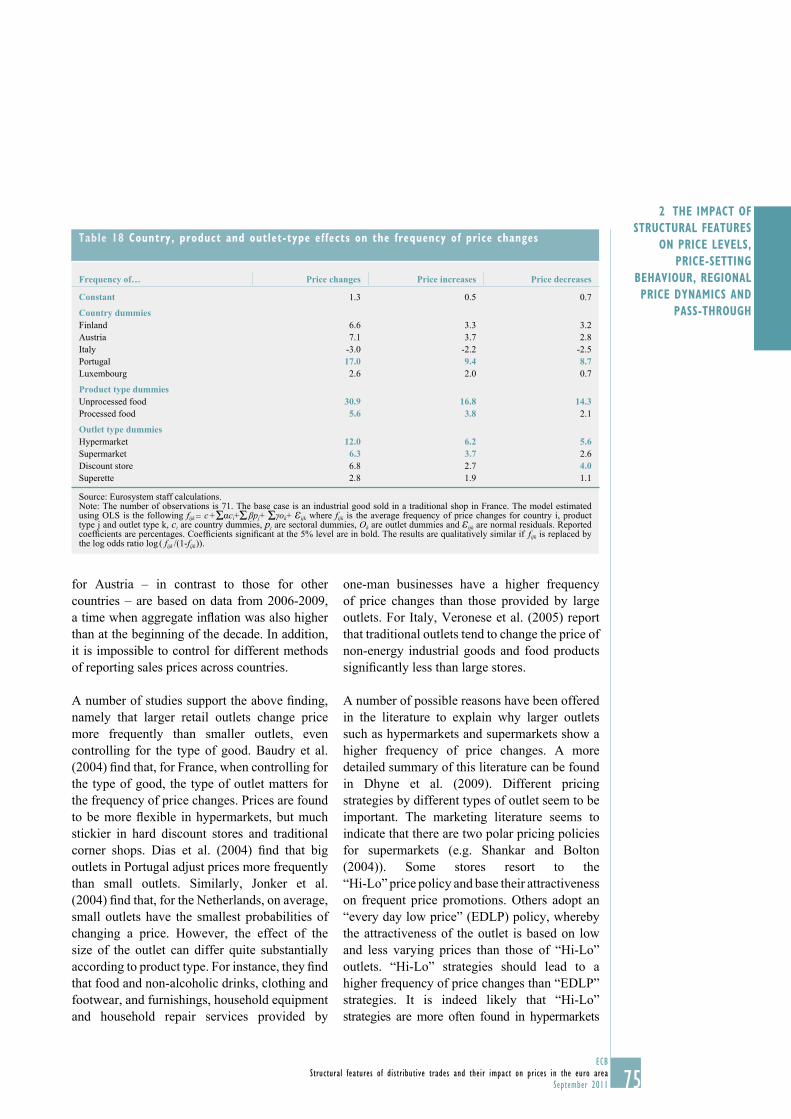
75ECB
Structural features of distributive trades and their impact on prices in the euro area
September 2011
2 THE IMPACT OF
STRUCTURAL FEATURES
ON PRICE LEVELS,
PRICE-SETTING
BEHAVIOUR, REGIONAL
PRICE DYNAMICS AND
PASS-THROUGH
for Austria – in contrast to those for other
countries – are based on data from 2006-2009,
a time when aggregate infl ation was also higher
than at the beginning of the decade. In addition,
it is impossible to control for different methods
of reporting sales prices across countries.
A number of studies support the above fi nding,
namely that larger retail outlets change price
more frequently than smaller outlets, even
controlling for the type of good. Baudry et al.
(2004) fi nd that, for France, when controlling for
the type of good, the type of outlet matters for
the frequency of price changes. Prices are found
to be more fl exible in hypermarkets, but much
stickier in hard discount stores and traditional
corner shops. Dias et al. (2004) fi nd that big
outlets in Portugal adjust prices more frequently
than small outlets. Similarly, Jonker et al.
(2004) fi nd that, for the Netherlands, on average,
small outlets have the smallest probabilities of
changing a price. However, the effect of the
size of the outlet can differ quite substantially
according to product type. For instance, they fi nd
that food and non-alcoholic drinks, clothing and
footwear, and furnishings, household equipment
and household repair services provided by
one-man businesses have a higher frequency
of price changes than those provided by large
outlets. For Italy, Veronese et al. (2005) report
that traditional outlets tend to change the price of
non-energy industrial goods and food products
signifi cantly less than large stores.
A number of possible reasons have been offered
in the literature to explain why larger outlets
such as hypermarkets and supermarkets show a
higher frequency of price changes. A more
detailed summary of this literature can be found
in Dhyne et al. (2009). Different pricing
strategies by different types of outlet seem to be
important. The marketing literature seems to
indicate that there are two polar pricing policies
for supermarkets (e.g. Shankar and Bolton
(2004)). Some stores resort to the
“Hi-Lo” price policy and base their attractiveness
on frequent price promotions. Others adopt an
“every day low price” (EDLP) policy, whereby
the attractiveness of the outlet is based on low
and less varying prices than those of “Hi-Lo”
outlets. “Hi-Lo” strategies should lead to a
higher frequency of price changes than “EDLP”
strategies. It is indeed likely that “Hi-Lo”
strategies are more often found in hypermarkets
Table 18 Country, product and outlet-type effects on the frequency of price changes
Frequency of… Price changes Price increases Price decreases
Constant 1.3 0.5 0.7
Country dummiesFinland 6.6 3.3 3.2
Austria 7.1 3.7 2.8
Italy -3.0 -2.2 -2.5
Portugal 17.0 9.4 8.7Luxembourg 2.6 2.0 0.7
Product type dummiesUnprocessed food 30.9 16.8 14.3Processed food 5.6 3.8 2.1
Outlet type dummiesHypermarket 12.0 6.2 5.6Supermarket 6.3 3.7 2.6
Discount store 6.8 2.7 4.0Superette 2.8 1.9 1.1
Source: Eurosystem staff calculations.Note: The number of observations is 71. The base case is an industrial good sold in a traditional shop in France. The model estimated using OLS is the following fijk = c + Σαci+Σ βpj+ Σγok+ εijk where fijk is the average frequency of price changes for country i, product type j and outlet type k, ci are country dummies, pj are sectoral dummies, Ok are outlet dummies and εijk are normal residuals. Reported coeffi cients are percentages. Coeffi cients signifi cant at the 5% level are in bold. The results are qualitatively similar if fijk is replaced by the log odds ratio log ( fijk /(1-fijk )).
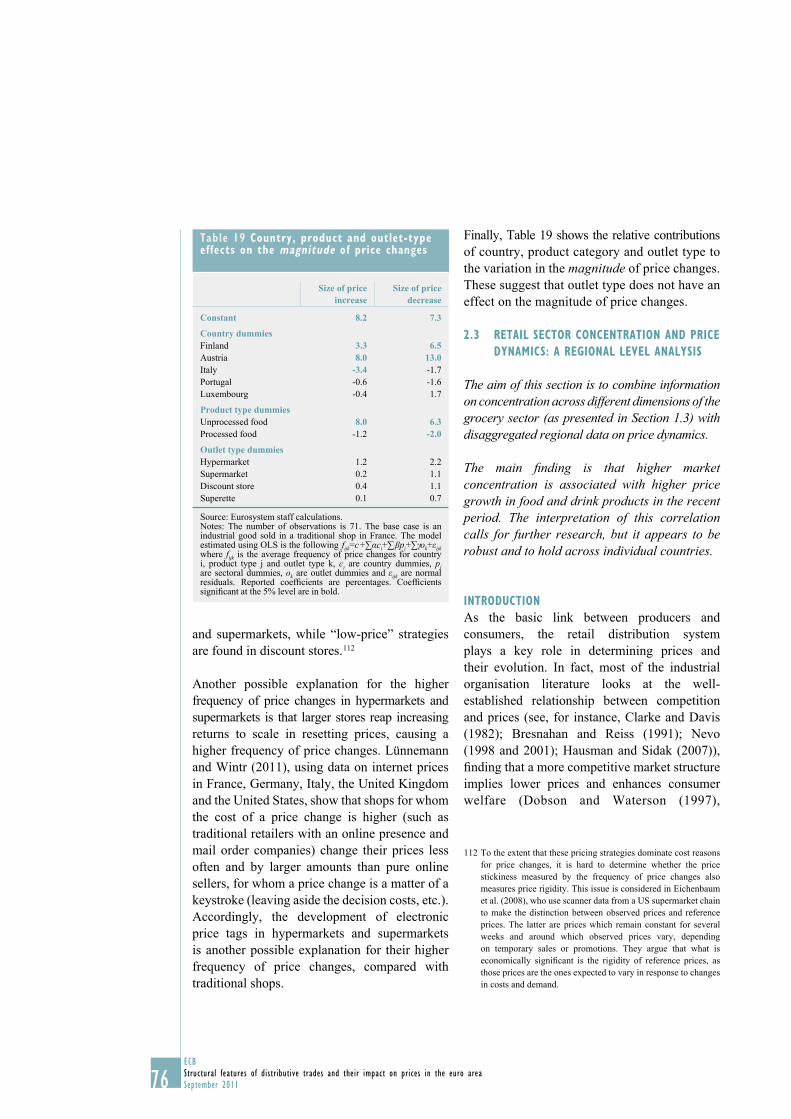
76ECB
Structural features of distributive trades and their impact on prices in the euro area
September 2011
and supermarkets, while “low-price” strategies
are found in discount stores.112
Another possible explanation for the higher
frequency of price changes in hypermarkets and
supermarkets is that larger stores reap increasing
returns to scale in resetting prices, causing a
higher frequency of price changes. Lünnemann
and Wintr (2011), using data on internet prices
in France, Germany, Italy, the United Kingdom
and the United States, show that shops for whom
the cost of a price change is higher (such as
traditional retailers with an online presence and
mail order companies) change their prices less
often and by larger amounts than pure online
sellers, for whom a price change is a matter of a
keystroke (leaving aside the decision costs, etc.).
Accordingly, the development of electronic
price tags in hypermarkets and supermarkets
is another possible explanation for their higher
frequency of price changes, compared with
traditional shops.
Finally, Table 19 shows the relative contributions
of country, product category and outlet type to
the variation in the magnitude of price changes.
These suggest that outlet type does not have an
effect on the magnitude of price changes.
2.3 RETAIL SECTOR CONCENTRATION AND PRICE
DYNAMICS: A REGIONAL LEVEL ANALYSIS
The aim of this section is to combine information on concentration across different dimensions of the grocery sector (as presented in Section 1.3) with disaggregated regional data on price dynamics.
The main fi nding is that higher market concentration is associated with higher price growth in food and drink products in the recent period. The interpretation of this correlation calls for further research, but it appears to be robust and to hold across individual countries.
INTRODUCTION
As the basic link between producers and
consumers, the retail distribution system
plays a key role in determining prices and
their evolution. In fact, most of the industrial
organisation literature looks at the well-
established relationship between competition
and prices (see, for instance, Clarke and Davis
(1982); Bresnahan and Reiss (1991); Nevo
(1998 and 2001); Hausman and Sidak (2007)),
fi nding that a more competitive market structure
implies lower prices and enhances consumer
welfare (Dobson and Waterson (1997),
To the extent that these pricing strategies dominate cost reasons 112
for price changes, it is hard to determine whether the price
stickiness measured by the frequency of price changes also
measures price rigidity. This issue is considered in Eichenbaum
et al. (2008), who use scanner data from a US supermarket chain
to make the distinction between observed prices and reference
prices. The latter are prices which remain constant for several
weeks and around which observed prices vary, depending
on temporary sales or promotions. They argue that what is
economically signifi cant is the rigidity of reference prices, as
those prices are the ones expected to vary in response to changes
in costs and demand.
Table 19 Country, product and outlet-type effects on the magnitude of price changes
Size of price increase
Size of price decrease
Constant 8.2 7.3
Country dummiesFinland 3.3 6.5Austria 8.0 13.0Italy -3.4 -1.7
Portugal -0.6 -1.6
Luxembourg -0.4 1.7
Product type dummiesUnprocessed food 8.0 6.3Processed food -1.2 -2.0
Outlet type dummiesHypermarket 1.2 2.2
Supermarket 0.2 1.1
Discount store 0.4 1.1
Superette 0.1 0.7
Source: Eurosystem staff calculations.Notes: The number of observations is 71. The base case is an industrial good sold in a traditional shop in France. The model estimated using OLS is the following fijk=c +∑αci+∑ βpj+∑γοk+εijk where fijk is the average frequency of price changes for country i, product type j and outlet type k, ci are country dummies, pj are sectoral dummies, ok are outlet dummies and εijk are normal residuals. Reported coeffi cients are percentages. Coeffi cients signifi cant at the 5% level are in bold.
77ECB
Structural features of distributive trades and their impact on prices in the euro area
September 2011
2 THE IMPACT OF
STRUCTURAL FEATURES
ON PRICE LEVELS,
PRICE-SETTING
BEHAVIOUR, REGIONAL
PRICE DYNAMICS AND
PASS-THROUGH
and Barros et al., (2006)).113 At the
macroeconomic theory level, many papers
have investigated the association between
the frequency of price adjustments and the
degree of monopoly power, showing a positive
relationship between the absence of price
changes and monopoly power and, conversely,
between frequent price changes and strong
competition.
Ciapanna and Colonna (2011), and Viviano
et al. (2011) recently assessed the effect of
concentration on price levels in the Italian retail
market, using price level records collected
for the computation of the Italian CPI merged
with retail trade data released by Nielsen
for the years 2003-2008. They found that
concentration and prices tend to move in the
same direction when looking at the parental
group and at the store level, whereas they tend
to be negatively related at the buying group
level. The approach used below is similar to
that used in Ciapanna and Colonna (2011), but,
for reasons of data availability, the analysis
focuses on price dynamics rather than price
levels. Very few contributions have analysed
the relationship between the degree of product
market concentration and price dynamics
(see, for instance, Scitovsky (1978) and
Benabou (1992) 114). Some studies, however,
have analysed the relationship between
product market competition and infl ation. In
this literature, a more competitive economy is
expected to adjust more quickly to unanticipated
shocks, for instance by reducing infl ation after a
supply shock. Przybyla and Roma (2005) fi nd
that the extent of product market competition, as
proxied by the level of mark-up, is an important
driver of infl ation for a panel of EU countries.115
This section represents an initial attempt to
analyse the impact of local level competition on
price dynamics across the euro area. A regional
analysis of the relationship between the degree
of retail market concentration and price changes
is conducted for two categories of grocery goods
in the COICOP aggregation (food and non-
alcoholic beverages; and alcoholic beverages
and tobacco) in Germany, Spain, Italy, Austria,
Portugal and Finland.116 Using the unique
census-type dataset on retailers (Nielsen
structural data) presented in Section 1.3, the HHI
is constructed at the buying group, parent
company and individual store level, considering
both the regional and local market defi nitions
(see Section 1.3 for a more detailed discussion),
and the relationship between this measure and
regional price growth is investigated.
It is important to note that the Nielsen structural
data used for the concentration indices refer to
the year 2010, while this investigation focuses
on price changes between 2003 and 2010.
Although it would clearly be preferable to have
data about the retail trade market structure over
the same time span, one can reasonably expect
that the differences in these structures across
regions and countries dominate their evolution
over time, so the retail trade market structure in
2010 remains informative about price changes
over the whole period. Moreover, the HHI in
2010 can be interpreted as the outcome of a
consolidation process which started in the 1990s.
The hypothesis is supported in the Eurostat
Structural Business Statistics, as well as in
the business literature. However, the very fact
of having regional CPI data – instead of price
levels – makes the link with the concentration
measures less immediate and the interpretation
of the results more diffi cult.
Despite these limitations, an overall positive
relationship is found between retail market
concentration and price changes for food and
beverages, as well as for alcohol and tobacco.
In addition to impacting on relative price levels, competition 113
may have a persistent and long-lasting impact on price
dynamics. This may arise both from transition effects from one
regime to another, but also from the impact of competition in
terms of enhancing productivity growth. For a more detailed
discussion of the impact of competition on infl ation and the
various mechanisms at play, see, for example, Sbordone (2010),
Jonsson (2007), OFT (2007) and Przybila and Roma (2005).
Benabou (1992), in particular, studies the inverse relationship 114
and shows that infl ation has a negative impact on mark-ups in
the US retail sector.
Neiss (2001) and Cavelaars (2003) also fi nd that product market 115
imperfections play a role in explaining cross-country infl ation
rates and have a permanent impact on average infl ation rates.
CPI regional data were not available for the other euro area 116
countries.
78ECB
Structural features of distributive trades and their impact on prices in the euro area
September 2011
The dataset is described below, after which the
econometric strategy is presented and the results
are discussed. A conclusion is then drawn and
possible extensions are proposed.
DATA DESCRIPTION
The regional analysis is based on a unique
dataset, constructed by using the structural
Nielsen data along with the regional CPI data
provided by the national statistical institutes
for Austria, Finland, Italy, Germany, Portugal
and Spain, and the Eurostat regional data
(at the NUTS2 level). A complete description
of the underlying structural dataset used in
this analysis, including a discussion of the
construction of locally based concentration
measures, is provided in Section 1.3.3 and in the
Appendix to Chapter 1.3.
The second data source includes sectoral CPI at
the regional level from six euro area countries
(Austria, Finland, Italy, Germany, Portugal
and Spain) and 69 regions (NUTS2),117 thereby
covering about 65% of the euro area in terms of
GDP. Only product categories that are plausibly
sold across all stores are included in the reference
data sample, namely food and non-alcoholic
beverages (food), and alcoholic beverages and
tobacco (alco).118
Overall, the dataset used for estimation includes
96 series, spanning the period from 2003 to 2010
at an annual frequency. The price change in a
given region i and sector j at year t denoted by
πijt is computed as the year-on-year percentage
change in the respective sectoral price index,
cpiijt,
π
ijt= (cpi
ijt- cpi
ijt-1) / cpi
ijt-1 (1)
In the empirical model, some control variables
from the Eurostat regional dataset are
included. These are the regional density
(population/km2) and measures of the evolution
of labour costs.119 All these variables were
available at the NUTS2 geographical level
of detail.
EMPIRICAL MODEL AND RESULTS
The year-on-year percentage change in sectoral
price index is modelled as follows:
πijt = β
0 + β
1X
it + β
2Duyear + β
3Ducountry
+ β4DuCOICOP
i*HHIB
i + β
5DuCOICOP
i*HHIP
+ β6DuCOICOP
i*HHIS
i + ε
ijt
(2)
where the indices i, j and t respectively indicate
the region, the COICOP category and the year.
The main variable of interest is the HHI – which
is only available for 2010 – computed at three
different levels of the sector:
for buying groups (HHIB);1)
for parental groups (HHIP); 2)
for stores (HHIS).3)
Moreover, two versions of these indices
have been considered: the fi rst measures the
concentration at the regional level, while the
second provides a more localised measure
For Italy, NUTS3 was also available, but, in this case, NUTS2 117
aggregation was used to match the geographical detail of the
controls.
The analysis has also been conducted for COICOP categories 3, 118
5 and 12 (clothing and footwear; furnishing, household equipment
and maintenance; and miscellaneous goods and services,
respectively), but these products are not representative in the
Nielsen store dataset, as they are often only sold in hypermarkets
and some large supermarkets, if at all, and are also sold in
non-grocery outlets. Given the partial coverage of the dataset,
these categories have not been included in the fi nal sample.
However, when the model was estimated with these further
COICOPs being included, a negative association was found
between the concentration indices and price growth for
categories 3 and 5 (but a positive one for category 12).
One possible explanation for the unexpected negative
association might be a composition effect: clothes and footwear
sold in non-specialised retailers are generally lower-quality
products than their counterparts sold in specialised stores.
A higher concentration at the store level may have stimulated
greater consumption of these low-price and low-quality
products, with the result that a parallel negative infl ation trend is
observed, which is due to the composition effect in consumers’
expenditure. A full assessment of this issue would require further
investigation, which is beyond the scope of this report.
For the latter, labour compensation, regional GDP (both in 119
nominal terms and in PPS) and real value added growth were
selected. These three variables were all highly correlated with
each other. Labour cost was retained on account of it being a
more precise proxy of expenditure capacity. The results are
largely unchanged when considering the other two measures.
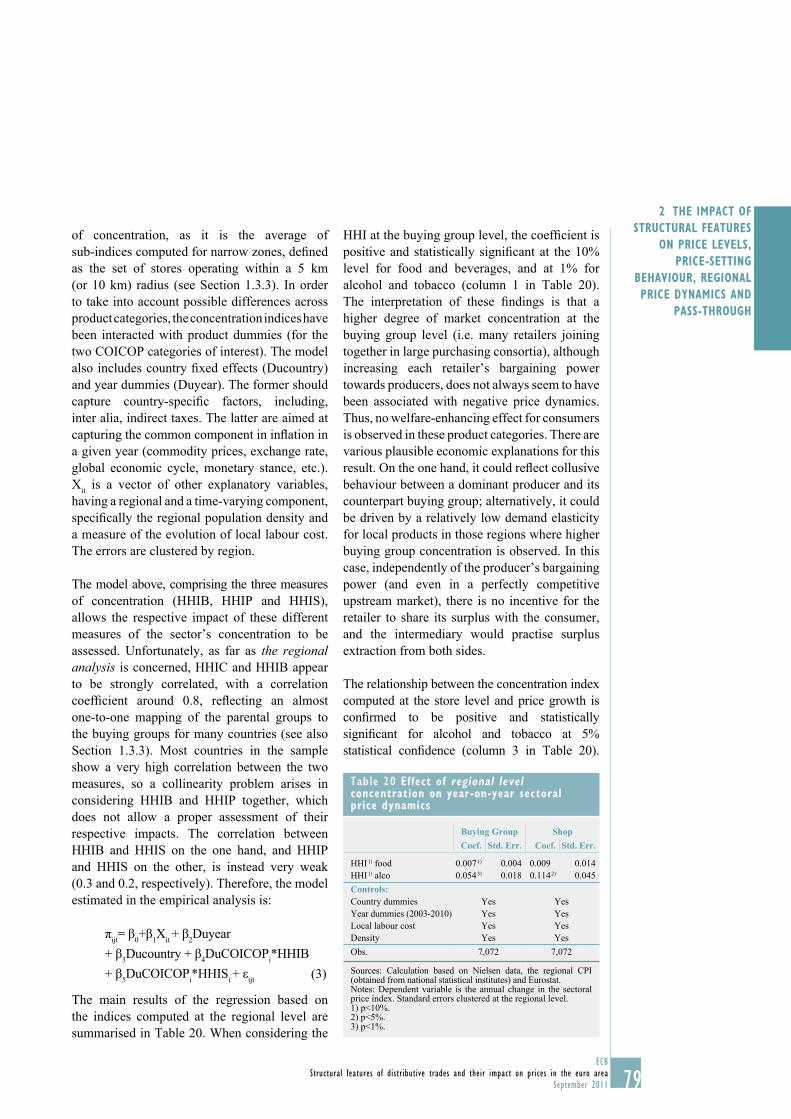
79ECB
Structural features of distributive trades and their impact on prices in the euro area
September 2011
2 THE IMPACT OF
STRUCTURAL FEATURES
ON PRICE LEVELS,
PRICE-SETTING
BEHAVIOUR, REGIONAL
PRICE DYNAMICS AND
PASS-THROUGH
of concentration, as it is the average of
sub-indices computed for narrow zones, defi ned
as the set of stores operating within a 5 km
(or 10 km) radius (see Section 1.3.3). In order
to take into account possible differences across
product categories, the concentration indices have
been interacted with product dummies (for the
two COICOP categories of interest). The model
also includes country fi xed effects (Ducountry)
and year dummies (Duyear). The former should
capture country-specifi c factors, including,
inter alia, indirect taxes. The latter are aimed at
capturing the common component in infl ation in
a given year (commodity prices, exchange rate,
global economic cycle, monetary stance, etc.).
Xit is a vector of other explanatory variables,
having a regional and a time-varying component,
specifi cally the regional population density and
a measure of the evolution of local labour cost.
The errors are clustered by region.
The model above, comprising the three measures
of concentration (HHIB, HHIP and HHIS),
allows the respective impact of these different
measures of the sector’s concentration to be
assessed. Unfortunately, as far as the regional analysis is concerned, HHIC and HHIB appear
to be strongly correlated, with a correlation
coeffi cient around 0.8, refl ecting an almost
one-to-one mapping of the parental groups to
the buying groups for many countries (see also
Section 1.3.3). Most countries in the sample
show a very high correlation between the two
measures, so a collinearity problem arises in
considering HHIB and HHIP together, which
does not allow a proper assessment of their
respective impacts. The correlation between
HHIB and HHIS on the one hand, and HHIP
and HHIS on the other, is instead very weak
(0.3 and 0.2, respectively). Therefore, the model
estimated in the empirical analysis is:
πijt= β
0+β
1X
it + β
2Duyear
+ β3Ducountry + β
4DuCOICOP
i*HHIB
+ β5DuCOICOP
i*HHIS
i + ε
ijt
(3)
The main results of the regression based on
the indices computed at the regional level are
summarised in Table 20. When considering the
HHI at the buying group level, the coeffi cient is
positive and statistically signifi cant at the 10%
level for food and beverages, and at 1% for
alcohol and tobacco (column 1 in Table 20).
The interpretation of these fi ndings is that a
higher degree of market concentration at the
buying group level (i.e. many retailers joining
together in large purchasing consortia), although
increasing each retailer’s bargaining power
towards producers, does not always seem to have
been associated with negative price dynamics.
Thus, no welfare-enhancing effect for consumers
is observed in these product categories. There are
various plausible economic explanations for this
result. On the one hand, it could refl ect collusive
behaviour between a dominant producer and its
counterpart buying group; alternatively, it could
be driven by a relatively low demand elasticity
for local products in those regions where higher
buying group concentration is observed. In this
case, independently of the producer’s bargaining
power (and even in a perfectly competitive
upstream market), there is no incentive for the
retailer to share its surplus with the consumer,
and the intermediary would practise surplus
extraction from both sides.
The relationship between the concentration index
computed at the store level and price growth is
confi rmed to be positive and statistically
signifi cant for alcohol and tobacco at 5%
statistical confi dence (column 3 in Table 20).
Table 20 Effect of regional level concentration on year-on-year sectoral price dynamics
Buying Group ShopCoef. Std. Err. Coef. Std. Err.
HHI 1) food 0.007 1) 0.004 0.009 0.014
HHI 1) alco 0.054 3) 0.018 0.114 2) 0.045
Controls:Country dummies Yes Yes
Year dummies (2003-2010) Yes Yes
Local labour cost Yes Yes
Density Yes Yes
Obs. 7,072 7,072
Sources: Calculation based on Nielsen data, the regional CPI (obtained from national statistical institutes) and Eurostat.Notes: Dependent variable is the annual change in the sectoral price index. Standard errors clustered at the regional level.1) p<10%.2) p<5%.3) p<1%.
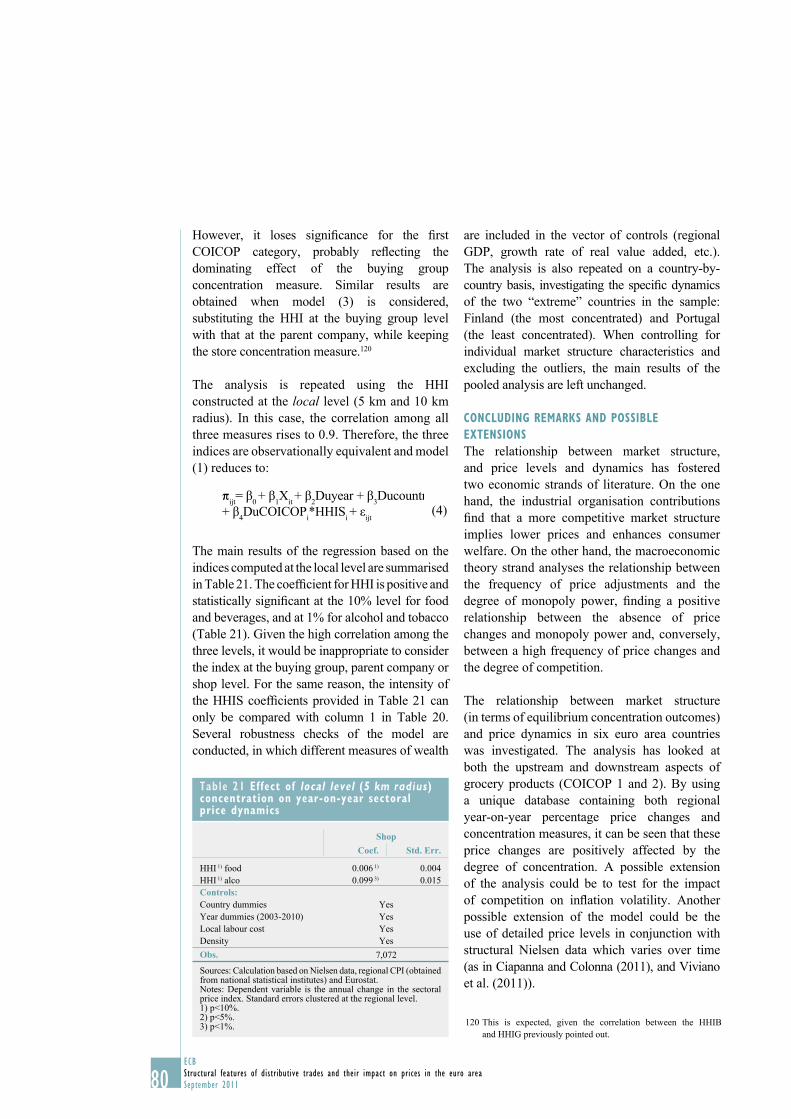
80ECB
Structural features of distributive trades and their impact on prices in the euro area
September 2011
However, it loses signifi cance for the fi rst
COICOP category, probably refl ecting the
dominating effect of the buying group
concentration measure. Similar results are
obtained when model (3) is considered,
substituting the HHI at the buying group level
with that at the parent company, while keeping
the store concentration measure.120
The analysis is repeated using the HHI
constructed at the local level (5 km and 10 km
radius). In this case, the correlation among all
three measures rises to 0.9. Therefore, the three
indices are observationally equivalent and model
(1) reduces to:
ijt= β
0 + β
1X
it + β
2Duyear + β
3Ducountr
+ β4DuCOICOP
i*HHIS
i + ε
ijt
(4)
The main results of the regression based on the
indices computed at the local level are summarised
in Table 21. The coeffi cient for HHI is positive and
statistically signifi cant at the 10% level for food
and beverages, and at 1% for alcohol and tobacco
(Table 21). Given the high correlation among the
three levels, it would be inappropriate to consider
the index at the buying group, parent company or
shop level. For the same reason, the intensity of
the HHIS coeffi cients provided in Table 21 can
only be compared with column 1 in Table 20.
Several robustness checks of the model are
conducted, in which different measures of wealth
are included in the vector of controls (regional
GDP, growth rate of real value added, etc.).
The analysis is also repeated on a country-by-
country basis, investigating the specifi c dynamics
of the two “extreme” countries in the sample:
Finland (the most concentrated) and Portugal
(the least concentrated). When controlling for
individual market structure characteristics and
excluding the outliers, the main results of the
pooled analysis are left unchanged.
CONCLUDING REMARKS AND POSSIBLE
EXTENSIONS
The relationship between market structure,
and price levels and dynamics has fostered
two economic strands of literature. On the one
hand, the industrial organisation contributions
fi nd that a more competitive market structure
implies lower prices and enhances consumer
welfare. On the other hand, the macroeconomic
theory strand analyses the relationship between
the frequency of price adjustments and the
degree of monopoly power, fi nding a positive
relationship between the absence of price
changes and monopoly power and, conversely,
between a high frequency of price changes and
the degree of competition.
The relationship between market structure
(in terms of equilibrium concentration outcomes)
and price dynamics in six euro area countries
was investigated. The analysis has looked at
both the upstream and downstream aspects of
grocery products (COICOP 1 and 2). By using
a unique database containing both regional
year-on-year percentage price changes and
concentration measures, it can be seen that these
price changes are positively affected by the
degree of concentration. A possible extension
of the analysis could be to test for the impact
of competition on infl ation volatility. Another
possible extension of the model could be the
use of detailed price levels in conjunction with
structural Nielsen data which varies over time
(as in Ciapanna and Colonna (2011), and Viviano
et al. (2011)).
This is expected, given the correlation between the HHIB 120
and HHIG previously pointed out.
Table 21 Effect of local level (5 km radius) concentration on year-on-year sectoral price dynamics
ShopCoef. Std. Err.
HHI 1) food 0.006 1) 0.004
HHI 1) alco 0.099 3) 0.015
Controls:Country dummies Yes
Year dummies (2003-2010) Yes
Local labour cost Yes
Density Yes
Obs. 7,072
Sources: Calculation based on Nielsen data, regional CPI (obtained from national statistical institutes) and Eurostat.Notes: Dependent variable is the annual change in the sectoral price index. Standard errors clustered at the regional level. 1) p<10%.2) p<5%.3) p<1%.
81ECB
Structural features of distributive trades and their impact on prices in the euro area
September 2011
2 THE IMPACT OF
STRUCTURAL FEATURES
ON PRICE LEVELS,
PRICE-SETTING
BEHAVIOUR, REGIONAL
PRICE DYNAMICS AND
PASS-THROUGH
Box 6
THE IMPACT OF INCREASED COMPETITION IN THE DISTRIBUTIVE SECTOR ON EMPLOYMENT
AND OUTPUT – A DSGE MODEL ANALYSIS
This box assesses the domestic and cross-country macroeconomic implications of competition-
enhancing reforms implemented in the distributive services in a euro area country from a
multi-country perspective on the basis of a simulation with the Euro Area and Global Economy
(EAGLE) model.1 This model is a large-scale New Keynesian dynamic general equilibrium
model of the euro area and the world economy. The euro area is modelled as a two-country
monetary union having a common monetary policy and nominal exchange rate against the rest of
the world (which is split into two regions).
For the purpose of this box, the model has been calibrated such that the developments of the main
macroeconomic aggregates approximate the structural features of a single euro area country
representing 10% of the euro area GDP. The shares of imports and exports of investment and
consumption goods from the other regions have been calibrated along the prevalent share parameters.
The model features monopolistic competition in product and labour markets. There is a mark-up
between the marginal cost and prices. Consistent with the monopolistic competition framework,
the mark-ups are inversely related to the degree of substitutability across product and labour
varieties, and hence the underlying level of competition.
The model distinguishes between sectors for tradable and non-tradable intermediate products.
Hence, its design is suitable for analysing the effect of increasing the degree of competition in
the services sectors, which are generally considered to mainly produce non-tradables. In line
with the fi ndings in the literature, the degree of competition is calibrated to be lower, i.e. mark-
ups on prices are higher, in the non-tradable sector: the price mark-up in the euro area is set to
40% in the services and 20% in the manufacturing sectors. In the United States and in the rest of
the world, the corresponding mark-ups are 28% and 20%.2
Given that the model does not have an explicit distributive sector as part of the non-trading
sector, the distributive sector in this model is regarded as part of the sector producing
non-tradable, intermediate products. A policy reform leading to more competition in the
distributive sector is introduced into the model by assuming that price mark-ups in the distributive
sector fall permanently by 15%.3 The policy change is assumed to be implemented in a gradual
fashion, so the decline in the price mark-up is assumed to gradually phase in over a period of fi ve
1 See Gomes et al. (2010). A simulation exercise similar to the one presented here is also discussed in Gomes et al. (2011).
2 These values appear to be in line with similar existing studies, such as those of Bayoumi et al. (2004), Farouqee et al. (2007), and
Everaert and Schule (2008). Many, if not all, of these studies refer to Jean and Nicoletti (2002), Oliveira Martins et al. (1996) and
Oliveira Martins and Scarpetta (1999) for estimates of mark-ups on the basis of OECD data. Some additional empirical evidence for
the euro area is provided by Christopoulou and Vermeulen (2008).
3 Measures contributing to increased competition could entail less regulation regarding the registration, licences and permits required to
open new shops, large outlet restrictions, zoning regulations and shop opening hours. Such measures often have the aim of strengthening
competition from new entrants to the market and thereby decreasing the rents of incumbent market participants.
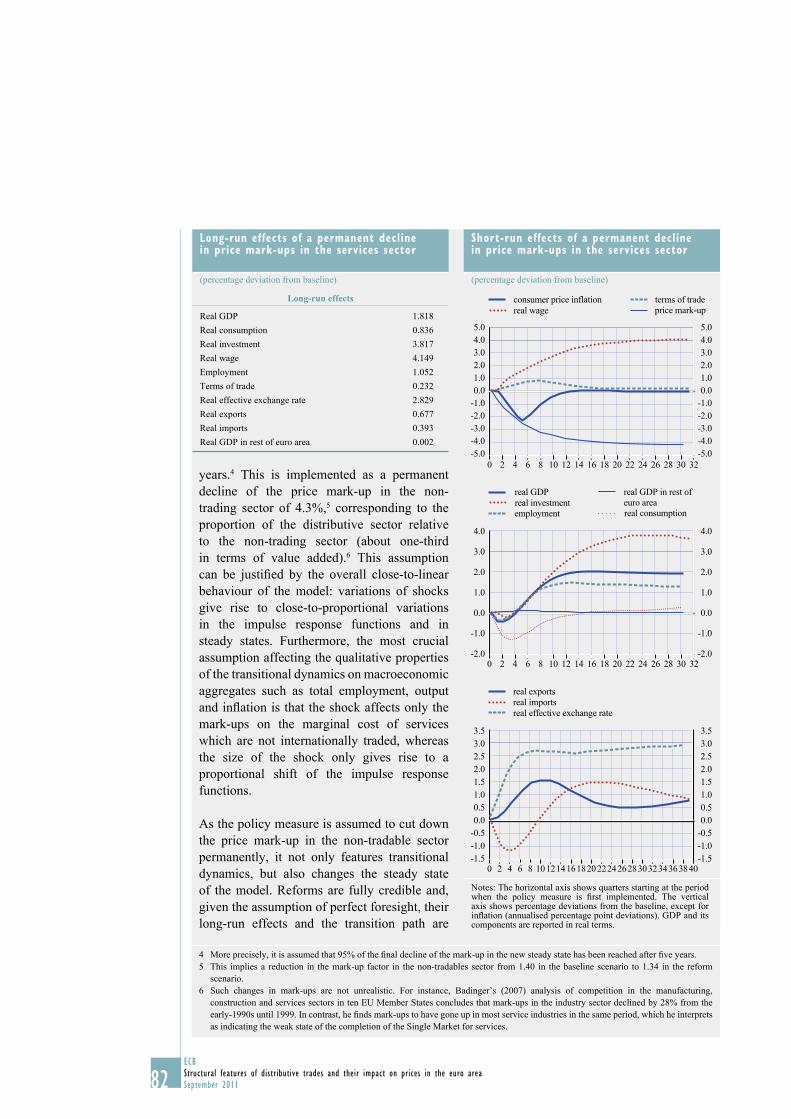
82ECB
Structural features of distributive trades and their impact on prices in the euro area
September 2011
years.4 This is implemented as a permanent
decline of the price mark-up in the non-
trading sector of 4.3%,5 corresponding to the
proportion of the distributive sector relative
to the non-trading sector (about one-third
in terms of value added).6 This assumption
can be justifi ed by the overall close-to-linear
behaviour of the model: variations of shocks
give rise to close-to-proportional variations
in the impulse response functions and in
steady states. Furthermore, the most crucial
assumption affecting the qualitative properties
of the transitional dynamics on macroeconomic
aggregates such as total employment, output
and infl ation is that the shock affects only the
mark-ups on the marginal cost of services
which are not internationally traded, whereas
the size of the shock only gives rise to a
proportional shift of the impulse response
functions.
As the policy measure is assumed to cut down
the price mark-up in the non-tradable sector
permanently, it not only features transitional
dynamics, but also changes the steady state
of the model. Reforms are fully credible and,
given the assumption of perfect foresight, their
long-run effects and the transition path are
4 More precisely, it is assumed that 95% of the fi nal decline of the mark-up in the new steady state has been reached after fi ve years.
5 This implies a reduction in the mark-up factor in the non-tradables sector from 1.40 in the baseline scenario to 1.34 in the reform
scenario.
6 Such changes in mark-ups are not unrealistic. For instance, Badinger’s (2007) analysis of competition in the manufacturing,
construction and services sectors in ten EU Member States concludes that mark-ups in the industry sector declined by 28% from the
early-1990s until 1999. In contrast, he fi nds mark-ups to have gone up in most service industries in the same period, which he interprets
as indicating the weak state of the completion of the Single Market for services.
Long-run effects of a permanent decline in price mark-ups in the services sector
(percentage deviation from baseline)
Long-run effects
Real GDP 1.818
Real consumption 0.836
Real investment 3.817
Real wage 4.149
Employment 1.052
Terms of trade 0.232
Real effective exchange rate 2.829
Real exports 0.677
Real imports 0.393
Real GDP in rest of euro area 0.002
Short-run effects of a permanent decline in price mark-ups in the services sector
(percentage deviation from baseline)
-5.0
-4.0
-3.0
-2.0
-1.0
0.0
1.0
2.0
3.0
4.0
5.0
-5.0
-4.0
-3.0
-2.0
-1.0
0.0
1.0
2.0
3.0
4.0
5.0
0 2 4 6 8 10 12 14 16 18 20 22 24 26 28 30 32
consumer price inflation
real wage
terms of trade
price mark-up
-2.0
-1.0
0.0
1.0
2.0
3.0
4.0
-2.0
-1.0
0.0
1.0
2.0
3.0
4.0
0 2 4 6 8 10 12 14 16 18 20 22 24 26 28 30 32
real GDP
employment real consumptionreal investment
real GDP in rest of
euro area
-1.5
-1.0
-0.5
0.0
0.5
1.0
1.5
2.0
2.5
3.0
3.5
-1.5
-1.0
-0.5
0.0
0.5
1.0
1.5
2.0
2.5
3.0
3.5
0 2 4 6 8 10121416182022242628303234363840
real exports
real imports
real effective exchange rate
Notes: The horizontal axis shows quarters starting at the period when the policy measure is fi rst implemented. The vertical axis shows percentage deviations from the baseline, except for infl ation (annualised percentage point deviations). GDP and its components are reported in real terms.
83ECB
Structural features of distributive trades and their impact on prices in the euro area
September 2011
2 THE IMPACT OF
STRUCTURAL FEATURES
ON PRICE LEVELS,
PRICE-SETTING
BEHAVIOUR, REGIONAL
PRICE DYNAMICS AND
PASS-THROUGH
2.4 THE RETAIL TRADES AND PASS-THROUGH
The aim of this section is to provide empirical evidence on the pass-through of costs into domestic prices (consumer and producer), examine how this varies across countries and sectors, and whether it is related to structural factors. In order to do so, this section analyses the pass-though of import and producer prices to consumer non-energy industrial goods prices
in euro area countries. Additionally, evidence for the pass-through to food prices and the clothing and footwear sector is provided.
The main-fi ndings are as follows. A large variation is found in the transmission of costs to fi nal goods sold across euro area countries and sectors. A joint analysis of the pass-through of import and producer prices suggests that producer prices are more relevant for the determination of
assumed to be anticipated by economic agents. Both the long-run (steady-state) effects and the
transitional dynamics are discussed here.
The Table reports the long-run results of reducing the (gross) mark-up non-tradables in the calibrated
model by 5 percentage points, corresponding to a reduction in the mark-up for distribution services
of 15 percentage points. Overall, the macroeconomic impact of such an economic reform is
sizeable: compared with the no-reform scenario, domestic output increases by 1.8%. The increase
is driven by both higher investment (+3.8%) and higher consumption (+0.8%). Firms increase
demand for capital and labour. Consequently, employment (hours worked) and real wages increase
by 1.1% and 4.1%, respectively. Regarding the effect on international trade, the increase in the
supply of services implies a depreciation of the real exchange rate and a deterioration of the terms
of trade, as the relative price of services (non-tradables) becomes lower. Consequently, exports
increase by 0.7%. The higher aggregate demand drives an increase in imports (+0.4%).
The Chart shows the domestic effects of reforms in the services sector along the transition from the
initial to the new steady state as deviations from the steady state in the no-reform baseline scenario.
As a direct impact of the reform measure, the price mark-up will decline and consumer price
infl ation will fall below the baseline in the short run. This effect fades out and, once the reform has
been implemented fully and all adjustments have been made, consumer price infl ation rebounds to
the long-run monetary policy target. Perhaps counter to what might be expected, according to the
model simulation, consumption will fall in the short run and will increase only in the medium term.
This is because domestic households anticipate that services will be cheaper in the future, when
their supply will be higher. Given the high services content of consumption, households postpone
consumption to future periods, when consumption goods will be cheaper. Therefore, private
consumption drops in the fi rst year and starts increasing afterwards, still remaining under the no-
reform scenario level for about four years, about the amount of time needed to fully implement
reforms.7 Simultaneously, fi rms anticipate the higher future production level and increase their
demand for capital and labour. This drives up the demand for domestic tradable goods and induces
the real wage to increase. After a short delay, output increases towards its new long-run level.
Domestic exports increase, while imports decrease in the short run, as the immediate lowering effect of
lower mark-ups on domestic prices gives rise to an improvement in domestic price competitiveness as
indicated by the depreciation of the real effective exchange rate. In the medium term, both exports and
imports will stay above the baseline path, refl ecting higher domestic and foreign demand. The spillover
impact on the rest of the euro area, while positive in the long run, is negligibly small overall.
7 While consumption achieves levels above the baseline steady state after four years, the full adjustment to the new long-run equilibrium
level happens very gradually. Consumption will achieve 50% of the new equilibrium level after 17 years.
84ECB
Structural features of distributive trades and their impact on prices in the euro area
September 2011
consumer prices in larger euro area countries. This analysis fi nds no signifi cant evidence for the link between pass-through estimates across countries and sectors, and structural indicators. However, the degree of competition appears to be positively related to the pass-through if the estimation is restricted to the long-run elasticity of consumer prices to import prices. Regarding food prices, some relevant differences in the pass-through estimates have been found across countries and products, which can be partially related to structural features of the retail trade sector, such as cross-country differences in the type and composition of retailers and producers. In particular, a stronger presence of discounters seems more likely to be associated with a higher pass-through. Finally, the available evidence on price pass-through in the clothing sector points to a reduced transmission of the fall in import prices to consumer prices.
2.4.1 PASS-THROUGH INTO CONSUMER
NON-ENERGY INDUSTRIAL GOODS PRICES
MOTIVATION
A robust feature found in the literature on the
pass-through of costs into domestic prices is their
declining size along the domestic production
chain. This is explained partly by the presence
of local costs, driving a wedge between border
and retail prices.121 An alternative explanation
is that imperfect competition gives rise to
profi t margins which can also provide partial
insulation from internationally transmitted
shocks. However, the impact of the market
structure in the retail sector seems to be an
under-investigated area.
Pass-through variations across countries and
sectors are diffi cult to evaluate, as types of shocks
and macroeconomic environments, for instance,
are not the same across studies. Warmedinger
(2004) investigates the cost transmission for fi ve
euro area countries, fi nding a comparatively lower
cost transmission of external shocks into import
prices for Germany than for France, Italy and
Spain. The lower cost transmission into German
import prices is the effect of the adjustment of
fi rms to competitors’ prices, which is stronger in
Germany than in the other countries. Less than
60% of foreign costs are passed on to German
import prices, while for France and Spain the
pass-through is above 80%. Although the size
of the transmission into domestic prices varies
across studies, it seems that some countries (such
as Germany) often appear at the lower end of the
pass-through spectrum, whereas other countries
(such as France) often appear at the higher end
of the spectrum. The latter is confi rmed by
Campa and Minguez (2004). They investigate
an exchange rate shock to domestic import
prices and fi nd that the long-run elasticity of
exchange rates is rather high for Spain and Italy,
but comparatively low for Germany and smaller
countries like Ireland and Austria. For the former
countries, the elasticities are (almost) complete,
while a much lower pass-through into import
prices was found for the latter countries, at about
half of the complete pass-through.122
A number of studies in different settings report
a lower impact of cost shocks on consumer
prices than on producer prices.123 Hahn (2003)
looks at the declining size of the pass-through
along the production chain, as well as the impact
of different shocks for the euro area aggregate.
The results indicate that the effect of an external
shock on producer prices in manufacturing is
It should be noted that complete pass-through of a cost change 121
to retail prices does not entail a one-to-one relationship between
the percentage change in costs and the percentage change in
prices. Other things being equal, the higher the portion of the
fi nal selling price that is accounted for by the cost, the higher the
pass-through coeffi cient will be. This is unlike the exchange rate
pass-through literature, where a one-to-one relationship tends
to be observed between the exchange rate movement and the
domestic price change. This is because the exchange rate change
applies to the entire import cost, whereas the retail selling
price is comprised of a number of costs of varying importance.
Therefore, the pass-through coeffi cient (the elasticity of the
selling price with respect to a specifi c cost factor) may be less
than unity even when pass-through is complete.
However, these estimates are not fully comparable, as not all 122
types of shocks are the same and the pass-through may also vary
across different macroeconomic environments. For instance,
some authors argue that the impact of cost transmissions
increases during high infl ation periods.
Among them are Campa and Minguez (2004), Goldberg 123
and Campa (2006), and Hahn (2003), as well as Landau and
Skudelny (2009). Clark (1999) reports similar fi ndings in the
aftermath of a monetary policy shock.
85ECB
Structural features of distributive trades and their impact on prices in the euro area
September 2011
2 THE IMPACT OF
STRUCTURAL FEATURES
ON PRICE LEVELS,
PRICE-SETTING
BEHAVIOUR, REGIONAL
PRICE DYNAMICS AND
PASS-THROUGH
most pronounced in the case of an increase in
non-oil import prices (61% of the shock is
transmitted after one year), followed by a shock
to the euro exchange rate (28% cost transmission
after one year).
Differences in the product-specifi c size of the cost
transmission have been analysed empirically less
frequently. Goldberg and Campa (2006) look at
the role of the distributive margins in the aftermath
of an exchange rate shock and their importance for
the cost transmission into consumer prices across
21 OECD countries. They fi nd common sectors
across countries for which margins are typically
high or typically low: margins are comparatively
high in furniture, textiles and leather products,
but lower in petroleum, natural gas and some
mining products. Most importantly, however, the
margins decrease in the case of depreciations and
hence in the wake of more expensive imports.
Unfortunately, the drivers of this variation of
margins are not analysed.
Empirical evidence of the impact of the structure
of the retail trade sector is scarce, although some
studies point towards competition as a key driver
of the pass-through. For instance, an empirical
investigation on fi rms’ behaviour was conducted
by Bertola et al. (2010), who found that the pass-
through of an input cost shock to prices is lower
in an environment of highly competitive product
markets, as fi rms have more incentives to reduce
wage costs instead of product prices (lower
pass-through into retail prices). However, in the
presence of collective wage agreements and more
stringent employment protection legislation, it is
more likely for the fi rm to respond to shocks
by increasing prices instead of lowering costs,
resulting in higher pass-through retail prices.
Another attempt to explain the ultimate drivers of
the cost transmission is made by Francois et al.
(2008), who study the pass-through of an import
price shock to producer and consumer prices
across EU Member States. At the product level,
the pass-through effect on producer prices is
highest for household maintenance items, textiles
and clothing, medical products and purchases of
vehicles. At the consumer level, the pass-through
is highest in the food sector, as well as in the
textiles and clothing sector. Most importantly,
the authors give empirical evidence on the
link between indicators of retail competition
(such as barriers to entry and price controls) and
the size of the pass-through to consumer prices.
In particular, they show that the pass-through
estimates are higher in less regulated markets
than in more regulated sectors.
EMPIRICAL ANALYSIS
This section investigates the pass-through of
changes in costs of fi nal goods for sale (using
import and producer (PPI) prices), specifi cally
items of HICP non-energy industrial goods.124
The pass-through of the import prices of fi nal
goods and of PPI for domestic sales to non-
energy industrial goods prices is examined
in an autoregressive distributed lag (ARDL)
model. As this approach faces some limitations,
the pass-through of total import prices is looked
at, following Francoise et al. (2007, 2008).
In the following analysis, import prices are
measured by unit value indices (UVI) for intra
and extra-euro area imports.125 UVI and PPI data
have been mapped for 15 product sectors with
HICP data, covering about 23% of the HICP
and about 80% of non-energy industrial goods
for the euro area. The mapping table is shown as
Table A15 in the Technical Appendix.126
Pass-through of import and producer prices
to consumer prices
The pass-through of domestic and foreign costs
is analysed fi rst, using ARDL specifi cations.
This means that domestic consumer prices are
While it would also be interesting to have information on the 124
impact of the structural features on the pass-through of other
costs, in particular wages (on a sectoral level), which are of high
relevance for the retail sectors, the data needed for this analysis
are not available.
Imports are based on the CPA 2002 trade data, while 125
industrial producer prices (PPI) are based on the NACE Rev.
2 classifi cation.
Importantly, this mapping of different classifi cation schemes 126
has its caveats, as, in many cases, the UVI, PPI and HICP
cover not identical goods, but just a similar class of goods.
Moreover, while the PPI and HICP are “real” price indices with
a well-defi ned basket of goods and high statistical standards,
UVI are usually of lower data quality.
86ECB
Structural features of distributive trades and their impact on prices in the euro area
September 2011
explained by their own lagged values and the
current and lagged values of all other main
explanatory variables:
Δhicpt = α +∑i=Lh
δiΔuvit-i + dummy(VAT) + et∑i=Lu
γiΔppit-i βiΔhicpt-i +∑i=Lp
+
Variables in lower case letters are in logs, while
fi rst differences account for unit roots in the time
series.127 The series are quarterly, the longest
covering the period from the fi rst quarter of 1990
and the third quarter of 2010, but in many cases
the estimation period is shorter, depending on the
availability of data.128 Owing to data limitations,
only ten euro area countries are covered in this
analysis: Belgium, Germany, France, Ireland,
Italy, Spain, the Netherlands, Austria, Portugal
and Finland. Estimation results are shown in
Table A16 in the Technical Appendix, where
only positive pass-through coeffi cients signifi cant
at the 5% level are reported.
Looking at the PPI pass-through in terms
of the median estimate of a product
category across countries, it appears that a
pass-through of more than 0.5 (in descending
order) is found for “Jewellery”, “Personal
transport equipment”, “Information processing
equipment”, “Equipment for reception (TV/
radio)”, “Cars”, “Textiles” and “Furniture”.
An almost complete or full pass-through was
found for “Jewellery” in quite a number of
countries. A pass-through for the PPI below
0.5 was found for “Pharmaceutical products”,
“Personal care appliances”, “Newspapers/Books”,
“Non-durable household goods”, “Sports
equipment” and “Household appliances”.
Meanwhile, UVI pass-through estimates are
considerably lower, with only one sector
(photographic equipment) having a pass-through
estimate exceeding 0.5.
Overall, price changes for domestic goods
(i.e. PPIs) tend to be of higher importance
for prices of manufactured consumer goods
in the larger euro area countries, refl ecting
signifi cant domestic production, while import
price changes (i.e. UVI) are more relevant for
consumer prices in smaller, more “open” euro
area countries where imports play a greater role.
The latter seem to be linked to an import content
that is likely to be higher in retail sales and to
very little own production, which is also partly
a reason for the reduced availability of PPI data
for these countries.
However, no signifi cant association is found
between these pass-through estimates across
products/countries and structural features of the
retail sector – measured by the HHI and the profi t
share. This fi nding does not necessarily mean
that the pass-through of costs is independent of
structural features in the retail sector in the euro
area economies, but rather illustrates that the
analysis faces many diffi culties, partly related
to the availability and quality of price and cost
data, as well as that of structural indicators, at a
detailed sector level.
Impact of import prices on consumer prices
Given that there were some limitations to the
previous ARDL approach, a simpler analysis is
now applied to the impact of import prices on
consumer prices. Mainly following the approach
of Francoise et al. (2007, 2008), domestic
producer prices are approximated by intra-area
import prices.129 More precisely, long-run pass-
through elasticities of non-energy industrial
goods prices to changes in total import prices
are estimated using the following equation:
ln HICPt = α + β ln UVIt (+δT)
Dummy variables for changes in the country’s standard VAT 127
rate are included if signifi cant. The lag structures are determined
by reducing a general specifi cation to a parsimonious one
by F-tests and t-tests on the signifi cance of sets and single
parameter estimates. The long-run elasticity of the pass-through
of producer prices to domestic consumer prices is given by
∑i=Lp
∑i=Lh
γi / (1– )βi .
Consumer prices of clothing and footwear are seasonally adjusted, 128
taking account of a strong and changing seasonal pattern.
The other variables are not adjusted, as the autoregressive part
of the equation is able to capture the seasonality adequately.
While this is a rather bold assumption, it allows use of a 129
consistent data classifi cation set to be made, a high level
of coverage across euro area countries and sectors, and the
extraction of just one pass-through estimator.
87ECB
Structural features of distributive trades and their impact on prices in the euro area
September 2011
2 THE IMPACT OF
STRUCTURAL FEATURES
ON PRICE LEVELS,
PRICE-SETTING
BEHAVIOUR, REGIONAL
PRICE DYNAMICS AND
PASS-THROUGH
where the log of HICP prices is regressed on a
constant and the log of the respective UVI (intra
and extra-area import prices). As prices of a
number of electronic products have been on a
downward trend due to technical progress and
related quality adjustment in the HICP, which is
not suffi ciently refl ected in UVI, a time trend is
added to the equation.130 Only the estimated
parameters which are positive and signifi cant at
the 5% level are reported.131
The median elasticity of import price changes to
consumer prices is estimated at 0.45 across the
12 euro area countries and 15 sectors considered
in this analysis (see Table A17 in the Technical
Appendix). However, the pass-through across
industries and countries is rather dispersed. For
comparison reasons, the estimated elasticities
for the euro area as a whole are added, with an
estimated median pass-through of 0.54. This is
largely comparable with results in the literature,
such as those of Hahn (2003), who estimates
the pass-through of non-oil import prices to the
overall euro area HICP at 0.31 after three years.
It is possible that this latter estimate is kept down
by the very low pass-through of import prices to
consumer energy prices, which are included in
the overall HICP.
In ten sectors, the median long-run import price
elasticity of consumer prices is around 0.5,
and, in most of these sectors, import price
elasticities are signifi cant for almost all
countries. This is particularly true of the sectors
“Furniture”, “Appliances for personal care”,
“Jewellery, clocks and watches”, “Newspapers,
books and stationery” and “Motor cars”.
Fewer signifi cant results at the country level
are found in the clothing and footwear sector,
where the median elasticity is 0.4, but with
large country dispersion. The same applies to
the items “Information processing equipment”
and, albeit to a lesser extent, “Photographic
equipment, etc.” and “Household appliances”.
The inclusion of a time trend in the estimates for
these two sectors, which attempts to capture the
impact of technical progress, does not help in
detecting a signifi cant relationship between the
HICP and UVI. This may also explain the few
signifi cant and meaningful results at the country
level for the “Household appliances” sector,
with a median pass-through of 0.1. There is also
little discernible pass-through in the “Games,
toys and hobbies” and “Equipment for sports,
camping and open-air recreation” sectors.
Regarding country divergence, consumer
prices seem to have relatively high import
price elasticities (i.e. a median higher than 0.5)
in Belgium, the Netherlands and Spain, and a
relatively low one (median of 0.2) in Ireland.
Overall, the fi ndings are somewhat different
to those of Francoise et al. (2008), but these
are based on a different sample with respect to
the countries, period and goods. Nevertheless,
they confi rm that the impact of import prices on
consumer prices varies greatly across countries
and sectors.
There is some evidence that the magnitude
of the estimated pass-though is related to the
degree of competition/concentration in the
specifi c country and sector. Chart 17 shows a
negative, albeit weak, relationship between the
estimated import price elasticity and the HHI,
suggesting that the stronger the competition
(i.e. the lower the HHI), the higher the
elasticity of consumer prices seems to be with
respect to import price changes. By contrast,
no link seems to exist between the estimated
coeffi cients and the profi t share (see Chart 18).
To check the robustness of the above
relationship, an estimation is made of whether
competition signifi cantly impacts on the
magnitude of the import price elasticity,
once controlling for effects stemming from
cross-sector differences. A panel regression
All series have been seasonally adjusted by ARIMA X12. SUR 130
estimation is applied to allow for contemporaneous correlation
between the error terms across the country equations for a
specifi c sector, as the shocks are expected to be sector rather
than country-specifi c.
UVI and HICP series are, in most cases, non-stationary, which 131
implies that conventionally used tests do not have standard
asymptotic distributions. However, the HICP and UVI series
are not expected to be co-integrated, as an important part in this
relationship, namely the costs of domestically produced goods,
is missing.
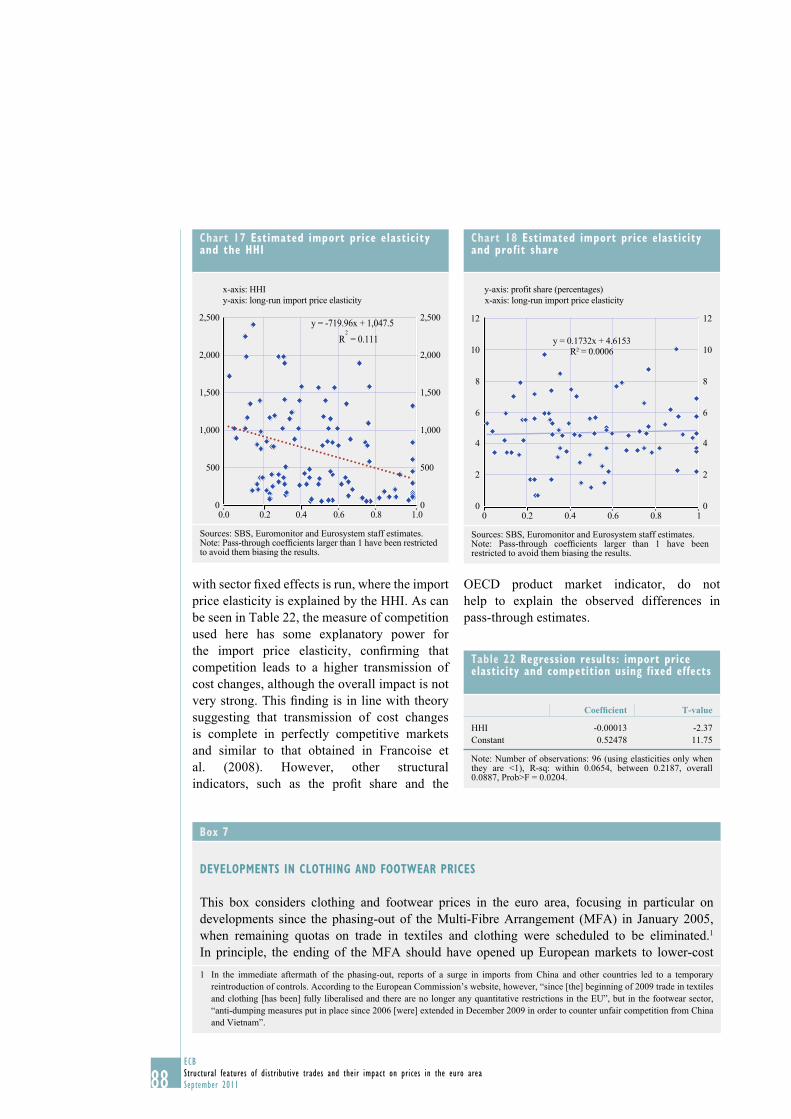
88ECB
Structural features of distributive trades and their impact on prices in the euro area
September 2011
with sector fi xed effects is run, where the import
price elasticity is explained by the HHI. As can
be seen in Table 22, the measure of competition
used here has some explanatory power for
the import price elasticity, confi rming that
competition leads to a higher transmission of
cost changes, although the overall impact is not
very strong. This fi nding is in line with theory
suggesting that transmission of cost changes
is complete in perfectly competitive markets
and similar to that obtained in Francoise et
al. (2008). However, other structural
indicators, such as the profi t share and the
OECD product market indicator, do not
help to explain the observed differences in
pass-through estimates.
Chart 17 Estimated import price elasticityand the HHI
y = -719.96x + 1,047.5
R2
= 0.111
0
500
1,000
1,500
2,000
2,500
0
500
1,000
1,500
2,000
2,500
1.00.0 0.2 0.4 0.6 0.8
x-axis: HHI
y-axis: long-run import price elasticity
Sources: SBS, Euromonitor and Eurosystem staff estimates.Note: Pass-through coeffi cients larger than 1 have been restricted to avoid them biasing the results.
Chart 18 Estimated import price elasticity and profit share
0
2
4
6
8
10
12
0
2
4
6
8
10
12
y = 0.1732x + 4.6153
R2 = 0.0006
0 0.2 0.4 0.6 0.8 1
x-axis: long-run import price elasticity
y-axis: profit share (percentages)
Sources: SBS, Euromonitor and Eurosystem staff estimates.Note: Pass-through coeffi cients larger than 1 have been restricted to avoid them biasing the results.
Table 22 Regression results: import price elasticity and competition using fixed effects
Coeffi cient T-value
HHI -0.00013 -2.37
Constant 0.52478 11.75
Note: Number of observations: 96 (using elasticities only when they are <1), R-sq: within 0.0654, between 0.2187, overall 0.0887, Prob>F = 0.0204.
Box 7
DEVELOPMENTS IN CLOTHING AND FOOTWEAR PRICES
This box considers clothing and footwear prices in the euro area, focusing in particular on
developments since the phasing-out of the Multi-Fibre Arrangement (MFA) in January 2005,
when remaining quotas on trade in textiles and clothing were scheduled to be eliminated.1
In principle, the ending of the MFA should have opened up European markets to lower-cost
1 In the immediate aftermath of the phasing-out, reports of a surge in imports from China and other countries led to a temporary
reintroduction of controls. According to the European Commission’s website, however, “since [the] beginning of 2009 trade in textiles
and clothing [has been] fully liberalised and there are no longer any quantitative restrictions in the EU”, but in the footwear sector,
“anti-dumping measures put in place since 2006 [were] extended in December 2009 in order to counter unfair competition from China
and Vietnam”.
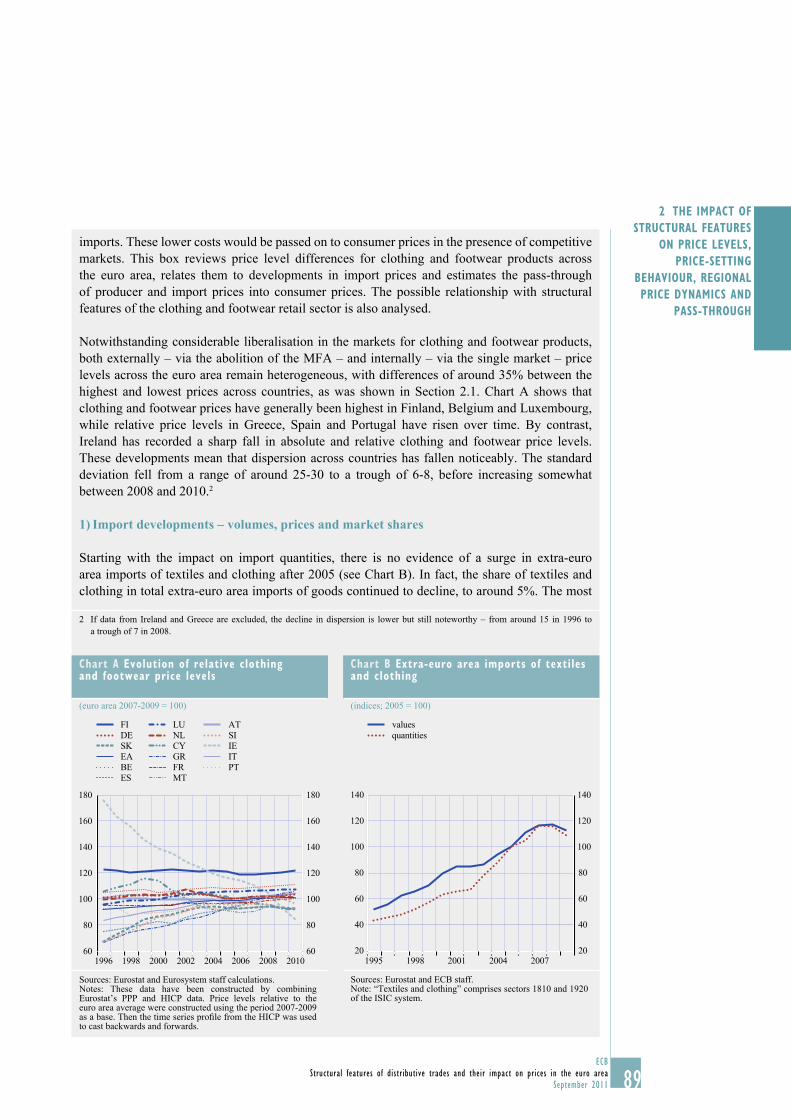
89ECB
Structural features of distributive trades and their impact on prices in the euro area
September 2011
2 THE IMPACT OF
STRUCTURAL FEATURES
ON PRICE LEVELS,
PRICE-SETTING
BEHAVIOUR, REGIONAL
PRICE DYNAMICS AND
PASS-THROUGH
imports. These lower costs would be passed on to consumer prices in the presence of competitive
markets. This box reviews price level differences for clothing and footwear products across
the euro area, relates them to developments in import prices and estimates the pass-through
of producer and import prices into consumer prices. The possible relationship with structural
features of the clothing and footwear retail sector is also analysed.
Notwithstanding considerable liberalisation in the markets for clothing and footwear products,
both externally – via the abolition of the MFA – and internally – via the single market – price
levels across the euro area remain heterogeneous, with differences of around 35% between the
highest and lowest prices across countries, as was shown in Section 2.1. Chart A shows that
clothing and footwear prices have generally been highest in Finland, Belgium and Luxembourg,
while relative price levels in Greece, Spain and Portugal have risen over time. By contrast,
Ireland has recorded a sharp fall in absolute and relative clothing and footwear price levels.
These developments mean that dispersion across countries has fallen noticeably. The standard
deviation fell from a range of around 25-30 to a trough of 6-8, before increasing somewhat
between 2008 and 2010.2
1) Import developments – volumes, prices and market shares
Starting with the impact on import quantities, there is no evidence of a surge in extra-euro
area imports of textiles and clothing after 2005 (see Chart B). In fact, the share of textiles and
clothing in total extra-euro area imports of goods continued to decline, to around 5%. The most
2 If data from Ireland and Greece are excluded, the decline in dispersion is lower but still noteworthy – from around 15 in 1996 to
a trough of 7 in 2008.
Chart A Evolution of relative clothing and footwear price levels
(euro area 2007-2009 = 100)
60
80
100
120
140
160
180
60
80
100
120
140
160
180
1996 1998 2000 2002 2004 2006 2008 2010
FI
DE
SK
EA
BE
ES
AT
SI
IE
IT
PT
LU
NL
CY
GR
FR
MT
Sources: Eurostat and Eurosystem staff calculations.Notes: These data have been constructed by combining Eurostat’s PPP and HICP data. Price levels relative to the euro area average were constructed using the period 2007-2009 as a base. Then the time series profi le from the HICP was used to cast backwards and forwards.
Chart B Extra-euro area imports of textiles and clothing
(indices; 2005 = 100)
20
40
60
80
100
120
140
20
40
60
80
100
120
140
1995 1998 2001 2004 2007
values
quantities
Sources: Eurostat and ECB staff.Note: “Textiles and clothing” comprises sectors 1810 and 1920 of the ISIC system.
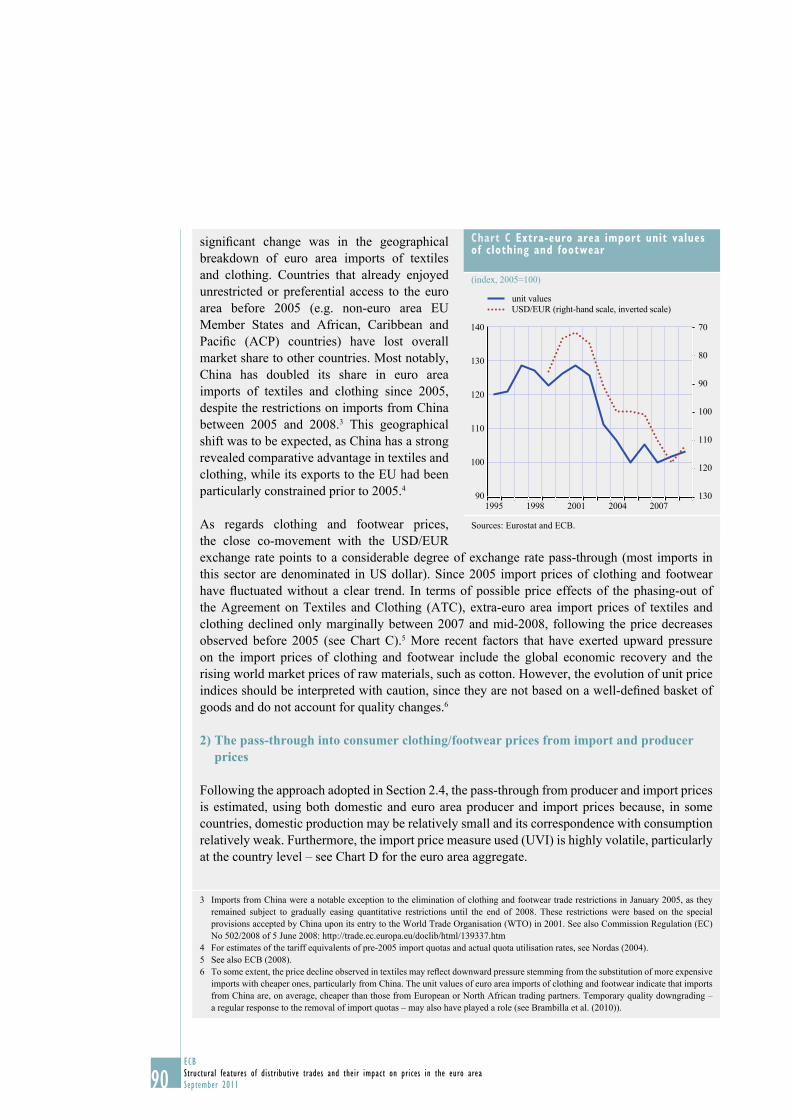
90ECB
Structural features of distributive trades and their impact on prices in the euro area
September 2011
signifi cant change was in the geographical
breakdown of euro area imports of textiles
and clothing. Countries that already enjoyed
unrestricted or preferential access to the euro
area before 2005 (e.g. non-euro area EU
Member States and African, Caribbean and
Pacifi c (ACP) countries) have lost overall
market share to other countries. Most notably,
China has doubled its share in euro area
imports of textiles and clothing since 2005,
despite the restrictions on imports from China
between 2005 and 2008.3 This geographical
shift was to be expected, as China has a strong
revealed comparative advantage in textiles and
clothing, while its exports to the EU had been
particularly constrained prior to 2005.4
As regards clothing and footwear prices,
the close co-movement with the USD/EUR
exchange rate points to a considerable degree of exchange rate pass-through (most imports in
this sector are denominated in US dollar). Since 2005 import prices of clothing and footwear
have fl uctuated without a clear trend. In terms of possible price effects of the phasing-out of
the Agreement on Textiles and Clothing (ATC), extra-euro area import prices of textiles and
clothing declined only marginally between 2007 and mid-2008, following the price decreases
observed before 2005 (see Chart C).5 More recent factors that have exerted upward pressure
on the import prices of clothing and footwear include the global economic recovery and the
rising world market prices of raw materials, such as cotton. However, the evolution of unit price
indices should be interpreted with caution, since they are not based on a well-defi ned basket of
goods and do not account for quality changes.6
2) The pass-through into consumer clothing/footwear prices from import and producer prices
Following the approach adopted in Section 2.4, the pass-through from producer and import prices
is estimated, using both domestic and euro area producer and import prices because, in some
countries, domestic production may be relatively small and its correspondence with consumption
relatively weak. Furthermore, the import price measure used (UVI) is highly volatile, particularly
at the country level – see Chart D for the euro area aggregate.
3 Imports from China were a notable exception to the elimination of clothing and footwear trade restrictions in January 2005, as they
remained subject to gradually easing quantitative restrictions until the end of 2008. These restrictions were based on the special
provisions accepted by China upon its entry to the World Trade Organisation (WTO) in 2001. See also Commission Regulation (EC)
No 502/2008 of 5 June 2008: http://trade.ec.europa.eu/doclib/html/139337.htm
4 For estimates of the tariff equivalents of pre-2005 import quotas and actual quota utilisation rates, see Nordas (2004).
5 See also ECB (2008).
6 To some extent, the price decline observed in textiles may refl ect downward pressure stemming from the substitution of more expensive
imports with cheaper ones, particularly from China. The unit values of euro area imports of clothing and footwear indicate that imports
from China are, on average, cheaper than those from European or North African trading partners. Temporary quality downgrading –
a regular response to the removal of import quotas – may also have played a role (see Brambilla et al. (2010)).
Chart C Extra-euro area import unit values of clothing and footwear
(index, 2005=100)
90
100
110
120
130
140 70
80
90
100
110
120
1301995 1998 2001 2004 2007
unit values
USD/EUR (right-hand scale, inverted scale)
Sources: Eurostat and ECB.
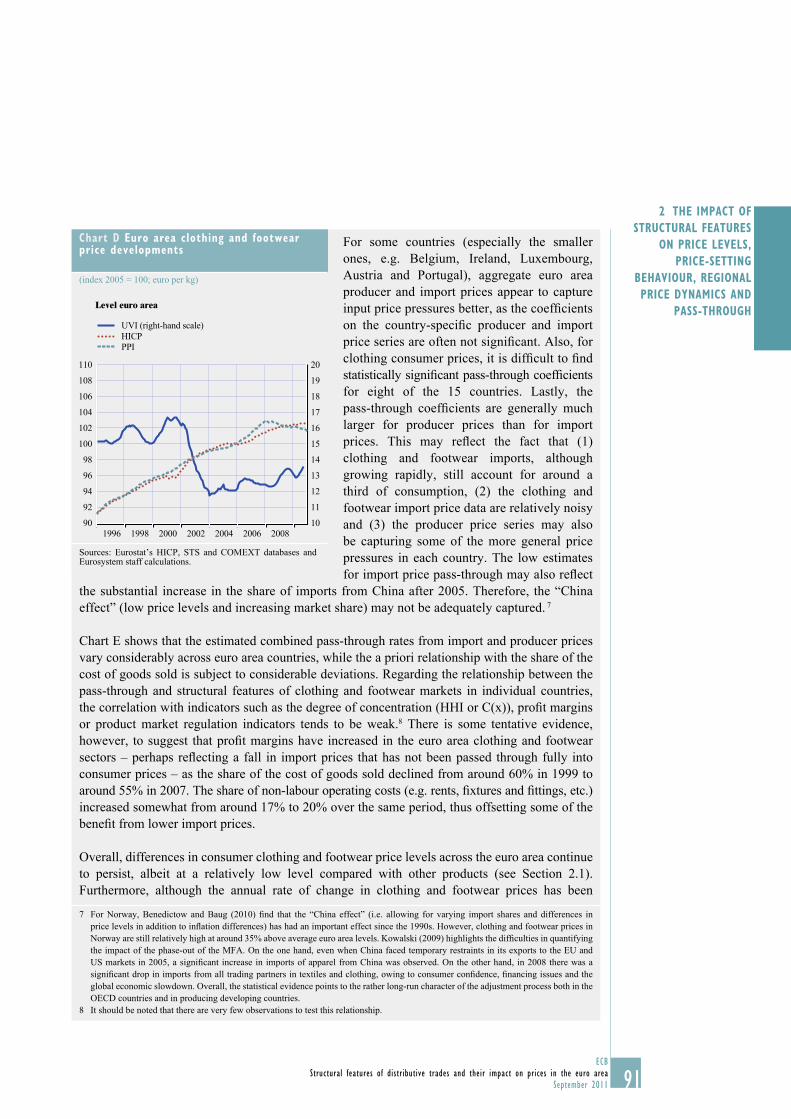
91ECB
Structural features of distributive trades and their impact on prices in the euro area
September 2011
2 THE IMPACT OF
STRUCTURAL FEATURES
ON PRICE LEVELS,
PRICE-SETTING
BEHAVIOUR, REGIONAL
PRICE DYNAMICS AND
PASS-THROUGH
For some countries (especially the smaller
ones, e.g. Belgium, Ireland, Luxembourg,
Austria and Portugal), aggregate euro area
producer and import prices appear to capture
input price pressures better, as the coeffi cients
on the country-specifi c producer and import
price series are often not signifi cant. Also, for
clothing consumer prices, it is diffi cult to fi nd
statistically signifi cant pass-through coeffi cients
for eight of the 15 countries. Lastly, the
pass-through coeffi cients are generally much
larger for producer prices than for import
prices. This may refl ect the fact that (1)
clothing and footwear imports, although
growing rapidly, still account for around a
third of consumption, (2) the clothing and
footwear import price data are relatively noisy
and (3) the producer price series may also
be capturing some of the more general price
pressures in each country. The low estimates
for import price pass-through may also refl ect
the substantial increase in the share of imports from China after 2005. Therefore, the “China
effect” (low price levels and increasing market share) may not be adequately captured. 7
Chart E shows that the estimated combined pass-through rates from import and producer prices
vary considerably across euro area countries, while the a priori relationship with the share of the
cost of goods sold is subject to considerable deviations. Regarding the relationship between the
pass-through and structural features of clothing and footwear markets in individual countries,
the correlation with indicators such as the degree of concentration (HHI or C(x)), profi t margins
or product market regulation indicators tends to be weak.8 There is some tentative evidence,
however, to suggest that profi t margins have increased in the euro area clothing and footwear
sectors – perhaps refl ecting a fall in import prices that has not been passed through fully into
consumer prices – as the share of the cost of goods sold declined from around 60% in 1999 to
around 55% in 2007. The share of non-labour operating costs (e.g. rents, fi xtures and fi ttings, etc.)
increased somewhat from around 17% to 20% over the same period, thus offsetting some of the
benefi t from lower import prices.
Overall, differences in consumer clothing and footwear price levels across the euro area continue
to persist, albeit at a relatively low level compared with other products (see Section 2.1).
Furthermore, although the annual rate of change in clothing and footwear prices has been
7 For Norway, Benedictow and Baug (2010) fi nd that the “China effect” (i.e. allowing for varying import shares and differences in
price levels in addition to infl ation differences) has had an important effect since the 1990s. However, clothing and footwear prices in
Norway are still relatively high at around 35% above average euro area levels. Kowalski (2009) highlights the diffi culties in quantifying
the impact of the phase-out of the MFA. On the one hand, even when China faced temporary restraints in its exports to the EU and
US markets in 2005, a signifi cant increase in imports of apparel from China was observed. On the other hand, in 2008 there was a
signifi cant drop in imports from all trading partners in textiles and clothing, owing to consumer confi dence, fi nancing issues and the
global economic slowdown. Overall, the statistical evidence points to the rather long-run character of the adjustment process both in the
OECD countries and in producing developing countries.
8 It should be noted that there are very few observations to test this relationship.
Chart D Euro area clothing and footwear price developments
(index 2005 = 100; euro per kg)
Level euro area
90
92
94
96
98
100
102
104
106
108
110
10
11
12
13
14
15
16
17
18
19
20
1996 1998 2000 2002 2004 2006 2008
UVI (right-hand scale)
PPI
HICP
Sources: Eurostat’s HICP, STS and COMEXT databases and Eurosystem staff calculations.
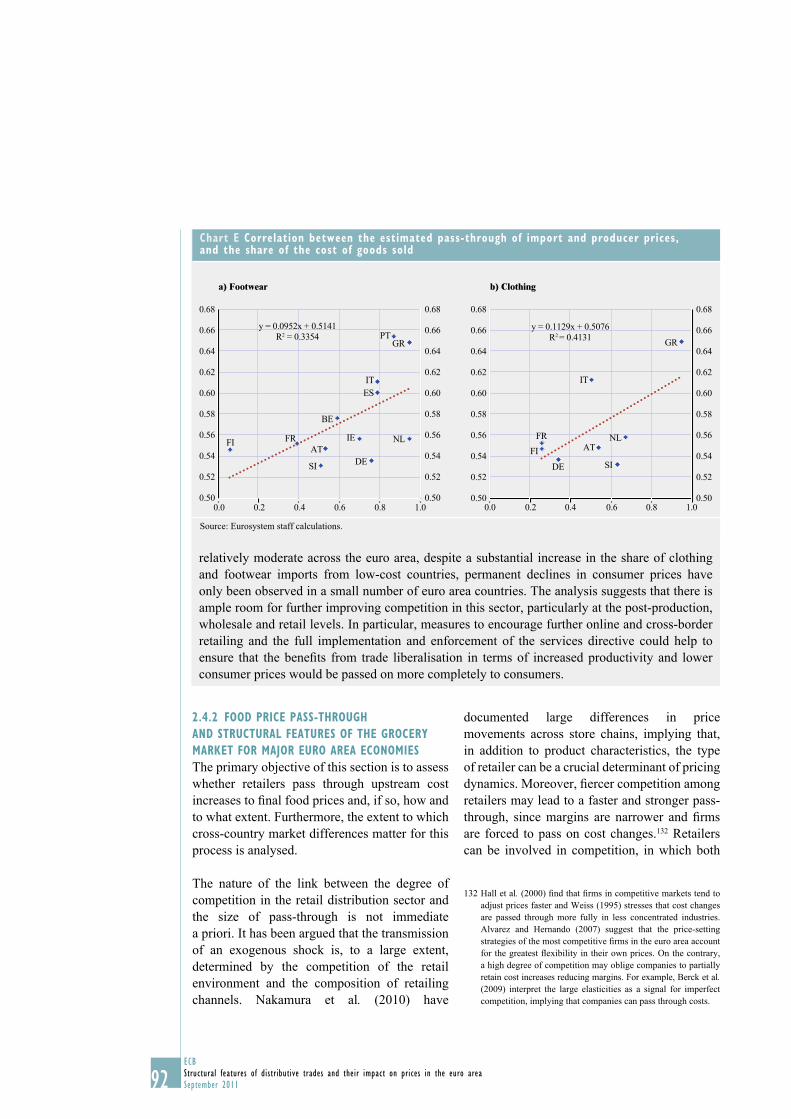
92ECB
Structural features of distributive trades and their impact on prices in the euro area
September 2011
2.4.2 FOOD PRICE PASS-THROUGH
AND STRUCTURAL FEATURES OF THE GROCERY
MARKET FOR MAJOR EURO AREA ECONOMIES
The primary objective of this section is to assess
whether retailers pass through upstream cost
increases to fi nal food prices and, if so, how and
to what extent. Furthermore, the extent to which
cross-country market differences matter for this
process is analysed.
The nature of the link between the degree of
competition in the retail distribution sector and
the size of pass-through is not immediate
a priori. It has been argued that the transmission
of an exogenous shock is, to a large extent,
determined by the competition of the retail
environment and the composition of retailing
channels. Nakamura et al. (2010) have
documented large differences in price
movements across store chains, implying that,
in addition to product characteristics, the type
of retailer can be a crucial determinant of pricing
dynamics. Moreover, fi ercer competition among
retailers may lead to a faster and stronger pass-
through, since margins are narrower and fi rms
are forced to pass on cost changes.132 Retailers
can be involved in competition, in which both
Hall et al132 . (2000) fi nd that fi rms in competitive markets tend to
adjust prices faster and Weiss (1995) stresses that cost changes
are passed through more fully in less concentrated industries.
Alvarez and Hernando (2007) suggest that the price-setting
strategies of the most competitive fi rms in the euro area account
for the greatest fl exibility in their own prices. On the contrary,
a high degree of competition may oblige companies to partially
retain cost increases reducing margins. For example, Berck et al. (2009) interpret the large elasticities as a signal for imperfect
competition, implying that companies can pass through costs.
relatively moderate across the euro area, despite a substantial increase in the share of clothing
and footwear imports from low-cost countries, permanent declines in consumer prices have
only been observed in a small number of euro area countries. The analysis suggests that there is
ample room for further improving competition in this sector, particularly at the post-production,
wholesale and retail levels. In particular, measures to encourage further online and cross-border
retailing and the full implementation and enforcement of the services directive could help to
ensure that the benefi ts from trade liberalisation in terms of increased productivity and lower
consumer prices would be passed on more completely to consumers.
Chart E Correlation between the estimated pass-through of import and producer prices, and the share of the cost of goods sold
a) Footwear b) Clothing
FI
SI
PT
ATNL
IT
FR
ES
GR
IE
DE
BE
y = 0.0952x + 0.5141
R2 = 0.3354
0.50
0.52
0.54
0.56
0.58
0.60
0.62
0.64
0.66
0.68
0.50
0.52
0.54
0.56
0.58
0.60
0.62
0.64
0.66
0.68
0.0 0.2 0.4 0.6 0.8 1.0
FI
SI
ATNL
IT
FR
GR
DE
y = 0.1129x + 0.5076
R2 = 0.4131
0.50
0.52
0.54
0.56
0.58
0.60
0.62
0.64
0.66
0.68
0.50
0.52
0.54
0.56
0.58
0.60
0.62
0.64
0.66
0.68
0.0 0.2 0.4 0.6 0.8 1.0
Source: Eurosystem staff calculations.
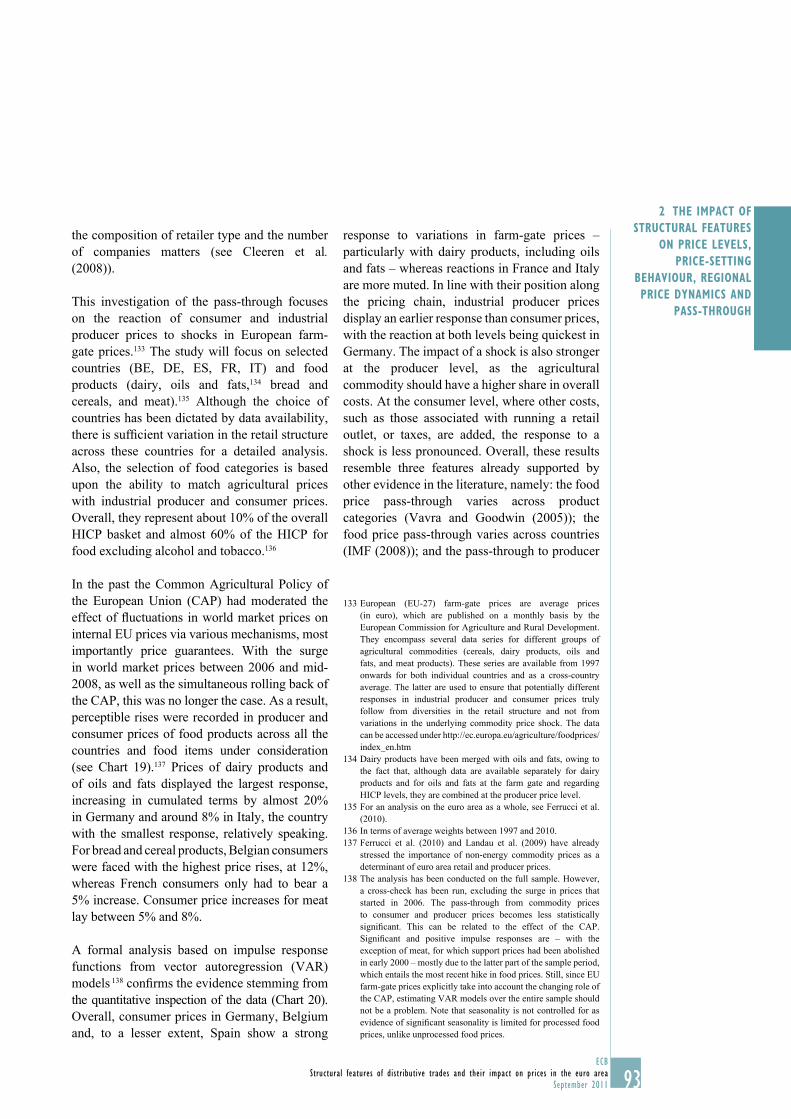
93ECB
Structural features of distributive trades and their impact on prices in the euro area
September 2011
2 THE IMPACT OF
STRUCTURAL FEATURES
ON PRICE LEVELS,
PRICE-SETTING
BEHAVIOUR, REGIONAL
PRICE DYNAMICS AND
PASS-THROUGH
the composition of retailer type and the number
of companies matters (see Cleeren et al. (2008)).
This investigation of the pass-through focuses
on the reaction of consumer and industrial
producer prices to shocks in European farm-
gate prices.133 The study will focus on selected
countries (BE, DE, ES, FR, IT) and food
products (dairy, oils and fats,134 bread and
cereals, and meat).135 Although the choice of
countries has been dictated by data availability,
there is suffi cient variation in the retail structure
across these countries for a detailed analysis.
Also, the selection of food categories is based
upon the ability to match agricultural prices
with industrial producer and consumer prices.
Overall, they represent about 10% of the overall
HICP basket and almost 60% of the HICP for
food excluding alcohol and tobacco.136
In the past the Common Agricultural Policy of
the European Union (CAP) had moderated the
effect of fl uctuations in world market prices on
internal EU prices via various mechanisms, most
importantly price guarantees. With the surge
in world market prices between 2006 and mid-
2008, as well as the simultaneous rolling back of
the CAP, this was no longer the case. As a result,
perceptible rises were recorded in producer and
consumer prices of food products across all the
countries and food items under consideration
(see Chart 19).137 Prices of dairy products and
of oils and fats displayed the largest response,
increasing in cumulated terms by almost 20%
in Germany and around 8% in Italy, the country
with the smallest response, relatively speaking.
For bread and cereal products, Belgian consumers
were faced with the highest price rises, at 12%,
whereas French consumers only had to bear a
5% increase. Consumer price increases for meat
lay between 5% and 8%.
A formal analysis based on impulse response
functions from vector autoregression (VAR)
models 138 confi rms the evidence stemming from
the quantitative inspection of the data (Chart 20).
Overall, consumer prices in Germany, Belgium
and, to a lesser extent, Spain show a strong
response to variations in farm-gate prices –
particularly with dairy products, including oils
and fats – whereas reactions in France and Italy
are more muted. In line with their position along
the pricing chain, industrial producer prices
display an earlier response than consumer prices,
with the reaction at both levels being quickest in
Germany. The impact of a shock is also stronger
at the producer level, as the agricultural
commodity should have a higher share in overall
costs. At the consumer level, where other costs,
such as those associated with running a retail
outlet, or taxes, are added, the response to a
shock is less pronounced. Overall, these results
resemble three features already supported by
other evidence in the literature, namely: the food
price pass-through varies across product
categories (Vavra and Goodwin (2005)); the
food price pass-through varies across countries
(IMF (2008)); and the pass-through to producer
European (EU-27) farm-gate prices are average prices 133
(in euro), which are published on a monthly basis by the
European Commission for Agriculture and Rural Development.
They encompass several data series for different groups of
agricultural commodities (cereals, dairy products, oils and
fats, and meat products). These series are available from 1997
onwards for both individual countries and as a cross-country
average. The latter are used to ensure that potentially different
responses in industrial producer and consumer prices truly
follow from diversities in the retail structure and not from
variations in the underlying commodity price shock. The data
can be accessed under http://ec.europa.eu/agriculture/foodprices/
index_en.htm
Dairy products have been merged with oils and fats, owing to 134
the fact that, although data are available separately for dairy
products and for oils and fats at the farm gate and regarding
HICP levels, they are combined at the producer price level.
For an analysis on the euro area as a whole, see Ferrucci et al. 135
(2010).
In terms of average weights between 1997 and 2010.136
Ferrucci et al. (2010) and Landau et al. (2009) have already 137
stressed the importance of non-energy commodity prices as a
determinant of euro area retail and producer prices.
The analysis has been conducted on the full sample. However, 138
a cross-check has been run, excluding the surge in prices that
started in 2006. The pass-through from commodity prices
to consumer and producer prices becomes less statistically
signifi cant. This can be related to the effect of the CAP.
Signifi cant and positive impulse responses are – with the
exception of meat, for which support prices had been abolished
in early 2000 – mostly due to the latter part of the sample period,
which entails the most recent hike in food prices. Still, since EU
farm-gate prices explicitly take into account the changing role of
the CAP, estimating VAR models over the entire sample should
not be a problem. Note that seasonality is not controlled for as
evidence of signifi cant seasonality is limited for processed food
prices, unlike unprocessed food prices.
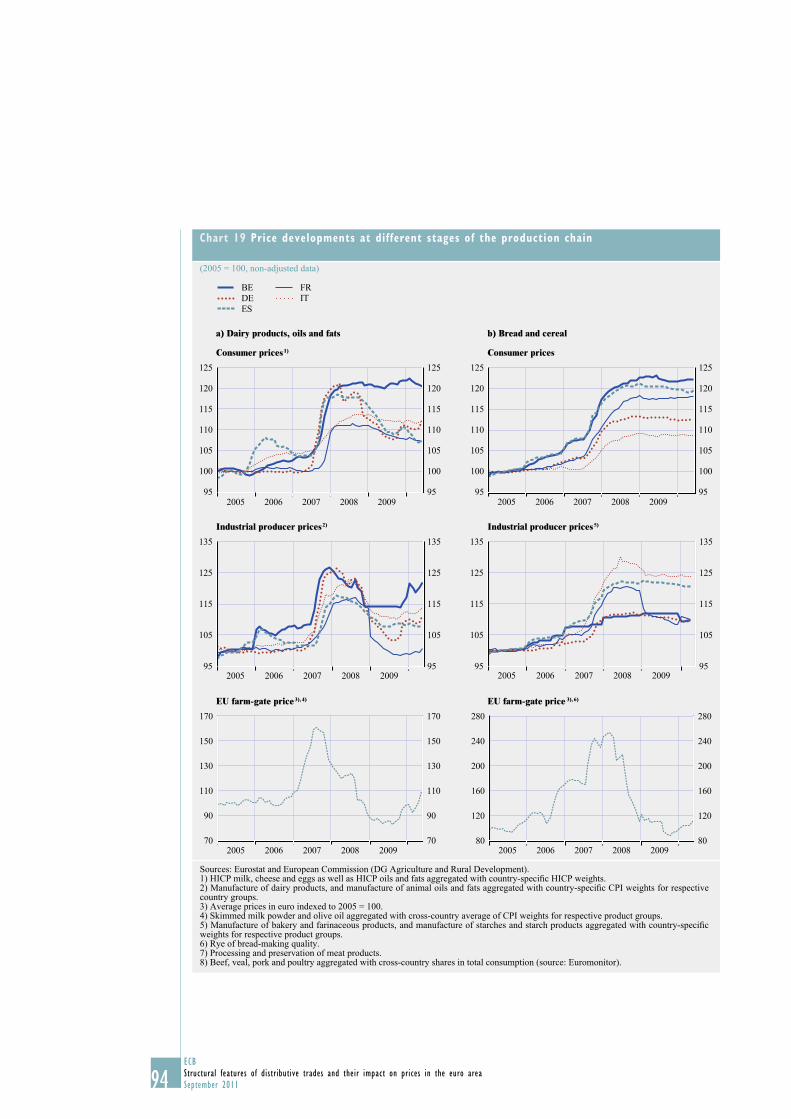
94ECB
Structural features of distributive trades and their impact on prices in the euro area
September 2011
Chart 19 Price developments at different stages of the production chain
(2005 = 100, non-adjusted data)
BE
DE
ES
IT
FR
a) Dairy products, oils and fats b) Bread and cereal
Consumer prices 1) Consumer prices
95
100
105
110
115
120
125
95
100
105
110
115
120
125
2005 2006 2007 2008 200995
100
105
110
115
120
125
95
100
105
110
115
120
125
2005 2006 2007 2008 2009
Industrial producer prices 2) Industrial producer prices 5)
95
105
115
125
135
95
105
115
125
135
2005 2006 2007 2008 200995
105
115
125
135
95
105
115
125
135
2005 2006 2007 2008 2009
EU farm-gate price 3), 4) EU farm-gate price 3), 6)
70
90
110
130
150
170
70
90
110
130
150
170
2005 2006 2007 2008 200980
120
160
200
240
280
80
120
160
200
240
280
2005 2006 2007 2008 2009
Sources: Eurostat and European Commission (DG Agriculture and Rural Development).1) HICP milk, cheese and eggs as well as HICP oils and fats aggregated with country-specifi c HICP weights. 2) Manufacture of dairy products, and manufacture of animal oils and fats aggregated with country-specifi c CPI weights for respective country groups. 3) Average prices in euro indexed to 2005 = 100. 4) Skimmed milk powder and olive oil aggregated with cross-country average of CPI weights for respective product groups. 5) Manufacture of bakery and farinaceous products, and manufacture of starches and starch products aggregated with country-specifi c weights for respective product groups. 6) Rye of bread-making quality. 7) Processing and preservation of meat products. 8) Beef, veal, pork and poultry aggregated with cross-country shares in total consumption (source: Euromonitor).
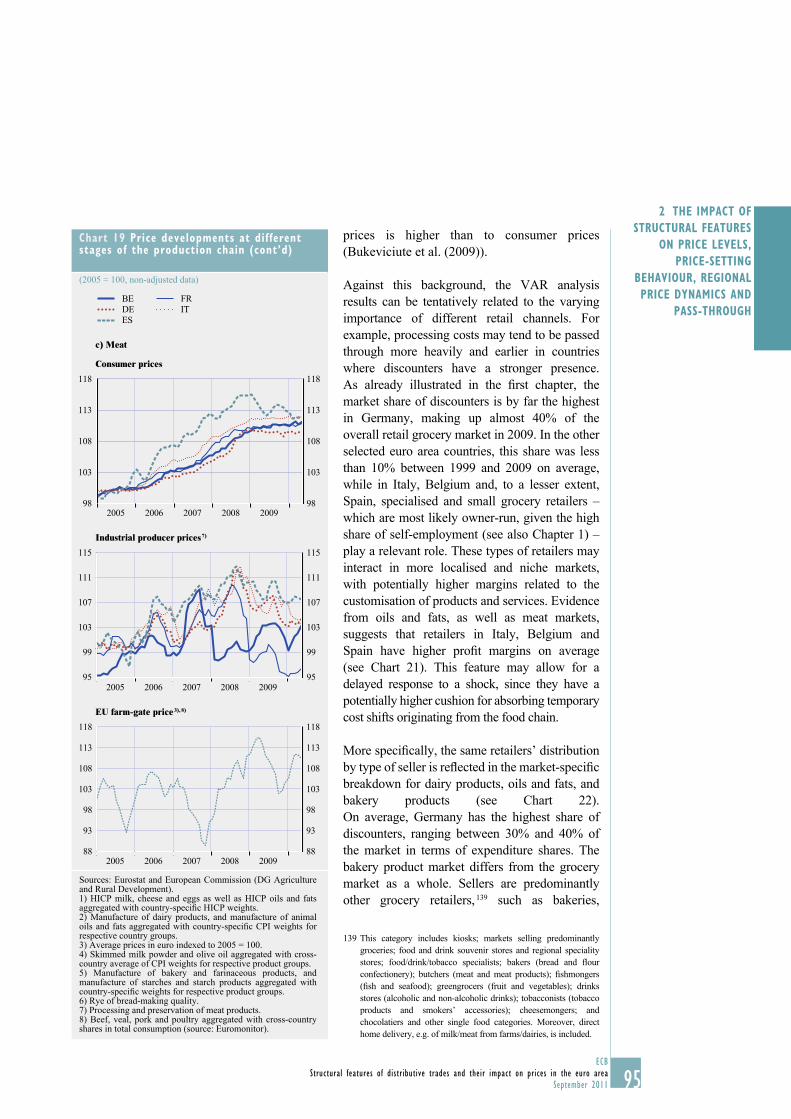
95ECB
Structural features of distributive trades and their impact on prices in the euro area
September 2011
2 THE IMPACT OF
STRUCTURAL FEATURES
ON PRICE LEVELS,
PRICE-SETTING
BEHAVIOUR, REGIONAL
PRICE DYNAMICS AND
PASS-THROUGH
prices is higher than to consumer prices
(Bukeviciute et al. (2009)).
Against this background, the VAR analysis
results can be tentatively related to the varying
importance of different retail channels. For
example, processing costs may tend to be passed
through more heavily and earlier in countries
where discounters have a stronger presence.
As already illustrated in the fi rst chapter, the
market share of discounters is by far the highest
in Germany, making up almost 40% of the
overall retail grocery market in 2009. In the other
selected euro area countries, this share was less
than 10% between 1999 and 2009 on average,
while in Italy, Belgium and, to a lesser extent,
Spain, specialised and small grocery retailers –
which are most likely owner-run, given the high
share of self-employment (see also Chapter 1) –
play a relevant role. These types of retailers may
interact in more localised and niche markets,
with potentially higher margins related to the
customisation of products and services. Evidence
from oils and fats, as well as meat markets,
suggests that retailers in Italy, Belgium and
Spain have higher profi t margins on average
(see Chart 21). This feature may allow for a
delayed response to a shock, since they have a
potentially higher cushion for absorbing temporary
cost shifts originating from the food chain.
More specifi cally, the same retailers’ distribution
by type of seller is refl ected in the market-specifi c
breakdown for dairy products, oils and fats, and
bakery products (see Chart 22).
On average, Germany has the highest share of
discounters, ranging between 30% and 40% of
the market in terms of expenditure shares. The
bakery product market differs from the grocery
market as a whole. Sellers are predominantly
other grocery retailers, 139 such as bakeries,
This category includes kiosks; markets selling predominantly 139
groceries; food and drink souvenir stores and regional speciality
stores; food/drink/tobacco specialists; bakers (bread and fl our
confectionery); butchers (meat and meat products); fi shmongers
(fi sh and seafood); greengrocers (fruit and vegetables); drinks
stores (alcoholic and non-alcoholic drinks); tobacconists (tobacco
products and smokers’ accessories); cheesemongers; and
chocolatiers and other single food categories. Moreover, direct
home delivery, e.g. of milk/meat from farms/dairies, is included.
Chart 19 Price developments at different stages of the production chain (cont’d)
(2005 = 100, non-adjusted data)
BE
DE
ES
IT
FR
c) Meat
Consumer prices
98
103
108
113
118
98
103
108
113
118
2005 2006 2007 2008 2009
Industrial producer prices 7)
95
99
103
107
111
115
95
99
103
107
111
115
2005 2006 2007 2008 2009
EU farm-gate price 3), 8)
88
93
98
103
108
113
118
88
93
98
103
108
113
118
2005 2006 2007 2008 2009
Sources: Eurostat and European Commission (DG Agriculture and Rural Development).1) HICP milk, cheese and eggs as well as HICP oils and fats aggregated with country-specifi c HICP weights. 2) Manufacture of dairy products, and manufacture of animal oils and fats aggregated with country-specifi c CPI weights for respective country groups. 3) Average prices in euro indexed to 2005 = 100. 4) Skimmed milk powder and olive oil aggregated with cross-country average of CPI weights for respective product groups. 5) Manufacture of bakery and farinaceous products, and manufacture of starches and starch products aggregated with country-specifi c weights for respective product groups. 6) Rye of bread-making quality. 7) Processing and preservation of meat products. 8) Beef, veal, pork and poultry aggregated with cross-country shares in total consumption (source: Euromonitor).
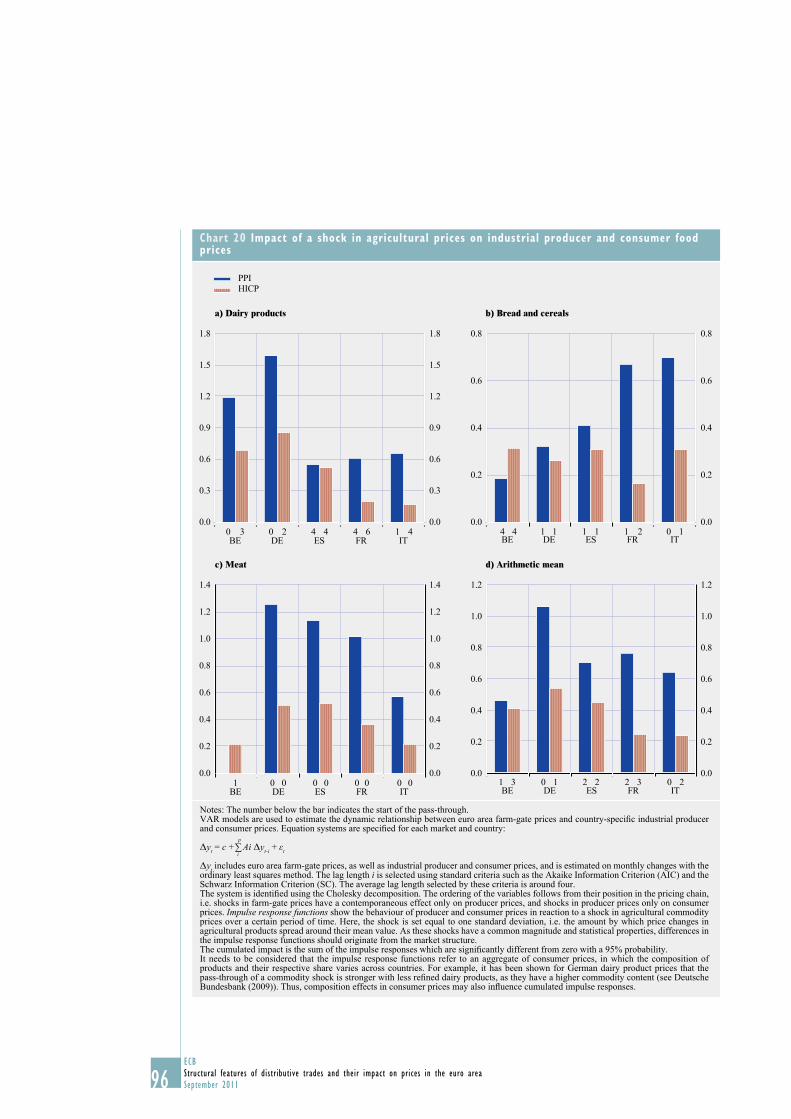
96ECB
Structural features of distributive trades and their impact on prices in the euro area
September 2011
Chart 20 Impact of a shock in agricultural prices on industrial producer and consumer food prices
PPIHICP
a) Dairy products b) Bread and cereals
0.0
0.3
0.6
0.9
1.2
1.5
1.8
0.0
0.3
0.6
0.9
1.2
1.5
1.8
0 3 0 2 4 4 4 6 1 4BE DE ES FR IT
1 14 1 1 0 1214BE DE ES FR IT
0.0
0.2
0.4
0.6
0.8
0.0
0.2
0.4
0.6
0.8
c) Meat d) Arithmetic mean
1 0 00 00 00 00.0
0.2
0.4
0.6
0.8
1.0
1.2
1.4
0.0
0.2
0.4
0.6
0.8
1.0
1.2
1.4
BE DE ES FR IT0221 03 1 2 3 2
0.0
0.2
0.4
0.6
0.8
1.0
1.2
0.0
0.2
0.4
0.6
0.8
1.0
1.2
BE DE ES FR IT
Notes: The number below the bar indicates the start of the pass-through.VAR models are used to estimate the dynamic relationship between euro area farm-gate prices and country-specifi c industrial producer and consumer prices. Equation systems are specifi ed for each market and country:
Δyt = c + i∑
p Ai Δyt-i + εt
Δyt includes euro area farm-gate prices, as well as industrial producer and consumer prices, and is estimated on monthly changes with the ordinary least squares method. The lag length i is selected using standard criteria such as the Akaike Information Criterion (AIC) and the Schwarz Information Criterion (SC). The average lag length selected by these criteria is around four.The system is identifi ed using the Cholesky decomposition. The ordering of the variables follows from their position in the pricing chain, i.e. shocks in farm-gate prices have a contemporaneous effect only on producer prices, and shocks in producer prices only on consumer prices. Impulse response functions show the behaviour of producer and consumer prices in reaction to a shock in agricultural commodity prices over a certain period of time. Here, the shock is set equal to one standard deviation, i.e. the amount by which price changes in agricultural products spread around their mean value. As these shocks have a common magnitude and statistical properties, differences in the impulse response functions should originate from the market structure.The cumulated impact is the sum of the impulse responses which are signifi cantly different from zero with a 95% probability.It needs to be considered that the impulse response functions refer to an aggregate of consumer prices, in which the composition of products and their respective share varies across countries. For example, it has been shown for German dairy product prices that the pass-through of a commodity shock is stronger with less refi ned dairy products, as they have a higher commodity content (see Deutsche Bundesbank (2009)). Thus, composition effects in consumer prices may also infl uence cumulated impulse responses.
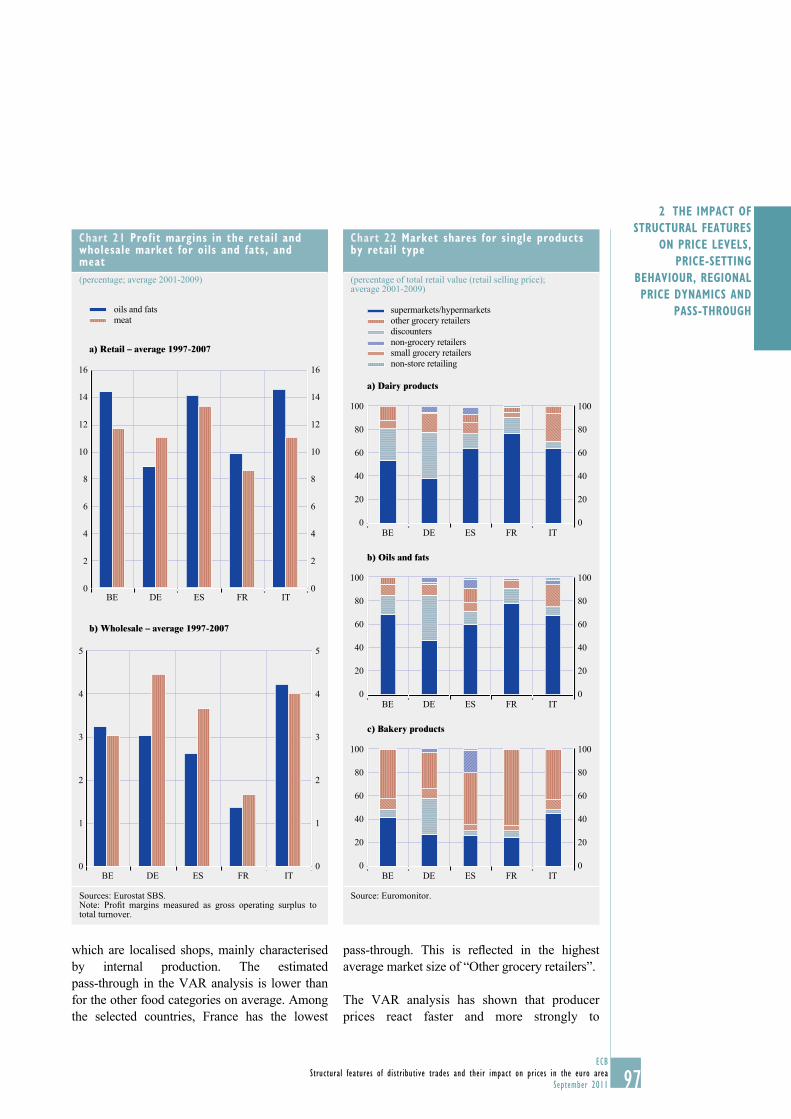
97ECB
Structural features of distributive trades and their impact on prices in the euro area
September 2011
2 THE IMPACT OF
STRUCTURAL FEATURES
ON PRICE LEVELS,
PRICE-SETTING
BEHAVIOUR, REGIONAL
PRICE DYNAMICS AND
PASS-THROUGH
which are localised shops, mainly characterised
by internal production. The estimated
pass-through in the VAR analysis is lower than
for the other food categories on average. Among
the selected countries, France has the lowest
pass-through. This is refl ected in the highest
average market size of “Other grocery retailers”.
The VAR analysis has shown that producer
prices react faster and more strongly to
Chart 22 Market shares for single products by retail type
(percentage of total retail value (retail selling price); average 2001-2009)
supermarkets/hypermarkets
discounters
small grocery retailers
other grocery retailers
non-grocery retailers
non-store retailing
a) Dairy products
0
20
40
60
80
100
0
20
40
60
80
100
BE DE ES FR IT
b) Oils and fats
0
20
40
60
80
100
0
20
40
60
80
100
BE DE ES FR IT
c) Bakery products
0
20
40
60
80
100
0
20
40
60
80
100
BE DE ES FR IT
Source: Euromonitor.
Chart 21 Profit margins in the retail and wholesale market for oils and fats, and meat
(percentage; average 2001-2009)
oils and fats
meat
a) Retail – average 1997-2007
0
2
4
6
8
10
12
14
16
0
2
4
6
8
10
12
14
16
BE DE ES FR IT
b) Wholesale – average 1997-2007
0
1
2
3
4
5
0
1
2
3
4
5
BE DE ES FR IT
Sources: Eurostat SBS.Note: Profi t margins measured as gross operating surplus to total turnover.
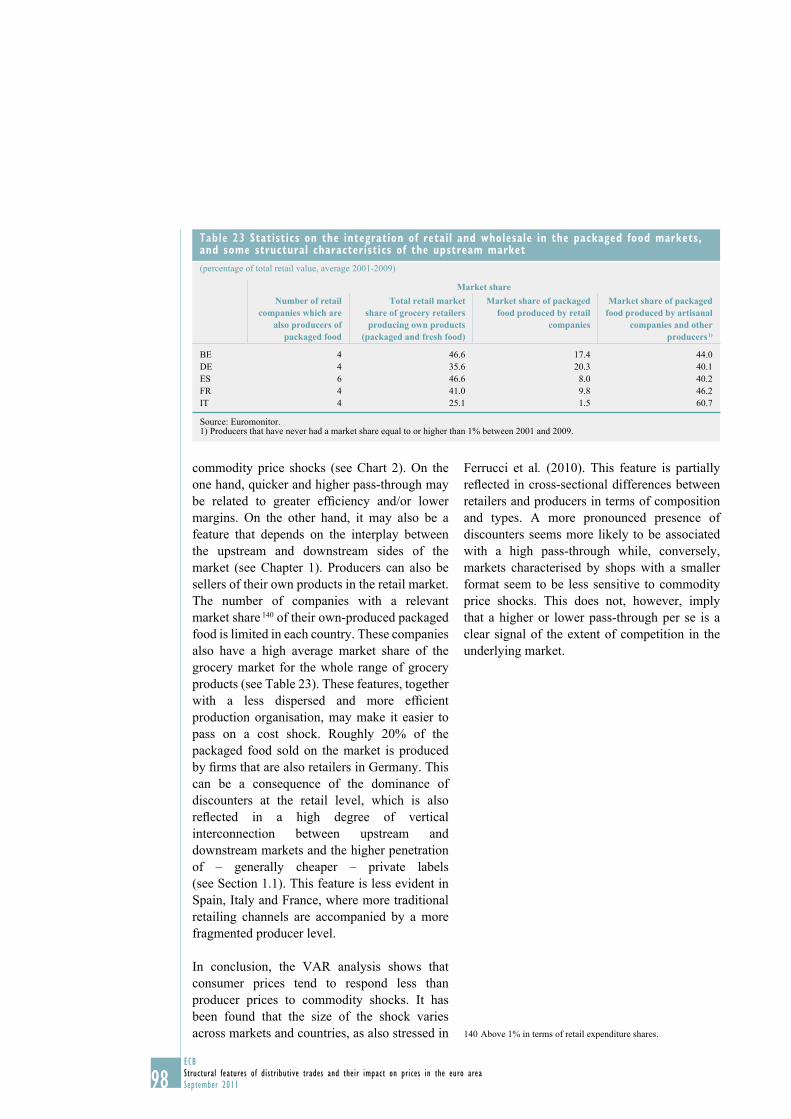
98ECB
Structural features of distributive trades and their impact on prices in the euro area
September 2011
commodity price shocks (see Chart 2). On the
one hand, quicker and higher pass-through may
be related to greater effi ciency and/or lower
margins. On the other hand, it may also be a
feature that depends on the interplay between
the upstream and downstream sides of the
market (see Chapter 1). Producers can also be
sellers of their own products in the retail market.
The number of companies with a relevant
market share 140 of their own-produced packaged
food is limited in each country. These companies
also have a high average market share of the
grocery market for the whole range of grocery
products (see Table 23). These features, together
with a less dispersed and more effi cient
production organisation, may make it easier to
pass on a cost shock. Roughly 20% of the
packaged food sold on the market is produced
by fi rms that are also retailers in Germany. This
can be a consequence of the dominance of
discounters at the retail level, which is also
refl ected in a high degree of vertical
interconnection between upstream and
downstream markets and the higher penetration
of – generally cheaper – private labels
(see Section 1.1). This feature is less evident in
Spain, Italy and France, where more traditional
retailing channels are accompanied by a more
fragmented producer level.
In conclusion, the VAR analysis shows that
consumer prices tend to respond less than
producer prices to commodity shocks. It has
been found that the size of the shock varies
across markets and countries, as also stressed in
Ferrucci et al. (2010). This feature is partially
refl ected in cross-sectional differences between
retailers and producers in terms of composition
and types. A more pronounced presence of
discounters seems more likely to be associated
with a high pass-through while, conversely,
markets characterised by shops with a smaller
format seem to be less sensitive to commodity
price shocks. This does not, however, imply
that a higher or lower pass-through per se is a
clear signal of the extent of competition in the
underlying market.
Above 1% in terms of retail expenditure shares.140
Table 23 Statistics on the integration of retail and wholesale in the packaged food markets, and some structural characteristics of the upstream market
(percentage of total retail value, average 2001-2009)
Market shareNumber of retail
companies which are also producers of
packaged food
Total retail market share of grocery retailers producing own products
(packaged and fresh food)
Market share of packaged food produced by retail
companies
Market share of packaged food produced by artisanal
companies and other producers 1)
BE 4 46.6 17.4 44.0
DE 4 35.6 20.3 40.1
ES 6 46.6 8.0 40.2
FR 4 41.0 9.8 46.2
IT 4 25.1 1.5 60.7
Source: Euromonitor.1) Producers that have never had a market share equal to or higher than 1% between 2001 and 2009.
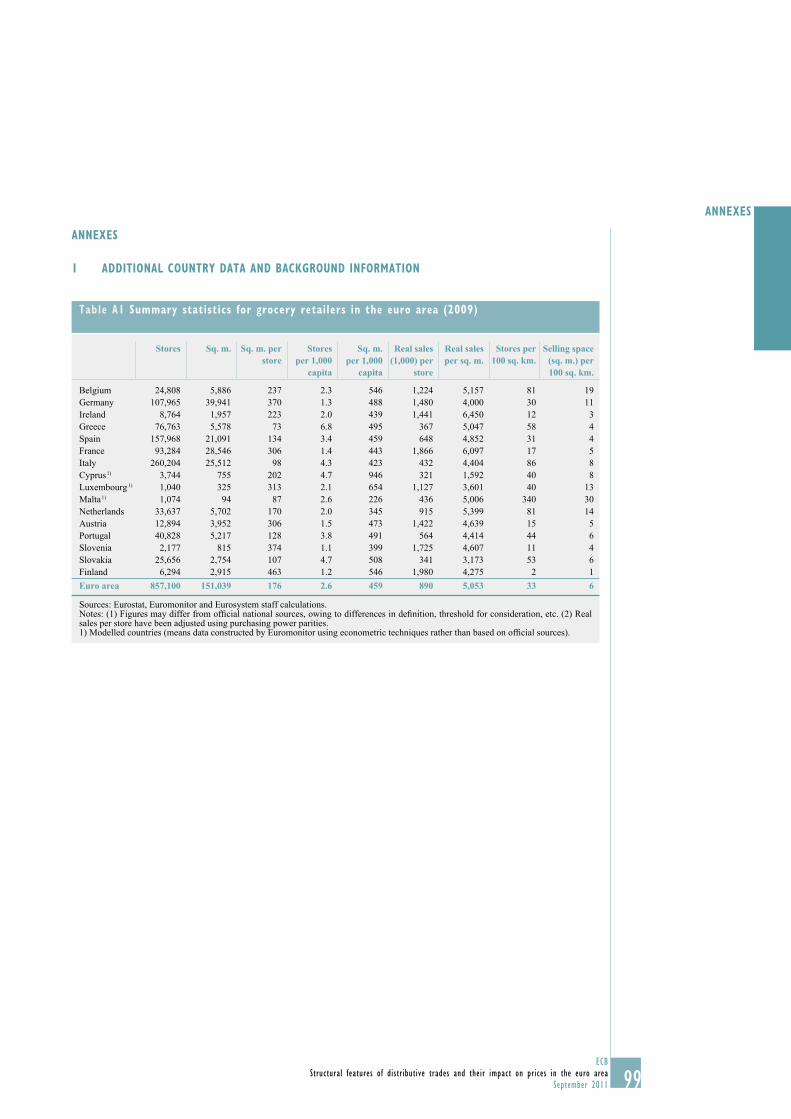
99ECB
Structural features of distributive trades and their impact on prices in the euro area
September 2011
ANNEXES
ANNEXES
1 ADDITIONAL COUNTRY DATA AND BACKGROUND INFORMATION
Table A1 Summary statistics for grocery retailers in the euro area (2009)
Stores Sq. m. Sq. m. per store
Stores per 1,000
capita
Sq. m. per 1,000
capita
Real sales (1,000) per
store
Real sales per sq. m.
Stores per 100 sq. km.
Selling space (sq. m.) per 100 sq. km.
Belgium 24,808 5,886 237 2.3 546 1,224 5,157 81 19
Germany 107,965 39,941 370 1.3 488 1,480 4,000 30 11
Ireland 8,764 1,957 223 2.0 439 1,441 6,450 12 3
Greece 76,763 5,578 73 6.8 495 367 5,047 58 4
Spain 157,968 21,091 134 3.4 459 648 4,852 31 4
France 93,284 28,546 306 1.4 443 1,866 6,097 17 5
Italy 260,204 25,512 98 4.3 423 432 4,404 86 8
Cyprus 1) 3,744 755 202 4.7 946 321 1,592 40 8
Luxembourg 1) 1,040 325 313 2.1 654 1,127 3,601 40 13
Malta 1) 1,074 94 87 2.6 226 436 5,006 340 30
Netherlands 33,637 5,702 170 2.0 345 915 5,399 81 14
Austria 12,894 3,952 306 1.5 473 1,422 4,639 15 5
Portugal 40,828 5,217 128 3.8 491 564 4,414 44 6
Slovenia 2,177 815 374 1.1 399 1,725 4,607 11 4
Slovakia 25,656 2,754 107 4.7 508 341 3,173 53 6
Finland 6,294 2,915 463 1.2 546 1,980 4,275 2 1
Euro area 857,100 151,039 176 2.6 459 890 5,053 33 6
Sources: Eurostat, Euromonitor and Eurosystem staff calculations.Notes: (1) Figures may differ from offi cial national sources, owing to differences in defi nition, threshold for consideration, etc. (2) Real sales per store have been adjusted using purchasing power parities.1) Modelled countries (means data constructed by Euromonitor using econometric techniques rather than based on offi cial sources).
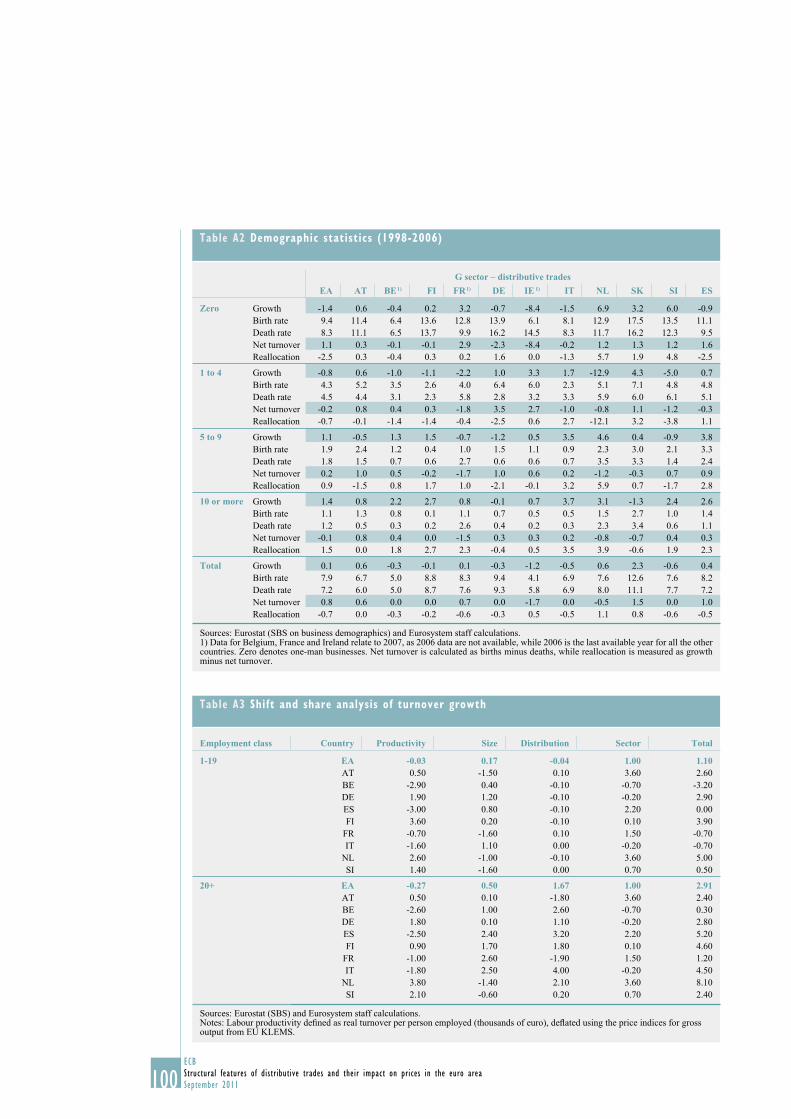
100ECB
Structural features of distributive trades and their impact on prices in the euro area
September 2011
Table A3 Shift and share analysis of turnover growth
Employment class Country Productivity Size Distribution Sector Total
1-19 EA -0.03 0.17 -0.04 1.00 1.10AT 0.50 -1.50 0.10 3.60 2.60
BE -2.90 0.40 -0.10 -0.70 -3.20
DE 1.90 1.20 -0.10 -0.20 2.90
ES -3.00 0.80 -0.10 2.20 0.00
FI 3.60 0.20 -0.10 0.10 3.90
FR -0.70 -1.60 0.10 1.50 -0.70
IT -1.60 1.10 0.00 -0.20 -0.70
NL 2.60 -1.00 -0.10 3.60 5.00
SI 1.40 -1.60 0.00 0.70 0.50
20+ EA -0.27 0.50 1.67 1.00 2.91AT 0.50 0.10 -1.80 3.60 2.40
BE -2.60 1.00 2.60 -0.70 0.30
DE 1.80 0.10 1.10 -0.20 2.80
ES -2.50 2.40 3.20 2.20 5.20
FI 0.90 1.70 1.80 0.10 4.60
FR -1.00 2.60 -1.90 1.50 1.20
IT -1.80 2.50 4.00 -0.20 4.50
NL 3.80 -1.40 2.10 3.60 8.10
SI 2.10 -0.60 0.20 0.70 2.40
Sources: Eurostat (SBS) and Eurosystem staff calculations.Notes: Labour productivity defi ned as real turnover per person employed (thousands of euro), defl ated using the price indices for gross output from EU KLEMS.
Table A2 Demographic statistics (1998-2006)
G sector – distributive tradesEA AT BE 1) FI FR 1) DE IE 1) IT NL SK SI ES
Zero Growth -1.4 0.6 -0.4 0.2 3.2 -0.7 -8.4 -1.5 6.9 3.2 6.0 -0.9
Birth rate 9.4 11.4 6.4 13.6 12.8 13.9 6.1 8.1 12.9 17.5 13.5 11.1
Death rate 8.3 11.1 6.5 13.7 9.9 16.2 14.5 8.3 11.7 16.2 12.3 9.5
Net turnover 1.1 0.3 -0.1 -0.1 2.9 -2.3 -8.4 -0.2 1.2 1.3 1.2 1.6
Reallocation -2.5 0.3 -0.4 0.3 0.2 1.6 0.0 -1.3 5.7 1.9 4.8 -2.5
1 to 4 Growth -0.8 0.6 -1.0 -1.1 -2.2 1.0 3.3 1.7 -12.9 4.3 -5.0 0.7
Birth rate 4.3 5.2 3.5 2.6 4.0 6.4 6.0 2.3 5.1 7.1 4.8 4.8
Death rate 4.5 4.4 3.1 2.3 5.8 2.8 3.2 3.3 5.9 6.0 6.1 5.1
Net turnover -0.2 0.8 0.4 0.3 -1.8 3.5 2.7 -1.0 -0.8 1.1 -1.2 -0.3
Reallocation -0.7 -0.1 -1.4 -1.4 -0.4 -2.5 0.6 2.7 -12.1 3.2 -3.8 1.1
5 to 9 Growth 1.1 -0.5 1.3 1.5 -0.7 -1.2 0.5 3.5 4.6 0.4 -0.9 3.8
Birth rate 1.9 2.4 1.2 0.4 1.0 1.5 1.1 0.9 2.3 3.0 2.1 3.3
Death rate 1.8 1.5 0.7 0.6 2.7 0.6 0.6 0.7 3.5 3.3 1.4 2.4
Net turnover 0.2 1.0 0.5 -0.2 -1.7 1.0 0.6 0.2 -1.2 -0.3 0.7 0.9
Reallocation 0.9 -1.5 0.8 1.7 1.0 -2.1 -0.1 3.2 5.9 0.7 -1.7 2.8
10 or more Growth 1.4 0.8 2.2 2.7 0.8 -0.1 0.7 3.7 3.1 -1.3 2.4 2.6
Birth rate 1.1 1.3 0.8 0.1 1.1 0.7 0.5 0.5 1.5 2.7 1.0 1.4
Death rate 1.2 0.5 0.3 0.2 2.6 0.4 0.2 0.3 2.3 3.4 0.6 1.1
Net turnover -0.1 0.8 0.4 0.0 -1.5 0.3 0.3 0.2 -0.8 -0.7 0.4 0.3
Reallocation 1.5 0.0 1.8 2.7 2.3 -0.4 0.5 3.5 3.9 -0.6 1.9 2.3
Total Growth 0.1 0.6 -0.3 -0.1 0.1 -0.3 -1.2 -0.5 0.6 2.3 -0.6 0.4
Birth rate 7.9 6.7 5.0 8.8 8.3 9.4 4.1 6.9 7.6 12.6 7.6 8.2
Death rate 7.2 6.0 5.0 8.7 7.6 9.3 5.8 6.9 8.0 11.1 7.7 7.2
Net turnover 0.8 0.6 0.0 0.0 0.7 0.0 -1.7 0.0 -0.5 1.5 0.0 1.0
Reallocation -0.7 0.0 -0.3 -0.2 -0.6 -0.3 0.5 -0.5 1.1 0.8 -0.6 -0.5
Sources: Eurostat (SBS on business demographics) and Eurosystem staff calculations.1) Data for Belgium, France and Ireland relate to 2007, as 2006 data are not available, while 2006 is the last available year for all the other countries. Zero denotes one-man businesses. Net turnover is calculated as births minus deaths, while reallocation is measured as growth minus net turnover.
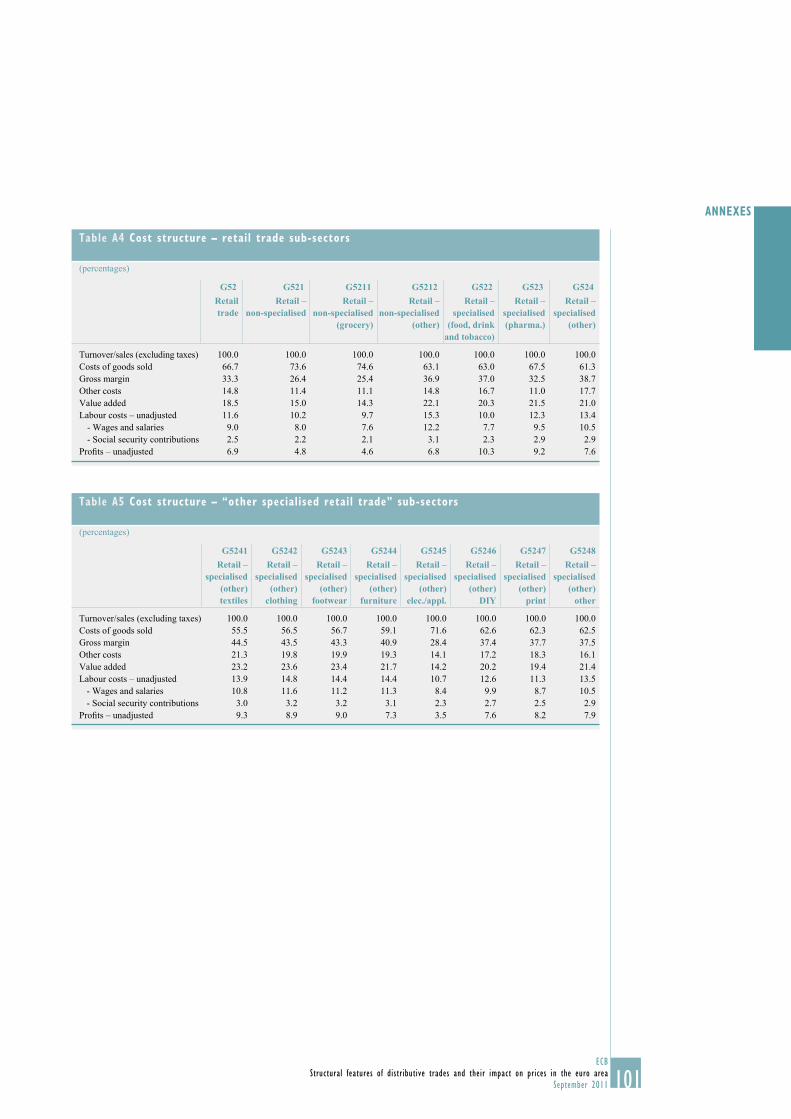
101ECB
Structural features of distributive trades and their impact on prices in the euro area
September 2011
ANNEXES
Table A5 Cost structure – “other specialised retail trade” sub-sectors
(percentages)
G5241 G5242 G5243 G5244 G5245 G5246 G5247 G5248Retail –
specialised (other) textiles
Retail – specialised
(other) clothing
Retail – specialised
(other) footwear
Retail – specialised
(other) furniture
Retail – specialised
(other) elec./appl.
Retail – specialised
(other) DIY
Retail – specialised
(other) print
Retail – specialised
(other) other
Turnover/sales (excluding taxes) 100.0 100.0 100.0 100.0 100.0 100.0 100.0 100.0
Costs of goods sold 55.5 56.5 56.7 59.1 71.6 62.6 62.3 62.5
Gross margin 44.5 43.5 43.3 40.9 28.4 37.4 37.7 37.5
Other costs 21.3 19.8 19.9 19.3 14.1 17.2 18.3 16.1
Value added 23.2 23.6 23.4 21.7 14.2 20.2 19.4 21.4
Labour costs – unadjusted 13.9 14.8 14.4 14.4 10.7 12.6 11.3 13.5
- Wages and salaries 10.8 11.6 11.2 11.3 8.4 9.9 8.7 10.5
- Social security contributions 3.0 3.2 3.2 3.1 2.3 2.7 2.5 2.9
Profi ts – unadjusted 9.3 8.9 9.0 7.3 3.5 7.6 8.2 7.9
Table A4 Cost structure – retail trade sub-sectors
(percentages)
G52 G521 G5211 G5212 G522 G523 G524Retail trade
Retail – non-specialised
Retail – non-specialised
(grocery)
Retail – non-specialised
(other)
Retail – specialised
(food, drink and tobacco)
Retail – specialised (pharma.)
Retail – specialised
(other)
Turnover/sales (excluding taxes) 100.0 100.0 100.0 100.0 100.0 100.0 100.0
Costs of goods sold 66.7 73.6 74.6 63.1 63.0 67.5 61.3
Gross margin 33.3 26.4 25.4 36.9 37.0 32.5 38.7
Other costs 14.8 11.4 11.1 14.8 16.7 11.0 17.7
Value added 18.5 15.0 14.3 22.1 20.3 21.5 21.0
Labour costs – unadjusted 11.6 10.2 9.7 15.3 10.0 12.3 13.4
- Wages and salaries 9.0 8.0 7.6 12.2 7.7 9.5 10.5
- Social security contributions 2.5 2.2 2.1 3.1 2.3 2.9 2.9
Profi ts – unadjusted 6.9 4.8 4.6 6.8 10.3 9.2 7.6
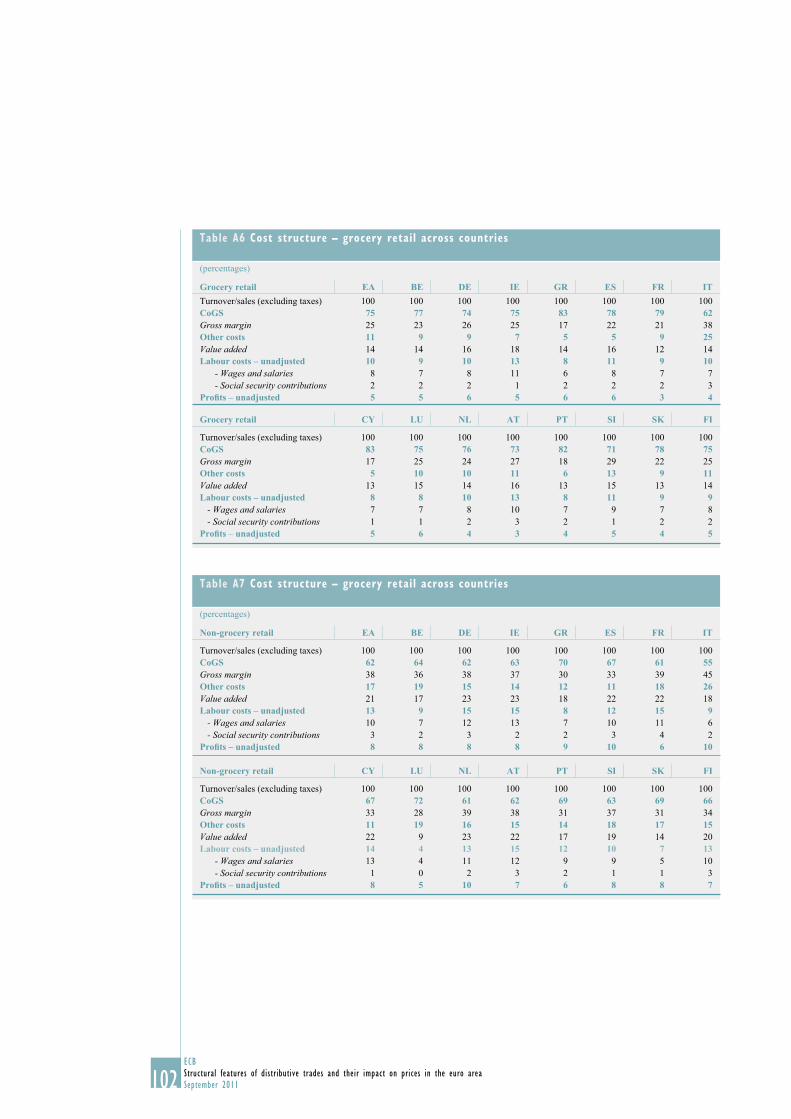
102ECB
Structural features of distributive trades and their impact on prices in the euro area
September 2011
Table A7 Cost structure – grocery retail across countries
(percentages)
Non-grocery retail EA BE DE IE GR ES FR IT
Turnover/sales (excluding taxes) 100 100 100 100 100 100 100 100
CoGS 62 64 62 63 70 67 61 55Gross margin 38 36 38 37 30 33 39 45
Other costs 17 19 15 14 12 11 18 26Value added 21 17 23 23 18 22 22 18
Labour costs – unadjusted 13 9 15 15 8 12 15 9- Wages and salaries 10 7 12 13 7 10 11 6
- Social security contributions 3 2 3 2 2 3 4 2
Profi ts – unadjusted 8 8 8 8 9 10 6 10
Non-grocery retail CY LU NL AT PT SI SK FI
Turnover/sales (excluding taxes) 100 100 100 100 100 100 100 100
CoGS 67 72 61 62 69 63 69 66Gross margin 33 28 39 38 31 37 31 34
Other costs 11 19 16 15 14 18 17 15Value added 22 9 23 22 17 19 14 20
Labour costs – unadjusted 14 4 13 15 12 10 7 13- Wages and salaries 13 4 11 12 9 9 5 10
- Social security contributions 1 0 2 3 2 1 1 3
Profi ts – unadjusted 8 5 10 7 6 8 8 7
Table A6 Cost structure – grocery retail across countries
(percentages)
Grocery retail EA BE DE IE GR ES FR ITTurnover/sales (excluding taxes) 100 100 100 100 100 100 100 100
CoGS 75 77 74 75 83 78 79 62Gross margin 25 23 26 25 17 22 21 38
Other costs 11 9 9 7 5 5 9 25Value added 14 14 16 18 14 16 12 14
Labour costs – unadjusted 10 9 10 13 8 11 9 10- Wages and salaries 8 7 8 11 6 8 7 7
- Social security contributions 2 2 2 1 2 2 2 3
Profi ts – unadjusted 5 5 6 5 6 6 3 4
Grocery retail CY LU NL AT PT SI SK FI
Turnover/sales (excluding taxes) 100 100 100 100 100 100 100 100
CoGS 83 75 76 73 82 71 78 75Gross margin 17 25 24 27 18 29 22 25
Other costs 5 10 10 11 6 13 9 11Value added 13 15 14 16 13 15 13 14
Labour costs – unadjusted 8 8 10 13 8 11 9 9- Wages and salaries 7 7 8 10 7 9 7 8
- Social security contributions 1 1 2 3 2 1 2 2
Profi ts – unadjusted 5 6 4 3 4 5 4 5
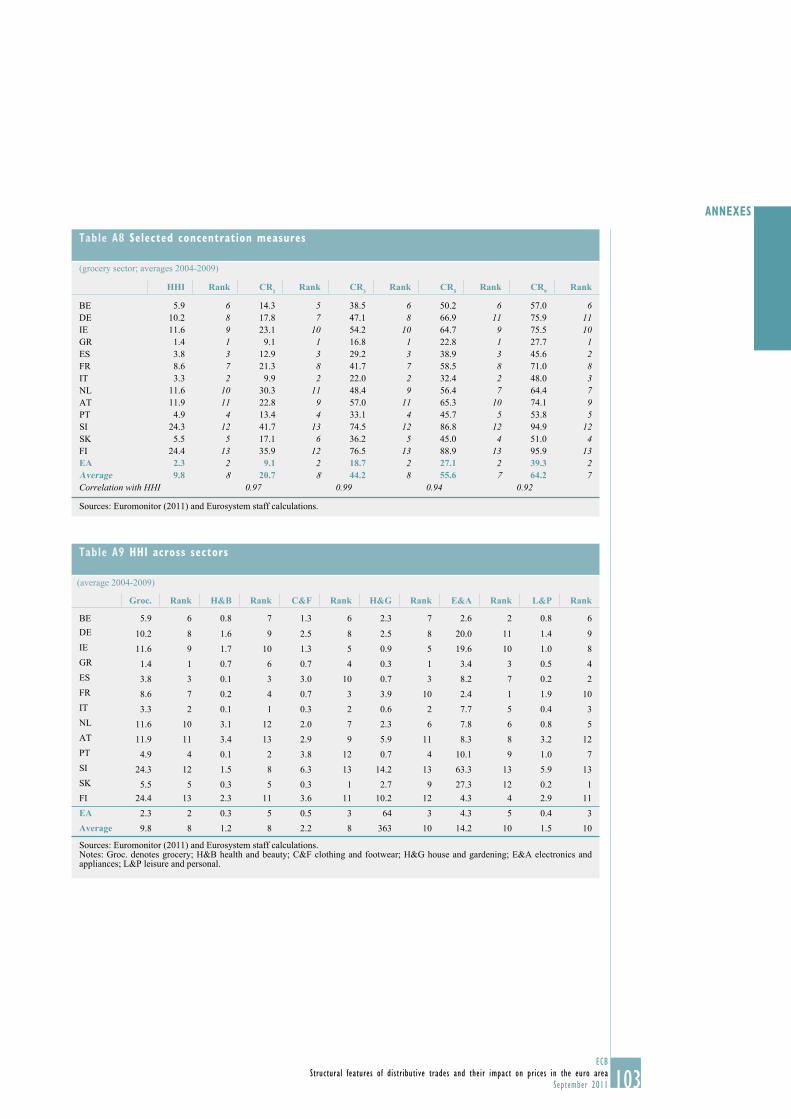
103ECB
Structural features of distributive trades and their impact on prices in the euro area
September 2011
ANNEXES
Table A9 HHI across sectors
(average 2004-2009)
Groc. Rank H&B Rank C&F Rank H&G Rank E&A Rank L&P Rank
BE 5.9 6 0.8 7 1.3 6 2.3 7 2.6 2 0.8 6
DE 10.2 8 1.6 9 2.5 8 2.5 8 20.0 11 1.4 9
IE 11.6 9 1.7 10 1.3 5 0.9 5 19.6 10 1.0 8
GR 1.4 1 0.7 6 0.7 4 0.3 1 3.4 3 0.5 4
ES 3.8 3 0.1 3 3.0 10 0.7 3 8.2 7 0.2 2
FR 8.6 7 0.2 4 0.7 3 3.9 10 2.4 1 1.9 10
IT 3.3 2 0.1 1 0.3 2 0.6 2 7.7 5 0.4 3
NL 11.6 10 3.1 12 2.0 7 2.3 6 7.8 6 0.8 5
AT 11.9 11 3.4 13 2.9 9 5.9 11 8.3 8 3.2 12
PT 4.9 4 0.1 2 3.8 12 0.7 4 10.1 9 1.0 7
SI 24.3 12 1.5 8 6.3 13 14.2 13 63.3 13 5.9 13
SK 5.5 5 0.3 5 0.3 1 2.7 9 27.3 12 0.2 1
FI 24.4 13 2.3 11 3.6 11 10.2 12 4.3 4 2.9 11
EA 2.3 2 0.3 5 0.5 3 64 3 4.3 5 0.4 3
Average 9.8 8 1.2 8 2.2 8 363 10 14.2 10 1.5 10
Sources: Euromonitor (2011) and Eurosystem staff calculations.Notes: Groc. denotes grocery; H&B health and beauty; C&F clothing and footwear; H&G house and gardening; E&A electronics and appliances; L&P leisure and personal.
Table A8 Selected concentration measures
(grocery sector; averages 2004-2009)
HHI Rank CR1 Rank CR3 Rank CR5 Rank CR9 Rank
BE 5.9 6 14.3 5 38.5 6 50.2 6 57.0 6DE 10.2 8 17.8 7 47.1 8 66.9 11 75.9 11IE 11.6 9 23.1 10 54.2 10 64.7 9 75.5 10GR 1.4 1 9.1 1 16.8 1 22.8 1 27.7 1ES 3.8 3 12.9 3 29.2 3 38.9 3 45.6 2FR 8.6 7 21.3 8 41.7 7 58.5 8 71.0 8IT 3.3 2 9.9 2 22.0 2 32.4 2 48.0 3NL 11.6 10 30.3 11 48.4 9 56.4 7 64.4 7AT 11.9 11 22.8 9 57.0 11 65.3 10 74.1 9PT 4.9 4 13.4 4 33.1 4 45.7 5 53.8 5SI 24.3 12 41.7 13 74.5 12 86.8 12 94.9 12SK 5.5 5 17.1 6 36.2 5 45.0 4 51.0 4FI 24.4 13 35.9 12 76.5 13 88.9 13 95.9 13EA 2.3 2 9.1 2 18.7 2 27.1 2 39.3 2Average 9.8 8 20.7 8 44.2 8 55.6 7 64.2 7Correlation with HHI 0.97 0.99 0.94 0.92
Sources: Euromonitor (2011) and Eurosystem staff calculations.
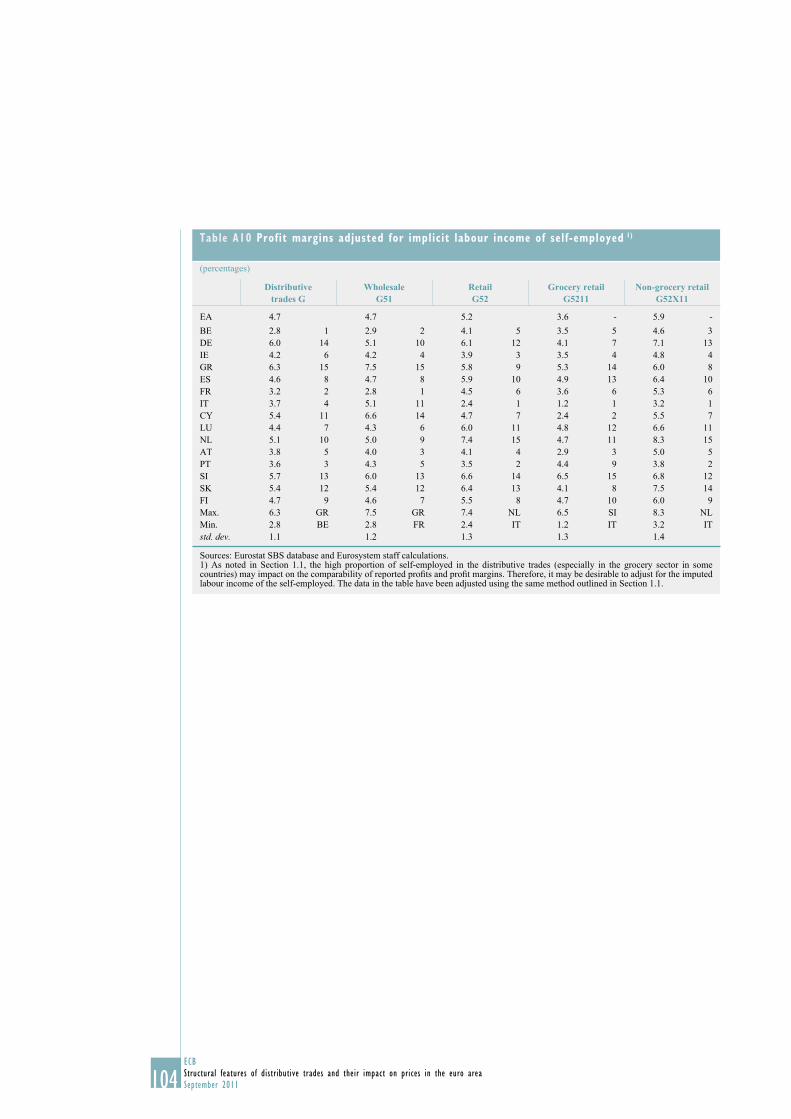
104ECB
Structural features of distributive trades and their impact on prices in the euro area
September 2011
Table A10 Profit margins adjusted for implicit labour income of self-employed 1)
(percentages)
Distributive trades G
WholesaleG51
RetailG52
Grocery retailG5211
Non-grocery retailG52X11
EA 4.7 4.7 5.2 3.6 - 5.9 -
BE 2.8 1 2.9 2 4.1 5 3.5 5 4.6 3
DE 6.0 14 5.1 10 6.1 12 4.1 7 7.1 13
IE 4.2 6 4.2 4 3.9 3 3.5 4 4.8 4
GR 6.3 15 7.5 15 5.8 9 5.3 14 6.0 8
ES 4.6 8 4.7 8 5.9 10 4.9 13 6.4 10
FR 3.2 2 2.8 1 4.5 6 3.6 6 5.3 6
IT 3.7 4 5.1 11 2.4 1 1.2 1 3.2 1
CY 5.4 11 6.6 14 4.7 7 2.4 2 5.5 7
LU 4.4 7 4.3 6 6.0 11 4.8 12 6.6 11
NL 5.1 10 5.0 9 7.4 15 4.7 11 8.3 15
AT 3.8 5 4.0 3 4.1 4 2.9 3 5.0 5
PT 3.6 3 4.3 5 3.5 2 4.4 9 3.8 2
SI 5.7 13 6.0 13 6.6 14 6.5 15 6.8 12
SK 5.4 12 5.4 12 6.4 13 4.1 8 7.5 14
FI 4.7 9 4.6 7 5.5 8 4.7 10 6.0 9
Max. 6.3 GR 7.5 GR 7.4 NL 6.5 SI 8.3 NL
Min. 2.8 BE 2.8 FR 2.4 IT 1.2 IT 3.2 IT
std. dev. 1.1 1.2 1.3 1.3 1.4
Sources: Eurostat SBS database and Eurosystem staff calculations.1) As noted in Section 1.1, the high proportion of self-employed in the distributive trades (especially in the grocery sector in some countries) may impact on the comparability of reported profi ts and profi t margins. Therefore, it may be desirable to adjust for the imputed labour income of the self-employed. The data in the table have been adjusted using the same method outlined in Section 1.1.
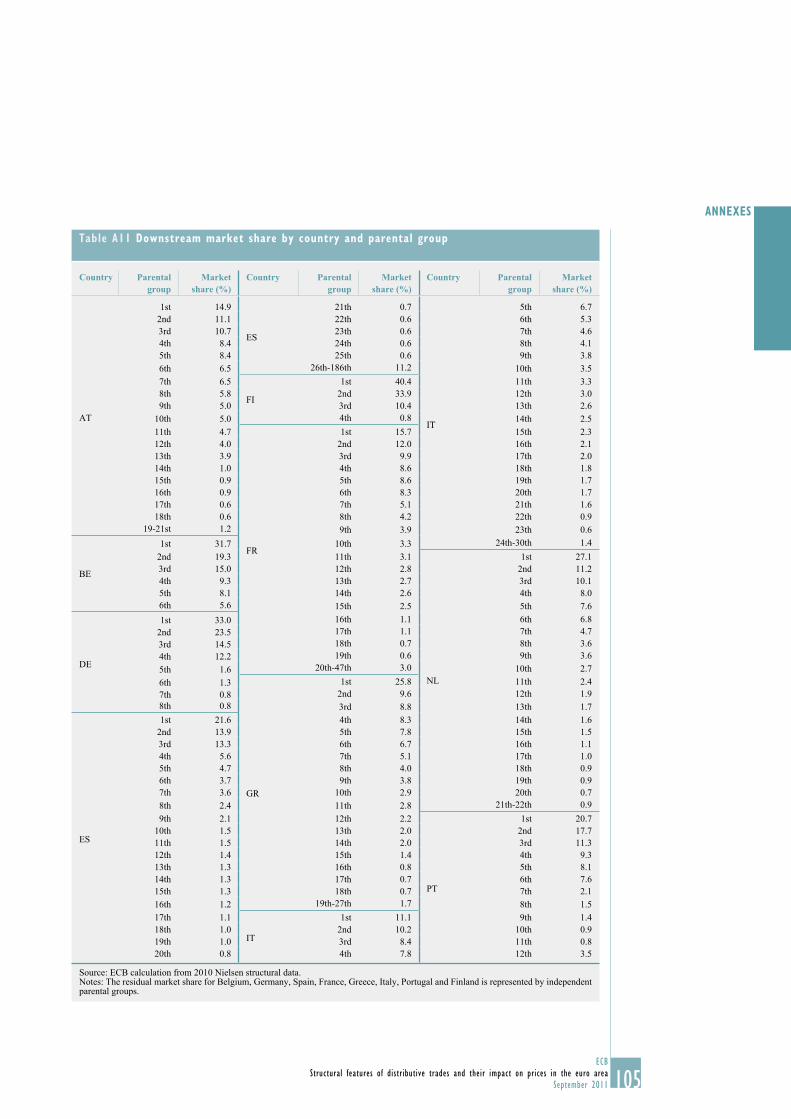
105ECB
Structural features of distributive trades and their impact on prices in the euro area
September 2011
ANNEXES
Table A11 Downstream market share by country and parental group
Country Parental group
Market share (%)
Country Parental group
Market share (%)
Country Parental group
Market share (%)
AT
1st 14.9
ES
21th 0.7
IT
5th 6.7
2nd 11.1 22th 0.6 6th 5.3
3rd 10.7 23th 0.6 7th 4.6
4th 8.4 24th 0.6 8th 4.1
5th 8.4 25th 0.6 9th 3.8
6th 6.5 26th-186th 11.2 10th 3.5
7th 6.5
FI
1st 40.4 11th 3.3
8th 5.8 2nd 33.9 12th 3.0
9th 5.0 3rd 10.4 13th 2.6
10th 5.0 4th 0.8 14th 2.5
11th 4.7
FR
1st 15.7 15th 2.3
12th 4.0 2nd 12.0 16th 2.1
13th 3.9 3rd 9.9 17th 2.0
14th 1.0 4th 8.6 18th 1.8
15th 0.9 5th 8.6 19th 1.7
16th 0.9 6th 8.3 20th 1.7
17th 0.6 7th 5.1 21th 1.6
18th 0.6 8th 4.2 22th 0.9
19-21st 1.2 9th 3.9 23th 0.6
BE
1st 31.7 10th 3.3 24th-30th 1.4
2nd 19.3 11th 3.1
NL
1st 27.1
3rd 15.0 12th 2.8 2nd 11.2
4th 9.3 13th 2.7 3rd 10.1
5th 8.1 14th 2.6 4th 8.0
6th 5.6 15th 2.5 5th 7.6
DE
1st 33.0 16th 1.1 6th 6.8
2nd 23.5 17th 1.1 7th 4.7
3rd 14.5 18th 0.7 8th 3.6
4th 12.2 19th 0.6 9th 3.6
5th 1.6 20th-47th 3.0 10th 2.7
6th 1.3
GR
1st 25.8 11th 2.4
7th 0.8 2nd 9.6 12th 1.9
8th 0.8 3rd 8.8 13th 1.7
ES
1st 21.6 4th 8.3 14th 1.6
2nd 13.9 5th 7.8 15th 1.5
3rd 13.3 6th 6.7 16th 1.1
4th 5.6 7th 5.1 17th 1.0
5th 4.7 8th 4.0 18th 0.9
6th 3.7 9th 3.8 19th 0.9
7th 3.6 10th 2.9 20th 0.7
8th 2.4 11th 2.8 21th-22th 0.9
9th 2.1 12th 2.2
PT
1st 20.7
10th 1.5 13th 2.0 2nd 17.7
11th 1.5 14th 2.0 3rd 11.3
12th 1.4 15th 1.4 4th 9.3
13th 1.3 16th 0.8 5th 8.1
14th 1.3 17th 0.7 6th 7.6
15th 1.3 18th 0.7 7th 2.1
16th 1.2 19th-27th 1.7 8th 1.5
17th 1.1
IT
1st 11.1 9th 1.4
18th 1.0 2nd 10.2 10th 0.9
19th 1.0 3rd 8.4 11th 0.8
20th 0.8 4th 7.8 12th 3.5
Source: ECB calculation from 2010 Nielsen structural data.Notes: The residual market share for Belgium, Germany, Spain, France, Greece, Italy, Portugal and Finland is represented by independent parental groups.
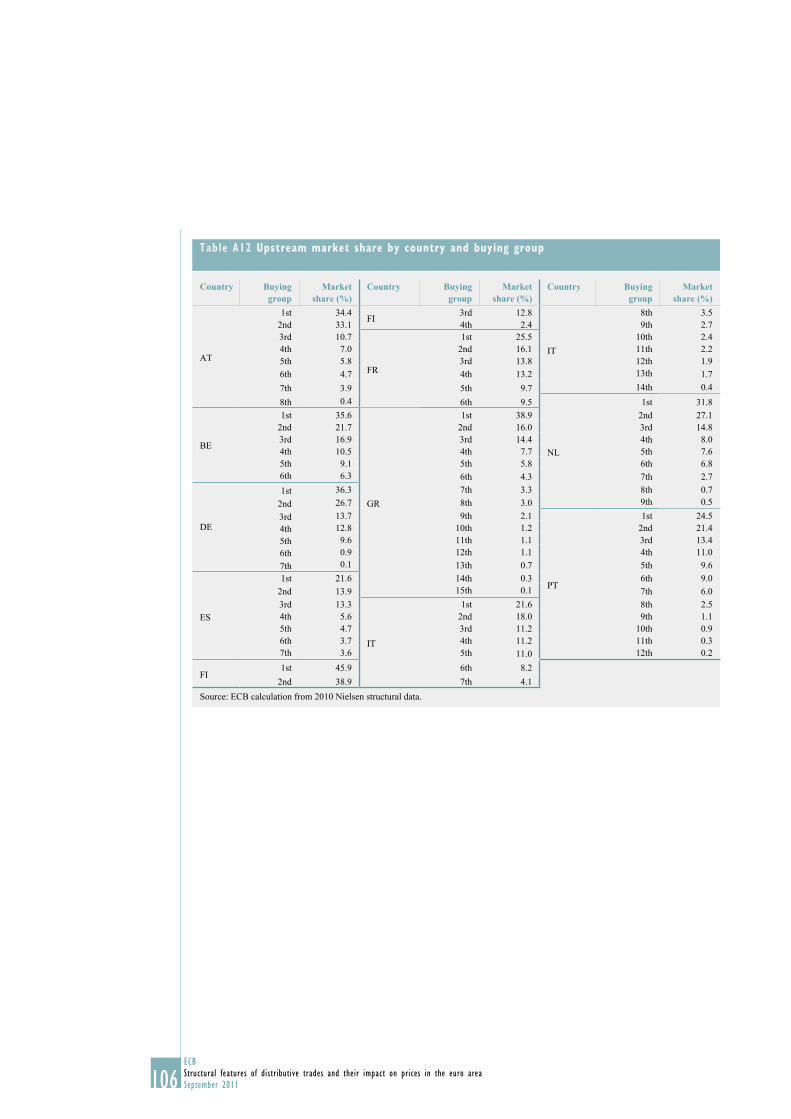
106ECB
Structural features of distributive trades and their impact on prices in the euro area
September 2011
Table A12 Upstream market share by country and buying group
Country Buying group
Market share (%)
Country Buying group
Market share (%)
Country Buying group
Market share (%)
AT
1st 34.4FI
3rd 12.8
IT
8th 3.5
2nd 33.1 4th 2.4 9th 2.7
3rd 10.7
FR
1st 25.5 10th 2.4
4th 7.0 2nd 16.1 11th 2.2
5th 5.8 3rd 13.8 12th 1.9
6th 4.7 4th 13.2 13th 1.7
7th 3.9 5th 9.7 14th 0.4
8th 0.4 6th 9.5
NL
1st 31.8
BE
1st 35.6
GR
1st 38.9 2nd 27.1
2nd 21.7 2nd 16.0 3rd 14.8
3rd 16.9 3rd 14.4 4th 8.0
4th 10.5 4th 7.7 5th 7.6
5th 9.1 5th 5.8 6th 6.8
6th 6.3 6th 4.3 7th 2.7
DE
1st 36.3 7th 3.3 8th 0.7
2nd 26.7 8th 3.0 9th 0.5
3rd 13.7 9th 2.1
PT
1st 24.5
4th 12.8 10th 1.2 2nd 21.4
5th 9.6 11th 1.1 3rd 13.4
6th 0.9 12th 1.1 4th 11.0
7th 0.1 13th 0.7 5th 9.6
ES
1st 21.6 14th 0.3 6th 9.0
2nd 13.9 15th 0.1 7th 6.0
3rd 13.3
IT
1st 21.6 8th 2.5
4th 5.6 2nd 18.0 9th 1.1
5th 4.7 3rd 11.2 10th 0.9
6th 3.7 4th 11.2 11th 0.3
7th 3.6 5th 11.0 12th 0.2
FI1st 45.9 6th 8.2
2nd 38.9 7th 4.1
Source: ECB calculation from 2010 Nielsen structural data.
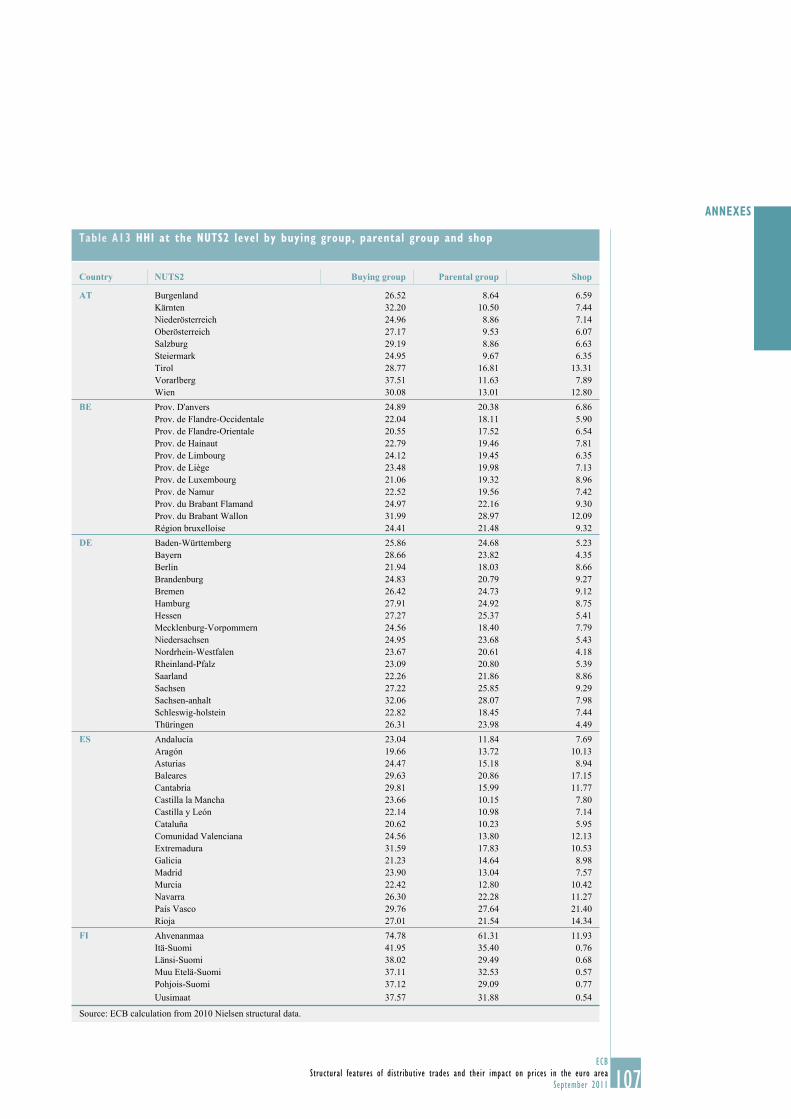
107ECB
Structural features of distributive trades and their impact on prices in the euro area
September 2011
ANNEXES
Table A13 HHI at the NUTS2 level by buying group, parental group and shop
Country NUTS2 Buying group Parental group Shop
AT Burgenland 26.52 8.64 6.59
Kärnten 32.20 10.50 7.44
Niederösterreich 24.96 8.86 7.14
Oberösterreich 27.17 9.53 6.07
Salzburg 29.19 8.86 6.63
Steiermark 24.95 9.67 6.35
Tirol 28.77 16.81 13.31
Vorarlberg 37.51 11.63 7.89
Wien 30.08 13.01 12.80
BE Prov. D’anvers 24.89 20.38 6.86
Prov. de Flandre-Occidentale 22.04 18.11 5.90
Prov. de Flandre-Orientale 20.55 17.52 6.54
Prov. de Hainaut 22.79 19.46 7.81
Prov. de Limbourg 24.12 19.45 6.35
Prov. de Liège 23.48 19.98 7.13
Prov. de Luxembourg 21.06 19.32 8.96
Prov. de Namur 22.52 19.56 7.42
Prov. du Brabant Flamand 24.97 22.16 9.30
Prov. du Brabant Wallon 31.99 28.97 12.09
Région bruxelloise 24.41 21.48 9.32
DE Baden-Württemberg 25.86 24.68 5.23
Bayern 28.66 23.82 4.35
Berlin 21.94 18.03 8.66
Brandenburg 24.83 20.79 9.27
Bremen 26.42 24.73 9.12
Hamburg 27.91 24.92 8.75
Hessen 27.27 25.37 5.41
Mecklenburg-Vorpommern 24.56 18.40 7.79
Niedersachsen 24.95 23.68 5.43
Nordrhein-Westfalen 23.67 20.61 4.18
Rheinland-Pfalz 23.09 20.80 5.39
Saarland 22.26 21.86 8.86
Sachsen 27.22 25.85 9.29
Sachsen-anhalt 32.06 28.07 7.98
Schleswig-holstein 22.82 18.45 7.44
Thüringen 26.31 23.98 4.49
ES Andalucía 23.04 11.84 7.69
Aragón 19.66 13.72 10.13
Asturias 24.47 15.18 8.94
Baleares 29.63 20.86 17.15
Cantabria 29.81 15.99 11.77
Castilla la Mancha 23.66 10.15 7.80
Castilla y León 22.14 10.98 7.14
Cataluña 20.62 10.23 5.95
Comunidad Valenciana 24.56 13.80 12.13
Extremadura 31.59 17.83 10.53
Galicia 21.23 14.64 8.98
Madrid 23.90 13.04 7.57
Murcia 22.42 12.80 10.42
Navarra 26.30 22.28 11.27
País Vasco 29.76 27.64 21.40
Rioja 27.01 21.54 14.34
FI Ahvenanmaa 74.78 61.31 11.93
Itä-Suomi 41.95 35.40 0.76
Länsi-Suomi 38.02 29.49 0.68
Muu Etelä-Suomi 37.11 32.53 0.57
Pohjois-Suomi 37.12 29.09 0.77
Uusimaat 37.57 31.88 0.54
Source: ECB calculation from 2010 Nielsen structural data.
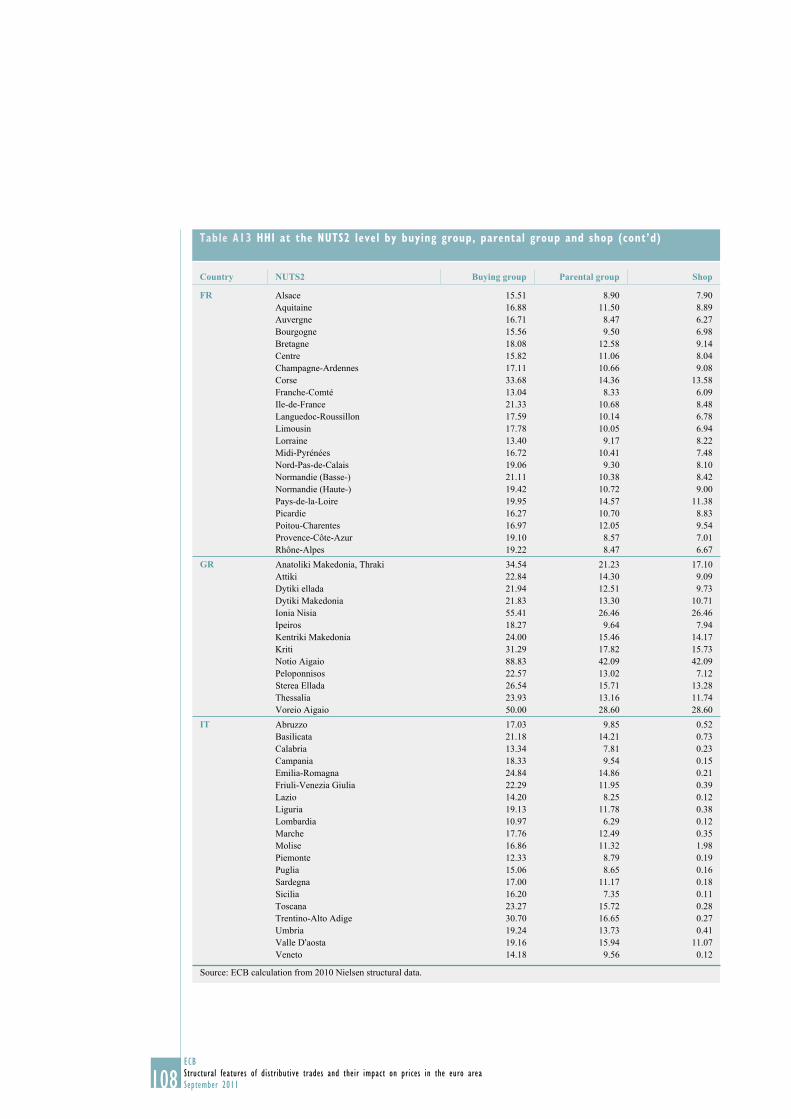
108ECB
Structural features of distributive trades and their impact on prices in the euro area
September 2011
Table A13 HHI at the NUTS2 level by buying group, parental group and shop (cont’d)
Country NUTS2 Buying group Parental group Shop
FR Alsace 15.51 8.90 7.90
Aquitaine 16.88 11.50 8.89
Auvergne 16.71 8.47 6.27
Bourgogne 15.56 9.50 6.98
Bretagne 18.08 12.58 9.14
Centre 15.82 11.06 8.04
Champagne-Ardennes 17.11 10.66 9.08
Corse 33.68 14.36 13.58
Franche-Comté 13.04 8.33 6.09
Ile-de-France 21.33 10.68 8.48
Languedoc-Roussillon 17.59 10.14 6.78
Limousin 17.78 10.05 6.94
Lorraine 13.40 9.17 8.22
Midi-Pyrénées 16.72 10.41 7.48
Nord-Pas-de-Calais 19.06 9.30 8.10
Normandie (Basse-) 21.11 10.38 8.42
Normandie (Haute-) 19.42 10.72 9.00
Pays-de-la-Loire 19.95 14.57 11.38
Picardie 16.27 10.70 8.83
Poitou-Charentes 16.97 12.05 9.54
Provence-Côte-Azur 19.10 8.57 7.01
Rhône-Alpes 19.22 8.47 6.67
GR Anatoliki Makedonia, Thraki 34.54 21.23 17.10
Attiki 22.84 14.30 9.09
Dytiki ellada 21.94 12.51 9.73
Dytiki Makedonia 21.83 13.30 10.71
Ionia Nisia 55.41 26.46 26.46
Ipeiros 18.27 9.64 7.94
Kentriki Makedonia 24.00 15.46 14.17
Kriti 31.29 17.82 15.73
Notio Aigaio 88.83 42.09 42.09
Peloponnisos 22.57 13.02 7.12
Sterea Ellada 26.54 15.71 13.28
Thessalia 23.93 13.16 11.74
Voreio Aigaio 50.00 28.60 28.60
IT Abruzzo 17.03 9.85 0.52
Basilicata 21.18 14.21 0.73
Calabria 13.34 7.81 0.23
Campania 18.33 9.54 0.15
Emilia-Romagna 24.84 14.86 0.21
Friuli-Venezia Giulia 22.29 11.95 0.39
Lazio 14.20 8.25 0.12
Liguria 19.13 11.78 0.38
Lombardia 10.97 6.29 0.12
Marche 17.76 12.49 0.35
Molise 16.86 11.32 1.98
Piemonte 12.33 8.79 0.19
Puglia 15.06 8.65 0.16
Sardegna 17.00 11.17 0.18
Sicilia 16.20 7.35 0.11
Toscana 23.27 15.72 0.28
Trentino-Alto Adige 30.70 16.65 0.27
Umbria 19.24 13.73 0.41
Valle D’aosta 19.16 15.94 11.07
Veneto 14.18 9.56 0.12
Source: ECB calculation from 2010 Nielsen structural data.
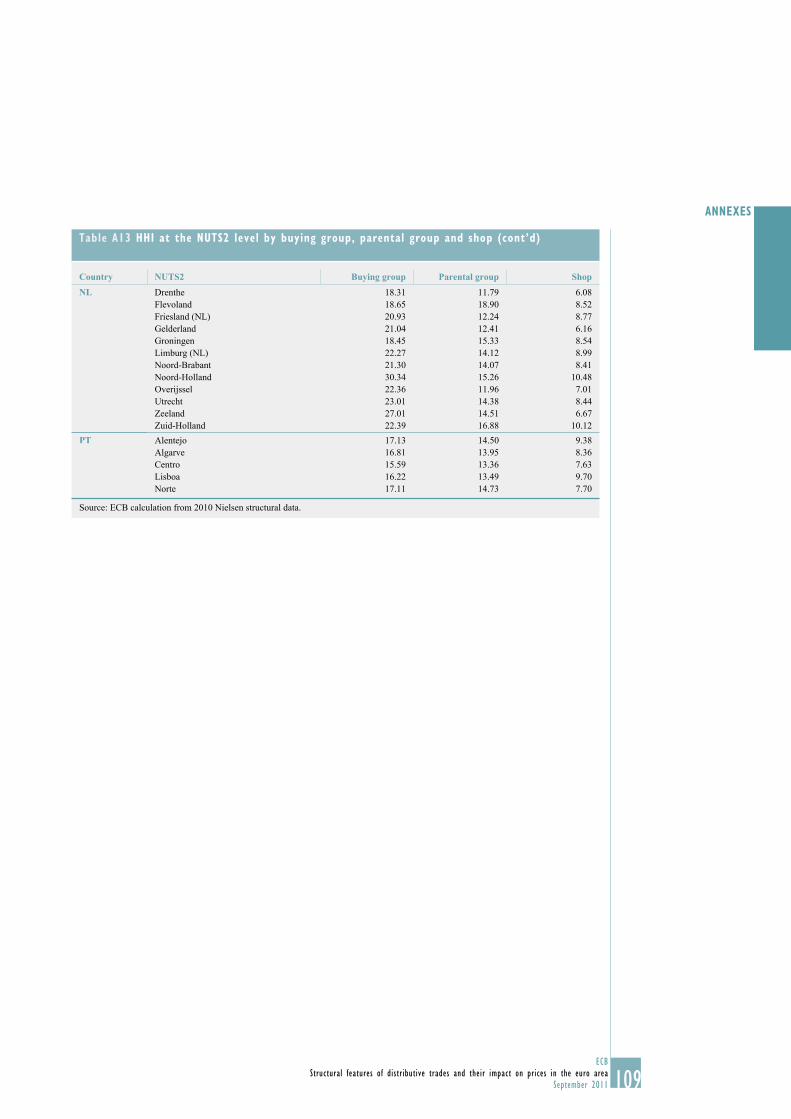
109ECB
Structural features of distributive trades and their impact on prices in the euro area
September 2011
ANNEXES
Table A13 HHI at the NUTS2 level by buying group, parental group and shop (cont’d)
Country NUTS2 Buying group Parental group Shop
NL Drenthe 18.31 11.79 6.08
Flevoland 18.65 18.90 8.52
Friesland (NL) 20.93 12.24 8.77
Gelderland 21.04 12.41 6.16
Groningen 18.45 15.33 8.54
Limburg (NL) 22.27 14.12 8.99
Noord-Brabant 21.30 14.07 8.41
Noord-Holland 30.34 15.26 10.48
Overijssel 22.36 11.96 7.01
Utrecht 23.01 14.38 8.44
Zeeland 27.01 14.51 6.67
Zuid-Holland 22.39 16.88 10.12
PT Alentejo 17.13 14.50 9.38
Algarve 16.81 13.95 8.36
Centro 15.59 13.36 7.63
Lisboa 16.22 13.49 9.70
Norte 17.11 14.73 7.70
Source: ECB calculation from 2010 Nielsen structural data.
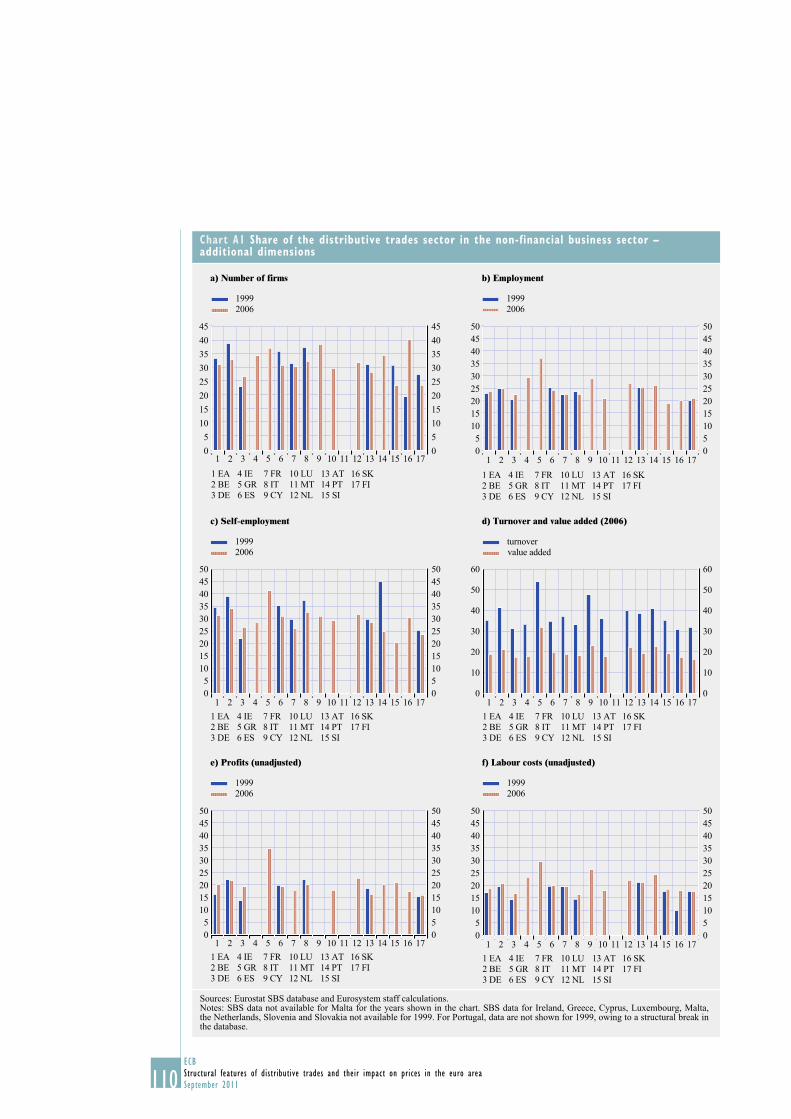
110ECB
Structural features of distributive trades and their impact on prices in the euro area
September 2011
Chart A1 Share of the distributive trades sector in the non-financial business sector – additional dimensions
a) Number of firms b) Employment
0
5
10
15
20
25
30
35
40
45
0
5
10
15
20
25
30
35
40
45
1 EA
2 BE
3 DE
4 IE
5 GR
6 ES
7 FR
8 IT
9 CY
10 LU
11 MT
12 NL
13 AT
14 PT
15 SI
16 SK
17 FI
1999
2006
1 2 3 4 5 6 7 8 9 10 11 12 13 14 15 16 170
5
10
15
20
25
30
35
40
45
50
0
5
10
15
20
25
30
35
40
45
50
1999
2006
1 EA
2 BE
3 DE
4 IE
5 GR
6 ES
7 FR
8 IT
9 CY
10 LU
11 MT
12 NL
13 AT
14 PT
15 SI
16 SK
17 FI
1 2 3 4 5 6 7 8 9 10 11 12 13 14 15 16 17
c) Self-employment d) Turnover and value added (2006)
0
5
10
15
20
25
30
35
40
45
50
0
5
10
15
20
25
30
35
40
45
50
1999
2006
1 EA
2 BE
3 DE
4 IE
5 GR
6 ES
7 FR
8 IT
9 CY
10 LU
11 MT
12 NL
13 AT
14 PT
15 SI
16 SK
17 FI
1 2 3 4 5 6 7 8 9 10 11 12 13 14 15 16 170
10
20
30
40
50
60
0
10
20
30
40
50
60
turnover
value added
1 EA
2 BE
3 DE
4 IE
5 GR
6 ES
7 FR
8 IT
9 CY
10 LU
11 MT
12 NL
13 AT
14 PT
15 SI
16 SK
17 FI
1 2 3 4 5 6 7 8 9 10 11 12 13 14 15 16 17
e) Profits (unadjusted) f) Labour costs (unadjusted)
0
5
10
15
20
25
30
35
40
45
50
0
5
10
15
20
25
30
35
40
45
50
1999
2006
1 EA
2 BE
3 DE
4 IE
5 GR
6 ES
7 FR
8 IT
9 CY
10 LU
11 MT
12 NL
13 AT
14 PT
15 SI
16 SK
17 FI
1 2 3 4 5 6 7 8 9 10 11 12 13 14 15 16 170
5
10
15
20
25
30
35
40
45
50
0
5
10
15
20
25
30
35
40
45
50
1999
2006
1 EA
2 BE
3 DE
4 IE
5 GR
6 ES
7 FR
8 IT
9 CY
10 LU
11 MT
12 NL
13 AT
14 PT
15 SI
16 SK
17 FI
1 2 3 4 5 6 7 8 9 10 11 12 13 14 15 16 17
Sources: Eurostat SBS database and Eurosystem staff calculations.Notes: SBS data not available for Malta for the years shown in the chart. SBS data for Ireland, Greece, Cyprus, Luxembourg, Malta, the Netherlands, Slovenia and Slovakia not available for 1999. For Portugal, data are not shown for 1999, owing to a structural break in the database.
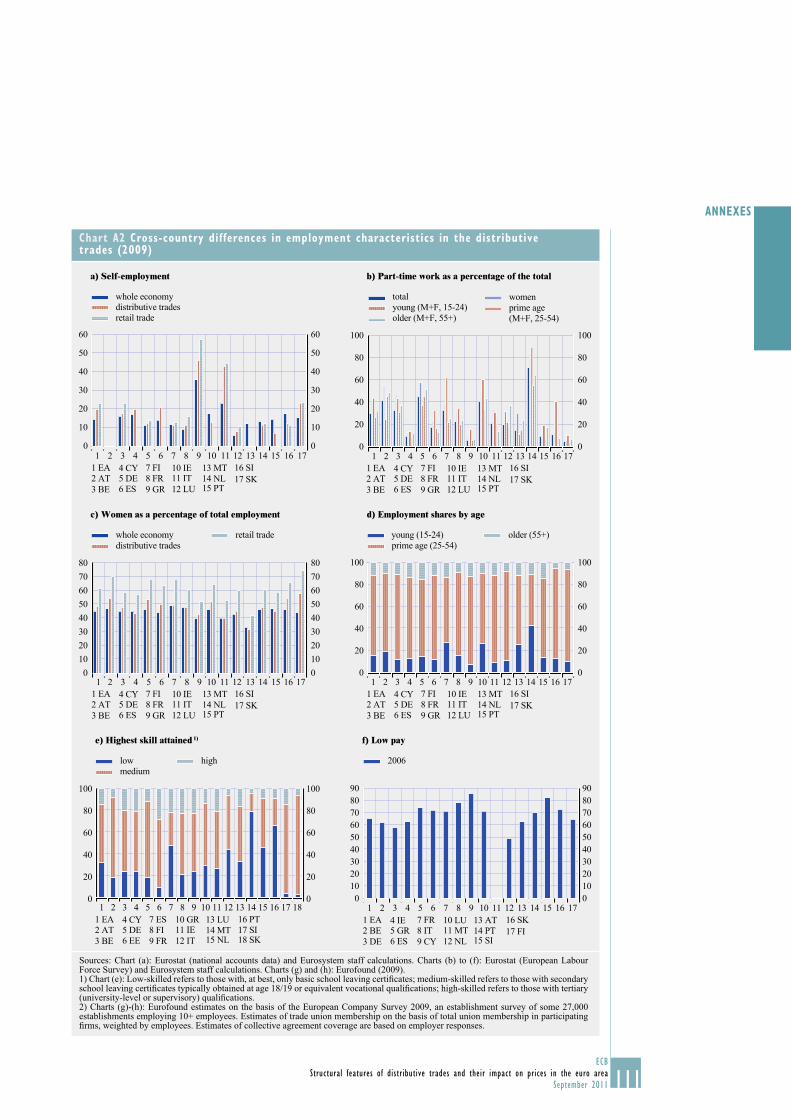
111ECB
Structural features of distributive trades and their impact on prices in the euro area
September 2011
ANNEXES
Chart A2 Cross-country differences in employment characteristics in the distributive trades (2009)
a) Self-employment b) Part-time work as a percentage of the total
0
10
20
30
40
50
60
0
10
20
30
40
50
60
whole economydistributive trades
retail trade
1 2 3 4 5 6 7 8 9 10 11 12 13 14 15 16 17
1 EA
2 AT
3 BE
4 CY5 DE
6 ES
7 FI
8 FR
9 GR
10 IE11 IT
12 LU
13 MT
14 NL15 PT
16 SI
17 SK
0
20
40
60
80
0
20
40
60
80
100 100
1 2 3 4 5 6 7 8 9 10 11 12 13 14 15 16 17
1 EA
2 AT
3 BE
4 CY5 DE
6 ES
7 FI
8 FR
9 GR
10 IE11 IT
12 LU
13 MT
14 NL15 PT
16 SI
17 SK
total women young (M+F, 15-24) prime age
(M+F, 25-54)older (M+F, 55+)
c) Women as a percentage of total employment d) Employment shares by age
0
10
20
30
40
50
60
70
80
0
10
20
30
40
50
60
70
80
whole economy
distributive trades
retail trade
1 2 3 4 5 6 7 8 9 10 11 12 13 14 15 16 17
1 EA
2 AT
3 BE
4 CY5 DE
6 ES
7 FI
8 FR
9 GR
10 IE11 IT
12 LU
13 MT
14 NL15 PT
16 SI
17 SK
0
20
40
60
80
100
0
20
40
60
80
100
young (15-24)
prime age (25-54)
older (55+)
1 2 3 4 5 6 7 8 9 10 11 12 13 14 15 16 17
1 EA
2 AT
3 BE
4 CY5 DE
6 ES
7 FI
8 FR
9 GR
10 IE11 IT
12 LU
13 MT
14 NL15 PT
16 SI
17 SK
e) Highest skill attained 1) f) Low pay
0
20
40
60
80
100
0
20
40
60
80
100
low
medium
high
1 2 3 4 5 6 7 8 9 10 11 12 13 14 15 16 17 18
1 EA
2 AT
3 BE
4 CY5 DE
6 EE
7 ES
8 FI
9 FR
10 GR11 IE
12 IT
13 LU
14 MT15 NL
16 PT
17 SI18 SK
10
20
30
40
50
60
70
80
90
0
10
20
30
40
50
60
70
80
90
01 2 3 4 5 6 7 8 9 10 11 12 13 14 15 16 17
1 EA
2 BE
3 DE
4 IE5 GR
6 ES
7 FR
8 IT
9 CY
10 LU11 MT
12 NL
13 AT
14 PT15 SI
16 SK
17 FI
2006
Sources: Chart (a): Eurostat (national accounts data) and Eurosystem staff calculations. Charts (b) to (f): Eurostat (European Labour Force Survey) and Eurosystem staff calculations. Charts (g) and (h): Eurofound (2009).1) Chart (e): Low-skilled refers to those with, at best, only basic school leaving certifi cates; medium-skilled refers to those with secondary school leaving certifi cates typically obtained at age 18/19 or equivalent vocational qualifi cations; high-skilled refers to those with tertiary (university-level or supervisory) qualifi cations.2) Charts (g)-(h): Eurofound estimates on the basis of the European Company Survey 2009, an establishment survey of some 27,000 establishments employing 10+ employees. Estimates of trade union membership on the basis of total union membership in participating fi rms, weighted by employees. Estimates of collective agreement coverage are based on employer responses.
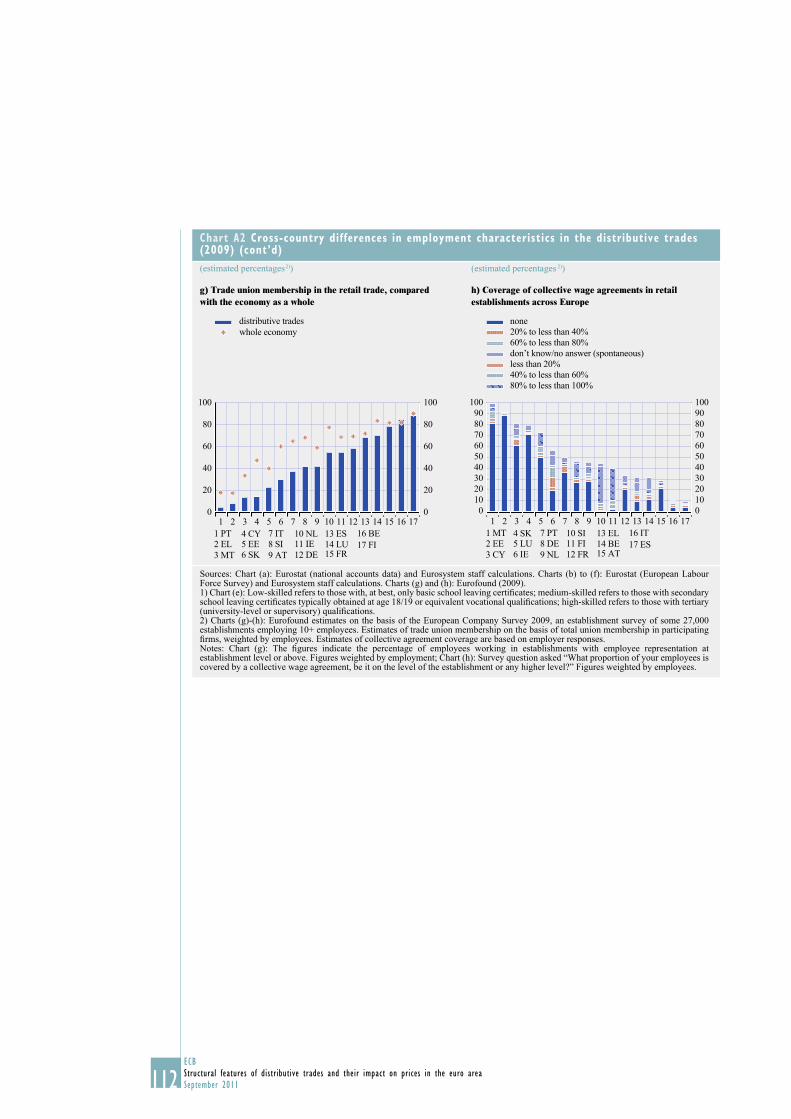
112ECB
Structural features of distributive trades and their impact on prices in the euro area
September 2011
Chart A2 Cross-country differences in employment characteristics in the distributive trades (2009) (cont’d)
(estimated percentages 2)) (estimated percentages 2))
g) Trade union membership in the retail trade, compared with the economy as a whole
h) Coverage of collective wage agreements in retail establishments across Europe
0
20
40
60
80
100
0
20
40
60
80
100
distributive trades
whole economy
1 2 3 4 5 6 7 8 9 10 11 12 13 14 15 16 17
1 PT
2 EL
3 MT
4 CY5 EE
6 SK
7 IT
8 SI
9 AT
10 NL11 IE
12 DE
13 ES
14 LU15 FR
16 BE
17 FI
0
10
20
30
40
50
60
70
80
90
100
0
10
20
30
40
50
60
70
80
90
100
none
20% to less than 40%
60% to less than 80%
don’t know/no answer (spontaneous)
less than 20%
40% to less than 60%
80% to less than 100%
1 2 3 4 5 6 7 8 9 10 11 12 13 14 15 16 17
1 MT
2 EE
3 CY
4 SK5 LU
6 IE
7 PT
8 DE
9 NL
10 SI11 FI
12 FR
13 EL
14 BE15 AT
16 IT
17 ES
Sources: Chart (a): Eurostat (national accounts data) and Eurosystem staff calculations. Charts (b) to (f): Eurostat (European Labour Force Survey) and Eurosystem staff calculations. Charts (g) and (h): Eurofound (2009).1) Chart (e): Low-skilled refers to those with, at best, only basic school leaving certifi cates; medium-skilled refers to those with secondary school leaving certifi cates typically obtained at age 18/19 or equivalent vocational qualifi cations; high-skilled refers to those with tertiary (university-level or supervisory) qualifi cations.2) Charts (g)-(h): Eurofound estimates on the basis of the European Company Survey 2009, an establishment survey of some 27,000 establishments employing 10+ employees. Estimates of trade union membership on the basis of total union membership in participating fi rms, weighted by employees. Estimates of collective agreement coverage are based on employer responses.Notes: Chart (g): The fi gures indicate the percentage of employees working in establishments with employee representation at establishment level or above. Figures weighted by employment; Chart (h): Survey question asked “What proportion of your employees is covered by a collective wage agreement, be it on the level of the establishment or any higher level?” Figures weighted by employees.

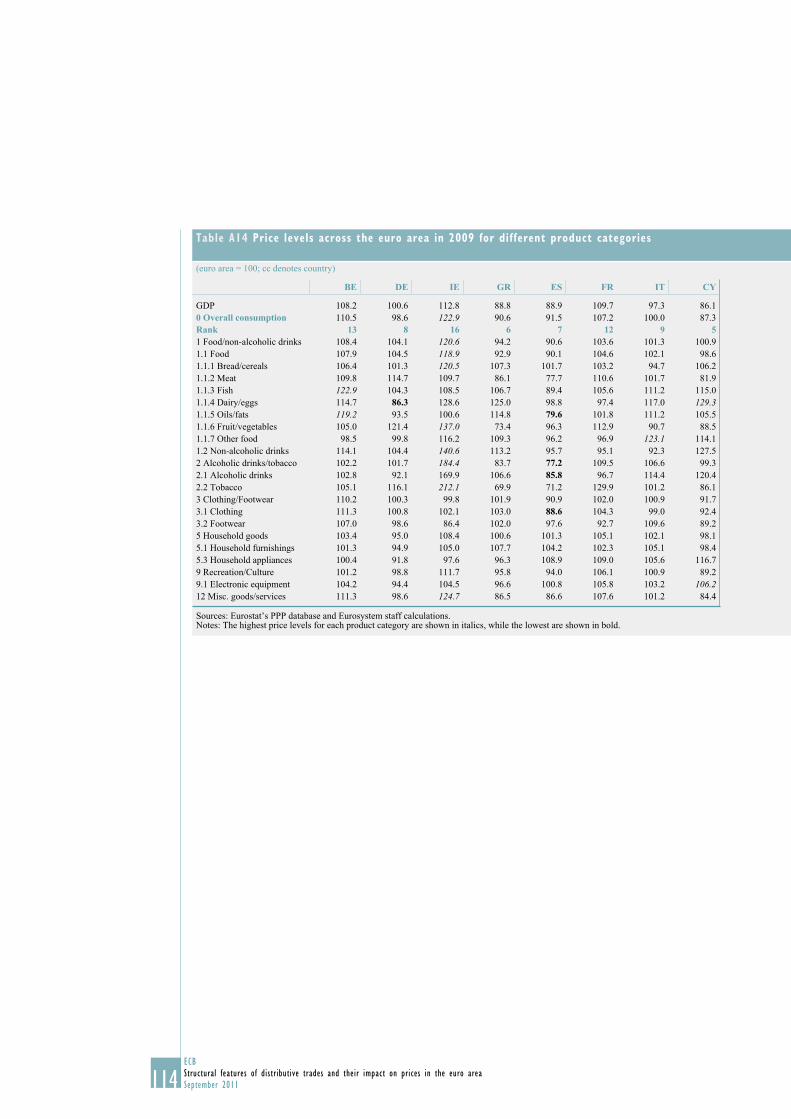
114ECB
Structural features of distributive trades and their impact on prices in the euro area
September 2011
Table A14 Price levels across the euro area in 2009 for different product categories
(euro area = 100; cc denotes country)
BE DE IE GR ES FR IT CY
GDP 108.2 100.6 112.8 88.8 88.9 109.7 97.3 86.1
0 Overall consumption 110.5 98.6 122.9 90.6 91.5 107.2 100.0 87.3
Rank 13 8 16 6 7 12 9 51 Food/non-alcoholic drinks 108.4 104.1 120.6 94.2 90.6 103.6 101.3 100.9
1.1 Food 107.9 104.5 118.9 92.9 90.1 104.6 102.1 98.6
1.1.1 Bread/cereals 106.4 101.3 120.5 107.3 101.7 103.2 94.7 106.2
1.1.2 Meat 109.8 114.7 109.7 86.1 77.7 110.6 101.7 81.9
1.1.3 Fish 122.9 104.3 108.5 106.7 89.4 105.6 111.2 115.0
1.1.4 Dairy/eggs 114.7 86.3 128.6 125.0 98.8 97.4 117.0 129.31.1.5 Oils/fats 119.2 93.5 100.6 114.8 79.6 101.8 111.2 105.5
1.1.6 Fruit/vegetables 105.0 121.4 137.0 73.4 96.3 112.9 90.7 88.5
1.1.7 Other food 98.5 99.8 116.2 109.3 96.2 96.9 123.1 114.1
1.2 Non-alcoholic drinks 114.1 104.4 140.6 113.2 95.7 95.1 92.3 127.5
2 Alcoholic drinks/tobacco 102.2 101.7 184.4 83.7 77.2 109.5 106.6 99.3
2.1 Alcoholic drinks 102.8 92.1 169.9 106.6 85.8 96.7 114.4 120.4
2.2 Tobacco 105.1 116.1 212.1 69.9 71.2 129.9 101.2 86.1
3 Clothing/Footwear 110.2 100.3 99.8 101.9 90.9 102.0 100.9 91.7
3.1 Clothing 111.3 100.8 102.1 103.0 88.6 104.3 99.0 92.4
3.2 Footwear 107.0 98.6 86.4 102.0 97.6 92.7 109.6 89.2
5 Household goods 103.4 95.0 108.4 100.6 101.3 105.1 102.1 98.1
5.1 Household furnishings 101.3 94.9 105.0 107.7 104.2 102.3 105.1 98.4
5.3 Household appliances 100.4 91.8 97.6 96.3 108.9 109.0 105.6 116.7
9 Recreation/Culture 101.2 98.8 111.7 95.8 94.0 106.1 100.9 89.2
9.1 Electronic equipment 104.2 94.4 104.5 96.6 100.8 105.8 103.2 106.212 Misc. goods/services 111.3 98.6 124.7 86.5 86.6 107.6 101.2 84.4
Sources: Eurostat’s PPP database and Eurosystem staff calculations.Notes: The highest price levels for each product category are shown in italics, while the lowest are shown in bold.
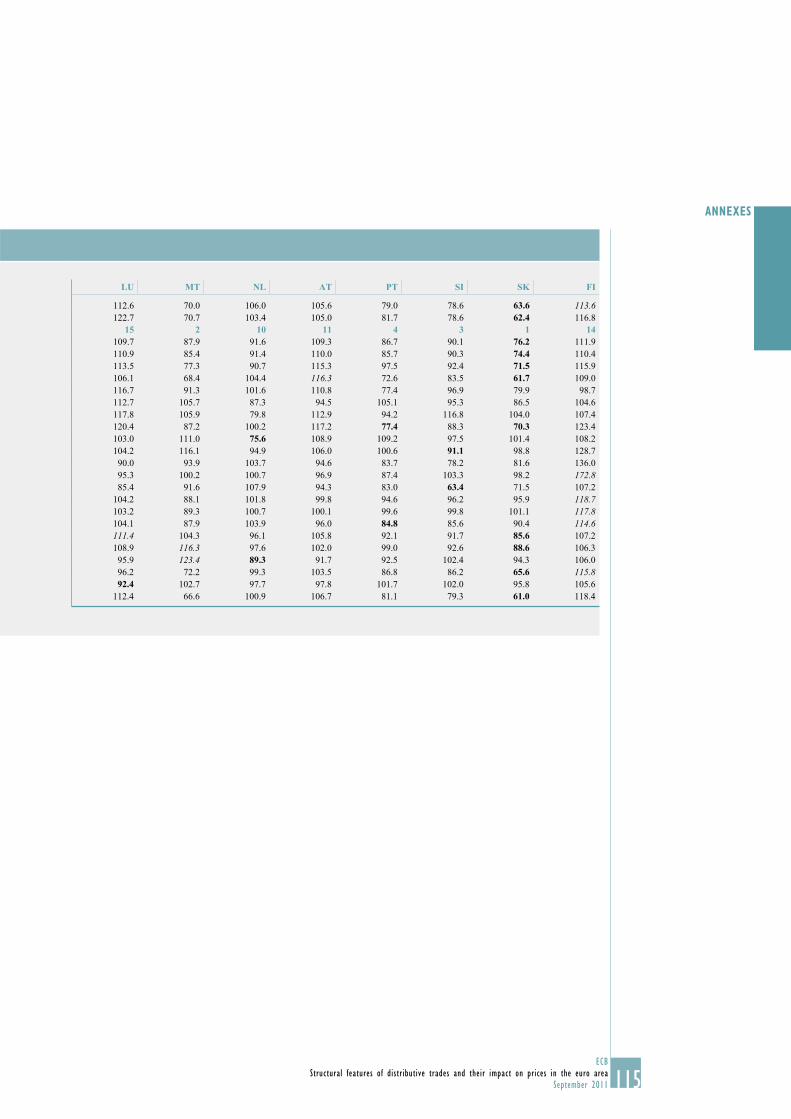
115ECB
Structural features of distributive trades and their impact on prices in the euro area
September 2011
ANNEXES
LU MT NL AT PT SI SK FI
112.6 70.0 106.0 105.6 79.0 78.6 63.6 113.6122.7 70.7 103.4 105.0 81.7 78.6 62.4 116.8
15 2 10 11 4 3 1 14109.7 87.9 91.6 109.3 86.7 90.1 76.2 111.9
110.9 85.4 91.4 110.0 85.7 90.3 74.4 110.4
113.5 77.3 90.7 115.3 97.5 92.4 71.5 115.9
106.1 68.4 104.4 116.3 72.6 83.5 61.7 109.0
116.7 91.3 101.6 110.8 77.4 96.9 79.9 98.7
112.7 105.7 87.3 94.5 105.1 95.3 86.5 104.6
117.8 105.9 79.8 112.9 94.2 116.8 104.0 107.4
120.4 87.2 100.2 117.2 77.4 88.3 70.3 123.4
103.0 111.0 75.6 108.9 109.2 97.5 101.4 108.2
104.2 116.1 94.9 106.0 100.6 91.1 98.8 128.7
90.0 93.9 103.7 94.6 83.7 78.2 81.6 136.0
95.3 100.2 100.7 96.9 87.4 103.3 98.2 172.885.4 91.6 107.9 94.3 83.0 63.4 71.5 107.2
104.2 88.1 101.8 99.8 94.6 96.2 95.9 118.7103.2 89.3 100.7 100.1 99.6 99.8 101.1 117.8104.1 87.9 103.9 96.0 84.8 85.6 90.4 114.6111.4 104.3 96.1 105.8 92.1 91.7 85.6 107.2
108.9 116.3 97.6 102.0 99.0 92.6 88.6 106.3
95.9 123.4 89.3 91.7 92.5 102.4 94.3 106.0
96.2 72.2 99.3 103.5 86.8 86.2 65.6 115.892.4 102.7 97.7 97.8 101.7 102.0 95.8 105.6
112.4 66.6 100.9 106.7 81.1 79.3 61.0 118.4
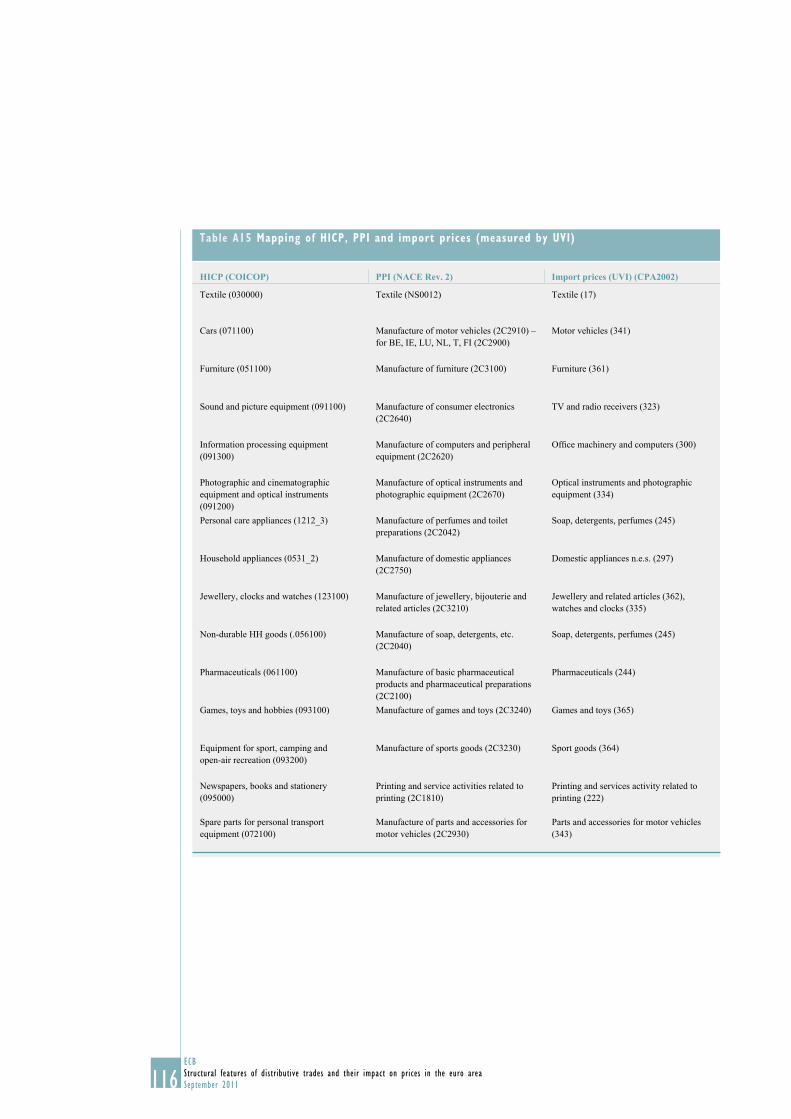
116ECB
Structural features of distributive trades and their impact on prices in the euro area
September 2011
Table A15 Mapping of HICP, PPI and import prices (measured by UVI)
HICP (COICOP) PPI (NACE Rev. 2) Import prices (UVI) (CPA2002)
Textile (030000) Textile (NS0012) Textile (17)
Cars (071100) Manufacture of motor vehicles (2C2910) –
for BE, IE, LU, NL, T, FI (2C2900)
Motor vehicles (341)
Furniture (051100) Manufacture of furniture (2C3100) Furniture (361)
Sound and picture equipment (091100) Manufacture of consumer electronics
(2C2640)
TV and radio receivers (323)
Information processing equipment
(091300)
Manufacture of computers and peripheral
equipment (2C2620)
Offi ce machinery and computers (300)
Photographic and cinematographic
equipment and optical instruments
(091200)
Manufacture of optical instruments and
photographic equipment (2C2670)
Optical instruments and photographic
equipment (334)
Personal care appliances (1212_3) Manufacture of perfumes and toilet
preparations (2C2042)
Soap, detergents, perfumes (245)
Household appliances (0531_2) Manufacture of domestic appliances
(2C2750)
Domestic appliances n.e.s. (297)
Jewellery, clocks and watches (123100) Manufacture of jewellery, bijouterie and
related articles (2C3210)
Jewellery and related articles (362),
watches and clocks (335)
Non-durable HH goods (.056100) Manufacture of soap, detergents, etc.
(2C2040)
Soap, detergents, perfumes (245)
Pharmaceuticals (061100) Manufacture of basic pharmaceutical
products and pharmaceutical preparations
(2C2100)
Pharmaceuticals (244)
Games, toys and hobbies (093100) Manufacture of games and toys (2C3240) Games and toys (365)
Equipment for sport, camping and
open-air recreation (093200)
Manufacture of sports goods (2C3230) Sport goods (364)
Newspapers, books and stationery
(095000)
Printing and service activities related to
printing (2C1810)
Printing and services activity related to
printing (222)
Spare parts for personal transport
equipment (072100)
Manufacture of parts and accessories for
motor vehicles (2C2930)
Parts and accessories for motor vehicles
(343)
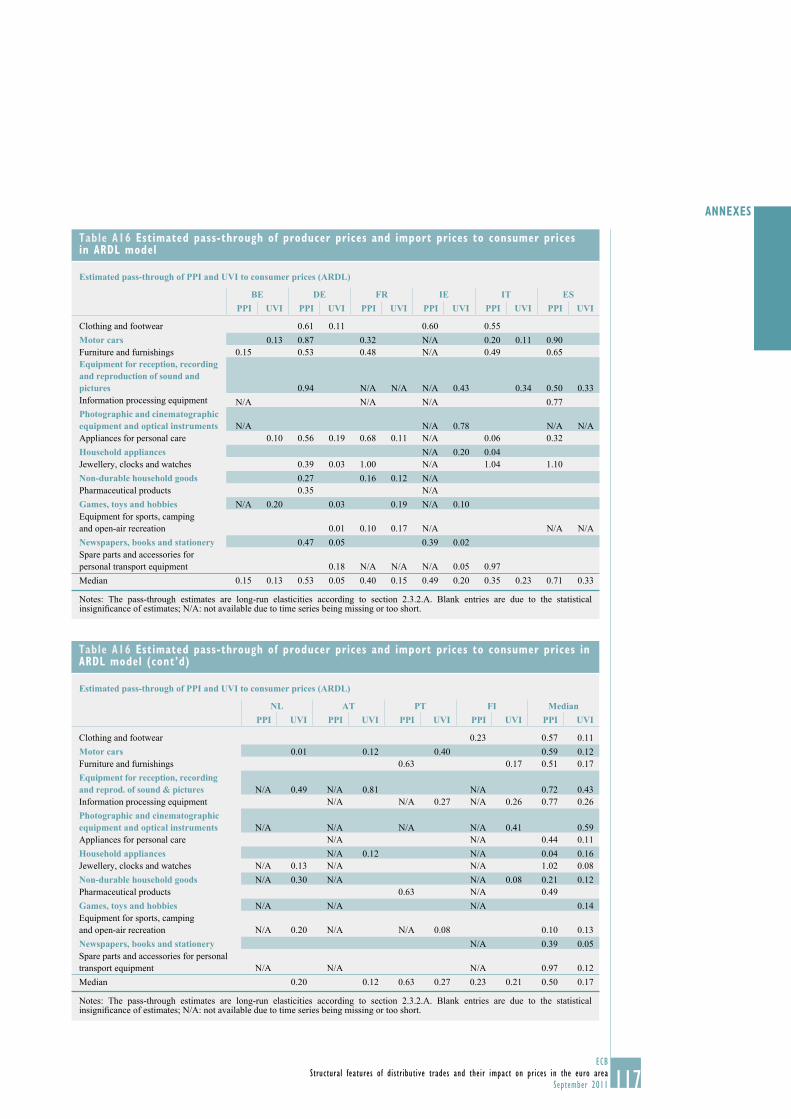
117ECB
Structural features of distributive trades and their impact on prices in the euro area
September 2011
ANNEXES
Table A16 Estimated pass-through of producer prices and import prices to consumer prices in ARDL model
Estimated pass-through of PPI and UVI to consumer prices (ARDL)
BE DE FR IE IT ESPPI UVI PPI UVI PPI UVI PPI UVI PPI UVI PPI UVI
Clothing and footwear 0.61 0.11 0.60 0.55
Motor cars 0.13 0.87 0.32 N/A 0.20 0.11 0.90
Furniture and furnishings 0.15 0.53 0.48 N/A 0.49 0.65
Equipment for reception, recording and reproduction of sound and pictures 0.94 N/A N/A N/A 0.43 0.34 0.50 0.33
Information processing equipment N/A N/A N/A 0.77
Photographic and cinematographic equipment and optical instruments N/A N/A 0.78 N/A N/A
Appliances for personal care 0.10 0.56 0.19 0.68 0.11 N/A 0.06 0.32
Household appliances N/A 0.20 0.04
Jewellery, clocks and watches 0.39 0.03 1.00 N/A 1.04 1.10
Non-durable household goods 0.27 0.16 0.12 N/A
Pharmaceutical products 0.35 N/A
Games, toys and hobbies N/A 0.20 0.03 0.19 N/A 0.10
Equipment for sports, camping
and open-air recreation 0.01 0.10 0.17 N/A N/A N/A
Newspapers, books and stationery 0.47 0.05 0.39 0.02
Spare parts and accessories for
personal transport equipment 0.18 N/A N/A N/A 0.05 0.97
Median 0.15 0.13 0.53 0.05 0.40 0.15 0.49 0.20 0.35 0.23 0.71 0.33
Notes: The pass-through estimates are long-run elasticities according to section 2.3.2.A. Blank entries are due to the statistical insignifi cance of estimates; N/A: not available due to time series being missing or too short.
Table A16 Estimated pass-through of producer prices and import prices to consumer prices in ARDL model (cont’d)
Estimated pass-through of PPI and UVI to consumer prices (ARDL)
NL AT PT FI MedianPPI UVI PPI UVI PPI UVI PPI UVI PPI UVI
Clothing and footwear 0.23 0.57 0.11
Motor cars 0.01 0.12 0.40 0.59 0.12
Furniture and furnishings 0.63 0.17 0.51 0.17
Equipment for reception, recording and reprod. of sound & pictures N/A 0.49 N/A 0.81 N/A 0.72 0.43
Information processing equipment N/A N/A 0.27 N/A 0.26 0.77 0.26
Photographic and cinematographic equipment and optical instruments N/A N/A N/A N/A 0.41 0.59
Appliances for personal care N/A N/A 0.44 0.11
Household appliances N/A 0.12 N/A 0.04 0.16
Jewellery, clocks and watches N/A 0.13 N/A N/A 1.02 0.08
Non-durable household goods N/A 0.30 N/A N/A 0.08 0.21 0.12
Pharmaceutical products 0.63 N/A 0.49
Games, toys and hobbies N/A N/A N/A 0.14
Equipment for sports, camping
and open-air recreation N/A 0.20 N/A N/A 0.08 0.10 0.13
Newspapers, books and stationery N/A 0.39 0.05
Spare parts and accessories for personal
transport equipment N/A N/A N/A 0.97 0.12
Median 0.20 0.12 0.63 0.27 0.23 0.21 0.50 0.17
Notes: The pass-through estimates are long-run elasticities according to section 2.3.2.A. Blank entries are due to the statistical insignifi cance of estimates; N/A: not available due to time series being missing or too short.
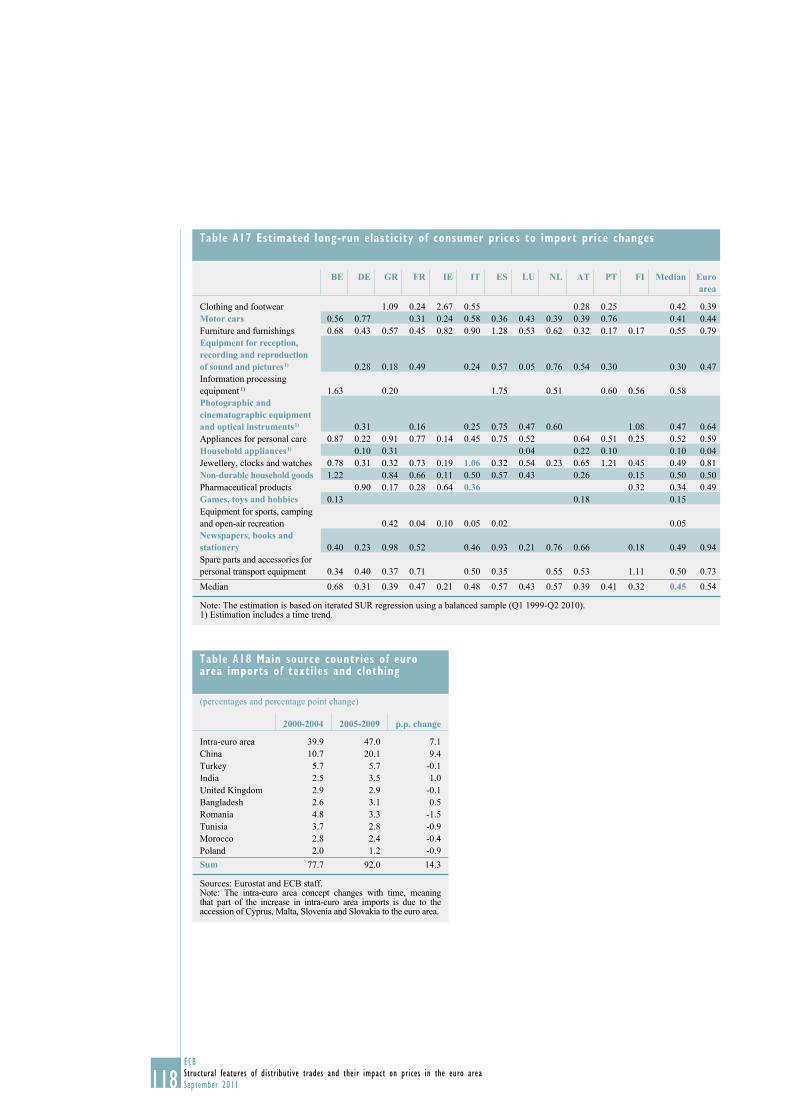
118ECB
Structural features of distributive trades and their impact on prices in the euro area
September 2011
Table A17 Estimated long-run elasticity of consumer prices to import price changes
BE DE GR FR IE IT ES LU NL AT PT FI Median Euroarea
Clothing and footwear 1.09 0.24 2.67 0.55 0.28 0.25 0.42 0.39
Motor cars 0.56 0.77 0.31 0.24 0.58 0.36 0.43 0.39 0.39 0.76 0.41 0.44
Furniture and furnishings 0.68 0.43 0.57 0.45 0.82 0.90 1.28 0.53 0.62 0.32 0.17 0.17 0.55 0.79
Equipment for reception, recording and reproduction of sound and pictures 1) 0.28 0.18 0.49 0.24 0.57 0.05 0.76 0.54 0.30 0.30 0.47
Information processing
equipment 1) 1.63 0.20 1.75 0.51 0.60 0.56 0.58
Photographic and cinematographic equipment and optical instruments 1) 0.31 0.16 0.25 0.75 0.47 0.60 1.08 0.47 0.64
Appliances for personal care 0.87 0.22 0.91 0.77 0.14 0.45 0.75 0.52 0.64 0.51 0.25 0.52 0.59
Household appliances 1) 0.10 0.31 0.04 0.22 0.10 0.10 0.04
Jewellery, clocks and watches 0.78 0.31 0.32 0.73 0.19 1.06 0.32 0.54 0.23 0.65 1.21 0.45 0.49 0.81
Non-durable household goods 1.22 0.84 0.66 0.11 0.50 0.57 0.43 0.26 0.15 0.50 0.50
Pharmaceutical products 0.90 0.17 0.28 0.64 0.36 0.32 0.34 0.49
Games, toys and hobbies 0.13 0.18 0.15
Equipment for sports, camping
and open-air recreation 0.42 0.04 0.10 0.05 0.02 0.05
Newspapers, books and stationery 0.40 0.23 0.98 0.52 0.46 0.93 0.21 0.76 0.66 0.18 0.49 0.94
Spare parts and accessories for
personal transport equipment 0.34 0.40 0.37 0.71 0.50 0.35 0.55 0.53 1.11 0.50 0.73
Median 0.68 0.31 0.39 0.47 0.21 0.48 0.57 0.43 0.57 0.39 0.41 0.32 0.45 0.54
Note: The estimation is based on iterated SUR regression using a balanced sample (Q1 1999-Q2 2010).1) Estimation includes a time trend.
Table A18 Main source countries of euro area imports of textiles and clothing
(percentages and percentage point change)
2000-2004 2005-2009 p.p. change
Intra-euro area 39.9 47.0 7.1
China 10.7 20.1 9.4
Turkey 5.7 5.7 -0.1
India 2.5 3.5 1.0
United Kingdom 2.9 2.9 -0.1
Bangladesh 2.6 3.1 0.5
Romania 4.8 3.3 -1.5
Tunisia 3.7 2.8 -0.9
Morocco 2.8 2.4 -0.4
Poland 2.0 1.2 -0.9
Sum 77.7 92.0 14.3
Sources: Eurostat and ECB staff.Note: The intra-euro area concept changes with time, meaning that part of the increase in intra-euro area imports is due to the accession of Cyprus, Malta, Slovenia and Slovakia to the euro area.
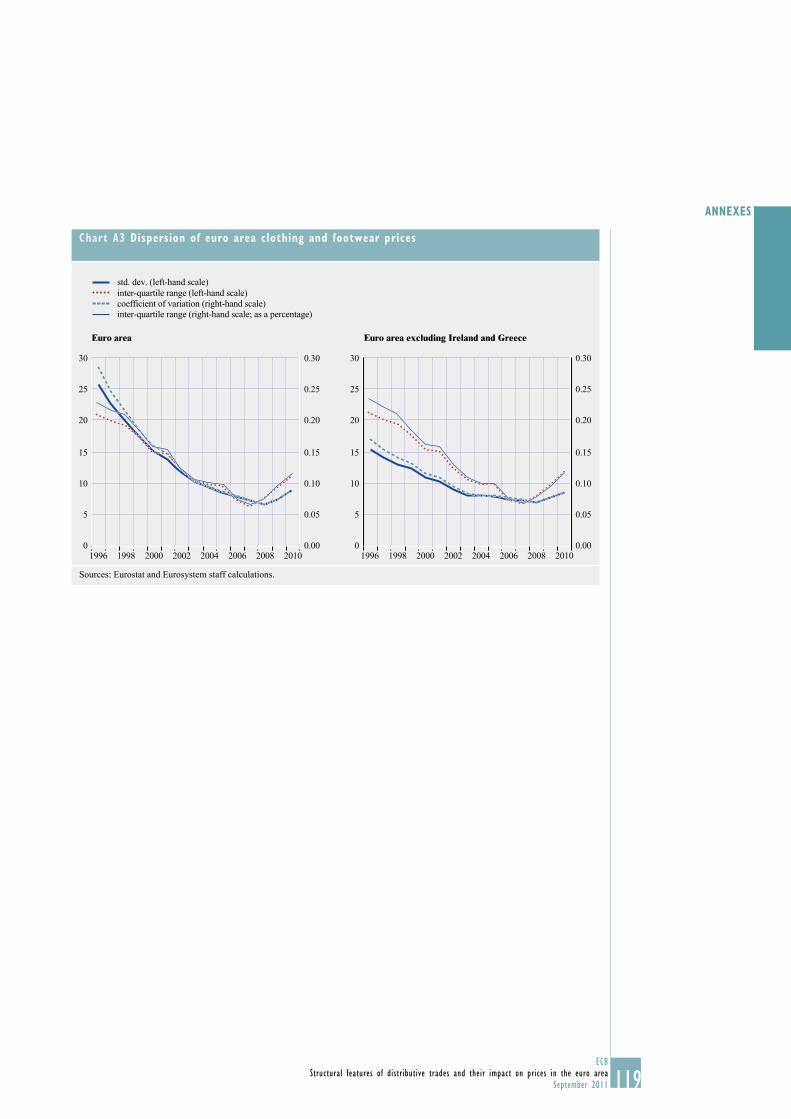
119ECB
Structural features of distributive trades and their impact on prices in the euro area
September 2011
ANNEXES
Chart A3 Dispersion of euro area clothing and footwear prices
std. dev. (left-hand scale)
inter-quartile range (left-hand scale)
coefficient of variation (right-hand scale)
inter-quartile range (right-hand scale; as a percentage)
Euro area Euro area excluding Ireland and Greece
0
5
10
15
20
25
30
0.00
0.05
0.10
0.15
0.20
0.25
0.30
1996 1998 2000 2002 2004 2006 201020080
5
10
15
20
25
30
0.00
0.05
0.10
0.15
0.20
0.25
0.30
1996 1998 2000 2002 2004 2006 20102008
Sources: Eurostat and Eurosystem staff calculations.

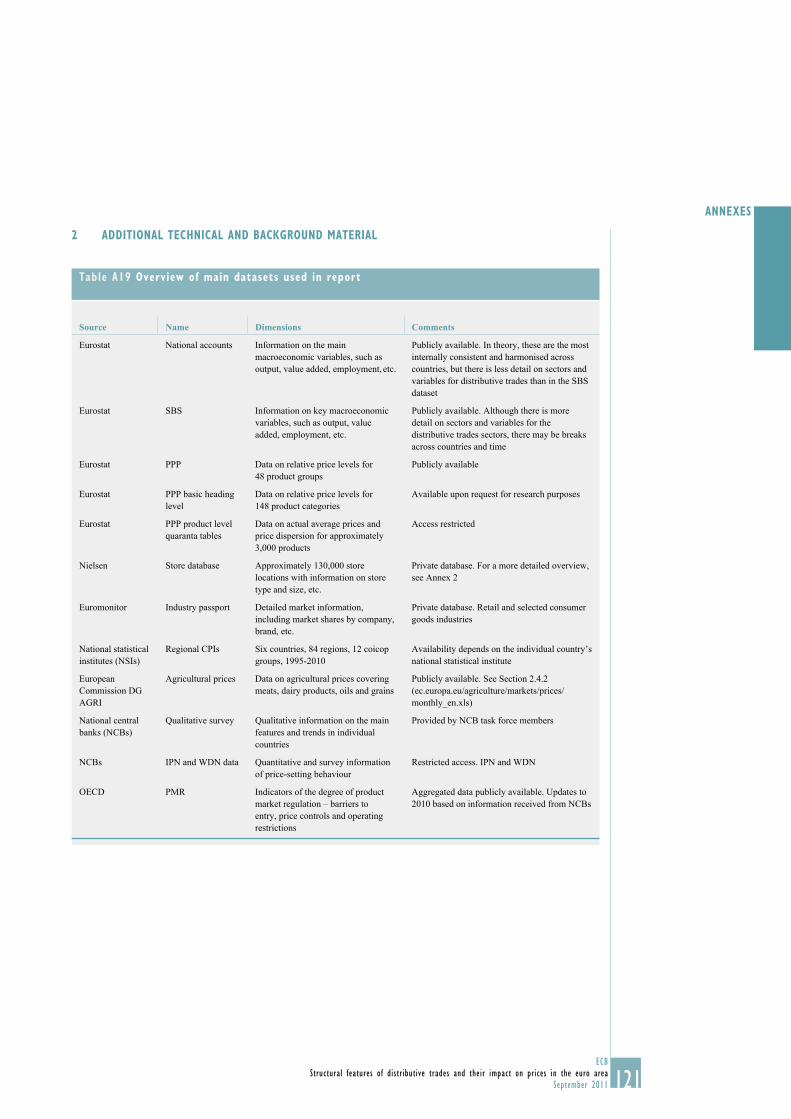
121ECB
Structural features of distributive trades and their impact on prices in the euro area
September 2011
ANNEXES
2 ADDITIONAL TECHNICAL AND BACKGROUND MATERIAL
Table A19 Overview of main datasets used in report
Source Name Dimensions Comments
Eurostat National accounts Information on the main
macroeconomic variables, such as
output, value added, employment, etc.
Publicly available. In theory, these are the most
internally consistent and harmonised across
countries, but there is less detail on sectors and
variables for distributive trades than in the SBS
dataset
Eurostat SBS Information on key macroeconomic
variables, such as output, value
added, employment, etc.
Publicly available. Although there is more
detail on sectors and variables for the
distributive trades sectors, there may be breaks
across countries and time
Eurostat PPP Data on relative price levels for
48 product groups
Publicly available
Eurostat PPP basic heading
level
Data on relative price levels for
148 product categories
Available upon request for research purposes
Eurostat PPP product level
quaranta tables
Data on actual average prices and
price dispersion for approximately
3,000 products
Access restricted
Nielsen Store database Approximately 130,000 store
locations with information on store
type and size, etc.
Private database. For a more detailed overview,
see Annex 2
Euromonitor Industry passport Detailed market information,
including market shares by company,
brand, etc.
Private database. Retail and selected consumer
goods industries
National statistical
institutes (NSIs)
Regional CPIs Six countries, 84 regions, 12 coicop
groups, 1995-2010
Availability depends on the individual country’s
national statistical institute
European
Commission DG
AGRI
Agricultural prices Data on agricultural prices covering
meats, dairy products, oils and grains
Publicly available. See Section 2.4.2
(ec.europa.eu/agriculture/markets/prices/
monthly_en.xls)
National central
banks (NCBs)
Qualitative survey Qualitative information on the main
features and trends in individual
countries
Provided by NCB task force members
NCBs IPN and WDN data Quantitative and survey information
of price-setting behaviour
Restricted access. IPN and WDN
OECD PMR Indicators of the degree of product
market regulation – barriers to
entry, price controls and operating
restrictions
Aggregated data publicly available. Updates to
2010 based on information received from NCBs
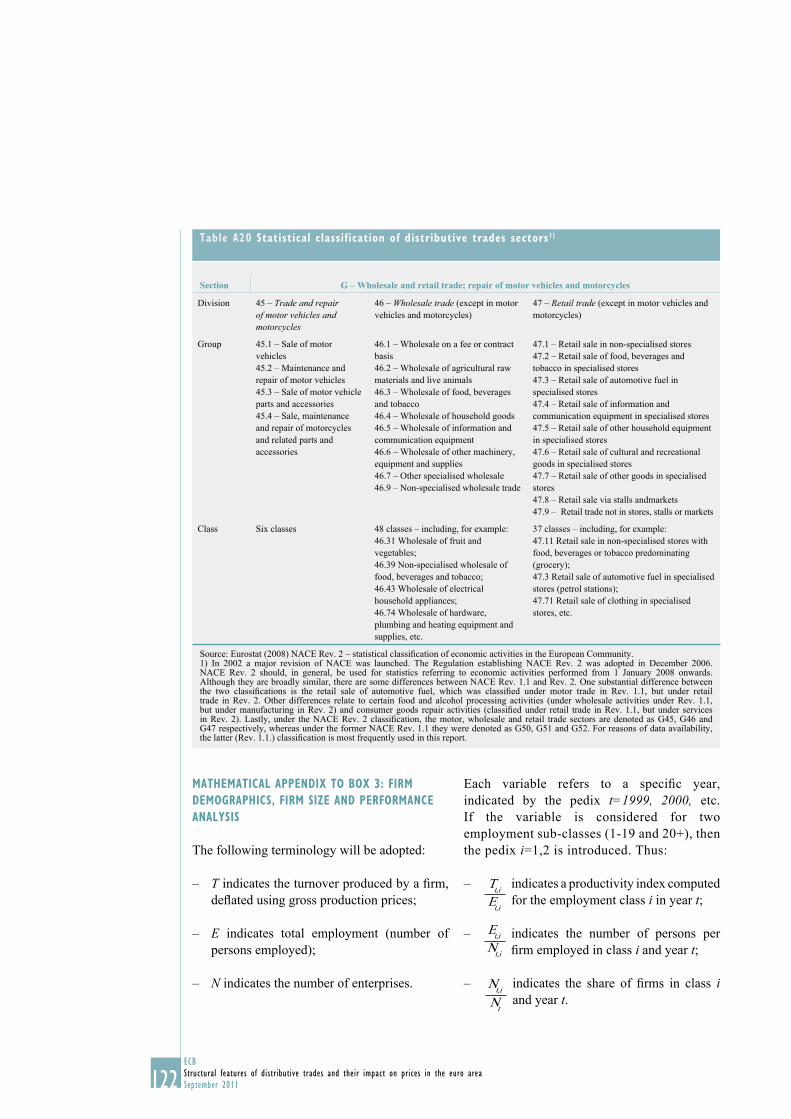
122ECB
Structural features of distributive trades and their impact on prices in the euro area
September 2011
MATHEMATICAL APPENDIX TO BOX 3: FIRM
DEMOGRAPHICS, FIRM SIZE AND PERFORMANCE
ANALYSIS
The following terminology will be adopted:
– T indicates the turnover produced by a fi rm,
defl ated using gross production prices;
– E indicates total employment (number of
persons employed);
– N indicates the number of enterprises.
Each variable refers to a specifi c year,
indicated by the pedix t=1999, 2000, etc.
If the variable is considered for two
employment sub-classes (1-19 and 20+), then
the pedix i=1,2 is introduced. Thus:
– Tt,i
Et,i
indicates a productivity index computed
for the employment class i in year t;
– Et,i
Nt,i
indicates the number of persons per
fi rm employed in class i and year t;
– Nt,i
Nt
indicates the share of fi rms in class i and year t.
Table A20 Statistical classification of distributive trades sectors1)
Section G – Wholesale and retail trade; repair of motor vehicles and motorcycles
Division 45 – Trade and repair of motor vehicles and motorcycles
46 – Wholesale trade (except in motor
vehicles and motorcycles)
47 – Retail trade (except in motor vehicles and
motorcycles)
Group 45.1 – Sale of motor
vehicles
45.2 – Maintenance and
repair of motor vehicles
45.3 – Sale of motor vehicle
parts and accessories
45.4 – Sale, maintenance
and repair of motorcycles
and related parts and
accessories
46.1 – Wholesale on a fee or contract
basis
46.2 – Wholesale of agricultural raw
materials and live animals
46.3 – Wholesale of food, beverages
and tobacco
46.4 – Wholesale of household goods
46.5 – Wholesale of information and
communication equipment
46.6 – Wholesale of other machinery,
equipment and supplies
46.7 – Other specialised wholesale
46.9 – Non-specialised wholesale trade
47.1 – Retail sale in non-specialised stores
47.2 – Retail sale of food, beverages and
tobacco in specialised stores
47.3 – Retail sale of automotive fuel in
specialised stores
47.4 – Retail sale of information and
communication equipment in specialised stores
47.5 – Retail sale of other household equipment
in specialised stores
47.6 – Retail sale of cultural and recreational
goods in specialised stores
47.7 – Retail sale of other goods in specialised
stores
47.8 – Retail sale via stalls andmarkets
47.9 – Retail trade not in stores, stalls or markets
Class Six classes 48 classes – including, for example:
46.31 Wholesale of fruit and
vegetables;
46.39 Non-specialised wholesale of
food, beverages and tobacco;
46.43 Wholesale of electrical
household appliances;
46.74 Wholesale of hardware,
plumbing and heating equipment and
supplies, etc.
37 classes – including, for example:
47.11 Retail sale in non-specialised stores with
food, beverages or tobacco predominating
(grocery);
47.3 Retail sale of automotive fuel in specialised
stores (petrol stations);
47.71 Retail sale of clothing in specialised
stores, etc.
Source: Eurostat (2008) NACE Rev. 2 – statistical classifi cation of economic activities in the European Community.1) In 2002 a major revision of NACE was launched. The Regulation establishing NACE Rev. 2 was adopted in December 2006. NACE Rev. 2 should, in general, be used for statistics referring to economic activities performed from 1 January 2008 onwards. Although they are broadly similar, there are some differences between NACE Rev. 1.1 and Rev. 2. One substantial difference between the two classifi cations is the retail sale of automotive fuel, which was classifi ed under motor trade in Rev. 1.1, but under retail trade in Rev. 2. Other differences relate to certain food and alcohol processing activities (under wholesale activities under Rev. 1.1, but under manufacturing in Rev. 2) and consumer goods repair activities (classifi ed under retail trade in Rev. 1.1, but under services in Rev. 2). Lastly, under the NACE Rev. 2 classifi cation, the motor, wholesale and retail trade sectors are denoted as G45, G46 and G47 respectively, whereas under the former NACE Rev. 1.1 they were denoted as G50, G51 and G52. For reasons of data availability, the latter (Rev. 1.1.) classifi cation is most frequently used in this report.
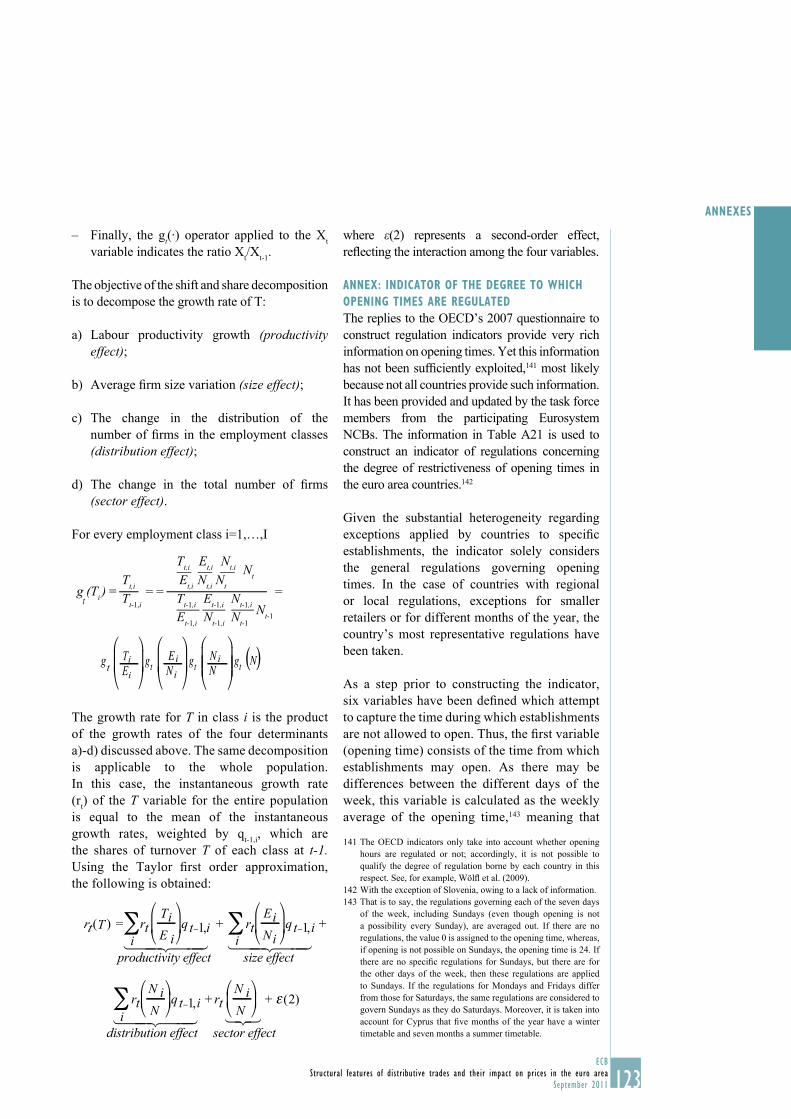
123ECB
Structural features of distributive trades and their impact on prices in the euro area
September 2011
ANNEXES
– Finally, the gt(·) operator applied to the Xt
variable indicates the ratio Xt/X
t-1.
The objective of the shift and share decomposition
is to decompose the growth rate of T:
a) Labour productivity growth (productivity effect);
b) Average fi rm size variation (size effect);
c) The change in the distribution of the
number of fi rms in the employment classes
(distribution effect);
d) The change in the total number of fi rms
(sector effect).
For every employment class i=1,…,I
g (Ti ) =--Tt,i
---Tt,i
-Tt-1,i-Et-1,i
Et-1,i Nt-1,i
-Nt-1,i Nt-1Nt-1
Nt.iEt,i
Et,i Nt,i Nt
Nt
Tt-1,i= = =
t
gtTiEi
gt Ei
Ni
gt Ni
N
gt N( )
The growth rate for T in class i is the product
of the growth rates of the four determinants
a)-d) discussed above. The same decomposition
is applicable to the whole population.
In this case, the instantaneous growth rate
(rt) of the T variable for the entire population
is equal to the mean of the instantaneous
growth rates, weighted by qt-1,i
, which are
the shares of turnover T of each class at t-1. Using the Taylor fi rst order approximation,
the following is obtained:
rt (T ) = rtTiE i
qt 1,i
iproductivity effect
+ rtEiNi
qt 1,i
isize effect
+
rtN iN
qt 1,i
idistribution effect
+ rtN iN
sector effect
+ (2)
where ε(2) represents a second-order effect,
refl ecting the interaction among the four variables.
ANNEX: INDICATOR OF THE DEGREE TO WHICH
OPENING TIMES ARE REGULATED
The replies to the OECD’s 2007 questionnaire to
construct regulation indicators provide very rich
information on opening times. Yet this information
has not been suffi ciently exploited,141 most likely
because not all countries provide such information.
It has been provided and updated by the task force
members from the participating Eurosystem
NCBs. The information in Table A21 is used to
construct an indicator of regulations concerning
the degree of restrictiveness of opening times in
the euro area countries.142
Given the substantial heterogeneity regarding
exceptions applied by countries to specifi c
establishments, the indicator solely considers
the general regulations governing opening
times. In the case of countries with regional
or local regulations, exceptions for smaller
retailers or for different months of the year, the
country’s most representative regulations have
been taken.
As a step prior to constructing the indicator,
six variables have been defi ned which attempt
to capture the time during which establishments
are not allowed to open. Thus, the fi rst variable
(opening time) consists of the time from which
establishments may open. As there may be
differences between the different days of the
week, this variable is calculated as the weekly
average of the opening time,143 meaning that
The OECD indicators only take into account whether opening 141
hours are regulated or not; accordingly, it is not possible to
qualify the degree of regulation borne by each country in this
respect. See, for example, Wölfl et al. (2009).
With the exception of Slovenia, owing to a lack of information.142
That is to say, the regulations governing each of the seven days 143
of the week, including Sundays (even though opening is not
a possibility every Sunday), are averaged out. If there are no
regulations, the value 0 is assigned to the opening time, whereas,
if opening is not possible on Sundays, the opening time is 24. If
there are no specifi c regulations for Sundays, but there are for
the other days of the week, then these regulations are applied
to Sundays. If the regulations for Mondays and Fridays differ
from those for Saturdays, the same regulations are considered to
govern Sundays as they do Saturdays. Moreover, it is taken into
account for Cyprus that fi ve months of the year have a winter
timetable and seven months a summer timetable.
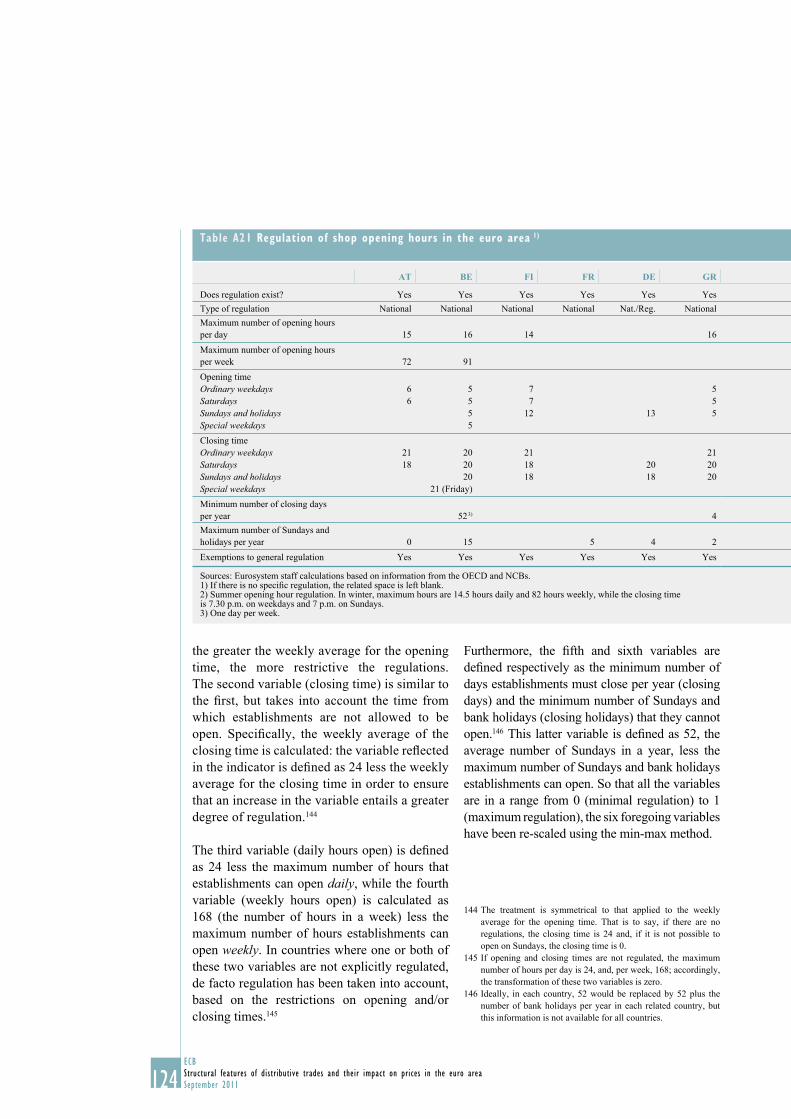
124ECB
Structural features of distributive trades and their impact on prices in the euro area
September 2011
the greater the weekly average for the opening
time, the more restrictive the regulations.
The second variable (closing time) is similar to
the fi rst, but takes into account the time from
which establishments are not allowed to be
open. Specifi cally, the weekly average of the
closing time is calculated: the variable refl ected
in the indicator is defi ned as 24 less the weekly
average for the closing time in order to ensure
that an increase in the variable entails a greater
degree of regulation.144
The third variable (daily hours open) is defi ned
as 24 less the maximum number of hours that
establishments can open daily, while the fourth
variable (weekly hours open) is calculated as
168 (the number of hours in a week) less the
maximum number of hours establishments can
open weekly. In countries where one or both of
these two variables are not explicitly regulated,
de facto regulation has been taken into account,
based on the restrictions on opening and/or
closing times.145
Furthermore, the fi fth and sixth variables are
defi ned respectively as the minimum number of
days establishments must close per year (closing
days) and the minimum number of Sundays and
bank holidays (closing holidays) that they cannot
open.146 This latter variable is defi ned as 52, the
average number of Sundays in a year, less the
maximum number of Sundays and bank holidays
establishments can open. So that all the variables
are in a range from 0 (minimal regulation) to 1
(maximum regulation), the six foregoing variables
have been re-scaled using the min-max method.
The treatment is symmetrical to that applied to the weekly 144
average for the opening time. That is to say, if there are no
regulations, the closing time is 24 and, if it is not possible to
open on Sundays, the closing time is 0.
If opening and closing times are not regulated, the maximum 145
number of hours per day is 24, and, per week, 168; accordingly,
the transformation of these two variables is zero.
Ideally, in each country, 52 would be replaced by 52 plus the 146
number of bank holidays per year in each related country, but
this information is not available for all countries.
Table A21 Regulation of shop opening hours in the euro area 1)
AT BE FI FR DE GR
Does regulation exist? Yes Yes Yes Yes Yes Yes
Type of regulation National National National National Nat./Reg. National
Maximum number of opening hours
per day 15 16 14 16
Maximum number of opening hours
per week 72 91
Opening time
Ordinary weekdays 6 5 7 5
Saturdays 6 5 7 5
Sundays and holidays 5 12 13 5
Special weekdays 5
Closing time
Ordinary weekdays 21 20 21 21
Saturdays 18 20 18 20 20
Sundays and holidays 20 18 18 20
Special weekdays 21 (Friday)
Minimum number of closing days
per year 52 3) 4
Maximum number of Sundays and
holidays per year 0 15 5 4 2
Exemptions to general regulation Yes Yes Yes Yes Yes Yes
Sources: Eurosystem staff calculations based on information from the OECD and NCBs.1) If there is no specifi c regulation, the related space is left blank. 2) Summer opening hour regulation. In winter, maximum hours are 14.5 hours daily and 82 hours weekly, while the closing time is 7.30 p.m. on weekdays and 7 p.m. on Sundays. 3) One day per week.
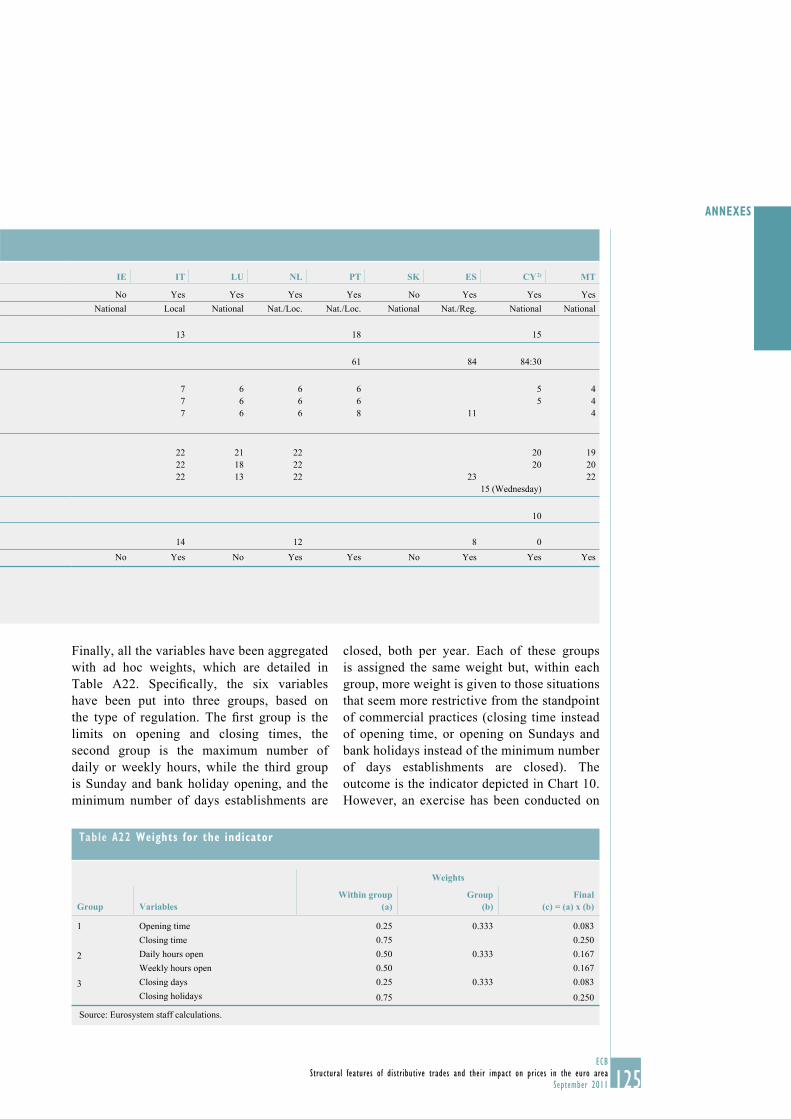
125ECB
Structural features of distributive trades and their impact on prices in the euro area
September 2011
ANNEXES
Finally, all the variables have been aggregated
with ad hoc weights, which are detailed in
Table A22. Specifi cally, the six variables
have been put into three groups, based on
the type of regulation. The fi rst group is the
limits on opening and closing times, the
second group is the maximum number of
daily or weekly hours, while the third group
is Sunday and bank holiday opening, and the
minimum number of days establishments are
closed, both per year. Each of these groups
is assigned the same weight but, within each
group, more weight is given to those situations
that seem more restrictive from the standpoint
of commercial practices (closing time instead
of opening time, or opening on Sundays and
bank holidays instead of the minimum number
of days establishments are closed). The
outcome is the indicator depicted in Chart 10.
However, an exercise has been conducted on
IE IT LU NL PT SK ES CY 2) MT
No Yes Yes Yes Yes No Yes Yes Yes
National Local National Nat./Loc. Nat./Loc. National Nat./Reg. National National
13 18 15
61 84 84:30
7 6 6 6 5 4
7 6 6 6 5 4
7 6 6 8 11 4
22 21 22 20 19
22 18 22 20 20
22 13 22 23 22
15 (Wednesday)
10
14 12 8 0
No Yes No Yes Yes No Yes Yes Yes
Table A22 Weights for the indicator
Weights
Group VariablesWithin group
(a)Group
(b)Final
(c) = (a) x (b)
1 Opening time 0.25 0.333 0.083
Closing time 0.75 0.250
2 Daily hours open 0.50 0.333 0.167
Weekly hours open 0.50 0.167
3 Closing days 0.25 0.333 0.083
Closing holidays 0.75 0.250
Source: Eurosystem staff calculations.
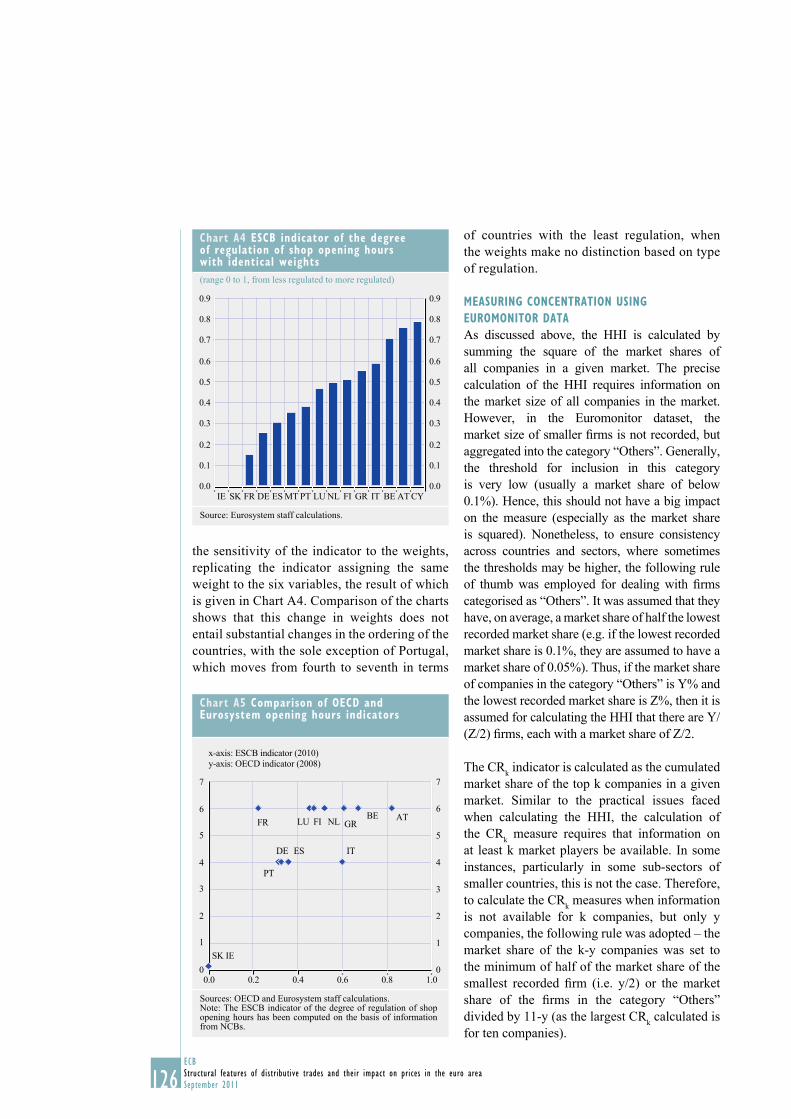
126ECB
Structural features of distributive trades and their impact on prices in the euro area
September 2011
the sensitivity of the indicator to the weights,
replicating the indicator assigning the same
weight to the six variables, the result of which
is given in Chart A4. Comparison of the charts
shows that this change in weights does not
entail substantial changes in the ordering of the
countries, with the sole exception of Portugal,
which moves from fourth to seventh in terms
of countries with the least regulation, when
the weights make no distinction based on type
of regulation.
MEASURING CONCENTRATION USING
EUROMONITOR DATA
As discussed above, the HHI is calculated by
summing the square of the market shares of
all companies in a given market. The precise
calculation of the HHI requires information on
the market size of all companies in the market.
However, in the Euromonitor dataset, the
market size of smaller fi rms is not recorded, but
aggregated into the category “Others”. Generally,
the threshold for inclusion in this category
is very low (usually a market share of below
0.1%). Hence, this should not have a big impact
on the measure (especially as the market share
is squared). Nonetheless, to ensure consistency
across countries and sectors, where sometimes
the thresholds may be higher, the following rule
of thumb was employed for dealing with fi rms
categorised as “Others”. It was assumed that they
have, on average, a market share of half the lowest
recorded market share (e.g. if the lowest recorded
market share is 0.1%, they are assumed to have a
market share of 0.05%). Thus, if the market share
of companies in the category “Others” is Y% and
the lowest recorded market share is Z%, then it is
assumed for calculating the HHI that there are Y/
(Z/2) fi rms, each with a market share of Z/2.
The CRk indicator is calculated as the cumulated
market share of the top k companies in a given
market. Similar to the practical issues faced
when calculating the HHI, the calculation of
the CRk measure requires that information on
at least k market players be available. In some
instances, particularly in some sub-sectors of
smaller countries, this is not the case. Therefore,
to calculate the CRk measures when information
is not available for k companies, but only y
companies, the following rule was adopted – the
market share of the k-y companies was set to
the minimum of half of the market share of the
smallest recorded fi rm (i.e. y/2) or the market
share of the fi rms in the category “Others”
divided by 11-y (as the largest CRk calculated is
for ten companies).
Chart A4 ESCB indicator of the degree of regulation of shop opening hours with identical weights
(range 0 to 1, from less regulated to more regulated)
0.0
0.1
0.2
0.3
0.4
0.5
0.6
0.7
0.8
0.9
0.0
0.1
0.2
0.3
0.4
0.5
0.6
0.7
0.8
0.9
IE SK FR DE ES MT PT LU NL FI GR IT BE AT CY
Source: Eurosystem staff calculations.
Chart A5 Comparison of OECD and Eurosystem opening hours indicators
0
1
2
3
4
5
6
7
0
1
2
3
4
5
6
7
ATBEGRNLFILUFR
ITESDE
PT
SK IE
0.0 0.2 0.4 0.6 0.8 1.0
x-axis: ESCB indicator (2010)
y-axis: OECD indicator (2008)
Sources: OECD and Eurosystem staff calculations.Note: The ESCB indicator of the degree of regulation of shop opening hours has been computed on the basis of information from NCBs.
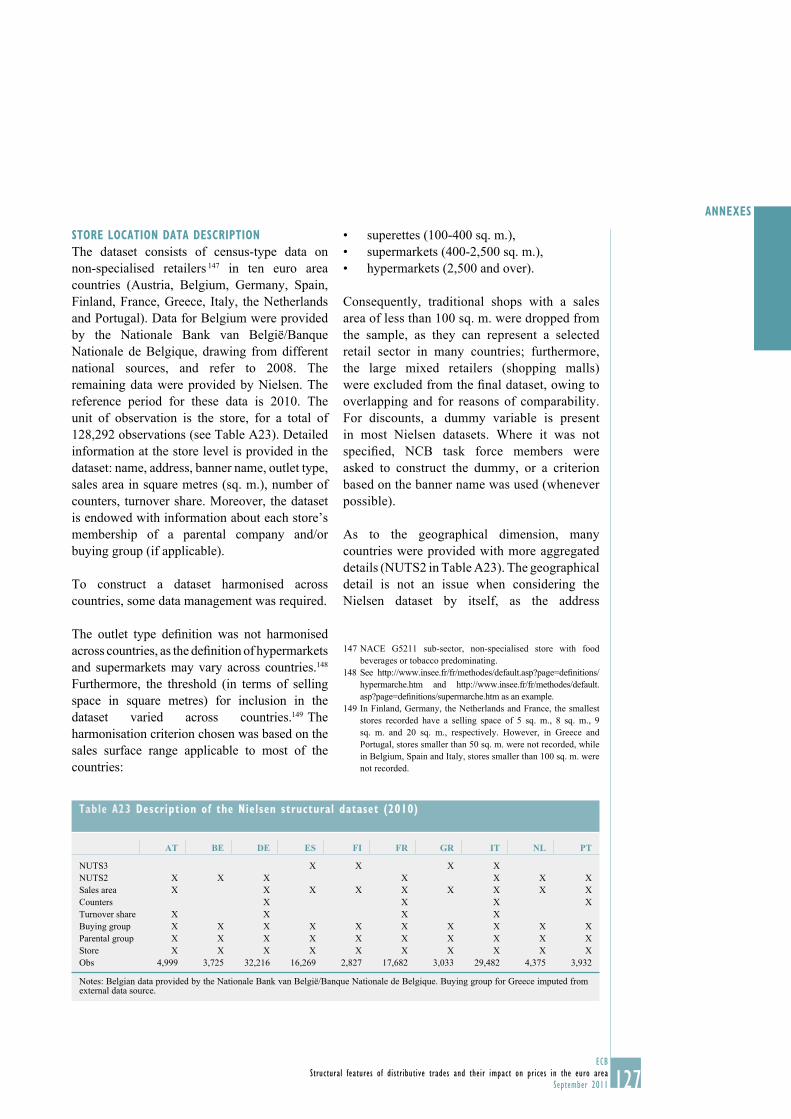
127ECB
Structural features of distributive trades and their impact on prices in the euro area
September 2011
ANNEXES
STORE LOCATION DATA DESCRIPTION
The dataset consists of census-type data on
non-specialised retailers 147 in ten euro area
countries (Austria, Belgium, Germany, Spain,
Finland, France, Greece, Italy, the Netherlands
and Portugal). Data for Belgium were provided
by the Nationale Bank van België/Banque
Nationale de Belgique, drawing from different
national sources, and refer to 2008. The
remaining data were provided by Nielsen. The
reference period for these data is 2010. The
unit of observation is the store, for a total of
128,292 observations (see Table A23). Detailed
information at the store level is provided in the
dataset: name, address, banner name, outlet type,
sales area in square metres (sq. m.), number of
counters, turnover share. Moreover, the dataset
is endowed with information about each store’s
membership of a parental company and/or
buying group (if applicable).
To construct a dataset harmonised across
countries, some data management was required.
The outlet type defi nition was not harmonised
across countries, as the defi nition of hypermarkets
and supermarkets may vary across countries.148
Furthermore, the threshold (in terms of selling
space in square metres) for inclusion in the
dataset varied across countries.149-The
harmonisation criterion chosen was based on the
sales surface range applicable to most of the
countries:
superettes (100-400 sq. m.),•
supermarkets (400-2,500 sq. m.),•
hypermarkets (2,500 and over).•
Consequently, traditional shops with a sales
area of less than 100 sq. m. were dropped from
the sample, as they can represent a selected
retail sector in many countries; furthermore,
the large mixed retailers (shopping malls)
were excluded from the fi nal dataset, owing to
overlapping and for reasons of comparability.
For discounts, a dummy variable is present
in most Nielsen datasets. Where it was not
specifi ed, NCB task force members were
asked to construct the dummy, or a criterion
based on the banner name was used (whenever
possible).
As to the geographical dimension, many
countries were provided with more aggregated
details (NUTS2 in Table A23). The geographical
detail is not an issue when considering the
Nielsen dataset by itself, as the address
NACE G5211 sub-sector, non-specialised store with food 147
beverages or tobacco predominating.
See http://www.insee.fr/fr/methodes/default.asp?page=defi nitions/148
hypermarche.htm and http://www.insee.fr/fr/methodes/default.
asp?page=defi nitions/supermarche.htm as an example.
In Finland, Germany, the Netherlands and France, the smallest 149
stores recorded have a selling space of 5 sq. m., 8 sq. m., 9
sq. m. and 20 sq. m., respectively. However, in Greece and
Portugal, stores smaller than 50 sq. m. were not recorded, while
in Belgium, Spain and Italy, stores smaller than 100 sq. m. were
not recorded.
Table A23 Description of the Nielsen structural dataset (2010)
AT BE DE ES FI FR GR IT NL PT
NUTS3 X X X X
NUTS2 X X X X X X X
Sales area X X X X X X X X X
Counters X X X X
Turnover share X X X X
Buying group X X X X X X X X X X
Parental group X X X X X X X X X X
Store X X X X X X X X X X
Obs 4,999 3,725 32,216 16,269 2,827 17,682 3,033 29,482 4,375 3,932
Notes: Belgian data provided by the Nationale Bank van België/Banque Nationale de Belgique. Buying group for Greece imputed from external data source.
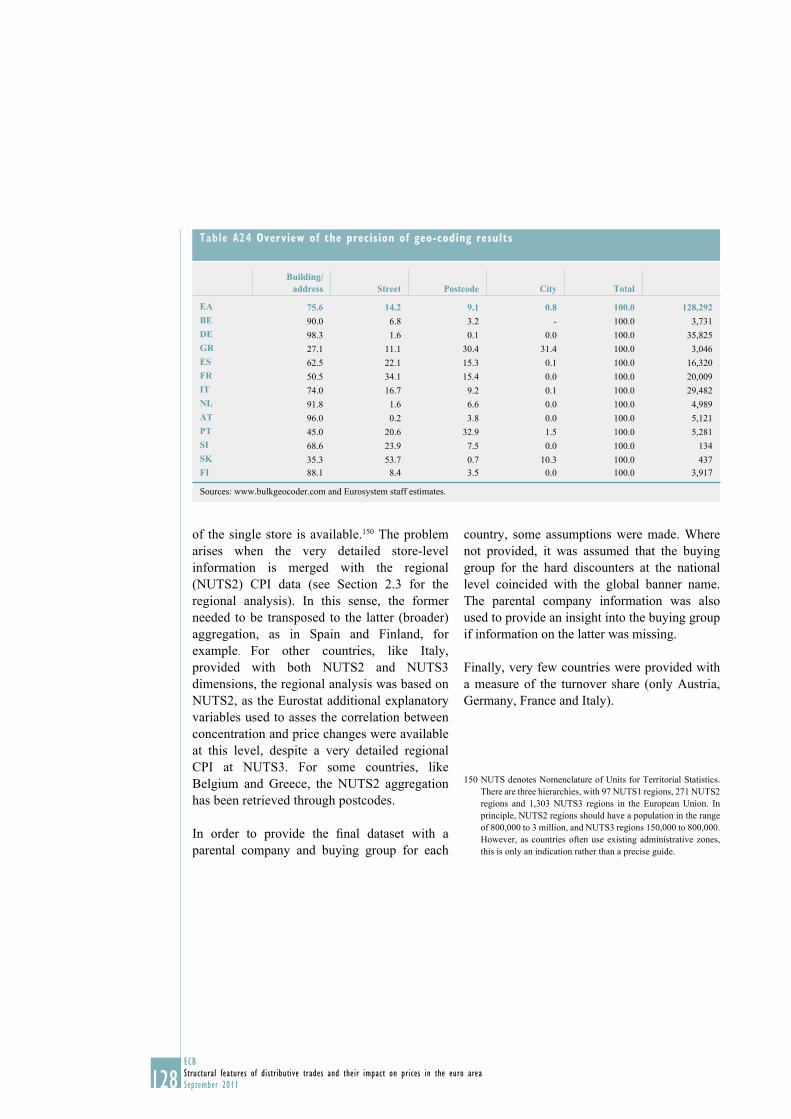
128ECB
Structural features of distributive trades and their impact on prices in the euro area
September 2011
of the single store is available.150 The problem
arises when the very detailed store-level
information is merged with the regional
(NUTS2) CPI data (see Section 2.3 for the
regional analysis). In this sense, the former
needed to be transposed to the latter (broader)
aggregation, as in Spain and Finland, for
example. For other countries, like Italy,
provided with both NUTS2 and NUTS3
dimensions, the regional analysis was based on
NUTS2, as the Eurostat additional explanatory
variables used to asses the correlation between
concentration and price changes were available
at this level, despite a very detailed regional
CPI at NUTS3. For some countries, like
Belgium and Greece, the NUTS2 aggregation
has been retrieved through postcodes.
In order to provide the fi nal dataset with a
parental company and buying group for each
country, some assumptions were made. Where
not provided, it was assumed that the buying
group for the hard discounters at the national
level coincided with the global banner name.
The parental company information was also
used to provide an insight into the buying group
if information on the latter was missing.
Finally, very few countries were provided with
a measure of the turnover share (only Austria,
Germany, France and Italy).
NUTS denotes Nomenclature of Units for Territorial Statistics. 150
There are three hierarchies, with 97 NUTS1 regions, 271 NUTS2
regions and 1,303 NUTS3 regions in the European Union. In
principle, NUTS2 regions should have a population in the range
of 800,000 to 3 million, and NUTS3 regions 150,000 to 800,000.
However, as countries often use existing administrative zones,
this is only an indication rather than a precise guide.
Table A24 Overview of the precision of geo-coding results
Building/ address Street Postcode City Total
EA 75.6 14.2 9.1 0.8 100.0 128,292BE 90.0 6.8 3.2 - 100.0 3,731
DE 98.3 1.6 0.1 0.0 100.0 35,825
GR 27.1 11.1 30.4 31.4 100.0 3,046
ES 62.5 22.1 15.3 0.1 100.0 16,320
FR 50.5 34.1 15.4 0.0 100.0 20,009
IT 74.0 16.7 9.2 0.1 100.0 29,482
NL 91.8 1.6 6.6 0.0 100.0 4,989
AT 96.0 0.2 3.8 0.0 100.0 5,121
PT 45.0 20.6 32.9 1.5 100.0 5,281
SI 68.6 23.9 7.5 0.0 100.0 134
SK 35.3 53.7 0.7 10.3 100.0 437
FI 88.1 8.4 3.5 0.0 100.0 3,917
Sources: www.bulkgeocoder.com and Eurosystem staff estimates.
129ECB
Structural features of distributive trades and their impact on prices in the euro area
September 2011
ANNEXES
Technical Box 1
ALTERNATIVE MEASURES OF PRICE DISPERSION AND CONVERGENCE
This box considers three measures of dispersion and/or convergence: (i) the standard deviation,
(ii) the coeffi cient of variation and (iii) regression to the mean analysis. The fi rst two are referred
to as sigma (σ) convergence measures, while the third is known as beta (β) convergence.
(i) The standard deviation is the classical and most commonly used measure of the degree of
variation or dispersion around the average (mean). A low standard deviation indicates low price
dispersion and the fall in the standard deviation over time is interpreted as convergence. However,
while the advantages of this measure are that it is easy to calculate and understand, is in the same
“dimension” as the underlying variable and is widely used, the disadvantages of it are that it is not
“scale-independent” and is not directly calculable using published PPP data on relative price levels
which are index to reference (e.g. EU15 = 100). To extract the standard deviation of prices using
PPP data, it is necessary to have a measure of the actual price level for the reference “country”
(Eurostat usually publishes PPP data with either EU15 = 100 or EU 27 = 100).
(ii) The coeffi cient of variation is simply the standard deviation of a variable divided by
its average or mean. It is used to correct for scale, but may provide a misleading picture of
convergence depending on how prices are considered. As PPPs are presented as relative price
levels (e.g. EU15 = 100), it is only possible to directly calculate the coeffi cient of variation
(as the relative price levels are effectively demeaned). Similar to the standard deviation, a low
coeffi cient of variation indicates low price dispersion and a fall over time is interpreted as
convergence – although, as discussed below, this may not actually be the case.
(iii) The third measure, using regression to the mean analysis (so-called beta (β) regressions
or beta (β) convergence), does not measure price dispersion per se, only the degree of
convergence or divergence. Beta convergence is estimated using the following equation:
PLcc,tt / PLcc,0 = αtt + βttPLcc,0, where PLcc,tt denotes the price level in a given country at the
time tt, PLcc,0 denotes the price level in the same country in the base period, 0. If β < 0 and is
statistically signifi cant, then beta-convergence is said to take place. It is often used and has intuitive
appeal, but may be biased towards signifi cance. This bias has given rise to an extensive literature,
referred to as the convergence (or Galton’s) fallacy literature – see, for example, Neary (1988),
Boyle and McCarthy (1999), Quah (1993), etc.
Regarding which measure, if any, is best, it turns out that this may depend on the underlying
nature of the data. More specifi cally, it boils down to whether one believes that dispersion and
convergence should be measured in absolute or percentage terms.
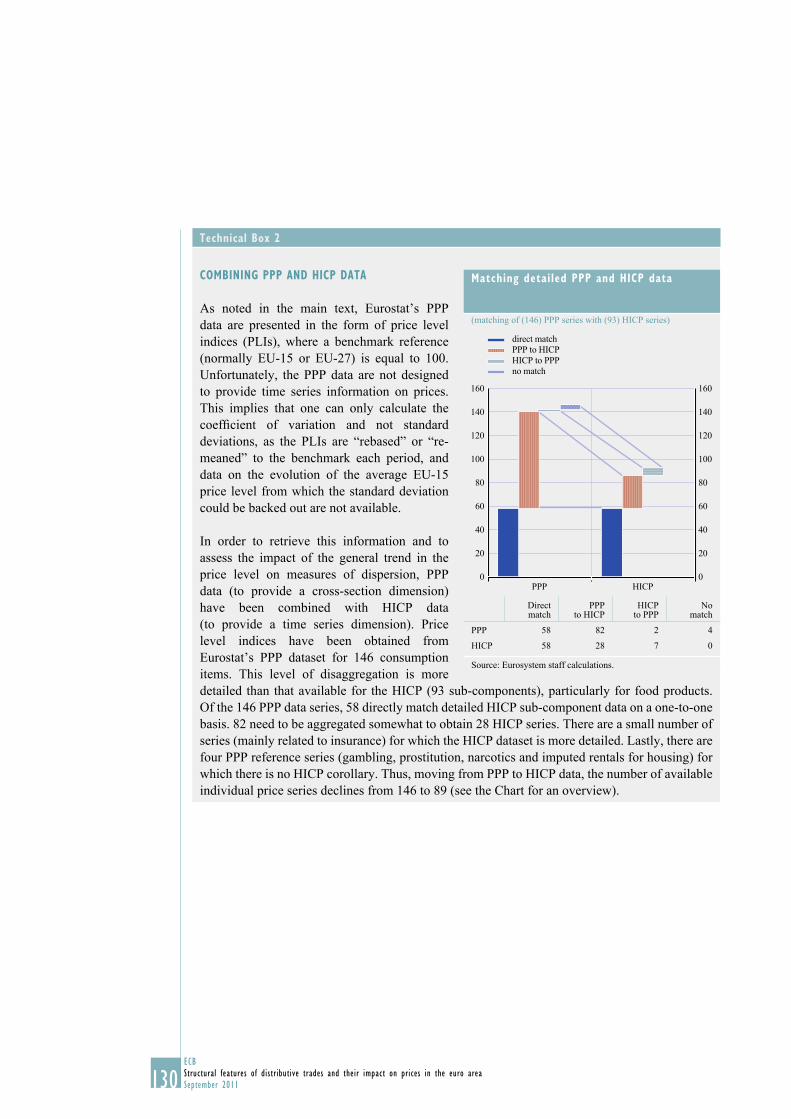
130ECB
Structural features of distributive trades and their impact on prices in the euro area
September 2011
Technical Box 2
COMBINING PPP AND HICP DATA
As noted in the main text, Eurostat’s PPP
data are presented in the form of price level
indices (PLIs), where a benchmark reference
(normally EU-15 or EU-27) is equal to 100.
Unfortunately, the PPP data are not designed
to provide time series information on prices.
This implies that one can only calculate the
coeffi cient of variation and not standard
deviations, as the PLIs are “rebased” or “re-
meaned” to the benchmark each period, and
data on the evolution of the average EU-15
price level from which the standard deviation
could be backed out are not available.
In order to retrieve this information and to
assess the impact of the general trend in the
price level on measures of dispersion, PPP
data (to provide a cross-section dimension)
have been combined with HICP data
(to provide a time series dimension). Price
level indices have been obtained from
Eurostat’s PPP dataset for 146 consumption
items. This level of disaggregation is more
detailed than that available for the HICP (93 sub-components), particularly for food products.
Of the 146 PPP data series, 58 directly match detailed HICP sub-component data on a one-to-one
basis. 82 need to be aggregated somewhat to obtain 28 HICP series. There are a small number of
series (mainly related to insurance) for which the HICP dataset is more detailed. Lastly, there are
four PPP reference series (gambling, prostitution, narcotics and imputed rentals for housing) for
which there is no HICP corollary. Thus, moving from PPP to HICP data, the number of available
individual price series declines from 146 to 89 (see the Chart for an overview).
Matching detailed PPP and HICP data
(matching of (146) PPP series with (93) HICP series)
0
20
40
60
80
100
120
140
160
0
20
40
60
80
100
120
140
160
direct match
PPP to HICP
HICP to PPP
no match
PPP HICP
Direct match
PPP to HICP
HICP to PPP
No match
PPP 58 82 2 4
HICP 58 28 7 0
Source: Eurosystem staff calculations.
131ECB
Structural features of distributive trades and their impact on prices in the euro area
September 2011
REFERENCES
REFERENCES
INTRODUCTION AND MOTIVATION
European Commission (2011b), Consumer Conditions Scoreboard, fi fth edition, Brussels.
European Commission (2010c), Consumer Market Scoreboard, fourth edition, Brussels.
European Commission (2010b), Consumer Market Scoreboard, third edition, Brussels.
European Commission (2010a), “Market monitoring report: Retail – towards more effi cient and
fairer retail services in the internal market for 2020”, Report from the Commission to the European Parliament, the Council, the European Economic and Social Committee and the Committee of the Regions, Brussels, 5 July 2010, COM(2010) 355 fi nal.
European Commission (2009), Consumer Market Scoreboard, second edition, Brussels.
European Commission (2008), Consumer Market Scoreboard, fi rst edition, Brussels.
CHAPTER 1.1 – OVERVIEW OF DISTRIBUTIVE TRADES SECTORS
Andersen Consulting (1992), “Grocery distribution in the 1990s”, (Study conducted for the
Coca-Cola Retailing Research Council Europe), June.
Bălan, C. (2007), “The Alliances of European Retailers and Their Effects in the Field of Marketing
and Supply Chain”, The Romanian Economic Journal, No 25 bis, November, pp. 29-48.
Bartelsman, E. and Doms, M. (2000), “Understanding productivity: lessons from longitudinal
microdata”, Journal of Economic Literature, Vol. 38, pp. 569-594.
Clarke, R. (2001), “Buyer Power and Competition in Food Retailing in the UK”, Briefi ng Notes in Economics, Commemorative Issue, No 50, September/October.
Dean, E.R. and Kunze, K. (1992), “Productivity measurement in service industries”, in Griliches,
Z. (ed.), Output measurement in the Service Sectors, University of Chicago Press.
Dobson Consulting (1999), “Buyer Power and its Impact on Competition in the Food Retail
Distribution Sector of the European Union”, (Report prepared for the European Commission,
DGIV Study Contract No IV98/EDT/078).
Dolado, J.J. and Stucchi, R. (2008), “Do Temporary Contracts Affect TFP? Evidence from Spanish
Manufacturing Firms”, IZA Discussion Paper, No 3832.
European Central Bank (2011), “Total factor productivity and structural patterns in fi rms’ dynamics
for selected euro area countries”, Monthly Bulletin, January.
European Central Bank (2006), “Competition, productivity and prices in the euro area services
sector”, Occasional Paper Series, No 44, April.
132ECB
Structural features of distributive trades and their impact on prices in the euro area
September 2011
European Central Bank (2004), “Measuring and analysing profi t developments in the euro area”,
Monthly Bulletin, January.
Eurofound (2009), “Industrial relations social dialogue and working time: the commerce sector in
Europe – Findings of the European Company Survey 2009”.
European Commission (2011a), “The impact of private labels on the competitiveness of the European
food supply chain”, (Study carried out by the Landbouw-Economisch Instituut (LEI)), Brussels.
European Commission (2010b), “Towards more effi cient and fairer retail services in the internal
market for 2020”, Report from the Commission to the European Parliament, the Council, the European Economic and Social Committee and the Committee of the Regions, Brussels.
European Commission (2010a), “On Retail Services in the Internal Market”, Commission staff working document, Brussels.
Forfás (2008), “The Cost of Running Retail Operations in Ireland”, December.
Foster, L., Haltiwanger, J. and Krizan, C.J. (2002), “The link between aggregate and micro
productivity growth: evidence from retail trade”, NBER Working Paper Series, No 9120,
August.
Gollin, D. (2002), “Getting Income Shares Right”, Journal of Political Economy, Vol. 110, No 2,
pp. 458-474.
Inklaar, R. and Timmer, M.P. (2008), “GGDC Productivity Level Database: International
Comparisons of Output, Inputs and Productivity at the Industry Level”, Groningen Growth and Development Centre Research Memorandum, GD-104, September.
Jarvis, V. and Prais, S.J. (1989), “Two Nations of Shopkeepers: Training for Retailing in France
and Britain”, National Institute Economic Review, May.
Leibtag, E., Barker, C. and Dutko, P. (2010), “How Much Lower Are Prices at Discount Stores?
An Examination of Retail Food Prices”, Economic Research Report, United States Department
of Agriculture, No 105, October.
Mason, G., Osborne, M. and Voss-Dahm, D. (2007), “Labour market outcomes in different national
settings: UK-German comparisons in retailing”, (Paper presented at the IWPLMS conference),
July.
Van Ark, B., McGuckin, R.H. and Spiegelman, M. (2005), The Retail Revolution: Can Europe Match U.S. Productivity Performance?, Conference Board, March.
McKinsey and Company (2005), “Responding to Discount – A New Business Model for Food
Retailers?”, (A study conducted for the Coca-Cola Retailing Research Council Europe),
Project XI, August.
133ECB
Structural features of distributive trades and their impact on prices in the euro area
September 2011
REFERENCES
O’Mahony, M. and Van Ark, B. (eds.) (2003), “EU Productivity and Competitiveness: An Industry
Perspective. Can Europe Resume the Catching-up Process?”, Offi ce for Offi cial Publications of the European Communities, Luxembourg.
Oi, W. (1992), “Productivity in the Distributive Trades: The Shopper and Economies of Massed
Reserves”, in Griliches, Z. (ed.), Output Measurement in the Service Sectors, University of
Chicago Press.
Steenkamp, J., Geyskens, I., Gielens, K. and Koll, O. (2004), “A global study into drivers of private
label success”, (Report commissioned by AIM (The European Brands Association); cited in
report as AIM Study).
Triplett, J.E. and Bosworth, B.P. (2001), “Productivity in the Services Sector”, in Stern, D.M. (ed.),
Services in the International Economy, Ann Arbor, University of Michigan Press.
UK Competition Commission (2007), “Working paper on the competitive effects of own-label
goods”, (Compiled for the Groceries Market Inquiry), April.
Worthington, S. (2008), “Retailers’ entry into the provision of fi nancial services: the case
for and against”, International Journal of Financial Services Management, Vol. 3, No 3,
pp. 243-254.
BOX ON ONLINE AND CROSS-BORDER TRADE
European Commission (2009), “Communication to the European Parliament, the Council, the
European Economic and Social Committee and the Committee of the Regions on cross-border
business-to-consumer e-commerce in the EU”, Brussels, COM(2009) 557 fi nal, October.
European Commission (2009), “The Consumer Markets Scoreboard: Third edition”, Brussels.
European Commission (2003), “Qualitative Study on Cross-border Shopping in 28 European
Countries”, Brussels.
Kuneva, M. (2009), “Barriers to eCommerce in the EU – Presentation of new eCommerce Report”
(Speech delivered to the European Parliament; SPEECH/09/91), 5 March.
Leal, A., López-Laborda, J. and Rodrigo, F. (2010), “Cross-border shopping: a survey”,
in International Advances in Economic Research, Vol. 16, No 2, DOI: 10.1007/s11294-010-
9258-z, pp. 135-148.
Lünnemann, P. and Wintr, L. (2011), “Price Stickiness in the US and Europe Revisited: Evidence
from Internet Prices”, Oxford Bulletin of Economics and Statistics, forthcoming.
Nielsen (2010), “Global Trends in Online Shopping – A Nielsen Global Consumer Report”, June.
Offi ce of the Revenue Commissioners and Central Statistics Offi ce (2009), “The Implications of
Cross Border Shopping for the Irish Exchequer”, February.
134ECB
Structural features of distributive trades and their impact on prices in the euro area
September 2011
Public Policy Exchange, found at http://publicpolicyexchange.co.uk/events/BB22-PPE2.php
Seybert, H. and Lööf, A. (2010), “Internet usage in 2010”, Eurostat: Data in focus, No 50/2010.
Xing, X (2010), “Can price dispersion be persistent in the Internet markets?”, Applied Economics,
Vol. 42, No 15, iFirst, June, pp. 1927-1940.
BOX: STATISTICS
Covas, F. and Santos Silva, J. (1999), “Outlet substitution bias”, Economic Bulletin, Banco de
Portugal, September.
Greenlees, J. and McClelland, R. (2008), “New Evidence on Outlet Substitution Effects in Consumer
Price Index Data”, Working Paper Series, No 421, U.S. Bureau of Labor Statistics.
Hoffmann, J. (1998), “Problems of Infl ation Measurement in Germany”, Discussion Paper, 1/98,
Economic Research Group of the Deutsche Bundesbank.
Leibtag, E., Barker, C. and Dutko, P. (2010), “How Much Lower Are Prices at Discount Stores?
An Examination of Retail Food Prices”, Economic Research Report, No 105, United States
Department of Agriculture, October.
Lequiller, F. (1997), “Does the French Consumer Price Index Overstate Infl ation?”, Série des documents de travail de la Direction des Études et Synthèses Économiques, Institut National de
la Statistique et des Études Économiques G 9714, August.
Linz, S. (2009), “Weighting of Outlet-types and Regions – a new Weighting System for the German
Consumer Price Index” (Paper prepared for the 11th Meeting of the International Working
Group On Price Indices), Ottawa Group.
Nielsen (2007), “The Hard Discounter Report: An Overview of Aldi and Lidl in Europe”, Consumer Insight Report, June.
Reinsdorf, M. (1993), “The Effect of Outlet Price Differentials on the US Consumer Price Index”,
in Foss, M., Manser, M. and Young, A. (eds.), Price Measurements and Their Uses, University
of Chicago Press, pp. 227-258.
CHAPTER 1.2 (REGULATION)
Baugnet, V., Cornille, D., Dhyne, E. and Robert, B. (2009), “Regulation and competition in the
distribution sector in Belgium”, Economic Review, Nationale Bank van België/Banque Nationale
de Belgique, September, pp. 35-61.
Biscourp, P., Boutin, X. and Vergé, T. (2008), “The Effects of Retail Regulations on Prices:
Evidence from the Loi Galland”, Série des documents de travail de la Direction des Études et Synthèses Économiques, Institut National de la Statistique et des Études Économiques,
G 2008/02, June.
135ECB
Structural features of distributive trades and their impact on prices in the euro area
September 2011
REFERENCES
Burda, M. and Weil, P. (2005), Blue Laws, October, mimeo.
Collins, A., Burt, S. and Oustapassidis, K. (2001), “Below-cost legislation and retail conduct:
evidence from the Republic of Ireland”, British Food Journal, Vol. 103, No 9, pp. 607-622.
European Commission (2010), “Towards more effi cient and fairer retail services in the internal
market for 2020”, Retail market monitoring report, COM(2010) 355 fi nal, July.
Matea, M.L. and Mora, J.S. (2009), “Developments in retail trade regulation in Spain and their
macroeconomic implications”, Working Paper Series, No 908, Banco de España, May.
Piette, C. and Van der Linden, J. (2009), “Economic effects of the Services Directive in Belgium: an
ex ante assessment”, Nationale Bank van België/Banque Nationale de Belgique, (Study carried
out in collaboration with the Federal Planning Bureau).
Skuterud, M. (2005), “The impact of Sunday shopping on employment and hours of work in the
retail industry: Evidence from Canada”, European Economic Review, No 49, pp. 1953-1978.
Wölfl , A., Wanner, I., Kozluk, T. and Nicoletti, G. (2009), “Ten Years of Product Market Reform
in OECD Countries – Insights from a Revised PMR Indicator”, OECD Economics Department Working Paper Series, No 695, April.
CHAPTER 1.3 (COMPETITION)
Felet, A. and Moiloa, T. (2009), “The use of profi tability analysis by competition authorities”,
(Paper for the Fourth Annual Competition Commission, Competition Tribunal and Mandela
Institute Conference on Competition Law, Economics and Policy in South Africa), 2 September
2009.
Baugnet, V., Cornille, D., Dhyne, E. and Robert, B. (2009), “Regulation and competition in the
distribution sector in Belgium”, Economic Review, Nationale Bank van België/Banque Nationale
de Belgique, September, pp. 35-61.
European Commission (2010), “On Retail Services in the Internal Market”, (Commission staff
working document accompanying the Report on Retail Market Monitoring entitled “Towards
more effi cient and fairer retail services in the Internal Market for 2020”), Brussels, COM(2010)
355 fi nal, July.
Mills, G. (2003), “Buyer Power of Supermarkets”, Agenda, Vol. 10, No 2, pp. 145-162.
Myburgh, A., Knight, S. and Sheik, F. (2007), “Geographic market defi nition where a national
pricing policy is applied”, Genesis Report.
Nakamura, A.O., Nakamura, E. and Nakamura, L.I. (2011), “Price dynamics, retail chains and
infl ation measurement”, Journal of Econometrics, Vol. 161, Issue 1, pp. 47-55.
Sloot, L.M. and Verhoef, P.C. (2008), “The Impact of Brand Delisting on Store Switching and
Brand Switching Intentions”, Journal of Retailing, Vol. 84, No 3, pp. 281-296.
136ECB
Structural features of distributive trades and their impact on prices in the euro area
September 2011
BOX – DISTRIBUTIVE TRADES IN THE NEW MEMBER STATES
Kearney, A.T. (2004, 2007 and 2010), “Global Retail Development Index”.
Bukeviciute, L., Dierx, A. and Ilkovitz, F. (2009), “The Functioning of the Food Supply Chain and
Its Effect on Food Prices in the European Union”, European Commission, European Economy,
Occasional Paper 47, May.
Deloitte (2008), “Why is the Central European Consumer Goods and Retail Sector So Interesting?
A Private Equity Perspective”.
Dries, L., Reardon, T. and Swinnen, J. (2004), “The Rapid Rise of Supermarkets in Central and
Eastern Europe: Implications for the Agrifood Sector and Rural Development”, Development Policy Review, Vol. 22, Issue 5.
Podpiera, J. and Raková, M. (2008), “The Price Effects of an Emerging Retail Market”, Working Paper Series, No 2008/6, Česká národní banka, June.
CHAPTER 2.1 – IMPACT ON PRICE LEVELS
Andersson, M., Masuch, K. and Schiffbauer, M. (2009), “Determinants of infl ation and price level
differentials across the euro area countries”, Working Paper Series, No 1129, ECB, December.
Bergin, P.R. and Glick, R. (2006), “Global Price Dispersion: Are Prices Converging or
Diverging?”, (Paper prepared for the Journal of International Money and Finance – Santa Cruz
Center for International Economics Conference on “Financial and Commercial Integrations”),
September 29-30.
Berka, M. and Devereux, M. (2010), “What determines European real exchange rates?”, NBER Working Paper Series, No 15753, February.
Deutsche Bundesbank (2009), “Price convergence in the euro area”, Monthly Report, March.
Crucini, M., Telmer, C. and Zachariadis, M. (2005), “Price Dispersion: The role of Borders,
Distance, and Location”, (Unpublished manuscript).
Dresdner Kleinwort Benson Research (2000), “European Economics For Investors: DKBR Pricing
Survey 2000”, 22 September.
Engel, C. and Rogers, J. (1996), “How wide is the border”, American Economic Review, Vol. 86,
pp. 1112-1125.
Eurostat (2010), “Price levels for food, beverages and tobacco across the European market differ
signifi cantly: Comparative price levels in 37 European countries for 2009”, Statistics in Focus,
30/2010, 28 June.
Eurostat (2006), “EUROSTAT − OECD Methodological manual on purchasing power parities:
2005 Edition”.
137ECB
Structural features of distributive trades and their impact on prices in the euro area
September 2011
REFERENCES
Faber, R.P. and Stokman, A.C.J. (2009), “A Short History of Price Level Convergence in Europe”,
Journal of Money, Credit and Banking, Vol. 41, Nos 2-3, March-April.
Francois, J., Manchin, M. and Norberg, H. (2008), “Distribution services and differential producer
and consumer price impacts of trade”, September.
Hoffmeister, W. (2009), “Barriers to retail competition and prices: evidence from Spain”, Oxford Economic Papers, Vol. 62, Issue 2, pp. 395-416.
Kotilainen, M., Koski, H., Mankinen, R. and Rantala, O. (2010), “Price formation and market functionality
of foodstuffs”, Discussion Paper, No 1209, The Research Institute of the Finnish Economy.
Matea, M.L. and Mora, J.S. (2009), “Developments in retail trade regulation in Spain and their
macroeconomic implications”, Working Paper Series, No 908, Banco de España, May.
Parsley, D.C. and Wei, S.-J. (2001), “Explaining the Border Effect: The Role of Exchange Rate
Variability, Shipping Costs, and Geography”, Journal of International Economics, Vol. 55,
No 1, pp. 87-105.
Rantala, O. (2007), “Competition in the Finnish private service sectors in international comparison”,
Discussion Paper, No 1069, The Research Institute of the Finnish Economy.
European Commission (2010), “Market monitoring report: Retail –towards more effi cient and fairer
retail services in the internal market for 2020”, Report from the Commission to the European Parliament, the Council, the European Economic and Social Committee and the Committee of the Regions, Brussels, 5 July 2010, COM(2010) 355 fi nal.
Ratfai, A. and Reiff, A. (2010), “The Geography of Consumer Prices”, 8 February, mimeo.
Schivardi, F. and Viviano, E. (2010), “Entry barriers in retail trade”, The Economic Journal, DOI:
10.1111/j.1468-0297.2009.02348.x.
Sturm, J.E., Fritsche, U., Graff, M., Lamla, M., Lein, S., Nitsch, V., Liechti, D. and Tri, D. (2009),
“The euro and prices: changeover-related infl ation and price convergence in the euro area”,
European Commission Economic Papers, No 381, June.
CHAPTER 2.2.1 – IMPACT OF STRUCTURAL FEATURES ON PRICE-SETTING BEHAVIOUR: EVIDENCE
FROM IPN
Baudry, L., Le Bihan, H., Sevestre, P. and Tarrieu, S. (2004), “Price rigidity: Evidence from the
French CPI micro-data”, Working Paper Series, No 384, ECB, August.
Dhyne, E., Koniecny, J., Rumler, F. and Sevestre, P. (2009), “Price rigidity in the euro area – An
assessment”, European Economy Economic Papers, No 380, May.
Dhyne, E., Álvarez, L.J., Le Bihan, H., Veronses, G., Dias, D., Hoffmann, J., Jonker, N.,
Lünnemann, P., Rumler, F. and Vilmunen, J. (2006), Price changes in the Euro Area and
138ECB
Structural features of distributive trades and their impact on prices in the euro area
September 2011
the United States: Some facts from Individual Consumer Price Data, Journal of Economic Perspectives, Vol. 20, No 2, Spring 2006, pp. 171-192.
Dias, M., Dias, D.A., Neves, P.D. (2004), “Stylised features of price setting behaviour in Portugal:
1992-2001”, Working Paper Series, No 332, ECB, April.
Jonker, N., Blijenberg, H. and Folkerstma, C. (2004), “An empirical analysis of price setting
behaviour in the Netherlands in the period 1998-2003 using micro data”, Working Paper Series,
No 413, ECB, November.
Lünnemann, P. and Wintr, L. (2011), “Price Stickiness in the US and Europe Revisited: Evidence
from Internet Prices”, Oxford Bulletin of Economics and Statistics, forthcoming.
Shankar, V. and Bolton, R. (2004), “An Empirical Analysis of Determinants of Retailer Pricing
Strategy”, Marketing Science, Vol. 23, No 1, pp. 28-49.
Veronese, G., Fabiani, S., Gattulli, A. and Sabbatini, R. (2005), “Consumer price behaviour in Italy:
evidence from micro CPI data”, Working Paper Series, No 449, ECB, March.
CHAPTER 2.2.2 – IMPACT FROM COMPETITION – EVIDENCE FROM WDN
Álvarez, L.J. and Hernando, I. (2007a), “Competition and Price Adjustment in the Euro Area”,
in Fabiani, S., Loupias, C., Martins, F. and Sabbatini, R. (eds.), Pricing Decisions in the Euro Area: How Firms Set Prices and Why, Oxford University Press.
Álvarez, L.J. and Hernando, I. (2007b), “The Price Setting Behaviour of Spanish Firms: Evidence
from Survey Data”, in Fabiani, S., Loupias, C., Martins, F. and Sabbatini, R. (eds.), Pricing Decisions in the Euro Area: How Firms Set Prices and Why, Oxford University Press.
Druant, M., Fabiani, S., Kezdi, G., Lamo, A., Martins, F. and Sabbatini, R. (2009), “How are fi rms’
wages and prices linked: survey evidence in Europe”, Working Paper Series, No 1084, ECB,
August.
Eichenbaum, M., Jaimovich, N. and Rebelo, S. (2008), “Reference Prices and Nominal Rigidities”,
NBER Working Paper Series, No 13829.
Fabiani, S., Gatulli, A. and Sabbatini, R. (2007), “The Pricing Behavior of Italian Firms.
New Survey Evidence on Price Stickiness”, in Fabiani, S., Loupias, C., Martins, F. and
Sabbatini, R. (eds.), Pricing Decisions in the Euro Area: How Firms Set Prices and Why, Oxford
University Press.
CHAPTER 2.3 – RETAIL SECTOR CONCENTRATION AND INFLATION IN THE EURO AREA
Barros, P.P., Brito, D. and De Lucena, D. (2006), “Mergers in the food retailing sector: An empirical
investigation”, European Economic Review, Vol. 50, No 2, pp. 447-468.
139ECB
Structural features of distributive trades and their impact on prices in the euro area
September 2011
REFERENCES
Benabou, R. (1992), “Infl ation and markups: Theories and evidence from the retail trade sector”,
European Economic Review, Vol. 36, Nos 2-3, pp. 566-574.
Bresnahan, T.F. and Reiss, P.C. (1991), “Entry and competition in concentrated markets”,
The Journal of Political Economy, Vol. 99, No 5, pp. 977-1009.
Cavelaars, P. (2003), “Does Competition Enhancement Have Permanent Infl ation Effects?”, Kyklos,
Vol. 56, No 1, pp. 69-94.
Ciapanna, E. and Colonna, F. (2011), “The effect of retail sector concentration on prices and SME
performance in Italy”, mimeo.
Clarke, R. and Davies, S.W. (1982), “Market Structure and Price-Cost Margins”, Economica,
Vol. 49, No 195, pp. 277-287.
Cotterill, R.W. (1986), “Market Power in the Retail Food Industry: Evidence from Vermont”,
Review of Economics and Statistics, Vol. 68, No 3, pp. 379-386.
Dobson, P.W. and Waterson, M. (1997), “Countervailing Power and Consumer Prices”,
The Economic Journal, Vol. 107, Issue 441, pp. 418-430.
Hausman, J.A. and Sidak, G. (2007), “Evaluating Market Power Using Competitive Benchmark
Prices Rather than the Hirschman-Herfi ndahl Index”, Antitrust Law Journal, Vol. 74, No 2,
pp. 387-407.
Jonsson, M. (2007), “Increased competition and infl ation”, Riksbank Economic Review, 2/2007.
Neiss, K. (2001), “The markup and infl ation: evidence in OECD countries”, Canadian Journal of Economics, Vol. 34, No 2, pp. 570-587.
Nevo, A. (1998), “Identifi cation of the oligopoly solution concept in a differentiated-products
industry”, Economics Letters, Vol. 59, No 3, pp. 391-395.
Offi ce of Fair Trading (2007), “Productivity and competition: An OFT perspective on the
productivity debate”, United Kingdom, January, OFT887.
PricewaterhouseCoopers (2000), “Consumer nation: Retailing 2010. Global Retailing in a
Consumer-Centric Universe”.
Rodrigues, J. (2006), “Buyer power and pass-through of large retailing groups in the Portuguese
food sector”, Autoridade da Concorrência Working Paper Series, No 14, September.
Przybyla, M. and Roma, M. (2005), “Does product market competition reduce infl ation? Evidence
from EU countries and sectors”, Working Paper Series, No 453, ECB, March.
Sbordone, A.M. (2009), “Globalization and Infl ation Dynamics: the Impact of Increased
Competition”, in Gali, J. and Gertler, M., International Dimensions of Monetary Policy,
University of Chicago Press.
140ECB
Structural features of distributive trades and their impact on prices in the euro area
September 2011
Scitovsky, T. (1978), “Market Power and Infl ation”, Economica, Vol. 45, No 179, pp. 221-233.
Viviano, E. (2008), “Entry regulations and labor market outcomes: evidence from the Italian retail
trade sector”, Labour Economics, Vol. 15(6), pp. 1200-1222.
Viviano, E., Aimone Gigio, L., Ciapanna, E., Colonna, F., Lagna, F. and Santioni, R. (2011),
“Il settore alimentare: problematiche dell’industria e della grande distribuzione organizzata”,
Banca d’Italia, mimeo.
BOX 6 – DSGE ANALYSIS
Badinger, H. (2007), “Has the EU’s Single Market Programme Fostered Competition? Testing
A Decrease in Mark-up Ratios in EU industries”, Oxford Bulletin of Economics and Statistics,
Vol. 69, No 4, pp. 497-518.
Bayoumi, T., Laxton, D. and Pesenti, P. (2004), “Benefi ts and spillovers of greater competition in
Europe: a macroeconomic assessment”, Working Paper Series, No 341, ECB, April.
Christopoulou, R. and Vermeulen, P. (2008), “Markups in the euro area and the US over the period
1981-2004: a comparison of 50 sectors”, Working Paper Series, No 856, ECB, January.
Everaert, L. and Schule, W. (2008), “Why It Pays to Synchronize Structural Reforms in the Euro
Area Across Markets and Countries”, International Monetary Fund Staff Papers, Vol. 55,
No 2.
Faruqee, H., Laxton, D. and Muir, D. (2007), “Smooth Landing or Crash? Model-Based Scenarios
of Global Current Account Rebalancing”, in Clarida, R. (ed.), G7 Current Account Imbalances: Sustainability and Adjustment, University of Chicago Press.
Gomes, S., Jacquinot, P., Mohr, M. and Pisani, M. (2011), “Structural reforms and macroeconomic
performance in the euro area countries: a model-based assessment”, Working Paper Series,
No 1323, ECB, April.
Gomes, S., Jacquinot, P. and Pisani, M. (2010), “The EAGLE: a model for policy analysis of
macroeconomic interdependence in the euro area”, Working Paper Series, No 1195, ECB, May.
Jean, S. and Nicoletti, G. (2002), “Product Market Regulation and Wage Premia in Europe and
North America: An Empirical Investigation”, OECD Economics Department Working Paper Series, No 318, Paris.
Oliveira Martins, J., Scarpetta, S. and Pilat, D. (1996), “Mark-up Ratios in Manufacturing Industries –
Estimates for 14 OECD Countries”, OECD Economics Department Working Paper Series,
No 162, Paris.
Oliveira Martins, J. and Scarpetta, S. (1999), “The Levels and Cyclical Behaviour of Mark-ups
Across Countries and Market Structures”, OECD Economics Department Working Paper Series, No 213, Paris.
141ECB
Structural features of distributive trades and their impact on prices in the euro area
September 2011
REFERENCES
CHAPTER 2.4 – RETAIL TRADES AND PASS-THROUGH
Álvarez, L.J. and Hernando, I. (2007a), “Competition and Price Adjustment in the Euro Area”,
in Fabiani, S., Loupias, C., Martins, F. and Sabbatini, R. (eds.), Pricing Decisions in the Euro Area: How Firms Set Prices and Why, Oxford University Press.
Anderton, R. (2003), “Extra-euro area manufacturing import prices and exchange rate
pass-through”, Working Paper Series, No 219, ECB, March.
Benedictow, A. and Boug, P. (2010), “Trade liberalisation and import price behaviour: the case of
textiles and wearing apparels”, Statistics Norway, mimeo.
Berck, P., Leibtag, E., Solis, A. and Villas-Boas, S. (2009), “Patterns of pass-through of commodity
price shocks to retail prices”, American Journal of Economics, Vol. 91, No 5, pp. 1456-1461.
Bertola, G., Kwapil, C., Dabusinskas, A., Montornès, J., Hoeberichts, M., Radowski, D. and
Izquierdo, M. (2010), “Price, wage and employment response to shocks: evidence from the
WDN survey”, Working Paper Series, No 1164, ECB, March.
Brambilla, I., Khandelwal, A. and Schott, P. (2010), “China’s experience under the Multi-Fibre
Arrangement (MFA) and the Agreement on Textiles and Clothing (ATC)”, in Feenstra, R. and
Wei, S.-J. (eds.), China’s growing role in world trade, NBER books.
Bukeviciute, L., Dierx, A. and Ilkovitz, F. (2009), “The Functioning of the Food Supply Chain
and Its Effect on Food Prices in the European Union”, European Economy Occasional Paper,
No 47, European Commission, May.
Campa, J.M. and González Minguez, J.M. (2004), “Differences in Exchange Rate Pass-Through in
the Euro Area”, CEPR Working Paper, No 4389.
Clark, T.E. (1995), “Do Producer Prices lead Consumer Prices?”, Economic Review, Federal
Reserve Bank of Kansas City.
Clark, T.E. (1999), “The Responses of Prices at Different Stages of Production to Monetary Policy
Shocks”, The Review of Economics and Statistics, Vol. 83, No 3, pp. 420-433.
Cleeren, K., Dekimpe, M., Gielens, K. and Verboven, F. (2008), “Intra- and inter-format competition
among discounters and supermarkets”, CEPR Discussion Paper, No 6964, September.
Deutsche Bundesbank (2009), “Marked fl uctuations in milk prices: causes and future developments”,
Monthly Report, August.
European Central Bank (2008), “New euro area industrial import price and industrial producer
export price indices”, Box 11, Monthly Bulletin, December.
European Central Bank (2005), “Trade liberalisation and its impact on the euro area textile and
clothing sectors”, Box 5, Monthly Bulletin, October.
142ECB
Structural features of distributive trades and their impact on prices in the euro area
September 2011
Ferrucci, G., Jiménez-Rodriguez, R. and Onorante, L. (2010), “Food price pass-through in the
euro area: The role of asymmetries and non-linearities”, Working Paper Series, No 1168,
ECB, April.
Francois, J., Manchin, M., Norgberg, H. and Spinanger, D. (2007), “Impacts of Textiles and
Clothing sectors liberalisation on prices”, (Report prepared for the European Commission).
Gaulier, G., Lahreche-Revil, A. and Mejean, I. (2006), “Exchange-Rate Pass-Through at the Product
Level”, CEPII Working Paper, No 2006-02.
Goldberg, L. and Campa, J.M. (2006), “Distribution Margins, Imported Inputs, and the Insensitivity
of the CPI to Exchange Rates”, mimeo.
Hahn, E. (2003), “Pass-through of external shocks to euro area infl ation”, Working Paper Series,
No 243, ECB, July.
Hall, S., Walsh, M. and Yates, A. (2000), “How do UK companies set prices”, Oxford Economic Papers, No 52, pp. 425-446.
Francois, J., Manchin, M., Norberg, H. and Spinanger, D. (2007), “Impacts of textiles and clothing
sectors liberalisation on prices”, Final Report, Commission of the European Union, Directorate-
General for Trade, 18 April.
Francois, J., Manchin, M. and Norberg, H. (2008), “Distribution services and differential producer
and consumer price impacts of trade”, (Paper presented at the 2008 European Trade Study
Group annual meetings, Warsaw).
International Monetary Fund (2008), “Coping with High Commodity Prices”, Regional Economic Outlook: Europe, Chapter II, October, pp. 19-36.
Kowalski, P. and Molnár, M. (2009), “Economic impacts of the phase-out in 2005 of quantitative
restrictions under the agreement on textiles and clothing”, OECD Trade Policy Working Paper Series, No 90, July.
Landau, B. and Skudelny, F. (2009), “Pass-through of external shocks along the pricing chain: a panel
estimation approach for the euro area”, Working Paper Series, No 1104, ECB, November.
Nakamura, A.O., Nakamura, E. and Nakamura, L.I. (2011), “Price dynamics, retail chains and
infl ation measurement”, Journal of Econometrics, Vol. 161, Issue 1, pp. 47-55.
Nordas, H.K. (2004), “The global textile and clothing industry post the Agreement on Textiles and
Clothing”, WTO Discussion Paper Series, No 5.
Pilat, D. (1997), “Regulation and the performance in the distribution sector”, OECD Working Paper Series, No 180.
Vavra, P. and Goodwin, B. (2005), “Analysis of price transmission along the food chain”, OECD Food, Agriculture and Fisheries Working Paper Series, No 3.
143ECB
Structural features of distributive trades and their impact on prices in the euro area
September 2011
REFERENCES
Warmedinger, T. (2004), “Import prices and pricing-to-market effects in the euro area”, Working Paper Series, No 299, ECB, January.
Weiss, C.R. (1995), “Determinants of price fl exibility in oligopolistic markets: evidence from
Austrian manufacturing fi rms”, Journal of Economics and Business, Vol. 47, pp. 423-439.


EURO
PEAN
CEN
TRAL
BAN
K
STRU
CTU
RAL
fEAT
URE
S O
f d
iSTR
iBU
TivE
TRA
dES
SE
PTEm
BER
2011
STrucTural FEaTurES oF D I STr IBuT IVE TraDES anD ThE Ir ImpacT on pr IcES In ThE Euro arEa
SEpTEmBEr 2011
Structural Issues Report