structural change, expanding informality and labour
TRANSCRIPT
Ilya B. Voskoboynikov
STRUCTURAL CHANGE,
EXPANDING INFORMALITY AND
LABOUR PRODUCTIVITY
GROWTH IN RUSSIA
BASIC RESEARCH PROGRAM
WORKING PAPERS
SERIES: ECONOMICS
WP BRP 168/EC/2017
This Working Paper is an output of a research project implemented within NRU HSE’s Annual Thematic Plan for
Basic and Applied Research. Any opinions or claims contained in this Working Paper do not necessarily reflect the
views of HSE

Ilya B. Voskoboynikov1
STRUCTURAL CHANGE, EXPANDING INFORMALITY AND
LABOUR PRODUCTIVITY GROWTH IN RUSSIA
Recent decades have been years of intensive growth, structural change and expanding informality for
many developing and emerging economies. However, in exploring the relationship between structural
change and productivity growth, most empirical studies ignored informality. This paper explores how
structural change in the Russian economy 1995–2012 affects aggregate labour productivity growth, taking
into account the informal sector. Using a newly developed dataset for 34 industries and applying three
alternative approaches aggregate labour productivity growth is decomposed into intra-industry and inter-
industry contributions. All three approaches show that the overall contribution of structural change is
growth enhancing, significant, and dumped in time. In turn, labour reallocation between the formal and
informal sectors is growth reducing because of the extension of informal activities with low productivity
levels. At the same time, sectoral labour reallocation effects are found to be highly sensitive to the
methods.
Key words: labour productivity, structural change, informal economy, Russia
JEL: O11, O17, C82, N14
1 E-mail: [email protected]. Permanent address: Russia, 101000, Moscow,
Miasnitskaia st. 20, National Research University Higher School of Economics, Laboratory for
Research in Inflation and Growth

3
1. Introduction
Last two decades were years of intensive growth and structural change in emerging and
developing economies in many regions of the world (Diao, McMillan, and Rodrik 2017). Many of these
economies are also characterized by a sizable informal sector accounting for a substantial share of
employment and value added (Hassan and Schneider 2016). In this context, Vries et al. (2012, 219)
noticed that if formal and informal activities within industries are not split, the estimation of the impact of
structural change on growth may be biased.
In recent years, research has shown an increased interest in the link between informality and
productivity. Restuccia (2013, 93) has assumed that informality is the response of less productive
entrepreneurs to tightening regulations. In turn, informality itself creates economy-wide distortions,
which are harmful to productivity. For example, McKinsey (2006) has pinpointed informality as one of
the main causes of the productivity gap between Brazil and the U.S.2 Marcouiller et al. (1997) identified
informality as the cause of low productivity growth in construction, manufacturing and retailing in
Latin America. Using the example of Mexico Leal Ordóñez (2014) specified three types of
distortions, induced by the informal sector, which are the misallocation of resources towards small
and stagnant plants, distortions in occupational choices and distortions in capital use in informal
establishments. Such distortions made productivity lower in Mexican manufacturing, retail,
wholesale and services (Busso, Maria, and Levy 2012).
However, there is a notable paucity of empirical research focusing specifically on the issue
of what would change our understanding of the impact of structural change on productivity growth,
if labour outflow to the informal sector of the economy is taken into account explicitly. A notable
exception is the paper of Vries et al. (2012), which has shown that expanding informality in India
made the reallocation effect growth reducing, while the shrinking informal sector in Brazil made
the contribution of labour reallocation more sound. Vries et al. (2012) applied a conventional
method of the shift-share analysis for the decomposition of aggregate labour productivity growth
into inter-industry and intra-industry components. The seminal works of Fabricant (1942) and
Denison (1962) pioneered this method. However, there are some weaknesses of it. In particular, De
Avillez (2012) points out to the possible counterintuitive interpretation of the contributions of
industries to structural change, whereas Dumagan (2013) highlights the problem of fixed weights
in this approach, and its dependence on aggregation formulae.
The case of post-transition Russia is remarkable in this context. Kapelyushnikov et al.
(2012) considered informality as one of the outcomes of the shock therapy of early 1990s after the
transition from plan to market, which illustrates the concept of “second best institutions” of Rodrik
(2008). The adaptation of new labour market legislation, based on “first-best” practices of
2 See also (Üngör 2017).

4
developed economies, in combination with weak state enforcement forced firms and workers to
look for alternative forms of adaptation including informality. All this created the pre-conditions for
the expansion of the informal economy, which continues. Although the informal sector smoothed
negative consequences of the shock therapy in Russia, absorbing excessive labour, its consequences
for productivity growth, as Kapelyushnikov et al. (2012) point out, could be harmful for two
reasons.3 First, employment contracts were poorly enforced, so the employees did not have much
incentive to invest in their human capital. Second, the persistence of `obsolete’ jobs hindered the
appearance of the `modern’ ones.
The present paper has three key aims. First, it estimates not only the total contribution, as
de Vries et al. (2012) did, but also the sectoral contributions of labour reallocation to labour
productivity growth for the Russian economy in 1995-2012. Second, it considers for the first time
the impact of expanding informality on labour productivity growth in Russia. For this I develop a
new industry-level data set, which includes variables for output and labour input for the period
spanning from 1995 to 2012, using industry-level series of the Russia KLEMS data base (Timmer
and Voskoboynikov 2016) and splitting them into formal and informal segments.4 Finally, along
with the traditional approach two other methods of the shift share analysis area applied, better
tailored for the strong volatility of domestic relative prices (Tang and Wang 2004; Sharpe 2010).
This study is one of the first attempts to assess the impact of structural change on the
growth of the Russian economy.5 I decompose aggregate labour productivity growth into intra-
industry and inter-industry contributions. All three approaches provide consistent evidence of the
link between structural change and productivity. The overall contribution of structural change was
growth enhancing, significant, and dumped in time. An explicit estimate of labour reallocation
between formal and informal sectors of the economy, novel for Russia, leads to the reduction of the
overall contribution effect because of the extension of informal segments of industries with low
productivity levels. At the same time, sectoral labour input reallocation effects, also discussed in the
literature6, are found to be highly sensitive to the assumptions of the methods and to the presence
of the informal split.
The paper has the following structure. Section 2 presents alternative approaches to the
shift-share analysis that are used in later sections. Section 3 describes the process of data
construction and data sources. Section 4 overviews major industry-level productivity and
3 In this context the paper of Kapelyushnikov et al. (2012) also mentions informal relations within firms and assumes that
such relations helped inefficient firms to survive. However, the present study neglects the effect of informality within firms,
focusing on producers with no status of legal entities. 4 See Appendix A on the usage of terms formal/informal sectors and segments through the text. 5 Vries et al. (2012) apply the conventional shift-share analysis to the Russian economy in 1995-2009, using one of the
previous releases of the Russia KLEMS dataset in 1995-2009 with no informal split. 6 See, e.g., (Diao, McMillan, and Rodrik 2017)

5
employment trends and points out productivity gaps between the formal and informal segments of
the economy, essential for the following analysis. Section 5 discusses the outcomes of decomposing
labour productivity growth rates into intra- and inter-industry effects. Section 6 concludes.
2. Approach to the structural decomposition
The reallocation of workers across industries contributes to aggregate labour productivity
growth. There is a large volume of published studies7 describing this phenomenon, originating from
the pioneering study of Fabricant (1942), which decomposes the increment of aggregate labour
productivity growth into intra-industry and inter-industry components. The former is caused by
the accumulation of human and physical capital, intangible assets and technological progress8,
while the latter depends on structural changes in the economy. With the assumption of additivity of
output in constant prices
(1) �̿�𝑡 = ∑ �̿�𝑛𝑡𝑁
𝑛 ,9
where �̿�𝑡 is the aggregate output in year t, �̿�𝑛𝑡 is the output of industry n, and N is the number of
industries, the change in the aggregate labour productivity ∆�̿� (𝑋 ≡ 𝑌 𝐿⁄ ) can be written as follows
(2) ∆�̿� = ∑(𝑠𝐿,𝑛0 ∆�̿�𝑛) + ∑(∆𝑠𝐿,𝑛�̿�𝑛
1) = ∑(𝑠𝐿,𝑛0 ∆�̿�𝑛) + 𝑅.
The last term in the second expression captures the reallocation effect 𝑅 ≡ ∑(∆𝑠𝐿,𝑛�̿�𝑛1). Weights
𝑠𝐿,𝑛𝑡 are shares of industry 𝑛 in total labour.10
7 See, e.g., the review in (G. de Vries, Timmer, and Vries 2015). 8The contribution of multifactor productivity growth, which is usually interpreted as the outcome of technological change,
could be also explained by temporary disequilibrium, caused by a delayed reaction on technological changes in previous periods,
terms of trade, low mobility of labour and capital, as well as various competitive barriers (Reinsdorf 2015). 9 For brevity sake, below we skip summation indices. Variables are marked with the double bar if it depends on output in
constant prices with fixed weights (the Laspeires index formulae). 10 One more reason for difficulties in the interpretation of sectoral contributions to structural change as independent, is the
following point, raised by Diewert (2014). Say, an increase of labour share of this industry is offset by changes in labour shares
of other industries. Indeed, if the number of industries exceeds two, there is no way to determine how the increase of the labour
share of a certain industry is offset by decreases in labour shares of the other industries. The same logic is applicable to changes
in relative prices. At the same time the total reallocation effect remains correct. So, the sectoral contributions should be
considered as labour input reallocation effect, rather than the sectoral contributions to structural change.

6
Vries et al. (2012, sec. 4) showed that (2) depends on the level of disaggregation. Formally, applying
(2) to the case when each industry n consists of 𝑀𝑛 sub-industries, the corresponding labour
productivity increment can be represented as
(3) ∆�̿�𝑛 = ∑ ((𝐿𝑛,𝑚
0
𝐿𝑛0 ) ∆�̿�𝑛,𝑚)
𝑀𝑛𝑚 + 𝑅𝑛,
where (𝐿𝑛,𝑚
0
𝐿𝑛0 ) is the labour share of industry n, and ∆�̿�𝑛,𝑚 is the labour productivity growth of
subindustry m in industry n. In turn, 𝑅𝑛 is the effect of labour reallocation between sub-industries
of n. Substituting (3) into (2), we have
(4) ∆�̿� = ∑ ∑ (𝑠𝐿;𝑛,𝑚0 ∆�̿�𝑛,𝑚)
𝑀𝑛𝑚
𝑁𝑛 + ∑(𝑠𝐿,𝑛
0 𝑅𝑛) + 𝑅,
where 𝑠𝐿;𝑛,𝑚0 = (𝐿𝑛,𝑚 𝐿⁄ ) .
It is useful to represent (2) in terms of growth rates, rather than levels. Dividing both sides
of equation (2) by �̿� and reformulating we come to
(5) �̿� = ∑ (𝑠�̿�,𝑛0 �̿�𝑛) + ∑ (𝑠�̿�,𝑛
0 𝜎𝑛) + ∑ (𝑠�̿�,𝑛0 𝜎𝑛�̿�𝑛).
Here 𝛾 ≡ ∆𝑋 𝑋0⁄ is the labour productivity growth rate, 𝑠�̿�,𝑛 are the shares of the output of industry
n in aggregate output, and 𝜎 is the growth rate of labour shares. Equation (5) originates from
Denison (1962) and, following Dumagan (2013), will be referred TRAD. While the first term
represents the contribution of labour productivity growth in industries. The second and the third
terms taken together are associated with reallocation, or the `between’ effect. Nordhaus (2002)
labelled them Denison and Baumol effects, respectively.
The Denison effect is the contribution of labour reallocation between industries with
different productivity levels. It shows why labour productivity acceleration in a certain industry can
slow the aggregate productivity growth. Consider two industries in the economy, industry A being
more productive than B (�̿�𝐴0 > �̿�𝐵
0). Then because of, say, technology improvements in industry A
its labour productivity level goes up, remaining unchanged in the rest of the economy. Under the

7
condition of constant demand for product industry A starts releasing workers, who find new jobs in
B. As a result, the labour share in A shrinks, and in B grows, being both equal in absolute magnitude,
or ∆𝑠𝐿,𝐵 = −∆𝑠𝐿,𝐴 > 0. Then terms of industries A and B in the Denison effect component of (5) are
(6) 𝑠�̿�,𝐴0 𝜎𝐴 + 𝑠�̿�,𝐵
0 𝜎𝐵 = ∆𝑠𝐿,𝐵 (𝑠�̿�,𝐵0 − 𝑠�̿�,𝐴
0 ) < 0.
In other words, the negative contribution of the employment share in A is more harmful for
aggregate growth, than a positive contribution of B, because initial productivity of A is higher than
B.11
The Baumol effect, represented by the last term in (5), reflects the contribution of the
labour reallocation between progressive industries with high productivity growth and stagnant
ones with low growth (Baumol 1967).
One limitation of TRAD, mentioned in the literature12, is the counter-intuitive interpretation
of reallocation in some cases. Consider industry n with a below average productivity level.
Intuitively, if it hires more workers from a more productive industry(𝜎𝑛 > 0), the reallocation
effect should be negative. However, as follows from (5), contribution 𝑠�̿�,𝑛0 𝜎𝑛 is positive. Another
case is when the employment share of an industry with the below average productivity level
shrinks (𝜎𝑛 < 0), and its labour productivity falls (�̿�𝑛 < 0). As seen from the third term in (5),
𝑠�̿�,𝑛0 𝜎𝑛�̿�𝑛, the contribution of reallocation will be also positive.
Resolving this is an alternative approach developed in the Centre for the Study of Living
Standards (CSLS) and implemented in the series of publications (De Avillez 2012), which accounts
for the difference between productivity levels in an industry and in the economy as a whole.
Reformulating (5) gives the explicit expression for the CSLS decomposition:
(7) �̿� = ∑ (𝑠�̿�,𝑛0 �̿�𝑛) + ∑ 𝜎𝑛 (𝑠�̿�,𝑛
0 − 𝑠𝐿,𝑛0 ) + ∑ 𝜎𝑛 (𝑠�̿�,𝑛
0 �̿�𝑛 − 𝑠𝐿,𝑛0 �̿�).
11 As it follows from (6), the Denison effect is independent of labour productivity growth in industries. Its direction is
specified by shifts in labour shares and relative productivity levels only. Denison stresses this, mentioning, that the aggregate
labour productivity growth can be negative even if productivity growth in all industries is nill. 12 See, e.g., (De Avillez 2012; Reinsdorf 2015).

8
Comparing TRAD (5) and CSLS (7), it can be seen that the first terms in both equations are the
same. However, the industry-level components of the second term in (7) (Denison effect) become
negative if employment expands in an industry with a below average level of labour productivity. In
this case 𝜎𝑛 (𝑠�̿�,𝑛0 − 𝑠𝐿,𝑛
0 ) = ∆𝑠𝐿,𝑛 (�̿�𝑛
0
�̿�0 − 1) < 0. By analogy, the Baumol effect for a low productive,
shrinking industry is positive.
A major source of uncertainty of TRAD and CSLS is assumption (1) of the additivity of output in
constant prices. Since (1) holds if aggregated output is calculated with fixed weights at constant
prices of a certain base year, the output series are sensitive to the choice of this year. This
dependence of the choice of the base year is the stronger the higher are changes of relative prices of
a current year relative to the base one. Such dramatic changes took place both in developed
economies and in economies in transition. Relative prices in developed economies varied mostly
because of rapid development of ICT technologies (Nordhaus 2002) and transition economies
experienced a smoothing of the multiple distortions of the planned economy period (Campos and
Coricelli 2002). One more source of intensive variations in relative prices, specific for the Russian
economy, is oil prices.
A conventional solution for this mismeasurement problem is the substitution of volume
indices at constant prices with chained volume indices, as is recommended by the System of
National Accounts.13 In this case the exact additivity assumption (1) does not hold. One also needs
other approaches to the shift-share analysis, consistent with the chained volume indices system,
which were suggested by Tang and Wang (2004) and called Generalized Exactly Additive
Decomposition (GEAD).14 The counterpart of (1) in GEAD is additivity of output 𝑉 in current, rather
than constant prices
(8) 𝑉 = ∑ 𝑉𝑛.
Then real output 𝑌 refers to nominal output, adjusted for the level of current prices relative to the
price level of a certain base year 𝑌 ≡ 𝑉 𝑃⁄ .
With (8) an aggregated labour productivity level 𝑋 can be represented as
13 (System of National Accounts 1993: 1.17, System of National Accounts 2008: 15.21), See more about using chain volume
output indices in Russian statistics in (Rosstat 2014, section 3). 14 See also the literature reviews in (Balk 2014; Reinsdorf 2015)

9
(9) 𝑋 ≡𝑌
𝐿=
𝑉
𝑃𝐿=
∑ 𝑉𝑛
𝑃𝐿=
1
𝐿∑
𝑉𝑛
𝑃𝑛
𝑃𝑛
𝑃= ∑
𝑌𝑛
𝐿𝑛
𝐿𝑛
𝐿
𝑃𝑛
𝑃= ∑ 𝑠𝐿,𝑛𝑝𝑛𝑋𝑛,
where 𝑝𝑛 ≡ (𝑃𝑛 𝑃⁄ ) is the relative price index of industry n. Specifying 𝑠𝑛 ≡ 𝑠𝐿,𝑛𝑝𝑛, we represent the
aggregated labour productivity level as
(10) 𝑋 = ∑ 𝑠𝑛𝑋𝑛,
and, with small manipulations, aggregated labour productivity growth as
(11) 𝛾 = ∑ 𝑠𝑌,𝑛0 𝛾𝑛 + ∑ 𝑠𝑋,𝑛
0 (𝑠𝑛1 − 𝑠𝑛
0) + ∑ 𝑠𝑋,𝑛0 (𝑠𝑛
1 − 𝑠𝑛0)𝛾𝑛,
where 𝑠𝑌,𝑛0 = (𝑌𝑛
0 𝑌0⁄ ) and 𝑠𝑋,𝑛0 = (𝑋𝑛
0 𝑋0⁄ ) are the ratios of productivity level in industry n to the
aggregated one. Equation (11) is the GEAD decomposition with the first term being within
contributions of industries, the second one is interpreted as the Denison effect, and the third one is
the Baumol effect.
Dumagan (2013) showed that compared to TRAD, GEAD has, along with the superiority in
terms of the fixed weights problem, two additional advantages. First, the within component in
GEAD (the first term in (11)) depends only on industry price deflators, while in TRAD it (the first
term in (5)) also rests on the price deflator for the total economy.15 In other words, the TRAD
decomposition is sensitive to the relationship between industry level deflators and the aggregated
deflator. Second, in contrast to TRAD, GEAD takes into account changes in the aggregate
productivity growth, caused by variations in relative prices. Such changes do not necessary lead to
labour reallocation and can be explained, for example, by extra inflow of capital services.
Summing up, the three methods are implemented in the present study. The first one, TRAD,
assumes fixed relative prices on industry products. It is widely used in the literature for the analysis
of structural changes, so that the literature provides a rich context for comparisons across time and
space. In addition, it provides an opportunity for the interpretation of the reallocation effect as the
sum of two effects, which are labour reallocation between industries with different productivity
15 See equations (4.1) and (4.2) in (Dumagan 2013) for the explicit exposition of this.
10
levels (the Denison effect) and growth rates (the Baumol effect). The second, CSLS uses the same
assumption of fixed product weights, as TRAD. However, it provides a better intuitive
interpretation of sectoral contributions to structural change, than TRAD. Weakening the limitation
of fixed relative prices leads to the third, GEAD. This approach also explores the split of the
reallocation effect into the Denison and Baumol components.
Taking into account the rich literature on structural change and labour productivity growth,16 the
list of these three decompositions is not comprehensive. Moreover, these methods are not perfect.17
This framework does form a coherent system of methods with a well-developed economic
interpretation. The sections that follow show how these methods work for Russia.
3. Data
As discussed above, methods of the shift-share analysis require industry-level time series
data on nominal value added, real value added, and labour input. Taking account of informality we
are also expected to split these series into formal and informal segments in each industry.
The conventional source for industry-level data is the official System of National Accounts
series (SNA). However, the Russian statistics office (Rosstat) provides consistent industry-level
series in an international industry classification only from 2003. The only alternative data source
with the time series set going back to 1995, is Russia KLEMS (Timmer and Voskoboynikov 2016;
“Russia KLEMS” 2017). It includes backcast estimations of output and inputs to 1995, being
consistent with the official total economy level SNA series 1995-2002, and the official industry-level
SNA series afterwards.
The next step is breaking down the industry-level series into formal and informal segments.
A worker is considered informal if (s)he is not engaged in an organization which belongs to
the corporate sector or, in other words, has no status as a legal entity.18 The informal segment,
therefore, is measured statistically as the production in the institutional sector of households in
SNA.
16 See. for example, the alternatives in the following studies (G. J. de Vries et al. 2012; Diewert 2014; Roncolato and Kucera
2014; Reinsdorf 2015). 17 See more about shortages and limitations in (Timmer and Szirmai 2000; G. J. de Vries et al. 2012; Reinsdorf 2015) 18 Being interested also in labour reallocation between formal and informal segments I disaggregate data for each industry by
these segments, correspondingly. There is a long discussion in the literature how to define informality; I rely here on the
productive definition which associates informality with properties of firms, not workers. For alternative definitions of informality
and their application to the Russian employment are discussed by Lehman and Zaiceva (2013), Gimpelson and Kapelyushnikov
(2015) and Lehman (2015).

11
Industry-level nominal value added is estimated by Rosstat as the sum of value added in the
corporate sector and the household sector. The latter is measured by using various indirect
estimates in accordance with international guidelines.19 The share of the informal segment in value
added is assumed to be the share of the household sector in the total value added of a particular
industry.20 Unfortunately, this subset of data is available at the one-digit level only. For example,
manufacturing includes thirteen industries, among which the informal segment in 2005 varied
from 3% of hours worked in Electrical and Optical Equipment (code 30t33, see Appendix B) to 38%
in wood and wood products and cork (20). To resolve the issue for an industry at the two-digit level
I use shares of a corresponding parent industry from the higher aggregation level. Thus, the
informal share of both Electrical and optical equipment (30t33) and Wood (20) are assumed to be
equal to that in all manufacturing. The share of hours worked in the informal segment of each
industry was calculated with data on hours worked in total and in the corporate sector, which is
available starting from 2005.
There are two exceptions in the application of this general approach. First, we set the
informal share in mining (C) and financial intermediation (J) to be nil. Official data estimates for the
value added in these industries produced by SMEs are under 0.2% and 1%, respectively.
Finally, I need to estimate the real value added series in formal and informal segments.
Assuming that price deflators in these two segments within each industry are the same, we deflate
nominal value added applying the implicit GDP deflators in each industry. These deflators are
calculated implicitly with the real and nominal value added in each industry, given in Russia
KLEMS.
4. Trends of productivity growth in Russia: shocks and adaptation
One of peculiarities of the Russian growth pattern has been relatively stable employment
with highly volatile output. This characterized the transformational recession 1991-1998, the post-
transition recovery in 1999-2008 and the following stagnation after the global financial crisis in
2009 onwards (Kapelyushnikov, Kuznetsov, and Kuznetsova 2012). Figure 1 reveals that in 1999-
2008 real value added of total market economy doubled, while employment grew by less than 24%.
Another example of this is the reaction of the economy to the global crisis of 2009. While output
plummeted by 8.9% in 2009 relative to 2008, the fall of employment was just 3.6%. Although all
19 Methodology description of output and value added of the economy, including the informal segment, is available by
Rosstat(1998). International experience of this is generalized by OECD (2002). 20 Data is available in official publications of Rosstat. See, for example, Rosstat (2014, tab. 2.3.44), and similar publications
for previous years. Starting from 2002, Rosstat publishes also shares of value added, adjusted for unobserved economic
operations (Rosstat 2010, tab. 2.3.46-52). I prefer the former since the share of the sector of households concur with the share of
unobserved economic operations until 2009. For succeeding years the latter falls much faster than the former, which unveils
some unreported changes in methodology. I thank Rostislav Kapelyushnikov, who attracted my attention to this issue.

12
transition economies passed through stages of the transformational recession and the post-
transition recovery, these stages varied in depth and duration21 and most economies of central and
eastern Europe employment trends followed GDP more closely. Market reforms in central and
eastern Europe triggered unemployment growth, which reached at least 10% almost immediately,
while in Russia the unemployment level passed this level only on the sixth year of reforms, and
reached maximum of 13.3% in 1998.
Figure 1. Trends of real value added, hours worked and labour productivity in
1995-2014 in total market economy (1995=100)
Sources: (Timmer and Voskoboynikov 2016; “Russia KLEMS” 2017)
Note: Market economy includes all industries except those, where non-market services dominate, such as Public Administration, Education, Healthcare and Real Estate
The explanation for the Russian anomaly lies in `the Russian way’ of adapting the labour
market to external shocks, starting from the shock therapy in early transition (Layard and Richter
1995), and includes a wide range of informal arrangements between employers and employees,
which help absorb external shocks by proper adjustment of wages and actual hours worked.
Another form of this adaptation is the availability of multiple job opportunities in the informal
21 See (Campos and Coricelli 2002) for a comprehensive review.
10
01
20
14
01
60
18
02
00
19
95
= 1
00
1995 1997 1999 2001 2003 2005 2007 2009 2011 2013
Labour productivity
Real value added
Hours worked
Total market economy

13
segment (Kapelyushnikov, Kuznetsov, and Kuznetsova 2012). 22 After losing work in registered
firms a job could be found in a firm with no legal status.
Such a reallocation does not change the total number of hours worked in the economy
significantly, but influences the structure of the economy and increases the share of the informal
segment. The corresponding changes in the employment structure in 2000-2013 are represented in
Figure 2. The small total increment of jobs by almost 3.5 million for thirteen years, mostly in years
of outstanding growth23, masks huge inflow of 8.8 million jobs to the informal segment, and also
significant outflow of 5.3 million jobs from formal organizations. The most significant losses of
formal jobs were manufacturing (3.7 mil) and agricultural firms (3.3 mil), while informal jobs
gained in construction (1.4 mil), trade (1.3 mil), transport (1.0 mil), and business services (0.5 mil).
This is more or less in line with expectations about traditional sectors with a significant labour
share of informal workers. What stand out are the remarkable cross-flows of jobs between formal
and informal segments within manufacturing and transport. This can indicate that some
manufacturing workers preferred staying in profession, but leaving corporate enterprises for small
workshops.
All in all, the impact of the `Russian way’ of labour market adaptation to the initial shock
therapy of plan-market transition, and to the following shocks of 1998 and 2008, is ambiguous. It
provided some level of social stability through the relatively low level of unemployment because of
the absorption of excessive labour by the informal segment; however such labour reallocation to
low productive informality influences aggregate labour productivity growth. The drastic changes in
the structure of employment in Figure 1, can slow aggregate labour productivity growth.
What follows in this section is a brief description of the other proximate factors which
contribute to the aggregate labour productivity growth.
22 See also the study of Gimpelson and Kapelyushnikov (2013) for the literature review. 23 Some similarities of the countercyclical expansion of informality in Russia might be found in Mexico – see (Fernández
and Meza 2015).

14
Figure 2. The change of the number of workers in total economy and major
sectors in 2000-2013
Source: the Labour Force Survey, Rosstat
Aggregate labour productivity is driven by two types of proximate sources: changes in the
performance of industries, fuelled mostly by investments to physical and human capital and
innovations, and labour reallocation across industries. The study of Timmer and Voskoboynikov
(2016) reveals that the former is driven by capital intensity in low-skill intensive services and
Extended Mining, and by technology catching up in Manufacturing, Financial intermediation and
business services. Extended Mining includes not only Mining, but also Wholesale trade and Fuel,
because the lion’s share of oil and gas revenues falls at them (Timmer and Voskoboynikov 2016).
Labour reallocation is the focus of the present study. It reflects fluctuations in the industrial
structure of the economy. The impact of labour reallocation is more substantial, the more the
structure changes and industries differ in productivity.
Considering reallocation effects between thirty industries of market economy, for
descriptive purposes I have combined them into six sectors, which are Agriculture, Manufacturing,
Extended Mining, Market Services (e.g. Construction, Retail and Telecommunications (CRT)),
Transport, and Finance and Business Services24. Suggesting these sectors I take into account the
following considerations. Agriculture and Manufacturing are sectors, which are conventional within
the three-sectoral analysis in development economics. One more reason of our interest in
24 The composition of these sectors is represented in Appendix B.

15
Agriculture in the context of Russia is its high share in comparison to other post-industrialized and
post-transition economies of a similar level of development. Extended Mining is considered
separately because of its size and the specific role in the Russian economic performance. Taking
into account the high share of services in modern developed economies and their heterogeneous
performance (Jorgenson and Timmer 2011), I split services into three additional sectors. Transport
is specific for its high capital intensity. Workers engaged in Finance and Business Services differ
from the rest of market servicers activities with the average level of skills and education (O’Mahony
and Ark 2003), which make these industries specific in terms of labour productivity performance.
Finally, I exclude Public administration, Education and Healthcare, because of low quality of
productivity measures in non-market services in the National Accounts (Timmer et al. 2010).
In recent decades the Russian economy has gone through intensive structural changes. The
structure of the economy in 1995, three years after transition, still carried some rudiments of the
planned economy and early transition distortions. In terms of hours worked the share of goods
(Agriculture and Manufacturing) was almost 60%. Surprisingly, more than two thirds of all labour
was agricultural, which is enormous for a post-industrialized economy. This was caused by labour
intensive non-market households, which produce agricultural products for their own consumption
(Gimpelson and Kapelyushnikov 2015). Being labour intensive and having low productivity in
comparison with agricultural firms, these households use around 12% of total hours worked or
more than half in Agriculture (Rosstat 2009, tab. 3.5). As might be expected, the share of Extended
Mining was small.
In the following years we observe a replacement of goods by services, which was the
outcome of different forces acting in one direction. These are the shift of demand from goods to
services because of income growth; the overcoming of the planned economy over-industrialization;
competition with Asia in manufactured goods; the expansion of Extended Mining in the years of
soaring global oil prices, starting from 1999. Table 1 shows the shares of sectoral hours worked and
value added in 1995 and 2012. The share of Agriculture in the total hours worked reduced from
28% to 21% and the share of Manufacturing decreased from 19% to 15%. This contrasts sharply
with the expansion of CRT from 20% to about 28% of total hours worked. Not less impressive was
the structural change in value added. The share of Agriculture almost halved, the share of
Manufacturing reduced from 7.6% to about 4%, that of Transportation fell from 11.7% to 6.8%.
Mining, Finance and Business Services increased their shares in GDP, while the aggregate share of
Retail, Construction and Services changed little.

16
Table 1. Sectoral shares in 1995 and 2012 (%)
Sectors
Value added Hours worked
1995 2012 1995 2012
Total economy 100.0 100.0 100.0 100.0
Market economy 86.1 81.7 80.9 79.6
Agriculture 7.6 3.9 27.9 20.9
Manufacturing 22.4 14.9 18.8 15.1
Extended Mining 20.1 25.0 3.5 4.5
Construction, Retail and Telecom 19.2 20.1 19.7 27.5
Transport 11.7 6.8 5.7 5.9
Finance and Business Services 5.1 10.9 5.2 5.7
Non-market economy 13.9 18.3 19.1 20.4
Source: (Timmer and Voskoboynikov 2016; “Russia KLEMS” 2017)
A comparison of the shares of value added and hours worked in Table 1 also provides some
insight about the variations in labour productivity levels and growth across sectors. For example,
Agriculture seems the least productive, because its share of hours worked in 1995 is almost four
times as much as its share of value added. It is not surprising that the share of value added of capital
intensive Extended Mining is more than five times higher than the share of hours worked. We
expect the remarkable growth of labour productivity in Financial and Business Services, because by
2012 its share of value added raised by 5.8 p.p., while the share of hours worked by only 0.5 p.p. It
is also worth mentioning the fall of labour productivity in CRT with its constant share of value
added and the expanding labour share by 10.3 p.p.
Taking into account the substantial changes in jobs in the formal and informal segments of
the economy, represented in Figure 2, this can be the additional source of variations in productivity.
Indeed, Table 2 shows that the share in hours worked by informal workers in 2005 was almost
44% and continued expanding. The share of informality varies across sectors from a modest 10%
(2012) in Financial and Business Services to 80% in agriculture. Equally important, the gap in
labour productivity levels between the formal and the informal segments of the economy is
substantial and becomes deeper. While the labour productivity level of total informal economy was
17% of the formal one in 2005 and fall to 14% by 2012, the picture across sectors is heterogeneous.
Informal manufacturing is very unproductive and degrades from 11% in 2005 to 5% in 2012. At the
other extreme, in Financial and Business Services informal workers seem to be much more
productive than their formal colleagues. This is the area where high quality freelancers over
perform traditional corporate forms of activity.

17
Table 2. Shares of hours worked of the informal segment and relative labour
productivity levels
Labour shares
of informal segments (% of hours worked)
LP levels of informal segments relative to formal
ones
2005 2012 2005 2012
Total market economy 43.8 44.8
0.17 0.14
Agriculture 79.7 82.7
0.31 0.27
Manufacturing 12.1 15.4
0.11 0.05
Extended Mining 38.2 35.4
0.19 0.15
Construction, Retail and Telecommunications
44.8 44.8
0.22 0.16
Transport 21.4 27.2
0.14 0.19
Finance and Business Services 8.1 9.7
1.74 1.29
Source: authors’ calculations. See details in main text.
Note: Relatively high shares of informal segment in extended mining are caused by high informality in some organizations of wholesale trade. However, it is unclear if these organizations provide some specific energy-export oriented services or other wholesale trade activities. Numbers may not sum exactly due to rounding.
The results reported in this section show that structural change can be a substantial source
of variation in aggregate labour productivity. This follows from the fact that the shifts in the
structure of the economy in recent decades were substantial and variations in productivity across
industries were high. In addition, I provide evidence that labour reallocation between formal and
informal sectors of the economy can contribute to productivity variations. However, these
preliminary results do not answer the question of what the relative impacts of all these reallocation
effects to aggregate productivity growth are. Such estimations need a more accurate shift share
analysis technique, which will be implemented in the following section.
5. The contribution of labour reallocation and informality
This section assesses the impact of structural change and labour reallocation on aggregate
labour productivity growth in two cases. The first one, conventional in the literature, deals with
industries with no informal split. Applying the three alternative methods of the shift-share analysis,
discussed in section 2, I tease out the effects where they provide consistent results. Next,
addressing the issue that this `no-split’ approach wrongly treats the impact on aggregate

18
productivity from job flows between formal and informal segments within industries as the
outcome of the intra-industry sources, I take into account the informal split explicitly.25 Comparing
results of the two cases, I discuss the bias of the `no-split’ approach and the impact of informality
expansion on labour productivity growth.
Table 3. Alternative decompositions of labour productivity growth
Contributions to yearly average growth rates (p.p.)
TRAD, CSLS GEAD
1995-2005 2005-2012 1995-2005 2005-2012
Total market economy 5.04 4.00 4.98 3.71
Total intra-industry 4.21 3.36 3.81 3.36
Agriculture 0.28 0.14 0.32 0.14
Manufacturing 0.93 0.43 1.09 0.43
Extended Mining 1.10 0.98 0.55 0.98
Construction, Retail and Telecommunications
0.52 1.06 0.61 1.06
Transport 0.33 0.16 0.32 0.16
Finance and Business Services
1.05 0.60 0.93 0.60
Reallocation 0.83 0.64 1.17 0.36
Notes: In this decomposition informal split is not taken into account. TRAD, CSLS: constant prices of 2005 are used. Numbers may not sum exactly due to rounding.
Source: authors’ calculations. See main text.
Table 3 presents the decomposition of aggregate labour productivity growth into intra-
industry contributions and the impact of labour reallocation for 30 industries of the market
economy in 1995-2012, which are grouped in six aggregated sectors. The table also reports the
results obtained by the alternative methods.26 Over the period all approaches are consistent in
revealing the main trends of this decomposition. First, aggregate productivity growth decelerates in
25 A similar approach was used by Vries et al. (2012) for Brazil and India 26 Comparing equations (5) and (7) one can be noticed that sectoral contributions and the total reallocation effect in TRAD
and CSLS are the same.

19
2005-2012 in comparison with the previous decade. Next, the main drivers of aggregate
productivity growth in the first decade were Extended Mining, Manufacturing, and Finance and
Business Services, while in the following years Manufacturing and Finance and Business Services
gave way to the consumption-oriented sector of CRT. Finally, the contribution of labour reallocation
declines. For example, the estimations of TRAD/CSLS demonstrate the fall of the reallocation
component by almost 0.2 p.p. or from 0.83 p.p. in 1995-2005 to 0.64 p.p. in 2005-2012. The fall of
reallocation explains from one fifth of the total 27 for TRAD/CSLS to almost two thirds for GEAD. A
possible explanation for this decline is the slow elimination of the disproportions of the planned
economy in the late stages of the transition from plan to market. Summing up, the role of labour
reallocation in total growth is minor in comparison with intra-industry sources. From this
perspective, Russia seems similar to the Latin America region, rather than East Asia or Africa (see
Diao et al (2017)).
The overall reallocation component deserves more attention not only because its
contribution remains significant for the Russian economy, but also because of the contribution of
labour input reallocation to structural change in different patterns of structural transformation,
discussed by Diao et al (2017) and calculated with the TRAD approach.
Section 2 elaborates the differences in initial assumptions of the three methods of structural
decomposition, which are shown as different approaches to the calculation of the reallocation term.
That is why it is little wonder that sectoral contributions to structural change, represented in
Tables 4 and 5, are mostly sensitive to the method used. For example, the negative contribution of
Agriculture, provided by TRAD both in 1995-2005 (- 0.18 p.p., table 4) and in 2005-2012 (-0.08 p.p.,
table 5) becomes positive with CSLS (0.41 p.p. and 0.26 p.p. respectively). This could be expected,
because CSLS is a modification of TRAD, which provides the positive contribution to structural
change for sectoral labour outflow from a low productive industry as Agriculture. In turn, the
GEAD-based contribution of Extended Mining in 1995-2005 is at least three times as much as TRAD
and CSLS, which can be explained by drastic changes of the relative prices in 2005 in comparison
with 1995 against the rapid growth of oil prices. Interestingly, the variation of GEAD-based
structural change contributions are higher in comparison with TRAD in 1995-2005 (Table 4),
rather than in the following years (Table 5), which can also be interpreted as the outcome of the
drastic change of oil prices. These findings clearly indicate that sectoral contributions to structural
change are sensitive to the way the shift-share analysis is implemented.
27 Aggregate productivity growth dropped by 1.04 p.p. while reallocation – by 0.19 p.p., or almost 19% of 1.04.

20
Table 4. Sectoral labour reallocation effects in 1995-2005
Contributions to yearly average growth rates (p.p.)
TRAD CSLS GEAD
Reallocation, total market economy
0,83 0,83 1,17
Agriculture -0,18 0,41 -0,33
Manufacturing -0,16 0,12 -0,59
Extended Mining 0,57 0,44 1,81
Construction, Retail and Telecommunications
0,62 -0,16 0,43
Transport -0,02 -0,02 -0,33
Finance and Business Services
0,00 0,03 0,18
Notes: In this decomposition informal split is not taken into account. TRAD, CSLS: constant prices of 2005 are used. TRAD, CSLS, GEAD – references to methods. Numbers may not sum exactly due to rounding.
Source: authors’ calculations. See main text.
Along with the variety of methods, one more source of uncertainty in this type of the
analysis is the option to take into account informality. Indeed, the substantial share of informal
labour is a reality in most developing economies. It has been widely discussed in the context of its
influence on overall productivity growth. At the same time, it is usually28 skipped in the
quantitative decompositions of aggregate labour productivity growth.
Taking into account substantial heterogeneity of productivity levels, reported in Table 2, the
introduction of the informal split increases heterogeneity in labour productivity levels and,
therefore it is expected to affect components of productivity growth. As follows from equations (3)
and (4), the fraction of aggregate labour productivity growth, which was initially attributed to the
within effect, now becomes the part of the between effect. This shift reflects implications of flows
across formal-informal divide.
Data from Tables 4 and 5 empower the quantitative evaluation of this fraction. Indeed, as
follows from Table 3, the total yearly average labour productivity growth rates in 2005-2012 are
4.00%, of which 3.49p.p. is contributed by the total intra-industry contributions, and 0.64 p.p. by
the reallocation effect between industries and -0.13 p.p. by the overall reallocation between the
formal and informal segments within industries. In other words, if the informal split is not taken
into account, the overall within effect is underestimated by -0.13 p.p., equals 3.36 p.p. and reported
28 The remarkable exception is the study of de Vries at al (2012), in which the impact informality on the reallocation effect
is considered for Brazil and India.

21
in Table 3. This negative impact reflects the expansion of the low-productive informal segment.
Table 2 reports that its share grew in 2005-2012 by 1 p.p., while its labour productivity level was
below one fifth of the formal one.
Table 5. Sectoral reallocation effects in 2005-2012
Contributions to yearly average growth rates (p.p.)
TRAD CSLS GEAD
Informal split: Informal split: Informal split:
No Yes No Yes No Yes
Reallocation, total market economy
0,64 0,51 0,64 0,51 0,36 0,22
Agriculture -0,08 -0,13 0,26 0,20 -0,11 -0,16
Manufacturing -0,17 -0,31 0,04 -0,09 -0,09 -0,22
Extended Mining 0,04 0,17 0,03 0,16 0,05 0,17
Construction, Retail and Telecommunications
0,28 0,26 -0,07 -0,09 0,26 0,25
Transport 0,04 -0,04 0,01 -0,08 0,06 -0,02
Finance and Business Services
0,53 0,56 0,38 0,40 0,18 0,20
Notes: TRAD, CSLS: constant prices of 2005 are used. Numbers may not sum exactly due to rounding.
Source: authors’ calculations. See main text.
Consequently, the effect of labour reallocation between the formal and informal segments
within a sector (the difference between the second and the first columns of Table 5) equals the
sectoral contributions of this reallocation between formal and informal segments. The table shows
that this reallocation is negative for all sectors with two exceptions. In Finance and Business
Services the informal segment is more productive, which follows from Table 2, so there is little
surprise that the expansion of its informal segment by 1.6 p.p. leads to a positive contribution. Such
a shift could reflect the fact, for example, that a qualified lawyer has left a firm and become self-
employed.29 Another exception is Extended Mining. As follows from Table 2, this is the only sector
where the informal sector contracted by 2.8 p.p. This effect is also evident as the gross flow of jobs
in Figure 2. The most substantial intra-sectoral reallocation of jobs between formal and informal
segments in Manufacturing, Agriculture and Construction corresponds to the largest values of the
effect (in absolute values).
29 We see this group of highly qualified self-employed at micro level (Gimpelson and Kapelyushnikov 2015).
22
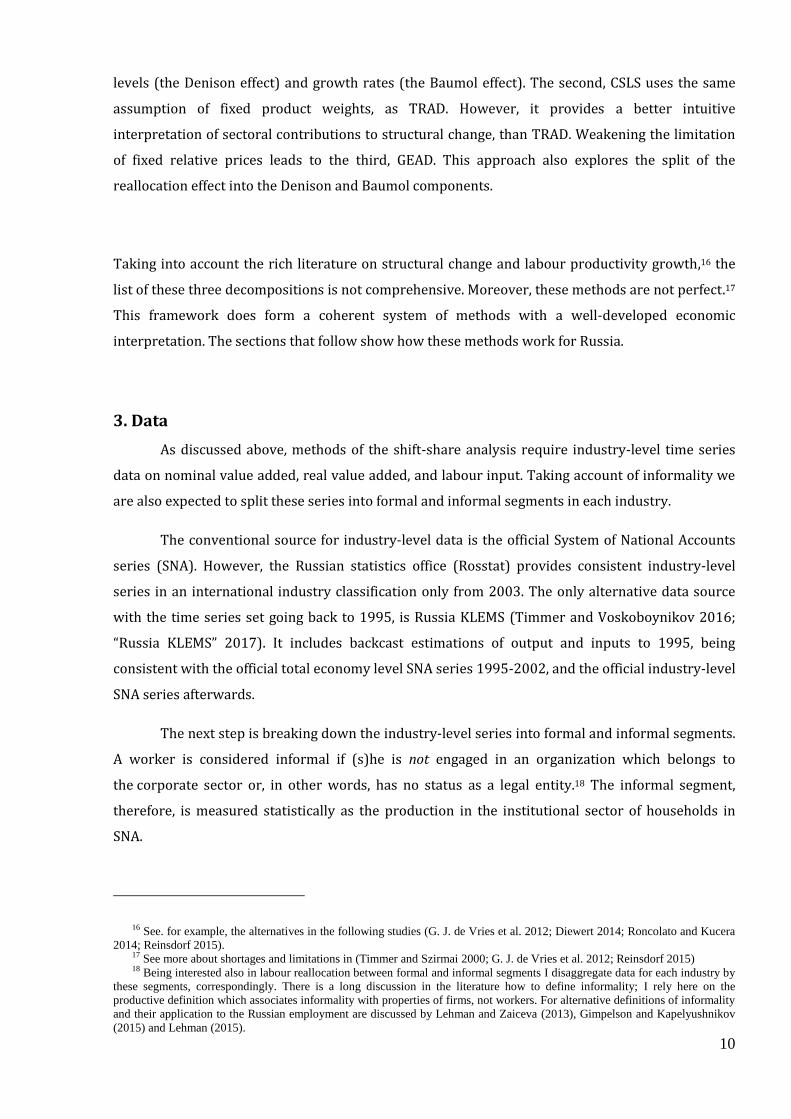
Figure 3. The contribution of labour reallocation on aggregate labour
productivity growth of the Russian economy in 2005-2012
Contributions to yearly average growth rates (p.p.)
Source: author’s calculations, see main text
Note: GEAD approach for the shift-share analysis (Tang and Wang 2004)
Figure 4. Distributions of labour productivity levels across industries in 2005-
2012
A. Total industries with no informal split.
B. Industries with the informal split
Note. Labour productivity level in an industry refers to the nominal value added per hour worked, normalized to the aggregate labour productivity level of a corresponding year. Descriptive statistics of the distributions is available in Appendix C.
Sources: authors’ calculations. See main text.
01
53
04
56
0
Pe
rce
nt
0 5 10 15lp_rt
01
53
04
56
0
Pe
rce
nt
0 5 10 15lp_rt

23
Figure 5. Distributions of labour productivity growth rates across industries in
2005-2012
A. Total industries with no informal split.
B. Industries with the informal split
Note. Labour productivity growth rate in an industry relative to the previous year is defined as the difference in growth rates of the real value added of this industry and its hours worked. Descriptive statistics of the distributions is available in Appendix C.
Sources: authors’ calculations. See main text.
As it stands, expanding informality reduces growth enhancing structural change because of
labour reallocation to less productive informal segments of industries. One can make one step
further and answer the question of the nature of this aggregate productivity slowdown—if it is
driven by the expansion of industries with lower productivity levels as defined in section 2 (the
Dennison effect), or, alternatively, growth rates (the Baumol effect). The results of the
corresponding decomposition for GEAD are given in Figure 3. Of the total decrease -0.14 p.p. the
Denison effect contribution is -0.12 p.p., while the Baumol effect is only 0.02 p.p. In other words,
reallocation of labour between industries with different productivity levels has a larger effect on
aggregate growth than with different growth rates.
Why is that? The Denison effect captures shifts of labour between industries with different
levels of labour productivity, while the Baumol effect deals with growth rates. Comparing Figures 2
and 3, the informal split impacts the distribution of levels stronger than of growth rates. Since the
distribution of levels became more asymmetrical, biased in the direction of the left tail, one can
conclude that the probability of a reallocation to a position with a lower level of productivity in
comparison with the previous one is much higher than to a more productive one. On the contrary,
with the informal split the distribution of growth rates becomes more symmetrical. We expect that
the extension of informality led to employment growth in industries with below average
productivity levels.
05
10
15
20
25
Percent
-.6 -.4 -.2 0 .2lp_gr
05
10
15
20
25
Percent
-.6 -.4 -.2 0 .2 .4lp_gr

24
The same effect can be represented in the form of distributions of industries by labour
productivity levels (Figure 4) and growth rates (Figure 2). Taking into account the informal split
shifts, the distribution of productivity levels is to the left, which can be noticed by comparison of
these Figures. In comparison with the no split case the skewness of the distribution with the
informal split raises by one quarter. With that, the increasing number of low productivity industries
shifts the average productivity down from 1.8 to 1.3 of the total economy level (see Appendix C).
The growing spike appears also in the form of increasing kurtosis. All this indicates that the
probability of finding a new job for a worker with the lower level of productivity than the previous
one is higher if the informal split is taken into consideration.
The informal split can also impact the distribution of productivity growth rates. Figures 3A
and 3B show that it does, but the influence is different. In contrast to the distribution of levels, the
asymmetry of growth rate distribution decreases. The corresponding skewness (Appendix C)
becomes closer to nil, changing from -1.7 to -0.8, which indicates that the tails on both sides balance
out. Interestingly, the informal split has no impact on the mean growth rates, which remain 3.1 per
cent per year. At the same time, higher standard deviation (15.3 instead of 11.1) is caused by
increasing infrequent extreme deviations, as follows from the decreasing value of kurtosis. In other
words, the number of industries with extreme productivity growth, both positive and negative,
increases. All in all, there is no evidence that taking into account the informal split leads to the
increasing role of industries with growing or falling productivity.
Though the estimates produced by alternative decomposition methodologies differ, they
paint a largely similar picture. The core is that the reallocation in the Russian economy in 1995-
2012 was not growth neutral. Its contribution into the aggregate labour productivity growth was
positive. This finding matches evidence from other studies which suggest a consistent upgrade in
job quality in 2000-2012 (Gimpelson and Kapelyushnikov 2014). However, a more precise account
of the informality composition and associated trends discounts the positive contribution of labour
reallocation. Reallocation remained progressive but the trend towards the expansion of informality
worked in the opposite direction. Workers who moved from the formal sector into the informal one
got jobs in industries where the productivity levels were lower than in industries they exited. A
worker leaving large industrial plant could become a cab driver or a sales person (formal or
informal), or could earn their living transforming their garage or basement into a small workshop.
The latter option allows them to stay in the same industry but working informally. In any case, in
this new job one hour of work produces much less value added than in the previous one.

25
6. Conclusion
The present study was designed to examine the link between structural change and the
aggregate labour productivity growth of the Russian economy to obtain the quantitative evaluation
of the impact of the expanding informal segment in Russia on productivity in the context of
structural dualism, thoroughly discussed by Diao, McMillan and Rodrik (2017) for the analysis of
the recent performance of developing and emerging economies. For this I have applied a set of
alternative analytical tools to decompose the aggregate labour productivity growth into the
between and within components.
Three main findings are that in 1995-2012 labour reallocation in Russia was significant,
growth enhancing and dumping. Considering 2005-2012 the study also evidences that expanding
labour reallocation to the informal segment of the economy acted in the opposite direction and
slowed down aggregate labour productivity growth. Further decomposition of the reallocation
contribution unveiled that this deceleration can be caused by the expanding employment share of
informal activities with low labour productivity levels.
Overall, this study strengthens the idea of the dual role of the informal sector. While the
informal sector is a safety valve which amplifies social consequences of external shocks and makes
employment stable, the expanding informality leads to a slowdown of labour productivity and, from
this perspective, is harmful for growth. The study also raises important questions about the
methods used for the shift-share analysis. Indeed, although the main findings have been confirmed
with the three methods used, sectoral labour reallocation effects were sensitive to the approach.
Finally the study highlights the role of relevant institutions, which is discussed by Rodrik (2008).
Formal adaptation of the best practices of developed economies by Russia in first years of the
transition from plan to market in conjunction with weak state enforcement reduced the structural
bonus because of expanding informality and abated long run growth.
In conclusion, a number of important limitations of this study need to be mentioned. The
consideration of the problem at the level of industries overlooks the contribution of labour
reallocation between firms within an industry, which can be significant.30 I am also limited with the
definition of informality by the one adapted in the Russian system of national accounts. At the same
time, the share of informality depends on the definition, as seen in the data of household surveys.31
Using this definition, adapted by the Russian official statistics, it is also difficult to split the impact of
the informal economy and household production. However, the macro perspective, used in the
present study, is the only one which considers the whole economy, rather than the corporate sector
for firm-level surveys, and is consistent with the total economy measure of economic growth.
30 See, e.g., (Brown and Earle 2008). 31 (Lehmann and Zaiceva 2013; Gimpelson and Kapelyushnikov 2015)
26
Acknowledgements
I acknowledge support from the HSE Basic Research Program. I thank Vladimir Bessonov, Rostislav
Kapelyushnikov and Boris Kuznetsov for valuable comments and suggestions. Especially I thank
Vladimir Gimpelson, who helped me in early stages of this project. Various versions of this paper
have been presented in the research seminar of the department of economics at Higher School of
Economics in 20 May 2015, the research seminar at the Bank of Finland Institute for Economics in
Transition (BOFIT) in 13 October 2015, the 34th General IARIW Conference in Dresden in 25 August
2016, and in the conference in honour of Elinor Ostrom “Informality and Development” at the
Indiana University, Bloomington, in 23 October 2016. I am grateful to participants and discussants
in these events for valuable comments. At the same time, I am responsible for all errors and
omissions in the paper.

27
References
Balk, Bert M. 2014. “Dissecting Aggregate Output and Labour Productivity Change.” Journal of Productivity Analysis 42 (1): 35–43. doi:10.1007/s11123-013-0359-6.
Baumol, William J. 1967. “Macroeconomics of Unbalanced Growth: The Anatomy of Urban Crisis.” American Economic Review 57 (3): 415–26.
Brown, J. David, and John S. Earle. 2008. “Understanding the Contributions of Reallocation to Productivity Growth: Lessons from a Comparative Firm-Level Analysis.” IZA Discussion Paper 3683 (September). http://ftp.iza.org/dp3683.pdf.
Busso, Matías, María Victoria Maria, and Santiago Levy. 2012. “(In)Formal and (Un)Productive: The Productivity Costs of Excessive Informality in Mexico.” IDB Working Paper Series IDB-WP-341 (August). http://services.iadb.org/wmsfiles/products/Publications/37042758.pdf.
Campos, Nauro F., and Fabrizio Coricelli. 2002. “Growth in Transition: What We Know, What We Don’t, and What We Should.” Journal of Economic Literature 40 (3): 793–836. doi:10.1257/002205102760273797.
De Avillez, Ricardo. 2012. “Sectoral Contributions to Labour Productivity Growth in Canada: Does the Choice of Decomposition Formula Matter?” International Productivity Monitor Fall (24): 97–117.
Denison, Edward F. 1962. The Sources of Economic Growth in the United States and the Alternatives before Us. Supplementary Paper No 13 Published by Committee for Economic Development. New York: Committee for Economic Development.
Diao, Xinshen, Margaret McMillan, and Dani Rodrik. 2017. “The Recent Growth Boom in Developing Economies: A Structural Change Perspective.” Working Paper 23132. National Bureau of Economic Research. doi:10.3386/w23132.
Diewert, W. Erwin. 2014. “Decompositions of Productivity Growth into Sectoral Effects.” Journal of Productivity Analysis, April, 1–21. doi:10.1007/s11123-014-0392-0.
Dumagan, Jesus C. 2013. “A Generalized Exactly Additive Decomposition of Aggregate Labor Productivity Growth.” Review of Income and Wealth 59 (1): 157–68. doi:10.1111/j.1475-4991.2012.00511.x.
Fabricant, Solomon. 1942. Employment in Manufacturing, 1899-1939. NBER chapters. NBER.
Fernández, Andrés, and Felipe Meza. 2015. “Informal Employment and Business Cycles in Emerging Economies: The Case of Mexico.” Review of Economic Dynamics 18 (2): 381–405. doi:http://dx.doi.org/10.1016/j.red.2014.07.001.
Gimpelson, Vladimir E., and Rostislav I. Kapelyushnikov. 2013. “Labour Market Adjustment: Is Russia Different?” In The Oxford Handbook of the Russian Economy, edited by Michael Alexeev and Shlomo Weber, 693–724. Oxford University Press.
———. 2014. “Polarization or Upgrading? Evolution of Employment in Transitionary Russia.” IZA Discussion Paper 8688. http://ftp.iza.org/dp8688.pdf.
———. 2015. “Between Light and Shadow: Informality in the Russian Labour Market.” In The Challenges for Russia’s Politicized Economic System, edited by Susanne Oxenstierna, 33–58. Oxford: Routledge.
Hassan, Mai, and Friedrich Schneider. 2016. “Size and Development of the Shadow Economies of 157 Worldwide Countries: Updated and New Measures from 1999 to 2013.” Journal of Global Economics 4 (3): 218. doi:10.4172/2375-4389.1000218.
Jorgenson, Dale W., and Marcel P. Timmer. 2011. “Structural Change in Advanced Nations: A New Set of Stylized Facts.” Scandinavian Journal of Economics 113 (1): 1–29. doi:10.1111/j.1467-9442.2010.01637.x.
Kapelyushnikov, Rostislav, Andrei Kuznetsov, and Olga Kuznetsova. 2012. “The Role of the Informal Sector, Flexible Working Time and Pay in the Russian Labour Market
28
Model.” Post-Communist Economies 24 (2): 177–90. doi:10.1080/14631377.2012.675154.
Layard, Richard, and Andrea Richter. 1995. “Labour Market Adjustment - the Russian Way.” In , edited by Anders Åslund, 119–48. Russian Economic Reform at Risk. London: Pinter.
Leal Ordóñez, Julio César. 2014. “Tax Collection, the Informal Sector, and Productivity.” Review of Economic Dynamics 17 (2): 262–86. doi:10.1016/j.red.2013.07.004.
Lehmann, Hartmut. 2015. “Informal Employment in Russia: Incidence, Determinants and Labour Market Segmentation.” Comparative Economic Studies 57 (March): 1–30. doi:10.1057/ces.2014.44.
Lehmann, Hartmut, and Anzelika Zaiceva. 2013. “Informal Employment in Russia: Incidence, Determinants and Labour Market Segmentation.” University of Bologna Working Paper DSE 903.
Marcouiller, Douglas, Veronica Ruiz de Castilla, and Christopher Woodruff. 1997. “Formal Measures of the Informal-Sector Wage Gap in Mexico, El Salvador, and Peru.” Economic Development and Cultural Change 45 (2): 367–92. doi:10.1086/452278.
McKinsey. 2006. How Brazil Can Grow. McKinsey Global Institute. http://www.mckinsey.com/global-themes/americas/how-brazil-can-grow.
Nordhaus, William D. 2002. “Productivity Growth and the New Economy.” Brookings Papers on Economic Activity 2002 (2): 211–44.
OECD. 2002. Measuring the Non-Observed Economy. A Handbook. Paris: OECD. O’Mahony, Mary, and Bart van Ark. 2003. EU Productivity and Competitiveness: An Industry
Perspective. European Comission. Reinsdorf, Marshall. 2015. “Measuring Industry Contributions to Labour Productivity
Change: A New Formula in a Chained Fisher Index Framework.” International Productivity Monitor, no. 28: 3–26.
Restuccia, Diego. 2013. “The Latin American Development Problem: An Interpretation.” Economía 13 (2): 69–100.
Rodrik, Dani. 2008. “Second-Best Institutions.” American Economic Review 98 (2): 100–104. doi:10.1257/aer.98.2.100.
Roncolato, Leanne, and David Kucera. 2014. “Structural Drivers of Productivity and Employment Growth: A Decomposition Analysis for 81 Countries.” Cambridge Journal of Economics 38 (2): 399–424. doi:10.1093/cje/bet044.
Rosstat. 1998. Metodicheskie Polozheniia Po Statistike. Vyp. 2 [Methodological Regulations on Statistics, Vol. 2]. Moscow: Gosudarstvennyĭ komitet Rossiĭskoĭ Federatsii po statistike.
———. 2009. Trud I Zaniatost’ v Rossii, 2009 [Labor and Employment in Russia, 2009]. Moscow: Federal’naia sluzhba gosudarstvennoĭ statistiki.
———. 2010. Natsional’nye Scheta Rossii v 2002-2009 Godakh [National Accounts of Russia in 2002-2009]. Moscow: Federal’naia sluzhba gosudarstvennoĭ statistiki.
———. 2014. Natsional’nye Scheta Rossii v 2006-2013 Godakh [National Accounts of Russia in 2006-2013]. Moscow: Federal’naia sluzhba gosudarstvennoĭ statistiki.
“Russia KLEMS.” 2017. National Research University Higher School of Economics; Groningen Growth and Development Centre. http://www.worldklems.net/data/basic/RUS_wk_march_2017.xlsx.
Sharpe, Andrew. 2010. “Can Sectoral Reallocations of Labour Explain Canada’s Absymal Productivity Performance?” International Productivity Monitor 19 (Spring): 40–49.
System of National Accounts. 1993. Brussels, New York, Paris, Washington. http://unstats.un.org/unsd/nationalaccount/docs/1993sna.pdf.
———. System of National Accounts. 2008. Brussels, New York, Paris, Washington. http://unstats.un.org/unsd/nationalaccount/docs/SNA2008.pdf.

29
Tang, Jianmin, and Weimin Wang. 2004. “Sources of Aggregate Labour Productivity Growth in Canada and the United States.” The Canadian Journal of Economics / Revue Canadienne d’Economique 37 (2): 421–44.
Timmer, Marcel P., Robert Inklaar, Mary O’Mahony, and Bart van Ark. 2010. Economic Growth in Europe. Cambridge: Cambridge University Press.
Timmer, Marcel P., and Adam Szirmai. 2000. “Productivity Growth in Asian Manufacturing: The Structural Bonus Hypothesis Examined.” Structural Change and Economic Dynamics 11 (4): 371–92. doi:10.1016/S0954-349X(00)00023-0.
Timmer, Marcel P., and Ilya B. Voskoboynikov. 2016. “Is Mining Fuelling Long-Run Growth in Russia? Industry Productivity Growth Trends in 1995-2012.” In Growth and Stagnation in the World Economy, edited by Dale W. Jorgenson, Kyoji Fukao, and Marcel P. Timmer. Cambridge University Press.
Üngör, Murat. 2017. “Productivity Growth and Labor Reallocation: Latin America versus East Asia.” Review of Economic Dynamics 24: 25–42. doi:http://dx.doi.org/10.1016/j.red.2016.12.004.
Vries, Gaaitzen de, Marcel P. Timmer, and Klaas de Vries. 2015. “Structural Transformation in Africa: Static Gains, Dynamic Losses.” Journal of Development Studies 51 (6): 674–88. doi:10.1080/00220388.2014.997222.
Vries, Gaaitzen J. de, Abdul A. Erumban, Marcel P. Timmer, Ilya B. Voskoboynikov, and Harry X. Wu. 2012. “Deconstructing the BRICs: Structural Transformation and Aggregate Productivity Growth.” Journal of Comparative Economics 40 (2): 211–27.

30
Appendices
Appendix A. Usage of terms `sector’ and `segment’
The following terminology is used through the text. The economy consists of industries. Groups of
industries can be combined into aggregated sectors, such as total market economy, or sectors such
as manufacturing. The full list of industries and aggregated sectors is given in Appendix B.
Next, if the informal split is taken into account, each industry is divided into two segments,
formal and informal. Formal segments of all industries form the formal sector of the economy,
whereas the informal segments are combined into the informal one. It is also possible to discuss
informal segments of an aggregated sector, assuming the set of informal segments of industries,
which belong to the aggregated sector. For example, the informal segment of manufacturing
consists of informal segments of industries within manufacturing. It is worth mentioning that term
`sectoral contribution’ assumes the contribution of sectors or aggregated sectors only in the no-split
case.
Finally, it is worth mentioning that the informal sector addresses the set of the informal
segments of industries of the total market economy, because informal activities of the non-market
economy are not in the scope of the paper.

31
Appendix B. The list of industries and the composition of aggregated sectors
# Code Industry Sector Aggregated Sector
1 AtB Agriculture, Hunting, Forestry and Fishing
Agriculture Market economy
2 23 Fuel Extended gas and oil Market economy
3 C Mining and quarrying Extended gas and oil Market economy
4 51 Wholesale trade Extended gas and oil Market economy
5 15t16 Food, Beverages and Tobacco Manufacturing Market economy
6 17t18 Textiles and Textile Products Manufacturing Market economy
7 19 Leather, Leather and Footwear Manufacturing Market economy
8 20 Wood and Products of Wood and Cork
Manufacturing Market economy
9 21t22 Pulp, Paper, Paper , Printing and Publishing
Manufacturing Market economy
10 24 Chemicals Manufacturing Market economy
11 25 Rubber and Plastics Manufacturing Market economy
12 26 Other Non-Metallic Mineral Manufacturing Market economy
13 27t28 Basic Metals and Fabricated Metal
Manufacturing Market economy
14 29 Other Machinery Manufacturing Market economy
15 30t33 Electrical and Optical Equipment
Manufacturing Market economy
16 34t35 Transport Equipment Manufacturing Market economy
17 36t37 Manufacturing, nec.; Recycling Manufacturing Market economy
18 E Electricity, Gas and Water supply
Manufacturing Market economy
19 F Construction Retail, Construction, Telecom
Market economy
20 50 Sale, Maintenance and Repair of Motor Vehicles and Motorcycles
Retail, Construction, Telecom
Market economy
21 52
Retail trade, except of motor vehicles and motorcycles; repair of personal and household goods
Retail, Construction, Telecom
Market economy
22 H Hotels and Restaurants Retail, Construction, Telecom
Market economy
23 64 Post and Telecommunications Retail, Construction, Telecom
Market economy
24 O Other Community, Social and Personal Services
Retail, Construction, Telecom
Market economy
25 J Financial intermediation Fin. & Business Services
Market economy
26 71t74 Renting of Machinery and Equipment and Other Business Activities
Fin. & Business Services
Market economy
27 60 Inland transport Transport Market economy
28 61 Water Transport Transport Market economy
29 62 Air Transport Transport Market economy
30 63 Other Transport Services Transport Market economy
31 70 Real est. Act. Non-market Non-market economy

32
services
32 L Public Admin And Defence; Compulsory Social Security
Non-market services
Non-market economy
33 M Education Non-market services
Non-market economy
34 N Health And Social Work Non-market services
Non-market economy
Appendix C. Distributions of labour productivity levels and growth rates by
industries
Table C1. Measures of labour productivity level distribution in industries in 2005-2012
NO Split Informal Split
Mean 1.79 1.32
Standard deviation 2.33 2.20
Skewness 3.05 3.82
Kurtosis 12.46 20.20
Note. Labour productivity in industries refers to nominal value added over hours worked. Industry productivity levels are normalized to the level of total economy of a corresponding year.
Table C2. Measures of labour productivity growth rates distribution in industries in
2005-2012
NO Split Informal Split
Mean 0.0320 0.0319
Standard deviation 0.1113 0.1520
Skewness -1.7148 -0.7810
Kurtosis 9.4647 4.9661
Note. Labour productivity growth rates are measured in yearly average growth rates

33
Any opinions or claims contained in this Working Paper do not
necessarily reflect the views of HSE
© Voskoboynikov, 2017