structural and mechanical analysis of a mouse model of
TRANSCRIPT

Structural and mechanical analysis of a mouse model of massive bone allografts
and the effect of systemic anabolic parathyroid hormone therapy for graft
healing
by
David Gregory Reynolds
Submitted in Partial Fulfillment
of the
Requirements for the Degree
Doctor of Philosophy
Supervised by
Professors Edward M. Schwarz and Hani A. Awad
Department of Biomedical Engineering
The College
Arts & Sciences
University of Rochester
Rochester, New York
2008

ii
Curriculum Vitae The author was born in Rochester, NY on March 9, 1981. He attended the State
University of New York at Buffalo from 1999 to 2003, and graduated in 2003 with a
Bachelor of Science degree in Mechanical Engineering. He came to the University of
Rochester in the fall of 2003 and began graduate studies in Biomedical Engineering.
He received a Dean’s Fellowship in 2003 and 2005, and received a Master of
Sciences degree from the University of Rochester in 2005. He pursued research in
structural mechanics of bone allograft healing and potential adjuvant treatments under
the direction of Professors Edward M. Schwarz and Hani A. Awad.

iii
Acknowledgements
I would first like to thank my advisors Hani and Eddie for inspiring me to do
this work. The aspirations for the goals they set for the research were high. This
work was exciting to me technically and scientifically, but I was also largely
motivated by the belief that the clinical impact could be substantial, and that
discovering new ways of diagnosing and treating skeletal defects would influence
patient outcomes in a meaningful way. I think that was the most important lesson that
I learned about myself: that I wanted to participate in influencing patient care on a
somewhat direct role through biomedical engineering and science. I also appreciate
the challenges they presented to me which helped me to stretch as an investigator. I
always found you had an open door to talk about everything from project details and
goals to career opportunities.
I’d also like to thank my committee members for their individual
contributions to this dissertation. I must admit that it was many of your ideas that are
incorporated into my research, and this dissertation would not have been the same
without them. Thank you Ruola for your expertise in CT imaging and for creating the
equipment that will make high-resolution, low-exposure radiography for clinical
translation of these studies possible in the future. Thank you, Regis, for the big-
picture view of the need to enhance massive allografts clinically. Your oversight of
both the lab and clinical work are inspirational and impressive. Thank you, Amy, for
iv
including me as a part of your lab for Thursday morning lab meetings. The
opportunity to present to your group directly and for the exposure to other aspects of
orthopaedic biomechanics helped round out my graduate education. Also, thank you
for challenging me to look at this project from other perspectives, and for asking
critical questions. My career path was greatly influenced by the seminar of yours that
my Dad thought I would be interested in 2001. I start with that day every time
someone asks me how I chose my career path.
Thank you, Dr. Christopher Beck, for the opportunity to lend your statistical
expertise and for discussing the details of multivariate regression analyses. Drs.
Susan Bukata and Lee Kaback: Thank you for providing me with the clinical fracture
cases from your clinical research to use in showing the potential for translational
applications of this work.
I could not have accomplished much of this work without the friendship and
expertise I found around me at the Center for Musculoskeletal Research Center and
Biomedical Engineering Department. Thank you all for your collaboration and
friendship. I’ve met some of the most interesting and impressive friends. In
particular, I’d like to thank Tony Chen for his breadth of expertise in biomedical
engineering, and for really important contributions to the Matlab program that was
generated for this dissertation. Other direct contributors include Saad Shaikh,
Colleen Hock, Laura Yanoso, Owen Papuga, and Krista Scorscone.
Sources of funding include grants from the Orthopedic Research Education
Foundation, the Musculoskeletal Transplant Foundation, the Wallace H. Coulter

v
Foundation, the National Institutes of Health (AR053459, DE017096, AR054041,
AR51469, and AR48681), and research grants from DePuy, J&J Inc.
Lastly, I’d like to thank my family. Their constant patience, love and
understanding have made it possible to focus these last few months. Thank you for
helping to keep our family unit a priority – you all mean so much to me. It has been a
challenging year with the passing of our father, and your time and comfort has been
instrumental in dealing with his sudden loss. I know that he lives on in each of us,
and that his good will, hard work and joy of learning are qualities that I hope to carry
on. Andrea, thank you for your confidence in me, and for being my cheerleader
through out all of this. You’re my number one. I love you. Also, thank you for
accommodating all the time I’ve been M.I.A. to focus on writing, I couldn't have
done it without you. This thesis is dedicated to you.

vi
Abstract
The use of bone allografts for skeletal reconstructions is commonplace
clinically, but they are known to have incomplete healing even years after
implantation, fail to develop union, and ultimately fail due to unrepaired fatigue
damage. Identifying patients at risk for bone graft failure remains an unmet clinical
need. Additionally, developing new ways of enhancing bone healing are being
devised, so there is need for quantitative evaluation of their efficacy. The goals of
this dissertation were to evaluate the specific structural qualities that contribute to the
mechanical properties of grafted bones in a critically-sized defect in the mouse femur,
to generate a novel measure of graft-to-host union, and to evaluate parathyroid
hormone (PTH), a systemic anabolic bone therapy, for its effect on bone graft
healing.
An alternative to bone allograft from a tissue bank is to harvest bone from one
site within the patient and implant it into the skeletal defect site. This live bone
transplant is known as an autograft. In the first part of this dissertation, the two
standard options of bone grafting were evaluated over time to determine what
structural and morphological differences yielded the best mechanical performance
over time. Through this study a working toolset was created which could be used to
for evaluate novel adjuvant treatments for bone graft healing. We compared
processed bone allografts from donor mice which lack any intrinsic healing capacity,

vii
with live autografts, whose live periosteum and intrinsic healing capacity make them
the gold standard of bone graft materials. Surprisingly, autografts did not produce
more bone callus, but compared to the allograft the callus was better organized,
forming a bridge over the graft entirely. Correlations of the measures of cross
sectional geometry and volume of the callus and graft helped to explain up to 44%
and 50% of the variation in torsional strength and rigidity, respectively.
We observed that allograft-to-host union was deficient in many samples in
this model, which recapitulates the complication found clinically. Therefore, in the
second stage of this dissertation we devised an imaging analysis tool to measure the
degree of graft-to-host union from the CT images and coined it the Union Ratio. The
Union Ratio significantly improved the ability to predict torsional mechanics from
CT imaging by 8 to 26%, and was particularly critical in delineating successfully
healed allografts at these time points.
In the third section of this dissertation, we then investigated an adjuvant
treatment for enhancing the host's healing capacity to allografted bones. PTH has
been used to reverse osteoporotic bone loss and has recently been found to
significantly enhance fracture healing. Systemic PTH treatment was found to almost
double the callus bone volume and the union area on the allograft and nearly doubled
the yield torque and rigidity compared to saline treated controls within 6 weeks.
Multivariate regression models combining the Union Ratio, the host-to-host bridging
and the minimum cross-sectional polar moment of inertia could explain 71 – 84% of
the variation in biomechanical rigidity and strength, respectively.

viii
Lastly, progress towards evaluating persistent non unions from clinical case
studies, and measuring the effect of PTH to consolidate these fractures was made.
Together, these results indicate that achieving a high level of union, as
measured by the Union Ratio, is an important non invasive biometric in allograft
functional strength and can be improved with systemic intermittent PTH therapy
during healing.
ix
Table of Contents Curriculum Vitae .......................................................................................................... ii Acknowledgements ...................................................................................................... iii Abstract ........................................................................................................................ vi Table of Contents ......................................................................................................... ix List of Figures ............................................................................................................. xii List of Tables ............................................................................................................. xiv List of Abbreviations .................................................................................................. xv Chapter 1: ...................................................................................................................... 1
1.1 Introduction .................................................................................................... 1 1.1.1 The clinical need for bone grafting ......................................................... 2 1.1.2 Materials for segmental defect reconstruction ........................................ 4 1.1.3 Bone Healing .......................................................................................... 6 1.1.4 The murine femoral bone graft model .................................................... 8 1.1.5 Complicating factors associated with bone grafting ............................. 11
1.1.5.1 Immunological response, pathogen transmission, and graft processing ....................................................................................... 11
1.1.5.2 Microdamage accumulation in bone grafts .................................... 12 1.1.5.3 Immunologic response to bone grafts results in delayed union ..... 14
1.1.6 Physical modification for enhancing bone allografts ............................ 17 1.1.7 Alternatives to bone allografts .............................................................. 19 1.1.8 Bioactive Adjuvant Therapies............................................................... 20 1.1.9 Parathyroid hormone treatment ............................................................. 23
1.2 Overview of Dissertation ............................................................................. 25 Chapter 2: .................................................................................................................... 27
2.1 Introduction .................................................................................................. 27 2.2 Background .................................................................................................. 29 2.3 Methods ........................................................................................................ 31
2.3.1 Surgical methods. .................................................................................. 31 2.3.2 Micro-CT imaging and analysis. ........................................................... 33

x
2.3.3 Biomechanical testing. .......................................................................... 36 2.3.4 Comparison and correlation statistics ................................................... 40 2.3.5 Background on linear regression statistical analysis ............................ 40
2.4 Results .......................................................................................................... 43 2.4.1 Reduction in sample number ................................................................ 43 2.4.2 µCT-based morphology and structural indices ..................................... 44 2.4.3 Biomechanical testing ........................................................................... 49 2.4.4 Correlations between micro-CT parameters and torsional properties .. 51
2.5 Discussion .................................................................................................... 54 Chapter 3: .................................................................................................................... 62
3.1 Introduction .................................................................................................. 62 3.1.1 Previous attempts at quantifying union................................................. 63
3.2 Methods ........................................................................................................ 65 3.2.1 Experimental model .............................................................................. 65 3.2.2 Union Ratio Algorithm ......................................................................... 66 3.2.3 Validation with Digital phantom .......................................................... 68 3.2.4 Statistical Analysis ................................................................................ 70
3.3 Results .......................................................................................................... 73 3.3.1 Algorithm Validation ............................................................................ 73 3.3.2 Union Ratio of Autografts and Allografts ............................................ 73 3.3.3 Correlations between Union Ratio and Torsional Properties ............... 76
3.4 Discussion .................................................................................................... 82 3.4.1 Clinical fracture non-union case study ................................................. 86
Chapter 4: .................................................................................................................... 89 4.1 Introduction .................................................................................................. 89 4.2 Methods ........................................................................................................ 92
4.2.1 Experimental Model.............................................................................. 92 4.2.2 Biomechanical Study ............................................................................ 93 4.2.3 Vascularization and Histological Study ................................................ 95
4.2.3.1 Vascular perfusion .......................................................................... 95 4.2.3.2 Histology ........................................................................................ 96
4.2.4 Statistical Analysis ................................................................................ 96

xi
4.3 Results .......................................................................................................... 97 4.3.1 Bone analysis from Micro-CT imaging ................................................ 97 4.3.2 Biomechanical Testing Results ........................................................... 104 4.3.3 Callus Vascularization Results ........................................................... 109
4.4 Discussion .................................................................................................. 113 Chapter 5: .................................................................................................................. 121
5.1 Review of Research .................................................................................... 121 5.2 Microdamage Study ................................................................................... 123 5.3 Rationale for Future Research Directions .................................................. 126
5.3.1 Further invesitigation of Union Metrics ............................................. 126 5.3.1.1 Other Clinical Applications .......................................................... 126 5.3.1.2 How much union is needed? When is a fracture “healed”? ......... 129 5.3.1.3 An alternative measure of overall connectivity ............................ 131 5.3.1.4 Large animal models of grafting and the application of union ratio ..
..................................................................................................... 134 5.3.2 Radiation exposure and justification for clinical CT imaging. ........... 137 5.3.3 Teriparatide Therapy ........................................................................... 140
6 References ......................................................................................................... 144 7 Appendicies....................................................................................................... 157
7.1 Appendix A: UnionRatio & µCT Analysis MATLAB Code ................... 157 7.2 Appendix B: PTH for fracture healing Literature Review ......................... 169

xii
List of Figures
Figure 1.1-1: Histological imaging of mouse allografts and autografts. .................... 10
Figure 2.1-1: Structural allograft failure after implantation. ...................................... 28
Figure 2.3-1: Mouse intercalary allograft model. ....................................................... 33
Figure 2.3-2: Bone volume segmentation and quantification. .................................... 35
Figure 2.3-3: Torsion testing apparatus and setup. .................................................... 38
Figure 2.3-4: Structural graft modes of failure during torsion testing. ....................... 40
Figure 2.4-1: Micro-CT images of allografts and autografts healing over time. ........ 45
Figure 2.4-2: Mineralized callus and graft volumes during femoral allograft and
autograft healing over time. .................................................................. 47
Figure 2.4-3: Cross-sectional PMI Analysis of a representative allograft and autograft.
.............................................................................................................. 48
Figure 2.4-4: Cross sectional Polar Moment of Inertia Data. ..................................... 49
Figure 2.4-5: The torsional properties of femoral allografts and autografts over time.
.............................................................................................................. 50
Figure 2.4-6: Multivariable linear regression analysis micro-CT parameters vs
mechanical outcomes. .......................................................................... 53
Figure 2.4-7: Torsional strength and rigidity vs mode of failure. ............................... 54
Figure 3.2-1: Illustration of the graft-to-host Union Ratio algorithm. ........................ 67
Figure 3.2-2: Algorithm validation using a digital model. ......................................... 69

xiii
Figure 3.3-1: Representative micro-CT and union area images. ................................ 74
Figure 3.3-2: Multivariable linear regression analysis. .............................................. 79
Figure 3.3-3: Multivariable linear regression analysis of allografts ........................... 81
Figure 3.4-1: Measuring the Union Area from clinical CT data of human patients. .. 87
Figure 4.2-1: Experimental Design ............................................................................. 93
Figure 4.3-1: Sagittal cross sections of grafted femurs. .............................................. 99
Figure 4.3-2: Representative BV quantification from micro-CT imaging ............... 101
Figure 4.3-3: Representative CT and Union Ratio images ....................................... 103
Figure 4.3-4: Linear regressions between mechanical properties and Union Ratio. 108
Figure 4.3-5: Vascularization of callus in Saline and PTH treated animals. ............ 110
Figure 4.3-6: Maximum intensity projections of vascular perfusion imaging. ......... 111
Figure 4.3-7: Multivariable linear regression results. ............................................... 112
Figure 5.2-1 Microdamage in mouse cortical bone .................................................. 125
Figure 5.3-1: 2D Flow connectivity example. ......................................................... 133
Figure 5.3-2: Case study: Union area of a proximal tibia allograft ........................ 135

xiv
List of Tables Table 2.4-1: Specimen sample size per group ............................................................ 44
Table 2.4-2: Distribution of allograft and autograft modes of failure in torsion over
time ........................................................................................................ 51
Table 2.4-3:Correlation coefficients and significance levels for single variable linear
regression models of micro-CT-based estimates of graft ultimate torque
and torsional rigidity .............................................................................. 52
Table 2.5-1: Relative resolution of routine clinical CT images to micro-CT images for
cortical bone and trabecular bone. ......................................................... 61
Table 3.3-1: UnionRatio and Host-to-Host bridging callus results ............................ 75
Table 3.3-2: Coefficients of determination and p-values for the univariate linear
regression of non-structural and structural independent variables TUlt and
TR. ......................................................................................................... 77
Table 4.3-1: Micro-CT imaging parameters of grafted femurs. ............................... 102
Table 4.3-2: Micro-CT imaging parameters of intact contralateral femurs. ............. 102
Table 4.3-3: Torsional properties of grafted and contralateral femurs in mice treated
with PTH or saline as control............................................................... 105
Table 4.3-4: Grafted femur mode of failure after torsion testing. ............................ 106
Table 4.3-5: Coefficients of determination (R2) for the univariate linear regression of
structural independent variables vs. mechanical properties TR, TYield and
TUlt. ....................................................................................................... 107
xv
List of Abbreviations
BMC: Bone Mineral Content
BMD: Bone Mineral Density
BMP: Bone Morphogenetic Protein
BV: Bone Volume
BVF: Bone Volume Fraction
DBM: Demineralized Bone Matrix
MSC: Mesenchymal Stem Cell
PBS: Phosphate buffered saline
PMI: Polar Moment of Inertia
PTH: Parathyroid Hormone
Tb.N.: Trabecular Number
TUlt: Ultimate Torque
TR: Torsional Rigidity
Tb.Sp: Trabecular Separation
Tb.Th.: Trabecular Thickness
W: Work (energy) to failure

1
Chapter 1: Introduction to bone grafting, Background and Overview of Dissertation 1.1 INTRODUCTION
The clinical need for bone grafting is to provide a source of material to
reconstruct skeletal defects for both the immediate restoration of mechanical function,
as well as the long-term durability of that surgical reconstruction. Bone allografts,
harvested post-mortem from organ and tissue donors, are the material of choice due to
their availability, workability, and largely positive outcomes. Unfortunately allografts
have complication and failure rates that are unacceptable, especially as patient life
expectancy after grafting is improving. There is a clinical need to identify recipients
whose grafts are at risk for failure and a need to define and validate adjuvant therapy
options which improve bone graft healing and longevity. The breadth of options
available for augmenting repair is widening as refinements are made to tissue
engineered bone substitutes which are osteoconductive and osteoinductive, easily
workable and have load-bearing capacity. New bioactive components and
coengraftment with live biologics are more commonly used than ever and are
improving outcomes. Improvements in medical imaging have given rise to routine
high-resolution 3D imaging using computed-tomography and magnetic resonance
imaging. While most clinical diagnoses such as the presence of bone fracture or

2
tumors are given based on qualitative evaluations, there is an increasing ability to
perform quantitative analysis for making diagnoses. Quantitative measures can
indicate biological function, but must be validated against functional gold standards
including strength and durability. Therefore, novel quantitative analyses need to be
developed in pre-clinical animal models and cadaveric studies where other destructive
analyses can be undertaken such as mechanical testing and histology.
In this introductory chapter, the need for bone grafts and the current state of
the art of grafting procedures will be introduced. Bone graft limitations, alternatives,
supplemental treatments for bone grafting will be presented. The state of the art in
quantitative diagnostic imaging tools will be reviewed. Finally, the objective of this
dissertation will be introduced.
1.1.1 The clinical need for bone grafting
As many as 800,000 skeletal bone grafting procedures are performed yearly in
the United States (Delloye et al. 2007). Large structural bone grafts from organ/tissue
donors are used to fill critical-sized skeletal defects which are a result of procedures
such as revision arthroplasty, surgical resection of tumors, and reconstruction after
trauma, including an increasing number of injured military service members. A
critical-size defect in bone is defined as a gap that is too wide for bone callus to form
bridging between the segments on its own. Therefore, critical defects need to be
filled during surgery in order to heal fully. Much of the 800,000 skeletal grafts used
each year are smaller and are for spinal fusion, joint arthrodesis, cranio-facial and

3
dental reconstruction. Another large category within bone grafts are products that
contain demineralized bone matrix (DBM) which comes in a variety of forms. What
remains after acid demineralization of bone is the underlying collagen matrix and
many osteoinductive factors including bone morphogenetic proteins (BMP) (Reddi
1998). DBM has been used since 1961 to stimulate bone formation, especially to
treat open fractures, non-unions, and to fill bone voids (Sharrard et al. 1961).
The need for improved success in bone grafts is critical in patients who
receive them for defects iatrogenically created after resection of tumors. Every year
there are approximately 300 new cases of Ewing’s Sarcoma in the USA, 700
osteosarcomas and 550 chondrosarcomas (Damron et al. 2007). Typical care consists
of surgical resection of the tumor often in combination with chemotherapy. The 5
year patient survival rate for non-metastatic Ewing’s Sarcoma has increased from
44% in the 1970s to 68% in the 1990s (Esiashvili et al. 2008). Overall survival rate
in children is between 55 and 68% (Desandes 2007). For limb-sparing surgery in
these children, bone grafts are often used to fill the large defect created by the
removal of the tumor and generally lead to enhanced quality of life. Alternatives are
implanting megaprostheses, limb amputation and rotationplasty but each is associated
with significant limitations and discomfort.
Other populations of patients receiving allografts include those who have
experienced complicated fractures due to trauma, patients who require spinal fusions
and arthroplasties. Unfortunately there are a growing number of soldiers
experiencing traumatic war injuries. There have been over 38,000 US troops

4
wounded-in-action during the Iraq war since 2003 (Defense 2008) and 28% of
injuries involve bone fractures (Baer et al. 2004) which have a high risk for infection,
osteomyelitis and non-union. Combinations of antibiotics and bone graft materials
would improve outcomes in these relatively high-morbidity injuries (Owens et al.
2006). The majority of spinal fusions use bone autograft material to achieve success
rates of 92 – 100% (Sandhu et al. 1999). In 1996 there were 228,000 spinal fusions in
the US and the number was increasing steadily. Unfortunately, the harvest of
autograft material is associated with donor site morbidity (Seiler et al. 2000; Hartman
et al. 2002) so alternatives such as allografts and osteogenic stimulating factors are
being investigated (Albert et al. 2006). Revision arthroplasties are often challenging
due to the need to make up for a loss of a patient’s bone stock caused by osteolysis,
stress shielding, infection, necrosis or complicated fractures (Huff et al. 2007) around
their old arthroplasty, which can be especially difficult in osteoporotic patients.
These defects are reconstructed with either intact cortical bone grafts or allograft
chips impacted into the defect as a void filler. These examples of the broad use of
allograft material in a variety of patients with diverse indications suggests that the use
of bone allografts will only continue to increase, thus further research to improve
these outcomes will have a large impact.
1.1.2 Materials for segmental defect reconstruction
There are a few different materials to select from which can be used to fill
large bone voids. The gold standard for sufficient healing capacity are live bone

5
autografts which are harvested from a secondary location within the patient’s body
and transplanted as live tissue. These are intrinsically osteoinductive have high
intrinsic healing capacity. The two major sites for autograft harvest are from the iliac
crest, and the fibula. Unfortunately, there is a limited source of autograft material
available for transplanting within a patient. There is also significant chronic pain and
morbidity associated with the site of autograft harvest (Summers et al. 1989; Younger
et al. 1989). The cortico-cancellous iliac crest can be harvested in a variety of shapes
to fit a variety of reconstructive needs, or it can be harvested and morselized to be
used as an osteoinductive supplement for bone healing (Sandhu et al. 1999). The
upper two-thirds of the fibula can be used for longer structural struts. Microsurgical
techniques can also retain the vascular connections of the fibular autografts at harvest,
and reconnect them to the vasculature of the new host location, thus preventing bone
necrosis (Doi et al. 1988). The live cellular component of autografts makes them
advantageous over allografts for their ability to form union, remodel and repair over
time. Live cells within the autograft, including osteocytes, active osteoclasts and
osteoblasts, vascular tissue, and the periosteum provide a rich population of
mesenchymal and osteoblastic cells and are active sources of the intercellular signals
to mediate healing. The live periosteum itself contains such a high density of
mesenchymal stem cells that can fill critically-sized defects in a ovine model of
intercalary defect by itself (Knothe Tate et al. 2007).
Bone allografts are used in most cases because they can be matched by size,
are somewhat osteoconductive, and allow for tendon and ligament reattachment.

6
When a joint is involved, the articular surface of a bone can have relatively good
outcome for a number of years, especially when the surface it is articulating against is
intact live articular cartilage (Hornicek et al. 1998; Shasha et al. 2003). Bone
allografts illicit little immune response after they have been processed, cleaned and
sterilized by the tissue banks, but this leaves them devitalized, thus lacking the
intrinsic cellular components that would mediate repair of the tissue. Unfortunately,
allograft procedures for large segmental defects experience failure rates of 23-43%
within 5 years of implantation. The majority of these failures occur within 2 years
(Berrey et al. 1990). Within these failed allografts non-unions are a contributing
complication in 27-34%, while 24-27% fracture and 9-16% have infection (Brigman
et al. 2004; Donati et al. 2005). Bone allografts are remarkably safe from infectious
contaminants and contaminated bone material is considered “a known but uncommon
complication” because of strict and effective processing controls (CDC MMWR
2002). Bone grafts rarely are thought to be responsible for the infections that arise
after surgery, (Loty et al. 1994) and are likely due to surgical introduction of
infectious agents.
1.1.3 Bone Healing
The healing response around massive bone allografts is similar to that of
typical fracture repair. Fracture healing involves three overlapping phases: the
inflammatory stage, the reparative phase, and the remodeling phase (Cruess et al.
1975; Einhorn 1998). Fracture causes a hematoma to form from the blood vessels

7
that are ruptured, and blood clotting takes place. The damaged tissue and hematoma
release cytokines that drive infiltration by inflammatory macrophages, fibroblasts and
capillary sprouting. Fibroblasts begin to lay down new matrix upon which vascular
tissue can form while macrophages begin removing debris such as the clot and
necrotic tissue. Upon neovascularization of the tissue this is termed granulation
tissue. This inflammatory phase allows for the involvement of mesenchymal cells
which get recruited to the fracture where they can then proliferate and differentiate
into chondrocytes. These chondrocytes begin to stabilize the fracture by laying down
cartilaginous callus which begins the reparative phase. This is the soft-tissue anlage
within which mineralization will occur by cartilaginous tissue hypertrophy and
osteoid deposition which will mineralize, making woven bone, thus generating the
initial consolidation of the fracture. This mineralized callus undergoes a prolonged
remodeling phase which transforms the callus into well-organized cortical bone
(Isaksson et al. 2008). As a master regulator of osteoclast activity, fracture
remodeling is partly governed by RANK signaling; the absence or blockade of it
causes osteopetrosis at the fracture site and inhibits revascularization within the callus
(Flick et al. 2003). Remodeling is partly mechanically regulated whereby regions
exposed to stress undergo more bone formation (Forwood et al. 1995), while areas
which lack stress are resorbed (Aro et al. 1982).
8
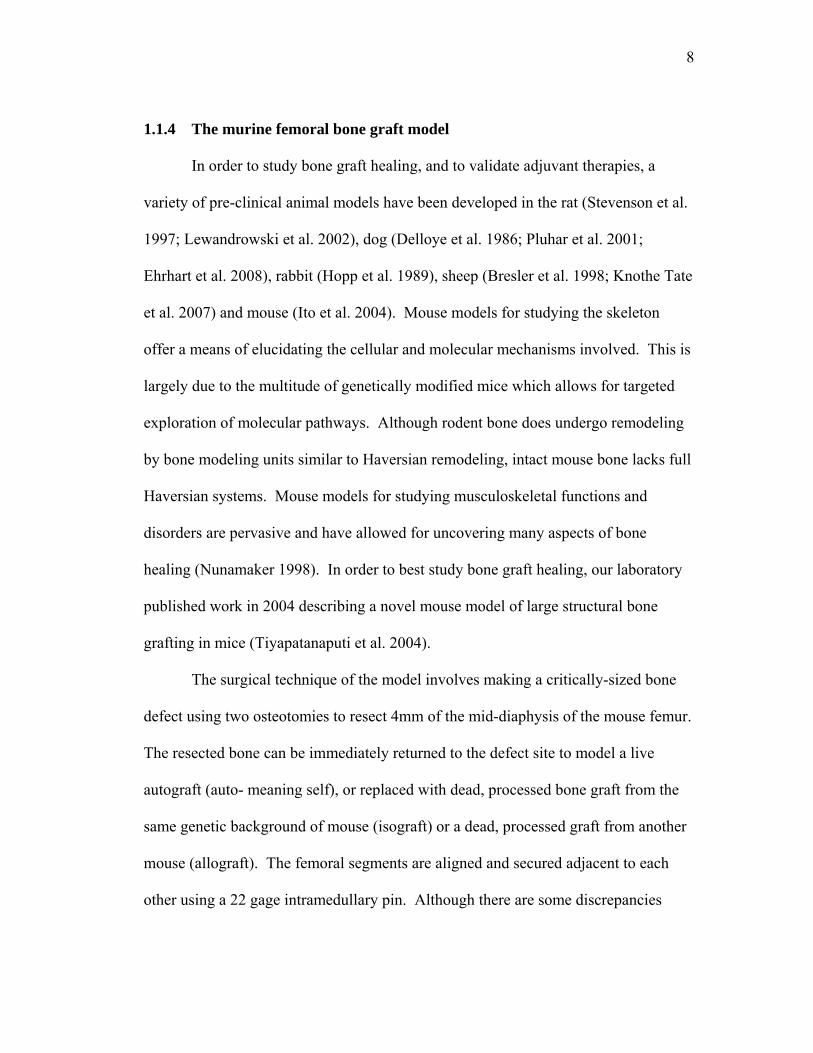
1.1.4 The murine femoral bone graft model
In order to study bone graft healing, and to validate adjuvant therapies, a
variety of pre-clinical animal models have been developed in the rat (Stevenson et al.
1997; Lewandrowski et al. 2002), dog (Delloye et al. 1986; Pluhar et al. 2001;
Ehrhart et al. 2008), rabbit (Hopp et al. 1989), sheep (Bresler et al. 1998; Knothe Tate
et al. 2007) and mouse (Ito et al. 2004). Mouse models for studying the skeleton
offer a means of elucidating the cellular and molecular mechanisms involved. This is
largely due to the multitude of genetically modified mice which allows for targeted
exploration of molecular pathways. Although rodent bone does undergo remodeling
by bone modeling units similar to Haversian remodeling, intact mouse bone lacks full
Haversian systems. Mouse models for studying musculoskeletal functions and
disorders are pervasive and have allowed for uncovering many aspects of bone
healing (Nunamaker 1998). In order to best study bone graft healing, our laboratory
published work in 2004 describing a novel mouse model of large structural bone
grafting in mice (Tiyapatanaputi et al. 2004).
The surgical technique of the model involves making a critically-sized bone
defect using two osteotomies to resect 4mm of the mid-diaphysis of the mouse femur.
The resected bone can be immediately returned to the defect site to model a live
autograft (auto- meaning self), or replaced with dead, processed bone graft from the
same genetic background of mouse (isograft) or a dead, processed graft from another
mouse (allograft). The femoral segments are aligned and secured adjacent to each
other using a 22 gage intramedullary pin. Although there are some discrepancies

9
between this model and the clinical setting, much of what is found clinically is
recapitulated in this model. Autograft repair is somewhat similar to fracture healing
in that a combination of endochondral bone formation occurs between the segments
of bone and intramembraneous bone arises from the periosteum. In the mouse, the
entire periosteum of the segmental autograft is activated by 2 weeks and results in
new bone formation along the entire length of the graft which generates a new
cortical shell bridges from host-to-host over the graft by 4 weeks (Figure 1.1-1).
Processed allografts lack a periosteum and thus have no intramembranous bone
formation along their length. Allograft repair is limited to the endochondral bone
formation initiated at the ends of the host adjacent to the graft and forms union by
creeping callus formation. Union onto the surface of the graft may be inhibited by a
fibrotic barrier that forms early on around the graft as a foreign body reaction.
Another attribute unique to autografts is their ability to be remodeled which is absent
in allografts for at least 4 weeks. Autografts are undoubtedly damaged due to the
osteotomies, and somewhat necrotic after having been severed from the vasculature,
which would cause osteocytes and bone lining cells to activate targeted resorption of
damaged tissue.

10
2 Weeks
Autograft
Allograft
4 WeeksA B
C D
Figure 1.1-1: Histological imaging of mouse allografts and autografts.
Histologic sections from fresh femoral autografts (A, B) and processed frozen
allografts (C, D) at 2 weeks (A, C) and 4 weeks (B, D) post-grafting, and stained with
alcian blue/hematoxylin. Bone formation along the length of autografts was
increased compared to allografts due to the periosteal bone formation. Bone union
occurred in all autografts by 4 weeks. There was also significant remodeling of the
entire autograft. In contrast, the ends of the allografts reached unions via creeping
callus from the host at the graft–host junction (arrow), and an absence of allograft
remodeling at week 4. (Adapted from Tiyapatanaputi 2004)

11
1.1.5 Complicating factors associated with bone grafting
1.1.5.1 Immunological response, pathogen transmission, and graft processing
Early studies showed that the immune response to minimally processed bone
grafts can be significant and that the major contributors were the cellular components
of the marrow and periosteum (Burwell 1963). Removal of cells and debris by
processing can be achieved by physical debridement, and cleansing with chemicals
such as surfactants and alcohols (Boyce et al. 1999). To prevent graft exposure to
pathogens, this processing needs to be done aseptically which can be expensive and
time consuming, so alternatively, less stringent pre-processing techniques followed
by a form of terminal sterilization can be used to achieve pathogen inactivation.
Proven forms of terminal sterilization are gamma irradiation (Sautin 1963; Loty et al.
1990; Nguyen et al. 2007), electron beam radiation (Lekishvili et al. 2004), and
ethylene oxide gas sterilization (Cloward 1980; Kakiuchi et al. 1996). Donor
screening is the first step in ensuring a safe graft tissue supply to eliminate those with
known infections, and those with risk factors associated with contracting infections,
but still, isolated cases can slip through. Simonds identified a case in which a donor
who was not identified as an HIV carrier because their serum was HIV-1 antibody
negative, but unfortunately 7 recipients of live organ or unprocessed-tissues
contracted the virus from the transplant (Simonds et al. 1992). Fortunately, viral
inactivation for reduction of the transmission in HIV, hepatitis and other infectious
agents was shown to be highly effective in this case, as graft processing prevented
disease transmission in all 34 recipients of processed tissues.

12
Other processing such as freeze drying (lyophilization) for final storage at
room temperatures for up to 5 years is an acceptable method under standards by the
American Association of Tissue Banks (Kagan 1998), but this has been shown to
reduce biomechanical strength both immediately after processing transplantation, and
is not recovered after subcutaneous implant (Kang et al. 1995) nor in a intercalary
implantation in a feline segmental cortical defect (Nather et al. 2004) where the freeze
dried bone was also less durable. Therefore, a balance between quality of graft
processing to reduce immunogenicity and disease transmission as well as
affordability of processing and storage on one hand, and maintining osteoconduction
and the biomechanical properties of the graft on the other hand needs to be achieved
according to the type of application.
1.1.5.2 Microdamage accumulation in bone grafts
Since bone allografts are implanted as devitalized material, they are subject to
accumulation of unrepaired microdamage which weakens the material over time
(Wheeler et al. 2005). This is suspected to be a major cause of catastrophic failures.
Elevated stress concentrations at the interface of implant hardware and bone are a
source of microcrack initiation (Zioupos et al. 1995; Huja et al. 1999). They are
localized at the interface between bone and prosthetic implant hardware for internal
fixation such as stems, plates and screws. Increased microdamage accumulation is
associated with cyclic loading of endosteal implants. In a study of a screw implanted
into dog cortical bone, microdamage accumulated quickly if loading was initiated

13
early after implantation. After 12 weeks of adaptation of the live bone to the implant,
osseointegration of the bone with the implant greatly minimized microdamage
accumulation (Huja et al. 1999). Clinically, allografts also experience an increased
fracture incidence when internal fixation devices penetrate the cortex of the allograft
(Thompson et al. 1993; Thompson et al. 2000; Enneking et al. 2001). Unfortunately,
targeted remodeling of microdamage (Burr et al. 1985) is absent in bone allografts
and they are incapable of adaptation around implants, thus there is an increased risk
of microdamage accumulation and fatigue failure in bone grafts. Targeted bone
remodeling after cyclic-loading-induced microdamage is mediated by the network of
osteocytes in bone (Bentolila et al. 1998). In healthy bone subjected to cyclic loading
osteocytes near microcracraks undergo apoptotic changes including DNA
fragmentation as indicated by TUNEL staining and pyknotic nuclei are there is
associated remodeling of these areas by bone remodeling units (Verborgt et al. 2000;
Verborgt et al. 2002). Targeted remodeling is therefore absent in acellular, processed
allografts. Quite recently a study found that the neuronal network may also be
involved in localized bone changes (Sample et al. 2008).
Techniques for visualizing microdamage have been developed since 1960
(Frost 1960). The gold standard has been to stain all pores within bone en bulk using
basic fuchsin before embedding in plastic for thick-sectioned slices (~200um) (Burr
et al. 1990). After sectioning, microcracks and diffuse microdamage are identifiable
using transmitted light or epifluorescent imaging (Huja et al. 1999) and are
quantifiable with manual image analysis and stereology techniques. Additionally,

14
bulk staining protocols with calcium-chelating fluorescent dyes such as calcein have
been formulated which allow epiflourescent and 3D confocal imaging of microcracks
(O'Brien et al. 2000; Lee et al. 2003). Other tools to identify microdamage in bone
include nonlinear resonant ultrasound spectroscopy (Muller et al. 2008), or barium
sulfate precipitation contrast enhanced computed tomography (Wang et al. 2007), or
super-high resolution synchrotron radiation computed tomography (Thurner et al.
2006). However, all of these techniques require the use of ex vivo bone samples and
thus cannot yet be applied clinically. Although microdamage accumulation is
associated with bone fatigue failure, accumulation of microdamage is currently
undetectable and unpredictable in clinical allografts and thus there are no indicating
risk factors for potential fatigue failures. This shortcoming deserves further
investigation and development of additional tools for studying it non-invasively. In
the mean time, the emphasis still remains on adjuvant therapies to enhance graft
healing to compensate for weakening bone material. There is also the need to devise
non-invasive clinical outcome measures to identify other risk factors such as non-
unions, or insufficient callus formation and organization. This dissertation identifies
potential solutions to these needs.
1.1.5.3 Immunologic response to bone grafts results in delayed union
Studies investigating tissue-type matching of allografts with their recipients
have not found conclusive evidence that the effect is substantial after processing
(Ward et al. 2008). Despite the fact that bone allografts have little immunologic

15
rejection associated with them (Pelker et al. 1989), they can experience a foreign
body reaction which limits their osteointegration, which could lead to prolonged non-
union between the graft and host bone. This foreign body reaction appears in the form
of an acellular fibrous barrier around the bone graft material which isolates the graft
from the host (Enneking et al. 2001; Tiyapatanaputi et al. 2004). This likely prevents
the penetration of bone modeling units into allografts, thus impairing allograft
revitalization and revascularization. The major complicating result of this is that the
establishment of union to allografts is slow, occurring anywhere between 8 and 18
months after implantation (Enneking et al. 2001; Ward et al. 2008). A complicating
factor has also uncovered that non-unions actually have an increased number of
osteoclasts (Laird et al. 2006) in a study of sheep intercalary bone grafts. Animals
with non-unions had greater numbers of osteoclasts on the surface of the graft than
those with unions. The cells that make up the fibrotic layer around non-unions
expressed the gene for the receptor activator of NF-κB ligand RANKL in non-union
specimens. These observations led to a recommendation that osteoclastic resorption
should probably be prevented by using bisphosphonates. On the other hand,
osteoclastic resorption has been recognized as the first important step to revitalizing
bone graft tissue. The debate over whether osteoclastic resorption is beneficial or
harmful may continue until a solution is found that imposes coupled remodeling of
bone allografts in which osteoblasts follow osteoclasts in succession. Previous studies
of cortical allografts and autografts in our lab found that allografts were deficient in
the osteoclastic stimulatory factor RANKL which corresponded to fewer osteoclasts
16
on the cortical surface (Ito et al. 2004; Tiyapatanaputi et al. 2004). Replenishing the
expression of this signaling factor, in combination with VEGF for stimulating
neovascularization using recombinant adeno-associated viral (rAAV) vectors was
found to revitalize implanted dead allograft bone. Surface remodeling and a 10-fold
increase in new bone formation on the graft was found by 4 weeks (Ito et al. 2005).
The immune system's foreign body reaction to the graft likely prevents graft-
to-host union. Non-union results in instability between the graft and host and puts
more stress on internal fixation hardware and raises the risk of failure. In addition,
non-union is the strongest indicating risk factor in patients whose allografts failed due
to fracture (Berrey et al. 1990). This indicates that a major deficit in graft durability
is a lack of union. Therefore I hypothesize that establishing union is paramount for a)
redistributing load from the implant-graft junction onto the graft-host junction,
thereby relieving the stress at the screw-bone interface, and b) providing a source for
bone modeling units to begin to revitalize the acellular, necrotic graft bone. The
extent of remodeling in massive bone allografts has been found to very limited, only
affecting ~20% of the bone graft in grafts recovered 5 to 13 years after implantation.
An approximate rate of remodeling into the graft surface is only 2 – 3 mm of depth
per year (Enneking et al. 1991; Stevenson et al. 1992; Enneking et al. 2001).
Interestingly, of allografts that are retrieved due to complications ~10% of them were
due to extensive graft resorption that is not associated with repair, remodeling or
revascularization (Wheeler et al. 2005). This indicates that there is at least a subset of

17
specimens that may be identifiable by x-ray as requiring an intervention to stimulate
osteoblastic bone formation.
1.1.6 Physical modification for enhancing bone allografts
Many strategies have attempted to overcome the low osteoinductivity,
imperfect osteoconductivity, and poor rate of remodeling of bone allografts by
physical modification. Early studies with demineralized bone matrix (DBM)
demonstrated that after leaching the mineral away, the remaining matrix contains
proteins that are remarkably osteoinductive (Urist 1965). The osteoinductive
components of DBM were later purified and categorized as the family of bone
morphogenetic proteins (BMPs). Surface demineralization of bone grafts was
attempted to expose these osteogenic factors but proved to not significantly improve
bone graft fate and there were few studies after 1987 (Dubuc et al. 1967; Pike et al.
1974; Kakiuchi et al. 1987) until recently when surface demineralization was
investigated for its potential to retain therapeutic agents for local delivery onto the
graft surface (Yazici et al. 2008).
Perforations within cortical allografts have been shown to affect remodeling in
some studies. Using a 1mm drill, radial perforations were made in allografts which
were implanted into a sheep defect for 6 months. Compared to standard allografts,
perforated grafts had increased bone callus formation, especially endosteal bone, and
the porosity of the graft was greatly increased due to remodeling (Delloye et al.
2002). Lewandrowski’s study compared standard allografts with partially

18
demineralized allografts and perforated and partially demineralized allografts. They
found increasing resorption and remodeling rates with the combination of
demineralization plus perforation (Lewandrowski et al. 2001). They also showed that
after 9 months, grafted bone with longitudinal perforations enhanced bending
stiffness of partially demineralized bone grafts, but were not stiffer than standard
allografts, while those with only demineralization were also weaker (Lewandrowski
et al. 2001). These studies raised concerns that mechanical integrity was
compromised in these more porous grafts (Lewandrowski et al. 1998; Lewandrowski
et al. 2001) and they have so far been rejected as a clinical alternative (Rees et al.
2003). A finite element study showed that bone is more sensitive to transverse
perforations than longitudinal perforations under axial or diametral compression
(Santoni et al. 2007) and so an in vivo study evaluating longitudinal perforations and
low intensity pulsed ultrasound (LIPUS) was undertaken. They have recently shown
that LIPUS and partial longitudinal perforations in cortical allografts seems to
improve incorporation, and increase torsional strength and stiffness by about 100%
over standard allografts, but due to a small number of animals (n=3) statistical
significance was not achieved (Santoni et al. 2008).
Additional work has been attempted to coat bone grafts with a biocompatible
polymer foam to enhance osteoconductivity of perforated and demineralized bone
grafts. They have found that a porous poly(propylene fumarate) (PPF)-hydroxlapatite
composite foam coating on allografts improves histologic incorporation of the graft-
host interface and higher strength than the uncoated controls (Lewandrowski et al.

19
2002) while at the same time protecting graft resorption. It is not possible to know if
perforation and demineralization were necessary or effective here as the PPF coating
on standard allografts was not evaluated.
In summary, physical modifications of cortical allografts have improved over
the last few decades and are encouraging means of altering osteoconductivity and
graft resorption. However, they have not overwhelmingly shown their worth, nor has
it been shown whether the perforations and demineralization affect internal fixation
devices such as plates with screws.
1.1.7 Alternatives to bone allografts
Other alternatives to structural bone grafts are engineered bone scaffolds, and
implantable prostheses. Bone scaffolds have been under development for many years.
They are typically engineered to be implanted into a void as a biocompatible,
osteoconductive 3D lattice upon which the host’s osteogenic cells will infiltrate and
eventually generate real bone. Generating scaffolds that are highly porous allows for
vascular invasion and space for new bone formation. Composition using
biodegradable materials makes complete substitution of the synthetic material
possible. Unfortunately, scaffold materials that are sufficiently strong for the load-
bearing requirements to fill major structural defects while at the same time providing
porosity and controlled biodegradation properties for positive long-term outcomes
have yet to be successfully implemented clinically. Large endoprostheses are also
available for skeletal reconstruction specifically generated for osteochondral,
20
intercalary or other defects. These can be effective, especially for revision surgeries,
but are also associated with complications. Therefore bone allografts remain the most
effective material for large skeletal reconstructions.
1.1.8 Bioactive Adjuvant Therapies
The need for adjuvant therapies for enhancing allografts is an unmet clinical
necessity. Beyond physical modification graft modification, as discussed in Section
1.1.5, three general strategies for actively overcoming the biological limitations of
allografts are 1) delivery of bioactive signaling molecules such as BMPs, 2) co-
engraftment of stem cells, and 3) therapeutic gene delivery locally to the cells around
the graft and 4) anabolic bone factors such as parathyroid hormone can be given
locally and systemically as a bone anabolic factor. The biological signals such as
BMPs can activate and recruit the host’s osteogenic population (Okubo et al. 2000).
Stem cell engraftment is meant to replenish the missing precursor population that can
differentiate into the terminal stage cells that can generate callus (Tsuchida et al.
2003). Delivering specific genes of interest locally to the cells around the graft
allows them to be the machines of the signaling molecules. This can elevate and
sustain the level of the signal beyond direct delivery of the signal, thus potentially
having a more pronounced effect.
Pre-clinical results suggested that proteins from the BMP family of growth-
regulatory factors improve bone callus generation around allografts (Cook et al. 2000;
Pluhar et al. 2001; Jones et al. 2006; Chen et al. 2007; Fukuroku et al. 2007). Short

21
exposure times and half-life of the factor is suspected to be the dominant reason why
such high doses are required, so creating slow-release delivery methods has been
investigated (Seeherman et al. 2004). The high level of dose required to produce
effective results also makes it an expensive treatment option. Evaluating the effect of
BMP treatment on bone healing and comparing the resulting costs is critical to
establish whether it is clinically cost effective. One study by Garrison et al. evaluated
the gains in patient outcomes, which included healing time, and the number of
secondary interventions, as a result of adjuvant BMP treatment for fractures, non-
unions and spinal fusion. They found that including adjuvant BMP in treatment
compared to conservative treatment had a moderate probability of being economically
justifiable for tibial fracture non-unions, and a low probability of cost-effectiveness
for lumbar spinal fusions (Garrison et al. 2007). Even greater dosages would likely
be required to affect massive cortical allografts.
Coengraftment of live stem cells to replace those that are inherently missing in
bone allografts has also been a method of enhancing bone allografting and fracture
healing (Bruder et al. 1994; Soltan et al. 2007). Rich sources of mesenchymal stem
cells are harvested from sources such as morselized autograft, as mentioned above, or
from bone marrow. This has been clinically adopted in the form of a paste that is
made from calcium phosphate collagen and autologous bone marrow aspirate such as
Vitoss (Meadows 2002) and CopiOs (www.Zimmer.com). Another source of
supplemental stem cells could be allogeneic mesenchymal stem cells (MSCs). They
have been reported to be immunoprivileged (Niemeyer et al. 2004) but this has not

22
yet been thoroughly evaluated since they have also been shown to induce immune
response and tissue rejection (Liu et al. 2006; Nauta et al. 2006; Kotobuki et al.
2008).
Delivery of therapeutic genes to stimulate skeletal reconstruction can be
accomplished by a variety of methods. Mesenchymal stem cells from various sources
can be harvested and modified ex vivo using viral vectors or other transfection
methods such as electroporation then implanted surgically (Aslan et al. 2006; Hidaka
et al. 2006). Naked plasmid delivered in vivo using a porous biocompatible material
has been coined a gene-activated matrix (GAM) (Fang et al. 1996; Bonadio et al.
1999). Transfection efficiency of locally delivered genes can be enhanced using
ultrasound and has shown to successfully induced gene expression and bone
formation (Sheyn et al. 2008). Engineered viral vectors carrying genes have been
investigated as direct in vivo gene transducers using adenovirus (Jane et al. 2002;
Chen et al. 2003; Tsuda et al. 2003), and adeno-associated virus (AAV) (Ito et al.
2004; Koefoed et al. 2005). Recently, successful delivery of BMP-2 genes was
enhanced using AAV vectors containing self-complementary (double-stranded) DNA
as opposed to previous single-stranded AAV vectors (Gazit et al. 2008) to induce
bone formation over mouse calvarial allografts. Regulation and control of gene
therapy using activation and suppression techniques would mitigate concerns about
unregulated expression of exogenous genes (Gafni et al. 2004). Engineered bone
graft substitutes combining multiple therapies are being designed to optimize
functional outcomes (Mihelic 2004; Tan et al. 2005).
23
Although there are many implantable therapeutics being developed for
enhancing surgical shortcomings at the time of surgery, there are few which can be
employed without surgical intervention. Since there is no way of knowing a priori
which graft procedures will result in non-unions or experience fatigue failure, it may
be hard to justify the additional expense of adjuvant treatments for all patients. Also,
many of these experimental therapeutics are not yet approved by the Food and Drug
Administration (FDA) for clinical use. Therefore, an FDA approved therapy which
requires no surgical intervention was investigated to determine its effects on bone
healing around allografts. This therapy is intermittent PTH 1-34, also known as
teriparatide, and marketed under the brand name Forteo™ by Lilly Pharmaceuticals.
1.1.9 Parathyroid hormone treatment
The mechanism of action of parathyroid hormone (PTH) is incompletely
understood, and its effects are diverse and seemingly incongruous, but they have been
studied in many settings and proven to be largely effective, safe and reliable as a
treatment. The basics about PTH’s actions will prove important to explaining the
effect on bone graft healing in Chapter 4. PTH has bi-phasic effects on skeletal bone
mass depending on the duration of exposure in the blood. Continuous upregulation of
PTH stimulates osteoclastic resorption of the skeleton, while intermittent exposure to
PTH causes bone formation (Locklin et al. 2003).
Under normal conditions, parathyroid hormone is a systemic master regulator
of calcium metabolism in the skeleton. When serum calcium concentration is low,

24
parathyroid cells secrete PTH into the blood. There are multiple targets within the
body that are regulated to affect calcium in the body. The first is the indirect
activation of osteoclasts in the bone which causes release of calcium from the bone
stores into the serum. To achieve general calcium balance, the other targets of PTH
seek to retain calcium by preventing its elimination in the urine and also to absorb as
much of the calcium from ingested food as possible. These processes start at the
kidney where the reabsorption of calcium is stimulated in the distal tubules. It is here
where activation of vitamin D takes place which then targets the intestine to promote
absorption from food in the intestine via active calcium pumps. Although the
exposure to elevated levels of PTH results in osteoclastic activation, this result is
indirect. It has been shown that osteoclasts lack PTH receptors (Lee et al. 1994).
Instead, PTH binds to receptors on osteoblasts and stromal cells (Fuller et al. 1998)
which then secrete RANKL which binds to RANK on osteoclasts to stimulate
osteoclast proliferation. The effect is calcium catabolism in the bone.
Hyperparathyroidism caused by parathyroid tumors yields continuous over-secretion
of PTH causing osteoporosis due to overactive osteoclasts (Locklin et al. 2003).
Interestingly, it has also been found that PTH can have an anabolic on the
skeleton when cyclically administered. Injections of full-length PTH (which is 84
amino acids) or just the most active region of PTH (AAs 1-34) results in a temporary
elevation of PTH in the blood which peaks within 30 minutes and lasts no more than
3 hours (Deal et al. 2003). In 1982 intermittent administration of PTH was observed
to increase bone mineral density in rats (Tam et al. 1982), and in 1995 it was shown

25
that this intermittent PTH did not stimulate osteoclast activity the same way as
continuous elevation of PTH (Uzawa et al. 1995). After a number of pre-clinical and
clinical trials Forteo was approved by the FDA in 2002 as a safe and effective
treatment for osteoporosis which can prevent fragility fractures. PTH’s effect is even
more impressive in healing bone. Fracture studies since 1999 have shown increases
callus volume, bone mineral density and strength in animals treated with intermittent
PTH (Andreassen et al. 1999). The application has broadened to off-label treatment
of fragility fracture non-unions in (Bukata et al. 2009). Preliminary data shows that
patients with prolonged non-unions after fracture who receive daily Forteo treatment
will achieve fracture consolidation with success rates of 93%. Recent reports of
PTH’s efficacy for enhancing autograft-mediated spinal fusion in a rat model (Abe et
al. 2007) are also encouraging for its continued broadening of potential utility.
Therefore in chapter 4 of this dissertation an attempt to enhance bone allografts is
made with intermittent administration of PTH.
1.2 OVERVIEW OF DISSERTATION
Two major problems with bone allografting are the relatively high failure rate,
and the lack of non-invasive outcome measures for identifying complications that will
lead to graft failure. These concepts were studied in this dissertation using an
established pre-clinical model of bone grafting in the mouse femur (Tiyapatanaputi et
al. 2004). This dissertation aims to first describe critical measures of structure of
bone graft healing from micro-computed tomography imaging that were identified

26
during these studies, showing that they correlate to the actual mechanical properties
of grafted femurs. Standard metrics for bone quantification such as bone volume,
cross-sectional geometry were unable to explain more than 50% of the variability in
biomechanical strength and stiffness. Qualitative observation of these specimens
revealed that graft-to-host union was not uniformly achieved and that regardless of
whether a specimen had union or not, there were wide distributions of bone callus
volumes and cross sectional geometry. Therefore, I hypothesized that samples with
large callus but no graft-to-callus union were clouding the ability to predict strength
based on simple measures alone. Since non-unions are also a frequent major
complicating factor of allografts clinically we determined that it was necessary to
develop a novel measure of bone graft-to-host union.
Next the characterization of the effect of systemic PTH treatment on bone
graft healing both non-invasively through imaging and mechanical testing was
performed. It was determined that PTH can efficiently overcome bone grafting non-
unions. Lastly a foray is made into the direct clinical potential for measuring non-
unions in routine CT imaging.

27
Chapter 2: Evaluation of the healing patterns of allografts and autografts by microCT image analysis and biomechanical torsion testing 2.1 INTRODUCTION
In cases of large skeletal insufficiency, bone grafts from organ and tissue
donors are used to replace the patient’s bone. The functional outcome after bone graft
transplantation is the recovery of the load bearing capacity to support the body and
regain function of the affected limb. Bone throughout the body is put under enormous
stress during routine activities and even greater stress during traumatic accidents.
Both routine and accidental loading can cause bone to fail, causing physical injury to
the patient. After bone grafting, a patient may regain the activities and capabilities
and achieve a high quality of life. Unfortunately, the risk of bone allograft failure is
much higher than normal bone fracture, and allografts are unlikely to heal on their
own, thus requiring further medical intervention. Figure 2.1.1 is an example of such a
case.

28
Figure 2.1-1: Structural allograft failure after implantation.
A patient with osteolytic Ewing’s sarcoma in the proximal tibia was treated by
surgical resection of the tumor and the affected bone. To spare the limb from
amputation, a cadaveric allograft (A) was used to fill the defect and secured internally
to the host bone with plates and screws (B). The arrow indicates fractures in the
metaphyseal region 1 year after implantation (C). A fibular autograft was used to
revise the grafted segment to assist in graft healing and revitalization (D). This was
held together with additional plates and screws. This second construction failed and
a prosthetic total knee arthroplasty (TKA) was performed (E) for the 14 year old
patient. [Reproduced from Awad 2007 with permission by Tissue Engineering]
To date, there are few indications for allograft failure that allow clinicians to
identify patients at risk for bone graft failure. The goal of this chapter is to describe
the state of the art in non-invasive and invasive biomechanical analysis of healing
bone and to use these tools to develop a system for analysis of bone in an animal

29
model where allografts and autografts are compared. This system is used in Chapter
4 to evaluate allografts in mice treated with PTH.
In this chapter allografts and autografts in mice were evaluated at multiple
time points to uncover the natural progression of graft healing. Their structure was
imaged and analyzed using micro-CT imaging and they were finally mechanically
tested. Statistical regression analysis was performed to identify measures of structure
which are critical for explaining the variation in biomechanical strength and rigidity.
Successes and shortcomings in this approach and the results are discussed and used to
stimulate further development of techniques and therapies.
2.2 BACKGROUND
There has been extensive research in human and experimental animal models
of bone allograft healing (Friedlaender et al. 1978; Burchardt 1983; Pelker et al.
1983; Weiland et al. 1984; Pelker et al. 1987; Pelker et al. 1989; Friedlaender 1991;
Kerry et al. 1999; Stevenson 1999; Wheeler et al. 2001; Wheeler et al. 2005), yet our
understanding of the immunologic, biologic, and biomechanical mechanisms of
allograft failure remains incomplete. What are the signals that identify grafted bone
as a foreign body which leads to its envelopment by a fibrous barrier? What specific
signals are missing from the dead allografts when microdamage occurs which limit
targeted remodeling? How are the stresses throughout the graft different in grafts that
fail by fatigue different from grafts that are enduring? To what extent is graft failure
due to graft processing, surgical technique, patient healing response, and patient

30
activity levels? These questions remain to be answered, but there have been many
attempts to find solutions to the difficulties encountered with bone grafting.
Furthermore, advances in evaluating these therapeutic adjuvants to improve bone
allograft repair have been slowed by the lack of quantitative and non-invasive
imaging-based outcome measures of graft biomechanical strength. Experimental
animal studies suggest that long bone defect repair (Bonadio et al. 1999) and allograft
healing (Ito et al. 2005; Koefoed et al. 2005) can be improved using localized gene
delivery vectors among other techniques.
An important alternative to bone allografting is autografting. An autograft is a
transfer of bone material from one location in the body to another. The most common
site of large strut autografts are from the patient's fibula. An autograft is implanted as
live bone material and thus has greater healing and reparative capacity, but is limited
in size. Furthermore, putative clinical reports suggest that improved tibial or femoral
allograft repair and revitalizing can be achieved by placing a vascularized fibular
autograft inside the massive processed allograft (Manfrini et al. 2004). However,
none of these studies reported quantitative indicators of the biomechanical strength of
the allografts. Before such outcome measures can be used in clinical applications,
they would first have to be developed and validated in preclinical animal models.
Toward the development of non-invasive assessment of the biomechanical
properties of structural bone grafts in a pre-clinical animal model, this chapter
investigates statistical correlations among micro-computed tomography (micro-CT)
imaging and biomechanical torsion testing parameters in the mouse femoral graft

31
model described in Chapter 1. In this study, the 4-mm mid-diaphyseal segment is
removed and either immediately replaced as a live autograft, or a graft from one
animal is devitalized and transplanted into another mouse as an allograft. Previous
studies helped identify critical molecular and cellular differences between autograft
and allograft healing (Tiyapatanaputi et al. 2004; Ito et al. 2005; Zhang et al. 2005;
Zhang et al. 2005); however, the structural and biomechanical aspects of both
autograft and allograft healing have yet to be studied in this model. Furthermore,
while previous animal studies have correlated biomechanical properties of long bone
fracture repair with imaging derived parameters (Markel et al. 1991; den Boer et al.
1999; Blokhuis et al. 2000; Shefelbine et al. 2005), no study has investigated
quantitative correlations in long bone segmental autograft and allograft repair in
animal models or human patients. To address these issues, we tested the hypothesis
that murine femoral autografts heal with improved biomechanical properties
compared to processed allografts. We also tested the hypothesis that micro-CT
parameters of graft and callus volume and geometry correlate significantly with the
torsional properties of the murine femoral grafts.
2.3 METHODS
2.3.1 Surgical methods.
All segmental femoral autograft and allograft surgeries were performed on 8-
week-old C57BL/6 mice following protocols that were approved by the University
Committee on Animal Resources as previously described (Tiyapatanaputi et al.
32
2004). Femurs from donor mice were harvested and processed with the following
steps. First the soft tissue and periosteum were scraped from the diaphysis of the
femur with a scalpel. The ends of the femur were then cut off using a 20mm round
diamond-sintered saw with a blade thickness of 0.2mm on a Dremel Tool to access
the marrow cavity. Using a syringe with 26 gage needle the marrow cavity was
flushed using 70% ethanol. The femurs were then trimmed to 4mm in length using
the same diamond saw and a caliper for measurement. They were then bathed in 70%
ethanol for 3 hours, rinsed three times with sterile saline and frozen to -80oC for 1
week to make cleaned, processed, aseptic, devitalized bone allografts.
Animals undergoing recovery surgery were anesthetized and an incision was
made on the lateral aspect of the left hind limb. The soft tissue and muscle were
dissected using blunt techniques to expose the midshaft of the femur. A double
osteotomy was made to remove 4 millimeters of bone. The live bone that was
resected was placed back into the defect with it's periosteum intact to be used as an
autograft or replaced with a processed allograft. Finally, the graft was secured
between the two host segments using a stainless steel intramedullary pin with a
0.35mm diameter (Figure 2.3.1). The pin is inserted through the knee, the graft is slid
over the pin, then the pin is passed through the greater trocanter of the femur. The
sharp end is cut square, then bent in a tight curl at each end to protect the soft tissue
and to allow for pin extraction after harvesting the femur. Weekly x-rays were taken
to monitor progression (Faxitron X-Ray LLC, Wheeling, IL).

33
Mice receiving either live autografts or devitalized allografts were sacrificed
at 6, 9, 12, and 18 weeks after surgery (n = 6 – 14, see Table 2.4-1) mice per
treatment group per time point). Femurs were disarticulated from the hip and knee
joints and the intramedullary stainless-steel pins were removed carefully. Specimens
were moistened with saline and frozen at -20oC until they were thawed for micro-CT
imaging and subsequent biomechanical testing.
Figure 2.3-1: Mouse intercalary allograft model.
Radiograph immediately after surgery of a 4mm intercalary bone graft implanted into
the femur of a mouse and secured with an intramedullary pin. [Reproduced from
Awad 2007 with permission from Tissue Engineering]
2.3.2 Micro-CT imaging and analysis.
Micro-computed tomography (micro-CT) Micro-CT imaging of the 6, 9, and
12 week specimens was performed at high resolution (13.9 mm) using the Explore
Locus SP scanner (GE Healthcare Technologies, London, ON) at 80 kVp, 80 mA,
415 projections, 1700 ms integration time; while the 18-week specimens were

34
scanned at high resolution (10.5 mm) on the VivaCT40 micro-CT scanner (Scanco
Medical, Basserdorf, Switzerland) at 55 kVp, 145 mA, 300 ms integration time.
Quantification of bone and graft volume was performed as previously
described using MicroView software (GE Healthcare) (Koefoed et al. 2005). Briefly,
total bone volume (BVTotal) between the graft–host interfaces was quantified. Graft
bone volume (BVGraft) was determined by manually segmenting the graft from the
surrounding mineralized callus. Mineralized callus volume (BVCallus) within the span
of the graft was computed from the difference between BVTotal and BVGraft (Figure
2.3.2). To compensate for image intensity variations of the scanner, a threshold was
determined for each scan using a standardized automatic threshold-selection feature
of the GE MicroView software that utilizes the Otsu method. This determines the
threshold which maximizes the variance between the groups of pixels (Otsu 1979).
The selected threshold was consistently verified against the user’s perception of the
boundary of the mineralized bone. To correct for small variations in length, all grafts
were measured using a digital caliper (Resolution: 70.01 mm; Model CD-600PS,
Mitutoyo Corp., Japan) and bone volumes were normalized to the measured length of
each graft. A custom-written MATLAB code (The Mathworks, Natick, MA) was
developed for computing the cross-sectional polar moment of inertia (PMI) about the
area centroid on each binarized slice of the grafted region. In circular, prismatic
shafts, the PMI correlates directly with torsional rigidity and inversely with the shear
stress (Shigley et al. 2001) and was used because it combines the quantity of the
material as well as the distance that material is from the torsional axis. Briefly,

35
numerical integration of thresholded (mineralized) pixels was performed, based on
the equation · where dA is the elemental area of each mineralized
pixel, and r is the radial distance to the element dA from the cross-section centroid.
The average, minimum, and maximum PMI (PMIAve, PMIMin, and PMIMax,
respectively) were determined for each specimen, as well as the PMI averaged over
the Middle 50% of the grafted region (PMIMid Graft) and over the proximal and distal
ends of the grafted region corresponding to the remaining 50% of the graft length on
both ends (PMIGraft Ends).
A B C
Figure 2.3-2: Bone volume segmentation and quantification.
The region of interest was defined as the region being within the proximal and distal
ends of the graft. The volume of total bone within that is quantified as BVTotal (A).
The graft is then manually segmented on 2D axial cross sections and volume is
calculated as BVGraft (B). What remains after subtraction of the graft from BVTotal
is the BVCallus (C). [Reproduced from Reynolds 2007 with permission of the
American Society of Bone and Mineral Research]
36
2.3.3 Biomechanical testing.
Evaluation of the mechanical competency of the grafted femur was desired in
order to understand how the entire bone performed. Other studies investigating the
material properties of the graft distinctly from how the host interacts with the graft
have been performed by excision and cementing of the allograft material only for
testing (Nather 2004). This isolates changes in the graft material from changes in the
callus formation. In these experiments we are interested in the grafted femur as a
whole, therefore we tested the graft, the host material at the ends of the graft, and the
connectivity between the segments by gripping the most proximal and distal ends of
the host. Torsion testing was chosen because it allows for concomitant testing of both
the graft and callus material, and their degree of connectivity, and it is a loading
condition that is experienced routinely as evidenced by a high frequency of spiral-
shaped fracture (Mellick et al. 1999). There have been many studies of whole bone
and healing bone that have used torsion testing and 3 and 4-point beam bending as an
outcome measure in studying mice (Wunder et al. 1977; Camacho et al. 1995; Mikic
et al. 1995; Brodt et al. 1999). Three- and four-point-bending were not pursued in
this study due to the possibility that the bone or callus would experience both
indentation and bending, and thus accurate interpretation of the loading and
displacement would be challenging.
After micro-CT imaging, the ends of the femurs were cemented into 6.35mm2
aluminum tube holders using PMMA in a custom jig to ensure axial alignment and to
maintain a gage length of 6.37 ± 0.9 mm, allowing at least 3mm to be potted at each

37
end. Specimens were bathed in PBS at room temperature for at least 2 h after potting
to allow for rehydration of the tissue (Broz et al. 1993) and hardening of the PMMA.
Specimens were then mounted on an EnduraTec TestBenchTM system (200Nmm
torque cell; Bose Corporation, Minnetonka, MN) and tested in torsion at a rate of 1o/s
until failure (Brodt et al. 1999) (Figure 2.3.3). The torque data were plotted against
the rotational deformation (normalized by the gage length and expressed as rad/mm)
to determine the ultimate torque (TUlt) and torsional rigidity (TR).

38
Figure 2.3-3: Torsion testing apparatus and setup.
Torque Cell
0
5
10
15
20
25
30
0 0.02 0.04 0.06 0.08
Normalized Rotation (rad/mm)
Torq
ue (N
.mm
)
AutograftAllograft
Allografted and autografted femurs were tested in torsion using a servoelectric motor
rotating at 1o/sec on the right with torque transducer on the fixed side on the left (A &
B). Femurs were potted into aluminum tubing, with bone cement, to a depth of
approximately 3mm leaving a gage length of approximately 6mm was left exposed
Normal
A
C
B
D

39
between the bone cement as the tested region of interest (C). Sample allograft,
autograft and normal femur torsion testing curves are shown in D.
After testing to failure, all samples were X-rayed to assess the mode of failure
(Lewandrowski et al. 2002). Specimens were classified into three distinct failure
modes. A ‘‘Pre-union’’ mode of failure presented as if the graft, clearly recognizable
and intact, was simply pulled out from the host callus and is likely due to very weak
union at either of the graft–host interfaces. An ‘‘Early union’’ mode of failure was
characterized by a fracture which involved the graft–host interface, but also extended
into the graft and/or host, indicating that there was some degree of union. The third
mode of failure that we observed was termed ‘‘Mature union’’ in which failure
largely occurred in the graft region as a spiral fracture, which commonly occurs when
torsional loads are applied to normal bone (Figure 2.3-4).

40
A B C
Figure 2.3-4: Structural graft modes of failure during torsion testing.
X-rays were taken of the grafted femurs after destructive torsion testing to assess the
mode of failure as defined by the fracture location and morphology. Three distinct
modes of failure were identified: ‘‘Pre-union’’ failure (A) presented as if the graft was
simply pulled out from the host callus; ‘‘Early union’’ failure (B) was characterized by
a fracture which involved the graft–host interface, but also extended further into the
graft and/or host; ‘‘Mature union’’ (C) in which failure largely occurred in the graft
region. [Reproduced from Reynolds 2007 with permission of the American Society of
Bone and Mineral Research]
2.3.4 Comparison and correlation statistics
Autograft and allograft data were compared using analysis of variance and
Bonferroni post hoc multiple comparisons. For the analysis of the mode of failure, a
chi-square test was conducted to determine whether the distribution of failure modes
was different between allografts and autografts (Tamhane 2000).
2.3.5 Background on linear regression statistical analysis
In order to elucidate the effect of structure and organization had on strength
and rigidity of bone grafts, we first investigated all of the individual parameters'
41
ability to correlate with strength and rigidity. We hypothesized that analysis of the
full set of data which included allografts and autografts at 6, 9, 12 and 18 weeks
would yield an indication of the most critical factors for improving grafted bone
strength and rigidity in an unbiased way. This resulted in multiple factors which had
significant correlations, but no single parameter was able to explain more than 32% of
the variation in mechanical properties, therefore further analysis using multiple
structural measures would be required to convincingly surmise the strength of grafted
femurs from 3D medical images.
There are a variety of ways of combining multiple independent factors to
generate an equation that relates to an outcome. Here we are trying to use multiple
structural measures to indicate the mechanical strength and rigidity outcomes. We
measured 8 different structural parameters, which means that there could be over 400
linear combinations of independent variables. There are two factors to consider when
generating an optimum regression equation. The first is that the ‘independent’
variables may be correlated to each other; therefore including both of them would be
redundant in the regression. Secondly, an independent variable that is brought into a
regression equation carries with it some uncertainty about whether the value is
actually related to the outcome, so there needs to be a penalty which accounts for
including additional terms. Two accepted methods of accounting for the problem of
“over-fitting” the regression are the Adjusted R2 which applies a penalty to the
coefficient of determination which is based on the number of regressors and the
number of samples in the dataset, or the use of Mallows’ CP (Mallows 1973).
42
Mallows’ CP is an indicator of fit defined as: 2 , where SSEP is the
error sum of squares for the model fit with P regressors, S2 is the residual mean
squared of the regression which uses the full set of independent variables and N is the
sample size. Therefore, when the next best variable is added to the regression
equation, the SSEP should go down, and P increases, while S2 and N remain constant.
When adding one-too-many variables to the regression the SSEP does not sufficiently
diminish to overcome the increase in P, thus CP rises from the previous step.
Therefore, minimization of CP indicates optimum regression fit. Other complicating
considerations are that an independent variable may be correlated to the outcome
variable, but in a non-linear way, or that terms may only be significantly important to
the outcome measure as part of a term of interacting variables. For this study we
wanted to use the data that was available in the most efficient way. The following
describes the methodology that was used and the explanation of the choices that were
made to perform these studies.
Since we know that allografts and autografts have very different healing
mechanisms, we realize that a measure for allografts might correlate to strength
differently than a measure for autografts, therefore the type of graft might be an
important co-variate. An example is that BVGraft seems to diminish greatly as
autografts mature, and is actually inversely related to biomechanical strength in
autografts (Figure 2.4-2), while BVGraft is relatively stable in allografts past 9 weeks
but that there are major changes in allograft strength from 6 to 9 weeks. The reason
for autograft resorption will be described in the discussion section of this chapter. In

43
such case, BVGraft may be a significant inverse indicator of strength, while BVGraft
may have a different effect for allografted femurs. A similar argument could be made
for the time as a covariate: BVCallus at one time point may not be important if the
specimens have not formed union at both junctions, while later on, when union is
established, variations in BVCallus may correspond to variation in bone mechanics.
Therefore, the inclusion of time and graft-type will also be considered.
All analyses were performed using SAS 9.1 (SAS Institute Inc., Cary, NC)
based on a best subset selection method which minimizes Mallows’ CP statistic to
optimize the number of independent variables and interactions included in the model
(Mallows, 1973).
2.4 RESULTS
2.4.1 Reduction in sample number
Although most groups maintained a high sample number, allografts at 6 and 9
weeks, and autografts at 6 weeks experienced multiple specimen losses. The
dominant reason for specimen loss was general weakness in grafted femurs at these
time points. Specimens were harvested and dissected carefully, but occasionally after
intramedullary pin removal it was determined that these specimens were not intact
and there was no way of distinguishing specimens that failed during harvesting from
those that had not yet attained consolidation (union) of the graft-host junction. The
rarer cause of specimen loss were animals that did not recover from anesthetic during

44
surgery or one of the weekly radiographs. The final table of specimen number is
given in Table 2.4-1.
Table 2.4-1: Specimen sample size per group
6 weeks 9 weeks 12 weeks 18 weeks Allografts 6/11 6/13 13/14 11/11 Autografts 7/11 12/14 13/14 7/11
2.4.2 µCT-based morphology and structural indices
Representative micro-CT sagittal-sections of typical autografts and allografts
demonstrate several remarkable differences in the size and morphology of the new
mineralized callus and graft bone over time (Figure 2.4-1). The prominent differences
between the grafts at 6 weeks are: (1) the large callus that envelops the entire length
of the autograft but remains limited to the ends of the allograft, (2) the clear union of
the autograft to the proximal and distal junctions of the host femur versus the limited
connectivity observed in the allograft, and (3) the differences in graft remodeling over
time. By 9 weeks the creeping callus covered large segments of the allograft,
resulting in a marked increase in union between the unresorbed allograft and the host.
This extensive remodeling continued over time, such that at 12 and 18 weeks the
autograft bone was unidentifiable in many of the samples, and the new bone collar
was the only contiguous load-bearing bone in the mid-femur. In contrast, allografts
did not display evidence of resorption up to 12 weeks postgrafting. However, the

45
callus at the allograft–host interface remodeled progressively over time and appeared
to establish limited graft–host continuity by 18 weeks.
Figure 2.4-1: Micro-CT images of allografts and autografts healing over time.
Mice receiving live autografts or devitalized allografts to repair segmental femoral
defects were sacrificed at 6, 9, 12, and 18 weeks following surgery and their grafted
femurs were analyzed by micro-CT. A representative image from each time point is
shown. Of note are the dramatic differences in osteointegration at 6 weeks (white

46
arrows), new bone collar formation around the graft at 6 and 9 weeks (red arrow
heads), and graft (shaded in yellow) remodeling such that only allografts are much
more intact at 12 and 18 weeks. [Reproduced from Reynolds 2007 with permission
of the American Society of Bone and Mineral Research]
Although no statistically significant differences were observed in BVCallus
between the grafts (Figure 2.4-2), the data demonstrated a trend in which the
autografts were on average 1.15 to 1.66-fold larger than the allografts. By contrast,
BVGraft of the autografts were only 62% of the allografts (p<0.01) at 6 weeks, and
declined progressively over time reaching 44% and 40% of the allograft BVGraft at 9
and 12 weeks, respectively. As demonstrated in Figs. 2.6 and 2.7, allograft BVGraft did
not change significantly over time up to 12 weeks. However, remodeling over time
made it difficult to clearly define both graft types at 18 weeks in many of the samples,
such that their BVGraft were similar at 18 weeks (Figure 2.4-2).

47
6 9 12 180.0
0.2
0.4
0.6
0.8
AllograftAutograft
Time (Weeks)
BV C
allu
s[m
m3 /m
m]
6 9 12 180.0
0.2
0.4
0.6
0.8
1.0
1.2
***
******
Time (Weeks)
BV G
raft
[mm
3 /mm
]
Figure 2.4-2: Mineralized callus and graft volumes during femoral allograft and
autograft healing over time.
The calcified callus volume BVCallus (A) and the bone graft volume BVGraft (B), at each
time point, normalized to each sample’s graft length. Data represent means ± SEM.
Asterisks indicates significant differences between autografts and allografts at each
time point (*** p<0.001) [Reproduced from Reynolds 2007 with permission of the
American Society of Bone and Mineral Research]
Furthermore, the only significant difference in PMI between the two grafts
was at 6 weeks when the autografts’ PMIMid Graft was 2.1-fold greater than allografts’

48
(p<0.001; Figure 2.4-4). This reflects the massive amounts of bridging callus
surrounding autografts, versus the naked cortex of the allograft at 6 weeks.
Allograft Autograft
Figure 2.4-3: Cross-sectional PMI Analysis of a representative allograft and
autograft.
Representative surface renderings of an allograft (top left) and an autograft (top
right) at 6 weeks showing the location and morphology of selected coronal sections
through the grafted femurs. Of note are the remarkable differences in cortical bone
thickness and the area of the femoral slice between the two graft types. Those slices
are indicated on the PMI line graphs (bottom) by gray triangles. The dotted vertical
lines define the proximal and distal ends of the graft. The minimum PMI (PMIMin)
over the graft region is indicated by *, and PMIMax is indicated by #. The average
PMI over the middle 50% of the graft (PMIMidGraft and the average PMI at the
proximal and distal ends of the grafted region (PMIGraftEnds) were also determined for
each specimen. [Reproduced from Reynolds 2007 with permission of the American
Society of Bone and Mineral Research]

49
0.0
0.5
1.0
1.5
6 wks 9 wks 12 wks 18 wks
PMI-A
ve. (
mm
4 )
*
0.0
0.5
1.0
1.5
2.0
2.5
3.0
6 wks 9 wks 12 wks 18 wks
PMI-M
ax (m
m4 )
*
0.0
0.5
1.0
1.5
6 wks 9 wks 12 wks 18 wks
PMI-M
in (m
m4 ) *
**
0.0
0.5
1.0
1.5
2.0
2.5
6 wks 9 wks 12 wks 18 wks
PMI-G
raft
Ends
(m
m4 )
*
0.0
0.5
1.0
1.5
6 wks 9 wks 12 wks 18 wksPM
I-Mid
Gra
ft (m
m4 )
*
**
A CB
D E
AllograftAutograft
Figure 2.4-4: Cross sectional Polar Moment of Inertia Data.
The cumulative PMIAve (A), PMIMax (B), PMIMin (C), PMIGraft Ends (D) PMIMidGraft (E) are
presented as mean ± SEM . * indiciate statisitically significant differences between
allograft and autografts. [Adapted from Reynolds 2007 with permission of the
American Society of Bone and Mineral Research]
2.4.3 Biomechanical testing
At 6 weeks, the ultimate torque and torsional rigidity of autografts were 2.5
and 3.9 times greater than allografts (p<0.001 and p<0.0001, respectively, Figure
2.4-5). Remarkably, by 9 weeks the differences between autografts and allografts
were insignificant, and the ultimate torque and torsional rigidity of both graft types
were not different than age-matched unoperated femurs (20.23 ± 2.28Nmm and
922.18 ± 103.40 Nmm2/rad, respectively). However, between 9 and 18 weeks,

50
allografts experienced a significant 45% reduction in ultimate torque (p<0.0005). The
torsional rigidity of the allografts also decreased significantly by 45% between 9 and
12 weeks (p<0.0005), and then increased significantly by 41% (p<0.05) at 18 weeks.
By contrast, the torsional properties of autografts did not change significantly
(p<0.05) between 9 and 18 weeks.
6 9 12 180.0
5.0
10.0
15.0
20.0
25.0 AllograftAutograft
*** ****
A
Time (W eeks)
T Ult
[ N.m
m ]
6 9 12 180
250
500
750
1000
**
***
B
Time (W eeks)
TR[ N
.mm
2 ]
Figure 2.4-5: The torsional properties of femoral allografts and autografts over
time.
Following micro-CT imaging, grafts were tested in torsion at a rate of 1o/s until failure
and the (A) ultimate torque (TUlt), and (B) torsional rigidity (TR), were computed as
described in the methods. Asterisks indicate significant differences between

51
autografts and allografts for that time point (*p<0.05, **p<0.01, and ***p<0.001). Data
represent mean ± SEM. [Reproduced from Reynolds 2007 with permission of the
American Society of Bone and Mineral Research]
Analysis of the three modes of failure described in Figure 2.3-4 are given in Table
2.4-2 as the percentage of incidence of the different modes. The critical χ2 value for α
= 0.05 with 6 degrees of freedom is 12.59. Since the χ2 for this table is 22.92 which
is greater than χ2critical, the pattern of allograft failure is statistically different than
autografts (p<0.005), as nearly 64% of allografts fail in Pre-union or Early union
modes even after 12 weeks of healing, and more than 70% of autografts failed in
Mature union mode 12 and 18 weeks post-grafting.
Table 2.4-2: Distribution of allograft and autograft modes of failure in torsion over
time
Allografts† Autografts
Week Pre-union Early Union Mature Union Pre-union Early Union Mature Union
6 100% – – 66% 33% –
9 75% 25% – 36% 28% 36%
12 28% 36% 36% – 29% 71%
18 18% – 82% 29% 71%
2.4.4 Correlations between micro-CT parameters and torsional properties
To the end of identifying micro-CT-derived parameters that correlate with
biomechanical strength of structural bone graft in our mouse model, we first
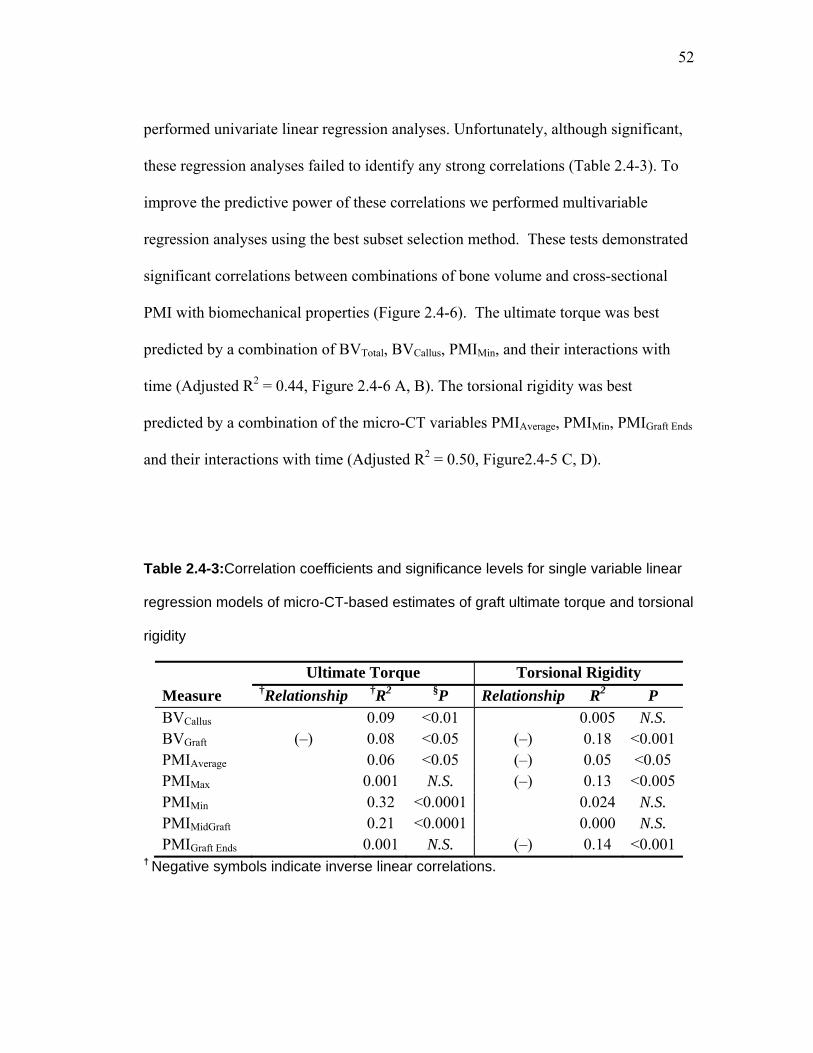
52
performed univariate linear regression analyses. Unfortunately, although significant,
these regression analyses failed to identify any strong correlations (Table 2.4-3). To
improve the predictive power of these correlations we performed multivariable
regression analyses using the best subset selection method. These tests demonstrated
significant correlations between combinations of bone volume and cross-sectional
PMI with biomechanical properties (Figure 2.4-6). The ultimate torque was best
predicted by a combination of BVTotal, BVCallus, PMIMin, and their interactions with
time (Adjusted R2 = 0.44, Figure 2.4-6 A, B). The torsional rigidity was best
predicted by a combination of the micro-CT variables PMIAverage, PMIMin, PMIGraft Ends
and their interactions with time (Adjusted R2 = 0.50, Figure2.4-5 C, D).
Table 2.4-3:Correlation coefficients and significance levels for single variable linear
regression models of micro-CT-based estimates of graft ultimate torque and torsional
rigidity
Ultimate Torque Torsional Rigidity Measure †Relationship †R2 §P Relationship R2 P BVCallus 0.09 <0.01 0.005 N.S. BVGraft (–) 0.08 <0.05 (–) 0.18 <0.001PMIAverage 0.06 <0.05 (–) 0.05 <0.05 PMIMax 0.001 N.S. (–) 0.13 <0.005PMIMin 0.32 <0.0001 0.024 N.S. PMIMidGraft 0.21 <0.0001 0.000 N.S. PMIGraft Ends 0.001 N.S. (–) 0.14 <0.001
† Negative symbols indicate inverse linear correlations.

53
§ P values indicate the significance level of the hypothesis that the slope of the
regression line is different than zero. N.S. indicates P > 0.05
Intercept 15.55 ± 4.53* Time -0 ± 0.33 BVCallus 11.59 ± 8.25BVTotal -7.35 ± 1.78* PMIMin -0.47 ± 5.90 Time × BVCallus -0.69 ± 0.69 Time × PMIMin 1.41 ± 0.53*
.28
Intercept 187.06 ± 240.32 Time 14.18 ± 16.39PMIAverage 1009.35 ± 434.10*PMIMin -480.08 ± 363.89PMIGraft Ends -753.66 ± 336.99*Time × PMIAverage -161.34 ± 47.42*Time × PMIMin 153.44 ± 39.59*Time × PMIGraft Ends 92.79 ± 37.83*
A B
CD
Figure 2.4-6: Multivariable linear regression analysis micro-CT parameters vs
mechanical outcomes.
Multivariable linear regression analysis based on the best subset selection of
geometric micro-CT-based parameters including bone volume and PMI, and their
interactions with time show strong correlations between the predicted and
experimentally measured ultimate torque (A) and torsional rigidity (C) independent of
the graft type. The dotted diagonal lines represent the ideal case of perfect

54
prediction. Tables (B) and (D) list the independent variables and their coefficient
estimates which were selected. Data represent parameter estimate ± standard error
* Indicates p<0.05 [Adapted from Reynolds 2007 with permission of the American
Society of Bone and Mineral Research]
0 200 400 600 800 1000
Torsional Rigidity (N*mm2)
Allografts
Autografts
0
1
2
3
0 10 20 30
Ultimate Torque (N*mm)
Allografts
Autografts
Pre-union
Early union
Mature union
Figure 2.4-7: Torsional strength and rigidity vs mode of failure.
The mode of failure, as determined by post-torsion testing x-rays versus the ultimate
torque and torsional rigidity for allografts and autografts at 6 and 9 weeks.
2.5 DISCUSSION
While it has long been recognized that the biomechanical properties of
structural autografts are superior to allografts, the mechanisms responsible for these
differences and when they are manifested during the healing process are poorly
understood. Moreover, there are no noninvasive imaging-based outcome measures to
assess the biomechanical properties of structural grafts, such that potential adjuvants
that improve allograft healing could be evaluated without destructive biomechanical

55
testing. Before such outcome measures can be translated to clinical applications, they
would first have to be developed and validated in pre-clinical animal models.
To address these issues, we aimed to characterize the 3D morphological and
biomechanical differences between allograft and autograft healing over time, and to
identify the micro-CT parameters that best correlate with torsional strength and
rigidity using a mouse femoral graft model. Consistent with previous studies
(Tiyapatanaputi et al. 2004), we found that autografts display a robust osteogenic
response that was previously reported to derive from the periosteum of the donor and
host bone (Zhang et al. 2005; Zhang et al. 2005), which results in a new bone collar
that completely surrounds the graft by 6 weeks. In contrast, allografts heal via
creeping callus from the host that remains scant until 9 weeks of healing. This may
have contributed to the dramatic difference in ultimate torque to failure and torsional
rigidity between the devitalized femoral allografts and autografts at 6 weeks (Figure
2.4-5).
Analysis of the micro-CT images delineated three observations which may
explain how allografts achieve biomechanical equivalency to autografts at 9 weeks
via different mechanisms of healing. The first observation is the very large callus at
the allograft ends at 6 weeks which remodels down over the next 3 weeks and slowly
creeps onto the allograft cortical surface, resulting in an increased PMIMid Graft at 9
weeks (Figure 2.4-1 and Figure 2.4-4). In contrast, autografts are enveloped by a
bridging callus with a thin cortex as early as 6 weeks which results in a large and
somewhat uniform PMI throughout the length of the graft and subsequently remodels

56
down uniformly over time. The second is the dramatic difference in cortical bone
thickness between the two graft types which results from uneven rates of graft
remodeling as the autografts experience rapid and robust resorption (Figure 2.4-1).
The third is the union of the graft with the host bones which was qualitatively
deduced a priori from the observed modes of failure following the torsion testing.
These data indicate that all grafts were poorly connected to the host at 6 weeks as
100% of the 6- week allografts failed in Pre-union compared to only 66% of the 6-
week autografts (Table 2.4-2). Interestingly, about 20% of the allografts never
achieved the Early union stage even after 18 weeks of healing, suggesting a persistent
poor incorporation of the allograft with the host. It should be noted that the failure
classification of Pre-union should not be interpreted to indicate that there was
absolutely no union in the specimens failing in this mode. Indeed all the tested
specimens registered torsional resistance that varied with graft type and time post-
grafting as shown in Figure 2.4-5. Naturally, a quantitative measure of the degree of
union between the graft, the callus, and the host would likely be an important
determinant of the biomechanical stability of the graft. To our knowledge there are no
existing methods that have been published for quantitatively assessing the level of
connection between complicated bone segments in 3D. Studies that have performed
other analyses similar will be reviewed in Chapter 3, along with an explanation of the
limitations of those methods. We therefore began working on developing methods to
determine a quantitative 3D parameter from micro-CT image data. The methodology
that was settled upon is explained in Chapter 3.

57
The causes for autograft resorption may start from the transfer of load-sharing
from the graft to the newly formed external callus which bridges from host-to-host,
thus shielding the autograft from stress which could cause bone disuse atrophy.
Overall, the autografts had greater ultimate torque and torsional rigidity
compared to the allografts over time (Figure 2.4-5). However, this was not
necessarily due to a delay in allograft healing, as the biomechanical properties of
autografts and allografts were equivalent by 9 weeks. At 12 and 18 weeks, the
significant decreases in allograft torsional rigidity and ultimate torque seem consistent
with clinical observations that patients receiving massive structural allografts are
initially able to return to normal activity and function but experience allograft failure
1–2 years after implantation (Lord et al. 1988; Berrey et al. 1990; Wheeler et al.
2005). While the cause of this late stage failure is not fully understood, the
accumulation of microdamage and the initiation of resorption in devitalized allografts
are likely factors in graft weakening that need further investigation.
While two-dimensional radiographic measurements (X-rays) have been the
standard clinical technique to assess the progress of bone fracture healing, they have
been shown to be poor predictors of fracture strength and rigidity (Nicholls et al. 1979).
Other imaging modalities including dual-energy X-ray absorptiometry (DXA) have
shown that the callus bone mineral content and density in experimentally induced
cortical bone fracture or osteotomy models correlate significantly with torsional
strength and rigidity of the fractured bones (Markel et al. 1991; den Boer et al. 1999;
Blokhuis et al. 2000) and implanted autografts (Delloye et al. 1986). However, in

58
more complex situations such as devitalized cortical allografts that are known to
exhibit delayed and impaired remodeling and turnover, bone mineral content and
density measurements can be misleading and are likely to be poor predictors of graft
strength and incorporation.
Unlike conventional X-ray and DXA that offer low resolution information
about the 2D geometry and mineralization of bone fracture or graft callus, computed
tomography imaging provides 3D details about the callus geometry and volume. In
our study, univariate correlations between micro-CT parameters and the torsional
properties yielded weak or insignificant correlations that at best explained no more
than 32% of the variability in the biomechanical properties of the mouse femoral
grafts (Table 2.4-3). These results are consistent with reports demonstrating that
estimates of healing progress based on bone volume and PMI measurements from CT
images of fractured rat femurs had weak and insignificant associations that explained
no better than 9% of the measured fractured femoral torsional rigidity (Shefelbine et
al. 2005). The multivariate correlations that were generated in the mouse femoral
graft model were as good as those obtained using sophisticated CT-based finite
element (FE) prediction of torsional and flexural femoral strength in a rat femur
fracture model (Shefelbine et al. 2005). While the use of FE modeling to clinically
predict fracture risk has only seen limited applicability in the reported literature and
provided only anecdotal data on only one patient (Taddei et al. 2003), direct statistical
interpretation of data from CT imaging may have wider clinical applicability in the
assessment of grafted bone healing (Manfrini et al. 2004).
59
One of the potential limitations in translating this work to clinical applications
is that clinical CT imaging systems sacrifice the quality and resolution for faster scan
acquisition times and reduced radiation exposure. Therefore, the low clinical CT
scanner resolution may limit the direct extrapolation of our micro-CT correlates to the
clinical setting. The state of the art clinical CT scanners can routinely achieve
comparable relative in-plane resolution but out-of-plane resolution is less than
optimal. Table 2.5-1 compares the relative resolution of the micro-CT system against
the current standard of care scanner. In-plane resolution of clinical imaging is
equivalent to micro-CT imaging of mouse cortical bone, but is much worse out-of-
plane because slice thickness is 2-8 times larger than the in-plane pixel dimensions.
Further, standard clinical CT imaging is unable to resolve individual human
trabeculae as well as micro-CT can in mice. A more thorough analysis of the effects
of the lower resolution on the graft and callus volume computation and the predictive
correlations with biomechanical properties would have to be performed in large
animal preclinical and future human clinical studies. Regardless, there are clinical
reports that strongly suggest the value of CT imaging, despite the low resolution
limitations, in the management of massive long bone allografts(Manfrini et al. 2004;
Attias et al. 2006). However, these limited studies do not report any quantifiable
correlations between CT parameters and functional recovery, which underscores the
importance of delineating such correlations in the preclinical mouse femoral graft
model as a first step towards clinical translation. Additional discussion of the need for
preclinical and clinical translational studies is included in Chapter 5.

60
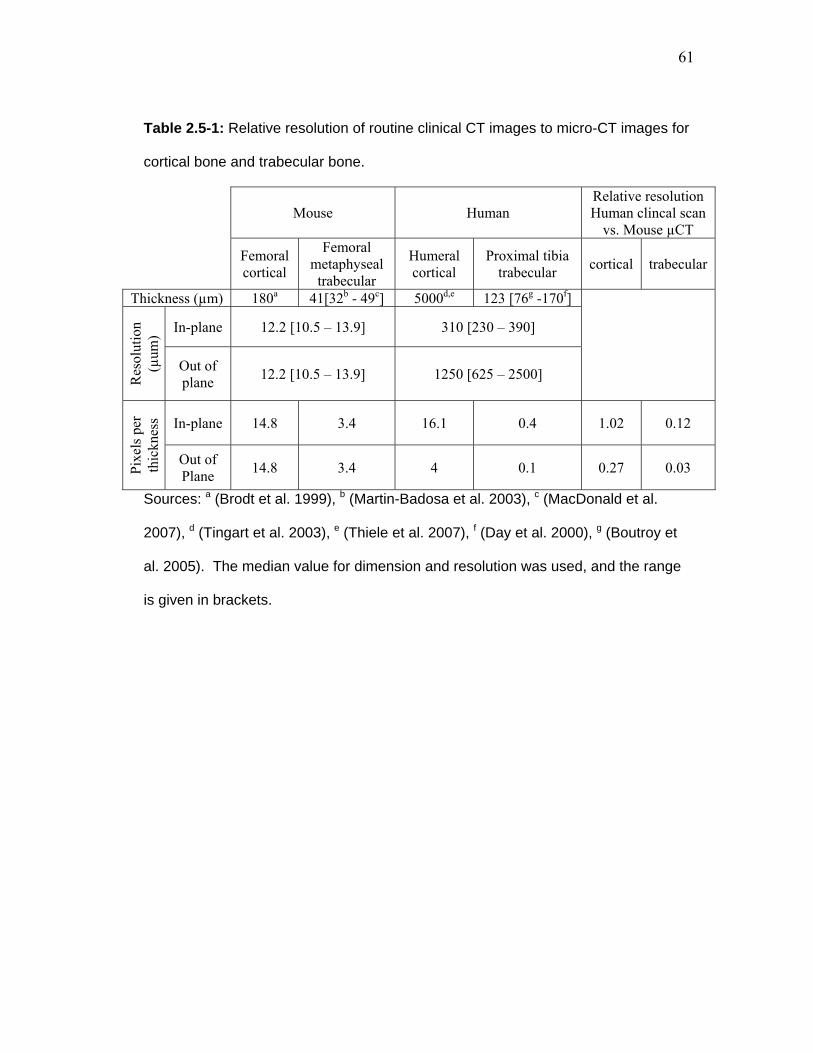
61
Table 2.5-1: Relative resolution of routine clinical CT images to micro-CT images for
cortical bone and trabecular bone.
Mouse Human Relative resolution Human clincal scan
vs. Mouse µCT
Femoral cortical
Femoral metaphyseal trabecular
Humeral cortical
Proximal tibia trabecular cortical trabecular
Thickness (µm) 180a 41[32b - 49c] 5000d,e 123 [76g -170f]
Res
olut
ion
(µum
) In-plane 12.2 [10.5 – 13.9] 310 [230 – 390]
Out of plane 12.2 [10.5 – 13.9] 1250 [625 – 2500]
Pixe
ls p
er
thic
knes
s In-plane 14.8 3.4 16.1 0.4 1.02 0.12
Out of Plane 14.8 3.4 4 0.1 0.27 0.03
Sources: a (Brodt et al. 1999), b (Martin-Badosa et al. 2003), c (MacDonald et al.
2007), d (Tingart et al. 2003), e (Thiele et al. 2007), f (Day et al. 2000), g (Boutroy et
al. 2005). The median value for dimension and resolution was used, and the range
is given in brackets.

62
Chapter 3: Development of an algorithm for the quantification of grafttohost union using microCT imaging 3.1 INTRODUCTION
The ability to evaluate patient outcomes longitudinally after bone grafting is
limited by a paucity of available non-invasive outcome measures. This limits the
ability to identify and treat patients with complications before they suffer a traumatic
failure. This also limits our ability to study adjuvant treatments quantitatively and to
determine differences in efficacy which would be necessary for ranking treatment
options based on performance, and for optimizing the best treatments such as dosage
and delivery method. In the study described in Chapter 2, two treatment groups
(allografts and autografts) were compared as a basis for identifying which of the
available outcome measures were most successful at predicting the best case scenario
for healing. These outcome measures included quantitative graft and callus bone
volume measurements, and the maximum, minimum and average cross sectional
polar moments of inertia. Together in a multivariate regression equation, these
parameters were only able to is result was only able to predict up to 44 and 50% of
the variation in the torsional strength and rigidity, respectively, which suggests that
these CT variables fail to explain about half of the variability in the torsional
biomechanics. Based on the observation in Figure 2.4-1 that non-unions between the
graft and host were present, but unaccounted for in the correlations of Chapter 2,
along with the result that the mode of failure after biomechanical testing often

63
occurred at the graft-host interface (Figure 2.3-4, Table 2.4-2) suggesting that was the
weakest link, we therefore hypothesized that the graft-to-host union would correlate
significantly with torsional biomechanical properties. The absence of a non-invasive,
objective, 3D measure of the degree of union makes studying this problem
impossible.
We chose to study allografts and autografts at 6 and 9 weeks because we
hypothesized that these early time points had the greatest variation in the degree of
union based on observations of CT images and post-testing analysis of the mode of
failure indicated that non-unions were prevalent among allografts at 6 weeks, but by 9
weeks they had established union to a greater degree and were almost 3x stronger and
5x more rigid. At later time points, mouse bone healing was substantial which
resulted in few apparent non-unions from radiography, and due to some extensive
remodeling, graft bone was somewhat indistinguishable from the callus making it
difficult to determine what was graft and what was host, and therefore how they were
actually connected. Therefore we limited our analysis to specimens for which the
degree of union was able to be obtained, as well as specifically investigating a time at
which our model seemed to be recapitulating a known deficiency in clinical graft
healing.
3.1.1 Previous attempts at quantifying union
Despite the understanding that non-unions cause instability and in the case of
reconstructive grafting, a delay in union means prolonged loading of fixation
instrumentation, there is no way of quantifying the degree of union. Two dimensional

64
radiographic evaluation has been performed to qualitatively assess whether cortices
had bridged on anterior-posterior and/or medial-lateral x-rays (Brown et al. 2004).
Brown et al. were unable to achieve any statistical significance among three treatment
groups harvested at 3 time points in a standardized rat femoral fracture model. This
was adapted to 2D planar CT slices by Gardner in 2007 to again qualitatively assess
the bridging of cortices in 4 sampled sites in a mouse tibia study, but again was
unsuccessful at delineating treatment groups. This negative result could be due to
limited sampling of only two slices per specimen, as the range with the number of
bridged cortices varied from 0 to 3 for all groups in the study. Bressler attempted
quantitative automated analysis of x-rays of fracture union sites by quantifying the
mineral density at the graft-host interface of distal femoral allografts in sheep using
digital image analysis of x-ray films. They found that this improved classification of
unions and non-unions over trained observers (Bresler et al. 1998).
To determine the osteoconductive effects of porous poly(propylene fumarate)
(PPF) foam coating on the integration of intercalary cortical (tibial) allografts in a rat
model, Lewandrowski et al. described a histomorphometry technique for assessing
allograft-host integration by tracing the perimeter of the graft and estimating the
length of host-to-graft integration along that perimeter (Lewandrowski et al. 2002).
The percentage of length that was connected was determined independently for both
the proximal and distal ends of each graft and named the Bonding Index.
Unfortunately, this method is limited by the destructive nature of this histological
evaluation that does not permit one-to-one correlations of graft-host union with
65
biomechanical properties. We thought we could advance this 2D technique by
extending it to 3D to eliminate sampling error, using non-destructive imaging to
measure union without compromising the specimen.
In this chapter, a novel micro-CT based algorithm is described and validated
which computes a 3D measure of union between host (bone and callus) and mouse
femoral graft (autograft or allograft) based on the surface area of the graft onto which
bone forms to connect the graft to the host. The ratio of connected graft area to total
graft surface area is computed for each graft end and the lesser value for each graft is
termed the Union Ratio. This technique is then used to investigate the variation in the
osseointegration of mouse grafts over time to test the hypothesis that the Union Ratio
correlates significantly with the torsional strength and rigidity of bone allografts.
Lastly, the translational potential of this measurement technique is briefly
demonstrated using clinical CT data of a nonunion tibia fracture to show that despite
lower relative resolution (as indicated in Table 2.5-1), this technique could be useful
and stimulates further validation in future studies.
3.2 METHODS
3.2.1 Experimental model
Specimens analyzed in this study are a subset of the 4mm intercalary femoral
allograft and autograft study described in Chapter 2. This included allografts (n=7)
and autografts (n=8) at 6 weeks and allografts (n=12) and autografts (n=7) at 9 weeks

66
after surgery. The same outcome measures from the first study were used, including
bone volumes, polar moments of inertia, torsional rigidity and strength.
3.2.2 Union Ratio Algorithm
A custom software program named uCTAnalysis was written in MATLAB
(The Mathworks, Natick, MA) for the analysis of the Union Ratio from the micro-CT
images. An active contouring algorithm (Kass et al. 1988) was adapted for the semi-
automated generation of a shell around the graft. First, contours are drawn around the
periosteal and endosteal surfaces of the bone graft in a single transverse micro-CT
slice which has been lightly low-pass filtered using a 2D Gaussian filter (σ = 1.8
pixels; Figure 3.2-1A, B). The contour then snaps to the edge of the graft based on
the 2D gradient of the grayscale image using a Prewitt filter (Prewitt 1970) (Figure
3.2-1C). Lastly, the contour dilates to a neighboring pixel with the darkest grayscale
intensity along a 4 pixel-long line drawn from each contour point perpendicular to the
line that connects the two contour points on each side of the current contour point.
Thus the contour dilates into the void space between the graft and callus bone if it
exists (Figure 3.2-1D). Because the contour snaps to the gradient between
contrasting pixels, the contour point will shift to the material of lesser radiopacity.
Generally, this means it shifts off the dense cortical graft, onto either newly
mineralized callus (woven bone is less radiopaque than organized lamellar bone), or
onto unmineralized soft tissue adjacent to the graft. Cubic spline interpolation was
used to smoothly join the contours. The contour from the previous slice is then copied

67
onto the next where the edge-detection and void space search processes are repeated
under operator supervision and modification, until the entire length of the graft is
contoured to create a shell around the graft. The shell is then meshed using triangular
elements that are used to quantify the amount of graft area in contact with host bone
or mineralized callus by summing 1/3 of the area of each triangle element for each
vertex that falls within a voxel with a grayscale value greater than the threshold used
to define mineralized tissue. The proximal and distal halves of the graft are evaluated
separately, and the lesser ratio of the connected surface area to total graft surface area
is used in the analysis and assigned as the value of the Union Ratio, to account for
any variation in graft size in our standardized model. The MATLAB code for the
semi-automated contouring, the 3D shell generation and the quantification are given
in the appendix and on a CD.
A B
C D
E
Figure 3.2-1: Illustration of the graft-to-host Union Ratio algorithm.

68
A user outlines the surface of the graft using contours on transverse micro-CT slices
(A). The semi-automated algorithm developed using MATLAB then optimizes the
manually defined contours drawn around the endosteal and periosteal surfaces
(yellow lines) (B). The contours are first snapped to the graft boundary by edge-
detection (C), then dilated into darker regions away from the graft surface, finding the
gap between graft and callus, if it exists (red denotes voxels that are adjacent to host
bone/callus and blue denotes voxels that are adjacent to host soft tissue) (D). The
resulting 2D contour from one slice is then copied to the next slice and the edge
detection and gap-finding operations are performed. This process is repeated on
each slice until the entire graft is enclosed in contours. A smoothed 3D shell is
generated from the contours using MATLAB’s isosurface function (E). The footprint
of bone penetrating the shell therefore defines connection areas between the graft
and host or callus. Summed over the entire surface area of either half of the graft
shell, the lesser area of the connections (red regions) normalized by the total surface
area for either proximal or distal half is defined as the Union Ratio.
3.2.3 Validation with Digital phantom
A digital model with standard hollow cylindrical geometry was created in
order to validate the calculations used to measure the connected surface area. This
model was generated as an idealized graft between two host ends, with geometrically-
defined connections simulating callus originating from the host tissue. The
theoretically-predetermined areas of connectivity that were used to validate the
computational technique are shown in Figure 3.2-2. The hollow cylindrical model

69
was generated with thickness of 15 pixels and outer diameter of 50 pixels, yielding a
relative resolution similar to the resolution of the real micro-CT images (typical
allograft cortical thickness was 180-200 microns (13-14 pixels) thick, and about 1.25-
1.55 mm (90-110 pixels) in diameter. Predetermined areas of connectivity were
created directly between the graft and host as rectangular prisms that either attached
to the end surface of the graft (Figure 3.2-2 B-B) or intersected the periosteal surface
of the graft connecting it to the callus (Figure 3.2-2 C-C). This idealized model was
then contoured and the Union Area was computed as described for the experimental
grafts.
B
B
C
C
Section B-B Section C-C
A
D
Figure 3.2-2: Algorithm validation using a digital model.
An idealized cylindrical graft (blue) between host cortical bone (white) and callus
(light gray) was digitally generated in MATLAB and used to validate the Union Ratio

70
measurement. The graft was given defined rectangular regions of union to the host
directly (section B-B) as well as between the graft and the callus forming around it
(section C-C). The theoretical union area (red regions) based on the idealized
geometry projected onto the curved surface was 2173.2 pixels2. Using the
contouring computational algorithm, the measured area represented in (D) was
2171.4 pixels2 resulting in a measurement error of only 0.08%.
3.2.4 Statistical Analysis
Comparisons of autograft and allograft Union Ratio data at the different time
points were performed using 2-way analysis of variance and Bonferroni post hoc
multiple comparisons. To evaluate intraoperator and interoperator error in the
estimation of the Union Ratio, a subset of 2 specimens from each group (8 specimens
total) was randomly selected to be repeated by the first operator (DGR) as well as
performed and repeated by another trained operator (MOP). The average percent
error between measurements was calculated by the absolute value of the difference
between measures divided by the average measurement. As described by Lodder et al
(Lodder et al. 2004) the coefficient of variation (CV) is the standard deviation
between measurements normalized by the mean of the paired measurements,
calculated as where a and b are the first and the second
measurements, Ma and Mb are the mean values for the two groups, and n is the
number of paired observations. Intraclass correlation coefficients (ICC) to evaluate
the concordance, or agreement, between measurements within and between operators

71
were computed (McGraw et al. 1996). This is defined as the difference between the
overall variation and the measurement variation, divided by the sum of the
measurement and overall variation. The ICC ranges between 0 and 1 where 1 is
perfect concordance.
As described in Section 2.3.5, univariate regression analysis was used to
determine if Union Ratio correlated with the ultimate torque and torsional rigidity of
6 and 9 week specimens. The best single variable regressions were determined for
the allografts and autografts separately as well as together using MiniTab Release 12
(State College, PA). Multivariate regression analysis was used to determine
combinations of micro-CT parameters that correlated with the torsional mechanical
properties using SAS 9.1 (SAS Institute Inc., Cary, NC). The analyses were
performed 3 separate ways. The foundation set included the variables that were used
in Chapter 2 (BVs and PMIs). In the second evaluation the Union Ratio was included
as a covariate. Interactions between the Union Ratio and the other foundation
variables were also allowed in this regression analysis. The third evaluation included
time as a covariate and investigated its interactions with the foundation variables. In
each evaluation, in order for two interacting variables to be included as a term, they
also needed to be included in the regression by themselves. This is accomplished by
creating variable groups in SAS so that interacting terms are only selected if the two
variables that make up the interacting term are also included, and together the three
terms significantly add to the regression. Unfortunately, SAS cannot not perform best
subsets selection using Mallow’s CP with grouped variables; instead, bi-directional
72
stepwise selection was used to select significant terms for the model. The selection
criteria used for this was to add the next strongest variable in the regression if it
achieved a significance at p < 0.50 to enter the model, and then check the significance
of each term of the equation and remove the one with the lowest significance if p <
0.05. These steps are iterated to ensure the most significant independent variables
and variable-interactions would be included in the model. The limitation of switching
to stepwise regression is that it does not look at every combination of independent
variables as Best Subsets selection does, so it could miss a better combination of
parameters, but in our experience evaluating both methods this risk is generally small
and the methods give similar results.
A continuous host-to-host callus shell had formed from one end of the graft to
the other in some specimens, while in other specimens there was a noticeable
discontinuity between the callus that formed from the proximal and distal ends. Host-
to-host bridging was particularly apparent in many of the autograft specimens.
Characterization of specimens with or without continuous host-to-host callus
formation was systematically investigated by scanning the axial cross sections from
one end of the graft to the other. If there was an interruption in callus, they were
“not-bridged”, while those with continuous flow of callus from one end to the other
were termed “bridged”. Non-bridged specimens are apparent in Figure 2.3-2C and
the allografts at 6 and 9 weeks in Figure 2.4-1 with all other specimens shown having
bridging (the 18 week allograft specimen shown had bridging apparent in another

73
view). To examine this as a factor for predicting strength, it was also incorporated in
the regression analysis.
3.3 RESULTS
3.3.1 Algorithm Validation
To validate the semi-automated contouring algorithm and computation of the
Union Ratio, a digital model was created that resembles a graft connected to host
bone and callus by a footprint of defined dimensions (Figure 3.2-2). The
predetermined connected area which accounts for the curvature of the cylindrical
model surface was computed to be 2173.2 pixels2. Using the contouring method and
the MATLAB algorithm, the Union Area was determined to be 2171.4 pixels2,
resulting in a measurement error of only 0.08%.
3.3.2 Union Ratio of Autografts and Allografts
Figure 3.3-1 illustrates the typical differences in the union with host bone and
callus between allografts and autografts at 6 and 9 weeks. Table 3.3-1 reports the
cumulative group results. At 6 weeks, the Union Ratio of autografts was nearly
double that of allografts (p < 0.05). The areas of union were also more uniformly
distributed along the length of the autografts compared to the allografts for which
new bone formation was restricted to the host bone at the ends of the grafts (Figure
3.3-1). At 9 weeks, the allografts’ Union Ratio was 2.2 times that of 6 week

74
allografts (p < 0.05), while the autografts’ Union Ratio declined 33% from 6 to 9
weeks (p < 0.05).
6wk Allo 9wk Allo 6wk Auto 9wk Auto
0.05 0.27 0.28 0.13
Figure 3.3-1: Representative micro-CT and union area images.
Representative micro-CT sagittal sections of 6 and 9 week allografts and autografts
(top) with the corresponding union area maps and Union Ratio numerical values
(bottom). The graft bone is highlighted in yellow. Red indicates areas where the graft
is connected to the host. Note that the areas of union and non-union (green arrows)
correspond accurately to the measured union areas on the surface of the graft
represented in red. Note also that union with the periosteal and endosteal surfaces,
and the ends of the graft were all accounted for. The proximal and distal halves of

75
the graft were evaluated separately, and the lowest value of the union area
normalized by the surface area was reported as the Union Ratio underneath each
specimen. The Union Ratio for each specimen is given at the bottom (numerical
values).
Table 3.3-1: UnionRatio and Host-to-Host bridging callus results
6 wk Allo 9 wk Allo 6 wk Auto 9 wk Auto
Group: n=8 n=7 n=8 n=12
UnionRatio: 0.105 (0.023) 0.228 (0.037) * 0.224 (0.029) † 0.150 (0.011) *,†
H-H Bridg.: 0% 57% 100% 100%
TUlt 5.0 (1.2) 14.4 (0.9) * 17.1 (1.2) † 18.4 (1.1) *,†
TR 0.105 (0.023) 0.228 (0.037) * 0.224 (0.029) † 0.150 (0.011) *,†
Data presented as mean (SEM) and as percent of specimens with bridging. Significantly
different means are labeled † for p < 0.05 between time points for each graft type and * for p
< 0.05 between graft types at each time point. TUlt and TR are the same results as presented
in Chapter 2.
The intra- and inter-operator sources of error in the measurement of the Union
Ratio were also investigated. The average percent error between operators’
measurements was 12% and the coefficient of variation (CV) was 9.7%. The intra-
operator ICC was 0.930 for DGR and 0.949 for MOP while ICC between different
operators (DGR and MOP) was 0.926. These results indicate that the measurements
were remarkably reproducible.

76
3.3.3 Correlations between Union Ratio and Torsional Properties
To estimate the effects of the Union Ratio on the torsional biomechanical
properties, univariate linear regression analyses were performed. When autografts
and allografts at all time points were grouped, the regression analysis identified weak,
yet significant, associations between the Union Ratio and the torsional properties
(Table 3.3-2). However, when analyzing the allograft data separately the correlation
was much stronger. By contrast, there were no significant associations between the
autografts’ Union Ratio and torsional properties. Taken together, these results suggest
that the Union Ratio is a significant indicator of functional strength in the devitalized
allografts that undergo no or little remodeling over the first 9 weeks of healing, while
it does not correlate with the biomechanical properties of autografts that undergo a
robust remodeling (as shown in Figure 2.4-2) such that the Union Ratio actually
decreases between 6 and 9 weeks due to excessive graft resorption.

77
Table 3.3-2: Coefficients of determination and p-values for the univariate linear
regression of non-structural and structural independent variables TUlt and TR.
Allografts & Autografts Allografts Autografts
TUlt TR TUlt TR TUlt TR
Non-structural
Time 48.1 (0.0001)
65.1 (0.0001)
80.2 (0.0001)
97.4 (0.0001)
27.3 (-) (0.022)
33.7 (-) (0.005)
Graft Type 25.0 (0.002)
9.0 (0.09) n/a n/a
Structural
UR 12.1 (0.043)
15.4 (0.022)
58.4 (0.001)
50.7 (0.003)
15.1 (0.1)
4.6 (0.379)
BVCallus 1.9
(0.44) 0.2
(0.812) 8.1
(0.304) 4.7
(0.44) 2.0
(0.567) 0.4
(0.803)
BVGraft 36.4 (-) (0.0001)
16.7 (-) (0.016)
12.6 (0.194)
5.8 (0.388)
19.1 (-) (0.061)
27.0 (-) (0.023)
PMIAve 9.5
(0.075) 11.9 (-) (0.045)
20.0 (0.094)
15.1 (0.152)
4.7 (0.375)
2.0 (0.561)
PMIMax 23.9 (-) (0.003)
22.6 (-) (0.004)
35.0 (-) (0.020)
27.3 (-) (0.046)
18.0 (0.070)
0.1 (0.916)
PMIMin 16.8
(0.027) 7.9
(0.108) 7.1
(0.336) 16.4
(0.135) 0.9
(0.701) 5.5
(0.334)
H-H Bridging 57.2 (0.0001)
35.5 (0.0001)
61.3 (0.001)
49.1 (0.004) n/a *
Data presented as R2 (p < ). P values for the two-sided test of the null hypothesis
that the slope of the regression line is zero. The strongest structural predictor (not
including host-to-host bridging) for the mechanical outcome is in bold. (-) indicates an
inverse relationship; only shown for significant correlations. * all autografts had
callus bridging from host to host.

78
To account for other variables that contribute to the biomechanical properties
of the grafts, multivariate correlations between micro-CT parameters and torsional
properties were investigated as described in Sections 2.3.5 and 3.2.4. When included
as an independent variable, the Union Ratio was a significant, predictive variable that
increased the regression coefficients for rigidity and strength of 6 and 9 week
autografts and allografts as a group.
To determine the union ratio’s ability to improve the correlation between
structural measures and mechanics, multivariable regression was performed twice,
once without the Union Ratio, and again with the Union Ratio. Without Union Ratio,
BVGraft PMIMax and PMIMin were selected to correlate with TUlt yielding an Adjusted
R2 = 0.50 (Figure 3.3-2A) and PMIMax and PMIMin were selected to correlate with TR
yielding an Adjusted R2 = 0.31 (Figure 3.3-2C). Including Union Ratio in the
independent variables to select from resulted in significantly higher correlation
coefficients. The ultimate torque correlated significantly with the combination of
Union Ratio, BVGraft, PMIMin and the interaction terms Union Ratio×BVGraft and
Union Ratio×PMIMin (Adjusted R2 = 0.67, Figure 3.3-2B). The torsional rigidity
correlated significantly with Union Ratio, BVGraft, BVCallus, PMIMax, PMIMin, and the
interaction terms Union Ratio×PMIMax, and Union Ratio×PMIMin (Adjusted R2 =
0.57, Figure 3.3-2D).

79
(N×m
m)
(N×m
m)
(N×m
m2 )
(N×m
m2 )
Figure 3.3-2: Multivariable linear regression analysis of allografts and
autografts.
Multivariable linear regression analysis of geometric micro-CT-based parameters
including bone volume (BV), polar moment of inertia (PMI), and Union Ratio (UR).
The variable selection by regression analysis was performed without UR (A and C),
and with UR (B and D) for the combined set of autografts and allografts. Adjusted R2
and the variables that were selected to generate the optimum regression equation
are given on each graph with their coefficients and standard error indicated. Each
variable or group of variables was significant at the p < 0.05 level, as indicated by *.

80
Variables without * were part of a group of variables that significantly contributed to
the regression as a group. These groups were made of the interacting term, and the
individual terms that make of the interacting term. Upon inclusion of UR, UR was
selected as a significant contributor either by itself, or in combination with other
measures. This improved the correlation’s Adjusted R2 by 0.16 for TUlt (A and B) and
by 0.26 for TR (C and D). All regressions were significant (p < 0.01).
When allografts were analyzed separately, and before the Union Ratio was
derived, the multivariate regression analysis used BVCallus, PMIAve and PMIMax for an
Adjusted R2=0.72. With the Union Ratio available, the regression selection chose
UR, PMIMin, BVGraft, and UR×BVGraft (the interaction term) in the regression with the
ultimate torque, increasing the Adjusted R2 to 0.80 (p<0.05) (Figure 3.3-3B). The
correlation with the torsional rigidity of allografts significantly improved with the
addition of the Union Ratio from an Adjusted R2 from 0.74 to 0.89 (p<0.05) with the
combination of the Union Ratio, BVGraft, PMIMax, PMIMin and the interaction terms
with the Union Ratio: UR×BVGraft, UR×PMIMax, UR×PMIMin (Figure 3.3-3 C & D).

81
Adj.R² = 0.89
0
1000
0 1
Pred
icte
d To
rsio
nal R
igid
ity
Measured Torsional Rigidity
A B
C D
Intercept 2045 ± 538 *UR -8396 ± 3777 *BVGraft -3550 ± 841 *PMIMax 240.7 ± 110 *PMIMin 2468 ± 588 *UR×BVGraft 19741± 5430 *UR×PMIMax -3223 ± 1134 *UR×PMIMin -8593 ± 3441 *
000
Adj.R² = 0.80
0
30
0 3
Pred
icte
d U
ltim
ate
Torq
ue
Measured Ultimate Torque0
Adj.R² = 0.72
0
30
0 30
Pred
icte
d U
ltim
ate
Torq
ue
Measured Ultimate Torque
6 wk Allo9 wk Allo
Adj.R² = 0.74
0
1000
0 1000
Pred
icte
d To
rsio
nal R
igid
ity
Measured Torsional Rigidity
Intercept 27.48 ±7.81 *UR -94.48 ±62.35BVGraft -34.84 ±8.75 *PMIMin 25.08 ±6.27 *UR×BVGraft 133.6 ±60.78 *
Intercept 4.73 ±3.05BVCallus 46.50 ±11.6 *PMIAve 12.09 ±4.44 *PMIMax -15.23 ±2.87 *
Intercept -16.01 ±156BVCallus 1518 ±608 *PMIMax -401.9 ±84.7 *PMIMin 966.6 ±275 *
(N×m
m)
(N×m
m)
(N×m
m2 )
(N×m
m2 )
Figure 3.3-3: Multivariable linear regression analysis of allografts
Multivariable linear regression analysis of geometric micro-CT-based parameters
including bone volume (BV), polar moment of inertia (PMI), and Union Ratio (UR) for
allografts only. The variable selection by regression analysis was performed without
UR (A and C), and with including UR (B and D) for allografts only. Adjusted R2 and
the variables that were selected to generate the optimum regression equation are
given on each graph with their coefficients and standard error indicated. Each
variable or group of variables was significant at the p < 0.05 level, as indicated by *.

82
Variables without * were part of a group of variables that significantly contributed to
the regression as a group. These groups were made up of the interaction term and
the individual terms of the interacting term. Upon inclusion of the UR, it was selected
as a significant contributor either by itself, or in combination with other measures.
This improved the correlation’s Adjusted R2 from 0.72 to 0.80 for TUlt (A and B) and
from 0.74 to 0.89 for TR (C and D). All regressions were significant (p < 0.01).
To determine the ability of time-after-surgery as a predictor of strength and
rigidity as a factor in the regressions the correlation of time by itself was calculated
and stepwise selection was performed with time as a co-variate. By itself, time was
generally the single best predictor of strength and rigidity for the subsets of allografts-
only, autografts-only, and allografts and autografts together (Table 3.3-2). In the
multivariate analysis for TUlt, time was chosen as a significant parameter along with
BVCallus, BVGraft, and PMIMin as grouped terms including the interaction with time
(Adj. R2 = 0.85, p < 0.0001) (Details not shown). Similarly, the multivariate
regression for TR determined that time, PMIMin, and BVGraft and the interaction
time×BVGraft was the best combination of predictors (Adj. R2 = 0.82, p < 0.0001)
3.4 DISCUSSION
Despite the high incidence of bone fractures and the clinical development of
safe and effective anabolic/osteogenic therapies for bone healing (i.e. teriparatide,
BMP-2), the absence of a non-invasive outcome measure of biomechanical healing of
fractured bone continues to limit our ability to define non-unions and evaluate new

83
therapies for unmet clinical needs. In Chapter 2 the establishment of correlations of
micro-CT parameters with torsional properties in the mouse femoral graft model was
attempted, but we found that we could only predict 50% of the biomechanical
properties of the mouse grafted femurs. This poor correlation is largely explained by
the fact that none of the established micro CT parameters are capable of quantifying
the extent of cortical bone union between the graft and the host, which intuitively
should be directly related to strength of the bone. Therefore, a novel algorithm to
quantitatively estimate the union between graft and host bone based on micro-CT data
was developed and validated. We then used a combination of this and other structural
outcome measures to define regression equations would correlate bone strength and
stiffness for a spectrum of treatments which included two graft types and 2 time
points in order to objectively evaluate bone graft healing. These results successfully
highlighted the differences in healing due to graft type, as well as the changes in
union and osseointegration patterns over time. Furthermore, one-to-one correlations
demonstrated that the Union Ratio was a significant predictive variable of the
biomechanical properties of the devitalized allografts, but not the live autografts.
Quantifying the Union Ratio of live autografts and devitalized allografts
corroborated previously qualitative observations regarding the biology and
biomechanics of healing in both cases (Tiyapatanaputi 2004, and Chapter 2 of this
dissertation). Histological evidence shows that devitalized allografts induce a foreign
body reaction that encases the graft in a fibrous layer initially which can be gradually
overcome with progression of the creeping callus from the host bone that typically

84
remains restricted to the graft ends (Tiyapatanaputi et al. 2004). Our results now show
that the mitigation of non-union by 9 weeks, when the callus finally penetrates the
fibrous capsule and integrates with the devitalized allograft, significantly increases
the ultimate torque and torsional rigidity (Table 3.3-1 & Table 3.3-2).
In the case of autografts, the Union Ratio does not correlate with torsional
properties, as shown in Table 3.3-2, while the allografts’ Union Ratio significantly
correlated with the torsional properties. We hypothesize that these results reflect
fundamental biological differences in the healing of live autografts and the
devitalized allografts which arise from the contribution of periosteal cells in live
autografts that are absent in devitalized allografts. We have previously shown that
autograft repair is facilitated by both endochondral bone formation at the host-graft
junction and by intramembranous bone formation along the entire length of the graft
as early as 2 weeks post-transplantation, and undergoes significant remodeling by 4
weeks(Tiyapatanaputi et al. 2004). This results in the formation of a new bone collar
that bridges the entire length of the autograft by 4 weeks, which is also apparent in
this study at 6 and 9 weeks in Figure 3.3-1. It is hypothesized that this new bone
collar begins to assume a significant share of the in vivo loading, and therefore the
autograft begins to experience significant stress-shielding and undergoes rapid and
substantial resorption (by up to 57%) by 6 weeks, thus rendering its contribution to
mechanical properties of the femur negligible. Therefore, whether or not the
remaining graft has a high degree of union to the new cortical shell plays little role in
the overall mechanical strength. In contrast, devitalized allografts completely rely on
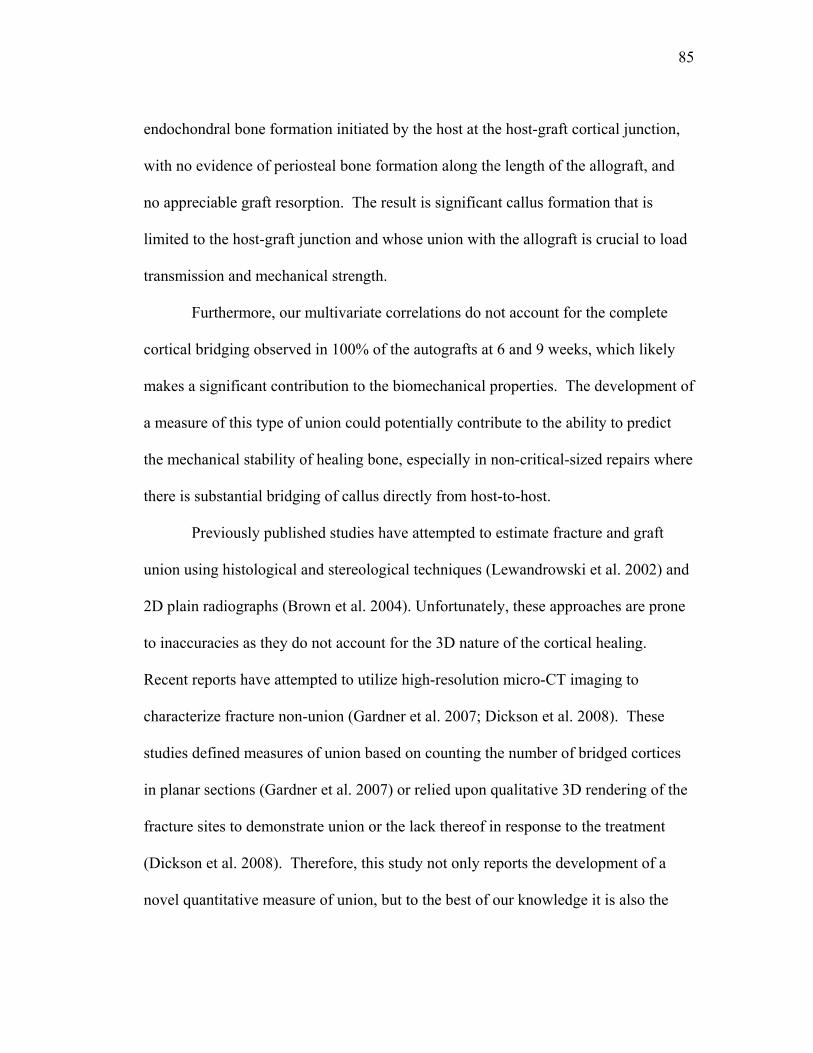
85
endochondral bone formation initiated by the host at the host-graft cortical junction,
with no evidence of periosteal bone formation along the length of the allograft, and
no appreciable graft resorption. The result is significant callus formation that is
limited to the host-graft junction and whose union with the allograft is crucial to load
transmission and mechanical strength.
Furthermore, our multivariate correlations do not account for the complete
cortical bridging observed in 100% of the autografts at 6 and 9 weeks, which likely
makes a significant contribution to the biomechanical properties. The development of
a measure of this type of union could potentially contribute to the ability to predict
the mechanical stability of healing bone, especially in non-critical-sized repairs where
there is substantial bridging of callus directly from host-to-host.
Previously published studies have attempted to estimate fracture and graft
union using histological and stereological techniques (Lewandrowski et al. 2002) and
2D plain radiographs (Brown et al. 2004). Unfortunately, these approaches are prone
to inaccuracies as they do not account for the 3D nature of the cortical healing.
Recent reports have attempted to utilize high-resolution micro-CT imaging to
characterize fracture non-union (Gardner et al. 2007; Dickson et al. 2008). These
studies defined measures of union based on counting the number of bridged cortices
in planar sections (Gardner et al. 2007) or relied upon qualitative 3D rendering of the
fracture sites to demonstrate union or the lack thereof in response to the treatment
(Dickson et al. 2008). Therefore, this study not only reports the development of a
novel quantitative measure of union, but to the best of our knowledge it is also the

86
first to report direct correlations between the graft and host degree of union and the
biomechanical properties of the reconstructed bone, which could have important
applications in longitudinal preclinical and clinical studies of bone repair and
grafting.
3.4.1 Clinical fracture non-union case study
The Union Ratio has significant clinical implications as a novel quantitative
biometric which prompts further study in additional pre-clinical and clinical settings.
Various preclinical and clinical studies have been performed to treat bone injuries
with adjuvant therapies to enhance healing and bone formation around allografts,
enhance their incorporation and remodeling, and their biomechanical properties and
durability. The evaluation of the repair quality and osseointegration in preclinical
animal models can be accomplished by destructive biomechanical testing. However,
the evaluation of clinical patients has to date been mostly based on non-quantitative
radiographic outcomes since destructive biomechanical testing is not an option.
To demonstrate the potential clinical utility of our algorithm on CT scans of
clinical resolution, we retrospectively analyzed clinical CT images of an anonymous
patient with a prolonged non-union (>4 months) tibial fracture, which was
subsequently non-surgically treated with teriparatide. We used our custom MATLAB
software to contour the segment of bone on one side of the fracture site similarly to
contouring around the murine graft. The surface area forming union to the other side
of the fracture was then estimated by the software. After 4 months of treatment, the
87
patient had a 2.8 fold increase in the mineralized Union Area connecting the fractured
segments which underscored the functional outcome of the patient being able to
finally bear weight on the healing leg (Figure 3.4-1).
A B
E F
C
G
D
H
Figure 3.4-1: Measuring the Union Area from clinical CT data of human
patients.
Clinical x-rays and CT scan data of a patient’s fractured tibia from before and after 4
months of teriparatide therapy were obtained retrospectively from the University of
Rochester Department of Orthopaedics, in compliance with institutional review board
research exemption. The tibial non-union 4.5 months after fracture is apparent from
plain x-ray (A). The non-union was confirmed by 3D reconstruction of the patient’s
CT as evidenced by the space between the proximal (white) and distal (blue) ends of

88
the fracture (B), which yielded a union area (red) of 4.2 cm2 (C). The remarkable
effects of teriparatide on fracture healing are demonstrated by x-ray (E) and 3D CT
(F & G), and could by quantified as a 2.8 fold increase in Union Area. Panels D & G
are rotated to show the healing surface.
Every clinical fracture case will have a different geometry of the fractured
bone, so defining how much union area is needed to be considered “healed” still
needs to be investigated. Another hurdle to overcome is how to validate the results of
being “healed” since destructive mechanical testing is impossible clinically, but they
could be compared to other outcome measures such as pain, and functional evaluation
(Puzas et al. 2006) and perhaps the re-fracture rate. Eventually, when validated in
additional pre-clinical studies, the union ratio can potentially help overcome a
significant hurdle in longitudinal clinical trials by providing a quantitative CT-based
union biometric that identify patients at risk for non-union complications.
Still, in controlled pre-clinical investigations of adjuvant therapies for bone
healing, the measurement of union can be expected to identify treatments that
accelerate osseointegration.
89
Chapter 4: The use of adjuvant systemic teriparatide (PTH 134) treatment improves grafted femur biomechanics by increasing grafttohost union formation 4.1 INTRODUCTION
Large structural allografts used for reconstruction of critically-sized defects,
experience failure rates of 23 - 43% (Brigman et al. 2004; Donati et al. 2005). The
three major complicating factors are non-union (27-34%), graft fracture (24-27%) and
infection (9-16%). A component of graft fracture may also be a result of delayed
union because without union the internal fixation devices such as plates, stems and
screws are relied on for load bearing which apply stress in focused regions within
bone and thus accelerating fatigue damage (Wheeler et al. 2005). Therefore rapidly
achieving union at the graft-host interface could prevent failures due to non-unions,
and potentially failures due to fatigue fracture of the graft material. Also, without
osteointegration with the host which is the first step required for graft remodeling, the
graft material remains acellular and will not heal in the event of graft fracture.
It is well documented that intermittent administration of teriparatide, an active
peptide sequence of parathyroid hormone (PTH 1-34) is a bone anabolic factor that
enhances skeletal bone mass in osteoporotic patients (Neer et al. 2001). It has been
approved by the FDA for clinical use for osteoporosis and has been shown to reduce
the incidence of fracture (Neer et al. 2001; Body et al. 2002). Additional preclinical

90
studies show that PTH is capable of accelerating the rate of fracture healing resulting
in greater strength (Chalidis et al. 2007) as well new evidence that it is effective at
reversing persistent non-unions in patients with fragility fractures (Bukata et al.
2009). PTH has also been studied with live bone grafts such as a large segmental
vascularized bone grafts in rats to study combinational effects of PTH and
bisphosphonates (Hashimoto et al. 2007) and for enhancing spinal fusion
experimentally in conjunction with morselized autograft in rabbits (Abe et al. 2007).
The mechanism of action by which therapeutic PTH enhances bone healing
has been found to affect cell populations at multiple stages of bone healing including
the mesenchymal (Nishida et al. 1994; Kaback et al. 2008), chondrogenic (Nakazawa
et al. 2005; Kakar et al. 2007) and osteogenic (Nakajima et al. 2002; Gardner et al.
2007) cell types. With intact bone, the response to PTH treatment is dominated by a
direct effect on osteoblasts by extending their life via suppression of apoptosis thus
increasing the total number of osteoblasts (Jilka et al. 1999). In healing bone, there
appear to be additional pathways by which intermittent PTH has its anabolic effects.
It has been suggested that PTH activates the preferential differentiation of progenitor
cells towards osteoblasts (Pettway et al. 2008), but does not enhance osteoblast or
precursor proliferation (Dobnig et al. 1995).
In addition to the effects on intact bone, PTH has been shown to enhance
fracture healing to an even greater extent. PTH administered to rats recovering from
a closed tibia fracture had a greater increase in strength and callus bone volume in
their fractured femur than in their intact tibia at 40 days post-fracture (Andreassen et

91
al. 1999). Nakazawa et al has shown that by 14 days post fracture chondroprogenitor
proliferation precedes the increases in bone formation (Nakazawa et al. 2005). Thus
one mechanism may be through formation of a larger cartilage anlage prior to callus
mineralization. Similar findings were recapitulated by Kakar et al. with increased
cartilage area in PTH treated fractures at day 5 and 10, after which they found that
chondrocyte hypertrophy markers were also upregulated (Kakar et al. 2007). See
Appendix B for a table summarizing a thorough review of the literature related to
PTH for fracture healing.
We have shown that upon mechanical torsional testing of allografted mouse
femurs the weakest location after 6 weeks was at the graft-host-interface, as all the
femurs failed there (Table 2.4-2). Allograft strength is also still in great deficit at 6
weeks. The femurs with autografts implanted for 6 weeks, and allografts implanted
for 9 weeks were stronger and stiffer than 6 week allografts and the fractures location
after mechanical testing occurred within the bone of the graft and the host suggesting
that the weakest point was not exclusively at the graft-host-interface due to greater
union. In order to develop a means of quantitatively assessing the degree of union,
we then devised an algorithm to quantify this site of weakness in bone grafts that we
termed the Union Ratio. The Union Ratio is a measure of the surface area of boney
callus formation onto the surface of the graft from micro-CT images. It has been
established that the Union Ratio correlates highly with the strength and stiffness of
grafted femurs and explained over 50% of the variation in mechanical properties of
allografted femurs (Table 3.3-2).

92
The objective in this study was to determine whether graft-to-host union and
bone mechanics are improved by intermittent systemic PTH treatment at 6 weeks
after allograft implantation. We hypothesize that systemic intermittent PTH
treatment will improve the bone volume and mineral content of host callus formation
around the allograft, and will overcome the delay in graft-host union by 6 weeks.
These morphological changes of the callus will result in the recuperation of
mechanical strength and rigidity of the grafted femurs. We also use the parameters of
bone graft healing that were established earlier in this dissertation to develop a means
of explaining the variation in biomechanical strength and stiffness with non-invasive
micro-CT imaging.
4.2 METHODS
4.2.1 Experimental Model
Four millimeter long bone allografts were harvested from donor mice, and
were processed to generate clean, aseptic, devitalized bone allografts for
implantation. All soft tissue was removed, the grafts were trimmed to 4mm in length
using a diamond-sintered cutoff saw, they were bathed in 70% ethanol for 3 hours,
rinsed three times with sterile saline and frozen to -80oC for 1 week. These bone
grafts were implanted into intecalary defects in the femur of other mice and secured
in place using a 0.35mm diameter stainless steel intramedullary pin as shown in
Figure 4.2-1 and as preiviously described (Reynolds et al. 2007). One week after
surgery, daily injections of 40µg/kg hrPTH (1-34) (Lilly, Inc., Indianapolis, IN) were

93
initiated in half of the mice, while the others received injections of saline control.
Weekly x-rays were taken to monitor progression (Faxitron X-Ray LLC, Wheeling,
IL). Further procedural details for each experimental study are described in the
sections that follow.
Saline group: Daily Saline Injections
Weeks1 2 3 4 5 6
PTH group: Daily PTH Injections (40 ug/kg)
• Histology & Vascular Imaging; n=4
• MicroCT & Biomechanical Testing; n=14
• Histology & Vascular Imaging; n=4
Figure 4.2-1: Experimental Design
4.2.2 Biomechanical Study
One cohort of the study groups used 14 mice from each treatment (PTH and
control) for imaging and mechanical material testing. These were sacrificed 6 weeks
after surgery. Each femur was harvested by disarticulating the hip and knee and
removing the intramedullary stainless-steel pin. Specimens were moistened with

94
saline and frozen at -20oC until thawed for micro-CT imaging and torsion testing.
Specimens were scanned at 12.5 µm isotropic resolution using the Scanco VivaCT 40
(Scanco Medical AG, Bassersdorf, Switzerland). From these 3D images, the graft
and callus bone volumes (BVGraft, BVCallus) were measured by manual segmentation,
followed by standardized thresholding at a grayscale corresponding to 750
mgHA/cm3 based on a phantom of known HA concentrations (Nazarian et al. 2008).
The cross-sectional polar moment of inertias (PMI) were computed for each slice
throughout the grafted region and the maximum, minimum and average PMI
(PMIMax, PMIMin, PMIAve) were investigated to determine their contribution to the
biomechanics of the grafted femurs.
The Union Ratio, as described in Chapter 3 and (Reynolds et al. 2008), was
also calculated. The Union Ratio measures the graft surface area upon which
mineralized callus has formed. In brief, if the voxels adjacent to the graft surface are
boney callus, the area of that region of the graft is measured and normalized to the
total graft surface area. Figure 4.3-3 depicts the bare surface of the graft in blue, with
regions of union to the callus depicted as red. Each half (proximal and distal) of the
graft is evaluated separately and the lesser ratio of union area to total graft surface
area is given as the Union Ratio for that specimen. Callus formation that bridged
from host-to-host over the graft was determined by evaluating serial axial cross
sections from micro-CT images and given a binary result. These samples were then
mechanically tested in torsion as described in Chapter 2 and (Reynolds et al. 2007).
Yield torque (TYield), ultimate torque (TUlt), torsional rigidity (TR), toughness (or
95
work to failure) and the twist at ultimate torque were determined for each specimen.
Finally, the mode of failure for each specimen was determined using an x-ray as
depicted in Figure 2.3-4.
4.2.3 Vascularization and Histological Study
A second cohort of 16 animals underwent the same surgery with sacrifice of 8
animals at 4 weeks and 8 animals at 6 weeks post-surgery to evaluate the degree of
vascularization of the graft and callus region using vascular profusion as described
previously (Duvall 2004). Half of the animals were treated with PTH, and the other
half with saline.
4.2.3.1 Vascular perfusion
On the day of sacrifice, animals were injected with a fatal dose of ketamine
and xylazine and their vasculature was perfused using a syringe pump through a
needle placed into the left ventricle of the heart. The right atrium was also punctured
to allow the blood to drain out. They were first perfused with heparinized (100
units/ml) saline to prevent blood clotting, followed by 10% neutral-buffered formalin,
and lastly with lead-chromate contrast agent (Microfil 122, Flow Tech, Inc. Carver,
MA). Samples were fixed in 10% formalin overnight followed by harvest of the
femur and pin extraction. Samples were micro-CT scanned once after fixation, and
again after EDTA decalcification. Using both scans we could evaluate the
vasculature specifically within the mineralized callus. The vessel volume, thickness,
spacing and vessel number was determined.

96
4.2.3.2 Histology
After micro-CT imaging for vascular analysis, specimens were processed for
histology. Mid-sagittal sections were stained with alcian blue, hematoxylin, eosin
and orange G as previously described (Tiyapatanaputi et al. 2004). Micro-CT
images were manually resliced using NIH ImageJ software in the same plane as the
histology sections to compare the imaging modalities as shown in Figure 4.3-1.
4.2.4 Statistical Analysis
Student t-tests were used to compare differences between PTH treatment and
saline treatment for each of the micro-CT imaging measures, and biomechanical
testing results.
As described in Chapters 2 & 3 (Reynolds et al. 2007; Reynolds et al. 2008),
univariate regression analysis was used to determine the degree of correlation
between micro-CT imaging derived measures and ultimate torque, yield torque and
torsional rigidity. Multivariate linear regression analysis was used to determine
combinations of micro-CT parameters that correlated with the torsional mechanical
properties. Stepwise selection regression analysis was used to optimize the
combination of significant (p<0.05) independent variables in a linear model. This
was performed using SAS 9.1 (SAS Institute Inc., Cary, NC).

97
4.3 RESULTS
4.3.1 Bone analysis from Micro-CT imaging
Observations from Micro-CT imaging shown in Figure 4.3-1 and Figure 4.3-2
revealed that in PTH treated specimens host callus formation around the graft were
larger and packed with regions of trabecular bone. Intramedullary callus was also
present to a greater extent in PTH treated animals. There were also fewer apparent
non-unions visible in PTH treated specimens. Bridging over the graft from host-to-
host was present in 6 of 14 specimens from saline treated control animals, and 8 of 14
specimens treated with PTH.
At 6 weeks after surgery, PTH treatment significantly increased BVCallus by
93%, with a noteworthy increase in BVIntramed of 217% (Table 4.3-1). The enhanced
bone formation resulted in a significant 38% and 26% increase in PMIAve and PMIMax,
respectively. This was predominately due to an increase in cross sectional area due to
the increase in bone volume fraction of the callus, and not a change in the outer
diameter of the callus – the maximum outer radius was 1.8±0.2 mm for saline
controls and 1.7±0.3 mm for PTH treated animals. In PTH treated animals, bone
mineral density of the callus was significantly less dense by 14%, but the net callus
total mineral content was still significantly greater by 67% because the bone volume
fraction within the callus was 52% greater. The graft bone volume was not different
between treatment groups at 6 weeks suggesting that there was no increase in graft
resorption with PTH treatment. This was verified with histology which revealed no
difference in the resorption spaces on the graft surface area. The Union Ratio, a

98
measure of the relative surface area upon which callus bone has formed, was
significantly 76% greater (p < 0.01) (Figure 4.3-3, Table 4.3-1).

99
0.5 mm
* *
* *
* *
* *
0.2 mm
*P
IM
*P
IM
*P
IM
*
IM
0.5 mm
P
6wk
Sal
ine
4wk
PTH
6wk
PTH
BA C
ED F
HG I
KJ L
4wk
Sal
ine
Figure 4.3-1: Sagittal cross sections of grafted femurs.
Sagittal micro-CT images (A, D, G, J) of the proximal graft-host interface correspond
with the Hematoxylin/Eosin and Orange G histology images in the middle and right

100
columns. Figures A – F are from animals 4 weeks after surgery while G – L were 6
weeks after surgery. 40µg/kg of PTH(1-34) was administered daily in specimens of
figures D – F and J – L while the others received saline. Specimens in figures A – C
and G – L were also used for volumetric vascular analysis by µCT and are thus
perfused with lead-chromate contrast agent which appears white on µCT and black
in histology. Asterisks indicate the end of the graft segment, ‘IM’ indicates the
intramedullary space and ‘P’ indicates the periosteal surface. Of note is that
cartilaginous callus persisted in 4 week PTH treated specimens, PTH treatment
enhanced the ratio of bone-to-hematopoetic marrow within the callus and overcame
the fibrous the gap between callus and graft bone, thus forming callus directly on the
surface of the graft. PTH treated specimens also show enhanced intramedullary
bone formation.

101
A B C DPT
H
0.84
Salin
e
E F G H
2.21 1.37 0.22 mm3/mm
0.901.46 0.56 0.04 mm3/mm
Figure 4.3-2: Representative BV quantification from micro-CT imaging
Representative quantification of Micro-CT results for a control (A-D) and PTH treated
(E-H) specimen. Cross sectional polar moment of inertia, graft (B & F), callus (C & G)
and intramedullary callus bone (D & H) volumes were quantified for each specimen
in a region of interest that extended from the proximal axial slice containing bone
graft through the distal slice, as shown in (A,E). These regions of interest were
manually segmented and quantified for bone volume, bone mineral density and bone
mineral content at a threshold corresponding to 750 mgHA/cm3. The total depth of
penetration of callus into the intramedullary cavity from both ends was also
measured. The trabecular-like region within the shell of the exterior callus was
segmented for trabecular analysis to quantify BVF, Tb.No., Tb.Th., and Tb.Sp.

102
Table 4.3-1: Micro-CT imaging parameters of grafted femurs.
Saline PTH
PMIMin (mm4 ) 0.41 (0.11) 0.51 (0.26) PMIAve (mm4 ) 0.84 (0.14) 1.16 (0.32) ** PMIMax (mm4 ) 1.72 (0.59) 2.17 (0.46) * BVGraft (mm3 /mm) 0.84 (0.066) 0.82 (0.067) BVCallus (mm3 /mm) 0.54 (0.14) 1.04 (0.3) ** BVIntramed (mm3 /mm) 0.063 (0.042) 0.2 (0.081) ** Intramed Penetration Depth (mm) 1.73 (0.57) 2.22 (0.71) BMDCallus (mgHA/cc ) 774 (28) 667 (16) ** BMCCallus (mgHA) 1.62 (0.47) 2.7 (0.76) ** Callus trabecular BVF 0.379 (0.21) 0.576 (0.046) * Callus Tb.N. 6.38 (1.75) 13.2 (1.0) ** Callus Tb.Th. 0.0722 (0.023) 0.149 (0.198) Callus Tb.Sp. 0.182 (0.054) 0.065 (0.007) ** Union Ratio 0.129 (0.088) 0.277 (0.068) ** Mean (SD). n = 14 per treatment. * p < 0.05, ** p < 0.005
Table 4.3-2: Micro-CT imaging parameters of intact contralateral femurs.
Saline Contralateral PTH Contralateral
M-L Periosteal Diameter (mm) 1.76 (0.03) 1.85 (0.08)
A-P Periosteal Diameter (mm) 1.22 (0.001) 1.30 (0.05)
Cortical Thickness (mm) 0.180 (0.006) 0.199 (0.007) *
Cortical Bone Density (mgHA/cc) 1201 (4) 1179 (21)
Cross-Sectional Area (mm3) 0.69 (0.01) 0.82 (0.05) *
Polar Moment of Inertia (mm4) 0.27 (0.01) 0.36 (0.03) * Mean (SD) N = 8 per treatment. * p < 0.05

103
UnionRatio:0.02
UnionRatio:0.31
A B C
D
E F G
H
Figure 4.3-3: Representative CT and Union Ratio images
Volume-rendered micro-CT for a control specimen (A-D) and a PTH treated
specimen (E-H). Of note are differences in the bone callus formation as indicated by
the red brackets in (B and F) and the bone volume fraction in panels C and G as well

104
as sites corresponding to the graft-host-union location indicated by the yellow
arrows. Panels D and H show the grafts’ surfaces where red indicates regions of
mineralized callus footprint onto the graft, with blue indicating otherwise. The Union
Ratio is indicated below those surfaces. Each half of the graft is evaluated
independently, and the lesser UR is used.
4.3.2 Biomechanical Testing Results
Mechanical properties of grafted femurs 6 weeks after implantation and the
contralateral intact femurs were measured in torsion and reported in Table 4.3-3. As
expected, PTH treatment improved grafted femur torsional rigidity and strength and
failed at with less twist in a more brittle-like fashion indicating the presence of boney
union, as opposed to soft callus formation. PTH treatment doubled the torsional
rigidity of grafted femurs, returning them to equivalent of intact normal femurs.
Yield Torque was also significantly 72% greater in PTH treated grafted femurs, but
Ultimate Torque was only 23% greater (not significant). Grafted femurs from saline
treated specimens did not fail until reaching a much greater the degree of twist at TUlt
than PTH treated specimens. The rate of twist at TUlt for PTH treated specimens was
only 1/3 the rotation of control grafted specimens and were similar to the intact
contralateral femurs. Work to failure (area under the curve) was not reduced in the
saline control group because of the association of low torsional rigidity with failure at
greater deformation angles, and similar ultimate torque values. Intact contralateral
femurs from the same mice did not show a significant increase in torsional mechanics
with 6 weeks of PTH treatment, which is consistent with results from a previous

105
experiment in which intact femurs from rats receiving intermittent did not achieve a
significant increase in strength until high dose PTH (100ug/kg) was given for 8 weeks
(Hashimoto et al. 2007)
Table 4.3-3: Torsional properties of grafted and contralateral femurs in mice treated
with PTH or saline as control
Sal Graft Sal Contra PTH Graft PTH Contra Tult
(N*mm) 10.7 (4.1) 19.5 (4.8) 13.2 (5.2) 22.6 (7.3)
Tyield (N*mm) 6.8 (5.5) 13.9 (5.0) † 10.5 (4.2) * 15.1 (4.5) †
TR (N*mm2/Rad) 585 (408) 1129 (362) † 1175 (311) * 1284 (205)
Twist at Tult (Rad/mm) 0.065 (0.054) 0.025 (0.006) † 0.020 (0.018) * 0.029 (0.020)
Work to TYield (Nmm*Rad/mm)
0.0508 (0.0615) 0.134 (0.090) † 0.0687(0.0348) 0.151 (0.125) †
Work to TUlt (Nmm*Rad/mm)
0.379 (0.311) 0.286 (0.115) 0.167 (0.102) 0.401 (0.244) † p < 0.05 for graft vs. contralateral. * p < 0.05 for PTH vs saline.
After torsion testing, an x-ray of the specimens was taken to determine the
mode of failure as described in (Reynolds et al. 2007). Despite the trend that PTH-
treated specimens had fewer grafted femurs failing due to simple non-union between
the graft and host, this was not found to be statistically significant using Fisher’s
Exact test. Six of the PTH-treated specimens failed in a manner that was not simply
graft-pullout from the host, while only 3 of the saline treated specimens appeared to
have had some union.

106
Table 4.3-4: Grafted femur mode of failure after torsion testing.
Pre-Union Early Union Mature Union Saline 10 1 2 PTH 8 3 3
Correlations between micro-CT parameters and torsional properties:
In order to establish associations between micro-CT derived measures and
biomechanical outcomes, univariate and multivariate linear regression analysis was
performed. The best univariate correlations for each of the mechanical outcomes
were as follows: TR vs. UR, r2 = 0.77; TYield vs. Bridging, r2 = 0.62; TUlt vs. PMIMin,
r2 = 0.57. Table 4.3-5 shows the Pearson correlation coefficients for all the micro-CT
derived measures to the mechanical outcomes.
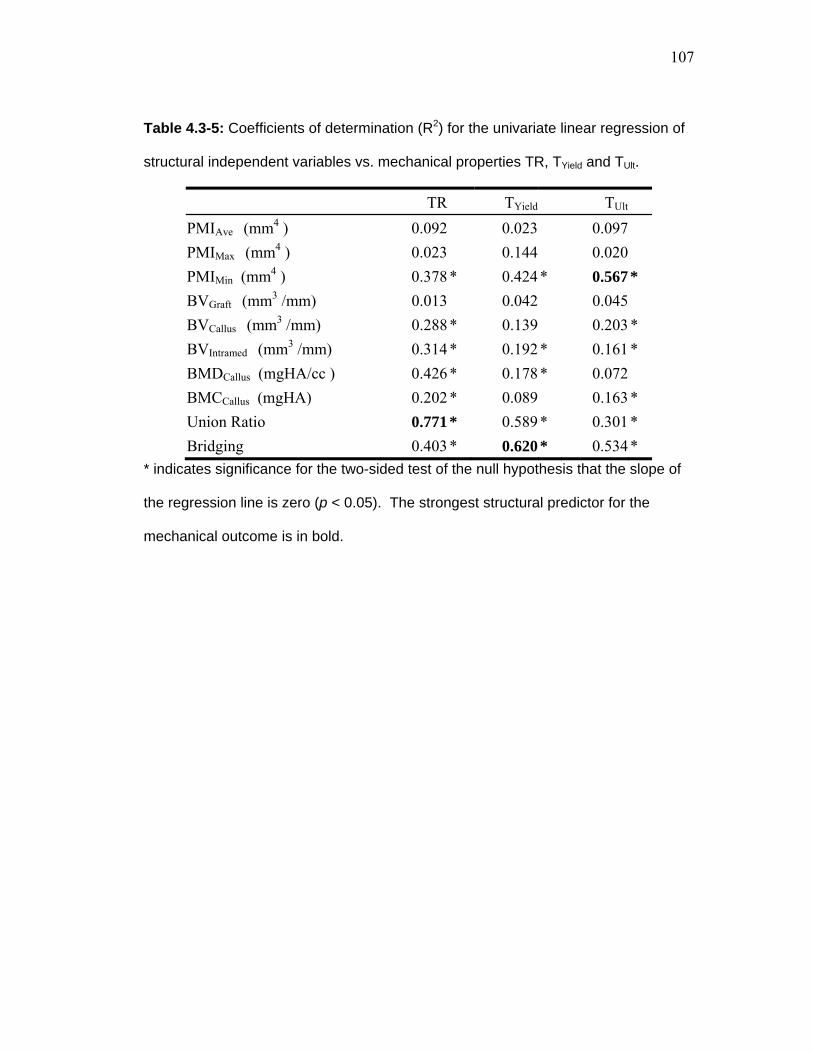
107
Table 4.3-5: Coefficients of determination (R2) for the univariate linear regression of
structural independent variables vs. mechanical properties TR, TYield and TUlt.
TR TYield TUlt PMIAve (mm4 ) 0.092 0.023 0.097 PMIMax (mm4 ) 0.023 0.144 0.020 PMIMin (mm4 ) 0.378 * 0.424 * 0.567 * BVGraft (mm3 /mm) 0.013 0.042 0.045 BVCallus (mm3 /mm) 0.288 * 0.139 0.203 * BVIntramed (mm3 /mm) 0.314 * 0.192 * 0.161 * BMDCallus (mgHA/cc ) 0.426 * 0.178 * 0.072 BMCCallus (mgHA) 0.202 * 0.089 0.163 * Union Ratio 0.771 * 0.589 * 0.301 * Bridging 0.403 * 0.620 * 0.534 *
* indicates significance for the two-sided test of the null hypothesis that the slope of
the regression line is zero (p < 0.05). The strongest structural predictor for the
mechanical outcome is in bold.

108
R² = 0.77090
500
1000
1500
2000
2500
0 0.1 0.2 0.3 0.4
Torsiona
l Rigidity (Nmm
2 )
UnionRatio
Torsional Rigidity vs. UnionRatio
Saline
PTH
R² = 0.58920
5
10
15
20
25
30
0 0.1 0.2 0.3 0.4
Yield Torque
(Nmm)
UnionRatio
Yield Torque vs. UnionRatio
Saline
PTH
R² = 0.3010
5
10
15
20
25
30
0 0.1 0.2 0.3 0.4
Ultim
ate Torque
(Nmm)
UnionRatio
UltimateTorque vs. UnionRatio
Saline
PTH
R² = 0.3957
0
0.1
0.2
0.3
0 0.1 0.2 0.3 0.4
Rate of Twist a
t TUlt(Rad
/mm)
UnionRatio
Twist vs. UnionRatio
Saline
PTH
BA
C
E
D
0 0.1 0.2 0.3 0.4UnionRatio
Mode of Failure vs. UnionRatio
Saline
PTH
Non-Union
Pre-Union
Mature Union
Figure 4.3-4: Linear regressions between mechanical properties and Union
Ratio.

109
The UR was found to correlate highly with TR (r2= 0.77), Tyield (r2=0.59) , TUlt (r2=0.30)
and inversely with Twist (r2=0.40). Horizontal dotted lines in A-D represent the range
of data obtained from the normal contralateral femurs in placebo-treated animals.
4.3.3 Callus Vascularization Results
Blood vessel analysis was performed using micro-CT imaging after vascular
perfusion with a contrast enhancing polymer. Quantification of the vessels within the
callus region, as shown in Figure 4.3-5 shows that there was 74% and 88% more
vessel volume in saline treated specimens at 4 and 6 weeks respectively (not
significant), which was mainly due to an increase in blood vessel diameter (55%
greater at 4 weeks p = 0.05, 78% greater at 6 weeks, p = 0.001).

110
* *
0
0.02
0.04
0.06
0.08
0.1
0.12
4 weeks 6 weeks
Vessel Thickness (mm)
0
0.2
0.4
0.6
0.8
1
4 weeks 6 weeks
Callus Vessel Volume (mm3)
0
0.5
1
1.5
2
2.5
4 weeks 6 weeks
Vessel number (1/mm)
6wks PTH6wks Saline4wks PTH4wks Saline
Saline
PTH
Figure 4.3-5: Vascularization of callus in Saline and PTH treated animals.
Representative vascular analysis via micro-CT imaging of contrast-enhancing
vascular profusion agent within the callus after decalcification. Total vascular
volume, vessel diameter and vessel number are plotted as mean ± SD; n = 4 per
group. * significance between treatment (p < 0.05).
In both PTH and saline treated animals we observed an interesting
phenomenon that a major blood vessel formed down the in the intramedullary canal
of the dead graft visible on micro-CT images of vascular-perfused specimens. This is
remarkable because despite there being vasculature within the graft, there is little or
no sign of revitalization of any other tissue associated by any other cell types. There
is neither bone nor hematopoietic marrow in the graft marrow cavity at 4 or 6 weeks
in control yet there was a single branch of the femoral artery perforating the host bone
shell and passing through the marrow cavity. This is interesting because it would
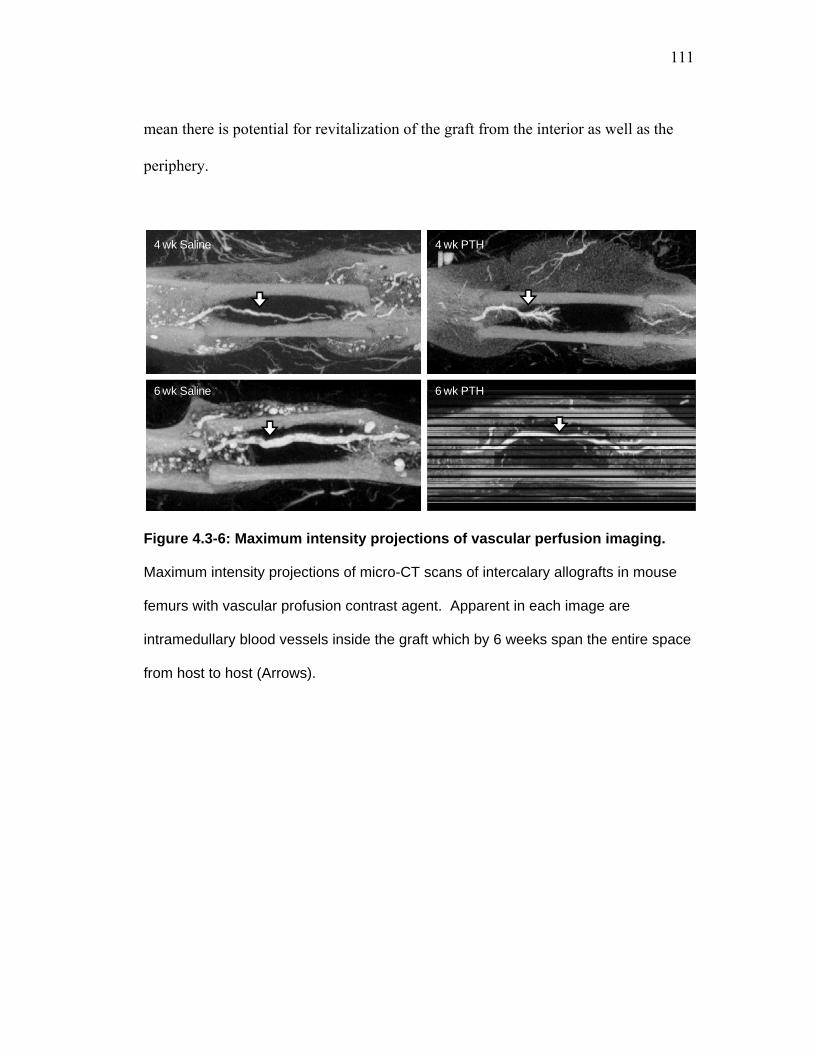
111
mean there is potential for revitalization of the graft from the interior as well as the
periphery.
6 wk PTH6 wk Saline
4 wk PTH4 wk Saline
Figure 4.3-6: Maximum intensity projections of vascular perfusion imaging.
Maximum intensity projections of micro-CT scans of intercalary allografts in mouse
femurs with vascular profusion contrast agent. Apparent in each image are
intramedullary blood vessels inside the graft which by 6 weeks span the entire space
from host to host (Arrows).

112
AdjR² = 0.840
2000
0 2000
Pred
icted TR
(N*m
m2 )
Measured TR (N*mm2)
Measured vs. Predicted TR
NoPTHPTH
AdjR² = 0.610
25
0 25
Pred
icted T U
lt(Nmm)
Measured TUlt (Nmm)
Measured vs. Predicted TUlt
NoPTHPTH
AdjR² = 0.710
20
0 20
Pred
icted T Y
ield(N*m
m)
Measured TYield (N*mm)
Measured vs. Predicted Yield Torque
NoPTHPTH
Ultimate Torque
Parameter Intercept PMIMin UnionRatio
Coefficient 2.407 14.93 12.75
Standard Error 1.582 3.135 5.734
Individual p < 0.1411 0.0001 0.04
Yield Torque
Parameter Intercept Bridging UnionRatio
Coefficient 2.030 5.662 20.11
Standard Error 1.181 1.243 5.676
Individual p < 0.1 0.0001 0.002
Torsional Rigidity
Parameter Intercept UnionRatio PMIMin
Coefficient -100.8 3151 722.5
Standard Error 97.89 354.9 194.0
Individual p < 0.31 0.0001 0.0011
Figure 4.3-7: Multivariable linear regression results.
Stepwise regression analysis was used for variable selection of micro-CT-derived
geometric properties such as segmented bone volumes, max, min or average PMIs,
Union Ratio, BMD, and host-to-host bridging, resulting in the correlations between

113
micro-CT parameters and torsional ultimate strength, yield strength and rigidity
shown here. This analysis yields correlation equations that could be used to predict
functional mechanical outcomes so the coefficients of the measures are given in the
tables.
4.4 DISCUSSION
Bone allografts are prone to high complication rates that can cause morbidity
and require interventions such as revision surgery or amputation. The major
complications after graft implantation are graft-to-host nonunion, fracture and
infection (Brigman et al. 2004; Donati et al. 2005). Graft fracture could be due to
either single loading events (trauma) or by fatigue failure. Overcoming these
complications by means of physical modification of bone grafts such as surface
decalcification, surface coating or perforation, and application of adjuvant treatments
such as BMPs, stem cell coengraftment and gene therapies has been a major topic of
study, but none of them have been clinically adopted as the gold standard for care,
while allograft failure still remains a concern.
Intermittent teriparatide (PTH 1-34), the only systemic anabolic bone factor,
has been used since before its FDA approval in 2002 for treatment of osteoporosis
(FDA 2002). PTH has an even more striking effect on enhancing bone fracture
healing. Over 40 days of 200ug/kg/day PTH treatment in rats, the percent increase in
bone mineral content of the fracture callus relative to untreated controls was 108%
while the intact contralateral femur diaphysis only enhances by BMC by 18.7% with

114
PTH treatment (Andreassen 1999). In this study we investigated the use of
intermittent teriparatide for standard cortical allografts to determine if the reported
anabolic effect in fracture healing also improves allograft bone incorporation. This
original work shows the anabolic effect of intermittently administered PTH (1-34)
effectively stimulates callus formation around bone allografts. This robust callus
overcomes the delay in radiographic non-union by 6 weeks which is an improvement
over normal allografts and plays a significant role in improving biomechanical
strength and stiffness.
Cartilage formation was increased with PTH treatment, which persisted
through 4 weeks after surgery, which was similar to results published by Nakazawa in
which PTH enhanced cartilage formation at the site of bone injury (Figure 4.3-1)
(Nakazawa et al. 2005). This extensive cartilage would then undergo ossification via
chondrocyte hypertrophy, thus suggesting that one mode of PTH's effect, which
resulted in greater bone volume at 6 weeks, was due to enhanced cartilaginous callus
formation.
There was also an improved graft-to-host union ratio apparent on micro-CT in
animals treated with PTH which meant that PTH treatment was able to overcome the
formation of the fibrous layer that forms around implanted bone grafts
(Tiyapatanaputi et al. 2004), (Stevenson et al. 1997) and hinders their incorporation
with the host callus. The mechanism by which PTH achieved greater union is not
specifically known. It could be due to simply a filling of the space between graft and
callus, or it could be that PTH accelerates the recruitment of stem cells to the wound

115
site before the fibrous response can mount. It could also be that PTH drives
mesenchymal stem cell differentiation toward the chondroblastic and/or osteoblastic
phenotypes, rather than the fibroblastic (Nakajima et al. 2002; Nakazawa et al. 2005;
Rickard et al. 2006). Studying the underlying basis for this to determine what local
factors could be responsible for reversing non-unions could be investigated in future
research. This will be discussed further in Chapter 5.
Side-by-side comparison of histological and radiographic imaging of the
union of the callus to allografts indicates that union, in this case, is attributable to
callus bone forming directly adjacent to the graft, but not necessarily integrating with
that graft tissue via remodeling of the graft initiated from the callus (Figure 4.3-1).
To some degree this distinguishes radiographic union from histological union. Here,
we found that radiographic union was sufficient to improve bone biomechanics.
As previously published, we found a preferential enhancement of total bone
mineral content of the callus at 6 weeks compared to the enhancement of the systemic
skeletal bone mineral content. The ratio of callus BMCPTH:BMCSaline was 1.67
whereas the contralateral intact femur’s diaphyseal BMCPTH:BMCSaline = 1.17. Zhou
et al. noted differences in the change in mineralization level of the axial skeleton
relative to the appendicular skeleton with intermittent PTH treatment, finding that the
axial skeleton (vertebral bodies) had greater increases in BMD (Zhou et al. 2003).
They suggested that this is due to the greater trabecular number in the axial skeleton
which therefore has more surface area upon which osteoblasts can form bone. In
addition to the increased cartilaginous callus volume early, the increased surface area

116
during callus formation may be another reason why there is greater improvement in
callus bone volume than in the intact contralateral diaphysis. PTH treatment appears
to affect multiple stages of bone healing, with enhancement of cartilage early which
turns into callus, as well as a greater bone formation rate of the trabecular-like woven
bone of the callus.
Figure 4.3-3A-D shows an obvious proximal non union in the saline control,
which corresponds to a Union Ratio of 0.02, which is interpreted as only 2% of that
half of the graft is in contact with callus, whereas the PTH-treated specimen in Figure
4.3-3H with UR = 0.31 has at least 31% of either half of the graft upon which callus
had formed. Across all samples (see Table 4.3-1), the Union Ratio was greater by 2.8
fold in PTH treated animals. Attaining a level of union that corresponds to a
recuperation of the mechanical properties of intact femurs can be identified in the
plots of Figure 4.3-4. The intersection of the trend line with the dashed line
representing the range of values for normal femurs indicates a threshold at which
union could be considered sufficient. With the various mechanical outcome
measures, this UR ranged from 0.12 to 0.23 with a mean intersection of 0.18. It can
be inferred that achieving that level of union in this mouse model would mean
returning the risk of limb fracture to “normal”. Interestingly, this did not correspond
to a dramatic shift in the location of failure of these femurs (Table 4.3-4). There was
a trend that fewer femurs failed in a non-union mode, but this trend was not
significant. This suggests that PTH induced robust callus formation adjacent to the
graft, but it may not have integrated with the graft.

117
The result of the improvements in the callus by PTH treatment resulted in
stronger graft biomechanics. In fact, it was found that these structural parameters
correlate highly with the biomechanical strength and stiffness determined by torsion
testing. Univariate regression analysis revealed that as expected, many of the
structural bone geometry and density measures correlated strongly with mechanical
outcome measures. According to their coefficient of determination (R2) the best of
these were the Union Ratio, the host-to-host bridging and PMIMin (Table 4.3-5).
Multivariable regression analysis of all the imaging-derived parameters showed that
by pairing combinations of those best three predictors the correlation significantly
improves, adding 0.14 – 0.17 to the adjusted coefficients of determination (Adj. R2)
(Figure 4.3-7).
The revitalization of the intramedullary canal of the graft with bone is a novel
observation and points to another means of revitalizing graft tissue from the inside
out. Intramedullary bone formation has not been observed in any of our studies
aimed at enhancing mouse allograft bone healing when adjuvant treatments were
locally delivered on the periosteal surface of the graft. These studies included the use
of rAAV-caAlk2 (Koefoed et al. 2005), combination rAAV-Vegf and rAAV-RankL
(Ito et al. 2005), rAAV-BMP2 (unpublished) and co-engraftment of C9 stem cells
(Xie et al. 2007). This increase in BVIntramed was mostly due to increased bone
volume fraction and a small increase in the depth of penetration of boney callus into
the grafts from both ends. Intramedullary penetration depth was 28% greater in PTH
treated animals (2.2 ± 0.7 mm in grafts from PTH-treated animals, 1.7 ± 0.6mm in

118
grafts from saline-treated animals; p = 0.12) but intramedullary callus that was
present was densely layered with bone. As on the exterior surface of allografts, the
cell types present in the intramedullary canal of allografts from saline treated mice
were predominantly fibroblastic, but with PTH treatment the composition of the
intramedullary space at the ends of the graft were predominantly osteoblastic cells.
Another novel observation was that a major intramedullary blood vessel was
visible on micro-CT images of animals with vascular contrast agent. This was
identified as a penetrating branch of the femoral artery that re-bridged, over time,
from host to host inside the graft. At 4 weeks the vessel was visible, and by 6 weeks
it had bridged the length of the graft in 3 of 4 saline treated specimens, and 4 of 4
PTH treated specimens. From histology it is apparent that the graft intramedullary
space is largely void of healing callus or hematopoetic marrow, and instead only
sparse fibroblasts and adipocytes. It may have been assumed that there was no
nutrient supply to this intramedullary space thus graft regeneration should focus on
the periosteal surface, but knowing now that vascular invasion of the graft is present
suggests that adjuvant local therapeutics in the intramedullary space should not be
ignored as a means of graft revitalization. Studying the revascularization of bone
grafts using the intramedullary canal as an indicator of graft revitalization may or
may not be appropriate as we found intramedullary vascularization with little or no
graft revitalization in both PTH and Saline treated specimens. Resolving the
vasculature within the graft material itself may be a better indicator. This deserves
further investigation.

119
Although patients receiving large structural allografts after removing bone
neoplasms would be restricted from PTH treatment due to an assumed increased risk
of cancer (Vahle et al. 2002), there are many other uses of bone grafts such as for
trauma, joint revision arthroplasty, dental implants, oral surgery, and spinal fusion in
which tumors are not involved for which PTH could be utilized without the risk of
exacerbating tumor recurrence.
Although a study of morselized autograft for spinal fusion shows early
enhancement of osteoclast-related genes and an increase in osteoclast number (Abe et
al. 2007), and another study of fracture healing in rats showed a significant increase
in OC# per fracture callus area (Komatsubara et al. 2005), we found that PTH
treatment for 6 weeks did not stimulate osteoclastic graft resorption, and thus there
was also no increase in revitalization of the graft tissue through remodeling.
Contrarily, other studies of fracture calluses show no increase in osteoclast number
per bone callus surface area beyond 1 week post-fracture (Nakajima et al. 2002;
Alkhiary et al. 2005; Manabe et al. 2007). These discrepancies may be due to the
method of counting osteoclasts, whether it is normalized to the cross-sectional callus
area, or the perimeter of the mineralized callus surface. To know whether
osteoclastic resorption of the graft can be stimulated via continuous elevation of PTH
(or by some other controlled means) should be investigated. PTH could also be used
in conjunction with other therapies as a control mechanism to maintain the highest
level of graft integrity. The toolbox of systemically administered therapies would

120
then include intermittent PTH for callus formation, short-term bisphosphonates to
inhibit osteoclastic resorption and perhaps continuous PTH to stimulate it.
The timing of PTH initiation after injury may be an important control
parameter for engineering a rehabilitation regime. We initiated daily saline or PTH
injections one week after initial surgery to allow normal hematoma formation to
complete before handling the animals daily. Pettway et al recently performed a study
of bone tissue engineering to investigate the effect of PTH on bone marrow stromal
cells (BMSC) at different points of differentiation (Pettway et al. 2008). They
showed that the effect of intermittent PTH was greatest on BMSCs that had been
implanted for one week suggesting that PTH may have its greatest effect on
stimulating pre-osteoblast proliferation.
Based on our results we find that the anabolic effect of PTH can significantly
improve callus formation from the host around bone grafts and for the first time show
a potential solution to improving bone graft-to-host union which would significantly
alleviate problems with graft non-unions. This could reduce the need for additional
surgical interventions in patients with non-stable constructs. If proven to be safe and
effective, there is potential for the use of PTH immediately after surgery to reduce the
recovery time and prevent other graft complications.

121
Chapter 5: Conclusions and Future Research Suggestions 5.1 REVIEW OF RESEARCH
Bone grafts are commonly used for skeletal reconstruction for a variety of
indications but experience complications. These complications include infection,
incomplete union, microcrack accumulation due to a lack of to intracortical repair,
fatigue failure, and should fracture occur within the graft material it is highly unlikely
to heal. Clinicians and researchers are aware of these limitations, but have few
alternatives that are superior. There is a paucity of tools for forcasting bone graft fate
after implantation. Generating tools that can quantitatively evaluate bone healing
could help identify patients at risk for complications, as well evaluate bone graft
alternatives and adjuvant therapies in pre-clinical models to establish the best
candidates. The research presented here establishes a method for performing
mechanical and structural quantification of bone graft fate after implantation in a
mouse model, devises a new tool to directly measure how osteoconductive a graft
surface is, and validates that delivering a bone anabolic factor stimulates bone callus
formation and reverses the inhibition of union formation.
Most notable from this work was that this model of bone allografting in mice
results in a delay in union up to 6 weeks which is recovered by 9 weeks, and results in
significant improvement in rigidty and stiffness. There appeared to be a trend of
decreasing strength after 9 weeks in allografts which was most likely due to a

122
combination of graft resorption and fatigue within the graft material. In a side
project, a method for visualizing microdamage was developed to attempt to
investigate whether microdamage accumulation was apparent in allografts between 9
and 12 weeks (see Section 5.2, below). At 6 weeks in autografts, there was increased
degree of union of callus bone onto the graft which was more dispersed along the
length of the graft since healing was enhanced by the periosteal callus formation.
Autograft strength similarly tended to decline over time until 18 months, but to a
lesser extent, possibly due to stress shielding of the bone by the intramedullary pin.
This conclusion is supported by clinical and research experience in which stress
shielding due to internal fixation devices can cause bone atrophy.
As in other animal and clinical studies, treatment with teriparatide rapidly
improved callus formation which improved radiographic allograft union and resulted
in greater stability of grafted femurs. This, along with other corroborating research
suggests that PTH may be effective for improving bone healing in many situations.
Multiple studies in fractures (see Appendix B) and additionally in spinal fusion using
morselized autograft (Abe et al. 2007) and live vascular fibular autografts (Hashimoto
et al. 2007) have all shown improvements using intermittent PTH therapy. PTH’s
effects are more pronounced in healing bone than they are in normal skeletal tissue,
suggesting that the cascade of events using intermittent PTH could be somewhat
different in healing bone than in mature bone.

123
5.2 MICRODAMAGE STUDY
The reduction in torsional strength and rigidity of bone allografts in our mouse
model after 9 weeks may be due in part to the accumulation of microdamage within
the graft material. To evaluate the amount of microdamage within the graft material a
method was developed to visualize microdamage histologically.
Normal mouse femurs were taken fresh and underwent cyclic loading using an
Instron Dynamite 8841 (Instron, Norwood MA) materials testing device in 3-point
bending for up to 1000 cycles to induce microdamage. These femurs were used as
controls to optimize the labeling and embedding protocols and confirm that
microdamage labeling was identifiable. For the experimental specimens, bone
allografts (4mm long) were implanted into the mid diaphysis of 10 mice which were
sacrificed at 9 and 12 weeks post-surgery (n=5 per time point). The intramedullary
pins were extracted from femurs, and the bones were fixed using 70% ethanol
overnight, labeled under vacuum in 1.5x10⁻⁴ molar calcein in 70% ethanol for 4
hours. Processing for plastic PMMA embedding involved rinsing and dehyrdrating in
a gradient of ethanol over days, cleared using xylazine, and infiltrated with PMMA
polymer over 2 days, and finally embedded in PMMA and polymerized over days
using the benzoyl peroxide decomposition technique. This polymerization is initiated
by adding benzoyl peroxide to the PMMA solution and incrementally raising the
temperature by 1°C every 12 hours from room temperature until polymerization is
completed. PMMA blocks are then sectioned with a IsoMet slow speed saw using a
0.4mm thick diamond wafering blade (Buehler Lake Bluff, IL). These sections are

124
then polished using incrementally finer cloths (600 grit, 1500 grit and 4000 grit) and
imaged using epifluorescence or confocal microscopy.
The protocol described above was the result of many iterations using a limited
number of samples, and therefore, many of the specimens were not suitable to be
properly imaged. Figure 5.2-1 Microdamage in mouse cortical bone Figure 5.2-1
shows representative histology from normal femurs showing the successful labeling
of intracortical surfaces (osteocytes) as well as the existence of microcracks in a
fatigued specimen. The limited samplings at 9 and 12 weeks did not reveal obvious
microdamage accumulation in this model. Instead, large resorption spaces were most
apparent within the graft tissue, especially in 12 week allografts. This is consistent
with the reduced graft bone volume (20%) measured from CT quantification (Figure
2.4-1). Due to the limited number of specimens, and infrequent identification of
microcracks, quantification was not pursued. However, future efforts should
investigate this phenomenon in a systematic study that evaluates allograft healing
over time and in response to therapeutic interventions to enhance repair.

125
A
B
Figure 5.2-1 Microdamage in mouse cortical bone
Bulk staining of cortical mouse bone with calcein fluorescence labeling reveals
intracortical surfaces such as osteocytes lacunae within normal bone (A), and bone
that was subjected to cyclic loading (B) using epifluorescence at 20x magnification.

126
5.3 RATIONALE FOR FUTURE RESEARCH DIRECTIONS
5.3.1 Further invesitigation of Union Metrics
5.3.1.1 Other Clinical Applications
The software tools for measuring the union onto a graft surface as presented in
Chapter 3 are flexible and capable of measuring other 3D surfaces, generating a shell
around them, and quantifying the amount of callus which penetrates that shell. This
has been applied to a variety of clinical fractures cases in pilot studies. Clinical
fractures can occur in any part of the skeleton, and have infinite conformations of the
fracture shape. Therefore it is not clear how much of the fracture surface needs to be
fused to the other fracture surface to achieve adequate union. This question will be
discussed more in 5.3.1.2. These pilot investigations showed that in patients with
non-union fractures, the fractured segment could successfully be identified in 3D
from standard clinical CT imaging. Fractures which present as non unions were
predominantly in the cervical spine, and in distal tibia and fibula. As these patients
were osteoporotic and had been on conservative treatment for at least 4 months
without successful consolidation of their fractures, they were placed on Forteo
(teriparatide) (Bukata et al. 2009). Through functional assessment, pain evaluation,
and radiographic imaging, approximately 93% of these patients’ persistent non-
unions were successfully reversed, achieving union. In 8 cases, the degree of union
was measured using the system described in Chapter 3 which corroborated the finding
of successful union area between the fractured segments by showing measurable
increases in the union surface area of the fracture in the majority of these patients.

127
Unfortunately, each fracture surface is unique and so the amount of surface area
necessary to achieve union is unknown, and so more work needs to be done to make
the measure of union meaningful from a diagnostic perspective. One way in which
this measure could be useful in this setting is to measure the rate of change in union
area over time. This could be achieved by longitudinal imaging with at least three
time points measured: two images captured at different times before initialization of
treatment and a third is captured after some time with treatment. To evaluate a
potential therapy, one could measure the change in the rate of union area before and
after treatment and compare that change in rate to a placebo treatment. Evaluating
the change in the relative change of the union area would eliminate variation. Further
study of this concept should be pursued to validate the Union Ratio as a meaningful
indicator of a therapy’s efficacy.
Another straightforward application for the Union Ratio technique lies in
evaluating prosthetic implant equipment. Dental implants, for instance, are typically
threaded metal sockets that are screwed into the mandible or maxilla and covered for
a number of weeks to allow for osseointegration onto their surface. It has been found
that osseointegration is relatively successful in the anterior mandible (97%), but in the
posterior maxilla the success rate is lower (77%) (Tolstunov 2007). The predominant
reason for this is lower bone quality in the posterior maxilla which limits the amount
of bone growth onto the implant. Evaluating the amount of bone contact with the
implant would be one way of identifying patients at risk for implant loosening and
could be evaluated using CT imaging. One technique for sampling a titanium
128
implant’s osseointegration was done by radial point counting on 2D axial slices
(Kuroda et al. 2004) where radial lines passing from the center of the implant were
investigated. The number of lines radiating from the implant that crossed into bone
first, instead of marrow space, counted toward that implant’s level of
osteointegration. They found that synthetic coating of the implant with apatite
improved radiographic osseointegration and torsional strength. Another study used
multilevel thresholding to evaluate the percent of bone pixels relative to the total
number of pixels adjacent to the implant to measure the %osseointegration (%OI)
(Gabet et al. 2006). They found that high dose teriparatide (75ug/kg) treatment
improved %OI by and that 25 and 75 mg/kg teriparatide improved pullout strength of
the implant. The advantage of studying prosthetic implants is that the surface area
can be known. The mechanical result of changes in union onto the implant can be
determined using finite element modeling and preclinical models to validate findings,
then further studies can be based simply on the changes in union.
Automation of the surface generation for defining the boundary of bone and
prosthetic implants is an area which could be improved for the Union Ratio
algorithm. Currently, images are semi-manually contoured (See Figure 3.2-1) which
can be time consuming and subject to user interpretation. Automatic mesh generation
could be accomplished by scanning bone grafts prior to or immediately after
implantation. This would show the known geometry of the graft material. A 3D shell
should be easily generated around this pure representation of the graft which could
later be registered to the remaining graft in the follow-up scan. This would be very

129
possible for prosthetic implants which often have an attenuation coefficient that is
different than bone. Then implants could be used to generate their own shell.
5.3.1.2 How much union is needed? When is a fracture “healed”?
Knowing what percentage of the surface of a bone segment is in contact with
surrounding callus is an appropriate measure for comparing the osteoconduction
between samples, and between treatments. We have shown in our model how union
ratio and mechanics are related, but determining when a specific specimen has
achieved adequate union to consider it fully healed remains complicated. For our
grafts, “union” could be the level needed to achieve the mechanical properties of the
range of normal contralateral limbs (see Figure 4.3-4). Further work must be
performed to understand how much union area needs to be achieved in a diverse array
of fracture types.
There are several conceivable methods to start understanding how much union
area is needed. One method would be to use normal healthy bone as a template. For
example, transferring the shell generated around our segment of interest (the graft) to
an intact femur, the surface area of connection between the virtual graft and the host
would be the transverse cross sectional area of that segment (since the osteotomies we
make are transverse). This can set a basis to compare the area of union of actual
grafts. In this example, the femoral cross sectional area normalized to the surface
area of a half a graft (as our Union Ratio measure does) is approximately 0.06. The
data shown in Figure 4.3-4 do not support this as being an adequate level of union.

130
There are two possible reasons for this discrepancy: the distribution of the union
surface on the graft is different, and there is a surface-bonding component that is
unaccounted for. To address the question about how the distribution of the union
affects the strength, a virtual graft model could be generated from the CT images, and
then the surface area of union could be modified to change the pattern of distribution
on the surface. Applying a set of different loading conditions (torque, bending about
the M-L Axis, bending about the A-P axis) to each of the models a finite element
analysis program could be produced. The magnitude of the maximum stress in each
model would then illustrate the risk of failure within that model. The patterns of
bonding could vary from a single continuous union area at the end (as the transverse
cross sectional area mentioned above) to a random distribution over the surface of the
graft as was observed in autografts at 6 and 9 weeks.
Understanding what the adhesion properties of the newly formed callus are on
the graft would also need to be accomplished. As shown in Figure 4.3-1, the
radiographic union of callus in the teriparatide treated animals involved bone
formation onto the surface of the graft. Since no additional remodeling of the graft
was stimulated, there was probably not true integration with the graft. I.e. the mineral
crystals were not continuous from the graft to the host. Accounting for the bond
strength would be important to reconcile that perfect continuous bone has a “Union
Ratio” of 0.6, while grafts with a union ratio of 2 or 3 times that have similar strength
and still fail at the graft-host interface (Table 4.3-2, Table 4.3-3, and Table 4.3-4).
One way of measuring this adhesion would be to implant cortical bone graft dowels

131
into a host bone of an animal. Micro CT imaging for union area measurement and
pullout testing could be performed to understand the adhesive properties of the graft-
host-interface.
5.3.1.3 An alternative measure of overall connectivity
Host to host bridging was a phenomenon found in autografts by 6 weeks, in
allografts at later time points, and in many of the allografts in the PTH study at 6
weeks. Simply noting if bridging was present was able to explain 40 – 62% of the
variation in mechanical properties of grafted femurs (Table 4.3-5). Quantifying the
degree of bridging may be able to enhance our understanding of the torsional
properties. Two considerations related to bridging are how thick is the bridge, and
what is its spatial relationship to the bending or torquing axes? One way of
quantifying bridging would be to measure the minimum thickness of the bridge.
Because the geometry is complicated, this thinnest plane could be at any angle
possible (not just the axial plane) across the specimen. For example, the digital
phantom in Figure 3.2-2 has examples of both transverse and oblique planes of graft-
to-host bridging. So it is somewhat impossible to quantify the minimum cross section
of bridging in all planes. During part of this dissertation, an alternative was
investigated. In this technique traces (lines) are drawn from one plane of interest to
another through the material (bone pixels in a CT image for instance). A series of
requirements for the drawing of this line are followed to achieve the measurement of
the thickness of a bridge between the two planes. The trace is drawn to hug the

132
surface of the bone with the goal of making its way toward the "goal" plane. Only
one trace may pass through a bone pixel (subsequent traces will hug the boundary
between the bone and the previous traces). The first trace (which is teal in Figure
5.3-2) starts on one edge of the start plane (the bottom left corner), and each
subsequent trace starts next to the previous trace. The line is drawn to hug the edge
of the bone area and will fill up a region of bone until it finds an outlet and can reach
the Goal plane. When a trace reaches a point where it can no longer go towards the
goal plane, by following the bottom or right surface of the bone, it will return to a
previous location within the trace to continue searching.
In the case of the teal trace, there were no connections on the bottom half of
the image, and so the bone was filled with that trace, until it reached a bridge to the
goal plane on the upper half of the image. This finally occurred at the place above the
black void in the host callus along which the trace makes a right-turn in the lower left
corner of the image. The next trace (in fucia) starts at the next available location
along the start plane, and ends up following alongside the first trace until it reaches
the goal plane. Three more traces do the same until a constriction indicated by the
red arrow is filled with 5 traces total. A subsequent trace in green can find no way of
reaching the goal plane, and thus fills the region Counting the number of traces that
successfully bridge one plane to another effectively quantifies the width of the
constriction between. Figure 5.3-1 gives a representation of this technique in 2D.
Transitioning this to 3D is more complicated and has not yet been solved, but is
possible.
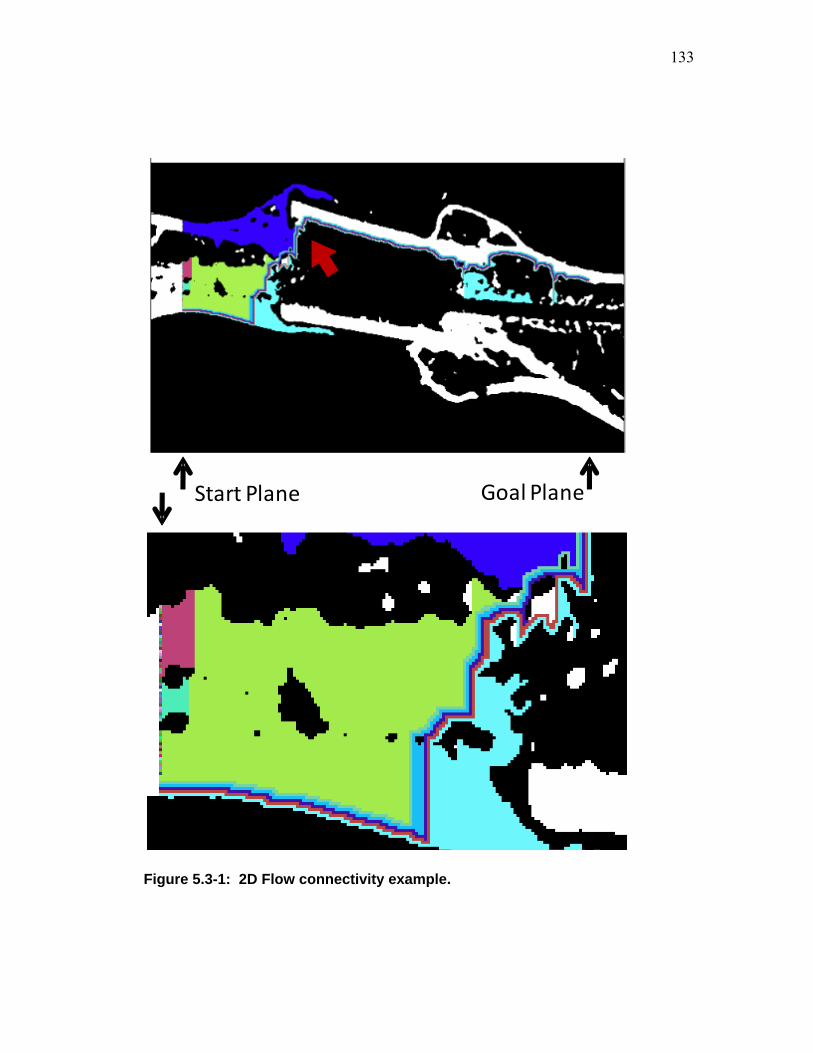
133
Start Plane Goal Plane
Figure 5.3-1: 2D Flow connectivity example.

134
On a 2D cross sectional image of a grafted femur, tracings were performed
automatically by a program written in Matlab. Tracings started on the bottom of the
start plane with the goal plane as the end point. Each tracing is colorized differently
for visualization purposes.. Five tracings successfully reached their target end point.
One constriction site is indicated by the red arrow.
As mentioned before, the location of this minimum cross section or
constriction site relative to the bending or torsional axes would play a role in its
contribution to the overall strength. Identifying the constriction site is not straight
forward in 3D, and would have to be studied further. After the constriction site is
identified, its contribution to the structure could be studied.
5.3.1.4 Large animal models of grafting and the application of union ratio
The union ratio has been investigated using CT images from a published study
of a single clinical allograft in which a high resolution investigational cone-beam CT
scanner was used (Ehrhart et al. 2008). Using these images posed multiple challenges
that would need to be address to pursue further clinical studies. Metal implants,
particularly steel alloys, have very high attenuation coefficients which generate image
artifacts obscuring details near these implants. Artifact suppression algorithms have
been developed for minimizing their effect, but are not yet standard. These artifacts
contribute to the uncertainty of the measurement of the union surface between a graft
and the host. None the less, union measures were obtained for this case, as shown in
Figure 5.3-2. It is obvious that parts of the graft will not be analyzed, but in regions

135
that are free from artifact, the union area could be measured. Selection of plates
made of less-radiopaque materials such as titanium instead of stainless steel would
generate less striking artifacts. Also a sample region of the surface of the graft that is
free from artifact could be selected for union area quantification, and monitored over
time in a longitudinal study.
6 Month FollowupWhole Area:
9300mm2
Connected Area:1500 mm2
BaselineWhole Area:
8500 mm2
Connected Area:1700 mm2
Plate and screw artifact Intramedullary stem
A B
C
Figure 5.3-2: Case study: Union area of a proximal tibia allograft
The proximal tibia from a clinical allograft was imaged with high resolution cone
beam CT. The sagittal and axial cross secions through the tibia are shown in panels
A and B. Apparent union area was measured around the graft and shown in red. Of

136
note are significant areas of artifact and locations where the intramedullary stem
passed through the shell drawn around the graft.
The research of this dissertation addresses one of the major complications of
allograft failure: non-union. The second major complication requiring further
investigation is the accumulation of microdamage leading to fatigue failure.
Identifying the risk factors that cause it would be paramount to minimizing its
occurrence. I propose one possible interaction between these complications, which is
that non unions contribute to microdamage accumulation due to reliance on implant
hardware to bear the load. Studying a larger animal model of bone grafting would
allow for the application of locking plates and screws that interact similarly to the
clinical setting. The first step would be to validate the union measurement in this
model despite implant hardware. Next, it would need to be validated that the model
induces microdamage in the graft material in a timely manner, and if necessary
increasing the animal’s activity or even using externally applied loading to induce
microdamage. Finally, determining if a relationship exists between how quickly a
specimen establishes union and the rate at which it develops microdamage or fatigue
failure would be instrumental in advocating augmentation of the graft-host junction to
prevent the majority of allograft failures. Pilot work for this research could initially
be done in cadaveric bone, using surgical reconstruction techniques, followed by
simulation of various degrees of graft-host union with cement, for instance.

137
5.3.2 Radiation exposure and justification for clinical CT imaging.
Computed tomographic radiography exposes the subject to potentially harmful
ionizing radiation that should not be undertaken without an evaluation of the risks and
benefits to a patient. Recent advances in radiography have continued to minimize the
exposure levels while continuing to achieve adequate resolution. Alongside these
advances are improvements in diagnostic capabilities through qualitative and
quantitative image analysis. The risk-to-health need of a patient needs to be
considered on multiple levels to include of the risk from a single exposure as well as a
patient's cumulative exposure over time. The age of the patient, and any existing
conditions also contribute in that patient's risk.
The measure of the radiation exposure are typically reported in Gray (Gy) or
Sievert (Sv) and is the joules of radiation exposure per kilogram. For x-rays and
gamma rays, 1Gy = 1Sv = 100 Rad. As a point of reference, approximate radiation
exposures for posterior-anterior chest x-ray is 0.01 mSv, lateral chest x-ray is 0.15
msV and an adult abdominal CT gives 10 mSv (Brenner et al. 2007). Lattanzi et al
found that a CT scan of the pelvis and femur for pre-operative planning of hip
replacement surgery results in approximately 5 mSv (range 2 - 7 mSv) (Lattanzi et al.
2004). They also quote that baseline whole body exposure is approximately 2mSv
per year (Farr et al. 1997).
A study of microCT dose exposure in rats was performed to investigate the
effects of longitudinal exposure on normal healthy rat bone. The Scanco Viva CT 40
scanner was used to image the rat hind limb at 15 µm resolution and resulted in an

138
exposure of somewhere between 422 and 987 mGy (Brouwers et al. 2007). This CT
protocol achieves very high resolution (15 µm) which is comparable to the 10.5 –
12.5 micron resolution in the much smaller animal used in this study, as the mouse
body is 1/10th the weight of rats. Brouwers et al. found no significant effect on
trabecular geometrical values over time, nor any effect on the vitality of bone marrow
cells due to scans performed weekly for 7 weeks. Another study of the radiation
exposure to mice using a lower resolution (200 µm) to image the torso found
exposure levels between 80 and 160 mGy (Taschereau et al. 2006).
The actual adverse effects of radiation exposure caused by CT scanning has
not been fully studied. Instead, estimates of the risk of cancer due to radiation
exposure are mainly based on studies of atomic-bomb survivors and those employed
in the nuclear industry (Brenner et al. 2007). Those studies show that radiation
exposure in the 5 to 150 mSv significantly increases the risk of developing cancer.
Radiation exposure to youths is more risky than to adults and increase the potential
for cancer because they youths are inherently more sensitive to radiation, and also
have a greater number of years to develop radiation-induced cancer. They estimate
that the overall risk of death due to cancer from a "typical" series of 2 or 3 CT scans
of the head or the chest for an adult is between 0.01% and 0.02% and for a child is
between 0.02% and 0.1%. Although the individual's risk is small, they estimate that
1.5 – 2% of all cancers may be attributable to current CT usage, and should be
considered a general public health risk.

139
The method by which a CT scan is acquired can vary the overall exposure
considerably. Cassese et al found that the radiation dose measured from 4 different
clinical CT scanners using the same high resolution technique (slice thickness =
1mm) may vary by a factor of 3 (Cassese et al. 2003) depending on the scanner. One
significant variable in radiation dose necessary to achieve a given resolution is the
detector geometry. Multidetector CT scanners can achieve greater resolution with
less total radiation exposure. There can be a 100% difference in the radiation
exposure for the same scan resolution using more refined detector configurations
(Dalrymple et al. 2007). Even more promising for high resolution imaging with
lower radiation exposure is the advent of cone beam CT (CBCT) imaging. Cone
beam CT imaging has been developed and investigated particularly in oncology field
for diagnostic purposes, as in breast cancer (Chen et al. 2002), as well as for radiation
oncology treatment planning and where multiple imaging sessions are used to ensure
proper patient positioning each time a patient undergoes fractionated external beam
radiation treatments. Studies comparing CBCT to the more standard multidetector
CT imaging systems indicate that radiation exposure can be 35 to 49% lower for head
and body scans, respectively (Kim et al. 2008). Cone beam CT imaging optimized
for detection of breast tumors (soft tissue, low contrast, high penetrance specimen)
can achieve spatial resolution of 0.36 mm with a delivered dose of 336 to 235 mRad
(2.35 – 3.36 mSv) depending on the size of the breast (Chen et al. 2002). This is
relatively high resolution with low dose, compared to the clinical CT scanners

140
described above, but differs due to total volume being imaged, and material
composition.
A longitudinal clinical study evaluating massive osteoarticular allografts with
CT imaging detected fractures earlier in the graft material with CT imaging than
standard radiographs, and thus supports CT imaging to evaluate the condition of a
patient's the bone allograft (Mattila et al. 1995). A clinical study comparing the
qualitative assessment of fracture union using CT and planar radiography in the
appedicular skeleton found CT imaging is not significantly more sensitive in
evaluating the time-to-union in most examples, but CT imaging was necessary in
11% of cases for which the assessment of healing fractures could not be determined
from standard plain x-rays due to positioning or internal hardware (Grigoryan et al.
2003). Fractures of the axial skeleton can be particularly difficult to evaluate from
planar x-rays. These studies indicate that the evaluation of clinical allografts with CT
imaging could identify complications due to fracture or resorption and would be
recommended for improved prognosis. Although the risk inherent with ionizing
radiation exists, improvements in the imaging resolution along with reduction of total
dose are being made will allow for quantitative assessment through CT image
analysis and will be beneficial to patient care.
5.3.3 Teriparatide Therapy
Our investigation of PTH treatment for bone graft healing showed that the
induction of an osteoblastic response filled the space between the outer callus shell

141
and the graft surface with bone, forming a tightly woven network through which load
could be transferred from the host to the graft. This was not seen in saline treated
allografts nor in autografts (where the cortical shell was maintained while the graft
was resorbed). The rampant bone formation reduced the volume of hematopoietic
marrow in the callus region, a soft tissue which would not contribute to graft stability.
Reduction in vascular volume was concomitantly measurable, mostly due to a
reduction in vessel diameter, rather than vessel number or distribution. The decrease
in hematopoietic tissue and vascular volume in the high bone density callus, is
contrary to our expectations. PTH promotes osteoblast-coupled hematopoiesis
(Whitfield 2005). The anabolic effect of PTH can be attenuated with an angiogenesis
inhibitor (Rhee et al. 2007). Osteogenesis is coupled with angiogenesis (Gerber et al.
2000; Wang et al. 2007) and active osteoblasts express vascular endothelial growth
factor (VEGF) (Deckers et al. 2000). But our finding and another recent report
(Prisby ASBMR Montreal 2008) indicate that osteogenesis can be stimulated without
an increase in angiogenesis. Future work could evaluate whether combining an
angiogenesis treatment via rAAV-Vegf (as shown in Ito 2005) in combination with
systemic PTH treatment would enhance bone formation more markedly.
Recently, a concern was raised about a possible decrease in strength of
implant fixation after termination of PTH treatment in which rats were given
intermittent PTH for two weeks. After PTH withdrawl they were treated with either
saline or bisphosphonate for three weeks (Johansson et al. 2008). They found that the
effect of terminating the administration of PTH after this initial healing phase

142
returned the pull-out strength of the screw to the same level as screws from untreated
animals. They also found the loss of strength after PTH withdrawal could be
prevented with the use of a bisphosphonate. Therefore, further studies would need to
be conducted to elucidate the effect on grafted bone strength after suspension of
anabolic PTH administration and whether bisphosphonates would be recommended
upon termination of PTH treatment.
Torsional resistance of grafted femurs was recovered with the use of PTH
treatment for 6 weeks, but did not stimulate graft remodeling and there was no
increase in osteoclast activity on the surface of the graft observed. Dead allograft
tissue is subject to fatigue damage accumulation for which targeted remodeling would
be an attractive means of reversing. Conversely, over-zealous graft resorption is a
potential risk of using an osteoclast stimulating therapy such as rAAV-RANKL (Ito et
al. 2005). Fortunately we now know that systemic PTH treatment can promote callus
formation, and could be used as a control agent to stimulate bone formation when
necessary.
Hypocalcemia and in hyperparathyroidism cause elevated serum PTH levels.
This causes osteoclastic resorption from the skeleton. Could sustained PTH treatment
be used to stimulate osteoclastic resorption of graft bone? This could be achieved via
local expression delivered via gene therapy, or by systemic elevation using an
osmotic pump. This could serve to be a non invasive control mechanism for inducing
osteoclastic resorption of the graft material after successful callus formation.

143
Many massive bone graft recipients are receiving allografts to replace a bone
neoplasm. It is thought that PTH carries a risk of stimulating cancer, thus precluding
treatment of these patients. At very high doses, PTH has been described as
carcinogenic in rats, but only when given at dose-levels that are 50 or 150ug/kg body
weight which is 27 and 66 times the exposure used clinically, but not at the level of
4.7 times the clinical dose (Jolette et al. 2006). Due to these studies, there is a black-
box limitation on the use of Forteo in patients with cancer to prevent adverse events.
There have been no clinical reports of increased tumorigenic incidence due to
teriparatide (Harper et al. 2007) and a long term study in non-human primates at
doses closer to clinical doses has not been found to cause cancer (Vahle et al. 2008).
This observed mature ovariectomized monkeys for 4.5 years after initialization of
daily teriparatide treatment 5 μg/kg body weight that was given for 18 months, there
were no incidents of neoplasia (Vahle et al. 2008). Further research could be
conducted to address whether PTH stimulates proliferation of existing neoplasms. In
vitro work with osteosarcoma and other cancer cell lines exposed to PTH, and in vivo
studies in mice could address the potential for risk.

144
6 References
Abe, Y., M. Takahata, et al. (2007). "Enhancement of graft bone healing by intermittent administration of human parathyroid hormone (1-34) in a rat spinal arthrodesis model." Bone 41(5): 775-85.
Albert, A., T. Leemrijse, et al. (2006). "Are bone autografts still necessary in 2006? A three-year retrospective study of bone grafting." Acta Orthop Belg 72(6): 734-40.
Alkhiary, Y. M., L. C. Gerstenfeld, et al. (2005). "Enhancement of experimental fracture-healing by systemic administration of recombinant human parathyroid hormone (PTH 1-34)." J Bone Joint Surg Am 87(4): 731-41.
Andreassen, T. T., C. Ejersted, et al. (1999). "Intermittent parathyroid hormone (1-34) treatment increases callus formation and mechanical strength of healing rat fractures." J Bone Miner Res 14(6): 960-8.
Aro, H., E. Eerola, et al. (1982). "Osteolysis after rigid fixation. The possible role of periosteal neural mechanoreceptors in bone remodeling." Clin Orthop Relat Res(166): 292-300.
Aslan, H., Y. Zilberman, et al. (2006). "Nucleofection-based ex vivo nonviral gene delivery to human stem cells as a platform for tissue regeneration." Tissue Eng 12(4): 877-89.
Attias, N. and R. W. Lindsey (2006). "Case reports: management of large segmental tibial defects using a cylindrical mesh cage." Clin Orthop Relat Res 450: 259-66.
Baer, D. G., T. J. Walters, et al. (2004). "Bone and Soft Tissue Trauma Research at the USAISR." RTO HFM Symposium RTO-MP-HFM-109: P35-1 - P35-10.
Bentolila, V., T. M. Boyce, et al. (1998). "Intracortical remodeling in adult rat long bones after fatigue loading." Bone 23(3): 275-81.
Berrey, B. H., Jr., C. F. Lord, et al. (1990). "Fractures of allografts. Frequency, treatment, and end-results." J Bone Joint Surg Am 72(6): 825-33.
Blokhuis, T. J., F. C. den Boer, et al. (2000). "Evaluation of strength of healing fractures with dual energy Xray absorptiometry." Clin Orthop Relat Res(380): 260-8.
Body, J. J., G. A. Gaich, et al. (2002). "A randomized double-blind trial to compare the efficacy of teriparatide [recombinant human parathyroid hormone (1-34)] with alendronate in postmenopausal women with osteoporosis." J Clin Endocrinol Metab 87(10): 4528-35.
Bonadio, J., E. Smiley, et al. (1999). "Localized, direct plasmid gene delivery in vivo: prolonged therapy results in reproducible tissue regeneration." Nat Med 5(7): 753-9.
145
Boutroy, S., M. L. Bouxsein, et al. (2005). "In vivo assessment of trabecular bone microarchitecture by high-resolution peripheral quantitative computed tomography." J Clin Endocrinol Metab 90(12): 6508-15.
Boyce, T., J. Edwards, et al. (1999). "Allograft bone. The influence of processing on safety and performance." Orthop Clin North Am 30(4): 571-81.
Brenner, D. J. and E. J. Hall (2007). "Computed tomography--an increasing source of radiation exposure." N Engl J Med 357(22): 2277-84.
Bresler, F., P. Simon, et al. (1998). "Digital image analysis of bone allograft union in sheep." Acta Orthop Scand 69(2): 181-3.
Brigman, B. E., F. J. Hornicek, et al. (2004). "Allografts about the Knee in Young Patients with High-Grade Sarcoma." Clin Orthop Relat Res(421): 232-9.
Brodt, M. D., C. B. Ellis, et al. (1999). "Growing C57Bl/6 mice increase whole bone mechanical properties by increasing geometric and material properties." J Bone Miner Res 14(12): 2159-66.
Brouwers, J. E., B. van Rietbergen, et al. (2007). "No effects of in vivo micro-CT radiation on structural parameters and bone marrow cells in proximal tibia of wistar rats detected after eight weekly scans." J Orthop Res 25(10): 1325-32.
Brown, K. M., M. M. Saunders, et al. (2004). "Effect of COX-2-specific inhibition on fracture-healing in the rat femur." J Bone Joint Surg Am 86-A(1): 116-23.
Broz, J. J., S. J. Simske, et al. (1993). "Effects of rehydration state on the flexural properties of whole mouse long bones." J Biomech Eng 115(4A): 447-9.
Bruder, S. P., D. J. Fink, et al. (1994). "Mesenchymal stem cells in bone development, bone repair, and skeletal regeneration therapy." J Cell Biochem 56(3): 283-94.
Bukata, S. V., L. A. Kaback, et al. (2009). "1-34 PTH at Physiologic Doses in Humans Shows Promise as a Helpful Adjuvant in Difficult to Heal Fractures: An Observational Cohort of 145 Patients." ORS Meeting Las Vegas.
Burchardt, H. (1983). "The biology of bone graft repair." Clin Orthop Relat Res(174): 28-42.
Burr, D. B., R. B. Martin, et al. (1985). "Bone remodeling in response to in vivo fatigue microdamage." J Biomech 18(3): 189-200.
Burr, D. B. and T. Stafford (1990). "Validity of the bulk-staining technique to separate artifactual from in vivo bone microdamage." Clin Orthop Relat Res(260): 305-8.
Burwell, R. G. (1963). "Studies in the transplantation of bone. V. The capacity of fresh and treated homografts of bone to evoke transplantation immunity." J Bone Joint Surg Br 45-B: 386-401.
Camacho, N. P., C. M. Rimnac, et al. (1995). "Effect of abnormal mineralization on the mechanical behavior of X-linked hypophosphatemic mice femora." Bone 17(3): 271-8.
Cassese, J. A., A. S. Brody, et al. (2003). "Utility of simple radiation dose measurements in the evaluation of different CT scanners used for high-resolution CT." J Thorac Imaging 18(4): 242-5.

146
Chalidis, B., C. Tzioupis, et al. (2007). "Enhancement of fracture healing with parathyroid hormone: preclinical studies and potential clinical applications." Expert Opin Investig Drugs 16(4): 441-9.
Chen, B. and R. Ning (2002). "Cone-beam volume CT breast imaging: feasibility study." Med Phys 29(5): 755-70.
Chen, J. B., Y. Yu, et al. (2007). "BMP-7 and CBFA1 in allograft bone in vivo bone formation and the influence of gamma-irradiation." J Biomed Mater Res A 80(2): 435-43.
Chen, Y., K. D. Luk, et al. (2003). "Gene therapy for new bone formation using adeno-associated viral bone morphogenetic protein-2 vectors." Gene Ther 10(16): 1345-53.
Cloward, R. B. (1980). "Gas-sterilized cadaver bone grafts for spinal fusion operations. A simplified bone bank." Spine 5(1): 4-10.
Cook, S. D., R. L. Barrack, et al. (2000). "The Otto Aufranc Award. Strut allograft healing to the femur with recombinant human osteogenic protein-1." Clin Orthop Relat Res(381): 47-57.
Cruess, R. L. and J. Dumont (1975). "Fracture healing." Can J Surg 18(5): 403-13. Dalrymple, N. C., S. R. Prasad, et al. (2007). "Price of isotropy in multidetector CT."
Radiographics 27(1): 49-62. Damron, T. A., W. G. Ward, et al. (2007). "Osteosarcoma, chondrosarcoma, and
Ewing's sarcoma: National Cancer Data Base Report." Clin Orthop Relat Res 459: 40-7.
Day, J. S., M. Ding, et al. (2000). "Parallel plate model for trabecular bone exhibits volume fraction-dependent bias." Bone 27(5): 715-20.
Deal, C. and J. Gideon (2003). "Recombinant human PTH 1-34 (Forteo): an anabolic drug for osteoporosis." Cleve Clin J Med 70(7): 585-6, 589-90, 592-4 passim.
Deckers, M. M., M. Karperien, et al. (2000). "Expression of vascular endothelial growth factors and their receptors during osteoblast differentiation." Endocrinology 141(5): 1667-74.
Defense, D. o. (2008). "Global War on Terrorism Casualities by Reason " Retrieved 11/29/08, from http://siadapp.dmdc.osd.mil/personnel/CASUALTY/gwot_reason.pdf.
Delloye, C., O. Cornu, et al. (2007). "Bone allografts: What they can offer and what they cannot." J Bone Joint Surg Br 89(5): 574-9.
Delloye, C., L. Coutelier, et al. (1986). "Canine cortical bone autograft remodeling in two simultaneous skeletal sites." Arch Orthop Trauma Surg 105(2): 79-99.
Delloye, C., P. Simon, et al. (2002). "Perforations of cortical bone allografts improve their incorporation." Clin Orthop Relat Res(396): 240-7.
den Boer, F. C., P. Patka, et al. (1999). "New segmental long bone defect model in sheep: quantitative analysis of healing with dual energy x-ray absorptiometry." J Orthop Res 17(5): 654-60.
Desandes, E. (2007). "Survival from adolescent cancer." Cancer Treat Rev 33(7): 609-15.

147
Dickson, G. R., C. Geddis, et al. (2008). "Microcomputed tomography imaging in a rat model of delayed union/non-union fracture." J Orthop Res 26(5): 729-36.
Dobnig, H. and R. T. Turner (1995). "Evidence that intermittent treatment with parathyroid hormone increases bone formation in adult rats by activation of bone lining cells." Endocrinology 136(8): 3632-8.
Doi, K., S. Kawai, et al. (1988). "Anterior cervical fusion using the free vascularized fibular graft." Spine 13(11): 1239-44.
Donati, D., C. Di Bella, et al. (2005). "The use of massive bone allografts in bone tumour surgery of the limb." Current Orthopaedics 19: 393-399.
Dubuc, F. L. and M. R. Urist (1967). "The accessibility of the bone induction principle in surface-decalcified bone implants." Clin Orthop Relat Res 55: 217-23.
Ehrhart, N., S. Kraft, et al. (2008). "Quantification of massive allograft healing with dynamic contrast enhanced-MRI and cone beam-CT: a pilot study." Clin Orthop Relat Res 466(8): 1897-904.
Einhorn, T. A. (1998). "The cell and molecular biology of fracture healing." Clin Orthop Relat Res(355 Suppl): S7-21.
Enneking, W. F. and D. A. Campanacci (2001). "Retrieved human allografts : a clinicopathological study." J Bone Joint Surg Am 83-A(7): 971-86.
Enneking, W. F. and E. R. Mindell (1991). "Observations on massive retrieved human allografts." J Bone Joint Surg Am 73(8): 1123-42.
Esiashvili, N., M. Goodman, et al. (2008). "Changes in incidence and survival of Ewing sarcoma patients over the past 3 decades: Surveillance Epidemiology and End Results data." J Pediatr Hematol Oncol 30(6): 425-30.
Fang, J., Y. Y. Zhu, et al. (1996). "Stimulation of new bone formation by direct transfer of osteogenic plasmid genes." Proc Natl Acad Sci U S A 93(12): 5753-8.
Farr, R. F. and P. J. Allisy-Roberts (1997). Physics for medical imaging. London, Saunders Company.
FDA (2002). "FDA APPROVES TERIPARATIDE TO TREAT OSTEOPOROSIS." FDA Talk Paper(T02-49).
Flick, L. M., J. M. Weaver, et al. (2003). "Effects of receptor activator of NFkappaB (RANK) signaling blockade on fracture healing." J Orthop Res 21(4): 676-84.
Forwood, M. R. and C. H. Turner (1995). "Skeletal adaptations to mechanical usage: results from tibial loading studies in rats." Bone 17(4 Suppl): 197S-205S.
Friedlaender, G. E. (1991). "Bone allografts: the biological consequences of immunological events." J Bone Joint Surg Am 73(8): 1119-22.
Friedlaender, G. E., K. W. Sell, et al. (1978). "Bone allograft antigenicity in an experimental model and in man." Acta Med Pol 19(1-2): 197-205.
Frost, H. M. (1960). "Presence of microscopic cracks in vivo in bone." H. Ford Hosp. Med. Bull. 8: 25–35.
Fukuroku, J., N. Inoue, et al. (2007). "Extracortical bone-bridging fixation with use of cortical allograft and recombinant human osteogenic protein-1." J Bone Joint Surg Am 89(7): 1486-96.

148
Fuller, K., J. M. Owens, et al. (1998). "Induction of osteoclast formation by parathyroid hormone depends on an action on stromal cells." J Endocrinol 158(3): 341-50.
Gabet, Y., R. Muller, et al. (2006). "Parathyroid hormone 1-34 enhances titanium implant anchorage in low-density trabecular bone: a correlative micro-computed tomographic and biomechanical analysis." Bone 39(2): 276-82.
Gafni, Y., G. Pelled, et al. (2004). "Gene therapy platform for bone regeneration using an exogenously regulated, AAV-2-based gene expression system." Mol Ther 9(4): 587-95.
Gardner, M. J., M. C. van der Meulen, et al. (2007). "Role of parathyroid hormone in the mechanosensitivity of fracture healing." J Orthop Res 25(11): 1474-1480.
Garrison, K. R., S. Donell, et al. (2007). "Clinical effectiveness and cost-effectiveness of bone morphogenetic proteins in the non-healing of fractures and spinal fusion: a systematic review." Health Technol Assess 11(30): 1-150, iii-iv.
Gazit, D., A. Ben-Arav, et al. (2008). "Craniofacial Bone Tissue Engineering using rAAV-BMP2-Coated Calvaria Allografts." TERMIS Conference.
Gerber, H. P. and N. Ferrara (2000). "Angiogenesis and bone growth." Trends Cardiovasc Med 10(5): 223-8.
Grigoryan, M., J. A. Lynch, et al. (2003). "Quantitative and qualitative assessment of closed fracture healing using computed tomography and conventional radiography." Acad Radiol 10(11): 1267-73.
Harper, K. D., J. H. Krege, et al. (2007). "Osteosarcoma and teriparatide?" J Bone Miner Res 22(2): 334.
Hartman, E. H., P. H. Spauwen, et al. (2002). "Donor-site complications in vascularized bone flap surgery." J Invest Surg 15(4): 185-97.
Hashimoto, T., M. Shigetomi, et al. (2007). "Sequential treatment with intermittent low-dose human parathyroid hormone (1-34) and bisphosphonate enhances large-size skeletal reconstruction by vascularized bone transplantation." Calcif Tissue Int 81(3): 232-9.
Hidaka, C., M. E. Cunningham, et al. (2006). "Modern biologics used in orthopaedic surgery." Curr Opin Rheumatol 18(1): 74-9.
Hopp, S. G., L. E. Dahners, et al. (1989). "A study of the mechanical strength of long bone defects treated with various bone autograft substitutes: an experimental investigation in the rabbit." J Orthop Res 7(4): 579-84.
Hornicek, F. J., Jr., W. Mnaymneh, et al. (1998). "Limb salvage with osteoarticular allografts after resection of proximal tibia bone tumors." Clin Orthop Relat Res(352): 179-86.
Huff, T. W. and T. P. Sculco (2007). "Management of bone loss in revision total knee arthroplasty." J Arthroplasty 22(7 Suppl 3): 32-6.
Huja, S. S., M. S. Hasan, et al. (1999). "Development of a fluorescent light technique for evaluating microdamage in bone subjected to fatigue loading." J Biomech 32(11): 1243-9.
Huja, S. S., T. R. Katona, et al. (1999). "Microdamage adjacent to endosseous implants." Bone 25(2): 217-22.

149
Isaksson, H., I. Grongroft, et al. (2008). "Remodeling of fracture callus in mice is consistent with mechanical loading and bone remodeling theory." J Orthop Res.
Ito, H., J. J. Goater, et al. (2004). "Light-activated gene transduction of recombinant adeno-associated virus in human mesenchymal stem cells." Gene Ther 11(1): 34-41.
Ito, H., M. Koefoed, et al. (2005). "Remodeling of cortical bone allografts mediated by adherent rAAV-RANKL and VEGF gene therapy." Nat Med 11(3): 291-7.
Jane, J. A., Jr., B. A. Dunford, et al. (2002). "Ectopic osteogenesis using adenoviral bone morphogenetic protein (BMP)-4 and BMP-6 gene transfer." Mol Ther 6(4): 464-70.
Jilka, R. L., R. S. Weinstein, et al. (1999). "Increased bone formation by prevention of osteoblast apoptosis with parathyroid hormone." J Clin Invest 104(4): 439-46.
Johansson, H. R., R. Skripitz, et al. (2008). "Bisphosphonates can block the deterioration in implant fixation after withdrawal of intermittent doses of parathyroid hormone." J Bone Joint Surg Br 90(3): 400-4.
Jolette, J., C. E. Wilker, et al. (2006). "Defining a noncarcinogenic dose of recombinant human parathyroid hormone 1-84 in a 2-year study in Fischer 344 rats." Toxicol Pathol 34(7): 929-40.
Jones, A. L., R. W. Bucholz, et al. (2006). "Recombinant human BMP-2 and allograft compared with autogenous bone graft for reconstruction of diaphyseal tibial fractures with cortical defects. A randomized, controlled trial." J Bone Joint Surg Am 88(7): 1431-41.
Kaback, L. A., Y. Soung do, et al. (2008). "Teriparatide (1-34 human PTH) regulation of osterix during fracture repair." J Cell Biochem 105(1): 219-26.
Kagan, R. J. (1998). Standards for Tissue Banking. McLean, VA, American Association of Tissue Banks.
Kakar, S., T. A. Einhorn, et al. (2007). "Enhanced chondrogenesis and Wnt signaling in PTH-treated fractures." J Bone Miner Res 22(12): 1903-12.
Kakiuchi, M. and K. Ono (1987). "The relative clinical efficacy of surface-decalcified and wholly decalcified bone alloimplants." Int Orthop 11(2): 89-94.
Kakiuchi, M. and K. Ono (1996). "Preparation of bank bone using defatting, freeze-drying and sterilisation with ethylene oxide gas. Part 2. Clinical evaluation of its efficacy and safety." Int Orthop 20(3): 147-52.
Kang, J. S. and N. H. Kim (1995). "The biomechanical properties of deep freezing and freeze drying bones and their biomechanical changes after in-vivo allograft." Yonsei Med J 36(4): 332-5.
Kass, M., A. Witkin, et al. (1988). "Snakes: Active Contour Models." International Journal of Computer Vision 1(4): 321.
Kerry, R. M., B. A. Masri, et al. (1999). "The biology of bone grafting." Instr Course Lect 48: 645-52.

150
Kim, S., T. T. Yoshizumi, et al. (2008). "Comparison of Radiation Doses between Cone Beam Ct and Multi Detector Ct: Tld Measurements." Radiat Prot Dosimetry.
Knothe Tate, M. L., T. F. Ritzman, et al. (2007). "Testing of a new one-stage bone-transport surgical procedure exploiting the periosteum for the repair of long-bone defects." J Bone Joint Surg Am 89(2): 307-16.
Koefoed, M., H. Ito, et al. (2005). "Biological effects of rAAV-caAlk2 coating on structural allograft healing." Mol Ther 12(2): 212-8.
Komatsubara, S., S. Mori, et al. (2005). "Human parathyroid hormone (1-34) accelerates the fracture healing process of woven to lamellar bone replacement and new cortical shell formation in rat femora." Bone 36(4): 678-87.
Kotobuki, N., Y. Katsube, et al. (2008). "In vivo survival and osteogenic differentiation of allogeneic rat bone marrow mesenchymal stem cells (MSCs)." Cell Transplant 17(6): 705-12.
Kuroda, S., A. S. Virdi, et al. (2004). "A low-temperature biomimetic calcium phosphate surface enhances early implant fixation in a rat model." J Biomed Mater Res A 70(1): 66-73.
Laird, R. K., N. J. Pavlos, et al. (2006). "Bone allograft non-union is related to excessive osteoclastic bone resorption: a sheep model study." Histol Histopathol 21(12): 1277-85.
Lattanzi, R., F. Baruffaldi, et al. (2004). "Specialised CT scan protocols for 3-D pre-operative planning of total hip replacement." Med Eng Phys 26(3): 237-45.
Lee, K., J. D. Deeds, et al. (1994). "Parathyroid hormone induces sequential c-fos expression in bone cells in vivo: in situ localization of its receptor and c-fos messenger ribonucleic acids." Endocrinology 134(1): 441-50.
Lee, T. C., S. Mohsin, et al. (2003). "Detecting microdamage in bone." J Anat 203(2): 161-72.
Lekishvili, M. V., A. I. Snetkov, et al. (2004). "Experimental and clinical study of the demineralized bone allografts manufactured in the tissue bank of CITO." Cell Tissue Bank 5(4): 231-8.
Lewandrowski, K. U., L. Bonassar, et al. (1998). "Mechanical properties of perforated and partially demineralized bone grafts." Clin Orthop Relat Res(353): 238-46.
Lewandrowski, K. U., S. Bondre, et al. (2002). "Porous poly(propylene fumarate) foam coating of orthotopic cortical bone grafts for improved osteoconduction." Tissue Eng 8(6): 1017-27.
Lewandrowski, K. U., G. Schollmeier, et al. (2001). "Incorporation of perforated and demineralized cortical bone allografts. Part I: radiographic and histologic evaluation." Biomed Mater Eng 11(3): 197-207.
Lewandrowski, K. U., G. Schollmeier, et al. (2001). "Incorporation of perforated and demineralized cortical bone allografts. Part II: A mechanical and histologic evaluation." Biomed Mater Eng 11(3): 209-19.

151
Liu, H., D. M. Kemeny, et al. (2006). "The immunogenicity and immunomodulatory function of osteogenic cells differentiated from mesenchymal stem cells." J Immunol 176(5): 2864-71.
Locklin, R. M., S. Khosla, et al. (2003). "Mediators of the biphasic responses of bone to intermittent and continuously administered parathyroid hormone." J Cell Biochem 89(1): 180-90.
Lodder, M. C., W. F. Lems, et al. (2004). "Reproducibility of bone mineral density measurement in daily practice." Ann Rheum Dis 63(3): 285-9.
Lord, G., J. H. Marotte, et al. (1988). "Cementless revisions of failed aseptic cemented and cementless total hip arthroplasties. 284 cases." Clin Orthop Relat Res(235): 67-74.
Loty, B., J. P. Courpied, et al. (1990). "Bone allografts sterilised by irradiation. Biological properties, procurement and results of 150 massive allografts." Int Orthop 14(3): 237-42.
Loty, B., B. Tomeno, et al. (1994). "Infection in massive bone allografts sterilised by radiation." Int Orthop 18(3): 164-71.
MacDonald, B. T., D. M. Joiner, et al. (2007). "Bone mass is inversely proportional to Dkk1 levels in mice." Bone 41(3): 331-9.
Mallows, C. L. (1973). "Some Comments on Cp." Technometrics 15: 661-675. Manabe, T., S. Mori, et al. (2007). "Human parathyroid hormone (1-34) accelerates
natural fracture healing process in the femoral osteotomy model of cynomolgus monkeys." Bone 40(6): 1475-82.
Manfrini, M., D. Vanel, et al. (2004). "Imaging of vascularized fibula autograft placed inside a massive allograft in reconstruction of lower limb bone tumors." AJR Am J Roentgenol 182(4): 963-70.
Markel, M. D., R. L. Morin, et al. (1991). "Quantitative CT for the evaluation of bone healing." Calcif Tissue Int 49(6): 427-32.
Martin-Badosa, E., D. Amblard, et al. (2003). "Excised bone structures in mice: imaging at three-dimensional synchrotron radiation micro CT." Radiology 229(3): 921-8.
Mattila, K. T., J. T. Heikkila, et al. (1995). "Massive osteoarticular knee allografts: structural changes evaluated with CT." Radiology 196(3): 657-60.
McGraw, K. O. and S. P. Wong (1996). "Forming Inferences About Some Intraclass Correlation Coefficients." Psychological Methods 1(1): 30 - 46.
Meadows, G. R. (2002). "Adjunctive use of ultraporous beta-tricalcium phosphate bone void filler in spinal arthrodesis." Orthopedics 25(5 Suppl): s579-84.
Mellick, L. B., L. Milker, et al. (1999). "Childhood accidental spiral tibial (CAST) fractures." Pediatr Emerg Care 15(5): 307-9.
Mihelic, N. E. (2004). "Repair of a severely comminuted distal femur fracture using surgical-grade calcium sulfate bone graft substitute." Orthopedics 27(1 Suppl): s127-8.
Mikic, B., M. C. van der Meulen, et al. (1995). "Long bone geometry and strength in adult BMP-5 deficient mice." Bone 16(4): 445-54.
152
Muller, M., D. Mitton, et al. (2008). "Nonlinear ultrasound can detect accumulated damage in human bone." J Biomech 41(5): 1062-8.
Nakajima, A., N. Shimoji, et al. (2002). "Mechanisms for the enhancement of fracture healing in rats treated with intermittent low-dose human parathyroid hormone (1-34)." J Bone Miner Res 17(11): 2038-47.
Nakazawa, T., A. Nakajima, et al. (2005). "Effects of low-dose, intermittent treatment with recombinant human parathyroid hormone (1-34) on chondrogenesis in a model of experimental fracture healing." Bone 37(5): 711-9.
Nather, A., A. Thambyah, et al. (2004). "Biomechanical strength of deep-frozen versus lyophilized large cortical allografts." Clin Biomech (Bristol, Avon) 19(5): 526-33.
Nauta, A. J., G. Westerhuis, et al. (2006). "Donor-derived mesenchymal stem cells are immunogenic in an allogeneic host and stimulate donor graft rejection in a nonmyeloablative setting." Blood 108(6): 2114-20.
Nazarian, A., B. D. Snyder, et al. (2008). "Quantitative micro-computed tomography: a non-invasive method to assess equivalent bone mineral density." Bone 43(2): 302-11.
Neer, R. M., C. D. Arnaud, et al. (2001). "Effect of parathyroid hormone (1-34) on fractures and bone mineral density in postmenopausal women with osteoporosis." N Engl J Med 344(19): 1434-41.
Nguyen, H., D. A. Morgan, et al. (2007). "Sterilization of allograft bone: effects of gamma irradiation on allograft biology and biomechanics." Cell Tissue Bank 8(2): 93-105.
Nicholls, P. J., E. Berg, et al. (1979). "X-ray diagnosis of healing fractures in rabbits." Clin Orthop Relat Res(142): 234-6.
Niemeyer, P., A. Seckinger, et al. (2004). "[Allogenic transplantation of human mesenchymal stem cells for tissue engineering purposes: an in vitro study]." Orthopade 33(12): 1346-53.
Nishida, S., A. Yamaguchi, et al. (1994). "Increased bone formation by intermittent parathyroid hormone administration is due to the stimulation of proliferation and differentiation of osteoprogenitor cells in bone marrow." Bone 15(6): 717-23.
Nunamaker, D. M. (1998). "Experimental models of fracture repair." Clin Orthop Relat Res(355 Suppl): S56-65.
O'Brien, F. J., D. Taylor, et al. (2000). "Visualisation of three-dimensional microcracks in compact bone." J Anat 197 Pt 3: 413-20.
Okubo, Y., K. Bessho, et al. (2000). "Osteoinduction by recombinant human bone morphogenetic protein-2 at intramuscular, intermuscular, subcutaneous and intrafatty sites." Int J Oral Maxillofac Surg 29(1): 62-6.
Otsu, N. (1979). "A threshold selection method from gray-level histograms." IEEE Trans. Systems, Man, and Cybernetics 9(1): 62-66.
Owens, B. D., J. C. Wenke, et al. (2006). "Extremity trauma research in the United States army." J Am Acad Orthop Surg 14(10 Suppl): S37-40.
153
Pelker, R. R. and G. E. Friedlaender (1987). "Biomechanical aspects of bone autografts and allografts." Orthop Clin North Am 18(2): 235-9.
Pelker, R. R., G. E. Friedlaender, et al. (1983). "Biomechanical properties of bone allografts." Clin Orthop Relat Res(174): 54-7.
Pelker, R. R., J. McKay, Jr., et al. (1989). "Allograft incorporation: a biomechanical evaluation in a rat model." J Orthop Res 7(4): 585-9.
Pettway, G. J., J. A. Meganck, et al. (2008). "Parathyroid hormone mediates bone growth through the regulation of osteoblast proliferation and differentiation." Bone 42(4): 806-18.
Pike, R. L. and P. J. Boyne (1974). "Use of surface-decalcified allogeneic bone and autogenous marrow in extensive mandibular defects." J Oral Surg 32(3): 177-82.
Pluhar, G. E., P. A. Manley, et al. (2001). "The effect of recombinant human bone morphogenetic protein-2 on femoral reconstruction with an intercalary allograft in a dog model." J Orthop Res 19(2): 308-17.
Prewitt, J. M. S. (1970). Object enhancement and extraction. New York, Academic Press.
Puzas, J. E., J. Houck, et al. (2006). "Accelerated fracture healing." J Am Acad Orthop Surg 14(10 Suppl): S145-51.
Reddi, A. H. (1998). "Role of morphogenetic proteins in skeletal tissue engineering and regeneration." Nat Biotechnol 16(3): 247-52.
Rees, D. C. and F. S. Haddad (2003). "Bone transplantation." Hosp Med 64(4): 205-9.
Reynolds, D. G., C. Hock, et al. (2007). "Micro-computed tomography prediction of biomechanical strength in murine structural bone grafts." J Biomech 40(14): 3178-86.
Reynolds, D. G., S. Shaikh, et al. (2008). "Micro-CT-Based Measurement of Cortical Bone Graft-to-Host Union." J Bone Miner Res.
Rhee, Y., S. Y. Park, et al. (2007). "Angiogenesis inhibitor attenuates parathyroid hormone-induced anabolic effect." Biomed Pharmacother.
Rickard, D. J., F. L. Wang, et al. (2006). "Intermittent treatment with parathyroid hormone (PTH) as well as a non-peptide small molecule agonist of the PTH1 receptor inhibits adipocyte differentiation in human bone marrow stromal cells." Bone 39(6): 1361-72.
Sample, S. J., M. Behan, et al. (2008). "Functional adaptation to loading of a single bone is neuronally regulated and involves multiple bones." J Bone Miner Res 23(9): 1372-81.
Sandhu, H. S., H. S. Grewal, et al. (1999). "Bone grafting for spinal fusion." Orthop Clin North Am 30(4): 685-98.
Santoni, B. G., N. Ehrhart, et al. (2008). "Effects of low intensity pulsed ultrasound with and without increased cortical porosity on structural bone allograft incorporation." J Orthop Surg 3: 20.
154
Santoni, B. G., W. J. Womack, et al. (2007). "A mechanical and computational investigation on the effects of conduit orientation on the strength of massive bone allografts." Bone 41(5): 769-74.
Sautin, E. N. (1963). "[Sterilization of Bone Tissue with Gamma Rays of Cobalt-60.]." Radiobiologiia 3: 621-5.
Seeherman, H. J., M. Bouxsein, et al. (2004). "Recombinant human bone morphogenetic protein-2 delivered in an injectable calcium phosphate paste accelerates osteotomy-site healing in a nonhuman primate model." J Bone Joint Surg Am 86-A(9): 1961-72.
Seiler, J. G., 3rd and J. Johnson (2000). "Iliac crest autogenous bone grafting: donor site complications." J South Orthop Assoc 9(2): 91-7.
Sharrard, W. J. and D. H. Collins (1961). "The fate of human decalcified bone grafts." Proc R Soc Med 54: 1101-2.
Shasha, N., S. Krywulak, et al. (2003). "Long-term follow-up of fresh tibial osteochondral allografts for failed tibial plateau fractures." J Bone Joint Surg Am 85-A Suppl 2: 33-9.
Shefelbine, S. J., U. Simon, et al. (2005). "Prediction of fracture callus mechanical properties using micro-CT images and voxel-based finite element analysis." Bone 36(3): 480-8.
Sheyn, D., N. Kimelman-Bleich, et al. (2008). "Ultrasound-based nonviral gene delivery induces bone formation in vivo." Gene Ther 15(4): 257-66.
Shigley, J. E. and C. R. Mischke (2001). Mechanical Engineering Design. New York, McGraw-Hill.
Simonds, R. J., S. D. Holmberg, et al. (1992). "Transmission of human immunodeficiency virus type 1 from a seronegative organ and tissue donor." N Engl J Med 326(11): 726-32.
Soltan, M., D. Smiler, et al. (2007). "Bone block allograft impregnated with bone marrow aspirate." Implant Dent 16(4): 329-39.
Stevenson, S. (1999). "Biology of bone grafts." Orthop Clin North Am 30(4): 543-52. Stevenson, S. and M. Horowitz (1992). "The response to bone allografts." J Bone
Joint Surg Am 74(6): 939-50. Stevenson, S., X. Q. Li, et al. (1997). "Critical biological determinants of
incorporation of non-vascularized cortical bone grafts. Quantification of a complex process and structure." J Bone Joint Surg Am 79(1): 1-16.
Summers, B. N. and S. M. Eisenstein (1989). "Donor site pain from the ilium. A complication of lumbar spine fusion." J Bone Joint Surg Br 71(4): 677-80.
Taddei, F., M. Viceconti, et al. (2003). "Mechanical strength of a femoral reconstruction in paediatric oncology: a finite element study." Proc Inst Mech Eng [H] 217(2): 111-9.
Tam, C. S., J. N. Heersche, et al. (1982). "Parathyroid hormone stimulates the bone apposition rate independently of its resorptive action: differential effects of intermittent and continuous administration." Endocrinology 110(2): 506-12.
Tamhane, A. D., D (2000). Statistics and Data Analysis: from Elementary to Intermediate. Upper Saddle River, Prentice-Hall, Inc.

155
Tan, K. K., G. H. Tan, et al. (2005). "Bone graft substitute using hydroxyapatite scaffold seeded with tissue engineered autologous osteoprogenitor cells in spinal fusion: early result in a sheep model." Med J Malaysia 60 Suppl C: 53-8.
Taschereau, R., P. L. Chow, et al. (2006). "Monte carlo simulations of dose from microCT imaging procedures in a realistic mouse phantom." Med Phys 33(1): 216-24.
Thiele, O. C., C. Eckhardt, et al. (2007). "Factors affecting the stability of screws in human cortical osteoporotic bone: a cadaver study." J Bone Joint Surg Br 89(5): 701-5.
Thompson, R. C., Jr., A. Garg, et al. (2000). "Fractures in large-segment allografts." Clin Orthop Relat Res(370): 227-35.
Thompson, R. C., Jr., E. A. Pickvance, et al. (1993). "Fractures in large-segment allografts." J Bone Joint Surg Am 75(11): 1663-73.
Thurner, P. J., P. Wyss, et al. (2006). "Time-lapsed investigation of three-dimensional failure and damage accumulation in trabecular bone using synchrotron light." Bone 39(2): 289-99.
Tingart, M. J., M. Apreleva, et al. (2003). "The cortical thickness of the proximal humeral diaphysis predicts bone mineral density of the proximal humerus." J Bone Joint Surg Br 85(4): 611-7.
Tiyapatanaputi, P., P. T. Rubery, et al. (2004). "A novel murine segmental femoral graft model." J Orthop Res 22(6): 1254-60.
Tolstunov, L. (2007). "Implant zones of the jaws: implant location and related success rate." J Oral Implantol 33(4): 211-20.
Tsuchida, H., J. Hashimoto, et al. (2003). "Engineered allogeneic mesenchymal stem cells repair femoral segmental defect in rats." J Orthop Res 21(1): 44-53.
Tsuda, H., T. Wada, et al. (2003). "Efficient BMP2 gene transfer and bone formation of mesenchymal stem cells by a fiber-mutant adenoviral vector." Mol Ther 7(3): 354-65.
Urist, M. R. (1965). "Bone: formation by autoinduction." Science 150(698): 893-9. Uzawa, T., M. Hori, et al. (1995). "Comparison of the effects of intermittent and
continuous administration of human parathyroid hormone(1-34) on rat bone." Bone 16(4): 477-84.
Vahle, J. L., M. Sato, et al. (2002). "Skeletal changes in rats given daily subcutaneous injections of recombinant human parathyroid hormone (1-34) for 2 years and relevance to human safety." Toxicol Pathol 30(3): 312-21.
Vahle, J. L., U. Zuehlke, et al. (2008). "Lack of Bone Neoplasms and Persistence of Bone Efficacy in Cynomolgus Macaques Following Long-term Treatment with Teriparatide [rhPTH(1-34)]*." J Bone Miner Res.
Verborgt, O., G. J. Gibson, et al. (2000). "Loss of osteocyte integrity in association with microdamage and bone remodeling after fatigue in vivo." J Bone Miner Res 15(1): 60-7.

156
Verborgt, O., N. A. Tatton, et al. (2002). "Spatial distribution of Bax and Bcl-2 in osteocytes after bone fatigue: complementary roles in bone remodeling regulation?" J Bone Miner Res 17(5): 907-14.
Wang, X., D. B. Masse, et al. (2007). "Detection of trabecular bone microdamage by micro-computed tomography." J Biomech 40(15): 3397-403.
Ward, W. G., M. D. Gautreaux, et al. (2008). "HLA sensitization and allograft bone graft incorporation." Clin Orthop Relat Res 466(8): 1837-48.
Weiland, A. J., T. W. Phillips, et al. (1984). "Bone grafts: a radiologic, histologic, and biomechanical model comparing autografts, allografts, and free vascularized bone grafts." Plast Reconstr Surg 74(3): 368-79.
Wheeler, D. L. and W. F. Enneking (2005). "Allograft bone decreases in strength in vivo over time." Clin Orthop Relat Res(435): 36-42.
Wheeler, D. L., J. L. Haynie, et al. (2001). "Biomechanical evaluation of retrieved massive allografts: preliminary results." Biomed Sci Instrum 37: 251-6.
Whitfield, J. F. (2005). "Parathyroid hormone (PTH) and hematopoiesis: new support for some old observations." J Cell Biochem 96(2): 278-84.
Wunder, C. C. and R. C. Welch (1977). "Femur-bending properties as influenced by gravity: II. Ultimate load, moment, and stress for 3-G mice." Aviat Space Environ Med 48(8): 734-6.
Xie, C., D. Reynolds, et al. (2007). "Structural bone allograft combined with genetically engineered mesenchymal stem cells as a novel platform for bone tissue engineering." Tissue Eng 13(3): 435-45.
Yazici, C., L. Yanoso, et al. (2008). "The effect of surface demineralization of cortical bone allograft on the properties of recombinant adeno-associated virus coatings." Biomaterials 29(28): 3882-7.
Younger, E. M. and M. W. Chapman (1989). "Morbidity at bone graft donor sites." J Orthop Trauma 3(3): 192-5.
Zhang, X., A. Naik, et al. (2005). "Periosteal stem cells are essential for bone revitalization and repair." J Musculoskelet Neuronal Interact 5(4): 360-2.
Zhang, X., C. Xie, et al. (2005). "Periosteal progenitor cell fate in segmental cortical bone graft transplantations: implications for functional tissue engineering." J Bone Miner Res 20(12): 2124-37.
Zhou, H., A. Iida-Klein, et al. (2003). "Anabolic action of parathyroid hormone on cortical and cancellous bone differs between axial and appendicular skeletal sites in mice." Bone 32(5): 513-20.
Zioupos, P., J. D. Currey, et al. (1995). "Experimentally determined microcracking around a circular hole in a flat plate of bone: comparison with predicted stresses." Philos Trans R Soc Lond B Biol Sci 347(1322): 383-96.

157
7 Appendicies 7.1 APPENDIX A: UNIONRATIO & UCTANALYSIS MATLAB CODE
The critical components of the UnionRatio analysis from the uCTanalysis MATLAB program are presented in this appendix. Below is a screen shot from the program in its entirety.

158
Snake Morphing – Edge Detection. The "Snake This Slice" button function Snake2D(hObject, eventdata, handles) im = handles.currentdata; image_num = handles.imnum; %the 3D image dataset if ~(handles.LastModifiedContours(end) == image_num) handles.LastModifiedContours(end+1) = image_num; end guidata(hObject,handles); mingray = handles.mingraya; maxgray = handles.maxgrayb; M(3) = handles.max; M(2) = handles.x; M(1) = handles.y; im2 = imfilter(im(:,:,image_num),fspecial('gaussian',5,1.8)); % SYNTAX: GradientSum = zeros(M(1),M(2)); GradNeighbors = 3; % this allows the gradient from the neighboring slices to be considered, reducing out of plane noise for i = 0:GradNeighbors * 2 im_Temp = imfilter(im(:,:,image_num-GradNeighbors+i),fspecial('gaussian',5,1.8)); % SYNTAX: fspecial('gaussian', hsize, StandardDeviation); imPrewittVert = filter2(fspecial('prewitt'),im_Temp); % im(:,:,image_num)); imPrewittHoriz = filter2(fspecial('prewitt')',im_Temp); % im(:,:,image_num)); imPrewittCombinedTemp = abs(imPrewittVert) + abs(imPrewittHoriz); GradientSum = GradientSum + imPrewittCombinedTemp; end imPrewittCombined = GradientSum; xOUT = handles.SliceContours{image_num,1}(:,1); %xC1OUT yOUT = handles.SliceContours{image_num,1}(:,2); %yC1OUT [xOUT, yOUT] = SubroutineA(hObject, eventdata, handles, xOUT, yOUT, im2, mingray, imPrewittCombined); handles.SliceContours{image_num,1}(:,1) = xOUT; handles.SliceContours{image_num,1}(:,2) = yOUT; guidata(hObject,handles); [xSOUT,ySOUT]=splineDGR(xOUT,yOUT); if ~isempty(handles.SliceContours{image_num,2}); xINN = handles.SliceContours{image_num,2}(:,1); yINN = handles.SliceContours{image_num,2}(:,2); [xINN, yINN] = SubroutineA(hObject, eventdata, handles, xINN, yINN, im2, mingray, imPrewittCombined); handles.SliceContours{image_num,2}(:,1) = xINN; handles.SliceContours{image_num,2}(:,2) = yINN; guidata(hObject,handles); [xSINN,ySINN]=splineDGR(xINN,yINN); end axes(handles.CT); imagesc(im(:,:,image_num),[(mingray) (maxgray)]) axis equal hold on plot([xSOUT;xSOUT(1)],[ySOUT;ySOUT(1)],'g-',[xOUT],[yOUT],'go'); if ~isempty(handles.SliceContours{image_num,2}); plot([xSINN;xSINN(1)],[ySINN;ySINN(1)],'r-',[xINN],[yINN],'ro'); end hold off handles.UpdatedContoursWithoutSave = 1; guidata(hObject, handles) DilateSnake2D(hObject, eventdata, handles); % % % % % % % % % % THE GUTS OF THE PROGRAM % % % % % % % % % % % % function [xs, ys] = SubroutineA(hObject, eventdata, handles, xs, ys, im2, mingray, imPrewittCombined) % find the slope of a point by looking at previous and next points slopes(1) = (ys(2) - ys(length(ys))) / (xs(2) - xs(length(xs))); % for first point slopes(length(xs)) = (ys(length(ys)-1) - ys(1)) / (xs(length(xs)-1) - xs(1)); % for last point for i = 2:(length(xs)-1) slopes(i) = (ys(i+1) - ys(i-1)) / (xs(i+1) - xs(i-1)); end % use negative reciprocal to find the slope of the perpendicular at a point perp = -1./slopes; % find the unit-length in the X and Y directions for a line ix = sign(perp)*1./(sqrt(1+perp.^2)); iy = sqrt(1-ix.^2); PerpLength = str2num(get(handles.EdgeSearchDistEditTextbox, 'String')); for j = 1:length(xs) for i = -PerpLength:PerpLength PerpLinesX(j,(i+PerpLength+1)) = xs(j)+i*ix(j); PerpLinesY(j,(i+PerpLength+1)) = ys(j)+i*iy(j); end
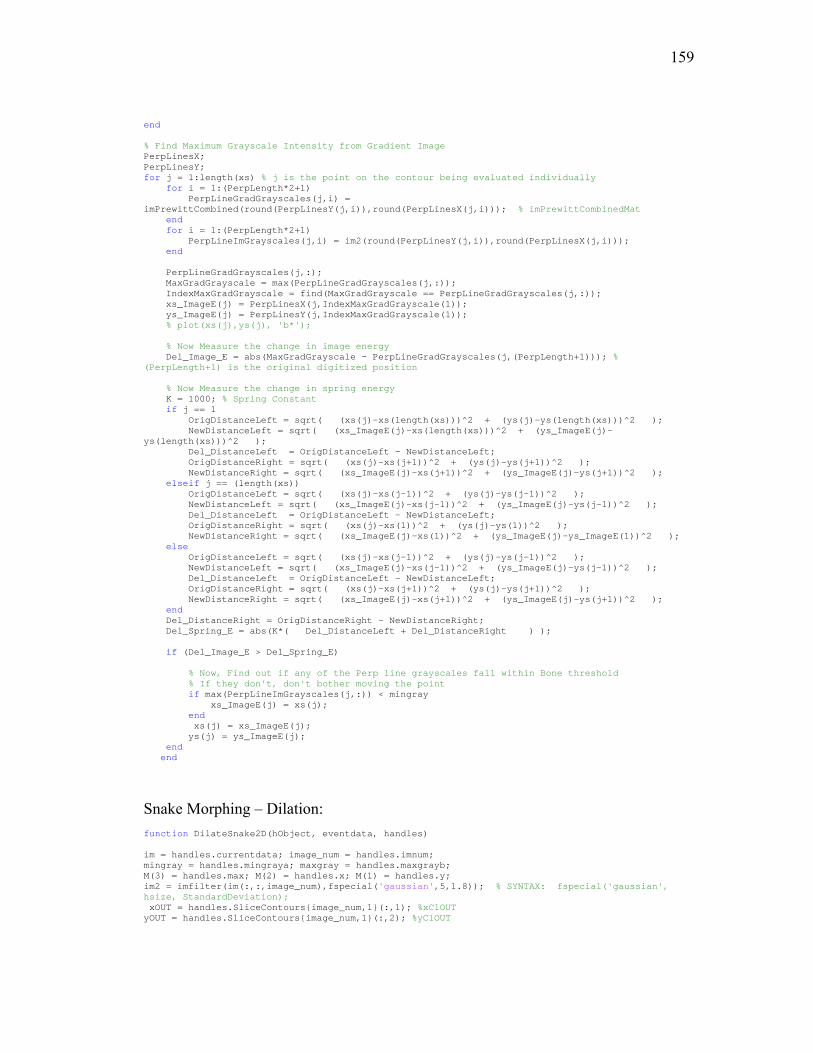
159
end % Find Maximum Grayscale Intensity from Gradient Image PerpLinesX; PerpLinesY; for j = 1:length(xs) % j is the point on the contour being evaluated individually for i = 1:(PerpLength*2+1) PerpLineGradGrayscales(j,i) = imPrewittCombined(round(PerpLinesY(j,i)),round(PerpLinesX(j,i))); % imPrewittCombinedMat end for i = 1:(PerpLength*2+1) PerpLineImGrayscales(j,i) = im2(round(PerpLinesY(j,i)),round(PerpLinesX(j,i))); end PerpLineGradGrayscales(j,:); MaxGradGrayscale = max(PerpLineGradGrayscales(j,:)); IndexMaxGradGrayscale = find(MaxGradGrayscale == PerpLineGradGrayscales(j,:)); xs_ImageE(j) = PerpLinesX(j,IndexMaxGradGrayscale(1)); ys_ImageE(j) = PerpLinesY(j,IndexMaxGradGrayscale(1)); % plot(xs(j),ys(j), 'b*'); % Now Measure the change in image energy Del_Image_E = abs(MaxGradGrayscale - PerpLineGradGrayscales(j,(PerpLength+1))); % (PerpLength+1) is the original digitized position % Now Measure the change in spring energy K = 1000; % Spring Constant if j == 1 OrigDistanceLeft = sqrt( (xs(j)-xs(length(xs)))^2 + (ys(j)-ys(length(xs)))^2 ); NewDistanceLeft = sqrt( (xs_ImageE(j)-xs(length(xs)))^2 + (ys_ImageE(j)-ys(length(xs)))^2 ); Del_DistanceLeft = OrigDistanceLeft - NewDistanceLeft; OrigDistanceRight = sqrt( (xs(j)-xs(j+1))^2 + (ys(j)-ys(j+1))^2 ); NewDistanceRight = sqrt( (xs_ImageE(j)-xs(j+1))^2 + (ys_ImageE(j)-ys(j+1))^2 ); elseif j == (length(xs)) OrigDistanceLeft = sqrt( (xs(j)-xs(j-1))^2 + (ys(j)-ys(j-1))^2 ); NewDistanceLeft = sqrt( (xs_ImageE(j)-xs(j-1))^2 + (ys_ImageE(j)-ys(j-1))^2 ); Del_DistanceLeft = OrigDistanceLeft - NewDistanceLeft; OrigDistanceRight = sqrt( (xs(j)-xs(1))^2 + (ys(j)-ys(1))^2 ); NewDistanceRight = sqrt( (xs_ImageE(j)-xs(1))^2 + (ys_ImageE(j)-ys_ImageE(1))^2 ); else OrigDistanceLeft = sqrt( (xs(j)-xs(j-1))^2 + (ys(j)-ys(j-1))^2 ); NewDistanceLeft = sqrt( (xs_ImageE(j)-xs(j-1))^2 + (ys_ImageE(j)-ys(j-1))^2 ); Del_DistanceLeft = OrigDistanceLeft - NewDistanceLeft; OrigDistanceRight = sqrt( (xs(j)-xs(j+1))^2 + (ys(j)-ys(j+1))^2 ); NewDistanceRight = sqrt( (xs_ImageE(j)-xs(j+1))^2 + (ys_ImageE(j)-ys(j+1))^2 ); end Del_DistanceRight = OrigDistanceRight - NewDistanceRight; Del_Spring_E = abs(K*( Del_DistanceLeft + Del_DistanceRight ) ); if (Del_Image_E > Del_Spring_E) % Now, Find out if any of the Perp line grayscales fall within Bone threshold % If they don't, don't bother moving the point if max(PerpLineImGrayscales(j,:)) < mingray xs_ImageE(j) = xs(j); end xs(j) = xs_ImageE(j); ys(j) = ys_ImageE(j); end end
Snake Morphing – Dilation: function DilateSnake2D(hObject, eventdata, handles) im = handles.currentdata; image_num = handles.imnum; mingray = handles.mingraya; maxgray = handles.maxgrayb; M(3) = handles.max; M(2) = handles.x; M(1) = handles.y; im2 = imfilter(im(:,:,image_num),fspecial('gaussian',5,1.8)); % SYNTAX: fspecial('gaussian', hsize, StandardDeviation); xOUT = handles.SliceContours{image_num,1}(:,1); %xC1OUT yOUT = handles.SliceContours{image_num,1}(:,2); %yC1OUT

160
[xOUT,yOUT]=SubroutineA(hObject, eventdata, handles, xOUT, yOUT, im2, mingray); handles.SliceContours{image_num,1}(:,1) = xOUT; handles.SliceContours{image_num,1}(:,2) = yOUT; guidata(hObject,handles); [xSOUT,ySOUT]=splineDGR(xOUT,yOUT); if ~isempty(handles.SliceContours{image_num,2}); xINN = handles.SliceContours{image_num,2}(:,1); yINN = handles.SliceContours{image_num,2}(:,2); [xINN,yINN]=SubroutineA(hObject, eventdata, handles, xINN, yINN, im2, mingray); handles.SliceContours{image_num,2}(:,1) = xINN; handles.SliceContours{image_num,2}(:,2) = yINN; guidata(hObject,handles); [xSINN,ySINN]=splineDGR(xINN,yINN); end % plot(xs,ys, 'b*'); % hold off axes(handles.CT); imagesc(im(:,:,image_num),[(mingray) (maxgray)]) axis equal hold on plot([xSOUT;xSOUT(1)],[ySOUT;ySOUT(1)],'g-',[xOUT],[yOUT],'go'); if ~isempty(handles.SliceContours{image_num,2}); plot([xSINN;xSINN(1)],[ySINN;ySINN(1)],'r-',[xINN],[yINN],'ro'); end hold off % % % % % % % % % % THE GUTS OF THE PROGRAM % % % % % % % % % % % % function [xs ,ys ] = SubroutineA(hObject, eventdata, handles, xs, ys, im2, mingray) slopes(1) = (ys(2) - ys(length(ys))) / (xs(2) - xs(length(xs))); % for first point slopes(length(xs)) = (ys(length(ys)-1) - ys(1)) / (xs(length(xs)-1) - xs(1)); % for last point for i = 2:(length(xs)-1) slopes(i) = (ys(i+1) - ys(i-1)) / (xs(i+1) - xs(i-1)); end % use negative reciprocal to find the slope of the perpendicular at a point perp = -1./slopes; % find the unit-length in the X and Y directions for a line ix = sign(perp)*1./(sqrt(1+perp.^2)); iy = sqrt(1-ix.^2); PerpLength = str2num(get(handles.DilateSearchDistEditTextbox,'String')); for j = 1:length(xs) for i = -PerpLength:PerpLength PerpLinesX(j,(i+PerpLength+1)) = xs(j)+i*ix(j); PerpLinesY(j,(i+PerpLength+1)) = ys(j)+i*iy(j); end end % hold on % plot(PerpLinesX', PerpLinesY', 'r-'); % plot perpendicular lines at each point in red % Find Minimum Grayscale Intensity from ORIGINAL Image for j = 1:length(xs) for i = 1:(PerpLength*2+1) PerpLineGrayscales(j,i) = im2(round(PerpLinesY(j,i)),round(PerpLinesX(j,i))); end for i = 1:(PerpLength*2+1) PerpLineImGrayscales(j,i) = im2(round(PerpLinesY(j,i)),round(PerpLinesX(j,i))); end PerpLineGrayscales(j,:); MinGrayscale = min(PerpLineGrayscales(j,:)); IndexMinGrayscale = find(MinGrayscale == PerpLineGrayscales(j,:)); xs_ImageE(j) = PerpLinesX(j,IndexMinGrayscale(1)); ys_ImageE(j) = PerpLinesY(j,IndexMinGrayscale(1)); % plot(xs(j),ys(j), 'b*'); if max(PerpLineImGrayscales(j,:)) < mingray xs_ImageE(j) = xs(j); end xs(j) = xs_ImageE(j); ys(j) = ys_ImageE(j); end
Surface calculation of UnionRatio. "Connectivity Surface Area" button

161
function findsurfaceareaDave(hObject,handles) %The function findsurfacearea takes the contours of all the slices which %appear in the listbox and finds the surface area of the 3-D surface that %the contours create when they are passed through the Matlab function %isosurface. This is accomplsihed by using the faces and vertices output of %isosurface. %Findsurfacearea also finds the surface area of the end caps of the 3-D %surface created by the passing the entire contour data set through the %function isosurface. This is accomplished by using the function isocaps %and its face and vertices output. %Findsurface area also finds the surface area of connection of a contoured %object to another object. This accomplished by summing 1/3 of the area of %one face of the connected surface if that face is in contact with a pixel %that has a grayscale value above a specific threshold value. %The surface area of the contoured object and the surface area of %connection area converted to milimeters squared and outputted to the %command window. %The function findsurfacearea seperates the contoured regions into a top %region, a middle region and a bottom region. This is done to conserve %memory usage. % load all necessary data from handles structure im = handles.currentdata; image_num = handles.imnum; mingray = handles.mingraya; maxgray = handles.maxgrayb; mingray = {num2str(mingray)}; Mz = handles.max; Mx = handles.x; My = handles.y; Ratio = handles.Resolution3D(3)/handles.Resolution3D(1); pad = 5; %eliminate zeros from slice data getslices = cell2struct(get(handles.ContouredSlicesListbox,'String'),'Slices',2); current_im_slice = str2num(getslices(1).Slices); true_first_slice = str2num(getslices(1).Slices); last_slice = str2num(getslices(end).Slices); %extract corresponding contour data to slice data contours = handles.SliceContours(true_first_slice:last_slice,:); slices_length = length(contours); %seperate out x and y coordinates of contour data for i = 1:(last_slice+1-true_first_slice) xdataOUT{i} = contours{i,1}(:,1); ydataOUT{i} = contours{i,1}(:,2); if ~isempty(contours{i,2}); xdataINN{i} = contours{i,2}(:,1); ydataINN{i} = contours{i,2}(:,2); end end %find the smallest increment that the length of contour array is divisible %by, so that the stack of contours may be broken down into top, middle and %bottom region. This allows for smaller volumes to be created in each %region (especially the middle region)in order to conserve memory during %the actual surface area calculation SliceDivisNum = 17; while (mod((last_slice-true_first_slice),SliceDivisNum) ~= 0) % mod = Modulus after division. (remainder) SliceDivisNum = SliceDivisNum - 1; end if SliceDivisNum == 1 msgbox('Number of slices is a prime number') return else SliceDivisNum; end mingray = round(str2num(get(handles.BinaryEditText, 'String'))); TextForInputDlg = ['SliceDivisNum is ', num2str(SliceDivisNum), '. EnterThresholdValue.' ]; mingray = inputdlg(TextForInputDlg,'threshold',1,{num2str(mingray)}); % if 'cancel' is clicked if isempty(mingray) return else mingray = str2num(cell2mat(mingray)); end set(handles.MinGraySelector, 'Value', mingray); set(handles.MinGrayText, 'String',['Min Gray: ' num2str(mingray)]); handles.mingraya = mingray; guidata(hObject,handles);

162
contourarea_final = double(0); connectedarea_final = double(0); areamineral_final = double(0); contourarea_array = zeros(length(contours),1); connectedarea_array = zeros(length(contours),1); areamineral_array = zeros(length(contours),1); h = waitbar(0,'Calculating Connected Surface Area. Please wait...'); start = 1; %start is in the binary mask's reference frame (BW) while first_slice is the global reference frame (im). finish = start+pad; %start and finish are used to iterate through the contour data array i = 0; %counter to used to create a 3-D binary mask for a the regions % make the binary mask for all the slices getsliceLength = length(getslices); TotalBW = zeros(My,Mx,getsliceLength+2*pad); % Pad the top of the binary mask with Zeros i=pad; for j = 1:(getsliceLength) i = i + 1; % pad + 1 slice = str2num(getslices(j).Slices); xOUT = cell2mat(xdataOUT(j)); yOUT = cell2mat(ydataOUT(j)); [x2OUT,y2OUT] = splineDGR(xOUT,yOUT); BWOUT = roipolyoldDave(im(:,:,slice),x2OUT,y2OUT); if ~isempty(handles.SliceContours{true_first_slice+j-1,2}); xINN = handles.SliceContours{true_first_slice+j-1,2}(:,1); yINN = handles.SliceContours{true_first_slice+j-1,2}(:,2); [x2INN,y2INN] = splineDGR(xINN,yINN); BWINN = roipolyoldDave(im(:,:,slice),x2INN,y2INN); BWOUT = BWINN ~= BWOUT; end TotalBW(:,:,i) = BWOUT; % figure; imagesc(BWtop(:,:,i)); end TotalBWsize = size(TotalBW); %TotalBW(:,:,TotalBWsize(3):(TotalBWsize(3)+pad)) = zeros(Mx,My,pad); % Pad the bottom of the binary mask with Zeros % Pad the top of the binary mask with Zeros to measure the % connection at the top surface (Dave) current_im_slice = current_im_slice-pad; % TotalBW = cat(3,zeros(TotalBWsize(1),TotalBWsize(2),pad),TotalBW); % Pad the bottom of the binary mask with Zeros % TotalBW = cat(3,TotalBW,zeros(TotalBWsize(1),TotalBWsize(2),pad)); %code for smoothing BW using a guassian filter TotalBW = smooth3(TotalBW,'gaussian',[pad pad (round(0.5*pad/Ratio)+0.5)*2], 2.0); % % TotalBW = smooth3(TotalBW, 'box', [3,3,3]); % % TotalBW = smooth3(TotalBW,'gaussian',[pad pad 3], 2.0); % TotalBW = TotalBW(:,:,:); %% Perform Top Cap measurement outside the loop. % Top Cap will now be the length of the pad that was applied: BWtop = TotalBW(:,:,1:pad+1); waitbar(pad/(slices_length+pad*2),h); BWtopsize = size(BWtop); x = 0; y = 0; z = 0; [x,y,z] = meshgrid(1:BWtopsize(2),1:BWtopsize(1),1:BWtopsize(3)); fv = isosurface(x,y,z,BWtop,0.5); %from the image processing toolbox fv.CDataFaces = ones(length(fv.faces),1); for i = 1:length(fv.faces) v1 = fv.vertices(fv.faces(i,1),1); v2 = fv.vertices(fv.faces(i,1),2); v3 = fv.vertices(fv.faces(i,1),3); if im(round(v2),round(v1),(round(v3+current_im_slice-1))) >= mingray fv.CDataFaces(i) = im(round(v2),round(v1),(round(v3+current_im_slice-1))); end end fv.CDataVertices = ones(length(fv.vertices),1); for i = 1:length(fv.vertices) v1 = fv.vertices(i,1); v2 = fv.vertices(i,2); v3 = fv.vertices(i,3); if im(round(v2),round(v1),(round(v3+current_im_slice-1))) >= mingray fv.CDataVertices(i) = im(round(v2),round(v1),(round(v3+current_im_slice-1))); % 255

163
% fv.CDataVertices(i) = 255; end end % This moves the verticies in the z-direction from the local % reference plane to the global: TempVertices = fv.vertices; c = zeros(length(TempVertices),2); c = cat(2,c,(ones(length(TempVertices),1)*(current_im_slice))); % -1 TempVertices = TempVertices + c; fv_total.vertices = TempVertices; fv_total.faces = fv.faces; fv_total.CDataFaces = fv.CDataFaces; fv_total.CDataVertices = fv.CDataVertices; %pull out faces and vertices from isosurface vertexpointstop = fv.vertices; facetop = fv.faces; Contour_Area = double(0); Connected_Area = double(0); AreaMineral = double(0); A = 0; %area of shell (from isosurface) for m = 1:length(facetop(:,1)) vertices = facetop(m,:); v1 = vertexpointstop(vertices(1),:); v2 = vertexpointstop(vertices(2),:); v3 = vertexpointstop(vertices(3),:); v1a = v1; v2a = v3; v3a = v2; v1a(3) = v1(3)*Ratio; v2a(3) = v3(3)*Ratio; v3a(3) = v2(3)*Ratio; %base v1 and v2 base = sqrt(((v2a(1)-v1a(1)).^2)+((v2a(2)-v1a(2)).^2)+((v2a(3)-v1a(3)).^2)); %vector between v1 and v2 vect1 = [v2a(1)-v1a(1),v2a(2)-v1a(2),v2a(3)-v1a(3)]; %vector between v1 and v2 vect2 = [v3a(1)-v1a(1),v3a(2)-v1a(2),v3a(3)-v1a(3)]; %distance to point 3 c = cross(vect1,vect2); d = sqrt(dot(c,c))/sqrt(dot(vect1,vect1)); A = (0.5*base*d); Contour_Area = Contour_Area + A; %connected area of shell (from isosurface) if im(round(v1(2)),round(v1(1)),(round(v1(3)+current_im_slice-1))) >= mingray Connected_Area = Connected_Area + (1/3*A); AreaMineral = AreaMineral + ... (1/3*A)*double(im(round(v1(2)),round(v1(1)),(round(v1(3)+current_im_slice-1)))*0.10197 - 232); end if im(round(v2(2)),round(v2(1)),(round(v2(3)+current_im_slice-1))) >= mingray Connected_Area = Connected_Area + (1/3*A); AreaMineral = AreaMineral + ... (1/3*A)*double(im(round(v1(2)),round(v1(1)),(round(v1(3)+current_im_slice-1)))*0.10197 - 232); end if im(round(v3(2)),round(v3(1)),(round(v3(3)+current_im_slice-1))) >= mingray Connected_Area = Connected_Area + (1/3*A); AreaMineral = AreaMineral + ... (1/3*A)*double(im(round(v1(2)),round(v1(1)),(round(v1(3)+current_im_slice-1)))*0.10197 - 232); end end %sum contoured and connected area of top region into final %contoured and connected area of entire object contourarea_final = contourarea_final + Contour_Area; contourarea_array(start) = Contour_Area; connectedarea_array(start) = Connected_Area; connectedarea_final = connectedarea_final + Connected_Area;

164
areamineral_array(start) = AreaMineral; areamineral_final = areamineral_final + AreaMineral; contourarea_TopCap = Contour_Area; connectedarea_TopCap = Connected_Area; areamineral_TopCap = AreaMineral; %iterate through slices by increment 'SliceDivisNum' into next region current_im_slice = current_im_slice+pad; %increment start and finish by the increment 'SliceDivisNum' found outside %the while loop so that can proceed into the next region (middle %region) start = pad+1; finish = start+SliceDivisNum; %% Perform Middle Region surface area calculation inside while loop while current_im_slice <= (last_slice+pad) if (current_im_slice < last_slice) waitbar(start/(slices_length+pad*2),h) BW = TotalBW(:,:,start:finish); BWsize = size(BW); x = 0; y = 0; z = 0; [x,y,z] = meshgrid(1:BWsize(2),1:BWsize(1),1:BWsize(3)); fv = isosurface(x,y,z,BW,0.5); % fv = reducepatch(fv,0.5); fv.CDataFaces = ones(length(fv.faces),1); for i = 1:length(fv.faces) % fv.faces(i,1), fv.faces(i,2), fv.faces(i,3) v1 = fv.vertices(fv.faces(i,1),1); v2 = fv.vertices(fv.faces(i,1),2); v3 = fv.vertices(fv.faces(i,1),3); if im(round(v2),round(v1),(round(v3+current_im_slice-1))) >= mingray fv.CDataFaces(i) = im(round(v2),round(v1),(round(v3+current_im_slice-1))); % 255 end end fv.CDataVertices = ones(length(fv.vertices),1); for i = 1:length(fv.vertices) % fv.faces(i,1), fv.faces(i,2), fv.faces(i,3) v1 = fv.vertices(i,1); v2 = fv.vertices(i,2); v3 = fv.vertices(i,3); if im(round(v2),round(v1),(round(v3+current_im_slice-1))) >= mingray fv.CDataVertices(i) = im(round(v2),round(v1),(round(v3+current_im_slice-1))); % 255 % fv.CDataVertices(i) = 255; end end NumberOfVertices = length(fv_total.vertices); % Code to modify the fv vertices' Z-coordinate such that it matches the Image data Z-coordinate: TempVertices = fv.vertices; c = zeros(length(TempVertices),2); c = cat(2,c,(ones(length(TempVertices),1)*current_im_slice)); TempVertices = TempVertices + c; fv_total.vertices = cat(1, fv_total.vertices, TempVertices); fv_total.faces = cat(1, fv_total.faces, (fv.faces + NumberOfVertices)); fv_total.CDataFaces = cat(1, fv_total.CDataFaces, fv.CDataFaces); fv_total.CDataVertices = cat(1, fv_total.CDataVertices, fv.CDataVertices); vertexpoints = fv.vertices; face = fv.faces; Contour_Area = double(0); Connected_Area = double(0); AreaMineral = double(0); A = 0; %area of shell (from isosurface) for m = 1:length(face(:,1)) vertices = face(m,:); v1 = vertexpoints(vertices(1),:); v2 = vertexpoints(vertices(2),:); v3 = vertexpoints(vertices(3),:);

165
v1a = v1; v2a = v3; v3a = v2; v1a(3) = v1(3)*Ratio; v2a(3) = v3(3)*Ratio; v3a(3) = v2(3)*Ratio; %base v1 and v2 base = sqrt(((v2a(1)-v1a(1)).^2)+((v2a(2)-v1a(2)).^2)+((v2a(3)-v1a(3)).^2)); %vector between v1 and v2 vect1 = [v2a(1)-v1a(1),v2a(2)-v1a(2),v2a(3)-v1a(3)]; %vector between v1 and v2 vect2 = [v3a(1)-v1a(1),v3a(2)-v1a(2),v3a(3)-v1a(3)]; %distance to point 3 c = cross(vect1,vect2); d = sqrt(dot(c,c))/sqrt(dot(vect1,vect1)); A = (0.5*base*d); Contour_Area = Contour_Area + A; %connected area of middle region (from isosurface) if im(round(v1(2)),round(v1(1)),(round(v1(3)+current_im_slice-1))) >= mingray Connected_Area = Connected_Area + (1/3*A); AreaMineral = AreaMineral + ... (1/3*A)*double(im(round(v1(2)),round(v1(1)),(round(v1(3)+current_im_slice-1)))*0.10197 - 232); end if im(round(v2(2)),round(v2(1)),(round(v2(3)+current_im_slice-1))) >= mingray Connected_Area = Connected_Area + (1/3*A); AreaMineral = AreaMineral + ... (1/3*A)*double(im(round(v1(2)),round(v1(1)),(round(v1(3)+current_im_slice-1)))*0.10197 - 232); end if im(round(v3(2)),round(v3(1)),(round(v3(3)+current_im_slice-1))) >= mingray Connected_Area = Connected_Area + (1/3*A); AreaMineral = AreaMineral + ... (1/3*A)*double(im(round(v1(2)),round(v1(1)),(round(v1(3)+current_im_slice-1)))*0.10197 - 232); end end clear('vertexpoints'); clear('face'); clear('TempVertices'); contourarea_final = contourarea_final + Contour_Area; connectedarea_final = connectedarea_final + Connected_Area; areamineral_final = areamineral_final + AreaMineral; contourarea_array(start) = Contour_Area; connectedarea_array(start) = Connected_Area; areamineral_array(start) = AreaMineral; current_im_slice = current_im_slice + SliceDivisNum; start = finish; finish = start+SliceDivisNum; else %% %%%%%%%%% Bottom Region with Bottom Cap %%%%%%%%%%% % make sure that finish does not exceed length of slice stack and % contour stack finish = length(TotalBW); i = 0; waitbar(start/(slices_length+pad*2),h) BWbot = TotalBW(:,:,start:end); BWbotsize = size(BWbot); x = 0; y = 0; z = 0; [x,y,z] = meshgrid(1:BWbotsize(2),1:BWbotsize(1),1:BWbotsize(3)); fv = isosurface(x,y,z,BWbot,0.5); % fv = reducepatch(fv,0.5); fv.CDataFaces = ones(length(fv.faces),1); for i = 1:length(fv.faces) % fv.faces(i,1), fv.faces(i,2), fv.faces(i,3) v1 = fv.vertices(fv.faces(i,1),1); v2 = fv.vertices(fv.faces(i,1),2); v3 = fv.vertices(fv.faces(i,1),3); if im(round(v2),round(v1),(round(v3+current_im_slice-1))) >= mingray fv.CDataFaces(i) = im(round(v2),round(v1),(round(v3+current_im_slice-1))); % 255 end end
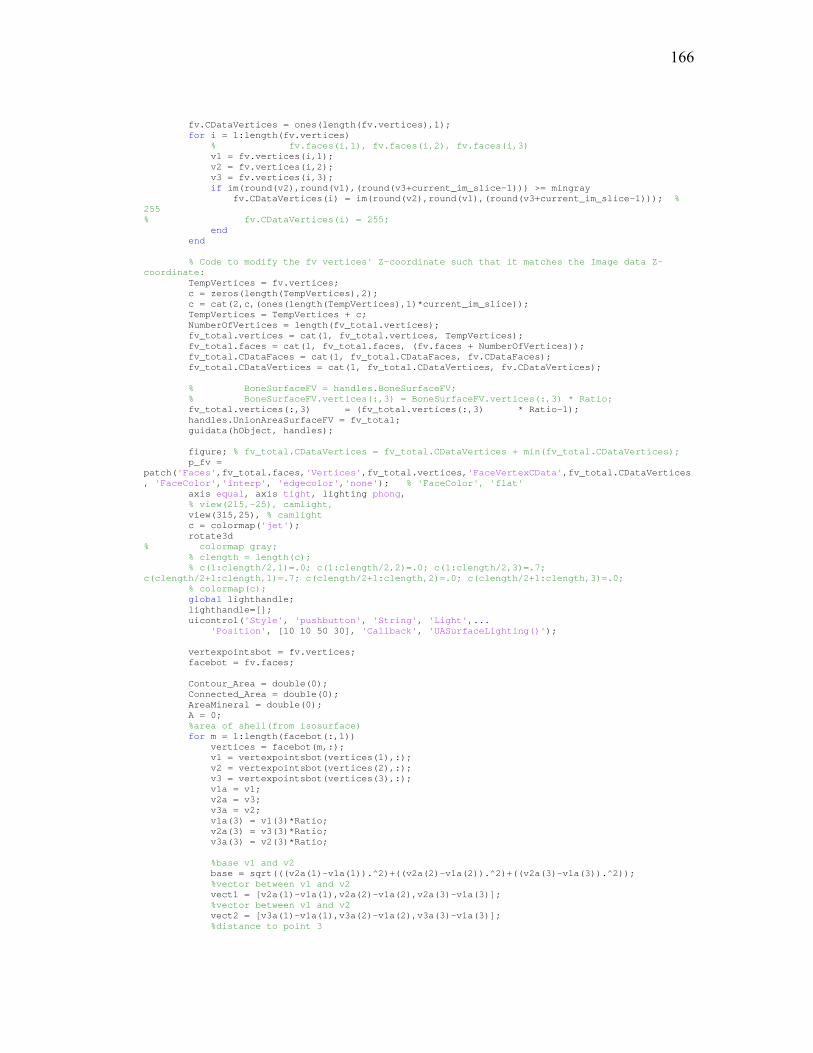
166
fv.CDataVertices = ones(length(fv.vertices),1); for i = 1:length(fv.vertices) % fv.faces(i,1), fv.faces(i,2), fv.faces(i,3) v1 = fv.vertices(i,1); v2 = fv.vertices(i,2); v3 = fv.vertices(i,3); if im(round(v2),round(v1),(round(v3+current_im_slice-1))) >= mingray fv.CDataVertices(i) = im(round(v2),round(v1),(round(v3+current_im_slice-1))); % 255 % fv.CDataVertices(i) = 255; end end % Code to modify the fv vertices' Z-coordinate such that it matches the Image data Z-coordinate: TempVertices = fv.vertices; c = zeros(length(TempVertices),2); c = cat(2,c,(ones(length(TempVertices),1)*current_im_slice)); TempVertices = TempVertices + c; NumberOfVertices = length(fv_total.vertices); fv_total.vertices = cat(1, fv_total.vertices, TempVertices); fv_total.faces = cat(1, fv_total.faces, (fv.faces + NumberOfVertices)); fv_total.CDataFaces = cat(1, fv_total.CDataFaces, fv.CDataFaces); fv_total.CDataVertices = cat(1, fv_total.CDataVertices, fv.CDataVertices); % BoneSurfaceFV = handles.BoneSurfaceFV; % BoneSurfaceFV.vertices(:,3) = BoneSurfaceFV.vertices(:,3) * Ratio; fv_total.vertices(:,3) = (fv_total.vertices(:,3) * Ratio-1); handles.UnionAreaSurfaceFV = fv_total; guidata(hObject, handles); figure; % fv_total.CDataVertices = fv_total.CDataVertices + min(fv_total.CDataVertices); p_fv = patch('Faces',fv_total.faces,'Vertices',fv_total.vertices,'FaceVertexCData',fv_total.CDataVertices, 'FaceColor','interp', 'edgecolor','none'); % 'FaceColor', 'flat' axis equal, axis tight, lighting phong, % view(215,-25), camlight, view(315,25), % camlight c = colormap('jet'); rotate3d % colormap gray; % clength = length(c); % c(1:clength/2,1)=.0; c(1:clength/2,2)=.0; c(1:clength/2,3)=.7; c(clength/2+1:clength,1)=.7; c(clength/2+1:clength,2)=.0; c(clength/2+1:clength,3)=.0; % colormap(c); global lighthandle; lighthandle=[]; uicontrol('Style', 'pushbutton', 'String', 'Light',... 'Position', [10 10 50 30], 'Callback', 'UASurfaceLighting()'); vertexpointsbot = fv.vertices; facebot = fv.faces; Contour_Area = double(0); Connected_Area = double(0); AreaMineral = double(0); A = 0; %area of shell(from isosurface) for m = 1:length(facebot(:,1)) vertices = facebot(m,:); v1 = vertexpointsbot(vertices(1),:); v2 = vertexpointsbot(vertices(2),:); v3 = vertexpointsbot(vertices(3),:); v1a = v1; v2a = v3; v3a = v2; v1a(3) = v1(3)*Ratio; v2a(3) = v3(3)*Ratio; v3a(3) = v2(3)*Ratio; %base v1 and v2 base = sqrt(((v2a(1)-v1a(1)).^2)+((v2a(2)-v1a(2)).^2)+((v2a(3)-v1a(3)).^2)); %vector between v1 and v2 vect1 = [v2a(1)-v1a(1),v2a(2)-v1a(2),v2a(3)-v1a(3)]; %vector between v1 and v2 vect2 = [v3a(1)-v1a(1),v3a(2)-v1a(2),v3a(3)-v1a(3)]; %distance to point 3

167
c = cross(vect1,vect2); d = sqrt(dot(c,c))/sqrt(dot(vect1,vect1)); A = (0.5*base*d); Contour_Area = Contour_Area + A; %connected area of bottom region (from isosurface) if im(round(v1(2)),round(v1(1)),(round(v1(3)+current_im_slice-1))) >= mingray Connected_Area = Connected_Area + (1/3*A); AreaMineral = AreaMineral + ... (1/3*A)*double(im(round(v1(2)),round(v1(1)),(round(v1(3)+current_im_slice-1)))*0.10197 - 232); end if im(round(v2(2)),round(v2(1)),(round(v2(3)+current_im_slice-1))) >= mingray Connected_Area = Connected_Area + (1/3*A); AreaMineral = AreaMineral + ... (1/3*A)*double(im(round(v1(2)),round(v1(1)),(round(v1(3)+current_im_slice-1)))*0.10197 - 232); end if im(round(v3(2)),round(v3(1)),(round(v3(3)+current_im_slice-1))) >= mingray Connected_Area = Connected_Area + (1/3*A); AreaMineral = AreaMineral + ... (1/3*A)*double(im(round(v1(2)),round(v1(1)),(round(v1(3)+current_im_slice-1)))*0.10197 - 232); end end current_im_slice = current_im_slice + SliceDivisNum; %iterate to end while loop data(1,:) = {'Contour Area No bottom cap (mm2)', 'Connected Area No bottom cap (mm2)','Contour Area No Top cap (mm2)', 'Connected Area No Top cap (mm2)',... 'TopHalfContourArea', 'TopHalfConnectedArea', 'BottomHalfContourArea', 'BottomHalfConnectedArea', 'WholeContourArea','WholeConnectedArea',... 'TopRatio','BottomRatio','MinimumConnectedRatio', 'Threshold', 'TopHalfAreaMineral [mg/cc * mm^2]', 'BottomHalfAreaMineral [mg/cc * mm^2]', 'AreaMineral [mg/cc * mm^2]','MineralDensity of Union [mg/cc]'}; disp('contour Area without bottom cap:') Resolution = handles.Resolution; contourarea_finalmm = contourarea_final*(Resolution^2) connectedarea_finalmm = connectedarea_final*(Resolution^2) data(2,1:2) = {sprintf('%0.4f', contourarea_finalmm),sprintf('%0.4f', connectedarea_finalmm)}; contourarea_final = contourarea_final + Contour_Area; connectedarea_final = connectedarea_final + Connected_Area; areamineral_final = areamineral_final + AreaMineral; contourarea_array(start) = Contour_Area; connectedarea_array(start) = Connected_Area; %adds bottom cap areamineral_array(start) = AreaMineral; end end Resolution = handles.Resolution; disp('contour Area without top cap:') contourarea_NoTopCap = contourarea_final - contourarea_TopCap; connectedarea_NoTopCap = connectedarea_final - connectedarea_TopCap; areamineral_NoTopCap = areamineral_final - areamineral_TopCap; contourarea_NoTopCapmm = contourarea_NoTopCap*(Resolution^2) connectedarea_NoTopCapmm = connectedarea_NoTopCap*(Resolution^2) areamineral_NoTopCapmm = areamineral_NoTopCap*(Resolution^2) disp('contour area WITH both caps:') contourarea_finalmm = contourarea_final*(Resolution^2) connectedarea_finalmm = connectedarea_final*(Resolution^2) areamineral_finalmm = areamineral_final*(Resolution^2) %outputs to the command window of final contour are in milimeters squared %and final connected area in milimeters squared disp('Connectivity when contour is complete, and splitting connectivity in halves:') TopHalfContourArea = sum(contourarea_array(1:round(end/2)))*(Resolution^2) TopHalfConnectedArea = sum(connectedarea_array(1:round(end/2)))*(Resolution^2) BottomHalfContourArea = sum(contourarea_array(round(end/2):end))*(Resolution^2) BottomHalfConnectedArea = sum(connectedarea_array(round(end/2):end))*(Resolution^2) WholeContourArea = sum(contourarea_array(1:end))*(Resolution^2) WholeConnectedArea = sum(connectedarea_array(1:end))*(Resolution^2)

168
WholeAreaMineral = sum(areamineral_array(1:end))*(Resolution^2) TopRatio = TopHalfConnectedArea/TopHalfContourArea BottomRatio = BottomHalfConnectedArea/BottomHalfContourArea MinimumConnectedRatio = min(TopRatio,BottomRatio) TopHalfAreaMineral = sum(areamineral_array(1:round(end/2)))*(Resolution^2) BottomHalfAreaMineral = sum(areamineral_array(round(end/2):end))*(Resolution^2) handles.finalcontourdarea = contourarea_finalmm; handles.finalconnectedarea = connectedarea_finalmm; guidata(hObject,handles) % set(handles.TotalVolumeText, 'String',['Contour Area: ' num2str(contourarea_finalmm) ' mm^2']); % set(handles.NormalizedVolumeText, 'String',['Connected Area: ' num2str(connectedarea_finalmm) ' mm^2']); set(handles.TotalVolumeText, 'String',['See Matlab Window for Area Measures']); set(handles.NormalizedVolumeText, 'String',[' ']); data(2,3:18) = {sprintf('%0.4f', contourarea_NoTopCapmm),sprintf('%0.4f', connectedarea_NoTopCapmm),... sprintf('%0.4f', TopHalfContourArea), sprintf('%0.4f', TopHalfConnectedArea), sprintf('%0.4f', BottomHalfContourArea), sprintf('%0.4f', BottomHalfConnectedArea), sprintf('%0.4f', WholeContourArea), sprintf('%0.4f', WholeConnectedArea),... sprintf('%0.4f', TopRatio), sprintf('%0.4f', BottomRatio), ... sprintf('%0.4f', MinimumConnectedRatio), sprintf('%0.4f', mingray), ... sprintf('%0.4f', TopHalfAreaMineral), sprintf('%0.4f', BottomHalfAreaMineral), sprintf('%0.4f', WholeAreaMineral), sprintf('%0.4f', WholeAreaMineral/WholeConnectedArea)}; pathname = handles.pathname; [file, path] = uiputfile('*.xls', 'Save Excel File', pathname); xlswrite([path file], data, 'sheet1'); pause(0.01) close(h) pause(0.01) beep on pause(0.5) beep off end % - - - - - - - - - - - - - - - - - - - - - % use this script to light the 3D surface rendering % of the output of the connectivity by surface area % I.e. adds lighting to figure of UnionRatio function UASurfaceLightingScript() % save original figure first!! global lighthandle; if isempty(lighthandle) lighthandle = camlight; end axis off lighting phong j = colormap(jet); j(1:end, 1:end) = 0; j(1,3) = 0.5; j(2:end,1) = 0.9; colormap(j); lighthandle = camlight(lighthandle, 'headlight'); ka=0.3; kd=0.7; ks=0.5; n=15; sc=1; material dull % material([ka kd ks n sc]) ; % sets the ambient/diffuse/specular strength, % specular exponent, and spec ular color reflectance of the objects. end

169
7.2 APPENDIX B: PTH FOR FRACTURE HEALING LITERATURE REVIEW
Authors Year Animal Model / Age
Injury Model
PTH Treatment Other Treatments/Variables
Major Findings
Andreen 1983 Sprague‐Dawley Rats (male)
Closed tibial fractures
Parathyroidectomy vitamin D for rescue of PTX?
Parathyroidectomy impairs fracture healing and resulted in non‐unions, Vitamin D could not rescue it much.
Centrella 1989 PTH modulates TGF‐b activity and binding in osteoblast enriched cell cultures
Fang 1996 Rats Critical osteotomy filled with GAM
PTH(1‐34) plasmid + BMP‐4 plasmid
Combination therapy of BMP‐4 and PTH gene increased bone formation greater than BMP‐4 alone
Andreassen 1999 Female Wistar Rats
Closed tibial fractures
60 μg/kg PTH or 200 μg/kg PTH for 20 or 40 days
at 20 days, only 200μg/kg PTH enhanced fracture healing strength (to 14% of contralat.) with larger callus of higher BMD (DEXA)
3 months old
at 40 days, both significantly enhanced fx strength (to 47% of contralat.)
contralat tibia sig. 15% stronger after 40 days of 200μg/kg
Kim 1999 Ovariectomized Rats
Bilateral tibial shaft fractures
PTH(1‐84) 17‐estradiol
PTH improved morphometric and mechanical parameters dose dependently
17‐estradiol (bone‐resorption inhibiting agent) did not benefit healing

170
Bostrom 2000 Male New Zealand White Rabbits
1mm osteotomy in ulna
PTHrP analog Prednisone corticosteroid
PTH reversed the inhibition of bone healing by prednisone to improve radiographic union rate and mechanical strength and stiffness
Skripitz 2000 JBJS
Male Sprague‐Dawley Rats 350g
Bone Chamber in proximal tibial metaphysis
0, 15, 60 or 240μg/kg PTH
sacrificed at 6 weeks
all doses of PTH enhanced cancellous density in the chamber, which correlated linearly with the log([PTH]) dose
distance of bone ingrowth into the chamber was unchanged
Skripitz 2000 Acta Orthop.
Male Rats 350g
Bone chamber in proximal tibial metaphysis
60μg/kg PTH time sequence studies with endpoints at 2, 4, 6 weeks
chamber cancellous density decreased in control animals, while PTH treated density increased over time
slight increase in bone ingrowth depth
Andreassen 2001 Old Wistar Rats
Tibial fracture
200 μg/kg PTH for 3 or 8 weeks
at 21 and 56 days, the fractures were sig. stronger with more mineral and greater girth bu pQCT
27 months old (2.25 yr)
56 day fx tibia were >2x stronger than contralateral!
Neer 2001 Women Postmenopaus
placebo, 20, or 40 μg of PTH
rate of new vertebral fxs was 14% (64 of 448), 5% (21 of 444) and 4% (20 of 434) respectively
relative risk of fracture to placebo were 35% and 31%
171
non‐vertebral fxs rates were 6%, 3%, 3% respectively
BMD (DEXA) increased by 9% (20μg/kg)and 13% (40μg/kg) over placebo in the vertebrae
BMD (DEXA) increased by 9% and 13% over placebo in the vertebrae and by 3% and 6% in femoral neck, and 2% and 4% in whole body
Skripitz 2001 Male Rats Steel screw implant into proximal tibia
60μg/kg PTH implant fixation strength and bone fraction were significantly greater at 2 and 4 wks
Nakajima 2002 Sprague‐Dawley Rats
Closed femoral fractures
2, 10, 50, 100 μg/kg PTH
Minimum effective dose for fracture healing: 10μg/kg
2 months old
10μg/kg PTH PTH stimulated osteoprogenitors in periosteum at the fx site at day 2, but not later
PTH increased osteoclast index at day 7, but not later
increased gene expression of marker for differentiated osteoblast
IGF‐1 expression levels greater in PTH treated animals
Vahle 2002 Fisher 344 Rats
5, 30 and 75 μg/kg PTH
all doses caused substantial increase in bone mineral
6‐8 weeks, given for 2 years
no injury Trabecular Hypertrophy, filling of intramedullary space, increased extramedullary hematopoesis (enlarged spleen, liver)

172
All bone proliferation lesions (osteosarcoma, osteoblastomas) observed were in PTH treated animals
(no placebo treated animals had cancer)Chen 2003 Adultmale
Sprague‐Dawley Rats 450 ‐ 550g
critical femure osteotomy filled with gene activated matrix
Local PTH plasmid by GAM plus systemic PTH injected
combination therapy improved the bone mineral in the 5mm osteotomy gap over systemic PTH.
Okazaki 2003 Rats fracture PTH/IGF‐1 interaction Zhuo 2003 C57Bl/6
Mice Ovariectomy
40μg/kg PTH or vehicle started 4 weeks after OVX
ovariectomy
normal mice PTH induced bone volume changes: Vertebrae > proximal tibia trabec >> tibia diaphysis
10 wk females
sham or after after sham surgery
OVX mice +/‐ PTH: OVX caused slight reduction in prox tib BVF which was not affected by PTH. OVX caused reduction in vertebral BVF which was sig improved with PTH. No change in tibia diaphysis due to OVX, slightly improved with PTH treat.
comparing axial and apendicular bone loss and formation rate due to PTH treatment suggested that the number of bone surface areas in a given region explained these changes in BVF

173
Andreassen 2004 Female Wistar Rats
tibial fracture
intermittant Systemic PTH 8 wks after Fx followed by 8 wks of withdrawl
PTH increases fracture strength by 8 weeks. After 16 weeks, there is no difference in mechanical props.
3 months old
Callus strength continues to increase during the next two weeks even after withdrawl of treatment of PTH
at 16 weeks, treated and untreated fracture mechanics are equal
Seebach 2004 Sprauge‐Dawley Rats
Distraction osteogenesis of the femur
60μg/kg PTH PTH increased strength, stiffness, callus volume, callus BMC and density relative to untreated.
3 months old
Contralateral femur also slightly stronger
PTH could be useful to shorten the distraction osteogenesis consolidation time.
Alkhiary 2005 Sprauge‐Dawley Rats
closed femur fracture
5μg/kg and 30μg/kg PTH (1‐34) for up to 35 dayds
30μg/kg increased bone content and density and percent of cartilage in callus, resulting in greater max torque and stiffness slightly by 21 days
450g 5μg/kg increased the callus bone content and mechanics
higher strength and bone mineral content was maintained at day 84 even after withdrawl of 30μg/kg since day 35
174
no increase in osteoclast density in callus (actually, slightly decreased)
Komatsubara
2005 Female Sprauge‐Dawley Rats
osteotomy at 8 weeks old
PTH 10 μg/kg or 30 μg/kg initiated 3 wks before osteotomy
after fx, PTH treatment was either withdrawn or continued should PTH treatment for Osteoporosis be stopped or continued after fx?
animals receiving PTH 3 wks before osteotomy were better off if they continued to received PTH, especially at 30μg/kg
5 weeks old
New bone formation and the conversion from woven to lamellar bone was improved with PTH treatment after osteotomy, and the ultimate load in 3 point bending was greater by 12 weeks with 30μg/kg but not before, and not with 1μg/kg
there is no reason to terminate PTH treatment when a fx occurs, infact it's better to maintain treatment
Nakazawa 2005 Sprague‐Dawley Rats
Femur fracture
10μg/kg PTH (1‐34) given to half of fractured animals
PTH enhanced cartilage area in Fx at day 14 (but not at day 7, 21, 28)
2 month old
PCNA (proliferating cell nuclear antigen) staining showed PTH stimulated mesenchymal area of fx. At day 4 & 7, but in the cartilage area of fx. ‐ suggesting PTH stimulates stem cells greater than chondrocytes
Sox9 and Col 2 upregulated a little

175
also looked at High dose PTH on growth plate for 2 weeks
Slight, insignificant change in growthplate length with 20μg/kg. GP hypertrophic zone length was significantly greater after 2wks of 400μg/kg, and 800μg/kg. Administering 800μg/kg does not yield more growth plate than 400 .
Pettway 2005 C57Bl/6 BMSC donors implanted into Nude mice
subcutaneous BMSCs on gelatin sponges
harvested after 1, 3, and 7 wks of PTH 30μg/kg treatment
also studied gene expression after transient (8hr) PTH treatment on day 7 and 14
ossicles from mice treated for 3 weeks had much greater mineralization, but by 7 weeks they were equivalent to ossicles in untreated mice, suggesting the ossicles the effect of PTH on BMSCs is temporally dependent probably due to differentiation stage and that they are particularly responsive to PTH for the 1st 4 weeks
4‐8 weeks old
3 weeks of PTH treatment initiated 12 weeks after implantation only stimulated a small increase in mineral content.
Aleksyniene 2006 Female New Zealand White Rabbits
Distraction osteogenesis of the tibia
5 or 25μg/kg PTH Callus size, BMD, BMC, trabecular measures was increased dose dependently with PTH treatment
6‐8 months old
25 μg/kg PTH was significantly more effective than 5 microg/kg/day PTH(1‐34)
Gabet 2006 Male Sprague‐Dawley Rats
Threaded titanium implant in metaphysis
5, 25 or 75 μg/kg/day
Ti rods were implanted 7 weeks postorchie
25 and 75μg/kg PTH improved implant fixation after 8 weeks

176
ctomy
5 months old
PTH improved trabecular bone structural indicies and the surface osteointegration was improved
Abe 2007 Male Sprague‐Dawley Rats
Spinal fusion with morselized autograft
40μg/kg PTH spinal fusion rate was greater with PTH treatment by 14 days, fusion mass was larger and denser at 14, 28 and 42 days
8 weeks old
PTH stimulated bone formation and bone resorption gene expression in the fusion mass
number of osteoclasts in fusion mass was increased with PTH treatment at D24 and 42
Gardner 2007 Male C57Bl/6 Mice
open osteotomy
30μg/kg PTH treated on days 5 ‐ 18, then sac'd)
daily, cyclic, compressive loading (on days 5‐18, then sac'd)
PTH induced osteoblast osteoid production
10 weeks old
Loading induced osteoclastic activity
PTH+Load lead to higher callus BMD and BVF and synergy was suggested as relavent, but PTH alone improved bending strength

177
Hashimoto 2007 Male Lewis Rats
Live vascularized isogenetic allograft for arthrodesis
10 or 100 μg/kg PTH
followed by 2μg/kg Zolendronic Acid for 4 weeks
PTH increased serum bone formation markers, ZA supressed both resorption and formation markers.
12 wks old 4 wks PTH followed by vehicle improved grafted bone strength but not as much as 8wks of PTH treatment, or 4wks PTH followed by ZA for 4wks which were relatively equivalent
conclusion: treatment with ZA following PTH treatment maintains bone density and strength equally well as continued PTH treatment
Kakar 2007 Male C57Bl/6 Mice
Closed femoral fractures
30μg/kg PTH (1‐34) for 14 days
PTH enhanced fracture callus volume at D14, especially cartilaginous volume
8 weeks old
PTH enhances chondrocyte genes and cause them to peak earlier (Sox9) to a slightly greater extent than the osteogenic genes (RunX2, Osterix)
PTH enhanced chondrocyte hypertrophy (Sox5 and ColX)
PTH enhanced Wnt 5a expression in callus from days 2 ‐7
PTHrP and IHH signalling are also enhanced in the callus
any increase in B‐Catenin levels were not conclusive

178
Manabe 2007 Cynomolgus Monkeys Female
femoral osteotomy
0.75μg/kg or 7.5μg/kg 2x/wk initiated 3 weeks before osteotomy
not sacrificed until after 6 months
Hi dose PTH improved material strength and modulus but had no effect on whole bone mechanics
18 or 19 years old
Callus area of PTH treated was slightly less, %bone area in callus was significantly greater
Osteoclast number within the callus dose was reduced dose dependently with increasing PTH
Hi PTH increased mineral aposition rate and activation frequency
Rozen 2007 Female Wistar Rats
tibial fracture
1ug, Local PTH(1‐34) on day 4,5,6 post fx
followed by local IL‐6 + IL‐6 soluble receptor on day 7, 9, 11 with 3 different doses
callus volume: control < IL‐6 < PTH(1‐34) == PTH(28‐48) < PTH(1‐34)+IL6+R == PTH(28‐48)+IL6+R
200 ‐ 250g or 0.2ug or 1ug local PKC‐specific PTH(28‐48), day 4, 5, 6
mechanical strength: control == PTH(1‐34) < PTH(28‐48) < PTH(28‐48)+IL6+R < PTH(1‐34) + IL6+R
PTH during cartilage anlage formation induced cartilage
activation of osteoclasts by IL‐6 accelerates callus remodelling
Trisidis 2007 New Zealand white rabbits
Metaphyseal wedge osteotomy filled with b‐
systemic PTH 10μg/kg, vs 40μg/kg vs local 200ng OP‐1
Only local OP‐1 improved torsional strength, stiffness and bone mineral content

179
16 weeks old
TCP
Low dose PTH had the greatest increase in BMC but did not improve strength.
hi dose PTH had little effect on BMC or mechanics
Aspenberg 2008 Sprague‐Dawley rats 295‐481g
Screw insertion into the tibia
Daily Injections of PTH
Screw coating with Bisphosphonates
The combined treatment signficantly increased screw pullout force and energy
11 weeks old
(Unkown dose) Pamidronate (300 ng/cm2) and Ibandronate (340 ng/cm2)
PTH+Bisphos > PTH > Bisphos > Untreated Controls
Iwaniec 2008 Male Sprague‐Dawley Rats
Demineralized bone matrix ectopic bone formation cylinders
1μg/kg PTH (very low!)
Chronic alcohol abuse
Alcohol consumption decreased whole body BMC, PTH enhanced whole body BMC, but not on periosteal bone nor within the chamber. Alcohol impaired bone formation and reduced the benefits of PTH treatment
3 months old
sac'd at 6 wks
BMC: Alcohol < Control == PTH+Alcohol < PTH
Johansson 2008 Sprague‐Dawley rats
steel screws and steel rod implanted into the
60μg/kg PTH withdrawl of PTH after 2 weeks of treatment,
PTH treated animals had greater implant pullout strength up to 8 days after PTH withdrawl, afterwhich there was no difference

180
tibial metaphysis
or replaced with 500μg/kg Pamidronate
12 weeks old
At 3 weeks after PTH withdrawl, Pamidronate treatment maintained twice the pull out strength of animals with 2wks of PTH followed by no treatment.
Kaback 2008 C57BL/6 mice
closed femoral fractures
40μg/kg PTH cell culture marrow MSCs from mice treated with PTH were more osteoblastic probably through induction of Osterix and Runx2 expression
7‐9 weeks old
Osterix and RunX2 genes were upregulated in the fractures of PTH treated aminals along with early Col2 and Col1
Nozaka 2008 Female Wistar rats
osteotomy 100μg/kg PTH once per week
+/‐ OVX PTH increased cancellous bone volume by stimulating bone formation in both normal and OVX rats and suppressed adipocyte marrow volume
7 months old
PCNA Proliferating cell number was 2‐3 fold greater with PTH treatment, especially at the osteotomy site
Pettway 2008 Morgan 2008 New
Zealand white rabbits
Metaphyseal wedge osteotomy filled with b‐
Half of them got 10μg/kg PTH
200μ into half the b‐TCP scaffolds to
rhBMP7 had little effect on bone formtion, torsional or compressive strength with or without PTH treatment. PTH+BMP7 was not sig. greater than PTH alone.
181
TCP study the combination
Vahle 2008 Cynomolg
us Monkeys Female (OVX)
no injury half got 5ug/kg PTH for 18 months
studied for 18 months and 4.5 years
18 months of PTH caused no neoplasms (observed for 3 years after treatment also)
PTH improved BMD in vertebrae and femoral neck after 18 months of treatment, but the effect in the vertebrae was lost after 3 years, while the femoral neck retained increased BMD due to PTH even after 3 years after treatment termination.

182