structural and electrochemical study of binary copper ... · structural and electrochemical study...
TRANSCRIPT
Available online www.jocpr.com
Journal of Chemical and Pharmaceutical Research, 2015, 7(4):1175-1186
Research Article ISSN : 0975-7384
CODEN(USA) : JCPRC5
1175
Structural and electrochemical study of binary copper alloys
corrosion in 3% NaCl solution
Laidi Babouri1, Kamel Belmokre
1, Abdenour Kabir
1, Abdesselam Abdelouas
2
and Yassine El Mendili*2
1Departement des sciences de la matière, faculté des sciences,Université du 20 aout 1955-Skikda, Algérie
2SUBATECH, CNRS-IN2P3, Ecole des Mines de Nantes-Université de Nantes, 4 rue Alfred Kastler, BP 20722,
44307 Nantes cedex 03, France
_____________________________________________________________________________________________
ABSTRACT
The interaction of binary copper alloys with aggressive environment may results in the formation of an adhering
and protective film with time. In the present study, we investigated the corrosion of the Cu-Zn (brass) and Cu-Ni
(cupronickel) alloys in 3% NaCl environment to simulate the sea waterdesalinationplants conditions. Alloys
corrosion was investigated by electrochemical tests and weights loss measurements. The morphology and the nature
of corrosion products formed at open circuit potential in 3% NaCl solution were analyzed using scanning electron
microscopy and confocal micro-Raman spectroscopy. The results show the formation of Cu2O, CuO, Cu3Zn(OH)6Cl2
and ZnO for the brass, while for the cupronickel, the corrosion products show the incorporation of nickel in the
corrosion products (Cu2O, CuO, Cu3Ni(OH)6Cl2 and NiO), which reduce the denickelisation of Cu-Ni alloy. Our
results clearly show that the copper-nickel alloy is more resistant towards corrosion in NaCl environment than
copper-zinc alloy.
Keywords: Copper alloys, 3% NaCl, corrosion, electrochemical techniques, structural characterisation.
_____________________________________________________________________________________________
INTRODUCTION
Pure copper is rarely used as a corrosion resistant material within the marine environment. Copper-based alloys,
however, such as the copper nickel, aluminum and zinc, have an extensive range of marine applications. The
corrosion of copper and its alloys has been widely studied in chloride media where it has been observed that the
chloride ion has a strong influence on the copper corrosion mechanism [1].
Binary alloys of copperare widely used in industry, mainly in the seawater desalination plants, due to their
outstanding physical and mechanical properties [2]. However, these materials are not thermodynamically stable and
are vulnerable to corrosion in contact with an aggressive environment [3]. The result of their interactions is the loss
of some or all of their essential properties. They may also be subject to some form of corrosion such a spitting
corrosion and/or selective dissolution [4-6].
The surface degradation of copper alloys results in the formation of an oxide film and/or adhering hydroxide which
limits the transport of metal ions of the layers interacting with the medium that promoting the protection of the metal
surface [7].
Most studies on binary alloys of copper are focused on understanding the passive film formation mechanism [8], its
quality [9], the influence of some experimental conditions (pH, the applied potential, the polarization time and the
presence of aggressive anions) on its stability [10-15], it sticknesse and its composition [16,17].

Laidi Babouri et al J. Chem. Pharm. Res., 2015, 7(4):1175-1186
_____________________________________________________________________________
1176
Previous studies showed a selective dissolution of brass in chloride environment and concluded that chloride
promotes the dissolution of both copper and zinc [18-20].
The Cu-Ni alloys constitute one of the most appealing Cu-based alloys due to their superior and tuneable mechanical
properties as well as outstanding corrosion resistance. They have been used for many years in seawater, where they
offer high resistance against bio-fouling [21].
The aim of the present work was to study the corrosion behavior of α-phase for bothCu-Zn and Cu-Ni alloysin
chloride-rich environment with application in the field of sea water desalination and power generation in Algeria.
Electrochemical tests, weight loss measurements combined with structural studies of the corrosion films were
conducted to describe the stability of alloys in aggressive chloride-rich environments.
EXPERIMENTAL SECTION
Copper alloys preparation
The materials used inthis study are a Cu-Ni and Cu-Zn alloys, provided bythe Skikda power plant (Algeria) and
made by SNC-Lavalin Group Inc (Canada). These alloys are used for a wide range of applications including
manufacturing of boilers, pressure vessel and pipes transporting hot liquids. The chemical composition of Cu-Zn
and Cu-Ni alloys, obtained by EDX spectroscopy are given in Table 1.
The samples coupons were cut into 15 × 15 × 0.8 mm3 and polished with a Buehler polisher using a PSA discs
(Pressure Sensitive Adhesive discs) to a surface roughness of 0.3 microns.
Table 1: Elementalchemicalcomposition of Cu-Zn and Cu-Ni alloys (in atomic %)
Alloys composition (%)
Cu Ni Zn Al Fe Co Mn
Cu-Zn 76.3 - 20.7 2.9 - <1 -
Cu-Ni 66 30.4 - 2.6 < 1 - <1
Figure 1 shows X-ray diffraction (XRD) patterns of the copper alloys used for this study. The crystallographic
analysis confirmed unambiguously the characteristic lines of only the α-phase for both Cu-Zn and Cu-Ni alloys [22].
The diffraction peaks of the samples are indexed to cubic crystal structure of CuNi with space group Fm-3m
(JCPDS Card No: 03-065-7246). Indeed, for Cu alloy with a copper content higher than 63 %, alloy has single
phased micro structure with α-crystals only.
10 20 30 40 50 60 70 80 90 100
(222)
(311)(220)
(200)
Inte
ns
ity (
a.u
.)
2
CuZn alloy
CuNi alloy
(111)
(222)
(311)(220)
(200)
(111)
Figure 1: X-ray diffractograms of the Cu-Ni and Cu-Zn alloys surface before corrosion

Laidi Babouri et al J. Chem. Pharm. Res., 2015, 7(4):1175-1186
_____________________________________________________________________________
1177
Corrosion experiments
The copper alloys coupons were immersed in100 ml of 3% NaCl in static mode for 15, 30, 60 and 90 daysat room
temperature. Thechoice of 90 days is motivated bymonitoring thestability of the filmformedonthecopper alloys
surface as described intheliterature [23]. According to the ASTM standard method for corrosion measurement
(ASTM, 1966), the alloys coupons were then cleaned with HCl (15%) and sodium carbonate (5%) andfinally
driedbyaforced airflow before experiments.
Electrochemical analysis
The electrolytic medium employed for the electrochemical tests is a 3% NaCl solution to simulate the sea water. The
solution was obtained by dissolving 30 g of sodium chloride crystalline powder in 1L of distilled water and then
stirred by a magnetic bar to have a homogeneous solution. The pH of the resulting solution was approximately
neutral.
The electrochemical studies were carried out using potentiostat/galvanostat (model PGZ 301). Acquisition and basic
treatment of spectra have been made with the VoltaMaster 4 software connected to a thermostated double-walled
electrochemical cell.
A conventional three-electrode electrochemical cell of 400 mL was used. The cell assembly consisted of a platinum
foil as counter electrode (CE), saturated calomel electrode (SCE) as reference electrode (RE) and Brass or
cupronickel as working electrode with an exposed surface area of 1 cm2 embedded in a chemically inert resin.
We applied to the studied samples a cathodic potential of -500 mV/SCE immediately after the introduction of the
solution. The application of a cathode potential prevents the alloys to be passivated before testing. The sample is
kept at the cathodic state for quarter hour before each test; which allows having the same surface condition and then
ensuring good reproducibility. Polarization curves were obtained in a scanning field (-1000 to 300) mV/SCE. The
potential was incremented by 0.5 mV/s.
Weight loss measurements.
For all experiments, the corrosion rate was determined according to the ASTM standard method for corrosion
measurement, the corrosion layer was pickled with HCl (15%) and isopropanol with 5mg/Lof
hexamethylenetetramine to inhibit further corrosion [24].
The corrosion rate can be calculated using the following formula:
Corrosion rate (micron/year):(days)Timex)(cmAreax)(g/cmDensity
(mg)lossweightx365023
(1)
With a density of 8,4 g/cm3 for brass and 8,9 g/cm
3 for cupronickel.
Chemical and surface analysis
At the end of reaction time, 10 mL of the solution was syringe-filtered using 0.2 μm polypropylene filter
(Whatman). The solution was then analysed by atomic absorption spectrophotometer (Shimadzu 6680) equipped
with an atomizer driven by the software running on the double beam principle, which avoids suffering the lamp
fluctuations. The problems inherent in the measurement of a signal will be detected first, and thereafter, we measure
the concentrations of copper, nickel and zinc dissolved in 3% NaCl after immersion for various times.
The morphology and chemical composition of the corrosion products were investigated using an Energy Dispersive
Spectroscopy (EDS) coupled to a Scanning Electron Microscope (SEM). The analyses were done under an
accelerating voltage of 15 kV. The Si(Li) detector used was equipped with a thin beryllium window that allows to
detect and quantify oxygen.
The characterization of both alloys surface was achieved by X-ray diffraction and micro-Raman analysis. Single
crystal powder X-ray diffraction pattern was recorded at room temperature using a Siemens D500 diffractometer in
a Bragg- Brentano geometry using Cu-Kα1 radiations (1 = 1.54051 as X-ray source (cold cathode Crookes tube)).
This latter is generated by a 2200 W copper anode (from Siemens, KFL CU 2K model, maximum potential: 60 kV).
The data were collected in the range 5° to 100° in 2θ with a 0.02° 2θ-step and a count time of 20s per step.
Laidi Babouri et al J. Chem. Pharm. Res., 2015, 7(4):1175-1186
_____________________________________________________________________________
1178
The thick layers of corrosion products have been characterised by Raman spectroscopy. Raman spectra were carried
out on the surface of Brass and cupronickel couponscorrodedfor 90 days in 3% NaCl solution at free potential and
under aerated conditions. The Raman experiments were performed at room temperature using a T64000 Jobin-
Yvon/Horiba spectrometer equipped with a 600 lines/mm diffraction grating and a nitrogen cooled CCD detector.
The Raman spectra were recorded under a microscope (Olympus Bx41) in the back scattering geometrywith a 100x
objective focusing the 514 nm line from an Argon–Krypton ion laser (coherent, Innova).The spot size of the laser
was estimated at 0.8 μm and the spectral resolution at 2 cm-1
. Single spectra were recorded twice in the wavenumber
80-2000 cm-1
region with an integration time of 600 s. Acquisition and basic treatment of spectra have been made
with the LabSpec V5.25 (Jobin Yvon-Horiba) software. Raman measurements were carried outat verylow laser
powerto minimize possible sample deterioration or phase transition with operating time.
RESULTS AND DISCUSSION
Electrochemical study
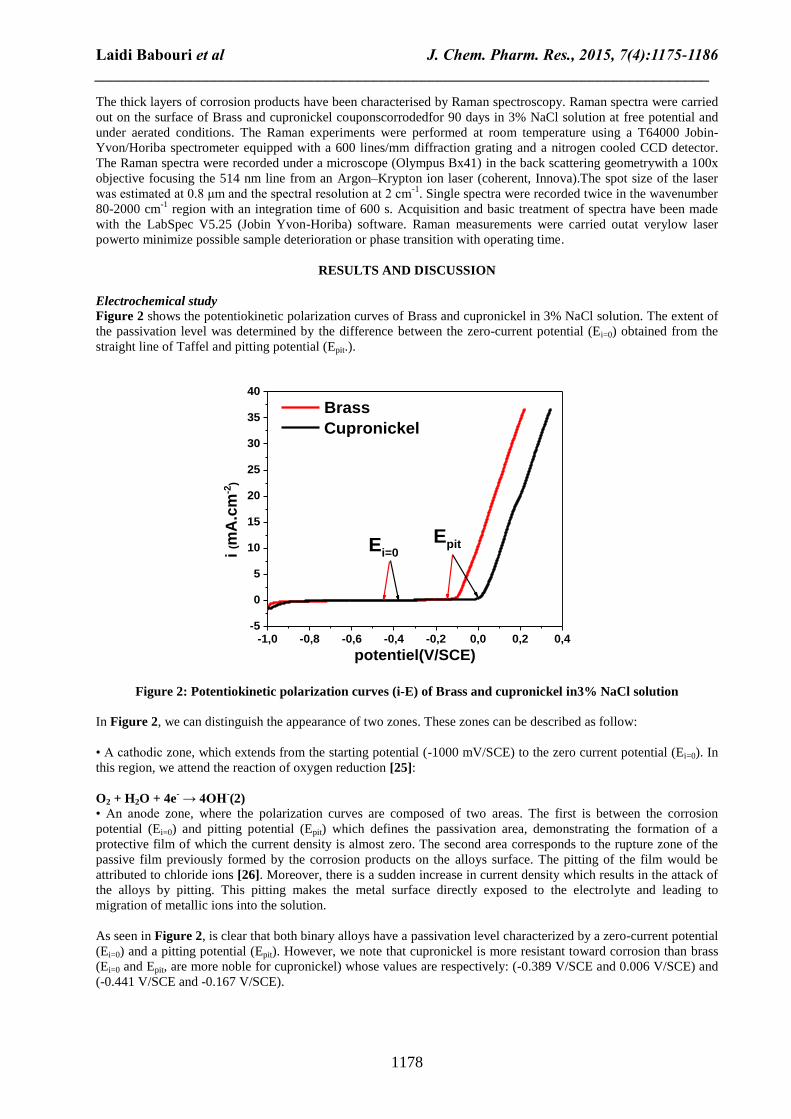
Figure 2 shows the potentiokinetic polarization curves of Brass and cupronickel in 3% NaCl solution. The extent of
the passivation level was determined by the difference between the zero-current potential (Ei=0) obtained from the
straight line of Taffel and pitting potential (Epit.).
-1,0 -0,8 -0,6 -0,4 -0,2 0,0 0,2 0,4-5
0
5
10
15
20
25
30
35
40
Ei=0
Brass
Cupronickel
Epit
i (m
A.c
m-2
)
potentiel(V/SCE)
Figure 2: Potentiokinetic polarization curves (i-E) of Brass and cupronickel in3% NaCl solution
In Figure 2, we can distinguish the appearance of two zones. These zones can be described as follow:
• A cathodic zone, which extends from the starting potential (-1000 mV/SCE) to the zero current potential (Ei=0). In
this region, we attend the reaction of oxygen reduction [25]:
O2 + H2O + 4e- → 4OH
-(2)
• An anode zone, where the polarization curves are composed of two areas. The first is between the corrosion
potential (Ei=0) and pitting potential (Epit) which defines the passivation area, demonstrating the formation of a
protective film of which the current density is almost zero. The second area corresponds to the rupture zone of the
passive film previously formed by the corrosion products on the alloys surface. The pitting of the film would be
attributed to chloride ions [26]. Moreover, there is a sudden increase in current density which results in the attack of
the alloys by pitting. This pitting makes the metal surface directly exposed to the electrolyte and leading to
migration of metallic ions into the solution.
As seen in Figure 2, is clear that both binary alloys have a passivation level characterized by a zero-current potential
(Ei=0) and a pitting potential (Epit). However, we note that cupronickel is more resistant toward corrosion than brass
(Ei=0 and Epit, are more noble for cupronickel) whose values are respectively: (-0.389 V/SCE and 0.006 V/SCE) and
(-0.441 V/SCE and -0.167 V/SCE).

Laidi Babouri et al J. Chem. Pharm. Res., 2015, 7(4):1175-1186
_____________________________________________________________________________
1179
In order to understand the behavior of the two alloys, we study the evolution of the passive film versus time using
the polarization curves. Immersion periods used for this study are: 15, 30, 60 and 90 days.
Figure 3 illustrates the polarization curves of brass and cupronickel in 3% NaCl solution for various immersion
times. The values of the zero-current potential (Ei=0) and the pitting potential (Epit) corresponding are summarized in
Table 2.
Figure 3: Evolution of polarization (log I = f (E) of alloys in 3% NaCl solution as a function of time immersion: (a) brass (b) cupronickel
Table 2: Values of zero-current and pitting potentials in the CuZn and CuNi alloys as afunction of time immersion
Immersion time (jours)
Brass Cupronickel
Ei=0
(V/SCE) Epit
(V/SCE) Epit.-Ei=0
(V/SCE) Ei=0
(V/SCE) Epit
(V/SCE) Epit.-Ei=0 (V/SCE)
15 -0.422 -0.170 0.252 -0.279 0.007 0.286
30 -0.333 -0.160 0.173 -0.264 0.010 0.274
60 -0.283 -0.170 0.113 -0.247 0.020 0.267
90 -0.270 -0.125 0.145 -0.233 0.031 0.264
Figure 3 shows a positive trend in zero-current potential as a function of immersion time for both alloys. After 90
days of immersion, the values obtained are -0.270 V/SCE for brass and -0.233 V/ SCE) for cupronnickel. The same
observation is true for pitting potential.
The potential values (Ei=0 and Epit) show the progressive formation of the passivation film as a function of time
(Table 2).
In the early time of immersion (Figure 3a and 3b), the analysis show the presence of dissolution attack of alloys
surface, which result in the cations transfert from metal into solution. However, when the corrosion layer was
formed and becomes more stable and increasingly resistant with time immersion; this will limit the current flow at
the material-electrolyte interface.
The formed film is probably consisting of adsorbed species, such as copper oxide (Cu2O and CuO) for both alloys,
nickel oxide NiO for cupronickel and ZnO for brass with a inhibitroy effect [30-33].
We can deduce that brass and cupronickel have a similar electrochemical behavior. However, the study conducted
on these materials showed that brass is less resistant in NaCl environment than the cupronickel. The low resistance
of brass against corrosion by pitting is probably due to a formation of ZnO in the passive layer [26-29].
The results obtained by the electrochemical method were corroborated by the physicochemical study (analysis of the
solution and structural characterization of the alloys surface).
Solution analysis
The solutions were analyzed by atomic absorption spectrophotometery to determine the concentration of Cu, Ni and
Zn leached from the submerged samples. The numerical values of weight loss (NL) measured after each time aging
and the factor corresponding to dezincification (DZ) and denickelfication (DN) factors are presented in Table 3.

Laidi Babouri et al J. Chem. Pharm. Res., 2015, 7(4):1175-1186
_____________________________________________________________________________
1180
The(DZ) and (DN) factors were calculated usingthe following formulas [34]:
all
SolZ
Cu
Zn
Cu
Zn
D (3)
all
Sol
Cu
Ni
Cu
Ni
DN (4)
Where: (Zn/Cu)sol : the concentration ratio of Zn/Cu in solution, (Zn/Cu)all : the ratio of Zn/Cu in the alloy (%
weight), (Ni/Cu)sol : the concentration ratio of Ni/Cu in solution and (Ni/Cu)all : the ratio of Ni/Cu in the alloy (%
weight).
Table 3: Results of the solution analysisby atomic absorption spectrophotometery for copper alloys in 3% NaCl solution
Time aging (days) Cu-Znalloy Cu-Nialloy
Cu (g/m2) Zn (g/m2) DZ Cu (g/m2) Ni (g/m2) DN
15 1.046 6.973 25.20 0.560 0.118 0.474
30 1.064 5.320 18.90 1.401 0.295 0.473
60 1.857 3.714 7.56 1.542 0.324 0.472
90 1.902 2.113 4.20 1.823 0.384 0.474
The analysis of the solutions after immersion of two alloys, revealed the presence of copper and zinc for brass and
the presence of copper and nickel for the cupronickel. For brass, the zinc element is preferentially released compared
to copper. The zinc concentrations in solution are more important than those of copper during the tests. We
emphasize that the dezincification factor decreased with increasing immersion time: from a rate of 25.2 within the
first 10 days to 4.2 after 90 days. The immersion of the brass in 3% NaCl solution results in the dezincification.
Indeed, Brass is subject to selective corrosion, and the zinc which possesses a more negative standard potential
compared to Cu is preferentially leached out of the brass leaving behind a brass matrix enriched in Cu.
The continuous dissolution results in the formation of a film composed of oxides of ZnO and Cu2O [35-37], which
lead with time immersion to a slowdown of the selective dissolution of zinc, due to a formation of protective layer
on brass surface.
In the case of cupronickel, we can show the absence of competitiveness between the elements constituting the alloy.
The dissolution of copper is accompanied by that of nickel. Moreover, there is a consistency of denickelfication
factor. Unlike with the brass, in the case of Cu-Ni alloys, the nickel is retained in the oxide layer, and the presence
of copper-nickel oxide prevents further nickel dissolution.
The pH of the solution before and after sample immersion remained stable, around 6.9 for Cu-Ni and 7.3 for Cu-Zn
alloy. This indicates that the pH does not play a significant role on the corrosion kinetics.
During the previous section, we highlighted by electrochemical techniques, the formation of a passive film on both
brass and cupronickel in 3% NaCl solution after 90 days. However, the precise identification of the corrosion
products requires the use of other complementary surface analysis tools such as SEM and Raman spectroscopy.
Weight Loss and Corrosion Rate
The corrosion rate calculated from weight loss after 90 days of immersion in 3% NaCl solution are 41.9 µm/year for
brass and 13.9 µm/year for cupronickel. This result confirmed that the brass is less resistant to corrosion in NaCl
environment compared to cupronickel. The high corrosion rate observed can be attributed to a high dissolution of
zinc.
The low corrosion rate for cupronickel is probably due to a formation of a thin protective layer which protect the
alloy from further corrosion.

Laidi Babouri et al J. Chem. Pharm. Res., 2015, 7(4):1175-1186
_____________________________________________________________________________
1181
SEM analysis
Figure 4 shows the scanning electron micrographs of Cu‐Zn and Cu‐Ni alloys before and after 90 days of corrosion
testing in 3% NaCl solution.
Figure 4 : SEM photographs of Cu‐Zn and Cu‐Ni alloys; (a) & (b) represent the uncorroded Cu‐Zn and Cu‐Ni, respectively; (a1, a2) &
(b1, b2) represent the corroded Cu‐Zn and Cu‐Ni in 3% NaCl solution after 90 days, respectively
These SEM photographs show the development of a corrosion layer on the surface of Cu-Zn and Cu-Ni (Figure 4-
a1 and b1) after 90 days. The layer formed on the Cu-Zn alloy exhibits intergranular corrosion (Figure 4-a2). This
layer enriched in copper corrosion products due to the de-alloying of zinc. It was reported previously that ZnO is
also more soluble than Cu2O in chloride media and hence dezincification is predicted [38]. The precipitation of zinc
corrosion products as ZnO as well as the copper corrosion products (such as Cu2O and CuO) leads eventually to

Laidi Babouri et al J. Chem. Pharm. Res., 2015, 7(4):1175-1186
_____________________________________________________________________________
1182
limit the selective dissolution of zinc for a long immersion time by covering the maximum of brass surface. The
difference in brightness observed on the image indicates that the layer formed after 90 days of time aging is not
uniform. This phenomenon is related to a dezincification of Zn [38].
The layer formed on the Cu-Ni alloy surface is dark green (CuO2) with shiny grains (NiO) uniformly distributed
over the surface of the alloy. These grains are less dense than those observed in the case of the Cu-Zn alloy (Figure
4-b2). This clearly indicates the mutual contribution of the two oxides (Cu2O and NiO) in the film (low preferential
dissolution of nickel) as has been shown in the electrochemical study.
The EDX spectra of the corroded surface are shown in Figure 5. The EDX analysis of the oxide film formed on the
Cu-Zn alloy reveals the presence of oxygen, copper and zinc, oxygen and chloride. For the case of Cu-Ni alloy, the
analysis of the oxide film revealed the presence of copper and nickel, oxygen and chloride.
Figure 5:EDX spectra of corroded surface: (a) Cu-Zn alloy surface (figure4-a1) and (b): Cu-Ni alloy surface (figure 4-b1)
The composition of the corrosion layer formed on surface in both alloys is summarized in Table 4.
Table 4: Thecomposition of thecorrosion layer formed on surface in both alloys
Elements Cu-Znalloy Cu-Nialloy
Before corrosion After corrosion Before corrosion After corrosion
Cu 76.3 25.7 66.0 31.4
Zn 20.7 4.5 - -
Ni - - 30.4 10.7
Cl - 14.2 - 14.9
O - 43.4 - 42.5
Al 2.9 2.0 2.6 <1
Co <1 - - -
Fe - - <1 <1
Mn - - <1 <1

Laidi Babouri et al J. Chem. Pharm. Res., 2015, 7(4):1175-1186
_____________________________________________________________________________
1183
The corrosion layer formed on brass surface is enriched in copper corrosion products due to the rapid de-alloying of
zinc, while for the cupronickel; the corrosion layer enriched in copper and nickel corrosion products. These results
are in agreement with solution data. Indeed nickel is retained in the oxide layer, and the formation of Cu-Ni oxide
prevents further denickelfication of cupronickel.
The EDX analysis indicates that the layer is composed of a mixture of copper, nickel, chlorine and oxygen for Cu-Ni
alloy (copper, zinc, chlorine and oxygen for brass), but it was not possible to determine the composition of the
oxide. For this purpose we used Raman spectroscopy for the surface microanalysis.
Raman analysis
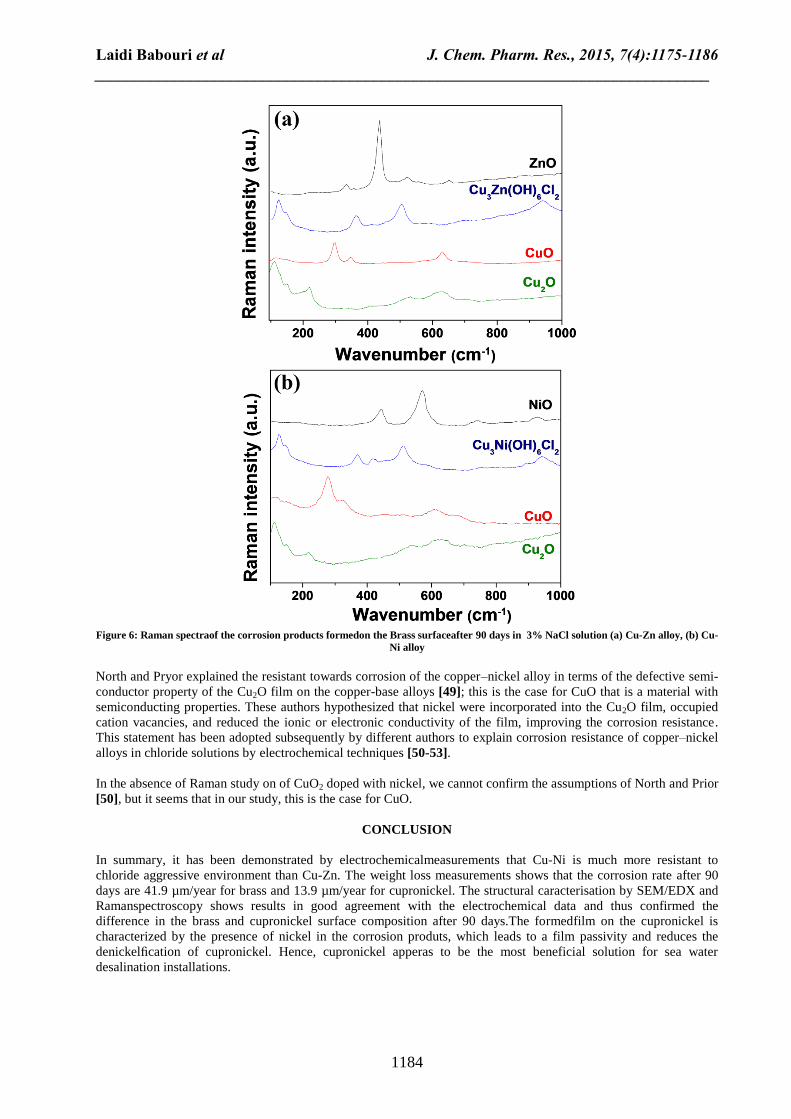
The Raman spectra of the brass coupon surface (Figure 6) show the presence of the vibration mode of the
crystalline Cu2O [39]. Indeed, for Cu2O, five distinct bands located at 113, 147, 215, 415 and 635 cm-1
are expected.
In addition, the weak peaks observed at 308 and 515 cm-1
are commonly assigned to the second-order modes of
Cu2O. The Raman investigations reveal also the presence of the ZnO characterized by the intense vibration mode E2
at 436 cm-1
. The low intensity peaks were observed at 330, 516, 576, and 650 cm-1
. The peaks at 330, 516, and 650
cm-1
are directly associated with the vibration mode caused by multiple-phonon scattering processes [40] and the
peak at 576 cm-1
corresponds to the LO phonon of the A1 mode.
The Raman spectrum of CuO shows very sharp peaks around 296, 345 and 627 cm-1
. The former peak at 296 cm cm-
1 belongs to Ag mode where as two latter peaks at 345 and 627 cm
-1 are assigned to Bg modes of CuO, respectively
which are in good agreement with the previously reported data [41].
In addition, the Raman analysis confirmed the presence of the bands at 120, 145, 365, 509 and 940cm-1
typical of
kapellasite (Cu3Zn(OH)6Cl2) [42],which is the metastable polymorph of herbertsmithite. According to the litterature
[43], Kapellasite can be synthesized from ZnCl2 solution and metallic copper metal. The observation by optical
microscopy confirmed the green color of Kapellasite. A series of minerals related to the Cu2(OH)3Cl polymorphs are
characterized by solid-solution phenomena in the group. Substitution for Cu2+
is known to occur commonly with
divalent Zn, Ni, Co, Mn, Fe and Mg ions [44].
For the cupronickel, our investigations show similar spectra for Cu2O. However, Raman measurements reveal the
presence of NiO and gillardite((Cu3Ni(OH)6Cl2), which is also isostructural with herbertsmithite. The spectrum for
gillardite appears similar to that of herbertsmithite measured by Wulferding et al. [45] and in this study. The
frequency shift of related modes between girraldite and herbertsmithite could be due to solid solution effects caused
by the difference in crystal-chemical behaviour of Ni2+
and Zn2+
[45,46].
For NiO: there are five vibrational bands – one - phonon (1P) TO at 440 cm-1
and LO at 560 cm-1
modes, two-
phonon (2P) 2TO at 740 cm-1
and TO+LO at 925 cm-1
[47].
The presence of Kapellasiteand gillardite clearly showsinteractions betweenchlorine originating from the medium
and the alloys, as indicated by the presence of Zn2+
(or Ni2+
) and Cu2+
in solution (atomic absorption
spectrophotometery analysis). The formation of Kapellasite (or gillardite) may be due to chemical reactions
involving the chloride complexes ZnCl2 (or NiCl2) and Cu(OH)2, according to the reactions:
3Cu(OH)2 + Zn2+
+ 2Cl-→ Cu3Zn(OH)6Cl2 (5)
3Cu(OH)2 + Ni2+
+ 2Cl-→ Cu3Ni(OH)6Cl2 (6)
For cupronickel, the spectral features of CuO are somewhat different to those found on the brass surface but appear
very similar to those reported in a recent study by Chand et al. [48]. These authors report the effect of Ni doping on
the structural and optical properties of CuO nanocrystals at different concentrations of Ni+2
ions (Cu1-xNixO with x =
0.0, 0.05, 0.10, 0.15 and 0.20). Our spectrum is close to that obtained by theses authors for Cu1-xNixO nanostructures
with x = 0.15, with the presence of a shoulder band at 275 cm-1
in addition to a broadening of the Raman modes.
The broadening and downshifts of the Raman peaks are mainly attributed to the quantum confinement effect of CuO
nanostructures.
This result is in good agreement with the EDX analysis (Figure 5). Indeed, the compositions of the layer formed on
the cupronickel surface shows that the corrosion products are enriched in Ni.
Laidi Babouri et al J. Chem. Pharm. Res., 2015, 7(4):1175-1186
_____________________________________________________________________________
1184
Figure 6: Raman spectraof the corrosion products formedon the Brass surfaceafter 90 days in 3% NaCl solution (a) Cu-Zn alloy, (b) Cu-
Ni alloy
North and Pryor explained the resistant towards corrosion of the copper–nickel alloy in terms of the defective semi-
conductor property of the Cu2O film on the copper-base alloys [49]; this is the case for CuO that is a material with
semiconducting properties. These authors hypothesized that nickel were incorporated into the Cu2O film, occupied
cation vacancies, and reduced the ionic or electronic conductivity of the film, improving the corrosion resistance.
This statement has been adopted subsequently by different authors to explain corrosion resistance of copper–nickel
alloys in chloride solutions by electrochemical techniques [50-53].
In the absence of Raman study on of CuO2 doped with nickel, we cannot confirm the assumptions of North and Prior
[50], but it seems that in our study, this is the case for CuO.
CONCLUSION
In summary, it has been demonstrated by electrochemicalmeasurements that Cu-Ni is much more resistant to
chloride aggressive environment than Cu-Zn. The weight loss measurements shows that the corrosion rate after 90
days are 41.9 µm/year for brass and 13.9 µm/year for cupronickel. The structural caracterisation by SEM/EDX and
Ramanspectroscopy shows results in good agreement with the electrochemical data and thus confirmed the
difference in the brass and cupronickel surface composition after 90 days.The formedfilm on the cupronickel is
characterized by the presence of nickel in the corrosion produts, which leads to a film passivity and reduces the
denickelfication of cupronickel. Hence, cupronickel apperas to be the most beneficial solution for sea water
desalination installations.

Laidi Babouri et al J. Chem. Pharm. Res., 2015, 7(4):1175-1186
_____________________________________________________________________________
1185
Acknowledgements
Special thanks to N. Stephant (Institut des Matériaux de Nantes, CNRS/université de Nantes) for the SEM-EDX
measurements.
REFERENCES
[1] M. M. Antonijevic; M. B. Petrovic, Int. J. Electrochem. Sci., 2008, 3, 1-28
[2] C Deslouis; G Mengoli; B Tribollet, J. Appl. Electrochem. Soc. 1983, 130(10), 2044-2046
[3] H Lu, K Gao; W Chu, Corros. Sci., 1998, 40(10), 1663-1670.
[4] VK Gouda; IZ Selim; AA Khedr; AM Fathi, J. Mater. Sci. Technol., 1999, 15, 208.
[5] J Morales; GT Fernandez; P Esparza; S Gonzalez; RC Salvarezza; AJ Arvia, Corros. Sci., 1995, 37, 211-225.
[6] AM Beccaria; ED Mor; G Poggi; F Mazza, Corros. Sci., 1987, 27, 363-372.
[7] HG Bachmann, The identification of slags from archaeological sites, published by the Institute of Archaeology
of London, Occasional Publication No. 6, Institute of Archaeology, London, 1982.
[8] A Giumlia-Mair, Revue De Métallurgie, 2001, 98(9), 767-776.
[9] R Procaccini; WH Schreiner; M Vazquez; S Ceré, Appl. Surf. Sci., 2013, 268, 171-178.
[10] J Kunze; V Maurice; LH Klein; HH Strehblow; P Marcus, Corros. Sci., 2004, 46, 245-264.
[11] G Kear; BD Barker; FC Walsh, Corros. Sci., 2004, 46, 109-135.
[12] TK Mikic; I Milosev; B Pihlar, J. Appl. Electrochem., 2005, 35, 975-984.
[13] J Morales; GT Fernandez; P Esparza; S Gonzalez; RC Salvarezza; AJ Arvia, Corros. Sci., 1995, 37, 211-229.
[14] KM Ismail; RM Elsherif; WA Badawy, Electrochim. Acta., 2004, 49, 5151-5160.
[15] Z Avramovic; M Antonijevic, Corros. Sci., 2004, 46, 2793-2802.
[16] S maroie; R Caudano; G debras; J Verbist, Appl. Surf. Sci., 1980, 4, 466-480.
[17] R Procaccini; M Vazquez; S Cere, Electrochim. Acta., 2009, 54, 7324-7329.
[18] J Morales; GT Fernandez; P Esparza; S Gonzalez; RC Salvarezza; AJ Arvia, Corros. Sci., 1998, 40, 177-190.
[19] L Burzynska; A Maraszewska; Z Zembura, Corros. Sci., 1996, 38, 337-347.
[20] JY Zou; DH Wang; WC Qiu, Electrochim. Acta., 1997, 43, 1733-1737.
[21] M Metikoš-Huković; R Babić; I Škugor Rončević; Z Grubač, Desalination, 2011, 276, 228-232.
[22] F El-Chiekh; MT El-Haty; H. Minoura; AA Montaser, Electrochim. Acta., 2005, 50, 2857-2864
[23] AH Tuthill, Guidelines for the use of Copper alloys in Seawater, Materials performances, September 1987.
[24] Y El Mendili; A Abdelouas; JF Bardeau, J. Mater. Environ. Sci., 2013, 4, 786-791.
[25] HG Jiang; M Ruhle; EJ Lavernia. J. Mater. res., 1999, 14, 549-559.
[26] SAM Refaey, Appl. Surf. Sci., 2000, 158, 190-196.
[27] MV Rylkina; YI Kuznetsov; MV Kalashnikova; MA Eremina, Protect. Met., 2002, 38, 387-393.
[28] MB Valcarce; SR de Sanchez; M Vazquez, Corros. Sci., 2005, 47, 795-809.
[29] T Kosec; I Milosev; B Pihlar, Appl. Surf. Sci., 2007, 253, 8863-8873.
[30] YZ Wang; AM Beccaria; G Poggi, Corros. Sci., 1996, 38, 835-851.
[31] RF North; MJ pryor, Corros. Sci., 1970, 10, 297-311.
[32] C Kato; BG Ateya; JE Castele; HW pickering, J. Electrochem. Soc., 1980, 127, 1890-1896.
[33] G Kear; BD Barker; K Stockes; FC Walsh, J. Appl. Electrochem., 2004, 34, 659-669.
[34] G Trabanali, A Garassiti, Advance in Corrosion Science and Technology, Plenum Press, New York, 1970.
[35] FM Al-Kharafi; YA El-Tatawy, Corros. Sci., 1982, 22, 1-12.
[36] Z Xia; Z Szklarska-smialowska, Corrosion., 1990, 46, 85-88.
[37] AA El Warraky, Br. Corros. J., 1997, 32, 57-61.
[38] O Fruhwirth; GW Herzog; J Poulios, Surf. Technol., 1985, 24, 293-300.
[39] A. Compaan; H. Z. Cummins, Phys. Rev. B., 1972, 6, 4753-4757.
[40] N Ashkenov; BN Mbenkum; C Bundesmann; V Riede; M Lorenz; D Spemann; EM Kaidashev; A Kasic; M
Schuber; M Grundmann; G Wagner; H Neumann; V Darakchieva; H Arwin; B Monemar, J. Appl. Phys., 2003, 93,
126-133.
[41] T Yu; X Zhao; Z X Shen; YH Wu; WH Su, J. Crystal Growth., 2004, 268, 590-595.
[42] GG Rotondo; L Darchuk; M Swaenen; R Van Grieken, J. Anal. Sci. Method. Instrum., 2012, 2, 42-47
[44] JL Jambor; JE Dutrizac; AC Roberts; JD Grice; JT Szymański, Canad. Mineral., 1996, 34, 61-72.
[45] D Wulferding; P Lemmens; P Scheib; J Röder; P Mendels; S Chu; T Han; YS Lee, Phys. Rev., 2010, B 52,
144412.
[46] RL Frost; W Martens; JT Kloprogge; PA Williams, J. Raman. Spectrosc., 2002, 33, 807-806.
[47] E Cazzanelli; A Kuzmin; G Mariotto; N Mironova-Ulmane, J. Phys.: Cond. Matter., 2003, 15, 2045-2052.
[48] P Chand; A Gaur; A Kumar, Appl. Sci. Lett., 2015, 1(1), 28-32
[49] RF North; MJ Pryor, Corros. Sci., 1970, 10, 297-311.
[50] SJ Yuan; SO Pehkonen, Corros. Sci., 2007, 49, 1276-1304.
[51] I Milosev; M Metikos-Hukovic, Electrochim. Acta. 1997, 42, 1537-1548.
Laidi Babouri et al J. Chem. Pharm. Res., 2015, 7(4):1175-1186
_____________________________________________________________________________
1186
[52] M Metikoš-Hukovic; R Babic; I Škugor; Z Grubac, Corros. Sci., 2011, 53, 347-352.
[53] G Kear; BD Barker; K Stokes; FC Walsh, J. Appl. Electrochem., 2004, 34, 659-669.