structural analysis equations
TRANSCRIPT

Structural Analysis EquationsMarco T. Lo Ricco, Research General EngineerM. Omar Amini, Postdoctoral Research Associate, Colorado State University Douglas R. Rammer, Research General Engineer
CHAPTER 9
ContentsDeformation Equations 9–2
Axial Load 9–2Bending 9–2Combined Bending and Axial Load 9–5Torsion 9–5
Stress Equations 9–5Axial Load 9–6Bending 9–6Combined Bending and Axial Load 9–12Torsion 9–12
Stability Equations 9–13Axial Compression 9–13Bending 9–15Interaction of Buckling Modes 9–16
Summary 9–17Literature Cited 9–17Additional References 9–19
Structural analysis mathematically models the physical forces, deformations, and stresses acting within a system. Structural analysis may generally apply to the construction of aircraft, bridges, buildings, furniture, pallets and shipping containers, sculpture, sporting equipment, and tools. In other words, structural analysis is useful in nearly every aspect of wood engineering. The ability to model deformations and stresses under load naturally lends itself to efficient design and, ultimately, effective use of materials.
Analytical models make use of generalized mechanical properties (discussed in Chap. 5) to characterize performance. The repeatability and predictability inherent in the analysis reduces the risk of failures in prototypes and products that serve various markets. Structural analysis, therefore, is typically applied at various stages of design. First iterations focus on preliminary sizing and geometric layout. For existing designs, it is customary to conduct structural analysis as a check of whether the system is adequately stiff and strong.
Determination of loads and other demands on the structure varies across industries. Each industry, furthermore, has established its own criteria for stiffness, strength, and other mechanical characteristics. These criteria may be based on experience or rigorous considerations of structural reliability that account for statistical variability in both structural demands and material properties. For specific design procedures, the reader is therefore encouraged to contact appropriate industry trade associations or product manufacturers. Current design information can be readily obtained from their web sites, technical handbooks, and bulletins.
For general applicability, this chapter focuses on fundamental mechanics-based equations that use symbolic parameters. Equations for deformation and stress provide the basis for analyzing mechanically loaded structural members like columns and beams. This chapter introduces analysis concepts commonly applied to wood structures. The first two sections cover tapered members, straight members, and special considerations such as notches, slits, and size effects. A third section presents stability criteria for members subject to buckling and for members subject to special conditions. This chapter highlights Forest Products Laboratory research and development relevant to structural analysis to provide an introductory level of understanding. For deeper knowledge, readers may refer directly to the technical works cited at the end of this chapter.
9–1

General Technical Report FPL–GTR–282
9–2
Deformation EquationsEquations for deformation of wood members are presented as functions of applied loads, moduli of elasticity and rigidity, and member dimensions. They may be solved to determine minimum required cross-sectional dimensions to meet deformation limitations imposed in design. Average moduli of elasticity (E) and rigidity (G) are given in Chapter 5. Consideration must be given to variability in material.
Axial LoadThe deformation of an axially loaded member does not usually take precedence over other loading, stability, or serviceability considerations. Axial load produces a change of length given by
δ PLAE
(9–1)
where δ is change of length, L initial length, A cross-sectional area, E modulus of elasticity (EL when grain runs parallel to member axis), and P axial force parallel to member axis. Figure 9–1 illustrates axial deformations of a member shortening in compression and lengthening in tension.
BendingStraight Beam DeflectionThe deflection of straight beams that are elastically stressed and have a constant cross section throughout their length is given by
3
b sδ k WL k WLEI GA
(9–2)
where δ is deflection, W total beam load acting perpendicular to beam neutral axis, L beam span, kb and ks constants dependent upon beam loading, support conditions, and location of point whose deflection is to be calculated, I beam moment of inertia, A′ modified beam area, E beam modulus of elasticity (for beams having grain direction parallel to their axis, E = EL), and G beam shear modulus (for beams with flat-grained vertical faces, G = GLT, and for beams with edge-grained vertical faces, G = GLR). Elastic property values are given in Tables 5–1 to 5–5 (Chap. 5). The first term on the right side of Equation (9–2) gives the
bending deflection and the second term the shear deflection. Figure 9–2 illustrates both deflection components with a cantilever case. Values of kb and ks for several cases of loading and support are given in Table 9–1.
For reference axes coinciding with the centroid, C, of the cross section (Fig. 9–3), the moment of inertia I of the beams is given by
3
12bhI for beam of rectangular cross section
4
64d
for beam of circular cross section
(9–3)
where b is beam width, h beam depth, and d beam diameter. The modified area A′ is given by
56
A = bh for beam of rectangular cross section
2940
= d for beam of circular cross section
(9–4)
If the beam has initial geometric imperfections such as bow (lateral bend) or twist, these imperfections could amplify deformations and lead to instability. Lateral or torsional restraints, therefore, may be necessary to hold such members in line. (See Interaction of Buckling Modes section.)
Tapered Beam DeflectionFigures 9–4 and 9–5, from Maki and Kuenzi (1965), are useful in the design of tapered beams. The equation determining the ordinates factors design criteria such as span, loading, difference in beam height (hc – h0) as required by roof slope or architectural effect, and maximum allowable deflection, together with material properties. From this, the value of the abscissa can be determined and the smallest beam depth h0 can be calculated for comparison with that given by the design criteria. Conversely, the deflection of a beam can be calculated if the value of the abscissa is known. Tapered beams deflect as a result of shear deflection in addition to bending deflections (Figs. 9–4 and 9–5), and this shear deflection Δs can be closely approximated by
Figure 9–1. Axial load deformations.
Figure 9–2. Components of straight beam deflection.

CHAPTER 9 | Structural Analysis Equations
9–3
Table 9–1. Values of kb and ks for several beam loadingsLoading Beam ends Diagram Deflection at kb ks
Uniformly distributed Both simply supported
Midspan 5/384 1/8
Both clamped Midspan 1/384 1/8
Concentrated at midspan
Both simply supported
Midspan 1/48 1/4
Both clamped Midspan 1/192 1/4
Concentrated at outer quarter span points
Both simply supported
Midspan 11/768 1/8
Both clamped Load point 1/96 1/8
Uniformly distributed Cantilever, one free, one clamped
Free end 1/8 1/2
Concentrated at free end
Cantilever, one free, one clamped
Free end 1/3 1
Figure 9–3. Cross-sectional properties of (a) rectangular and (b) circular sections.

General Technical Report FPL–GTR–282
9–4
s0
320
WLGbh
for uniformly distributed load
(9–5)
0
310
PLGbh
for midspan-concentrated load
The final beam design should consider the total deflection as the sum of the shear and bending deflections, and iterations may be necessary to arrive at final beam dimensions. Equations (9–5) are applicable to either single-tapered or double-tapered beams. As with straight beams, lateral or torsional restraint may be necessary.
Effect of Notches and HolesThe deflection of a beam increases if holes or notches, for example, reduce effective cross-sectional dimensions. The deflection of such beams can be determined by considering them of variable cross section along their length and appropriately solving the general differential equations of the elastic curves, EI(d2y/dx2) = M, to obtain deflection expressions or by the application of Castigliano’s theorem. (These procedures are given in most texts on mechanics of materials or structural analysis.)
Effect of Time: Creep DeflectionsIn addition to the elastic deflections previously discussed, wood beams and composite panels usually sag in time
because of creep. Creep deflection that produces sag slowly accumulates, from the flow of solids under mechanical stresses, and adds to the immediate deflections produced by the applied loads. The amount of creep deflection, or sag, depends on magnitude and duration of the applied loads and the material rate of creep, which can be affected by environmental conditions such as heat and humidity. (See the discussion of creep in Time under Load in Chap. 5.)
Green timbers will sag if allowed to dry under load, although partially dried material will also sag to some extent. In thoroughly dried beams, small changes in deflection occur with changes in moisture content but with little permanent increase in deflection. If deflection under longtime load with initially green timber is to be limited, it has been customary to design for an initial deflection of about half the value permitted for longtime deflection. If deflection under longtime load with initially dry timber is to be limited, it has been customary to design for an initial deflection of about two-thirds the value permitted for longtime deflection.
Water PondingPonding of water on roofs already deflected by other loads can cause large increases in deflection. Kuenzi and Bohannan (1964) developed expressions for amplification of the deflections and stresses caused by ponding based on
Figure 9–4. Graph for determining tapered beam size based on deflection under uniformly distributed load.
Figure 9–5. Graph for determining tapered beam size based on deflection under concentrated midspan load.

CHAPTER 9 | Structural Analysis Equations
9–5
tests. Ensuing work by Zahn showed that the total elastic deflection Δ due to design load plus ponded water can be closely estimated by
0
cr1 s s
(9–6)
where Δ0 is deflection due to design load alone, s beam spacing, and scr critical beam spacing (Eq. (9–32)).
Combined Bending and Axial LoadConcentric LoadAdding concentric axial load to a beam under bending loads, acting perpendicular to the beam neutral axis, increases bending deflection for added axial compression (Fig. 9–6) and decreases bending deflection for added axial tension. The deflection under combined loading at midspan for pin-ended, or simply supported, members can be estimated closely by
0
cr1 P P
(9–7)
where the plus sign is chosen if the axial load is tension and the minus sign if the axial load is compression, Δ is midspan deflection under combined loading, Δ0 beam midspan deflection without axial load, P axial load, and Pcr a constant equal to the buckling load of the beam under axial compressive load only and based on flexural rigidity about the neutral axis perpendicular to the direction of bending loads. (For determination of Pcr, see Axial Compression in Stability Equations section.) This Pcr constant appears regardless of whether P is tension or compression. If P is compression, it must be less than Pcr to avoid collapse. When the axial load is tension, it is conservative to ignore the P/Pcr term. If the beam is not supported against lateral deflection, its buckling load should be checked using Eq. (9–36).
Eccentric LoadIf an axial load is eccentrically applied to a simply supported, pin-ended member at a distance e0 from the centroidal neutral axis (Fig. 9–7), it will induce bending deflections and change in length given by Equation (9–1). Equation (9–7) can be applied to find the bending deflection by writing the equation in the form
0b 0
crδ
1e
eP P
(9–8)
Figure 9–6. Beam deflections amplified by axial loads.
Figure 9–7. Beam deflections amplified by eccentrically applied axial loads.
where δb is the induced bending deflection at midspan and e0 the eccentricity of P from the centroid of the cross section.
TorsionTorsion twists the cross section (Fig. 9–8). The angle of twist of wood members about the longitudinal axis can be computed by
GKTL
θ
(9–9)
where θ is angle of twist in radians, T applied torque, L member length, G shear modulus (use
LR LTG G
, or approximate G by EL/16 if measured G is not available), and K a torsional constant dependent on cross-sectional shape. For a circular cross section, K equals the polar moment of inertia, J:
4π
32DK J
(9–10)
where D is diameter.
For noncircular cross sections, which warp under torsion, empirical methods can be used to estimate a torsional rigidity that will closely match the response used in Equation (9–9). For a rectangular cross section, the following approximation of second polar moment of inertia may apply:
3
φ
hbK J
(9–11)
where h is larger cross-section dimension, b is smaller cross-section dimension, and ϕ is given in Figure 9–9. Trayer and March (1930) tested and analyzed the angle of twist and torsional stress for a wide variety of cross-sectional shapes formed of Sitka spruce wood.
Stress EquationsThe equations presented here are limited by the assumption that stress and strain are directly proportional (Hooke’s law) and by the fact that local stresses in the vicinity of points of support or points of load application are correct

General Technical Report FPL–GTR–282
9–6
Figure 9–8. Torsion on beams of (a) circular and (b) rectangular cross-sections.
Figure 9–9. Coefficient φ for determining torsional rigidity of rectangular member (Eq. (9 –11)).
only to the extent of being statically equivalent to the true stress distribution (St. Venant’s principle). Local stress concentrations must be separately accounted for if they are to be limited in design.
Axial LoadTensile StressConcentric axial load (along the line, labeled longitudinal axis L in Figure 9–10, joining the centroids of the cross sections) produces a uniform stress:
tPfA
(9–12)
where ft is tensile stress, P axial load, and A cross-sectional area. Figure 9–10a shows a rectangular block concentrically loaded in tension and an isolated portion of the block under uniform tensile stress, as expressed by Equation (9–12).
Two-dimensional representations of the cross section customarily diagram the tensile stress as moving away from the cross-section, because the axial tensile stress acts outward and normal to the plane of the cross section.
Short-Block Compressive StressAs shown in Figure 9–10b, Equation (9–12) can also be used in compression. A directional sign convention, such as positive for tension or negative for compression, is customarily assigned to track whether stresses are respectively oriented away from or towards the cross section. If the member under compression is short enough to fail by fiber crushing without suddenly deflecting laterally or buckling, this uniform stress state will prevail until the member is loaded to material capacity. Such fiber crushing produces a local “wrinkle” caused by microstructural instability. Despite fiber crushing, the member generally remains structurally stable and able to bear constant load at a reduced material stiffness because the compressive axial stress remains approximately uniform and concentric.
BendingThe strength of beams is determined by flexural stresses caused by bending moment, shear stresses caused by shear load, and compression across the grain at the end bearings and load points. Figure 9–11 illustrates a common case of a simply supported beam loaded in four-point bending, with a hinge and roller acting as two support points and two symmetrically placed loads of equal magnitude stressing the beam. The magnitude and direction of reactions at the supports, shear, and moment along the span, diagrammed in view (a), can be determined by summing moments of all forces acting on the beam, about any point in the structure. Equating the terms to zero imposes the condition of static equilibrium. Solving for unknown terms provides magnitude

CHAPTER 9 | Structural Analysis Equations
9–7
Figure 9–10. Axial (a) compression and (b) tension on rectangular blocks, shown in elevation and cross section.
and verifies the directions of forces, whether the forces act internally or externally on the beam. Mechanics of materials textbooks explain the analytical concepts of the free-body diagram and equilibrium equations for general application. Many references (AWC 2007) provide beam formulas with shear and moment diagrams and deflections for common load configurations like those presented in Table 9–1. To maintain static equilibrium, the externally applied forces that generate shear, V, and moment, M, in the beam must be counteracted by internal stresses, fb and fv, that respectively sum to match the magnitudes and oppose the directions of the applied force effects.
Straight Beam StressesThe stress due to bending moment for a simply supported, pin-ended beam is a maximum at the top and bottom edges. The concave edge is compressed, and the convex edge is
under tension. The maximum stress, at extreme top and bottom fibers of the cross section, is given by
bMfS
(9–13)
where fb is bending stress, M bending moment, and S beam section modulus (for a rectangular cross section, S = bh2/6; for a circular cross section, S = πD3/32). For common structural cross sections, the elastic section modulus S is tabulated by many analytical aids. More generally, the elastic section modulus S is defined as the cross-sectional moment of inertia, I, over the distance from the neutral axis to top or bottom of the beam, c, measured with respect to the direction of bending. Figure 9–11 diagrams the linear elastic, bending moment stress distribution acting on a uniform rectangular cross section, in the 2D view (b) and 3D axon (d). In the simply supported beam, compression

General Technical Report FPL–GTR–282
9–8
Figure 9–11. Beam diagrams (a) in elevation view with (b) linear elastic bending moment stress and (c) parabolic shear stress distributions on uniform two-dimensional cross-section and (d) axonometric view.
occurs above the neutral axis, which shortens fibers, while tension below the neutral axis lengthens beam fibers.
Equation (9–13) is also used beyond the limits of Hooke’s law with M as the ultimate moment at failure. The resulting pseudo-stress is called the “modulus of rupture,” values of which are tabulated in Chapter 5. The modulus of rupture has been found to decrease with increasing size of member. (See Size Effect section.)
For beams of uniform cross section, the shear stress due to bending is a maximum at the neutral axis of the beam, where the bending stress happens to be zero. (This condition is not true if the beam is tapered—see following section.) In wood beams, this shear stress may produce a failure crack near mid-depth running along the axis of the member. The maximum shear stress acting on a beam cross-section is
vVf kA
(9–14)
where fv is shear stress, V vertical shear force on cross section, A cross-sectional area, and k = 3/2 for a rectangular cross section or k = 4/3 for a circular cross section. Equation 9-14 is intended for beams with solid cross sections. For an I-shape, the shear capacity of the cross section is conservatively estimated by the rectangular web. Newlin and Trayer (1924), however, analytically and experimentally showed that shear deformations for I- and
box-shaped beams are particularly more pronounced. Figure 9–11c plots the parabolic shear stress distribution in 2D and 3D axon of Figure 9–11d based on Equation (9–14), which is adequate for most practical purposes. For a more detailed account of the orthotropic behavior of wood, see Liu and Cheng (1979); Gerhardt and Liu (1983) developed elasticity models with additional terms that slightly alter the bending and shear stress distributions of rectangular cross sections.
For long beams, the load capacity of wood beams is limited by bending moment capacity of the beam cross section. In such cases, Equation (9–13) governs design. For short beams, shear limits the load capacity of the beam cross section because wood is relatively weak in shear strength. For guidance in distinguishing long and short beams, Soltis and Rammer (1997) provides a table of common loading conditions and span-to-depth (L/d) ratios where shear is likely to limit beam capacity.
Tapered Beam StressesFor beams of constant width that taper in depth at a slope less than 25°, the bending stress can be obtained from Equation (9–13) with an error of less than 5%. The shear stress, however, differs markedly from that found in uniform beams. It can be determined from the basic theory presented by Maki and Kuenzi (1965). The shear stress at the tapered

CHAPTER 9 | Structural Analysis Equations
9–9
P = resultant of applied concentrated loads producing beam reaction, V (P = 2V, if applied at midspan of simply supported beam)M = bending momentV = beam reaction force (shear)x = horizontal position along x-axis (x = 0 at beam reaction)y = vertical position along y-axis (y = 0 at top of beam profile)h0 = depth of beam section at reactionh = depth of beam at section of interestθ = angle of tapered beam profileα = peak shear stress of a beam of constant depth and rectangular cross section
where
Figure 9–12. Shear stress distribution for a tapered beam.
edge can reach a maximum value as great as that at the neutral axis at a reaction.
Consider the example shown in Figure 9–12, in which concentrated loads, represented by resultant P farther to the right, have produced a support reaction V at the left end. In this case, the maximum stresses occur at the cross section that is double the depth of the beam at the reaction. For other loadings, the location of the cross section with maximum shear stress at the tapered edge will be different.
For the beam depicted in Figure 9–12, the bending and shear stresses acting with respect to the x–y coordinate system combine to produce a maximum tension stress at point O.
Transforming the x–y stresses to the x′–y′ coordinate system reveals the predominant tensile stress acting along the taper and a lesser tensile stress acting in the y′ direction, normal to the taper. The effect of combined stresses at point O can be approximated by an interaction equation based on the Henky–von Mises theory of energy, due to the change of shape. This theory applied by Norris (1950) to wood results in
2 22
2 2 2 1xy yx
x xy y
f ffF F F
(9–15)
General Technical Report FPL–GTR–282
9–10
where fx is bending stress, fy stress perpendicular to the neutral axis, and fxy shear stress. Values of Fx, Fy, and Fxy are corresponding stresses chosen at design values or maximum values in accordance with allowable or maximum values being determined for the tapered beam. Maximum stresses in the beam depicted in Figure 9–12 is given by
20
2
32
tan
tan
x
xy x
y x
Mfbh
f f
f f
(9–16)
Substitution of these equations into the interaction Equation (9–15) will result in an expression for the moment capacity M of the beam. If the taper is on the beam tension edge, the values of fx and fy are tensile stresses.
Example: Determine the moment capacity (newton-meters) of a tapered beam of width b = 100 mm, depth h0 = 200 mm, and taper tan θ = 1/10. Substituting these dimensions into Equation (9–16) (with stresses in pascals) results in
37537.5
3.75
x
xy
y
f Mf M
f M
Substituting these into Equation (9–15) and solving for M results in
1/24 2 2 2 2
1
3.75 10 10 1x xy y
MF F F
where appropriate allowable or maximum values of the F stresses (pascals) are based on test data. Maki and Kuenzi (1965), for example, determined maximum F stresses with strength-to-failure tests of clear and straight-grained Sitka spruce specimens extracted from the same planks used for tapered beam fabrication. As the diagrams of the stressed element O show in Figure 9–12, the beam taper induces a combined stress state that subjects the element to shear when oriented with respect to the x–y coordinate system. Typically, the wood grain direction aligns parallel to the x axis, so the orientation of stresses on element O determines what stress limit states of F apply. For combined stress diagram Figure 9–12a, the corresponding limit states are
• shear stress parallel to grain, Fv,
• bending stress Fb, like the horizontal tension stress parallel to grain shown in the diagram, and
• perpendicular-to-grain stresses Ft┴, like the vertical
tension shown in the diagram.
If a beam is tapered along the compression flange, the orientation forces acting perpendicular to grain reverse to compression Fc┴. Liu (1981) further analyzed the shear strength of tapered beams for the size effect discussed in the next section.
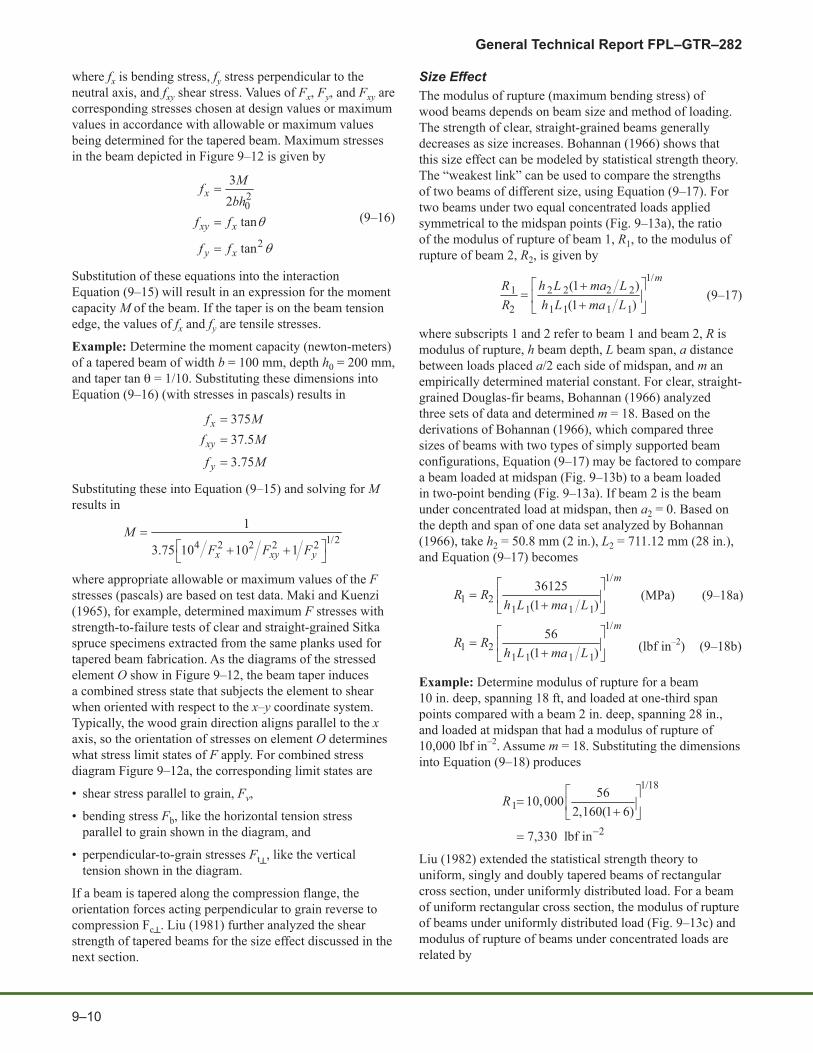
Size EffectThe modulus of rupture (maximum bending stress) of wood beams depends on beam size and method of loading. The strength of clear, straight-grained beams generally decreases as size increases. Bohannan (1966) shows that this size effect can be modeled by statistical strength theory. The “weakest link” can be used to compare the strengths of two beams of different size, using Equation (9–17). For two beams under two equal concentrated loads applied symmetrical to the midspan points (Fig. 9–13a), the ratio of the modulus of rupture of beam 1, R1, to the modulus of rupture of beam 2, R2, is given by
1/
1 2 2 2 2
2 1 1 1 1
(1 )(1 )
mR h L ma LR h L ma L
(9–17)
where subscripts 1 and 2 refer to beam 1 and beam 2, R is modulus of rupture, h beam depth, L beam span, a distance between loads placed a/2 each side of midspan, and m an empirically determined material constant. For clear, straight-grained Douglas-fir beams, Bohannan (1966) analyzed three sets of data and determined m = 18. Based on the derivations of Bohannan (1966), which compared three sizes of beams with two types of simply supported beam configurations, Equation (9–17) may be factored to compare a beam loaded at midspan (Fig. 9–13b) to a beam loaded in two-point bending (Fig. 9–13a). If beam 2 is the beam under concentrated load at midspan, then a2 = 0. Based on the depth and span of one data set analyzed by Bohannan (1966), take h2 = 50.8 mm (2 in.), L2 = 711.12 mm (28 in.), and Equation (9–17) becomes
1/
1 21 1 1 1
36125(1 )
m
R Rh L ma L
1/
1 21 1 1 1
56(1 )
m
R Rh L ma L
Example: Determine modulus of rupture for a beam 10 in. deep, spanning 18 ft, and loaded at one-third span points compared with a beam 2 in. deep, spanning 28 in., and loaded at midspan that had a modulus of rupture of 10,000 lbf in–2. Assume m = 18. Substituting the dimensions into Equation (9–18) produces
1/18
1
2
5610,0002,160(1 6)
7,330 lbf in
R
Liu (1982) extended the statistical strength theory to uniform, singly and doubly tapered beams of rectangular cross section, under uniformly distributed load. For a beam of uniform rectangular cross section, the modulus of rupture of beams under uniformly distributed load (Fig. 9–13c) and modulus of rupture of beams under concentrated loads are related by
(MPa) (9–18a)
(lbf in–2) (9–18b)

CHAPTER 9 | Structural Analysis Equations
9–11
Figure 9–13. Load configuration of simply supported beams examined for size effect in (a) two-point, (b) concentrated midspan, and (c) uniformly distributed loading.
1/18
c c c cu
c u u
1 183.876
a L h LRR h L
(9–19)
where subscripts u and c refer to beams under uniformly distributed and concentrated loads, respectively, and other terms are as previously defined. As before, m in the exponential term was determined as 18 by fitting data to multiple experiments conducted with Douglas-fir beams. The numerical factor in the denominator of Equation (9–19) is a “characteristic parameter” of the loading condition (such as concentrated or uniform) and geometry of the beam cross section (such as uniform rectangular or singly or doubly tapered).
Shear strength for non-split, non-checked, solid-sawn, and glulam beams (Glued Laminated Timber, Chap. 11) also decreases as beam size increases (Liu 1980). A relationship between beam shear τ and ASTM D143 shear block strength τASTM, including a stress concentration factor for the re-entrant corner of the shear block, Cf, and the shear area A, is
(metric) (9–20a)
(inch–pound) (9–20b)
f ASTM1/5
1.9 ττ
CA
f ASTM1/5
1.3 ττ
CA
where τ is beam shear (MPa, lb in–2), Cf stress concentration factor, τASTM ASTM D143 shear block strength (MPa, lb in–2), and A shear area (cm2, in2).
Rammer and Soltis (1994) and Rammer and others (1996) determined this relationship by empirical fit to test data. The shear block re-entrant corner concentration factor is approximately 2; the shear area is defined as beam width multiplied by the length of beam subjected to shear force.
Effect of Notches, Slits, and HolesIn beams having notches, slits, or holes with sharp interior corners, large stress concentrations exist at the corners. The local stresses include shear parallel to grain and tension perpendicular to grain. As a result, even moderately low

General Technical Report FPL–GTR–282
9–12
loads can cause a crack to initiate at the sharp corner and propagate along the grain. An estimate of the crack-initiation load can be obtained by the fracture mechanics analysis of Murphy (1979) for a beam with a slit, but it is generally more economical to avoid sharp notches entirely in wood beams. Sharp notches cause greater reductions in strength for larger beams, resulting from size effects. A conservative criterion for crack initiation for a beam with a slit is
26 3 1
2M Vh A B
bhbh
(9–21)
where h is beam depth, b beam width, M bending moment, and V vertical shear force, and coefficients A and B are presented in Figure 9–14 as functions of a/h, where a is slit depth. The value of A depends on whether the slit is on the tension edge or the compression edge. Therefore, use either At or Ac as appropriate. The values of A and B are dependent upon species. The values given in Figure 9–14, however, are conservative for most softwood species.
Effects of Time: Creep Rupture, Fatigue, and AgingSee Chapter 5 for a discussion of fatigue and aging. Creep rupture is accounted for by duration-of-load adjustment in the setting of allowable stresses, as discussed in Chapters 5 and 7.
Water PondingPonding of water on roofs can cause increases in bending stresses that can be computed by the same amplification factor (Eq. (9–6)) used with deflection. (See Water Ponding in the Deformation Equations section.)
Combined Bending and Axial LoadConcentric LoadEquation (9–7) gives the effect on deflection of adding an axial end load to a simply supported pin-ended beam already bent by transverse flexural loads. The bending stress in the member (Fig. 9–7) is modified by the same factor as the deflection:
Figure 9–14. Coefficients A and B for crack-initiation criterion (Eq. (9–21)).
b0b
cr1f
fP P
(9–22)
where the plus sign is chosen if the axial load is tension and the minus sign is chosen if the axial load is compression, fb is net bending stress from combined bending and axial load, fb0 bending stress without axial load, P axial load, and Pcr the buckling load of the beam under axial compressive load only (see Axial Compression in the Stability Equations section). This Pcr is not necessarily the minimum buckling load of the member. If P is compressive, the possibility of buckling under combined loading must be checked. (See Interaction of Buckling Modes.)
The total stress under combined bending and axial load is obtained by superposition of the stresses given by Equations (9–12) and (9–22).
Example: Suppose transverse loads produce a bending stress fb0 tensile on the convex edge and compressive on the concave edge of the beam. Then the addition of a tensile axial force P at the centroids of the end sections will produce a maximum tensile stress on the convex edge of
b0t max
cr1f PfP P A
and a maximum compressive stress on the concave edge of
b0c max
cr1f PfP P A
where a negative result would indicate that the stress was in fact tensile.
Eccentric LoadIf the axial load is eccentrically applied, then the bending stress fb0 should be augmented by ±Pe0/S, where e0 is eccentricity of the axial load. If applied in a manner that creates a convex curvature, opposite to that shown in Figure 9–7, then e0 is negative.
Example: In the preceding example, let the axial load be eccentric with respect to the concave edge of the beam, as shown in Figure 9–7. Then the maximum stresses become
b0 0t max
cr1f Pe S Pf
P P A
b0 0c max
cr1f Pe S Pf
P P A
TorsionFor a circular cross section, the shear stress induced by torsion is
s 316π
Tfd
(9–23)
where T is the applied torsional moment that induces the torque and d diameter. For a rectangular cross section,

CHAPTER 9 | Structural Analysis Equations
9–13
s 2βTfhb
(9–24)
where T is the applied torsional moment that induces the torque, h larger cross-section dimension, and b smaller cross-section dimension, and β is presented in Figure 9–15.
Stability EquationsAxial CompressionFor slender members under axial compression, a sudden loss of stability is the principal failure mode. Buckling, as shown in Figure 9–16, introduces a sudden lateral eccentricity that drastically reduces axial load-carrying capacity, even to the point of collapse. The following equations are for concentrically loaded members. For eccentrically loaded columns, see Interaction of Buckling Modes section.
Long ColumnsA column long enough to buckle before the compressive stress P/A exceeds the proportional limit stress is called a “long column.” The critical stress at buckling is calculated by Euler’s formula:
2
Lcr 2
π( )
EfL r
(9–25)
where EL is elastic modulus parallel to the axis of the member, L unbraced length, and r least radius of gyration.
The radius of gyration r of cross-sectional shapes is given by
IrA
(9–26)
where I is moment of inertia and A cross-sectional area. For the cross sections of Figure 9–3,
12br
Figure 9–15. Coefficient β for computing maximum shear stress in torsion of rectangular member (Eq. (9 –24)).
Figure 9–16. Buckling of a column with simple supports.
4dr
Equation (9–25) is based on an idealized pinned-end condition (Fig. 9–17a). Although few columns are detailed to behave as an ideal pin, free to rotate about a hinge point, actual rotational constraints are typically neglected. For example, a column with squared-off ends that bear directly on a rigid surface (Fig. 9–17b) may be capable of developing end moments that are conservatively neglected because the constraint forces are typically too small to fix the column against significant rotation.
Short ColumnsColumns that buckle at a compressive stress P/A beyond the proportional limit stress are called “short columns.” The short column range is usually explored empirically, and appropriate design equations are proposed. Material of this nature is presented in Newlin and Gahagan (1930). The final equation is a fourth-power parabolic function that can be written as
4
ccr c 4 L
4127π
FLf Fr E
(9–27)
where Fc is compressive strength and remaining terms are defined as in Equation (9–25). Figure 9–18 is a graphical representation of Equations (9–25) and (9–27).
Short columns can be analyzed by fitting a nonlinear function to compressive stress–strain data and using it in place of Hooke’s law. One such nonlinear function proposed by Ylinen (1956) is
for a rectangular cross section with b as its least dimension
for a member of circular cross section of diameter d

General Technical Report FPL–GTR–282
9–14
Figure 9–17. Column end conditions (a) idealized pin or hinge and (b) squared off bearing against a rigid surface.
Figure 9–18. Graph for determining critical buckling stress of wood columns.
c
L c cε (1 ) log 1e
F f fc cE F F
(9–28)
where ε is compressive strain, f compressive stress, c a constant between 0 and 1, and EL and Fc are as previously defined. Using the slope of Equation (9–27) in place of EL in Euler’s formula, given by Equation (9–25), leads to Ylinen’s buckling equation
2
c e c e c ecr 2 2
F f F f F ff
c c c
(9–29)
where Fc is compressive strength and fe buckling stress given by Euler’s formula, Equation (9–25). Equation (9–29) agrees closely with the FPL fourth-power formula in Figure 9–11 if c = 0.957.
Comparing the fourth-power parabolic function Equation (9–27) to experimental data, however, indicates that the function is nonconservative for intermediate L/r range columns. Using Ylinen’s buckling equation (Eq. (9–29)) with c = 0.8 gives a better estimate for the solid-sawn and glued-laminated data, whereas c = 0.9 gives a better estimate for structural composite lumber.
Built-Up and Spaced ColumnsBuilt-up columns of nearly square cross section, such as those shown in Figure 9–19, cannot support as much load as a solid or glue-laminated column of similar dimensions, because the dowel-type fasteners (nails or bolts) that hold the cross section together deform and slip. Malhorta and Sukumar (1989) models a rational approach to determine the buckling capacity of some common built-up column configurations.
If built-up columns are adequately connected and the axial load is near the geometric center of the cross section,
Equation (9–29) is reduced with a factor that depends on the type of mechanical connection. The built-up column capacity is
2
c e c e c ecr f 2 2
F f F f F ff K
c c c
(9–30)
where Fc, fe, and c are as defined for Equation (9–29). Kf is the built-up stability factor, which accounts for the efficiency of the connection; for bolts, Kf = 0.75, and for nails, Kf = 0.6, provided bolt and nail spacing requirements meet design specification approval.
If the built-up column is of several spaced pieces, the spacer blocks should be placed close enough together, lengthwise in the column, so that the unsupported portion of the spaced member will not locally buckle at the same or lower stress than that of the complete member. “Spaced columns” are designed with previously presented column equations, considering each compression member as an unsupported simple column. The sum of column loads for all the members is taken as the column load for the spaced column. Therefore, local and global buckling checks apply to built-up columns.
Columns with FlangesColumns with thin, outstanding flanges can fail by elastic instability of the outstanding flange, causing wrinkling of the flange and twisting of the column at stresses less than those for general column instability as given by Equations (9–25) and (9–27). For outstanding flanges of cross sections, such as I, H, +, and L (Fig. 9–20), Trayer and March (1931) estimated the flange instability stress by
2
cr 0.044 2tf Eb
(9–31)
0.9
0.8
0.7
0.6
0.667
FPL fourth-power formula
12Fc/E
1.225
0.5
0.4
0.3
0.2
0.1
0.0 0.5 1.0 1.5 2.0 2.5 3.0
1.0
Euler’s Formula
Eq. (9–29), c = 0.957Eq. (9–29), c = 0.8
L�a
f F c

CHAPTER 9 | Structural Analysis Equations
9–15
Figure 9–19. Two types of built-up columns.
Figure 9–20. Cross-sections with thin outstanding flanges.
where E is column modulus of elasticity, t thickness of the outstanding flange, and b width of the outstanding flange. If the joints between the column members are glued and reinforced with glued fillets, the instability stress increases to as much as 1.6 times that given by Equation (9–31).
BendingBeams are subject to two kinds of instability: lateral–torsional buckling and progressive deflection under water ponding, both of which are determined by member stiffness.
Water PondingRoof beams that are insufficiently stiff or spaced too far apart for their given stiffness can fail by progressive deflection under the weight of water (Fig. 9–21). Steady rain, obstructed drainage, or another continuous source of water can cause rooftop ponding conditions. According to Zahn (1988), the critical beam spacing scr is given by
4
cr 4πρ
m EIsL
(9–32)
where E is beam modulus of elasticity, I beam moment of inertia, ρ density of water (1,000 kg m–3, 0.0361 lb in–3), L beam length, and m = 1 for simple support or m = 16/3 for fixed-end condition. To prevent ponding, the beam spacing must be less than scr.
Lateral–Torsional BucklingBecause beams are compressed on the concave edge when bent under load, they can buckle by a combination of lateral deflection and twist (Fig. 9–22). Because most wood beams are rectangular in cross section, the equations presented here are for rectangular members only. Beams of I, H, or other built-up cross section exhibit a more complex resistance to twisting. Built-up cross sections of these and closed box shapes are more stable than the following equations would predict.
Long Beams—Long slender beams that are restrained against torsional, axial rotation at their points of support but are otherwise free to twist and to deflect laterally will buckle when the maximum bending stress fb equals or exceeds the following critical value:
2
b cr 2πα
LEf
(9–33)
Figure 9–21. Ponding on a beam with simple supports.
Figure 9–22. Lateral torsional buckling.

General Technical Report FPL–GTR–282
9–16
Table 9–2. Effective length for checking lateral–torsional stability of beamsa
Support Load Diagram Effective length Le
Simple support Equal end moments L
Concentrated force at center 0.742L1 – 2 h/L
Uniformly distributed force 0.887L1 – 2 h/L
Cantilever Concentrated force at end 0.783L1 – 2 h/L
Uniformly distributed force 0.489L1 – 2 h/L
aThese values are conservative for beams with a width-to-depth ratio of less than 0.4. The load is assumed to act at the top edge of the beams.
where α is the slenderness factor given by
e4α 2π yEI L hGJ b
(9–34)
where EIy is lateral flexural rigidity equal to EL hb3/12, h is beam depth, b beam width, GJ torsional rigidity defined in Equation (9–9), and Le effective length determined by type of loading and support as given in Table 9–2. Equation (9–33) is valid for bending stresses below the proportional limit.
Short Beams—Short beams can buckle at stresses beyond the proportional limit. In view of the similarity of Equation (9–33) to Euler’s formula (Eq. (9–25)) for column buckling, it is recommended that short-beam buckling be analyzed by using the column buckling criterion in Figure 9–18 applied with α in place of L/r on the abscissa and fb cr/Fb in place of fcr/Fc on the ordinate. Here Fb is beam modulus of rupture.
Effect of Deck Support—The most common form of support against lateral deflection is a deck continuously attached to the top edge of the beam. Decking often provides enough restraint to prevent lateral torsional buckling of beams. For many beams, the top edge is the compression, concave edge. Many panel decking systems, such as plywood (Chap. 11), typically fastened to the top beam edge have high enough in-plane shear strength and rigidity to laterally restrain the compression at the concave edge of the beam. Where a beam is continuous over a support, the curvature at top edge of the beam is convex. Because the top of the beam in this location is in tension, the deck provides no restraint to the compression, concave edge of the beam. Lateral bracing, such as diagonal blocking or a
trussed diaphragm must be added to bring lateral stability to the bottom, compression side, of the beam.
Even if the deck flexes under in-plane shear, such as standard 38-mm (nominal 2-in.) wood decking, Equation (9–33) and Figure 9–18 can still be used to check stability if the effective length is modified by dividing by θ, as given in Figure 9–23. According to Zahn (1973), the abscissa of this figure is a deck shear stiffness parameter τ given by
2
Dτy
sG LEI
(9–35)
where EIy is lateral flexural rigidity as in Equation (9–34), s beam spacing, GD in-plane shear rigidity of deck (ratio of shear force per unit length of edge to shear strain), and L actual beam length. This figure applies only to simply supported beams. Cantilevers with the deck on top have their tension edge supported and do not derive much support from the deck. Zahn (1984) provides a more widely applicable procedure to determine bracing requirements, including contributions from the deck and diagonal braces.
Interaction of Buckling ModesWhen two or more loads are acting and each of them has a critical value associated with a mode of buckling, the combination can produce buckling even though each load is less than its own critical value.
The general case of a beam of unbraced length le includes a primary (edgewise) moment M1, a lateral (flatwise) moment M2, and axial load P. The axial load creates a secondary moment on both edgewise and flatwise moments due to the deflection under combined loading given by Equation (9–7).

CHAPTER 9 | Structural Analysis Equations
9–17
Figure 9–23. Increase in buckling stress resulting from attached deck; simply supported beams. To apply this graph, divide the effective length by θ.
Case 1 = end momentsCase 2 = uniform loadCase 3 = concentrated load
In addition, the edgewise moment has an effect like the secondary moment effect on the flatwise moment (Fig. 9–24).
Based on Zahn (1986), the following equation contains two moment modification factors, one on the edgewise bending stress and one on the flatwise bending stress that includes the interaction of biaxial bending. The equation also contains a squared term for axial load to better fit experimental data:
2b1 1 1 c c1c
c c1 b1
b2 2 2 c c2
c2 b2
6( / ) (1.234 0.234θ )θ
6( / ) (1.234 0.234θ )1.0
θ
f e d ffF F
f e d fF
(9–36)
where f is the member stress in compression, edgewise bending, or flatwise bending (subscripts c, b1, or b2, respectively), F buckling strength in compression or bending (a single prime denotes the strength is reduced for slenderness of the member; a double prime denotes the elastic buckling stress), e/d ratio of eccentricity of the axial compression to member depth ratio for edgewise or flatwise bending (subscripts 1 or 2, respectively), and θc moment magnification factors for edgewise and flatwise bending, given by
cc1
c1 crθ 1
f sF s
(9–37)
c b1 1 1 cc2
c2 b1
6( )θ 1
f f e d fF F
(9–38)
c1 2e1 1
0.822( )
EFl d
(9–39)
c2 2e2 2
0.822( )
EFl d
(9–40)
2b1
e 1
1.44 dEFl d
(9–41)
where le is effective length of member and s and scr are previously defined ponding beam spacing. Figure 9–24 shows a simply supported biaxial beam–column, with labeled reference axes and laterally constrained end supports (le = le1 = le2). The effective spans le1 and le2 may respectively change if interior vertical supports or lateral bracing is added. The 1–2 coordinate system respectively denotes edgewise and flatwise bending to facilitate evaluations of biaxial bending moment. For more complex cases of combined loading, Zahn (1988) offers a detailed approach that may be adapted to more beam–column configurations.
SummaryThis chapter reviews the fundamentals of axial, bending, torsional, and combined loadings considered in the structural analysis of wood structural members. This chapter shows the fundamental mechanics of materials applicable to many common situations. The chapter further addresses the orthotropic nature of wood and special detailing considerations, which have implications on cross-sectional size, taper, and built-up structural sections. The chapter also highlights considerations regarding elastic stability and fracture mechanics—such as the amplifying effects of deflections, slits and notches, eccentric loadings, and lateral bracing. The following references provide more detailed information.
Literature CitedAWC. 2007. Beam design formulas with shear and moment diagrams. Washington, DC: American Wood Council. https://www.awc.org/pdf/codes-standards/publications/design-aids/AWC-DA6-BeamFormulas-0710.pdf
Bohannan, B. 1966. Effect of size on bending strength of wood members. Research Paper FPL–RP–56. Madison, WI: U.S. Department of Agriculture, Forest Service, Forest Products Laboratory. 30 p.
Gerhardt, T.D.; Liu, J.Y. 1983. Orthotropic beams under normal and shear loading. Journal of Engineering Mechanics. 109(2): 394–410.
Kuenzi, E.W.; Bohannan, B. 1964. Increases in deflection and stress caused by ponding of water on roofs. Forest Products Journal. 14(9): 421–424.
Liu, J.Y. 1980. Shear strength of wood beams: a Weibull analysis. Journal of the Structural Division (ASCE). 106(ST10): 2035–2052.

General Technical Report FPL–GTR–282
9–18
Figure 9–24. Simply supported biaxial beam–column with ends constrained against axial rotation.
Liu, J.Y. 1981. Shear strength of tapered wood beams. Journal of the Structural Division (ASCE). 107(ST5): 719–731.
Liu, J.Y. 1982. A Weibull analysis of wood member bending strength. Journal of Mechanical Design. 104: 572–579.
Liu, J.Y.; Cheng, S. 1979. Analysis of orthotropic beams. Research Paper FPL–RP–343. Madison, WI: U.S. Department of Agriculture, Forest Service, Forest Products Laboratory. 37 p.
Maki, A.C.; Kuenzi, E.W. 1965. Deflection and stresses of tapered wood beams. Research Paper FPL–RP–34. Madison, WI: U.S. Department of Agriculture, Forest Service, Forest Products Laboratory. 56 p.
Malhorta, S.K.; Sukumar, A.P. 1989. A simplified procedure for built-up wood compression members. Annual conference. St. John’s, Newfoundland: Canadian Society for Civil Engineering: 1–18.
Murphy, J.F. 1979. Using fracture mechanics to predict failure of notched wood beams. In: Proceedings of first international conference on wood fracture; 1978 August 14–16; Banff, AB. Vancouver, BC: Forintek Canada Corporation. 159: 161–173.
Newlin, J.A.; Gahagan, J.M. 1930. Tests of large timber columns and presentation of the Forest Products Laboratory
column formula. Technical Bulletin 167. Madison, WI: U.S. Department of Agriculture, Forest Service, Forest Products Laboratory. 44 p.
Newlin, J.A.; Trayer, G.W. 1924. Deflection of beams with special reference to shear deformations. Report 180. Washington, DC: U.S. National Advisory Committee on Aeronautics. 18 p.
Norris, C.B. 1950. Strength of orthotropic materials subjected to combined stresses. Report 1816. Madison, WI: U.S. Department of Agriculture, Forest Service, Forest Products Laboratory. 40 p.
Rammer, D.R.; Soltis, L.A. 1994. Experimental shear strength of glued-laminated beams. Research Paper FPL–RP–527. Madison, WI: U.S. Department of Agriculture, Forest Service, Forest Products Laboratory. 40 p.
Rammer, D.R.; Soltis, L.A.; Lebow, P.K. 1996. Experimental shear strength of unchecked solid sawn Douglas-fir. Research Paper FPL–RP–553. Madison, WI: U.S. Department of Agriculture, Forest Service, Forest Products Laboratory. 35 p.
Soltis, L.A.; Rammer, D.R. 1997. Bending to shear ratio approach to beam design. Forest Products Journal. 47(1): 104–108.

CHAPTER 9 | Structural Analysis Equations
9–19
Trayer, G.W.; March, H.W. 1930. The torsion of members having sections common in aircraft construction. Report 334. Washington, DC: U.S. National Advisory Committee on Aeronautics. 49 p.
Trayer, G.W.; March, H.W. 1931. Elastic instability of members having sections common in aircraft construction. Report 382. Washington, DC: U.S. National Advisory Committee on Aeronautics. 38 p.
Ylinen, A. 1956. A method of determining the buckling stress and the required cross-sectional area for centrally loaded straight columns in elastic and inelastic range. Zurich, Switzerland: Publication of the IABSA (International Association for Bridge and Structural Engineering). Vol. 16.
Zahn, J.J. 1973. Lateral stability of wood beam-and-deck systems. Journal of the Structural Division (ASCE). 99(ST7): 1391–1408.
Zahn, J. J. 1984. Bracing requirements for lateral stability. Journal of Structural Engineering. 110(8): 1786-1802.
Zahn, J.J. 1986. Design of wood members under combined loads. Journal of Structural Engineering. 112(ST9): 2109–2126.
Zahn, J.J. 1988. Combined-load stability criterion for wood beam-columns. Journal of Structural Engineering. 114(ST11): 2612–2628.
Additional ReferencesANC. 1951. Design of wood aircraft structures. ANC Bulletin 18. Washington, DC: Air Force–Navy–Commerce, Munitions Board Aircraft Committee.
ASTM. [Current edition]. Standard methods for testing clear specimens of timber. ASTM D143–94. West Conshohocken, PA: American Society for Testing and Materials.
Liu, J.Y. 1984. Evaluation of the tensor polynomial strength theory for wood. Journal of Composite Materials. 18(3): 216–226. (May).
Norris, C. 1943. The application of Mohr’s stress and strain circles to wood and plywood. Mimeo No. 1312. Madison, WI: U.S. Department of Agriculture, Forest Service, Forest Products Laboratory.


Wood HandbookWood as an Engineering Material
Forest Products Laboratory | United States Department of Agriculture Forest Service | Madison, Wisconsin
AbstractSummarizes information on wood as an engineering material. Presents properties of wood and wood-based products of particular concern to the architect and engineer. Includes discussion of designing with wood and wood-based products along with some pertinent uses.
Keywords: wood structure, physical properties (wood), mechanical properties (wood), lumber, wood-based composites, plywood, panel products, design, fastenings, wood moisture, drying, gluing, fire resistance, finishing, decay, preservation, wood-based products, heat sterilization, sustainable use
Pesticide Precautionary StatementThis publication reports research involving pesticides. It does not contain recommendations for their use, nor does it imply that the uses discussed here have been registered. All uses of pesticides must be registered by appropriate State and/or Federal agencies before they can be recommended.
Caution: Pesticides can be injurious to humans, domestic animals, desirable plants, and fish or other wildlife, if they are not handled or applied properly. Use all pesticides selectively and carefully. Follow recommended practices for the disposal of surplus pesticides and pesticide containers.
March 2021Forest Products Laboratory. 2021. Wood handbook—wood as an engineering material. General Technical Report FPL-GTR-282. Madison, WI: U.S. Department of Agriculture, Forest Service, Forest Products Laboratory. 543 p.A limited number of free copies of this publication are available to the public from the Forest Products Laboratory, One Gifford Pinchot Drive, Madison, WI 53726-2398. This publication is also available online at www.fpl.fs.fed.us. Laboratory publications are sent to hundreds of libraries in the United States and elsewhere.The Forest Products Laboratory is maintained in cooperation with the University of Wisconsin. The use of trade or firm names in this publication is for reader information and does not imply endorsement by the United States Department of Agriculture (USDA) of any product or service.
In accordance with Federal civil rights law and U.S. Department of Agriculture (USDA) civil rights regulations and policies, the USDA, its Agencies, offices, and employees, and institutions participating in or administering USDA programs are prohibited from discriminating based on race, color, national origin, religion, sex, gender identity (including gender expression), sexual orientation, disability, age, marital status, family/parental status, income derived from a public assistance program, political beliefs, or reprisal or retaliation for prior civil rights activity, in any program or activity conducted or funded by USDA (not all bases apply to all programs). Remedies and complaint filing deadlines vary by program or incident. Persons with disabilities who require alternative means of communication for program information (e.g., Braille, large print, audiotape, American Sign Language, etc.) should contact the responsible Agency or USDA’s TARGET Center at (202) 720–2600 (voice and TTY) or contact USDA through the Federal Relay Service at (800) 877–8339. Additionally, program information may be made available in languages other than English. To file a program discrimination complaint, complete the USDA Program Discrimination Complaint Form, AD-3027, found online at http://www.ascr.usda.gov/complaint_filing_cust.html and at any USDA office or write a letter addressed to USDA and provide in the letter all of the information requested in the form. To request a copy of the complaint form, call (866) 632–9992. Submit your completed form or letter to USDA by: (1) mail: U.S. Department of Agriculture, Office of the Assistant Secretary for Civil Rights, 1400 Independence Avenue, SW, Washington, D.C. 20250–9410; (2) fax: (202) 690–7442; or (3) email: [email protected] is an equal opportunity provider, employer, and lender.