stronger academe-industry collaboration for sustained reforms … · stronger academe-industry...
TRANSCRIPT
STRONGER academe-industry
collaboration for sustained
reforms IN basic education!Elvin Uy
Philippine Business for Social Progress 25 September 2018
Presentation outline!
2
1. Labor Force and Youth Employment
2. K to 12: Exits and 21st Century Skills
3. Skills for Success
4. Strengthening the Curriculum Support System
5. Academe-Industry Collaboration in Basic Education
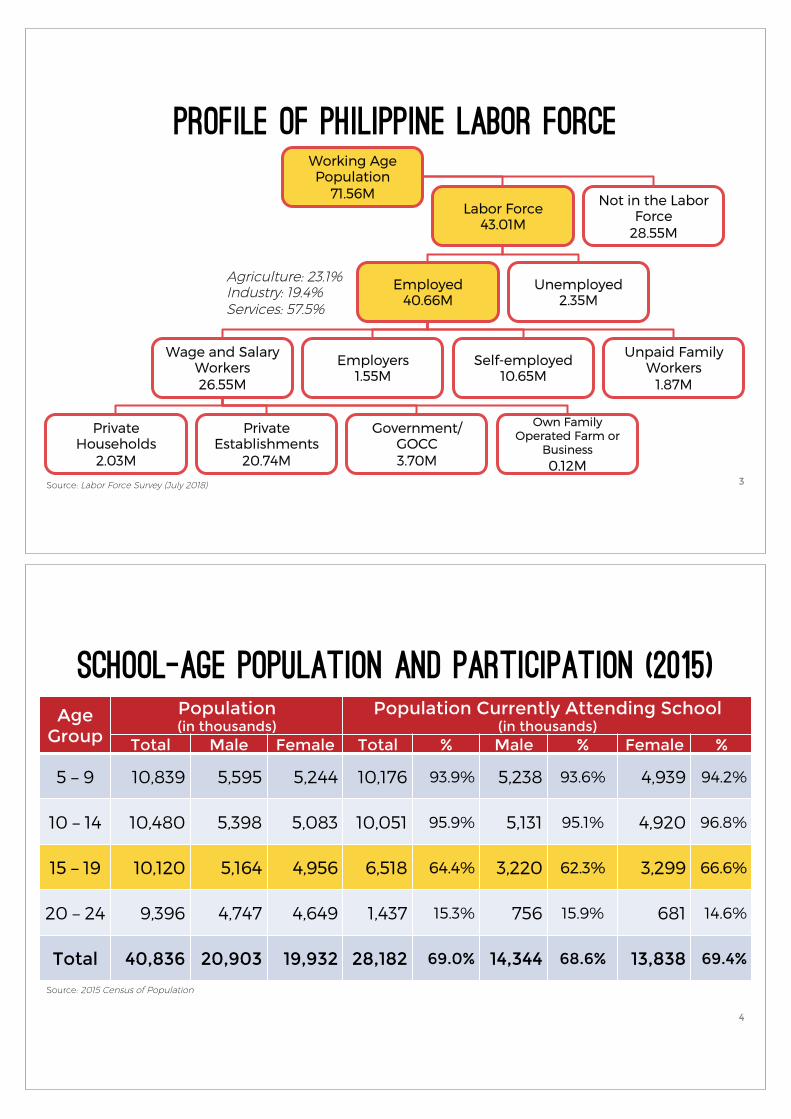
Profile of Philippine labor Force!
3
Working Age Population
71.56M Labor Force
43.01M
Not in the Labor Force
28.55M
Employed 40.66M
Unemployed 2.35M
Wage and Salary Workers 26.55M
Employers 1.55M
Self-employed 10.65M
Unpaid Family Workers
1.87M
Private Households
2.03M
Private Establishments
20.74M
Government/ GOCC 3.70M
Own Family Operated Farm or
Business 0.12M
Source: Labor Force Survey (July 2018)
Agriculture: 23.1% Industry: 19.4% Services: 57.5%
Age Group
Population (in thousands)
Population Currently Attending School (in thousands)
Total Male Female Total % Male % Female %
5 – 9 10,839 5,595 5,244 10,176 93.9% 5,238 93.6% 4,939 94.2%
10 – 14 10,480 5,398 5,083 10,051 95.9% 5,131 95.1% 4,920 96.8%
15 – 19 10,120 5,164 4,956 6,518 64.4% 3,220 62.3% 3,299 66.6%
20 – 24 9,396 4,747 4,649 1,437 15.3% 756 15.9% 681 14.6%
Total 40,836 20,903 19,932 28,182 69.0% 14,344 68.6% 13,838 69.4%
School-Age Population and Participation (2015)!
Source: 2015 Census of Population
4
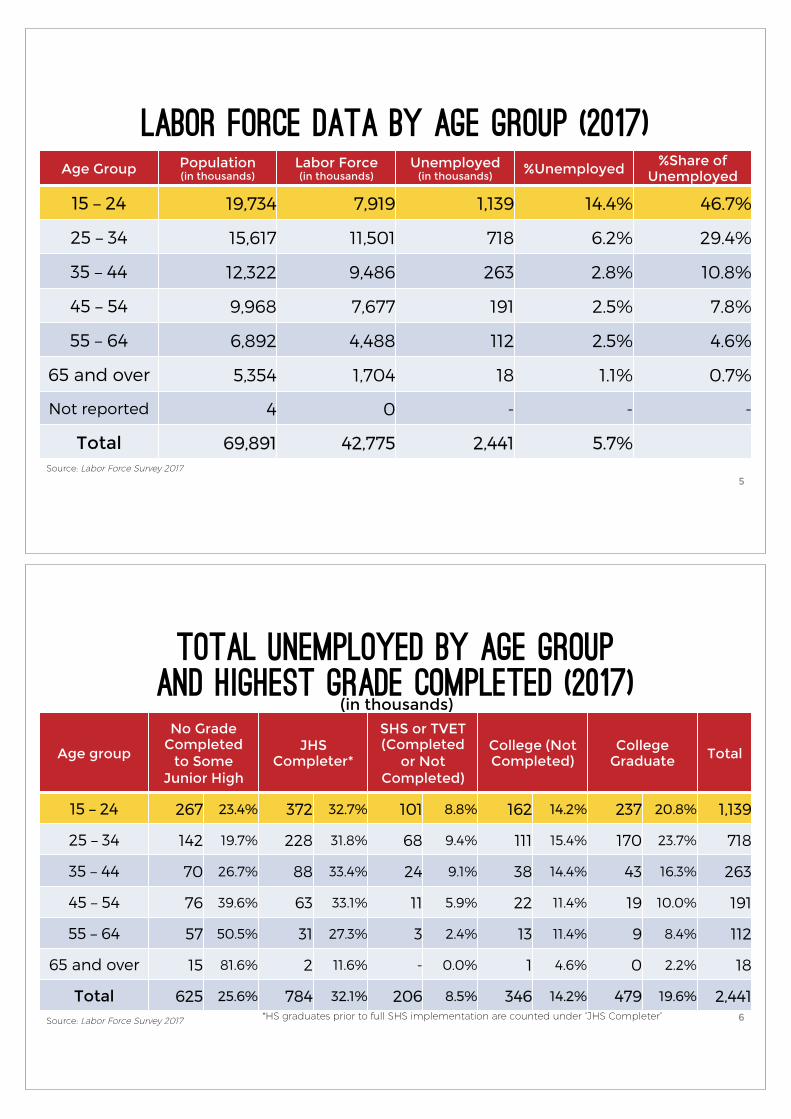
Age Group Population (in thousands)
Labor Force (in thousands)
Unemployed (in thousands) %Unemployed %Share of
Unemployed
15 – 24 19,734 7,919 1,139 14.4% 46.7%
25 – 34 15,617 11,501 718 6.2% 29.4%
35 – 44 12,322 9,486 263 2.8% 10.8%
45 – 54 9,968 7,677 191 2.5% 7.8%
55 – 64 6,892 4,488 112 2.5% 4.6%
65 and over 5,354 1,704 18 1.1% 0.7%
Not reported 4 0 - - -
Total 69,891 42,775 2,441 5.7%
Labor force data by age group (2017)!
Source: Labor Force Survey 2017 5
Age group
No Grade Completed
to Some Junior High
JHS Completer*
SHS or TVET (Completed
or Not Completed)
College (Not Completed)
College Graduate Total
15 – 24 267 23.4% 372 32.7% 101 8.8% 162 14.2% 237 20.8% 1,139
25 – 34 142 19.7% 228 31.8% 68 9.4% 111 15.4% 170 23.7% 718
35 – 44 70 26.7% 88 33.4% 24 9.1% 38 14.4% 43 16.3% 263
45 – 54 76 39.6% 63 33.1% 11 5.9% 22 11.4% 19 10.0% 191
55 – 64 57 50.5% 31 27.3% 3 2.4% 13 11.4% 9 8.4% 112
65 and over 15 81.6% 2 11.6% - 0.0% 1 4.6% 0 2.2% 18
Total 625 25.6% 784 32.1% 206 8.5% 346 14.2% 479 19.6% 2,441
Total unemployed by age group AND highest grade completed (2017)!
(in thousands)
6 Source: Labor Force Survey 2017 *HS graduates prior to full SHS implementation are counted under “JHS Completer”

Skills
mismatch!
Types of labor market mismatch!
Qualification
mismatch!
Regional & Sectoral mismatch!
Worker Skills required job skills!
Skills Deficit (skill gap)
Skill underutilization (overskilling)
Worker educational qualifications required educational qualifications!
Under-education Over-education worker’s
educational qualifications
< job
educational qualifications
worker’s educational
qualifications >
job educational
qualifications
Where potential employees are JOB OPENING LOCATIONS & SECTORS !
worker’s skills < job requirement worker’s skills > job requirement
Source: European Commission, 2012
Median time to find first job and wage job!
8
First Job Wage Job All youth 2 3 Males 3 3 Females 2 3 High school or less 3 4 At least some college education 1 2 Source: ADB Household Survey (2008)
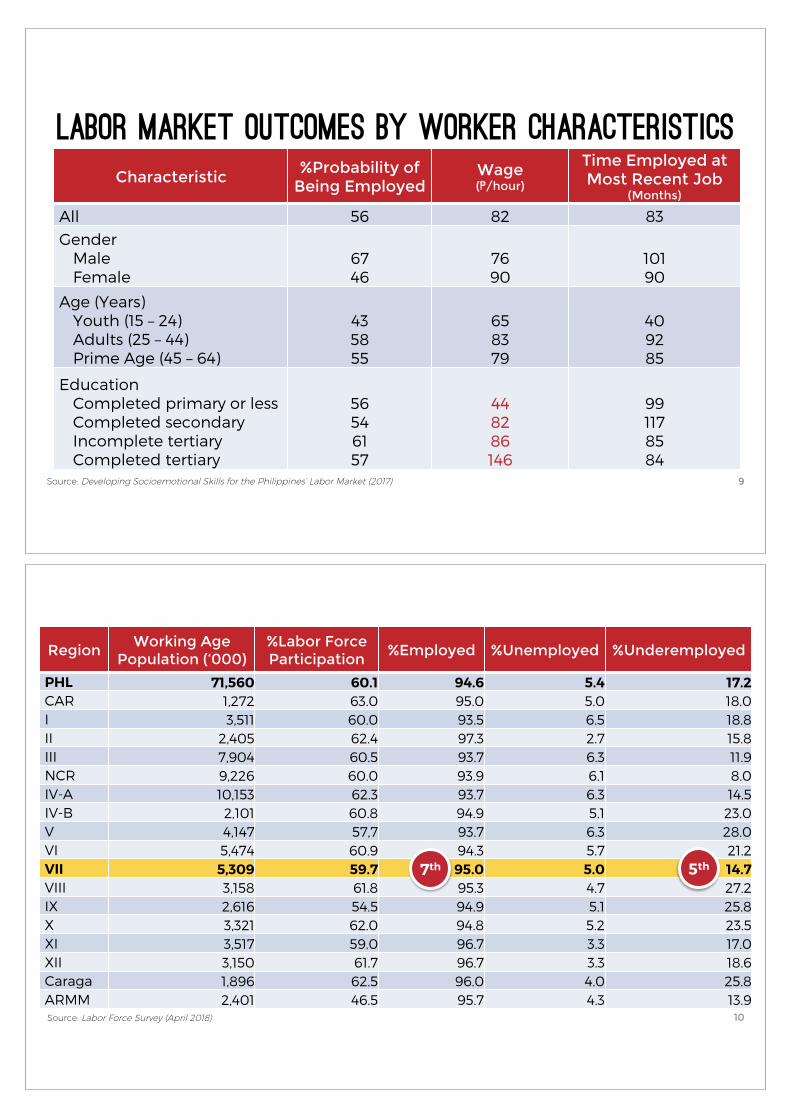
Labor market outcomes by worker characteristics!
9
Characteristic %Probability of
Being Employed Wage ( /hour)
Time Employed at Most Recent Job
(Months) All 56 82 83 Gender
Male Female
67 46
76 90
101 90
Age (Years) Youth (15 – 24) Adults (25 – 44) Prime Age (45 – 64)
43 58 55
65 83 79
40 92 85
Education Completed primary or less Completed secondary Incomplete tertiary Completed tertiary
56 54 61 57
44 82 86 146
99 117 85 84
Source: Developing Socioemotional Skills for the Philippines’ Labor Market (2017)
10
Region Working Age
Population (‘000) %Labor Force Participation
%Employed %Unemployed %Underemployed
PHL 71,560 60.1 94.6 5.4 17.2 CAR 1,272 63.0 95.0 5.0 18.0 I 3,511 60.0 93.5 6.5 18.8 II 2,405 62.4 97.3 2.7 15.8 III 7,904 60.5 93.7 6.3 11.9 NCR 9,226 60.0 93.9 6.1 8.0 IV-A 10,153 62.3 93.7 6.3 14.5 IV-B 2,101 60.8 94.9 5.1 23.0 V 4,147 57,7 93.7 6.3 28.0 VI 5,474 60.9 94.3 5.7 21.2 VII 5,309 59.7 95.0 5.0 14.7 VIII 3,158 61.8 95.3 4.7 27.2 IX 2,616 54.5 94.9 5.1 25.8 X 3,321 62.0 94.8 5.2 23.5 XI 3,517 59.0 96.7 3.3 17.0 XII 3,150 61.7 96.7 3.3 18.6 Caraga 1,896 62.5 96.0 4.0 25.8 ARMM 2,401 46.5 95.7 4.3 13.9 Source: Labor Force Survey (April 2018)
7th 5th
Presentation outline!
11
1. Labor Force and Youth Employment
2. K to 12: Exits and 21st Century Skills
3. Skills for Success
4. Strengthening the Curriculum Support System
5. Academe-Industry Collaboration in Basic Education
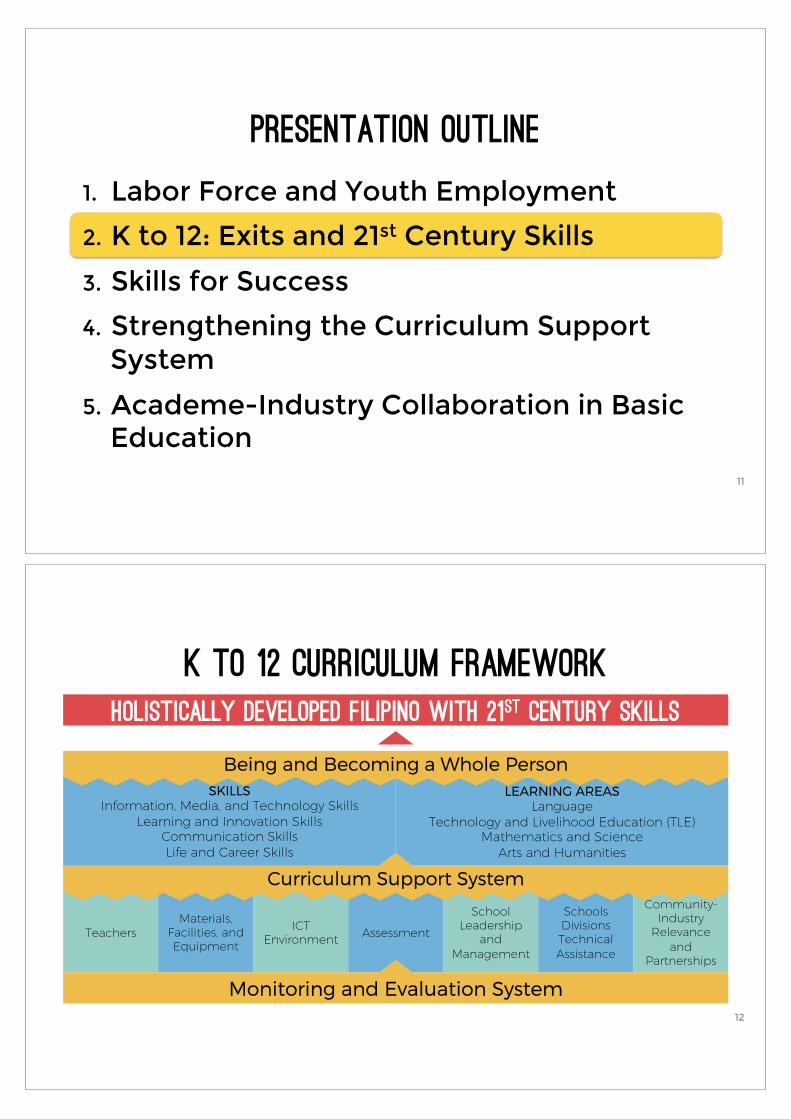
SKILLS Information, Media, and Technology Skills
Learning and Innovation Skills Communication Skills Life and Career Skills
LEARNING AREAS Language
Technology and Livelihood Education (TLE) Mathematics and Science
Arts and Humanities
Materials, Facilities, and Equipment
ICT Environment Assessment
School Leadership
and Management
Schools Divisions Technical Assistance
Community-Industry
Relevance and
Partnerships
Teachers
K to 12 Curriculum Framework!
Monitoring and Evaluation System
Curriculum Support System
Holistically Developed Filipino with 21st Century Skills!
Being and Becoming a Whole Person
12
K to 12: Lifelong Learning for Inclusive Growth!
13
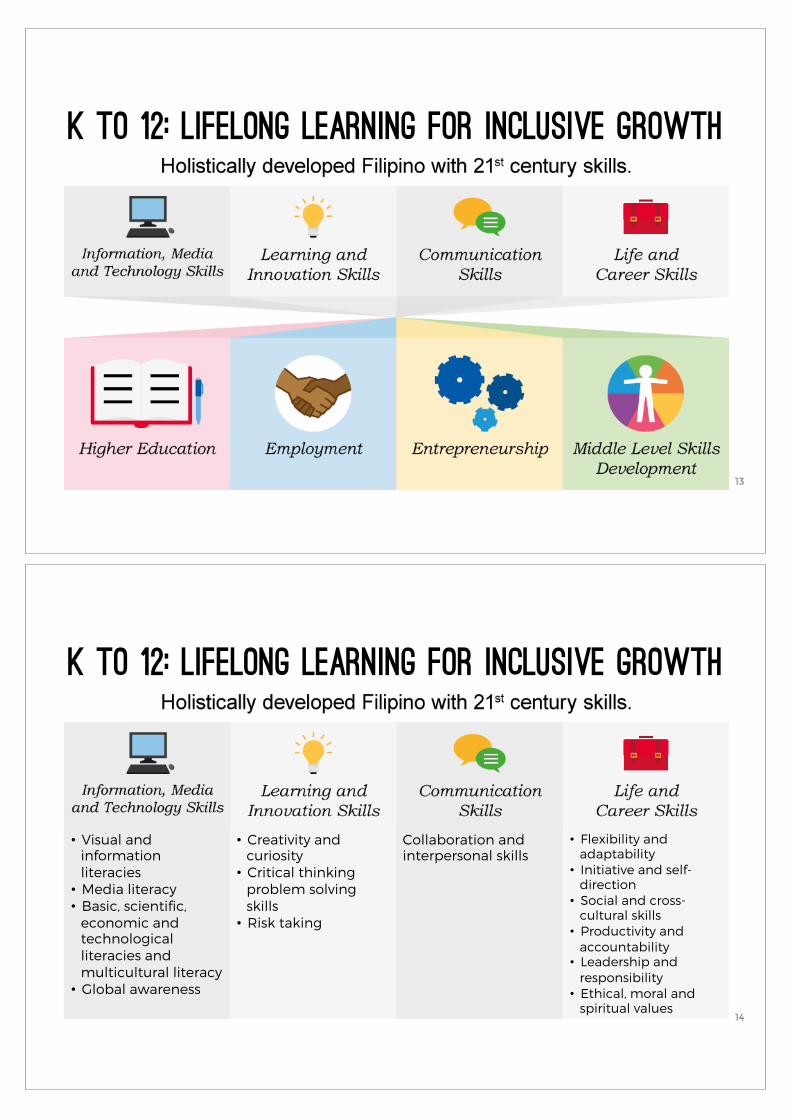
K to 12: Lifelong Learning for Inclusive Growth!
14
• Visual and information literacies • Media literacy • Basic, scientific,
economic and technological literacies and multicultural literacy • Global awareness
• Creativity and curiosity • Critical thinking
problem solving skills • Risk taking
Collaboration and interpersonal skills
• Flexibility and adaptability
• Initiative and self-direction
• Social and cross-cultural skills
• Productivity and accountability
• Leadership and responsibility
• Ethical, moral and spiritual values
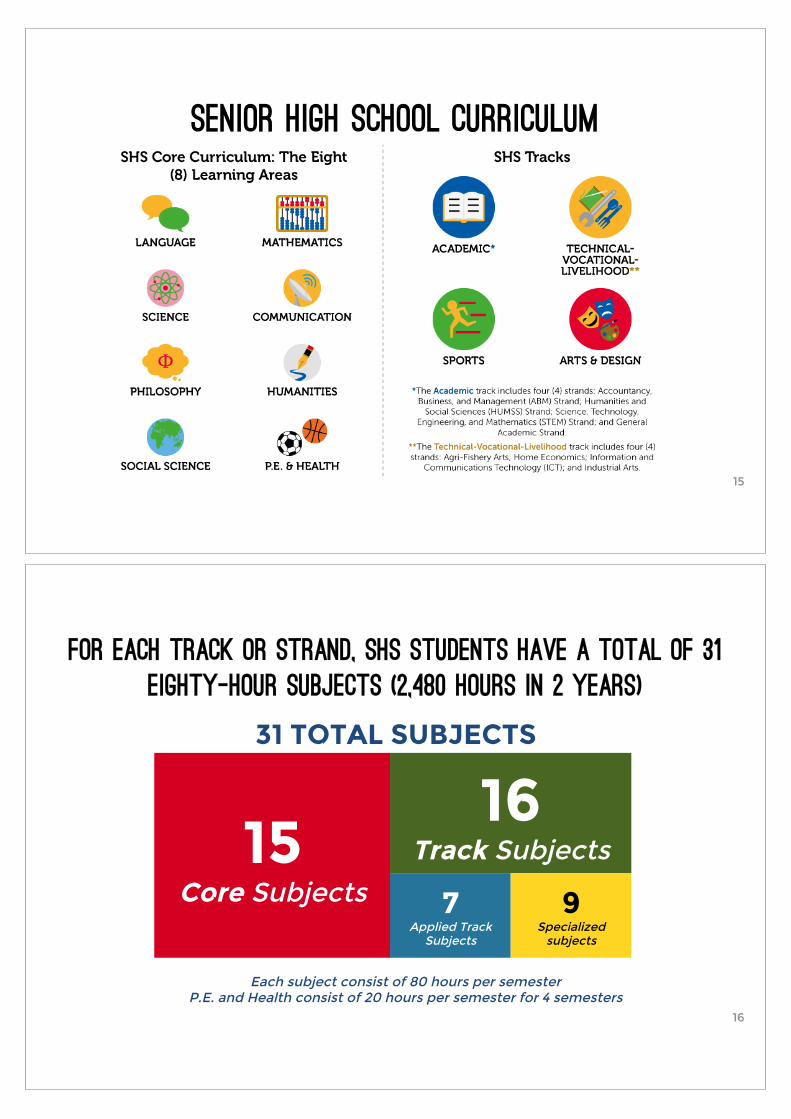
SENIOR HIGH SCHOOL CURRICULUM!
15
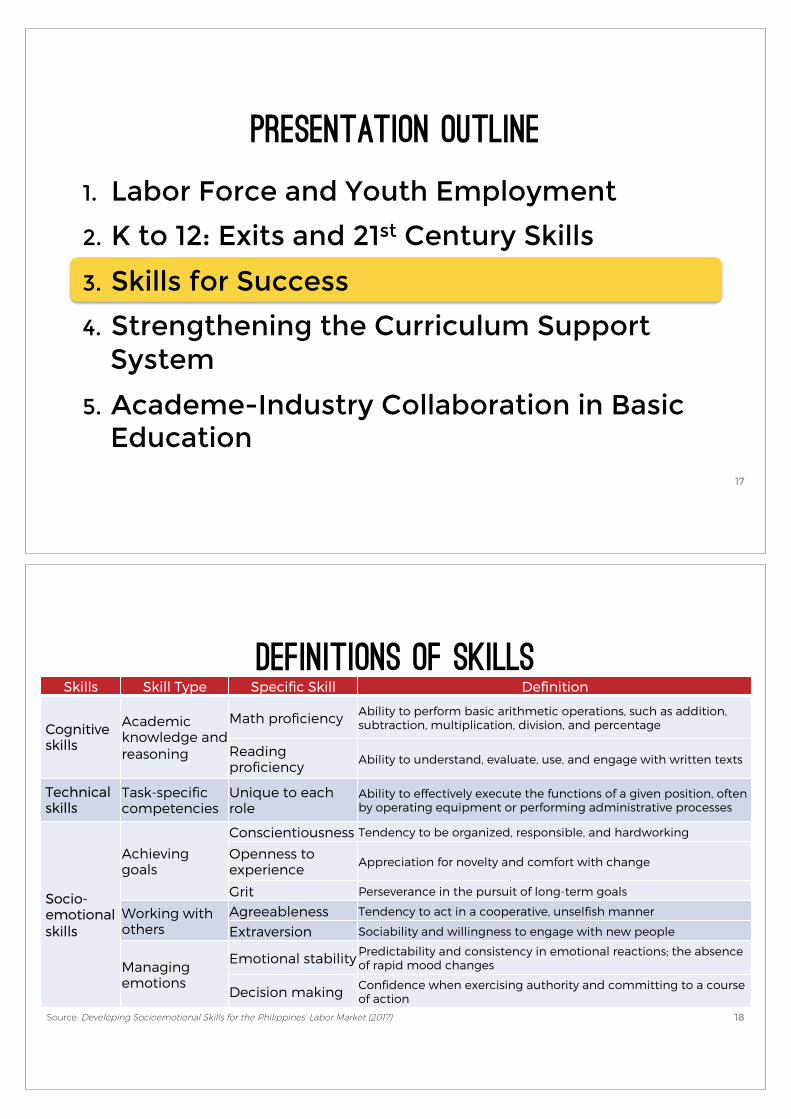
For Each Track or Strand, SHS Students have a total of 31
eighty-hour subjects (2,480 hours in 2 Years)!
15 Core Subjects
16 Track Subjects
7 Applied Track
Subjects
9 Specialized
subjects
31 TOTAL SUBJECTS
Each subject consist of 80 hours per semester P.E. and Health consist of 20 hours per semester for 4 semesters
16
Presentation outline!
17
1. Labor Force and Youth Employment
2. K to 12: Exits and 21st Century Skills
3. Skills for Success
4. Strengthening the Curriculum Support System
5. Academe-Industry Collaboration in Basic Education
Skills Skill Type Specific Skill Definition
Cognitive skills
Academic knowledge and reasoning
Math proficiency Ability to perform basic arithmetic operations, such as addition, subtraction, multiplication, division, and percentage
Reading proficiency Ability to understand, evaluate, use, and engage with written texts
Technical skills
Task-specific competencies
Unique to each role
Ability to effectively execute the functions of a given position, often by operating equipment or performing administrative processes
Socio-emotional skills
Achieving goals
Conscientiousness Tendency to be organized, responsible, and hardworking
Openness to experience Appreciation for novelty and comfort with change
Grit Perseverance in the pursuit of long-term goals
Working with others
Agreeableness Tendency to act in a cooperative, unselfish manner
Extraversion Sociability and willingness to engage with new people
Managing emotions
Emotional stability Predictability and consistency in emotional reactions; the absence of rapid mood changes
Decision making Confidence when exercising authority and committing to a course of action
Definitions of skills!
18 Source: Developing Socioemotional Skills for the Philippines’ Labor Market (2017)

Top 5 skills!Behavioral Skills
hirers look for in Fresh Grads!
functional Skills hirers look for in
Fresh Grads!
• Willingness to learn
• Initiative • Honesty and
Integrity • Self-motivated
or self-starter • Self-confidence
• Communication skills
• Trainability • Competence • Problem solving
and analytical skills
• Tech know-how
Future in-demand skills!
• Complex problem-solving • Critical thinking • Creativity • People management • Coordinating with others • Emotional intelligence • Service orientation • Decision-making • Negotiation • Cognitive thinking
Source: JobStreet.com (2015) Source: DOLE (2017)
19
HIRING CONSTRAINTS AND CORRESPONDING TRAININGS PROVIDED BY FIRMS!
0 20 40 60 80 100%
Managerial and leadership skills
Work ethic and commitment
Interpersonal & communication skills
Technical, vocational or job-specific skills
Foreign language skill/ Others
Computer or general IT skills
Writing skills
30%
18%
22%
11%
8%
5%
6%
Trainings provided by firms (primary focus area)
Most valued skills but difficult to acquire from applicants
Source: Developing Socioemotional Skills for the Philippines’ Labor Market (2017) 20
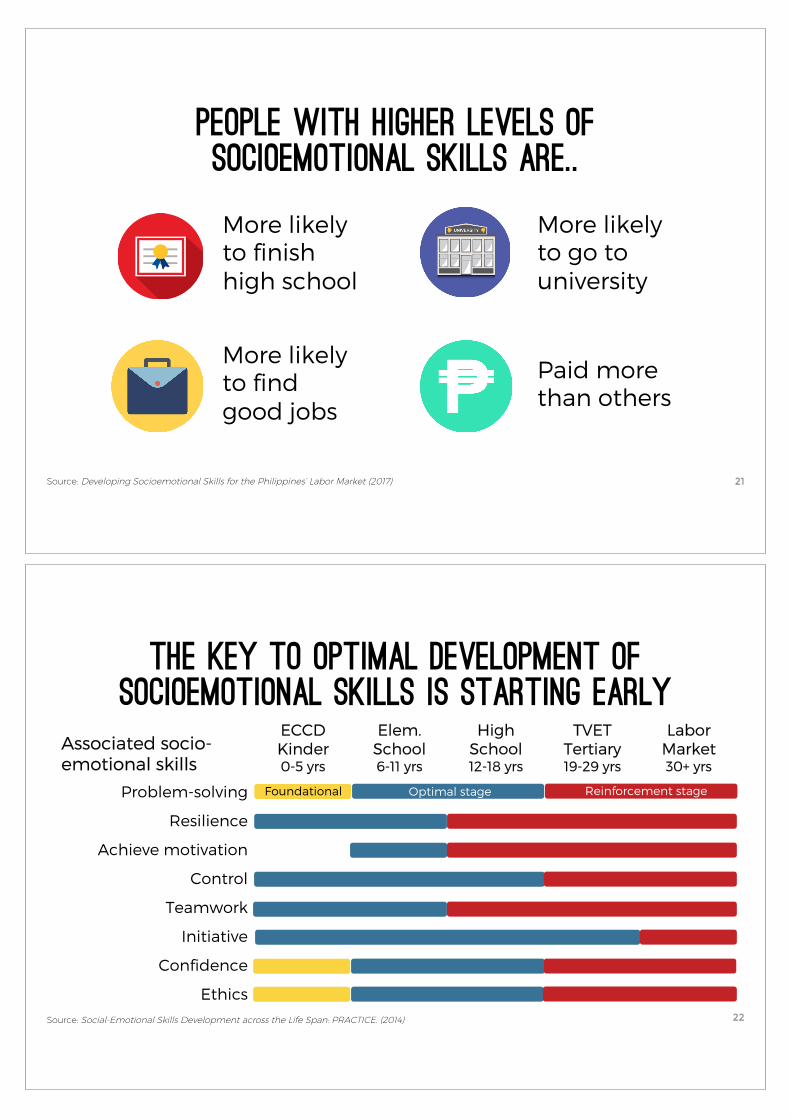
People with higher levels of socioemotional skills are..!
More likely to finish high school
More likely to go to university
More likely to find good jobs
Paid more than others
21 Source: Developing Socioemotional Skills for the Philippines’ Labor Market (2017)
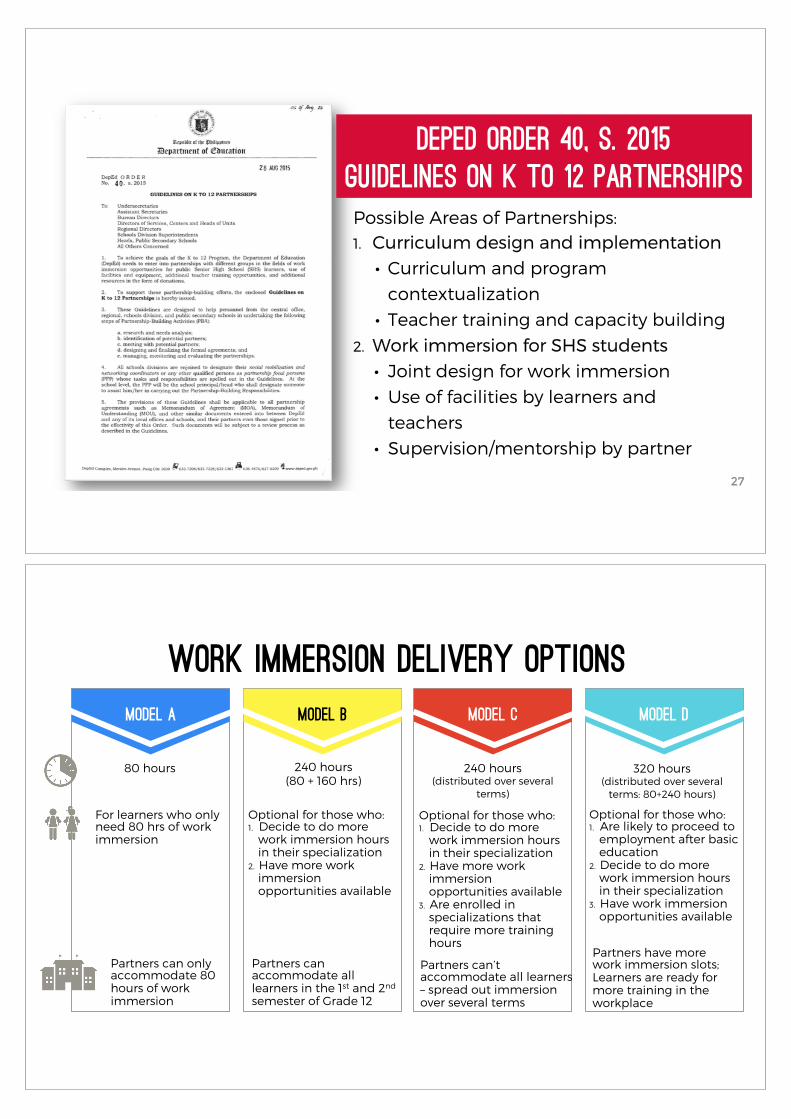
Associated socio-emotional skills
ECCD Kinder 0-5 yrs
Elem. School 6-11 yrs
High School 12-18 yrs
TVET Tertiary 19-29 yrs
Labor Market 30+ yrs
Problem-solving
Resilience
Achieve motivation
Control
Teamwork
Initiative
Confidence
Ethics
The key to optimal development of socioemotional skills is starting early!
Foundational Optimal stage Reinforcement stage
Source: Social-Emotional Skills Development across the Life Span: PRACTICE. (2014) 22

Presentation outline!
23
1. Labor Force and Youth Employment
2. K to 12: Exits and 21st Century Skills
3. Skills for Success
4. Strengthening the Curriculum Support System
5. Academe-Industry Collaboration in Basic Education
SKILLS Information, Media, and Technology Skills
Learning and Innovation Skills Communication Skills Life and Career Skills
LEARNING AREAS Language
Technology and Livelihood Education (TLE) Mathematics and Science
Arts and Humanities
Materials, Facilities, and Equipment
ICT Environment Assessment
School Leadership
and Management
Schools Divisions Technical Assistance
Community-Industry
Relevance and
Partnerships
Teachers
K to 12 Curriculum Framework!
Monitoring and Evaluation System
Curriculum Support System
Holistically Developed Filipino with 21st Century Skills!
Being and Becoming a Whole Person
24

Strengthening the curriculum support system!
25
Component Gap Opportunity
Teachers • Mastery of assigned subject/s • Lack of familiarity with industry
context
• Support for continuing professional development
• Industry exposure and education activities
Materials, Facilities, and Equipment
• Lack of learning resources • Delays in availability of facilities/tools
• Supplemental materials • Offsite training programs
ICT Environment Delays in availability of ICT packages School outreach ICT programs Assessment
School Leadership and Management
• Capacity for career guidance and advocacy
• Capacity for non-curricular roles (e.g. financial, stakeholder management)
• Joint career guidance, advocacy, and placement programs
• Support for continuing professional development
Schools Division Technical Assistance
Lack of bandwidth for effective supervision and technical assistance
Support for continuing professional development
Community-Industry Relevance and Partnerships
Lack of sustained and strategic partnerships between DepEd/schools and industries
Organization of local education-industry collaboration councils
Monitoring & Evaluation Dearth of outcome indicators/data Support for graduate tracer programs and
longitudinal SHS research
Presentation outline!
26
1. Labor Force and Youth Employment
2. K to 12: Exits and 21st Century Skills
3. Skills for Success
4. Strengthening the Curriculum Support System
5. Academe-Industry Collaboration in Basic Education
27
Deped order 40, s. 2015
Guidelines on k to 12 Partnerships!
Possible Areas of Partnerships: 1. Curriculum design and implementation
• Curriculum and program contextualization
• Teacher training and capacity building 2. Work immersion for SHS students • Joint design for work immersion • Use of facilities by learners and
teachers • Supervision/mentorship by partner
Work immersion delivery options!
MODEL A! MODEL B! MODEL C! MODEL D!
80 hours 240 hours (80 + 160 hrs)
240 hours (distributed over several
terms)
320 hours (distributed over several
terms: 80+240 hours)
For learners who only need 80 hrs of work immersion
Optional for those who: 1. Decide to do more
work immersion hours in their specialization
2. Have more work immersion opportunities available
Optional for those who: 1. Decide to do more
work immersion hours in their specialization
2. Have more work immersion opportunities available
3. Are enrolled in specializations that require more training hours
Optional for those who: 1. Are likely to proceed to
employment after basic education
2. Decide to do more work immersion hours in their specialization
3. Have work immersion opportunities available
Partners can only accommodate 80 hours of work immersion
Partners can accommodate all learners in the 1st and 2nd semester of Grade 12
Partners can’t accommodate all learners – spread out immersion over several terms
Partners have more work immersion slots; Learners are ready for more training in the workplace

MODEL A! MODEL B! MODEL C! MODEL D!
options! 1. Gr 9 to Gr 11: 640-hr specialization Gr 12: 160-hr specialization 2. Gr 11: 320-hr specialization Gr 12: 160-hr specialization 3. Gr 11: Three 160-hr specialization Gr 12, 2nd sem: work immersion
640-hr specialization: 1. Gr 11: take first 320 hrs Summer: 120 hrs work immersion Gr 12, 1st sem: 160-hr specialization Sem break: 40 hrs work immersion Gr 12, 2nd sem: 160-hr specialization and 80 hrs work immersion 2. Gr 11: 320-hr specialization Summer: 160 hrs work immersion Gr 12, 1st sem: 320-hr specialization Gr 12, 2nd sem: 80 hrs work immersion
480-hr specialization: 1. Gr 11: take 320-hr specialization Summer: 80 hrs work immersion Gr 12, 1st sem: 160-hr specialization Gr 12, 2nd sem: 240 hrs work immersion 2. Gr 11: 320-hr specialization Summer: 40 hrs work immersion Gr 12, 1st sem: 240 hr work immersion Sem break: 40 hr work immersion Gr 12, 2nd sem: 160-hr specialization
Work immersion delivery options!
pbsp.org pbsporgwww.pbsp.org.ph