strip diagrams: illuminating proportions - math...
TRANSCRIPT
536 MatheMatics teaching in the Middle school ● Vol. 18, No. 9, May 2013
illuminatingilluminatingproportionsA running problem, among others, can help
students model proportional thinking.
RIC
HVI
NTA
GE/
ISTO
CK
PH
OTO
illuminatingstrip diagrams:
Jessica S. Cohen
pp and Bay-Williams 2010).It is well documented that pro-
portionality is a complex and time-consuming concept to master (Hoffer and Hoffer 1988; Lesh, Post, and Behr 1988). This is compounded by the tendency to teach proportional reason-ing through the cross-multiplication algorithm (Lesh, Post, and Behr 1988). Although this algorithm is a useful tool for solving proportion problems, students can successfully implement the algorithm without using or demon-strating proportional thinking.
It is common for the preservice teachers I work with to be able to properly set up the equivalent ratios needed to solve a proportion problem and effi ciently use the cross-product
Proportional reasoning is both com-plex and layered, making it challeng-ing to defi ne. Lamon (1999) identifi ed characteristics of proportional think-ers, such as being able to understand covariance of quantities; distinguish between proportional and nonpropor-tional relationships; use a variety of strategies fl exibly, most of which are nonalgorithmic, to solve proportion problems and compare ratios; and un-derstand ratios as being separate from the quantities they compare. Propor-tional reasoning is multifaceted and is not an all-or-nothing ability. Rather, it is a collection of understandings and abilities that must be developed through a range of activities and experiences (Van de Walle, Karp,
Copyright © 2013 The National Council of Teachers of Mathematics, Inc. www.nctm.org. All rights reserved.This material may not be copied or distributed electronically or in any other format without written permission from NCTM.

Vol. 18, No. 9, May 2013 ● MatheMatics teaching in the Middle school 537
strip diagrams:
538 MatheMatics teaching in the Middle school ● Vol. 18, No. 9, May 2013
algorithm to fi nd a solution. How-ever, it is also common for these same preservice teachers to be unable to ar-ticulate the covariation in the problem or to be able to identify an alternate solution strategy. These skills are two components of Lamon’s hallmarks of proportional thinkers. Including alternate methods, particularly those that provide deeper insight into the proportionality at the heart of the problem, can help students develop their proportional reasoning abilities.
Using Singapore strip diagrams (Beckmann 2004) can be a particularly effective strategy for solving propor-tion problems, building proportional reasoning skills, and connecting pro-portionality to other mathematical
topics. These simple, visual models use strips to represent known and unknown quantities in problems in a meaningful way by displaying relation-ships between those quantities.
Strip diagrams were presented to students in a mixed mathematics con-tent and methods course for preservice elementary and middle-grades teachers. This strategy was one of several given for solving ratio and proportion prob-lems. These students began a propor-tional reasoning unit by considering proportion problems that did not involve numbers (see fi g. 1). These problems had been adapted from the NCTM 2002 Yearbook companion (Litwiller and Bright 2002). Proportion prob-lems without numbers were included to ensure that students used nonalgo-rithmic thinking and to help students distinguish between proportional and nonproportional relationships.
Students then encountered propor-tion problems with numbers and were allowed to use their own strategies to solve other proportion problems, provided they could explain why the strategy worked. This part of the unit was included to help students develop a range of nonalgorithmic strategies for solving proportions. It revealed students’ developing understanding of covariance and of ratios and quantities as different mathematical entities. Students also learned how to use ratio tables and were fi nally shown strip diagrams.
The goal of this part of the unit was to help students continue to build an understanding of covariance. The ap-proach was to connect the strips model to the relationship between covary-ing quantities and to use this model to deepen their understanding of the cross-multiplication algorithm. Devel-oping a meaningful understanding of the algorithm, with particular focus on why it can be used to solve proportion problems, is important for preservice teachers who will then be teaching the algorithm to their own students.
A description of preservice teach-ers’ use of strip diagrams follows. It highlights their evolving perception of the usefulness of the strategy and
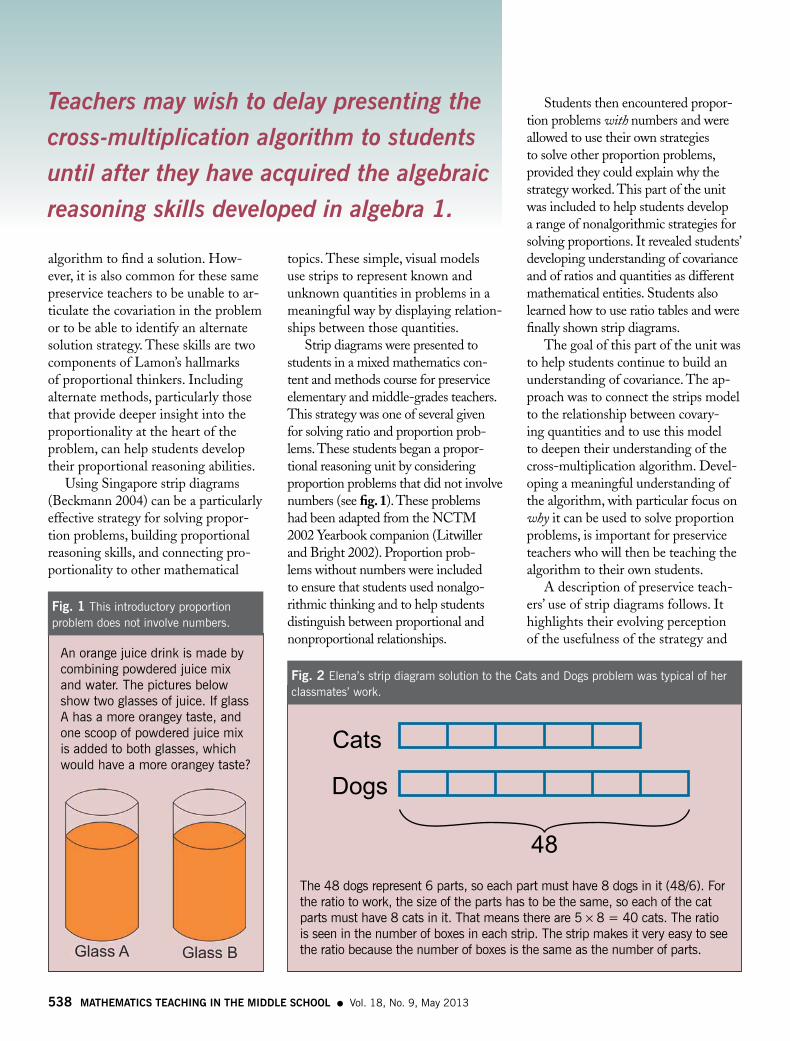
An orange juice drink is made by combining powdered juice mix and water. The pictures below show two glasses of juice. If glass A has a more orangey taste, and one scoop of powdered juice mix is added to both glasses, which would have a more orangey taste?
The 48 dogs represent 6 parts, so each part must have 8 dogs in it (48/6). For the ratio to work, the size of the parts has to be the same, so each of the cat parts must have 8 cats in it. That means there are 5 × 8 = 40 cats. The ratio is seen in the number of boxes in each strip. The strip makes it very easy to see the ratio because the number of boxes is the same as the number of parts.
Fig. 1 This introductory proportion problem does not involve numbers.
Fig. 2 Elena’s strip diagram solution to the Cats and Dogs problem was typical of her classmates’ work.
Teachers may wish to delay presenting the cross-multiplication algorithm to students until after they have acquired the algebraic reasoning skills developed in algebra 1.
Vol. 18, No. 9, May 2013 ● MatheMatics teaching in the Middle school 539
the use of strip diagrams to build insight about the cross-multiplication algorithm. Although the problems described were used with preservice teachers, many tasks in the unit were adapted from materials intended for middle school students.
strip diagraMs in practiceStudents were initially presented with the following Cats and Dogs problem:
An animal shelter has 5 cats for every 6 dogs. If the shelter has 48 dogs, how many cats must it have?
Students were asked to find a solution using a strip diagram and consider how the strip diagram emphasized the ratio of cats to dogs. The most common student response is shown in figure 2. The consensus was that the problem was fairly straightforward; students had virtually no issues while using the strip diagram. Moreover, most students identified the ratio in the problem, and many students explicitly stated that the strip diagram emphasized the ratio.
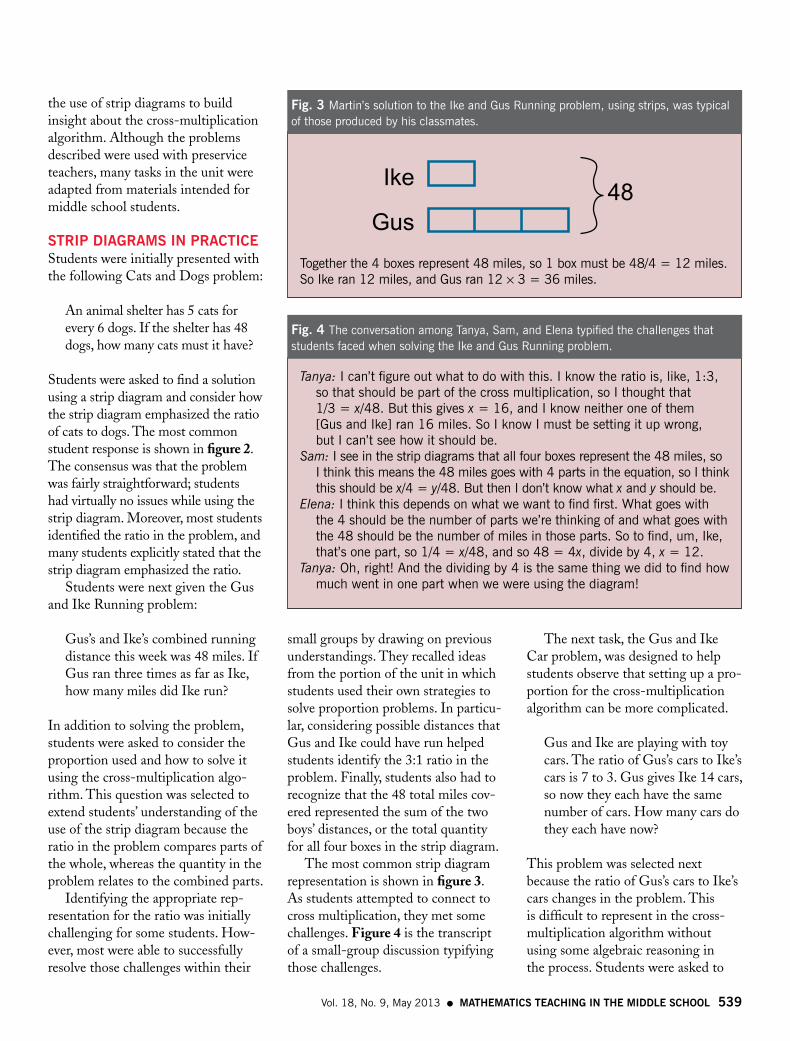
Students were next given the Gus and Ike Running problem:
Gus’s and Ike’s combined running distance this week was 48 miles. If Gus ran three times as far as Ike, how many miles did Ike run?
In addition to solving the problem, students were asked to consider the proportion used and how to solve it using the cross-multiplication algo-rithm. This question was selected to extend students’ understanding of the use of the strip diagram because the ratio in the problem compares parts of the whole, whereas the quantity in the problem relates to the combined parts.
Identifying the appropriate rep-resentation for the ratio was initially challenging for some students. How-ever, most were able to successfully resolve those challenges within their
small groups by drawing on previous understandings. They recalled ideas from the portion of the unit in which students used their own strategies to solve proportion problems. In particu-lar, considering possible distances that Gus and Ike could have run helped students identify the 3:1 ratio in the problem. Finally, students also had to recognize that the 48 total miles cov-ered represented the sum of the two boys’ distances, or the total quantity for all four boxes in the strip diagram.
The most common strip diagram representation is shown in figure 3. As students attempted to connect to cross multiplication, they met some challenges. Figure 4 is the transcript of a small-group discussion typifying those challenges.
The next task, the Gus and Ike Car problem, was designed to help students observe that setting up a pro-portion for the cross-multiplication algorithm can be more complicated.
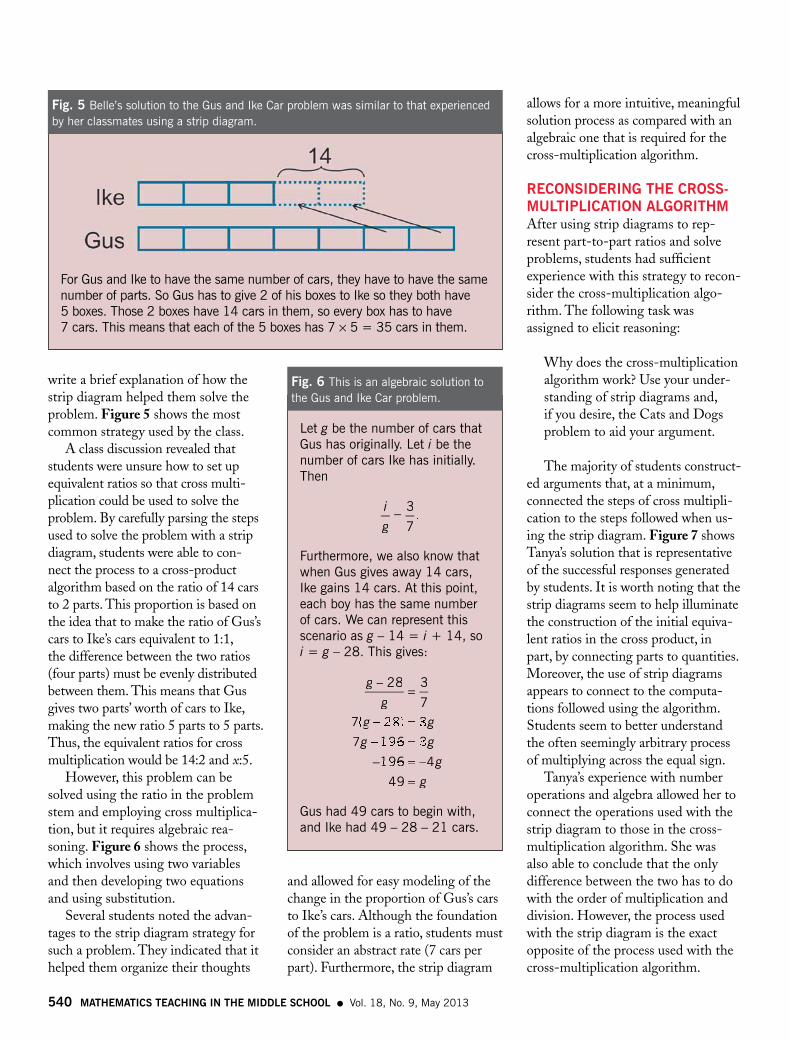
Gus and Ike are playing with toy cars. The ratio of Gus’s cars to Ike’s cars is 7 to 3. Gus gives Ike 14 cars, so now they each have the same number of cars. How many cars do they each have now?
This problem was selected next because the ratio of Gus’s cars to Ike’s cars changes in the problem. This is difficult to represent in the cross-multiplication algorithm without using some algebraic reasoning in the process. Students were asked to
Together the 4 boxes represent 48 miles, so 1 box must be 48/4 = 12 miles. So Ike ran 12 miles, and Gus ran 12 × 3 = 36 miles.
Fig. 3 Martin’s solution to the Ike and Gus Running problem, using strips, was typical of those produced by his classmates.
Tanya: I can’t figure out what to do with this. I know the ratio is, like, 1:3, so that should be part of the cross multiplication, so I thought that 1/3 = x/48. But this gives x = 16, and I know neither one of them [Gus and Ike] ran 16 miles. So I know I must be setting it up wrong, but I can’t see how it should be.
Sam: I see in the strip diagrams that all four boxes represent the 48 miles, so I think this means the 48 miles goes with 4 parts in the equation, so I think this should be x/4 = y/48. But then I don’t know what x and y should be.
Elena: I think this depends on what we want to find first. What goes with the 4 should be the number of parts we’re thinking of and what goes with the 48 should be the number of miles in those parts. So to find, um, Ike, that’s one part, so 1/4 = x/48, and so 48 = 4x, divide by 4, x = 12.
Tanya: Oh, right! And the dividing by 4 is the same thing we did to find how much went in one part when we were using the diagram!
Fig. 4 The conversation among Tanya, Sam, and Elena typified the challenges that students faced when solving the Ike and Gus Running problem.
540 MatheMatics teaching in the Middle school ● Vol. 18, No. 9, May 2013
allows for a more intuitive, meaningful solution process as compared with an algebraic one that is required for the cross-multiplication algorithm.
reconsidering the cross-MUltiplication algorithMAfter using strip diagrams to rep-resent part-to-part ratios and solve problems, students had suffi cient experience with this strategy to recon-sider the cross-multiplication algo-rithm. The following task was assigned to elicit reasoning:
Why does the cross-multiplication algorithm work? Use your under-standing of strip diagrams and, if you desire, the Cats and Dogs problem to aid your argument.
The majority of students construct-ed arguments that, at a minimum, connected the steps of cross multipli-cation to the steps followed when us-ing the strip diagram. Figure 7 shows Tanya’s solution that is representative of the successful responses generated by students. It is worth noting that the strip diagrams seem to help illuminate the construction of the initial equiva-lent ratios in the cross product, in part, by connecting parts to quantities. Moreover, the use of strip diagrams appears to connect to the computa-tions followed using the algorithm. Students seem to better understand the often seemingly arbitrary process of multiplying across the equal sign.
Tanya’s experience with number operations and algebra allowed her to connect the operations used with the strip diagram to those in the cross-multiplication algorithm. She was also able to conclude that the only difference between the two has to do with the order of multiplication and division. However, the process used with the strip diagram is the exact opposite of the process used with the cross-multiplication algorithm.
write a brief explanation of how the strip diagram helped them solve the problem. Figure 5 shows the most common strategy used by the class.
A class discussion revealed that students were unsure how to set up equivalent ratios so that cross multi-plication could be used to solve the problem. By carefully parsing the steps used to solve the problem with a strip diagram, students were able to con-nect the process to a cross-product algorithm based on the ratio of 14 cars to 2 parts. This proportion is based on the idea that to make the ratio of Gus’s cars to Ike’s cars equivalent to 1:1, the difference between the two ratios (four parts) must be evenly distributed between them. This means that Gus gives two parts’ worth of cars to Ike, making the new ratio 5 parts to 5 parts. Thus, the equivalent ratios for cross multiplication would be 14:2 and x:5.
However, this problem can be solved using the ratio in the problem stem and employing cross multiplica-tion, but it requires algebraic rea-soning. Figure 6 shows the process, which involves using two variables and then developing two equations and using substitution.
Several students noted the advan-tages to the strip diagram strategy for such a problem. They indicated that it helped them organize their thoughts
and allowed for easy modeling of the change in the proportion of Gus’s cars to Ike’s cars. Although the foundation of the problem is a ratio, students must consider an abstract rate (7 cars per part). Furthermore, the strip diagram
Let g be the number of cars that Gus has originally. Let i be the number of cars Ike has initially. Then
i
g=
3
7.
Furthermore, we also know that when Gus gives away 14 cars, Ike gains 14 cars. At this point, each boy has the same number of cars. We can represent this scenario as g – 14 = i + 14, so i = g – 28. This gives:
g
gg g
g g
g
g
−=
g g− =g g
− = −=
28 3
77 28 3g g8 3g gg g− =g g8 3g g− =g g
7 196g g196g gg g− =g g196g g− =g g3g g3g g
196− =196− = 4
49
( )g g( )g gg g− =g g( )g g− =g g7 2( )7 2g g7 2g g( )g g7 2g gg g− =g g7 2g g− =g g( )g g− =g g7 2g g− =g g8 3( )8 3g g8 3g g( )g g8 3g gg g− =g g8 3g g− =g g( )g g− =g g8 3g g− =g g
Gus had 49 cars to begin with, and Ike had 49 – 28 – 21 cars.
Fig. 6 This is an algebraic solution to the Gus and Ike Car problem.
For Gus and Ike to have the same number of cars, they have to have the same number of parts. So Gus has to give 2 of his boxes to Ike so they both have 5 boxes. Those 2 boxes have 14 cars in them, so every box has to have 7 cars. This means that each of the 5 boxes has 7 × 5 = 35 cars in them.
Fig. 5 Belle’s solution to the Gus and Ike Car problem was similar to that experienced by her classmates using a strip diagram.
Vol. 18, No. 9, May 2013 ● MatheMatics teaching in the Middle school 541
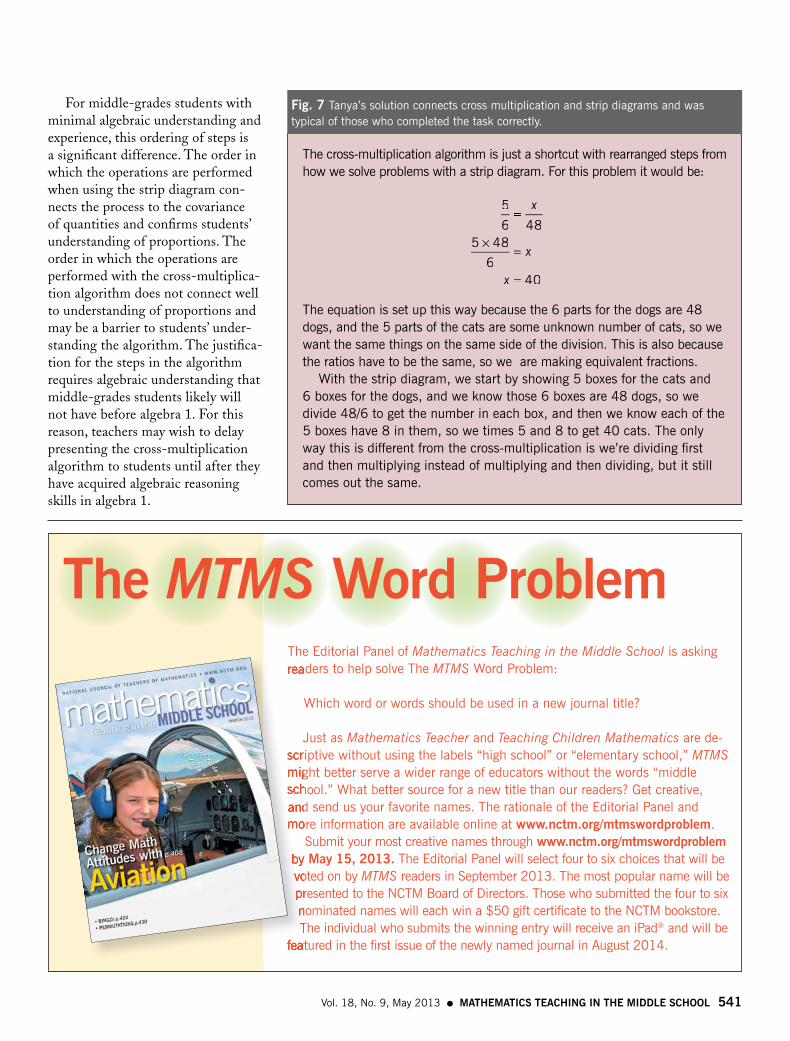
The cross-multiplication algorithm is just a shortcut with rearranged steps from how we solve problems with a strip diagram. For this problem it would be:
5
6===
=
=
x
x
x
485 4×5 4× 8
640
The equation is set up this way because the 6 parts for the dogs are 48 dogs, and the 5 parts of the cats are some unknown number of cats, so we want the same things on the same side of the division. This is also because the ratios have to be the same, so we are making equivalent fractions.
With the strip diagram, we start by showing 5 boxes for the cats and 6 boxes for the dogs, and we know those 6 boxes are 48 dogs, so we divide 48/6 to get the number in each box, and then we know each of the 5 boxes have 8 in them, so we times 5 and 8 to get 40 cats. The only way this is different from the cross-multiplication is we’re dividing fi rst and then multiplying instead of multiplying and then dividing, but it still comes out the same.
Fig. 7 Tanya’s solution connects cross multiplication and strip diagrams and was typical of those who completed the task correctly.
The Editorial Panel of Mathematics Teaching in the Middle School is asking readers to help solve The MTMS Word Problem:
Which word or words should be used in a new journal title?
Just as Mathematics Teacher and Teaching Children Mathematics are de-scriptive without using the labels “high school” or “elementary school,” MTMS might better serve a wider range of educators without the words “middle school.” What better source for a new title than our readers? Get creative, and send us your favorite names. The rationale of the Editorial Panel and more information are available online at www.nctm.org/mtmswordproblem.
Submit your most creative names through www.nctm.org/mtmswordproblem by May 15, 2013. The Editorial Panel will select four to six choices that will be voted on by MTMS readers in September 2013. The most popular name will be presented to the NCTM Board of Directors. Those who submitted the four to six nominated names will each win a $50 gift certifi cate to the NCTM bookstore. The individual who submits the winning entry will receive an iPad® and will be
featured in the fi rst issue of the newly named journal in August 2014.
readers to help solve The
Just as scriptive without using the labels “high school” or “elementary school,” might better serve a wider range of educators without the words “middle school.” What better source for a new title than our readers? Get creative, and send us your favorite names. The rationale of the Editorial Panel and more information are available online at
by voted on by presented to the NCTM Board of Directors. Those who submitted the four to six nominated names will each win a $50 gift certifi cate to the NCTM bookstore. The individual who submits the winning entry will receive an iPad
featured in the fi rst issue of the newly named journal in August 2014.
the MTMS Word problem
For middle-grades students with minimal algebraic understanding and experience, this ordering of steps is a signifi cant difference. The order in which the operations are performed when using the strip diagram con-nects the process to the covariance of quantities and confi rms students’ understanding of proportions. The order in which the operations are performed with the cross-multiplica-tion algorithm does not connect well to understanding of proportions and may be a barrier to students’ under-standing the algorithm. The justifi ca-tion for the steps in the algorithm requires algebraic understanding that middle-grades students likely will not have before algebra 1. For this reason, teachers may wish to delay presenting the cross-multiplication algorithm to students until after they have acquired algebraic reasoning skills in algebra 1.
542 MatheMatics teaching in the Middle school ● Vol. 18, No. 9, May 2013
the poWer oF the strip diagraMsFor problems requiring proportional reasoning, using strip diagrams to model ratios and solutions provides an excellent sense-making context among preservice teachers. The meaningful understanding of the relationships between parts and quantities would be diffi cult to accomplish with a tradi-tional algorithmic method. The activi-ties described in this article can build understanding of a variety of complex and multistep proportion problems. Building in opportunities for refl ec-tion and discussion about the use of strip diagrams can promote concep-tual understanding of a topic that is often challenging. Refl ection and discussion can also provide opportuni-ties for preservice teachers to revisit and solidify their understandings of challenging ideas.
The visual nature of the strip diagram and the clear connection to the ratios in a proportion task may be a useful tool for middle-grades students. The procedure of using a strip diagram is more conceptually connected to covariance and the rela-tionships between ratios and quanti-ties than the procedure of using the cross-multiplication algorithm. This may allow middle-grades teachers to delay presentation of the algorithm until students have suffi cient algebraic understanding to digest the process
while providing a tool for facilitating problem solving.
If strip diagrams are presented as a strategy after students have had opportunities to develop their own strategies for solving proportion prob-lems, they become tools for developing relationships between covariance and ratios and quantities. The proportion problems presented here are similar to those found in materials for use in the middle grades (Van de Walle, Karp and Bay-Williams 2010; Litwiller and Bright 2002), yet they are rich enough for use with preservice teachers, par-ticularly when students are directed to focus on connections to their under-standing of proportions and their own experiences with algorithmic solutions.
BiBliographYBeckmann, Sybilla. 2004. “Solving Alge-
bra and Other Story Problems with Simple Diagrams: A Method Dem-onstrated in Grade 4−6 Texts Used in Singapore.” The Mathematics Educator14 (1): 42−46.
Common Core State Standards Initiative (CCSSI). 2010. Common Core State Standards for Mathematics. Washing-ton, DC: National Governors Associa-tion Center for Best Practices and the Council of Chief State School Offi cers. http://www.corestandards.org/assets/CCSSI_Math%20Standards.pdf.
Hoffer, Alan, and Shirley Hoffer. 1988. “Ratios and Proportional Thinking.”
In Teaching Mathematics in Grades K–8, edited by Thomas Post. Boston: Allyn & Bacon.
Lamon, Susan J. 1999. Teaching Fractions and Ratios for Understanding: Essential Content Knowledge and Instructional Strategies for Teachers. Mahwah, NJ: Lawrence Erlbaum.
Lesh, Richard, Thomas R. Post, and Merlyn Behr. 1988. “Proportional Reasoning.” In Number Concepts and Operations in the Middle Grades, edited by James Hiebert and Merlyn Behr, pp. 93–118. Reston, VA: National Council of Teachers of Mathematics.
Litwiller, Bonnie, and George B. Bright, eds. 2002. Classroom Activities for Mak-ing Sense of Fractions, Ratios, and Pro-portions, 2002 Yearbook of the National Council of Teachers of Mathematics (NCTM). Reston, VA: NCTM.
National Council of Teachers of Math-ematics (NCTM). 1989. Curriculum and Evaluation Standards for School Mathematics. Reston, VA: NCTM.
———. 2000. Principles and Standards for School Mathematics. Reston, VA: NCTM.
Post, Thomas R., Merlyn J. Behr and Rich-ard A. Lesh. 1988. “Proportionality and the Development of Prealgebra Under-standings.” In The Ideas of Algebra K−12,1988 Yearbook of the National Council of Teachers of Mathematics (NCTM), edited by Arthur F. Coxford and Albert Schulte. Reston, VA: NCTM.
Van de Walle, John, A., Karen Karp, and Jennifer M. Bay-Williams. 2010. El-ementary and Middle School Mathemat-ics: Teaching Developmentally. 7th ed. Boston: Pearson Education.
Jessica s. cohen, [email protected], is an assistant professor in the mathematics department at Western Washington
University in Bellingham. Her research interests include the preparation of preser-vice teachers, technology in mathematics education, and classroom discourse.
The order in which the operations are performed with the cross-multiplication algorithm does not connect well to an understanding of proportions and may be a barrier to students’ understanding the algorithm.

Visit www.nctm.org/meetings for up-to-date information.
NCTM 2013 regionalconferences&expositionsBaltimore, maryland | octoBer 16–18
las Vegas, neVada | octoBer 23–25
louisVille, KentucKy | noVemBer 6–8
Help Your Students Succeed in a Competitive WorldIn a global society with rapidly changing technology your students need the right tools to succeed. So take the next step to help them grow— focus on the latest topics for math education at an NCTM Regional Conference. By attending you and your colleagues will:
•Learnmoreaboutthelatesttechnology
•Discovernewandeffective intervention methods
•Refineyourassessment techniques
•Andmore!
In a global society with rapidly changing technology your students need the right tools to succeed. So take the next step to help them grow—focus on the latest topics for math education at an NCTM Regional
la la las Vegas, s Vegas, s Vegas, neVVadaVadaV | ooctocto
l louisouisouisVille, Kentucille, Kentucille, Kentucille, KentucKy | nnooVV
Help Your Students Succeed
Whetheryou’reaclassroomteacher,coach,administrator,preserviceteacher, or math specialist, this conference has something for you.