string method solution of the gating pathways for a ... · string method solution of the gating...
TRANSCRIPT
String method solution of the gating pathways for apentameric ligand-gated ion channelBogdan Leva, Samuel Murailb, Frédéric Poitevinc,d, Brett A. Cromera,e, Marc Baadenb, Marc Delaruef,and Toby W. Allena,1
aSchool of Science, RMIT University, Melbourne, VIC 3001, Australia; bLaboratoire de Biochimie Théorique, CNRS, UPR9080, Université Paris Diderot,Sorbonne Paris Cité, F-75005 Paris, France; cDepartment of Structural Biology, Stanford University, Stanford, CA 94305; dStanford PULSE Institute,SLAC National Accelerator Laboratory, Menlo Park, CA 94025; eSchool of Health and Biomedical Sciences, RMIT University, Bundoora, VIC 3083, Australia;and fDepartment of Structural Biology and Chemistry, Institut Pasteur and UMR 3528 du CNRS, F-75015 Paris, France
Edited by Jean-Pierre Changeux, CNRS, Institut Pasteur, Paris, France, and approved April 11, 2017 (received for review October 22, 2016)
Pentameric ligand-gated ion channels control synaptic neurotrans-mission by converting chemical signals into electrical signals.Agonist binding leads to rapid signal transduction via an allostericmechanism, where global protein conformational changes open apore across the nerve cell membrane. We use all-atom moleculardynamics with a swarm-based stringmethod to solve for theminimumfree-energy gating pathways of the proton-activated bacterial GLICchannel. We describe stable wetted/open and dewetted/closed states,and uncover conformational changes in the agonist-binding extracel-lular domain, ion-conducting transmembrane domain, and gatinginterface that control communication between these domains. Transi-tion analysis is used to compute free-energy surfaces that suggestallosteric pathways; stabilization with pH; and intermediates, includingstates that facilitate channel closing in the presence of an agonist. Wedescribe a switching mechanism that senses proton binding by markedreorganization of subunit interface, altering the packing of β-sheets toinduce changes that lead to asynchronous pore-lining M2 helix move-ments. These results provide molecular details of GLIC gating and in-sight into the allosteric mechanisms for the superfamily of pentamericligand-gated channels.
pentameric ligand-gated ion channel | ion channel gating | string methodmolecular dynamics | allosteric modulation | pH activation
Pentameric ligand-gated ion channels (pLGICs) control syn-aptic neurotransmission by converting chemical signals into
electrical signals, enabling complex signal processing that un-derlies nervous system function. This signal transduction isachieved by an allosteric, Monod–Wyman–Changeux mechanism(1), where selective binding of an agonist, such as a neurotrans-mitter, leads to a global protein conformational change that opensan ion-conducting pore across the nerve membrane. Over 50 yearsof study has given us in-depth knowledge of the physiology andpharmacology of pLGICs (2). However, it is only in the past fewyears that we have begun to see what these proteins look like inatomic detail (3–13), and we now have an opportunity to describethe mechanisms of pLGIC function at the molecular level.The pLGICs are made up of five identical or homologous
subunits, each composed of an N-terminal β-sheet sandwich ex-tracellular domain (ECD) followed by a four-helix trans-membrane domain (TMD) (Fig. 1A). Between the ECD subunitsare the binding sites for agonists, formed from seven segments or“loops”: A–C from the principal or (+)-side subunit and D–Gfrom the complementary or (−)-side subunit, with loop Cforming a lid between the bound agonist and the surroundingextracellular medium. The binding of a ligand under loop C isthought to change intersubunit contacts and alter the internalstructure of each subunit. How this perturbation is communi-cated through the “gating interface” at the boundary betweenthe ECD and the TMD to the distinct ion-conducting poreformed by the pentamer of M2 helices in the TMD is notcompletely understood.To shed light on this transduction process, one must observe
the conformational changes that occur between active/open (O)
and resting/closed (C) forms. Fortunately, X-ray crystal struc-tures for both forms of the pH-activated GLIC channel (4, 6, 7)have been solved. Structures of multiple states of the channelGluCl have also been solved (3, 9), with generally similar con-formational changes, but with differences in the TMD that maysignify variability in the family, or that could be artifacts due tothe use of antibody fragments or the large antiparasitic ivermectinto trap the GluCl O structure (3). Moreover, O and C structures ofα1-Gly receptor (GlyR) have been solved with cryo-EM (10, 11),and also solved in the presence of ivermectin or the inhibitorstrychnine. The ELIC (8), β3 GABAA receptor (GABAAR) (13),5-HT3 (12) and α4β2 nACh receptor (nAChR) (14) channels,solved in one state, provide valuable comparisons to explain re-ceptor diversity but do not offer consistent end points for studies ofgating. We therefore focus on pH-activated GLIC, with O and Cstructures solved under conditions that differ only by the presenceof agonist (protons). GLIC transitions from maximally open atpH 4.6 to fully closed at pH 7, with a pH of half-maximal activation(pH50) of ∼5.3 (4), due to protonation sites within the ECD (15),mimicking agonist binding. High-resolution structures of GLIC,Protein Data Bank (PDB) ID codes 3EAM and 4HFI (being verysimilar), have been demonstrated to represent the O state withsimulations of ion occupancy in the pore (16), and by doubleelectron–electron resonance (DEER) spectroscopy (17). Althougha high-resolution structure has also been solved for a locally closed(LC; activated ECD, closed TMD) state with cross-links or single-point mutations (H235F, E243P) near the gating interface (5), weconsider only WT O and C forms for investigation into pathwaysbased on end points of the gating transition.
Significance
High-resolution structures of pentameric ligand-gated ionchannels have created an opportunity to discover the mecha-nisms of rapid synaptic transduction in the brain. This studydescribes the mechanisms of allosteric channel gating usingstring method simulations, applied to a complete atomistic ionchannel, combined with a transition analysis approach to extractfree-energy surfaces from swarms of trajectories. We reproducepH-modulated activity of the channel, identify the molecularinteractions associated with interdomain communication, andquantify the energetics of the gating process. These resultsprovide general mechanistic understanding of the function ofpentameric ligand-gated channels, with potential applications inthe design of improved anesthetics, neuromodulatory drugs,antiparasitics, and pesticides.
Author contributions: B.L., F.P., B.A.C., M.B., M.D., and T.W.A. designed research; B.L. andS.M. performed research; B.L. and T.W.A. analyzed data; and B.L., F.P., B.A.C., M.B., M.D.,and T.W.A. wrote the paper.
The authors declare no conflict of interest.
This article is a PNAS Direct Submission.1To whom correspondence should be addressed. Email: [email protected].
This article contains supporting information online at www.pnas.org/lookup/suppl/doi:10.1073/pnas.1617567114/-/DCSupplemental.
www.pnas.org/cgi/doi/10.1073/pnas.1617567114 PNAS Early Edition | 1 of 10
BIOPH
YSICSAND
COMPU
TATIONALBIOLO
GY
PNASPL
US

Our aim is to describe the molecular events and energetics ofGLIC pH activation, communication between separate ECD andTMD domains, and the opening/closing of the ion-conductingpore. Atomistic molecular dynamic (MD) simulations, over long(microseconds or longer) time scales, offer structural refinement ina native-like membrane environment and opportunities for ob-serving conformational changes as a result of the addition or
removal of agonists (18–22). Even simulations on relatively shorttime scales can be informative in terms of the quaternary andtertiary changes in the different domains of pLGICs (e.g., refs.20, 21). However, in general, unbiased simulations are likely toyield incomplete or anecdotal evidence, due to the time scales ofgating being comparable to or exceeding simulation times. In-stead, we directly model the gating process here using a “swarmsof trajectories” string approach (23, 24). We refine guess tra-jectories between O and C states to converge on the minimumfree-energy pathways for gating using a large number of simu-lations to explore conformational transitions (24). This signifi-cant demand on computational resources, beyond typical MDsimulations, is needed to ensure optimization of conformationalchanges. We have devised an analysis of millions of transitions toobtain free-energy surfaces that reveal pH-dependent activity,activation pathways, intermediate states, and interdependenciesof conformational variables that help to explain allosteric com-munication in pLGICs.
Results and DiscussionConformational Changes Along the Activation String. We have car-ried out a swarm-based string method calculation that exploitslarge numbers of short simulations to explore configurationalspace and converge on the minimum free-energy pathways ofactivation (23–25) (Methods). The procedure requires selectionof a small set of collective variables that account for the domi-nant protein conformational changes. The crystallographic C andO GLIC states have previously revealed a marked radialspreading (also called blooming) and tangential twisting of theECD, leading to a structurally diverse C state (4). The ECDβ-sandwich is composed of inner and outer sheets, with con-necting loops (Fig. 1A) that are thought to contribute to signalcommunication (26). Altered packing against these β-sheets isthought to lead to expansion of the lower β-sandwich, evidencedin GLIC by the breaking of the D32-R192 salt bridge (4). Al-though D32 is not strictly conserved (SI Appendix, Fig. S1), thisbridge is part of a largely conserved triplet, D32-R192-D122, ofwhich R192-D122 is highly conserved and essential for function(27, 28), and mutation of D32 in GLIC causes loss of function(28). Breaking of D32-R192 and β-sandwich expansion likelycause changes that influence interdomain communication viadeflection of the pre-M1 R192 residue (29–31), or throughnoncovalent interactions, as indicated in Fig. 1B (observed instring simulations and described below). Finally, the TMD poreis narrowed in the C state associated with M2 helix movementinward and away from its partner M1 helix in the neighboring[complementary or (−)] subunit (4), leading to pore constrictionvia hydrophobic residues (32) and expelling of water (Fig. 1B).These observations have guided our selection of variables, asoutlined in Methods.Following targeted MD simulations between O and C states at
low (pH 4.6) and high (pH 7) pH to provide initial guess path-ways, string optimization in the full dihedral space of the proteinwas first carried out, allowing statistics to guide reduction ofcorrelated variables (SI Appendix, Fig. S2). The final choice of35 variables (seven per subunit), as defined in Methods, is illus-trated in Fig. 2 A–C. Optimizations in this 35D space were car-ried out to convergence, with two independent strings for eachpH. We begin here by reporting the approximate order of con-formational changes along these strings, each consisting of a setof 42 “images” distributed between the O and C states (40 im-ages plus two fixed end points), as summarized in Fig. 2D forpH 4.6 (independent strings are shown in SI Appendix, Fig. S3 Aand C, results for pH 7 provided in SI Appendix, Fig. S3 B and D,and raw data are shown in SI Appendix, Fig. S4). These image-image trends only provide a guide to the sequence of changes,subject to fluctuations in a broad energy well (described below),in contrast to the quantitative statistical analyses to follow.At low pH, following the initial rapid progress in ECD changes
from O (Fig. 2D, image numbers to the left) to C (Fig. 2D, imagenumbers to the right), we see changes in TMD variables (M2 collapse
A
B
Fig. 1. (A) Atomistic simulation system showing GLIC protein as ribbons(nearest two subunits removed, with the rear subunit shown in color and withthe inner and outer β-sheets, loop C, Cys loop, D32-R192 salt bridge, TMDhelices M1–4, pre-M1, and M2-M3 indicated) in a hydrated lipid bilayer (chainsshown as green lines, water shown as blue dots, and NaCl shown as yellow/cyan balls). Important protein side chains are drawn with sticks, with titratedresidues identified (*). (B) Gating interface changes during string simulations,showing the D32-R192 salt bridge breaking, the L246-P247-K248 motif flip-ping, K248 interaction changes from E243/D32(−) to D32, and wedging ofL246 between M2 and M3 in the vicinity of F14′ (F238). Disappearance of acontinuously water-filled pore is illustrated with a blue surface (also Movie S1).
2 of 10 | www.pnas.org/cgi/doi/10.1073/pnas.1617567114 Lev et al.

and dehydration), lower β-sandwich (β-expansion), M2-M1(−)distance, and M1 kink (with all variables normalized). It thus ap-pears that ECD expansion and twisting are required before otherchanges can occur to close the channel. The contracted ECD canbe considered as a stabilizing “cap” on the O state that needs to bereleased for channel closing. The reverse process (C to O) does not
experience the same order, because the C-state ECD is alreadyexpanded and twisted, with the dynamic ECD allowing for multipleconcurrent changes during opening. Note that the high ECD twistat image 40 is due to holding the string end at the initial C structure,whereas the optimized C state, spanning a range of images, has areduced level of twist, such that the majority of ECD changes occurlate (to the left) in the opening process. In this case, β-contraction isthe initial step, preceding TMD transitions, and the last (or slowest)change then involves the ECD. At high pH, the process is similar(SI Appendix, Fig. S3 B and D). These observations suggest ECDchange is the trigger for global change during closing, whereasβ-contraction is the trigger in channel opening.Estimates of the reversible work to change a string variable
from the O to C state (SI Appendix, Fig. S4, Right) were obtainedfrom forces during constrained trajectories (Methods). Theseprofiles reveal that several kilocalories per mole are required tomove from the O state to the C state at low pH, but that changesbecome more favorable at high pH. This equilibrium shift is seenin each profile, yet it is the ECD that contains the protonatingsites that drive gating, as we now examine.
Quaternary ECD Changes Driven by Protonation Sites.As the proteinchanges from O to C at pH 4.6, ECD spreading and twistingoccur steeply (Fig. 2D). Twist increases from 12.7° to 16.7°midway along the coordinate, overtwisting before dropping to15.2° in the C state, with similar changes at high pH (SI Ap-pendix, Fig. S4A). A small overspread can also be seen in two offour independent strings in SI Appendix, Fig. S4B. This findingmay suggest an unlocking and alignment of the ECD beforeinteractions can be formed that stabilize the C state.GLIC has a number of titratable residues expected to change
protonation states between pH 4.6 and pH 7 (Methods and SIAppendix). Although the only histidine determined to changestate was H277, this residue, at the base of the TMD, is notexpected to drive ECD changes. Residue H127 was found to beprotonated at both pH values, whereas H235 was alwaysdeprotonated. No basic residues or aspartates were determinedto change state, with pH sensitivity coming exclusively fromglutamates at the ECD subunit interface, including E26, E35,E75, and E82 (and E243 at the top of M2 in the TMD; Fig. 1A);E177 on loop C, which forms the usual agonist binding lid; andtwo other loops (E67 and E69) exposed to solvent.The net subunit charge changing from +4e to −5e with pH
results in a long-ranged Coulombic expansion force. Althoughchanging interaction energies have been observed within andacross subunits as a function of pH (SI Appendix, Fig. S5A), suchanalysis is limited in its ability to explain the influence of par-ticular residues on conformational change. To quantify thecontributions to ECD spreading directly, we have computed aresidue decomposition of electrostatic reversible work in Fig. 3A(summarized in Fig. 3B for pH 7–pH 4.6). Given the approxi-mate treatment of electrolyte screening (SI Appendix, SupportingAnalysis), these results provide a guide to whether residues assistor oppose gating with pH. Residues E35 and E75 (as well as E69,despite screening) assist ECD spreading, with increased pHdriving the channel to the C state. Residue E243, although in theTMD, also assists in ECD spreading through repulsive forces onthe neighboring subunit (including with E243 itself). Of partic-ular note is that E75 reverses its effect with pH (contracting atlow pH and expanding at high pH), owing to repulsive partnerson the complementary subunit (notably D88 and D91). E75 ispart of the largely conserved WXPD/E motif on loop A, im-portant for loop A/B interactions that create an orthosteric sitein other pLGICs (26). Rather than leading to an intersubunitpocket, E75 deprotonation appears to control ECD spreadthrough its exposure to the complementary subunit face. ResidueE82 is well screened and has little effect, whereas E177 andE26 oppose ECD spreading and help keep the channel open athigh pH. The role of E177 was unexpected, because it sits at theperiphery, but it lies on loop C, which caps agonists in eukaryoticneurotransmitter pLGICs, with protonation potentially mimicking
Nor
mal
ized
Val
ue
Open Closed
ECD Twist
ECD Radius
M2 Radius
M2-M1(-) Distance
Expansion
Image Number
E243S196
N200 N239
D32R192
A
B
C
D
Fig. 2. (A–C) Structural changes between O (Left) and C (Right). (A) ECD radius(Movie S2) and ECD twist (rounded arrows indicating relative twist with TMD).(B) M2 radius (Movie S3) and M2-M1(−) distance (M2 shown in blue andM1 shown in red; Movie S4). (C) Lower β-sandwich expansion (Movie S5) andM1 kink [also illustrating changing M2 interactions with M1(−)]. Pore dewettingis shown in Movie S6. (D) Normalized changes for pH 4.6 against image number(pH 7 is shown in SI Appendix, Fig. S3, and raw data are shown in SI Appendix,Fig. S4). Variables that decrease from left to right are plotted as dehydration(1 − hydration) and M2 collapse (1 − M2 radius).
Lev et al. PNAS Early Edition | 3 of 10
BIOPH
YSICSAND
COMPU
TATIONALBIOLO
GY
PNASPL
US

agonist binding through attractive intersubunit interactions, con-sistent with the role of loop C in proton activation (33).
Rearrangements at the ECD–TMD Interface and TMD Pore. ECDspreading and twisting alter the packing against the β-sheets,which extend down to the gating interface, signified by lowerβ-sandwich expansion [separation of β-sheets in the vicinity ofR192 (pre-M1) and D32 (loop 2) from ∼11.5–13 Å; SI Appendix,Fig. S4D] and the breaking of the R192-D32 salt bridge uponchannel closing. This movement deflects the pre-M1 main-chainlinkage from ECD to M1. As a result, we observe M1 to kink atP204, increasing its value by ∼5° upon closing (SI Appendix, Fig.S4G), likely influencing pore collapse. Indeed, M1(−) interacts
favorably with M2 in the O state, through H-bonds N200-N239 and S196-E243, but not in the C state (Fig. 2C).The expansion of the lower β-sandwich alters the proximity of
D32 to key TMD residues (Fig. 1B), influencing the M2-M3 loop.The behavior of this loop is important for GLIC and other pLGICs(9, 10, 20, 28), and its crystal conformation may have been influ-enced by nearby lipid and detergent molecules (4, 6). Based onstring simulations, we observe distinct molecular events, in additionto overall movement of the segment. Fig. 1B (also Movie S1)shows flipping of a conserved LPX motif (246–248; X = K inGLIC; SI Appendix, Fig. S1) in M2-M3, rotating K248 upward,from interaction with mostly D32(−) (preceding subunit) andE243 in the TMD in the O state, to interaction with D32 (samesubunit) in the C state [as well as Y119 (β6–7/Cys loop), Y197(M1) and E243]. Importantly, this rotation is coincident withL246 movement downward via a rigid LPK “wing nut” structure.L246 is bound in an aromatic cleft formed by the Cys loop(F116 and Y119) in the O state, but it detaches and binds to theTMD, behind M2, in the C state when the β-sandwich no longeroffers a defined pocket (or it is occluded by P247). This movementapparently wedges closed the pore (Fig. 1B, Right), and is consistentwith L246’s high conservation and loss-of-function mutations inpLGICs (4). Moreover, L246 pushes into the allosteric intersubunitsite for general anesthetics, suggesting a mechanism for receptormodulation from this site.Closure of the TMD pore is well represented by the M2 ra-
dius, which decreases from ∼12.1 Å to 11.3 Å upon closing at lowpH (Fig. 2D and SI Appendix, Fig. S4F), with the number ofwater molecules in the pore dropping from ∼38 to 0 (SI Ap-pendix, Fig. S6A), as well as by M2-M1(−) distance, which un-dergoes a change from ∼13.5 Å to ∼17.5 Å (pH 7 is shown in SIAppendix, Fig. S4E). M2-M1(−) is a good subunit variable de-fining pore gating, undergoing a discrete change that involvesloss of helical contacts between subunits (Fig. 2 B and C), althoughit also contributes to ECD-TMD twist via its tangential compo-nent. The TMD is slightly different in the optimized O statecompared with PDB ID code 4HFI, being more open according toM2-M1(−) distance, which decreased from ∼14 Å to 13.5 Å, likelystabilizing M2-M1(−) packing, but similar or marginally reducedM2 radius. These changes during optimization may help explaindifficulties in maintaining a wetted pore in microsecond-ordersimulations based on 4HFI/3EAM (34–36), whereas string simu-lations indefinitely maintain a wetted O state over 400 iterations.
Free-Energy Surfaces of Activation.Illustration of receptor gating and pH modulation.We can use the largelibraries of random transitions to calculate free-energy maps forcoordinates of interest, without resorting to separate biasedsimulations. Doing so is possible because, after convergence, thepath diffuses in a broad basin of low-energy configurationsconnecting the O and C states. We can summarize the gatingprocess by calculating the free-energy as the function of oneECD variable, such as twist (ECD radius is shown in SI Appendix,Fig. S7E), and one TMD variable, such as M2-M1(−) distance(M2 radius is shown in SI Appendix, Fig. S8E, and pore hydrationis shown in SI Appendix, Fig. S10 A and B), as shown in Fig. 4A.At low pH, there exists a curved path from the O state to the Cstate, requiring a highly twisted ECD to “unlock” the ECD be-fore progressing to the C state, promoted by high pH. The mapsuggests an energy change of order kBT favoring the O state atpH 4.6, consistent with the experimental pH50 of 5.3 (4). At pH7, the map is similar, but with the O state destabilized and a fullytwisted intermediate (I1) apparent. The I1 state has expandedand twisted ECD, but features a semiopen (nonconducting) pore(SI Appendix, Table S1).The O (PDB ID code 4HFI) and C (PDB ID code 4NPQ)
structures are indicated with yellow and green points (one persubunit), respectively, in Fig. 4A. The relaxed O and C minimadeviate from these structures due to optimization and thepresence of membrane (and potentially the absence of detergentmolecules in the upper pore). Based on M2-M1(−) alone, the O
-5
0
5
10
Open Closed Open Closed
E67
E75E243E69
E35
E82
E26
E177
-10
-5
0
5
10
15
23.5 24 24.5 25 25.5
Fre
e E
nerg
y (k
cal/m
ol)
Fre
e E
nerg
y (k
cal/m
ol)
0
5
10
15
20
-15
-10
-5
0
-10
-5
0
5
-5
0
5
10
-15
-10
-5
0
-15
-10
-5
0
0
5
10
15
E35E26
E67 E69
E243E177
E82E75
Open Closed
ECD Radius
pH 7
pH4.6
Unscreened
23.5 25.5 23.5 25.5
A
B
Fig. 3. Mean force decomposition of ECD spreading work, based on elec-trostatic interaction forces between individual residues (that change pro-tonation state) and other subunits. (A) Work contributions for individualresidues for pH 4.6 (red) and pH 7 (black), with unscreened electrostaticsshown as solid curves and screened electrostatics shown as dotted curves.(B) Comparison of all screened electrostatic work contributions (pH 7 to pH 4.6).
4 of 10 | www.pnas.org/cgi/doi/10.1073/pnas.1617567114 Lev et al.

pore is more open than 4HFI and the C state is less closed com-pared with 4NPQ. The ECD twist increased from 11° to 13° in4HFI to 12° to 15° in the optimized O state (pH 4.6), whereas itdecreased from 16° to 19° for 4NPQ to 13° to 16° in the optimized Cstate. The LC structure 3TLT (Fig. 4A, gray points) appears to theside of the broad basin, with an ECD twist of 11°. SI Appendix, Fig.S9 shows the rmsd to crystal structures, with the similarity to 4HFIfor O changing to a similarity to 4NPQ for C, with a range of rmsdsto LC along the path (discussed below).The 1D free-energy profiles for water inside the pore (Fig. 4B)
reveal a kilocalorie per mole order difference between the O(high hydration; Fig. 4B, Right) and C (low hydration; Fig. 4B,Left) states, and capture the anticipated pH shift, through in-creased probability of occupying the wetted state at pH 4.6 (Fig.4B, red) relative to pH 7 (Fig. 4B, black). Integrating over O andC minima yields an O ⇌ C equilibrium constant change from0.85 ± 0.03 at low pH to 2.0 ± 0.9 at high pH (i.e., favoring awetted pore at low pH and a dewetted pore at high pH, andquantitatively demonstrating modulation by proton binding).Quaternary ECD changes unlock the gating interface to enable an O-Ctransition. Fig. 5A shows the free-energy map for ECD radiusversus lower β-expansion. At pH 4.6 (Fig. 5A, Left), a free-energybasin connects the O and C states via an intermediate, I2, re-quiring significant spread of the ECD before the β-sandwich canexpand to the C state. The fairly flat but orthogonal dependencesuggests some decoupling of ECD and TMD changes, and a“binary switch” for sensing agonists, requiring ECD changeabove a threshold before a discrete conversion of the gating in-terface. In contrast, at high pH (Fig. 5A, Right), this threshold ismostly exceeded, leaving the channel to flicker between the I2and C states due to a dynamic β-sandwich.These changes in the lower β-sandwich at the ECD–TMD
interface lead to changes in the TMD, which we demonstrate byexamining the free-energy projection involving β-expansion andM2-M1(−) in Fig. 5B. At low pH (Fig. 5B, Left), the broad
surface has two (left and right) pathways, with preference for theO state. Without ECD spread to cause β-expansion, the systemwould reside on the left side, with the pore flickering betweenthe O and I3 states. The LC 3TLT structure appears close to thisintermediate, yet I3, defined only by pore and β-sandwich vari-ables, contains multiple clusters with wide-ranging ECD change(SI Appendix, Table S1). Two of these clusters have low rmsd toLC (3TLT), suggesting a relationship with this key intermediate.Thus, vertical movement between O and I3 represents localizedTMD pore closure, without the β-expansion needed to stabilizethe C form. Such decoupled flickering of the pore is consistentwith the coexistence of O and LC forms in a single crystalstructure (4). The I3 state helps close the channel in the presenceof agonist, along the dominant left pathway. The less favoredpathway is where the pore remains open, whereas the β-sandwichchanges (right path), without the assistance of the I3 state. In-dividual subunit maps (SI Appendix, Fig. S11) reveal that theconverged string involves three subunits favoring the left pathand two subunits favoring the right path, suggesting a degree ofindependence. We emphasize that maps for each subunit shouldnot be the same but, when combined, as in Fig. 5B, should revealwhat paths are possible.At pH 7 (Fig. 5B, Right), the map is similar, favoring the
dominant left pathway, with equilibrium shifted to states withgreater M2-M1(−) (C). There are, in fact, multiple nonconductingstates, including C, I3, and two others with moderate M2-M1(−),that are visible in individual subunit maps (SI Appendix, Fig. S11)but averaged away in Fig. 5B, indicating some entropic stabiliza-tion of the nonconducting form. Because the ECD is more spreadat pH 7, the probability of an expanded β-sandwich is increased,enabling lateral I3-to-C exchange, shifting the equilibrium andleading to a dynamic protein, consistent with X-ray structural di-versity (4).Molecular interactions facilitate ECD–TMD communication. We can usefree-energy projections to examine detailed molecular changes at
M2-
M1(
-) D
ista
nce
( Å
)pH 4.6 pH 7
-1 0 1 2 3 4 5 6 7
0 10 20 30 40 50Number of water molecules
Fre
e E
nerg
y (
kcal
/mol
)
( kcal/mol )A
B
Fig. 4. (A) Free-energy maps showing M2-M1(−)distance against ECD twist for pH 4.6 (Left) and pH 7(Right), with crystal subunit data shown as points[five points per structure; PDB ID code 4NPQ isshown with 20 points, corresponding to the fouravailable structures (4)]. (B) One-dimensional free-energy profiles of hydration (pH 4.6 shown in redand pH 7 shown in black), with error bars as SDs.(Insets) Side views of the channel in the O/wettedand C/dewetted states. Superimposed is the un-biased estimate from limited free-simulation runs(green curve). Convergence is illustrated in SI Ap-pendix, Fig. S6A.
Lev et al. PNAS Early Edition | 5 of 10
BIOPH
YSICSAND
COMPU
TATIONALBIOLO
GY
PNASPL
US

the gating interface and how they relate to ECD and TMDchanges. For example, relationships between β-expansion andpore closure can be seen involving the covalent linkage pre-M1,where breaking of D32-R192 displaces R192 (pre-M1), kinkingM1 and inevitably altering the stability of the M2 that stacksupon it in the O state (Fig. 2C). SI Appendix, Fig. S12 showsmaps for M1 kink against β-expansion and pore variables; forexample, SI Appendix, Fig. S12A shows that M1 kink changeoccurs with β-expansion, whereas SI Appendix, Fig. S12 B and Cillustrates how M1 kink adjustment is associated with pore clo-sure. These dependencies are, however, subtle and do not nec-essarily imply communication is caused by pre-M1.To examine the role of the M2-M3 LPK motif in ECD–TMD
communication, we analyze the dependence of K248 distances toresidues D32, D32(−), and E243 on β-expansion (SI Appendix,Fig. S13 B–D) and M2-M1(−) pore gating (SI Appendix, Fig. S14B–D). On average (SI Appendix, Figs. S13 and S14, Right),K248 interacts more with D32(−) (as well as E243) in the Ostate, but then predominantly with D32 in the C state. The free-energy maps for pH 4.6 (SI Appendix, Figs. S13 and S14, Left)and pH 7 (SI Appendix, Figs. S13 and S14, Center) explain thesetrends, through increased probability of small D32 and largeD32(−)/E243 distances as β-expansion or M2-M1(−) increases,escaping one minimum to move to another. This behavior ap-pears independent of E243 protonation with pH, suggestingE243 interactions influence, but are not critical for, gating. Wemay use these maps to infer a role for K248 in interdomaincommunication; for example, SI Appendix, Fig. S13B shows thatECD β-expansion (freeing up D32) allows K248 to bind to D32(not otherwise possible), whereas SI Appendix, Fig. S14B showsthat K248 binding to D32 necessitates M2-M1(−) increase, andthus pore closure. Although not proof of causality (and mapsshow closure can occur without significant K248 movement),these results demonstrate the protein is constrained to follow thishigh-probability communication pathway. Mutation of K248 wouldeliminate its salt bridge to D32, and being stronger in the C statewhen D32 is available (and likely assists in breaking D32-R192),explains the gain-of-function phenotype seen experimentally inGLIC (K248C) (5).
We also analyze L246 binding to partners F116 (ECD) andF238 (TMD) against β-expansion (SI Appendix, Fig. S13 E and F)and M2-M1(−) pore gating (SI Appendix, Fig. S14 E and F). In SIAppendix, Figs. S13 E and F, Right and S14 E and F, Right, thepanels show that, on average, L246 will exchange F116 with F238(14′, interacting via V242) during gating, closing the pore bysterically interfering with M2, leading to dewetting (proven in SIAppendix, Fig. S15). To illustrate the L246 interdomain de-pendencies, SI Appendix, Fig. S13E, maps show that with lowβ-expansion, the protein prefers a minimum with large L246-F238 distance, but can escape to smaller L246-F238 distanceswith increased β-expansion. SI Appendix, Fig. S14E reveals thatmovement of L246 down toward F238 necessitates pore closure[increased M2-M1(−)]. This correlation, although also not nec-essarily causal, indicates that with high probability, the L246 islinked by both ECD and TMD gating changes.Pore closure involves asynchronous initial M2 collapse. Fig. 2D sug-gested dewetting of the pore, correlated with M2 constrictionand increased M2-M1(−) distance. M2 tangential and radialmovements overall resemble an “iris”-like pore gating (seeMovie S3), as suggested previously from a TMD-only model(37). However, individual subunit changes (pH 4.6 is shown inFig. 6A) reveal that the most rapid change in M2-M1(−) occursin the order of subunits B, C, D, A, and E. Although merely aguide, this tendency for some ordering is evident in all inde-pendent strings (SI Appendix, Fig. S3 E–H). To examine thenature of the subunit collapse better, we present the free energyas a function of M2 movement for subunit n and its neighbor n + 1in Fig. 6A. Although the path is generally diagonal, suggestingsome correlation of neighbor movements, the maps exhibit adegree of sequential collapse. We observe first a vertical move-ment from the O state as one helix experiences partial collapsefrom 13 Å to 15–16 Å, followed by diagonal movement as thehelix and its neighbor collapse completely to a value of 17–18 Å.We can understand the influence of one subunit on the next bythe interactions between M2-M1(−), as well as by intersubunitinteractions via the M2-M3 loop. The work required to collapsethe first helix partially is ∼1 kcal/mol, whereas no work is re-quired to complete the collapse of the helix and its neighbor
A
B
Fig. 5. (A) Free-energy maps showing β-expansionagainst ECD radius for pH 4.6 (Left) and pH 7 (Right).(B) Maps showing M2-M1(−) against β-expansion.Pathways are indicated with dashed lines, and crys-tal structure subunit data are shown as points.
6 of 10 | www.pnas.org/cgi/doi/10.1073/pnas.1617567114 Lev et al.

(being downhill). At high pH, the process has two stages, owingto a shallow intermediate with a half-collapsed M2 (as with I1 inFig. 4A). The partially sequential nature remains, but the cost isjust ∼kBT, assisted by the intermediate and shifted toward theC state.Although the relationship between pore hydration and size is
simple (SI Appendix, Fig. S10E), SI Appendix, Fig. S10D revealssome orthogonal dependence on M2-M1(−), where change canoccur without significant wetting/dewetting, still requiring acti-vation (by ∼2 kcal/mol), owing to the fact that pore hydration ispotentially controlled by multiple subunits. However, dehydra-tion superimposed in Fig. 6A (and SI Appendix, Fig. S3 E–H, graycurves) reveals that dewetting primarily occurs upon first M2 collapse,with the empty pore likely easing collapse of subsequent helices.Wetting-dewetting transitions and unbiased observations. The porehydration free energy in Fig. 4B can help explain the wetting-dewetting process. The O state (Fig. 4B, Right) consists of abroad well spanning 12–47 water molecules, centered on ∼36 wa-ter molecules. The barrier is ∼1.5 kcal/mol (relative to O, pH 4.6),occurring when the pore contains ∼12 water molecules. We esti-mate that the Kramer’s rate for dewetting at pH 4.6 is 11.4 μs−1(transition every 88 ns; SI Appendix). The C state (Fig. 4B, Left) isnarrow and deeper (higher wetting barrier of ∼2.5 kcal/mol),conspiring to yield a similar Kramer’s wetting rate of 12.2 μs−1(transition every 82 ns). This result suggests that wetting anddewetting transitions from optimized states should happen onsimilar O(100 ns) time scales. At pH 7, the mean dewetting timeis decreased twofold to 45 ns, consistent with rapid closing inunbiased simulations at pH 7 (38), whereas the wetting time isincreased to 122 ns, which is expected, given the effect of pH onthe equilibrium constant of gating above.We have taken representative samples from the O-state min-
imum and launched independent unbiased simulations (Fig. 7A).In each case, the pore remains hydrated for some time beforedewetting, with trajectories exhibiting repeated wetting-dewettingtransitions on the order of 100-ns intervals. The occurrence ofrewetting events is strong evidence for a stable O state. Projectiononto maps for subunit changes [M2-M1(−) versus ECD twist and
β-expansion] in Fig. 7B shows good sampling around the O-stateminimum and exploration of intermediate and C states. Selecttrajectories are shown in Fig. 7C (Right), with the graph demon-strating that transitions can follow the same two dominant pathwaysidentified in our free-energy maps. Furthermore, the apparent onsetof equilibrium in Fig. 7A suggests a reversible wetting-dewettingprocess, with an unbiased estimate of the free energy for hydra-tion shown in Fig. 4B (green), having the same general shape asobtained from the string method, albeit with the C state not wellsampled in limited free trajectories. These unbiased tests demon-strate a stable O state for GLIC, and that the identified pathways instring simulations are natural transitions of the protein.
Discussion and ConclusionsWe have reported a string method optimization of the activationprocess for the GLIC ion channel, demonstrating modulatedreceptor function due to pH, revealing the pathways connectingstable O and C states via intermediates, and observing thecommunication mechanisms between agonist-binding ECD andion-conducting TMD domains.The key stimulus for gating is the protonation/deprotonation
of residues that control ECD intersubunit interactions. We havemade predictions for residues that generate force to spread orcontract the ECD upon pH increase. Key titrated residues in ourmodel are E35, E75, and E243, acting to close the channel athigh pH (and thus, if mutated, would cause gain of function),with opposite effects from E26 and E177, acting to promote an Ostate at high pH (and thus, if mutated, would cause loss offunction). The role of E177 suggests an interesting parallel topLGICs that gate via agonist binding under loop C, whereas E75,at a pLGIC orthosteric site, highlights the role of loop A–B
M2(
+)-
M1
Dis
tanc
e (
Å )
pH 7 pH 4.6
M2-M1(-) Distance ( Å )
Nor
mal
ized
Val
ue
Image Number
Open Closed
( kcal/mol )
A
B
Fig. 6. (A) M2-M1(−) for five subunits (pH 4.6) illustrating asynchronouspore collapse (pH 7 is shown in SI Appendix, Fig. S3 F and H), with de-hydration shown as a dashed gray curve for comparison. (B) Free-energymaps showing M2-M1(−) distance for the nth and nth + 1 subunits.
Time ( ns )
Por
e H
ydra
tion
M2-
M1(
-) D
ista
nce
( Å
)
-Expansion ( Å )
C
M2-
M1(
-) D
ista
nce
( Å
)
A
B
Fig. 7. Unbiased simulation from the optimized O state at pH 4.6. (A) Timeseries for pore hydration based on a set of ten 350-ns trajectories. (B) Superpo-sition of trajectories on free-energy maps from Figs. 4 and 5. (C) Sample trajec-tories revealing unbiased sampling of different paths (color shaded by time).
Lev et al. PNAS Early Edition | 7 of 10
BIOPH
YSICSAND
COMPU
TATIONALBIOLO
GY
PNASPL
US
intersubunit interactions in gating and modulation. Residuesclose to the gating interface, such as E35 and E26, might playdirect roles in β-sheet expansion; for example, E35 sits on β1-β2,packing against P247 on M2-M3 and contacting hydrophobic Cysloop and loop 9 residues from the adjacent subunit in the Ostate, which would be disfavored by protonation.The result of deprotonation at high pH is to spread and twist
the ECD, which are the leading events in channel closure, butthe final steps in channel opening (Fig. 2D), consistent with thesimulations of Cecchini and coworkers for GluCl (20) and analysisby Auerbach and coworkers for nAChR (39). We demonstratedthat high levels of ECD twist are required along the gating pathway,making it an important variable for gating (39). Threshold levelsof ECD spread alter the packing of subunits sufficiently to expandthe lower β-sandwich around D32 (loop 2) and R192 (pre-M1),representing a binary switch mechanism for signal transduction.One interpretation is that the β-sandwich acts as an all-or-nothingswitch that senses analog agonist signal to turn off or on the outputelectrical signal, as opposed to a gradual change that would bedifficult to reconcile with the single conductance state seen exper-imentally (40).Breaking of the D32-R192 salt bridge has consequences for
the TMD. ECD–TMD coupling may occur via the pre-M1 linkage(30), where R192 movement can lead to M1 kinking, likely desta-bilizing its neighboring M2 in its O state (Fig. 2 B and C). We have,however, identified interesting β1-β2–M2-M3 loop interactions withstrong interdomain dependencies that were not seen in GLICcrystal structures. K248 onM2-M3 is bound mostly within the TMDin the O state, but flips up to make contact with D32 in the C state,enabled by the freeing of D32 from R192 and the lining up ofsame-subunit residues through tangential twist. Although K248has a corresponding R or K in the ELIC, GABAAR, and GlyRsubunits, it is lacking in GluCl, 5HT3 receptor, and nAChR (SIAppendix, Fig. S1), likely leading to variability. K248 is part of awell-conserved LPX motif (X = K in GLIC; SI Appendix, Fig.S1), with L246 stably bound in a hydrophobic cleft in the Cysloop in the O state, but driven into the TMD between M2 andM3 when the motif rotates, acting as a wedge to assistM2 collapse (Fig. 1B and Movie S1). Experiments introducingunnatural cis-proline have shown increased open probability innAChRs (41), likely rotating the L246 equivalent upward. Impor-tantly, in the C state, L246 sits adjacent to F14′, which occupies thepLGIC ethanol binding site, offering insight into how ethanol andanesthetic bromoform modulate pLGICs (42, 43). Our free-energyanalysis has demonstrated strong connections between K248/L246movements and both ECD and TMD changes, suggesting involve-ment in interdomain communication.This communication thus centers on the changing availability
of D32 during gating. D32 is part of a conserved triplet of in-teractions, with R192 maintaining interaction with D122 alongthe path (SI Appendix, Figs. S13G and S14G), and change in-volving only D32-R192 breakage (SI Appendix, Figs. S13A andS14A). D32E and D32N mutation both lower the pH50 [by 0.7–1.5 (4)] and D32A leads to loss of activity (28), whereas in GlyR,the equivalent E53C reduces agonist sensitivity ∼10-fold (27).D32 is conserved in GlyR, GABAAR, nAChR, and 5HT3. Inchannels lacking a D32 equivalent (GluCl and ELIC in SI Ap-
pendix, Fig. S1), we cannot rule out roles for neighboring β1-β2 carboxylates, but postulate those channels might rely on pre-M1 communication, requiring the same β-sandwich expansion.Our free-energy surfaces revealed flickering between O and
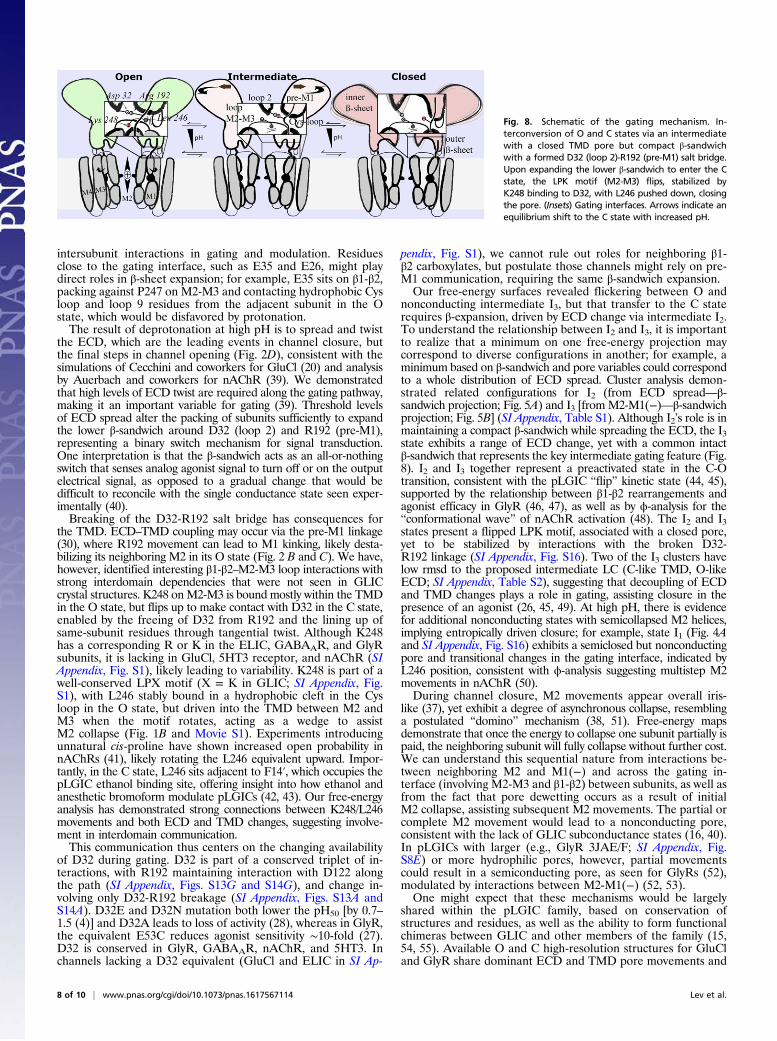
nonconducting intermediate I3, but that transfer to the C staterequires β-expansion, driven by ECD change via intermediate I2.To understand the relationship between I2 and I3, it is importantto realize that a minimum on one free-energy projection maycorrespond to diverse configurations in another; for example, aminimum based on β-sandwich and pore variables could correspondto a whole distribution of ECD spread. Cluster analysis demon-strated related configurations for I2 (from ECD spread—β-sandwich projection; Fig. 5A) and I3 [from M2-M1(−)—β-sandwichprojection; Fig. 5B] (SI Appendix, Table S1). Although I2’s role is inmaintaining a compact β-sandwich while spreading the ECD, the I3state exhibits a range of ECD change, yet with a common intactβ-sandwich that represents the key intermediate gating feature (Fig.8). I2 and I3 together represent a preactivated state in the C-Otransition, consistent with the pLGIC “flip” kinetic state (44, 45),supported by the relationship between β1-β2 rearrangements andagonist efficacy in GlyR (46, 47), as well as by ϕ-analysis for the“conformational wave” of nAChR activation (48). The I2 and I3states present a flipped LPK motif, associated with a closed pore,yet to be stabilized by interactions with the broken D32-R192 linkage (SI Appendix, Fig. S16). Two of the I3 clusters havelow rmsd to the proposed intermediate LC (C-like TMD, O-likeECD; SI Appendix, Table S2), suggesting that decoupling of ECDand TMD changes plays a role in gating, assisting closure in thepresence of an agonist (26, 45, 49). At high pH, there is evidencefor additional nonconducting states with semicollapsed M2 helices,implying entropically driven closure; for example, state I1 (Fig. 4Aand SI Appendix, Fig. S16) exhibits a semiclosed but nonconductingpore and transitional changes in the gating interface, indicated byL246 position, consistent with ϕ-analysis suggesting multistep M2movements in nAChR (50).During channel closure, M2 movements appear overall iris-
like (37), yet exhibit a degree of asynchronous collapse, resemblinga postulated “domino” mechanism (38, 51). Free-energy mapsdemonstrate that once the energy to collapse one subunit partially ispaid, the neighboring subunit will fully collapse without further cost.We can understand this sequential nature from interactions be-tween neighboring M2 and M1(−) and across the gating in-terface (involving M2-M3 and β1-β2) between subunits, as well asfrom the fact that pore dewetting occurs as a result of initialM2 collapse, assisting subsequent M2 movements. The partial orcomplete M2 movement would lead to a nonconducting pore,consistent with the lack of GLIC subconductance states (16, 40).In pLGICs with larger (e.g., GlyR 3JAE/F; SI Appendix, Fig.S8E) or more hydrophilic pores, however, partial movementscould result in a semiconducting pore, as seen for GlyRs (52),modulated by interactions between M2-M1(−) (52, 53).One might expect that these mechanisms would be largely
shared within the pLGIC family, based on conservation ofstructures and residues, as well as the ability to form functionalchimeras between GLIC and other members of the family (15,54, 55). Available O and C high-resolution structures for GluCland GlyR share dominant ECD and TMD pore movements and
Fig. 8. Schematic of the gating mechanism. In-terconversion of O and C states via an intermediatewith a closed TMD pore but compact β-sandwichwith a formed D32 (loop 2)-R192 (pre-M1) salt bridge.Upon expanding the lower β-sandwich to enter the Cstate, the LPK motif (M2-M3) flips, stabilized byK248 binding to D32, with L246 pushed down, closingthe pore. (Insets) Gating interfaces. Arrows indicate anequilibrium shift to the C state with increased pH.
8 of 10 | www.pnas.org/cgi/doi/10.1073/pnas.1617567114 Lev et al.
features at the gating interface, including interaction betweenD122 and R192 and M2-M3 loop displacement (3, 10, 20).However, comparisons shown in SI Appendix, Fig. S8, overlayingavailable structures on GLIC free-energy maps, suggest differ-ences. For GluCl, changes between O (3RIA) and C (4TNV) aresimilar in terms of ECD radius, ECD twist, β-expansion, andM2 radius, although they exhibit reduced M2-M1(−) movement[previously noted (20)], perhaps due to the use of ivermectin totrap the GluCl O structure (3) or due to sequence differences inM2-M3 and β1-β2 loops. GlyR O (3JAE/F) and C (3JAD)structures reveal similar behavior for ECD twist and M2 radius(on an expanded scale), but with less β-expansion and markedlyreduced ECD spread and M2-M1(−) distance [although thisfinding appears inconsistent with evidence for the interactionsbetween M2-M1(−) that stabilize the GlyR O state (53)]. Dif-ferences are most prominent in the C state, for which GluCl andGlyR were stabilized by antibody fragments or the competitiveinhibitor strychnine, although they may also be attributed tovariability between cation- and anion-selective, or prokaryoticand eukaryotic channels.The finding that the GLIC O-state structure is similarly open
following optimization [with slight movement of M2 towardM1(−) to help stabilize the wetted pore], reinforces the fact thatPDB ID code 4HFI (or PDB ID code 3EAM) corresponds to theO state, not artificially stabilized by detergent molecules, beingabsent in these simulations. Unbiased simulations confirm thisstable state, with repeated rewetting transitions (not previouslyseen in simulations from crystal structures). We remark that op-timization of the O state also leads to an E-2′ (bottom of M2)radius increase by ∼0.3 Å, with a lower M2 (−2′ to 9′) azimuthalrotation (10) away from 4HFI by ∼17°, acting to widen the lowerpore. Although ∼1.2 Å less wide than the most open GlyRstructure, it is over 1 Å wider than the collapsed form of thatchannel (10). Differences may be natural consequences of cationversus anion permeation, with Na+ passing the constriction withthe help of direct E-2′ coordination (as well as backbone) (14, 16),in contrast to Cl−, which is expected to move as a hydrated ionpast P-2′ in GlyR. These variations may suggest that although thecurrent studies inform us of pLGIC allosteric mechanisms ingeneral, detailed TMD changes may most directly relate to cat-ionic members of the family.In summary, we set out to understand GLIC channel activation
using string method simulations and have made predictions for pHsensitivity and the interactions governing allosteric communication.We used free-energy analysis of swarms of trajectories to demon-strate GLIC modulation quantitatively by protons, consistent withexperimental pH dependence (4), and solved for a stable O state,verified with unbiased MD simulation. Deprotonation of residuesat the subunit interface drives ECD change during channel closure,consistent with observations for GluCl and nAChR (20, 39). Cal-culated forces have revealed the titrated residues responsible, in-cluding glutamates close to the gating interface likely to controlβ-sandwich change, on loop C [consistent with its role in pH sen-sitivity (33)] mimicking eukaryotic pLGICs, as well as at a con-served loop A ligand-binding site (26). We revealed a binary switch(β-sandwich expansion, D32-R192 breaking) that responds tothreshold ECD change and directly communicates movement tothe TMD. D32-R192 is part of a functionally important triplet (27,28), with D32 mutation causing loss of function in GLIC and GlyR(4, 27, 28). The β-sandwich switching influences the TMD via theM2-M3 loop, which is important for function (9, 10, 20, 28) andidentified in nAChR activation (39). A conserved LPX (L246,P247, and K248 in GLIC) motif flips to engage D32 in the ex-panded β-sandwich, driving L246 [essential for pLGIC function (4)]down toward a general anesthetic site (42, 43) to force the poreclosed. P247 is important in nAChRs (41), and our observations forK248 explain its experimental mutant phenotypes in GLIC (5). Ourindependently solved intermediate with a closed pore and compactβ-sandwich includes an LC-like form seen experimentally (5), andprovides a low-energy path in the presence of agonist, consistentwith the “preactive” (26) or flip (45, 49) pLGIC state. We observe
iris-like M2 movements, consistent with studies of a TMD-onlychannel (37), but modulated by the gating interface, leading toasynchronous movements involving partial collapse. Identificationof a partially closed state is consistent with ϕ-analysis in nAChRs(50), and may explain subconductance states in channels such asGlyR (52). We see similarities to other pLGIC gating movements,with ECD change, β-sandwich switching, and pore collapse con-served, yet warranting separate string method investigations.pLGICs are primary targets for general anesthetics (56), as
well as for drugs that treat acquired or inherited mutationsresponsible for diseases such as epilepsy (57). The results ofthis study improve our knowledge of pLGIC function, revealingdetails of the molecular events during gating intimately involvedwith anesthetic and drug-binding sites. The string method, withtransition analysis, has been proven to capture receptor modula-tion by protons, in addition to stable O, C, and intermediate statesthat may be tested with experimental trapping or emerging time-resolved structural methods (58), providing potential new targetsfor therapeutic drugs.
MethodsThe GLIC protein in the O and C states [PDB ID codes 4HFI (16) and 4NPQ (4),respectively] were embedded in bilayers of 1-palmitoyl-2-oleoyl-sn-glycero-3-phosphocholine with explicit TIP3P water and 150 mM NaCl, totalling150,235 atoms. Systems were built and preequilibrated with CHARMM (59),and simulated using NAMD (60) with the CHARMM36 force field (61–64).Additional unbiased/free-trajectory simulations using GROMACS 4.6.6 (13)with the CHARMM36 force field are also described in SI Appendix. Ionizationstates for pH 4.6 (activated) and pH 7 (closed/resting) were based on pKa
estimates, mutagenesis, and crystallographic data (6). At low pH, the sites ofprotonation were E26, E35, E67, E69, E75, E82, E177, E243, and H277, asindicated in Fig. 1A, whereas standard states were used at pH 7, with theexception of H127, which was protonated at both pH values (SI Appendix).
We first ran rmsd-based targetedMD to generate guess paths between theO and C states at each pH (SI Appendix). Independent strings were initiatedby exchanging structures between pH values. We then carried out a stringmethod approach, based on the swarms of trajectories method (23–25),requiring definition of a lower dimensional space. We chose the followingvariables for each of the five subunits (35 in total; definitions are provided inSI Appendix): ECD twist, ECD upper and lower spread (two variables; how-ever, for analysis, we analyze one upper “ECD radius”; SI Appendix), lowerβ-sandwich expansion (“β-expansion,” distance between β-sheets in thevicinity of D32 and R192), M2-M1(−) distance, upper M2 spread (reported as“M2 radius”), and M1 kink at conserved P204 (Fig. 2). All variables have beennormalized to ensure equal weight in the optimization. Other interestingcoordinates, such as ECD–TMD separation, subunit, and helical tilting, werewell correlated with these variables (select correlations are illustrated in SIAppendix, Fig. S2, based on initial optimizations described in SI Appendix).
Forty image structures (plus two fixed end points) were sampled uniformlyalong the targeted MD trajectory for each pH. We refined these structuresusing a swarm of 20 short (10-ps) simulations launched from each image.Images were updated based on mean drift in each swarm, redistributingbetween end states and relaxing with 20-ps constrained simulations. At least400 iterations were completed for each string. We acknowledge that thedegree and order of changes could be influenced by the initial trajectory inthe event of a lack of convergence. SI Appendix, Fig. S17 demonstratesconvergence within 300 iterations (last 100 analyzed), with similar changesin all four independent strings (SI Appendix, Fig. S3 A–D).
We constructed free-energy maps in spaces defined by a selection ofvariables, X, using unbiased swarm trajectories after convergence via atransition analysis similar to Markov state modeling (e.g. ref. 65) not pre-viously applied to string method solutions. To obtain the probability that thesystem occupies point k in this space, ρk(X), we computed the dimensionlesstransition probability Pkl, from a transition count matrix, normalized bysource to remove bias from image locations. We sought a stationary solutionfor ρk(t) by iterating the discretized master equation:
ρkðt + δtÞ= ρkðtÞ+X
l≠k
½ρlðtÞPlk − ρkðtÞPkl �,
from which we computed the potential of mean force, Wk = −kBT ln(ρk). Wk
corresponds to an equilibrium free-energy projection, where remaining co-ordinates are sampled within the broad basin around the string. Maps werecalculated from analysis of different subunit variables (whole-pentamer results
Lev et al. PNAS Early Edition | 9 of 10
BIOPH
YSICSAND
COMPU
TATIONALBIOLO
GY
PNASPL
US

are shown in SI Appendix, Fig. S18), revealing interdependencies related tochannel gating. Other free-energy profiles were obtained by mean force orconstraint force integration, solving the Poisson–Boltzmann equation to esti-mate electrolyte screening, with full details provided in SI Appendix.
ACKNOWLEDGMENTS. We thank Michael Thomas for assistance in settingup simulations on the VLSCI BlueGene (VR0318; T.W.A.), Sergei Noskov forsample string scripts, and Igor Vorobyov for scripts used in SI Appendix, Fig.
S2. This study was supported by the National Health and Medical ResearchCouncil (Grant APP1104259 to T.W.A., B.A.C., and M.D.), NIH (Grant U01-11567710 to T.W.A.), Australian Research Council (Grant DP170101732 to T.W.A.),National Cancer Institute (Grant dd7 to T.W.A.), French Agency for Researchand “Initiative d’Excellence” (Grants ANR-13-BSV8-0020 and ANR-11-LABX-0011 to M.D. and M.B.), GENCI-/TGCC/CINES/IDRIS (Grant 2013-072292 to M.D.),and Air Liquide (M.B. and S.M.). We are grateful to the Medical AdvancesWithout Animals Trust for supporting this research.
1. Changeux JP (2012) Allostery and the Monod-Wyman-Changeux model after 50 years.Annu Rev Biophys 41:103–133.
2. Cecchini M, Changeux JP (2015) The nicotinic acetylcholine receptor and its pro-karyotic homologues: Structure, conformational transitions and allosteric modula-tion. Neuropharmacology 96:137–149.
3. Hibbs RE, Gouaux E (2011) Principles of activation and permeation in an anion-selective Cys-loop receptor. Nature 474:54–60.
4. Sauguet L, et al. (2014) Crystal structures of a pentameric ligand-gated ion channelprovide a mechanism for activation. Proc Natl Acad Sci USA 111:966–971.
5. Prevost MS, et al. (2012) A locally closed conformation of a bacterial pentamericproton-gated ion channel. Nat Struct Mol Biol 19:642–649.
6. Bocquet N, et al. (2009) X-ray structure of a pentameric ligand-gated ion channel inan apparently open conformation. Nature 457:111–114.
7. Hilf RJ, Dutzler R (2009) Structure of a potentially open state of a proton-activatedpentameric ligand-gated ion channel. Nature 457:115–118.
8. Hilf RJ, Dutzler R (2008) X-ray structure of a prokaryotic pentameric ligand-gated ionchannel. Nature 452:375–379.
9. Althoff T, Hibbs RE, Banerjee S, Gouaux E (2014) X-ray structures of GluCl in apo statesreveal a gating mechanism of Cys-loop receptors. Nature 512:333–337.
10. Du J, Lü W, Wu S, Cheng Y, Gouaux E (2015) Glycine receptor mechanism elucidatedby electron cryo-microscopy. Nature 526:224–229.
11. Huang X, Chen H, Michelsen K, Schneider S, Shaffer PL (2015) Crystal structure ofhuman glycine receptor-α3 bound to antagonist strychnine. Nature 526:277–280.
12. Hassaine G, et al. (2014) X-ray structure of the mouse serotonin 5-HT3 receptor.Nature 512:276–281.
13. Miller PS, Aricescu AR (2014) Crystal structure of a human GABAA receptor. Nature512:270–275.
14. Morales-Perez CL, Noviello CM, Hibbs RE (2016) X-ray structure of the humanα4β2 nicotinic receptor. Nature 538:411–415.
15. Duret G, et al. (2011) Functional prokaryotic-eukaryotic chimera from the pentamericligand-gated ion channel family. Proc Natl Acad Sci USA 108:12143–12148.
16. Sauguet L, et al. (2013) Structural basis for ion permeation mechanism in pentamericligand-gated ion channels. EMBO J 32:728–741.
17. Dellisanti CD, et al. (2013) Site-directed spin labeling reveals pentameric ligand-gatedion channel gating motions. PLoS Biol 11:e1001714.
18. Nury H, et al. (2011) Conformational dynamics in a nicotinic receptor homologueprobed by simulations. Biophys J 100:272.
19. Yu R, et al. (2014) Agonist and antagonist binding in human glycine receptors.Biochemistry 53:6041–6051.
20. Calimet N, et al. (2013) A gating mechanism of pentameric ligand-gated ion channels.Proc Natl Acad Sci USA 110:E3987–E3996.
21. Yoluk Ö, Lindahl E, Andersson M (2015) Conformational gating dynamics in the GluClanion-selective chloride channel. ACS Chem Neurosci 6:1459–1467.
22. Orellana L, Yoluk O, Carrillo O, Orozco M, Lindahl E (2016) Prediction and validationof protein intermediate states from structurally rich ensembles and coarse-grainedsimulations. Nat Commun 7:12575.
23. Weinan E, Ren WQ, Vanden-Eijnden E (2002) String method for the study of rareevents. Phys Rev B 66:052301.
24. Pan AC, Sezer D, Roux B (2008) Finding transition pathways using the string methodwith swarms of trajectories. J Phys Chem B 112:3432–3440.
25. Zhao C, Noskov SY (2013) The molecular mechanism of ion-dependent gating insecondary transporters. PLOS Comput Biol 9:e1003296.
26. Corringer PJ, et al. (2012) Structure and pharmacology of pentameric receptorchannels: From bacteria to brain. Structure 20:941–956.
27. Pless SA, Leung AW, Galpin JD, Ahern CA (2011) Contributions of conserved residuesat the gating interface of glycine receptors. J Biol Chem 286:35129–35136.
28. Bertozzi C, Zimmermann I, Engeler S, Hilf RJC, Dutzler R (2016) Signal transduction atthe domain interface of prokaryotic pentameric ligand-gated ion channels. PLoS Biol14:e1002393.
29. Lee WY, Sine SM (2005) Principal pathway coupling agonist binding to channel gatingin nicotinic receptors. Nature 438:243–247.
30. Purohit P, Auerbach A (2007) Acetylcholine receptor gating at extracellular trans-membrane domain interface: The “pre-M1” linker. J Gen Physiol 130:559–568.
31. Dellisanti CD, Hanson SM, Chen L, Czajkowski C (2011) Packing of the extracellulardomain hydrophobic core has evolved to facilitate pentameric ligand-gated ionchannel function. J Biol Chem 286:3658–3670.
32. Bali M, Akabas MH (2007) The location of a closed channel gate in the GABAA re-ceptor channel. J Gen Physiol 129:145–159.
33. Wang H-L, Cheng X, Sine SM (2012) Intramembrane proton binding site linked toactivation of bacterial pentameric ion channel. J Biol Chem 287:6482–6489.
34. LeBard DN, Hénin J, Eckenhoff RG, Klein ML, Brannigan G (2012) General anestheticspredicted to block the GLIC pore with micromolar affinity. PLOS Comput Biol 8:e1002532.
35. Laurent B, Murail S, Da Silva F, Corringer P-J, Baaden M (2012) Modeling complexbiological systems: From solution chemistry to membranes and channels. Pure ApplChem 85:1–13.
36. Willenbring D, Liu LT, Mowrey D, Xu Y, Tang P (2011) Isoflurane alters the structureand dynamics of GLIC. Biophys J 101:1905–1912.
37. Zhu F, Hummer G (2010) Pore opening and closing of a pentameric ligand-gated ionchannel. Proc Natl Acad Sci USA 107:19814–19819.
38. Nury H, et al. (2010) One-microsecond molecular dynamics simulation of channelgating in a nicotinic receptor homologue. Proc Natl Acad Sci USA 107:6275–6280.
39. Gupta S, Chakraborty S, Vij R, Auerbach A (2017) A mechanism for acetylcholine re-ceptor gating based on structure, coupling, phi, and flip. J Gen Physiol 149:85–103.
40. Bocquet N, et al. (2007) A prokaryotic proton-gated ion channel from the nicotinicacetylcholine receptor family. Nature 445:116–119.
41. Lummis SC, et al. (2005) Cis-trans isomerization at a proline opens the pore of aneurotransmitter-gated ion channel. Nature 438:248–252.
42. Sauguet L, et al. (2013) Structural basis for potentiation by alcohols and anaestheticsin a ligand-gated ion channel. Nat Commun 4:1697.
43. Laurent B, et al. (2016) Sites of anesthetic inhibitory action on a cationic ligand-gatedion channel. Structure 24:595–605.
44. Lape R, Colquhoun D, Sivilotti LG (2008) On the nature of partial agonism in thenicotinic receptor superfamily. Nature 454:722–727.
45. Sivilotti LG (2010) What single-channel analysis tells us of the activation mechanism ofligand-gated channels: The case of the glycine receptor. J Physiol 588:45–58.
46. Pless SA, Lynch JW (2009) Magnitude of a conformational change in the glycine re-ceptor beta1-beta2 loop is correlated with agonist efficacy. J Biol Chem 284:27370–27376.
47. Soh MS, Estrada-Mondragon A, Durisic N, Keramidas A, Lynch JW (2017) Probing thestructural mechanism of partial agonism in glycine receptors using the fluorescentartificial amino acid, ANAP. ACS Chem Biol 12:805–813.
48. Purohit P, Gupta S, Jadey S, Auerbach A (2013) Functional anatomy of an allostericprotein. Nat Commun 4:2984.
49. Burzomato V, Beato M, Groot-Kormelink PJ, Colquhoun D, Sivilotti LG (2004) Single-channel behavior of heteromeric alpha1beta glycine receptors: An attempt to detecta conformational change before the channel opens. J Neurosci 24:10924–10940.
50. Purohit P, Mitra A, Auerbach A (2007) A stepwise mechanism for acetylcholine re-ceptor channel gating. Nature 446:930–933.
51. Duke TA, Le Novère N, Bray D (2001) Conformational spread in a ring of proteins: Astochastic approach to allostery. J Mol Biol 308:541–553.
52. Rajendra S, et al. (1995) Mutation of an arginine residue in the human glycine re-ceptor transforms beta-alanine and taurine from agonists into competitive antago-nists. Neuron 14:169–175.
53. Bode A, Lynch JW (2013) Analysis of hyperekplexia mutations identifies trans-membrane domain rearrangements that mediate glycine receptor activation. J BiolChem 288:33760–33771.
54. Eiselé JL, et al. (1993) Chimaeric nicotinic-serotonergic receptor combines distinct li-gand binding and channel specificities. Nature 366:479–483.
55. Grutter T, et al. (2005) Molecular tuning of fast gating in pentameric ligand-gated ionchannels. Proc Natl Acad Sci USA 102:18207–18212.
56. Nury H, et al. (2011) X-ray structures of general anaesthetics bound to a pentamericligand-gated ion channel. Nature 469:428–431.
57. Reid CA, Berkovic SF, Petrou S (2009) Mechanisms of human inherited epilepsies. ProgNeurobiol 87:41–57.
58. Schwoerer H, Chapman HN, Siwick BJ, Miller RJD (2016) Special issue on imaging thedynamic structure of matter. J Phys At Mol Opt Phys 49:150201.
59. Brooks BR, et al. (2009) CHARMM: The biomolecular simulation program. J ComputChem 30:1545–1614.
60. Phillips JC, et al. (2005) Scalable molecular dynamics with NAMD. J Comput Chem 26:1781–1802.
61. MacKerell AD, et al. (1998) All-atom empirical potential for molecular modeling anddynamics studies of proteins. J Phys Chem B 102:3586–3616.
62. Mackerell AD, Jr, Feig M, Brooks CL, 3rd (2004) Extending the treatment of backboneenergetics in protein force fields: Limitations of gas-phase quantum mechanics inreproducing protein conformational distributions in molecular dynamics simulations.J Comput Chem 25:1400–1415.
63. Klauda JB, et al. (2010) Update of the CHARMM all-atom additive force field for lipids:validation on six lipid types. J Phys Chem B 114:7830–7843.
64. Jorgensen WL, Chandrasekhar J, Madura JD, Impey RW, Klein ML (1983) Comparisonof simple potential functions for simulating liquid water. J Chem Phys 79:926–935.
65. Buch I, Giorgino T, De Fabritiis G (2011) Complete reconstruction of an enzyme-inhibitor binding process by molecular dynamics simulations. Proc Natl Acad Sci USA 108:10184–10189.
10 of 10 | www.pnas.org/cgi/doi/10.1073/pnas.1617567114 Lev et al.