strides pharma science limited annual report report/annual_report_for_fy...strides pharma science...
TRANSCRIPT

Annual Report 2018-19Annual Report 2018-19
Strides Pharma Science Limited Annual Report 2018-19
ACROSS THIS REPORT
01-21
22-104
105-299
Business Review
01 Reset. Resurgent.04 Corporate Identity06 Financial Performance 08 Business Model10 Managing Director and
Group CEO’s Message 12 CFO’s Review14 Manufacturing Facilities16 Research and Development 17 Quality Framework18 Corporate Social Responsibility20 Board and Management
Statutory Reports
22 Management Discussion and Analysis 33 Board's Report 71 Corporate Governance Report 95 Business Responsibility Report
Financial Statements
105 Consolidated Financials210 Standalone Financials297 Details of Income, Expenditure and
Capital expenditure of DSIR recognized R&D unit
298 Equity History of the Company
Key financials, FY 2018-19
Revenues
EBITDA
EBITDA Margin
Regulated Market Margin
6%
7%
20 BPS
300 BPS
`30,264Million
`4,695Million
15.5%
20%
Growth (y-o-y)
Forward-looking statement
In this Annual Report, we have disclosed forward-looking information to enable investors to appraise our prospects and take investment decisions. This report and other statements–written and oral–that we periodically make contain forward-looking statements that sets out anticipated results based on the management’s plans and assumptions. We have tried, wherever possible, to identify such statements by using words such as ‘anticipate’, ‘estimate’, ‘expect’, ‘project’, ‘intend’, ‘plan’, ‘believe’, and words of similar substance in connection with any discussion of future performance. Although we have been prudent in our assumptions, we cannot guarantee that these forward-looking statements will be realised. The achievement of results is subject to risks, uncertainties and even inaccurate assumptions. Should known or unknown risks or uncertainties materialise, or should underlying assumptions prove inaccurate, actual results could materially vary from those anticipated, estimated or projected. Readers should bear this in mind. We undertake no obligation to publicly update any forward-looking statement whether as a result of new information, future events or otherwise. For more information, visit www.strides.com

This annual report deep dives into our reset and resurgent approaches that accelerate our growth momentum across the regulated markets and Africa continent. Challenging the status quo has always been a part of our DNA and our sole prescription for progress.
We believe, the reset strategy has infused new energy and optimism in our business and will help us create more value for both medium and long term and benefit all our stakeholders.
Strides Pharma Science Limited Annual Report 2018-19
32
Starting our journey from a challenging year, our focus in FY 2018-19 was to realign priorities and maximise growth with a focus on operational efficiencies.
Growing share in regulated markets
The regulated markets globally are projected to report a 3-6% CAGR during 2019-23, reaching an estimated value of US$900-1,020 Million. We have decided to consistently expand our share in regulated markets owing to their sheer scale and significance. Also, we have a growing presence in several countries in the European Union (EU), along with the US, the UK, South Africa and Canada, amongst others. We are driving rapid expansion in the US and other regulated markets to consistently grow our revenue share across these regions. Our continued R&D momentum is resulting in a significant build out of the portfolio for global markets.
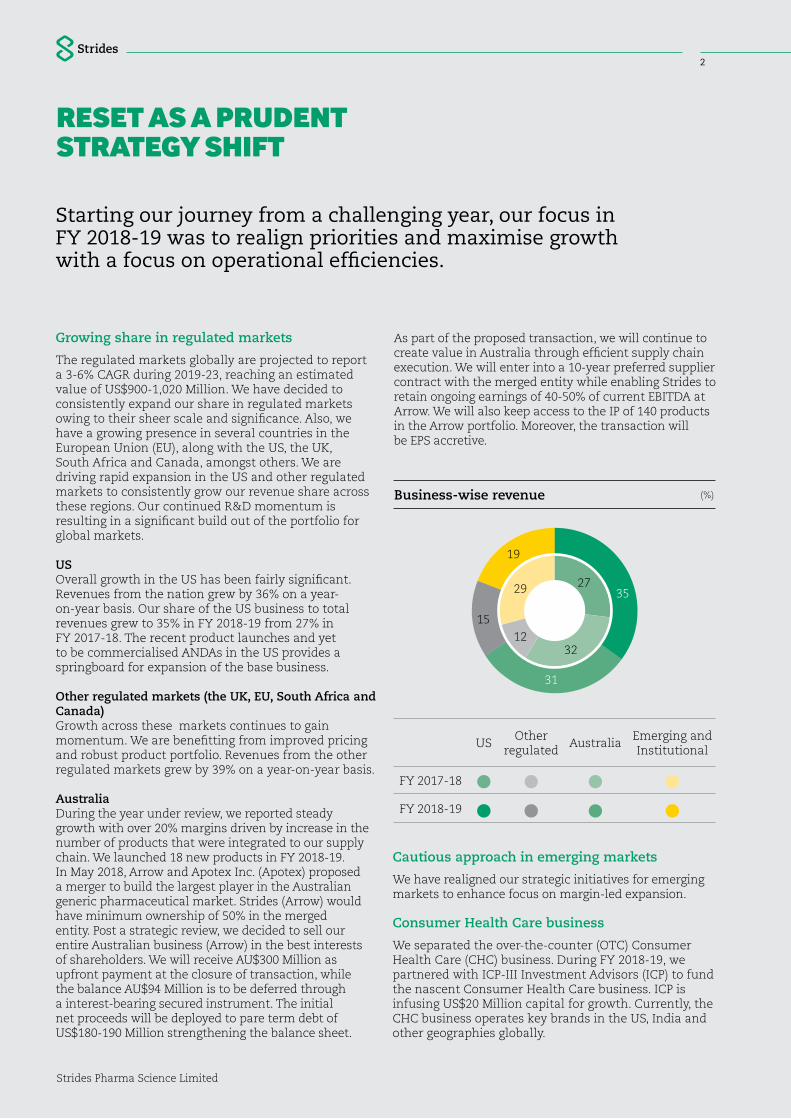
US Overall growth in the US has been fairly significant. Revenues from the nation grew by 36% on a year-on-year basis. Our share of the US business to total revenues grew to 35% in FY 2018-19 from 27% in FY 2017-18. The recent product launches and yet to be commercialised ANDAs in the US provides a springboard for expansion of the base business.
Other regulated markets (the UK, EU, South Africa and Canada) Growth across these markets continues to gain momentum. We are benefitting from improved pricing and robust product portfolio. Revenues from the other regulated markets grew by 39% on a year-on-year basis.
AustraliaDuring the year under review, we reported steady growth with over 20% margins driven by increase in the number of products that were integrated to our supply chain. We launched 18 new products in FY 2018-19. In May 2018, Arrow and Apotex Inc. (Apotex) proposed a merger to build the largest player in the Australian generic pharmaceutical market. Strides (Arrow) would have minimum ownership of 50% in the merged entity. Post a strategic review, we decided to sell our entire Australian business (Arrow) in the best interests of shareholders. We will receive AU$300 Million as upfront payment at the closure of transaction, while the balance AU$94 Million is to be deferred through a interest-bearing secured instrument. The initial net proceeds will be deployed to pare term debt of US$180-190 Million strengthening the balance sheet.
RESET AS A PRUDENT STRATEGY SHIFT
As part of the proposed transaction, we will continue to create value in Australia through efficient supply chain execution. We will enter into a 10-year preferred supplier contract with the merged entity while enabling Strides to retain ongoing earnings of 40-50% of current EBITDA at Arrow. We will also keep access to the IP of 140 products in the Arrow portfolio. Moreover, the transaction will be EPS accretive.
(%)Business-wise revenue
USOther
regulatedAustralia
Emerging and Institutional
FY 2017-18
FY 2018-19
Cautious approach in emerging markets
We have realigned our strategic initiatives for emerging markets to enhance focus on margin-led expansion.
Consumer Health Care business
We separated the over-the-counter (OTC) Consumer Health Care (CHC) business. During FY 2018-19, we partnered with ICP-III Investment Advisors (ICP) to fund the nascent Consumer Health Care business. ICP is infusing US$20 Million capital for growth. Currently, the CHC business operates key brands in the US, India and other geographies globally.
35
31
15
19
27
3212
29
Strides Pharma Science Limited Annual Report 2018-19
32
As we focus on future, we expect to build on the momentum with profitable growth, robust cash flows and operating leverage.
RESURGENT DRIVE TO REMAIN FUTURE-READY
Regulated markets
US marketOur US market growth is driven by a significant portfolio build out and additional upside from the recently concluded strategic acquisitions, which are as follows:
Acquisition of Vensun PharmaceuticalsWe acquired a 100% stake in Vensun Pharmaceuticals, Inc. (Vensun), a US-based generics company. Vensun has 12 commercialised ANDAs and 12 files pending approvals.
Converted 50:50 joint venture with Vivimed to 100% ownershipTo fast track our strategy, we converted our 50:50 JV with Vivimed to 100% ownership. Vivimed’s portfolio of 10 approved ANDAs was earlier marketed by third parties. The portfolio will now be ours and potentially add an annualised US$25 Million revenue starting from FY 2019-20.
The US FDA approved facility at Alathur, Chennai with a capacity of 1.5 Billion oral solids will support better utilisation of our facilities to service our increased demand in the fast-growing regulated markets business.
Other regulated markets
Other regulated markets witnessed the fastest growing business for Strides in FY 2018-19. We are fast-tracking growth by leveraging an extensive and established portfolio in Australia, Europe and the US through a portfolio maximisation strategy for other regulated markets.
Building our Canadian operationsWe acquired 80% stake in Pharmapar Inc. (Pharmapar), a Canada-based specialised generics front-end Company. This transaction enabled us to foray into Canada, which is a new market for us and one of the top 10 global pharmaceutical markets. The market is estimated at US$21 Billion, with a significant share of generics through retail pharmacies (Source: IQVIA).
Emerging markets
Currently, we are focussing on driving profits in emerging markets and staying on the forefront with a new treatment regimen in the institutional business. We remain focussed on reinforcing our pan-Africa branded generic player with leadership position in key markets and therapies.
In institutional business, we will sustain profitability of the existing business through focussed pricing and tender participation. Additionally, the introduction of next-generation combinations drugs will drive the next level of growth.
Business Review | Reset. Resurgent.
Strides Pharma Science Limited Annual Report 2018-19
54
REFRESHING WAY FORWARD
Incorporated in 1990, Strides Pharma Science Limited (Strides) is a global pharmaceutical company that operates across two business verticals in regulated and emerging markets. We focus on ‘difficult-to-manufacture’ products that are sold in over 100 countries.
With sustainability as a goal and a reset business model, we have made significant progress towards course correction and execution of our strategic objectives. We are strengthening our diversified B2C business, while we retain our growth momentum across key markets. We are supported in our endeavours by our global manufacturing base with seven production units spanning three continents. We have five manufacturing facilities [four US Food and Drug Administration (US FDA) approved] for regulated markets and we also own two dedicated production facilities in India and Kenya for the emerging markets. In the journey ahead, we will also maintain our product filing and approval trajectory for the US and other regulated markets.
We operate in a highly regulated and competitive global generics market with a resurgent approach that catalyses our actions towards achieving optimal growth momentum with improved margins and a stronger balance sheet. Our focus is on building a diversified consumer-focussed global formulations business with niche products and complex manufacturing capabilities. Our strategic progress has enabled us to operate in difficult markets and create a robust branded generics portfolio for a formidable front-end presence. We are putting the building blocks to commence the next leg of our journey; and we have made significant investments in synergic acquisitions, capacity expansions, research and development (R&D), IT infrastructure and compliance to build a strong foundation for the future.
In all our initiatives, the most important driving force is our people. With their curiosity, creativity, agility and intuition, they help us manage change with foresight and fortitude. Our empowered workforce brings onboard strong technical acumen and scientific capability to deliver high compliance and quality.
Regulated markets
Emerging markets
Business focus
USA | Australia | Other regulated markets
Africa | Institutional business
Strides Pharma Science Limited Annual Report 2018-19
54
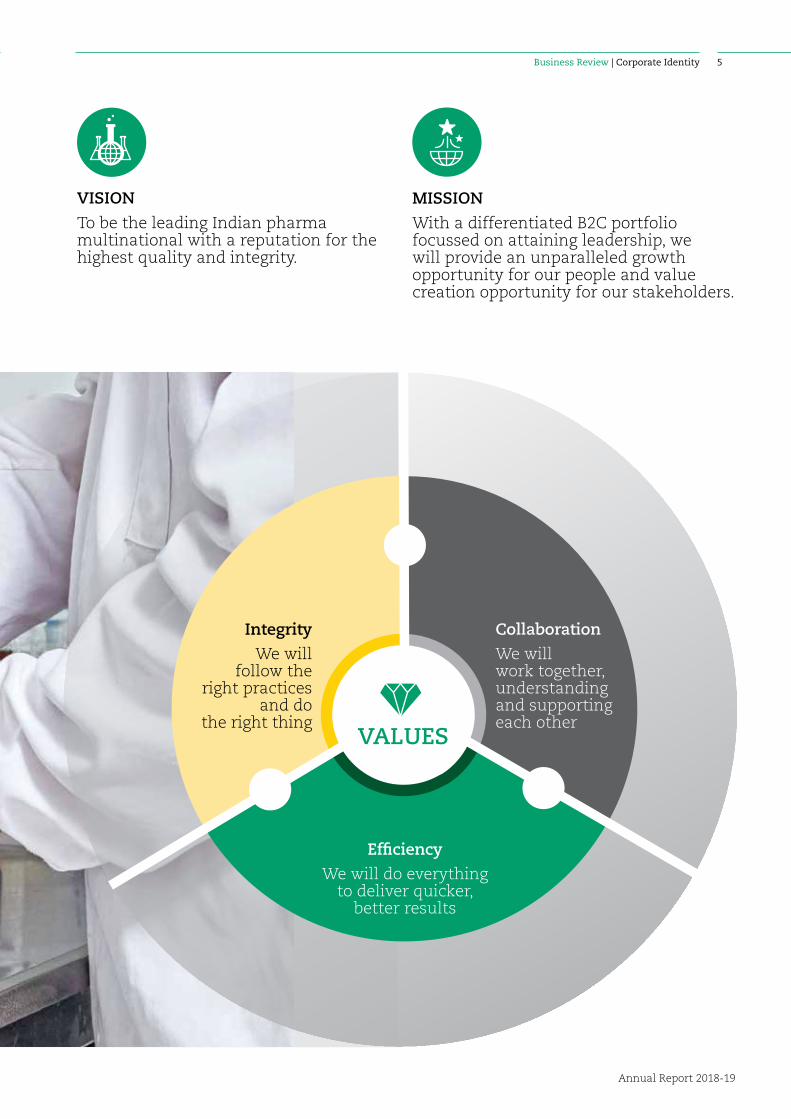
VALUES
Integrity
We will follow the
right practices and do
the right thing
Collaboration
We will work together, understanding and supporting each other
Efficiency
We will do everything to deliver quicker,
better results
MISSION
With a differentiated B2C portfolio focussed on attaining leadership, we will provide an unparalleled growth opportunity for our people and value creation opportunity for our stakeholders.
VISION
To be the leading Indian pharma multinational with a reputation for the highest quality and integrity.
Business Review | Corporate Identity
Strides Pharma Science Limited Annual Report 2018-19
76
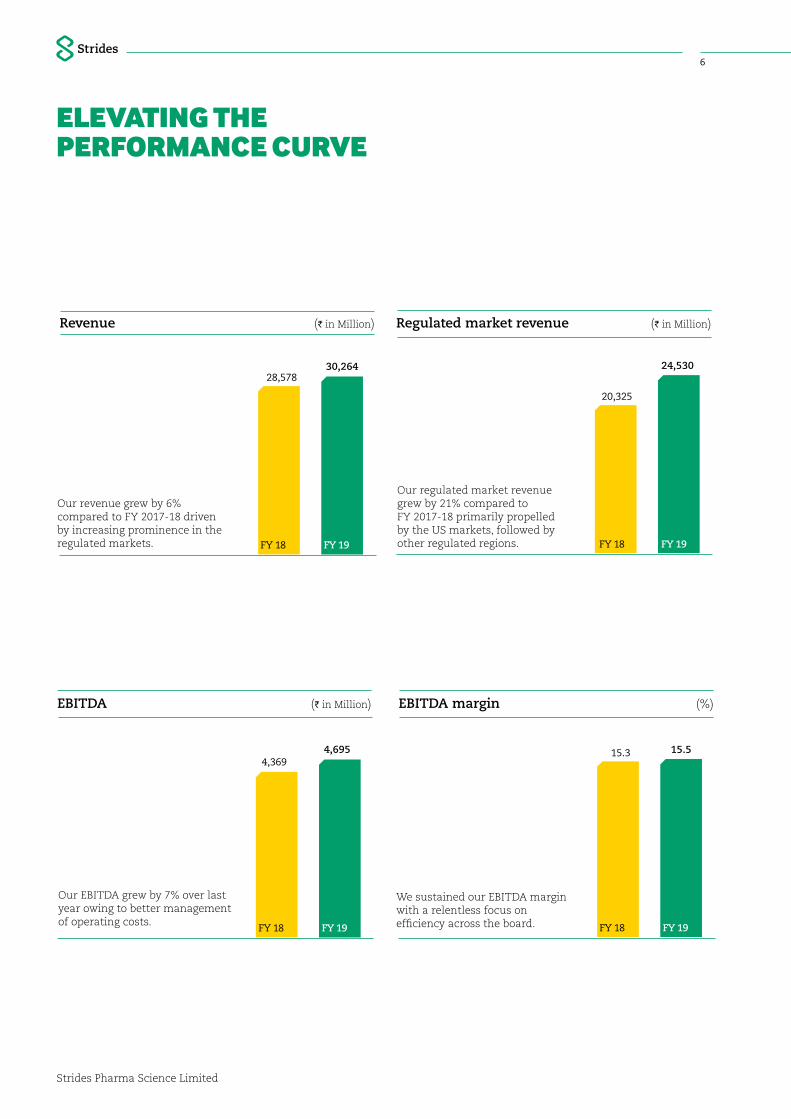
ELEVATING THE PERFORMANCE CURVE
FY 18
28,578
FY 19
30,264
(I in Million)Revenue
Our revenue grew by 6% compared to FY 2017-18 driven by increasing prominence in the regulated markets.
EBITDA
FY 18
4,369
FY 19
4,695
Our EBITDA grew by 7% over last year owing to better management of operating costs.
(I in Million)
FY 19
EBITDA margin
We sustained our EBITDA margin with a relentless focus on efficiency across the board.
(%)
FY 18
15.3 15.5
Regulated market revenue
Our regulated market revenue grew by 21% compared to FY 2017-18 primarily propelled by the US markets, followed by other regulated regions.
(I in Million)
FY 19 FY 18
20,325
24,530
Strides Pharma Science Limited Annual Report 2018-19
76
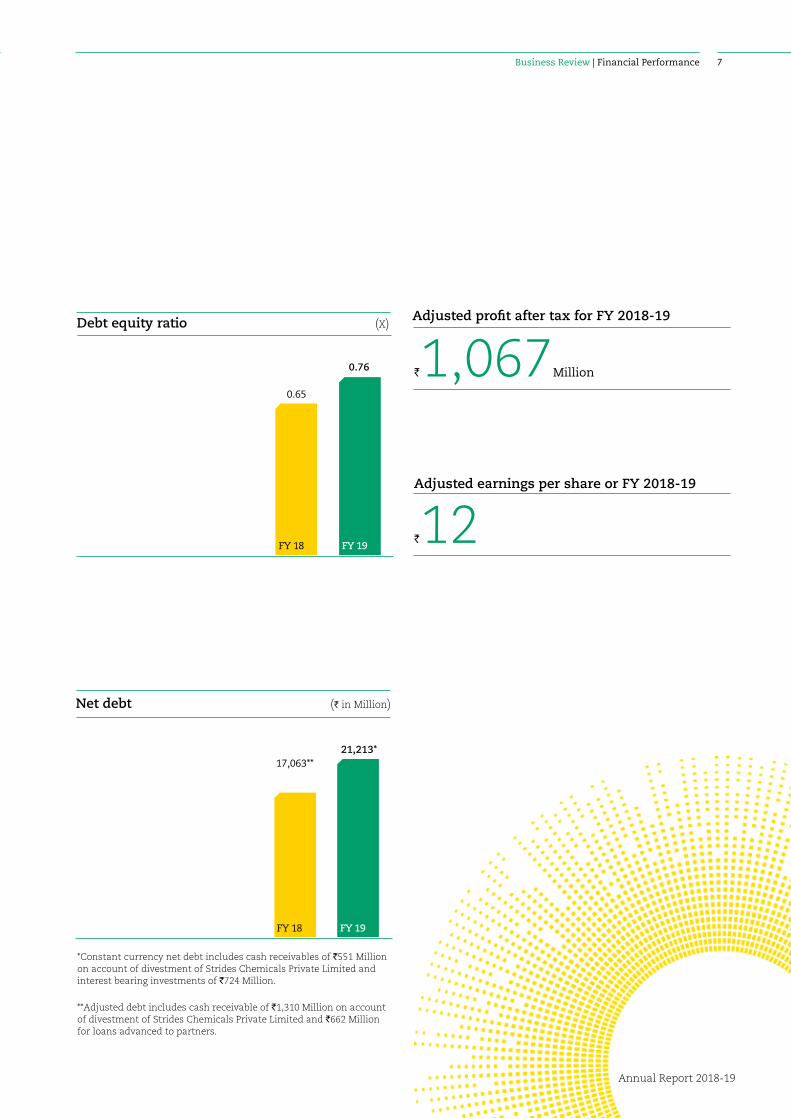
Debt equity ratio
FY 18
0.65
FY 19
0.76
Net debt (I in Million)
FY 18 FY 19
17,063**21,213*
*Constant currency net debt includes cash receivables of `551 Million on account of divestment of Strides Chemicals Private Limited and interest bearing investments of `724 Million.
**Adjusted debt includes cash receivable of `1,310 Million on account of divestment of Strides Chemicals Private Limited and `662 Million for loans advanced to partners.
Business Review | Financial Performance
(X)
Adjusted earnings per share or FY 2018-19
`12
`1,067Million
Adjusted profit after tax for FY 2018-19
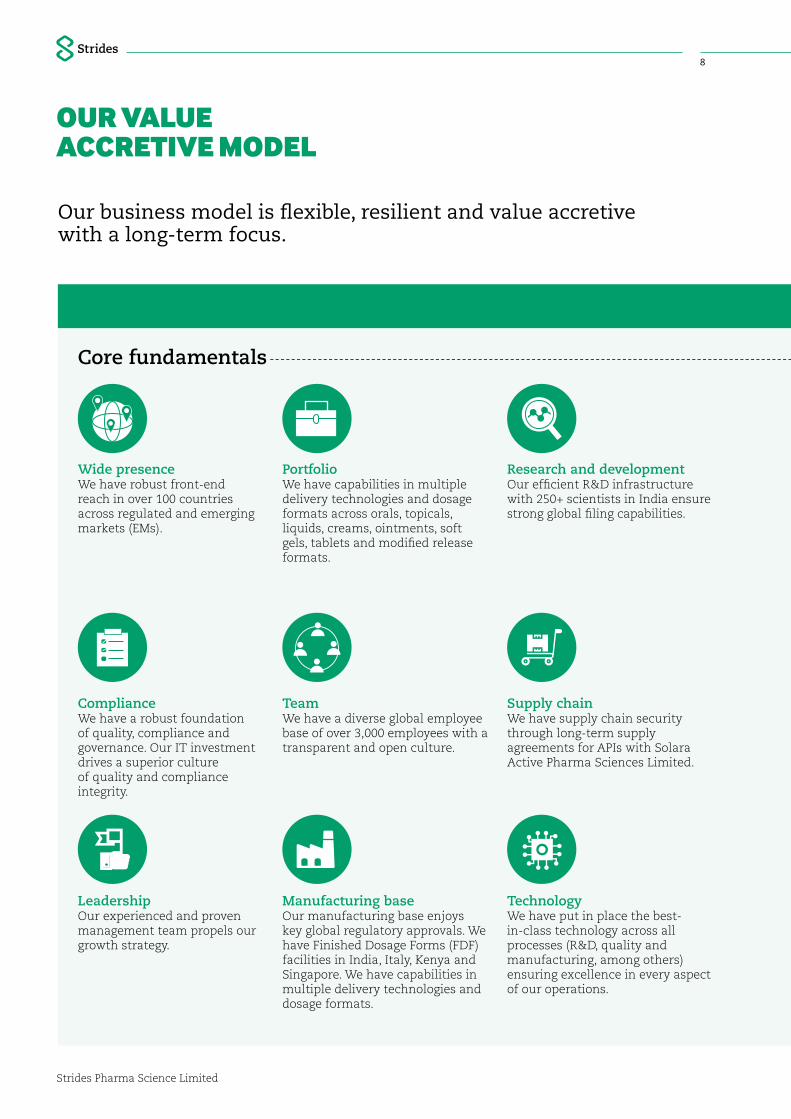
Core fundamentals
Wide presence We have robust front-end reach in over 100 countries across regulated and emerging markets (EMs).
Portfolio We have capabilities in multiple delivery technologies and dosage formats across orals, topicals, liquids, creams, ointments, soft gels, tablets and modified release formats.
Research and development Our efficient R&D infrastructure with 250+ scientists in India ensure strong global filing capabilities.
Team We have a diverse global employee base of over 3,000 employees with a transparent and open culture.
Compliance We have a robust foundation of quality, compliance and governance. Our IT investment drives a superior culture of quality and compliance integrity.
Manufacturing base Our manufacturing base enjoys key global regulatory approvals. We have Finished Dosage Forms (FDF) facilities in India, Italy, Kenya and Singapore. We have capabilities in multiple delivery technologies and dosage formats.
Leadership Our experienced and proven management team propels our growth strategy.
Supply chain We have supply chain security through long-term supply agreements for APIs with Solara Active Pharma Sciences Limited.
Technology We have put in place the best-in-class technology across all processes (R&D, quality and manufacturing, among others) ensuring excellence in every aspect of our operations.
Strides Pharma Science Limited Annual Report 2018-19
98
OUR VALUE ACCRETIVE MODEL
Our business model is flexible, resilient and value accretive with a long-term focus.
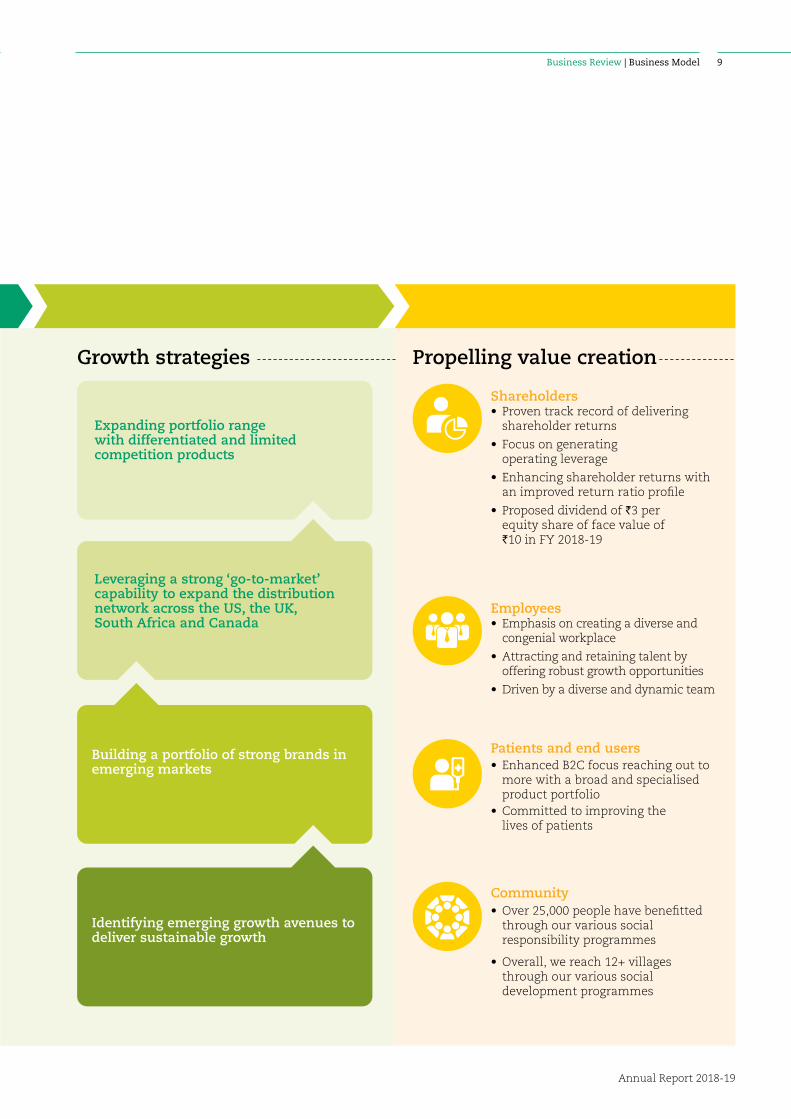
Expanding portfolio range with differentiated and limited competition products
Shareholders• Proven track record of delivering
shareholder returns
• Focus on generating operating leverage
• Enhancing shareholder returns with an improved return ratio profile
• Proposed dividend of `3 per equity share of face value of `10 in FY 2018-19
Employees • Emphasis on creating a diverse and
congenial workplace
• Attracting and retaining talent by offering robust growth opportunities
• Driven by a diverse and dynamic team
Community• Over 25,000 people have benefitted
through our various social responsibility programmes
• Overall, we reach 12+ villages through our various social development programmes
Leveraging a strong ‘go-to-market’ capability to expand the distribution network across the US, the UK, South Africa and Canada
Building a portfolio of strong brands in emerging markets
Identifying emerging growth avenues to deliver sustainable growth
Growth strategies Propelling value creation
Patients and end users• Enhanced B2C focus reaching out to
more with a broad and specialised product portfolio
• Committed to improving the lives of patients
Strides Pharma Science Limited Annual Report 2018-19
98 Business Review | Business Model

Strides Pharma Science Limited Annual Report 2018-19
1110
Dear Shareholders,
It feels great to share my perspectives yet again in my annual letter to you after a significant strategy reset at Strides. It has been a satisfying year in which most of our planned outcomes have met our expectations. Before we deep dive into the strategic progress and performance for the year, it is worthwhile to revisit the thoughts I shared last year wherein I had outlined the focus for FY 2018-19 as course correction and building the right enablers. From that perspective, we are happy to have achieved what we had set out to do.
We continued to be resilient and delivered an improved overall performance in FY 2018-19, while at the same time strengthened our fundamentals across our businesses.
We recalibrated our strategy in the US market and delivered healthy front-end performance in the base portfolio with market share gains for several molecules.
RESURGENT AND OPTIMISTIC
Strides Pharma Science Limited Annual Report 2018-19
1110
If we look back, the beginning of the year was no doubt challenging for us, given the backdrop of a weak performance in FY 2017-18 and changing industry landscape across key pharmaceutical markets. However, we continued to be resilient and delivered an improved overall performance, while at the same time strengthened our fundamentals across our businesses. This is particularly evident in our regulated market performance, where we exceeded our internal targets on margins, despite increased R&D activity and spend.
We reported 6% revenue growth from `28,578 Million in FY 2017-18 to `30,264 Million in FY 2018-19, resulting in growing scale in existing regulated markets and entry into emerging regulated geographies. Our EBITDA grew by 7% from `4,369 Million in FY 2017-18 to `4,695 Million in FY 2018-19 with a stable 15.5% margin. Our adjusted net profit (PAT) stood at `1,067 Million and earnings per share was `12 for FY 2018-19
Our reset strategy primarily revolves around our growing exposure in regulated markets, along with the cautious and calibrated approach in emerging markets and institutional business.
Regulated markets
The regulated markets business reported 21% year-on-year growth, accounting for over 81% of group revenues.
We recalibrated our strategy in the US market and delivered healthy front-end performance in the base portfolio with market share gains for several molecules. Over 60% of the currently commercialised portfolio is among the top 3 or have a significant market share, and 10+ products are enjoying a US$10 Million run rate.
We acquired 100% stake in Vensun Pharmaceuticals, Inc. to bolster our US marketed portfolio and front-end presence. We also converted our 50:50 joint venture with Vivimed to 100% ownership to take control of partnered ANDAs and the US FDA approved facility increasing our manufacturing bandwidth for the US market. Moreover, we entered into exclusive product development, licensing and supply agreement with SUDA Pharmaceuticals Ltd. for our novel drug SUD-001H, an oral spray of sumatriptan to treat migraine headache for the US market.
Our business across other regulated markets saw encouraging growth, while achieving critical scale driven by portfolio maximisation and new market entry. In the UK, we delivered a strong front-end performance, catalysed by increased wholesaler listings for generics and branded portfolio.
In South Africa, we benefitted from better compliance for portfolio and new customer addition. During the year under review, we forayed into Canada.
During FY 2018-19, we received shareholders’ approval to divest Australian business. The transaction is pending for other closing conditions, including the completion of the merger of Arrow and Apotex. Simultaneously with closure, we will enter into a
10-year preferred supplier contract with the merged entity, which will ensure our continued presence in the Australian market with improved EBITDA.
We continued our research and development (R&D) momentum. Our R&D investments grew 10% to `1,290 Million in FY 2018-19 from `1,176 Million in FY 2017-18. During FY 2018-19, we had 21 filings and received 15 product approvals, including PARA IV approvals for Cinacalcet and Milnacipran Hydrochloride.
Emerging markets and institutional business
We had our own share of challenges in emerging markets and institutional business owing primarily to the weak business environment. In Africa and other emerging markets, our major strategy shift achieved its desired outcomes; and is expected to deliver a turnaround in the foreseeable future. We remain focussed to become a pan-Africa branded generic player with leadership position in key markets and therapies.
In our institutional business, we completed all contractual obligations of low-margin institutional supplies, partnered under long-term contracts. Now we have recalibrated our strategy to focus more on profitable contracts and have taken a guarded, margin-driven approach.
Compliance
During FY 2018-19, we successfully completed the US FDA inspection at our flagship facility in Bengaluru. We received the US FDA approval for our greenfield oral dosage facility in Singapore, which will cater to regulated markets across the US, Australia, the UK and Europe. Our focus is unwavering on compliance, with industry-leading automation and quality framework. Our efforts are underway to get a fast reclassification of Puducherry facility, which was recently classified as ‘Official Action Indicated’ by the US FDA. We will continue to drive reassuring outcomes in quality, compliance and automation.
Looking ahead
Going forward, our key priorities to drive sustainable growth will include:
• Reinforce market prominence in the US with existing portfolio and maintain product launch momentum
• Broad-base growth across other regulated markets with our robust product portfolio
• Focus on R&D filings with a strategic shift towards complex or speciality generics
• Drive profitable growth across emerging markets and institutional business
On behalf of the Board, I take this opportunity to convey my gratitude to our shareowners, management team, employees, suppliers, associates and our loyal fraternity of customers for their continued trust and support.
Arun
Business Review | Managing Director and Group CEO’s Message
Strides Pharma Science Limited Annual Report 2018-19
1312
Dear Shareholders,
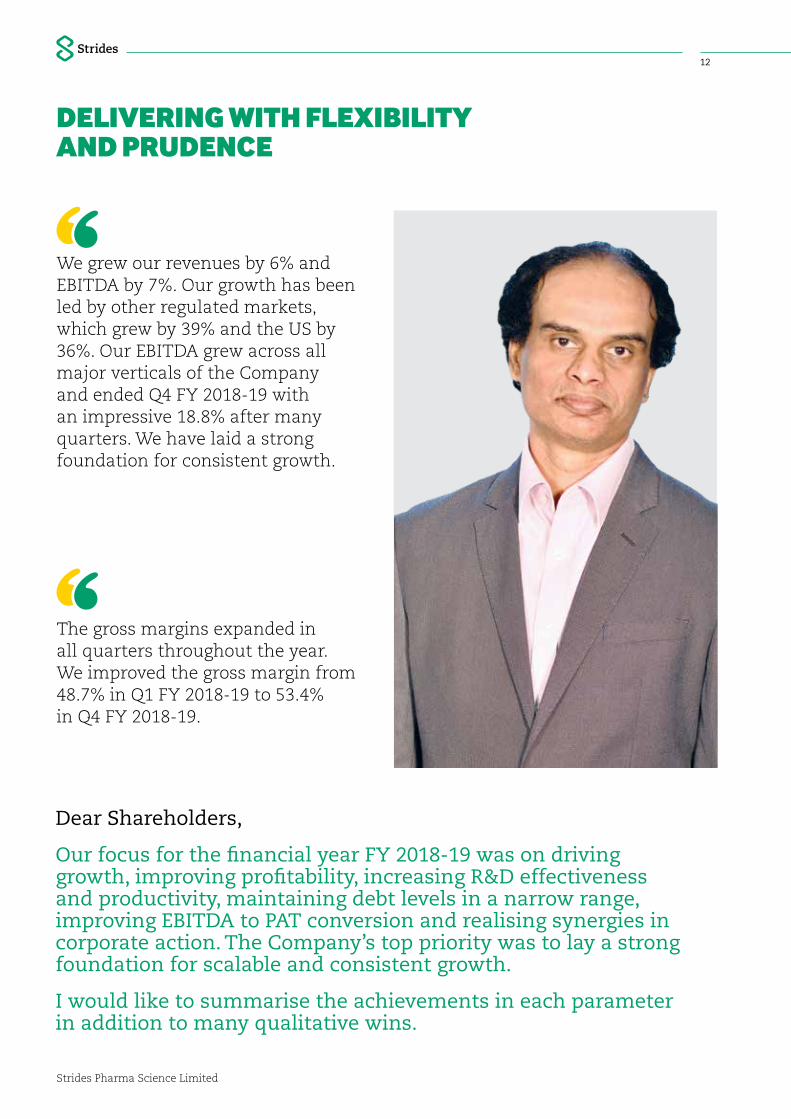
Our focus for the financial year FY 2018-19 was on driving growth, improving profitability, increasing R&D effectiveness and productivity, maintaining debt levels in a narrow range, improving EBITDA to PAT conversion and realising synergies in corporate action. The Company’s top priority was to lay a strong foundation for scalable and consistent growth.
I would like to summarise the achievements in each parameter in addition to many qualitative wins.
We grew our revenues by 6% and EBITDA by 7%. Our growth has been led by other regulated markets, which grew by 39% and the US by 36%. Our EBITDA grew across all major verticals of the Company and ended Q4 FY 2018-19 with an impressive 18.8% after many quarters. We have laid a strong foundation for consistent growth.
The gross margins expanded in all quarters throughout the year. We improved the gross margin from 48.7% in Q1 FY 2018-19 to 53.4% in Q4 FY 2018-19.
DELIVERING WITH FLEXIBILITY AND PRUDENCE

Strides Pharma Science Limited Annual Report 2018-19
1312
Growth
We grew our revenues by 6% and EBITDA by 7%. Our growth has been led by other regulated markets, which grew by 39% and the US by 36%. Our EBITDA grew across all major verticals of the Company and ended Q4 FY 2018-19 with an impressive 18.8% after many quarters. Arrow delivered over 20% EBITDA margins across all quarters. The Company’s US revenue reached a landmark `10 Billion, an encouraging achievement by any measure. We have laid a strong foundation for consistent growth.
Profitability
The gross margins expanded in all quarters throughout the year. We improved the gross margins from 48.7% in Q1 FY 2018-19 to 53.4% in Q4 FY 2018-19. The EBITDA margins improved from 13.5% in Q1 FY 2018-19 to 18.8% in Q4 FY 2018-19. This was primarily led by higher contribution from regulated markets and steady cost base. We fully managed the operating leverage in Q4 FY 2018-19. This is a significant achievement and the scale-up is very steep from Q1 FY 2018-19.
R&D effectiveness
We achieved linearity in R&D filings. During the year, we filed 21 ANDA applications. This is one of the highest filings in the preceding few years of Strides 2.0. In addition, the fungibility of the Arrow portfolio, has enabled other regulated markets to grow at a healthy pace with minimal regulatory costs.
Debt/PAT conversion
The depreciation, interest and tax component has been consistent in all the four quarters of the year. The increase in the gross margins and EBITDA of Q4 FY 2018-19 completely reflected in PAT, signifying the reflection of the operating leverage. The scale up of the US business was almost 2.5 times in Q4 FY 2018-19 vis-à-vis Q4 FY 2017-18.
To fund the growth in our business and to sustain the R&D momentum, we had to make investments in working capital. The depreciation in the Rupee also increased the reported debt by about `1,890 Million, primarily arising out of exchange fluctuations (Conversion) on consolidation though the debt is in respective functional currency. The balance debt increase represents acquisition debt on to Vensun and Vivimed transaction. During the year, the Company also committed funding to Stelis Biopharma to the tune of ~`1,000 Million in proportion to its shareholding.
Corporate initiatives
We completed multiple corporate actions with acquisitions of Vensun, Pharmapar and Vivimed. We deconsolidated Consumer Health Care (CHC) business with effect from Q4 FY 2018-19. We announced the divestment of our Australian front-end business. We had announced the intention to pare off significant term debt. We hope to complete the transaction by Q2 FY 2019-20.
In addition, there have been qualitative wins. We, along with Mylan, successfully closed the long pending international arbitration, which resulted in cash inflow of about US$42 Million to the Company. We have been very proactive and have laid a strong governance framework for ever-changing legislations globally. The Goods and Services Tax (GST) refund process has also been completely streamlined. We are happy to share, that we have completed all the pending capital expenditure (capex) programmes in Singapore. Our Singapore plant received an US FDA approval in March 2019.
Future priorities
We are pleased with the progress of FY 2018-19 and we believe we have laid a strong foundation for consistent Profitability, Efficiency and Growth (PEG). The key priorities for the next year comprise the following:
• Lay a strong platform to achieve a sustainable EBITDA level of 20%
• Improve return ratios like return on capital employed (ROCE) and return on equity (ROE) to industry standards
• Continue our strong risk management programme and extend it to new geographies
• IT automation needs more focus to enable decision-making both in terms of lead and lag metrics on all aspects of performance
• Align working capital between front-end and back-end business so that the cash is fungible across the organisation
• Complete the divestment of Australian business, retire debt and strengthen the balance sheet
• Focus on global governance compliance programme including new geographies
We will continue to focus on enhancing the productivity of our teams and build a robust review mechanism to meet ever-growing future demands. We will be guided by the knowledge and insight of the investor fraternity and serve them well. Energised by a reset strategy and a resurgent focus on future priorities, we are confident to grow prudently.
I thank all shareholders for their support and guidance in one of the most turbulent years of our journey. I look forward to FY 2019-20 with optimism and we are committed to creating long-term value with diligence and focus.
Badree
Business Review | CFO’s Review
Strides Pharma Science Limited Annual Report 2018-19
1514
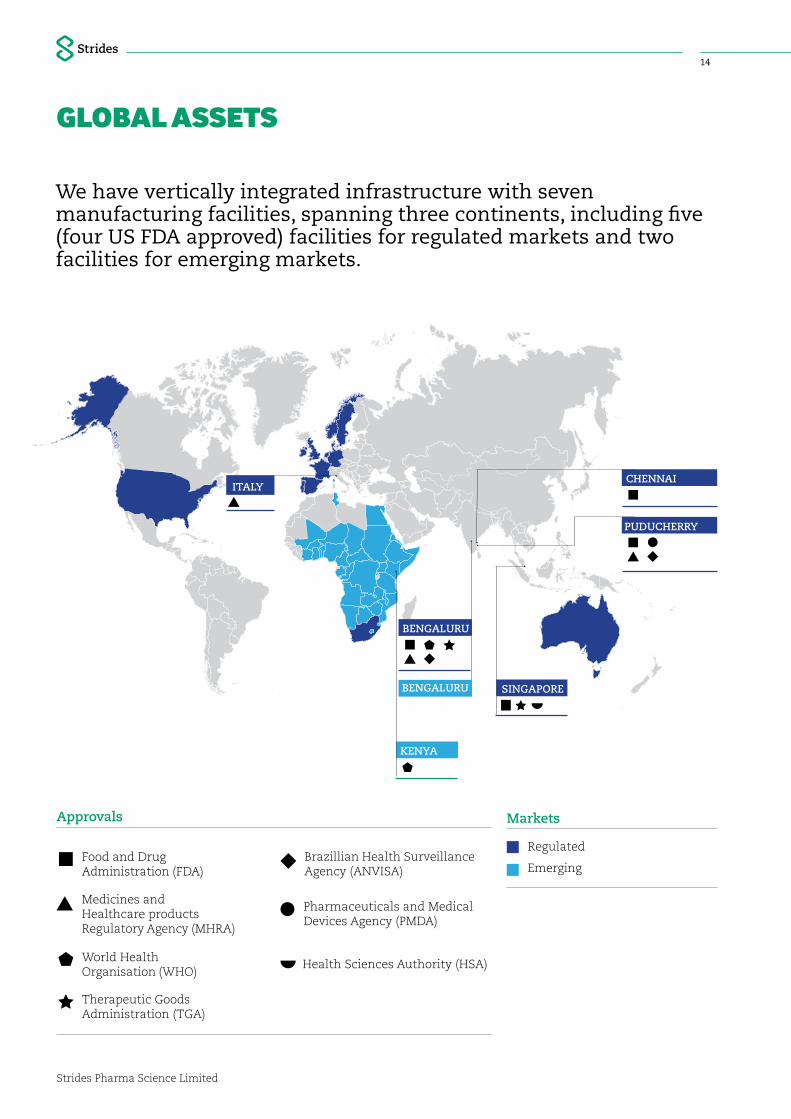
GLOBAL ASSETS
We have vertically integrated infrastructure with seven manufacturing facilities, spanning three continents, including five (four US FDA approved) facilities for regulated markets and two facilities for emerging markets.
World Health Organisation (WHO)
Food and Drug Administration (FDA)
Brazillian Health Surveillance Agency (ANVISA)
Medicines and Healthcare products Regulatory Agency (MHRA)
Pharmaceuticals and Medical Devices Agency (PMDA)
Health Sciences Authority (HSA)
Therapeutic Goods Administration (TGA)
Approvals Markets
Regulated
Emerging
BENGALURU
CHENNAI
SINGAPORE
PUDUCHERRY
KENYA
BENGALURU
ITALY
Strides Pharma Science Limited Annual Report 2018-19
1514
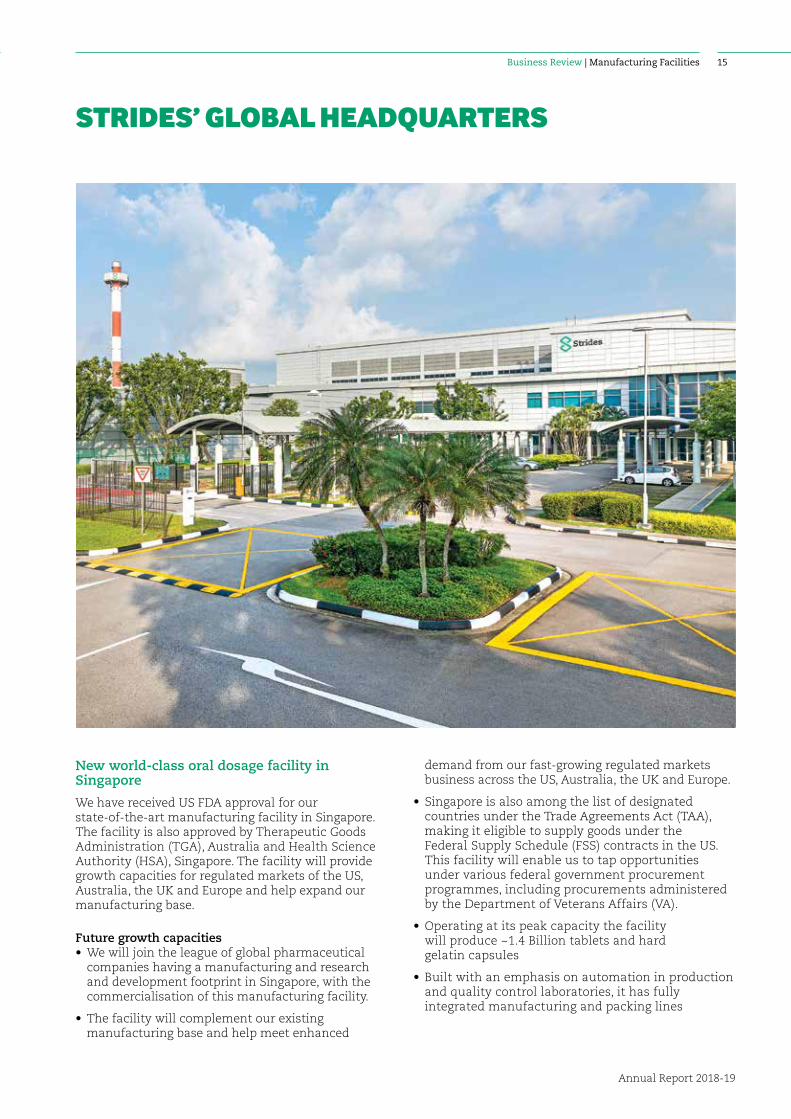
New world-class oral dosage facility in Singapore
We have received US FDA approval for our state-of-the-art manufacturing facility in Singapore. The facility is also approved by Therapeutic Goods Administration (TGA), Australia and Health Science Authority (HSA), Singapore. The facility will provide growth capacities for regulated markets of the US, Australia, the UK and Europe and help expand our manufacturing base.
Future growth capacities• We will join the league of global pharmaceutical
companies having a manufacturing and research and development footprint in Singapore, with the commercialisation of this manufacturing facility.
• The facility will complement our existing manufacturing base and help meet enhanced
demand from our fast‐growing regulated markets business across the US, Australia, the UK and Europe.
• Singapore is also among the list of designated countries under the Trade Agreements Act (TAA), making it eligible to supply goods under the Federal Supply Schedule (FSS) contracts in the US. This facility will enable us to tap opportunities under various federal government procurement programmes, including procurements administered by the Department of Veterans Affairs (VA).
• Operating at its peak capacity the facility will produce ~1.4 Billion tablets and hard gelatin capsules
• Built with an emphasis on automation in production and quality control laboratories, it has fully integrated manufacturing and packing lines
STRIDES’ GLOBAL HEADQUARTERS
Business Review | Manufacturing Facilities
Strides Pharma Science Limited Annual Report 2018-19
1716
INNOVATION REMAINS OUR COMPETITIVE ADVANTAGE
The pharmaceutical landscape is ever evolving, and innovation is critical to survive and thrive in such an operating landscape. Our R&D team focusses on development of a variety of novel dosage forms, including various novel dosage forms. The focus is to steadily improve our processes and procedures to drive our long-term growth trajectory.
During FY 2018-19, our R&D team delivered 21 ANDAs, along with 30+ dossiers for regulated markets, including EU zone, Canada, Australia, South Africa and others. Our technical expertise, coupled with access to leading-edge technology platforms enable us to deliver value and customer satisfaction seamlessly.
Powered by innovation, we introduced new products and processes, which helped strengthen our profit. We also consolidated our new R&D infrastructure and streamlined our processes. We followed a strategic blueprint for growing the impact of our R&D across the various markets we serve. During FY 2018-19, our R&D spend stood at `1,290 Million vis-à-vis `1,176 Million in FY 2017-18.
Regulated market
As a part of our transformation, we are shifting our focus on novel drug delivery system and 505b (2) product development, alongside the existing generic product development. Since we have created a robust foothold in the US with 100+ files, our R&D team is gradually shifting its focus on increasing generic filings in other regulated markets of EU region, Canada and Australia, thereby providing equal emphasis to all regulated markets, where we have our presence.
Additionally, our R&D team is involved in extending the current portfolio to multiple regulated markets through the portfolio maximisation programme, whereby we not only increase the number of filings but also expand the revenue of each product basket.
Institutional and emerging markets
During FY 2018-19, we recalibrated our focus on institutional and emerging markets and emphasised on the regulated markets business. Our R&D team is ready to take up additional development and improvement activities with the available technical expertise, along with our futuristic technological platforms.
Way forward
The transition from being a generic player to a novel drug development/505b(2) developer will be the primary focus for the upcoming year. Therefore, balancing the generic development across all regulated markets and specialised drug development will be the most critical task at hand for our R&D team.
Going forward, we will continue to focus on complex drug development while developing generic competitive projects with speed. Besides, we will also emphasise on portfolio maximisation and process improvement for different markets.
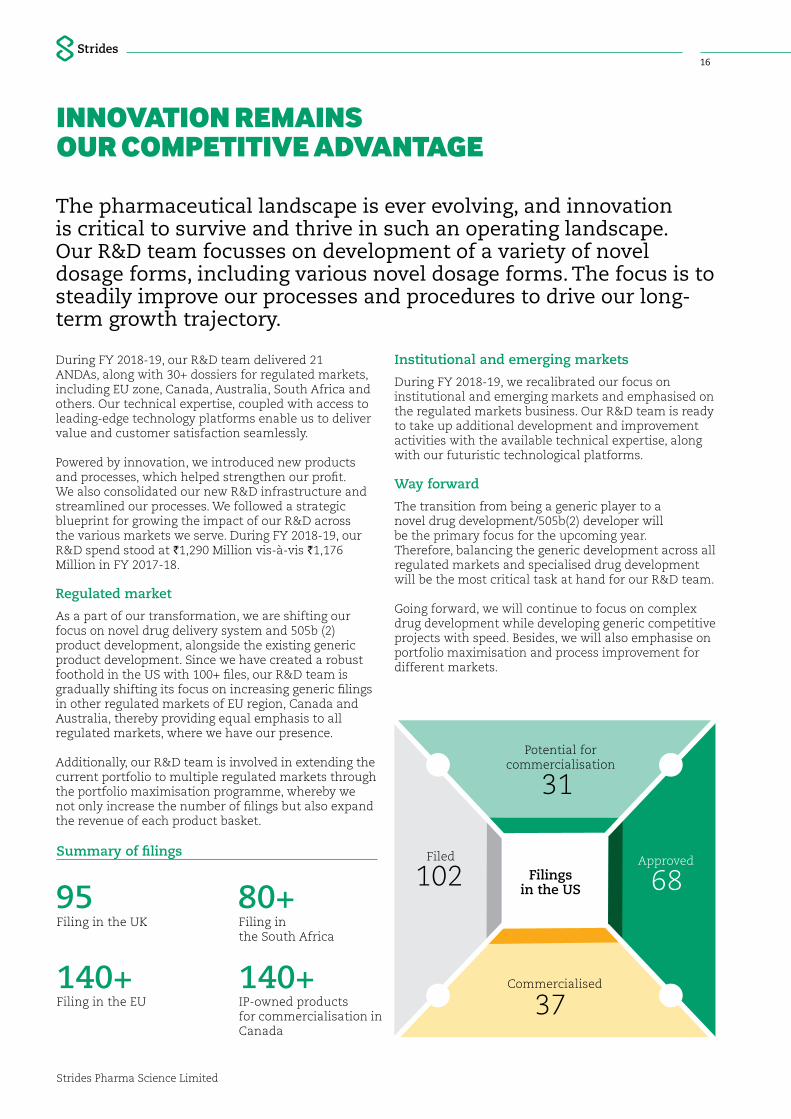
Summary of filings
95 80+
140+ 140+
Filing in the UK Filing in the South Africa
Filing in the EU IP-owned products for commercialisation in Canada
Potential for commercialisation
31
Approved
68Filed
102
Commercialised
37
Filings in the US

Strides Pharma Science Limited Annual Report 2018-19
1716
QUALITY AT THE CENTRE OF OUR OPERATIONS
Quality is a 24x7 priority at Strides. Our continued focus on quality and compliance has helped us achieve high benchmarks in the compliance curve. This includes laboratory and manufacturing automation, translating to greater accuracy and compliance in these areas.
We have set up a robust quality governance mechanism and continue to optimise it for greater effectiveness, based on relentless improvement programmes. These governance models include site-level and corporate-level governance mechanisms. The governance model ensures that senior management is engaged in key matters of quality and compliance.
Our automation initiative is now expanded to more number of products for manufacturing and testing. The real-time governance metrics has been
matured and democratised for greater effectiveness and engagement with relevant staff. The learning management standard has been expanded to include more people under the purview of a very intense training and development programmes for our technical staff.
We are mindful of ever-rising regulatory expectations as well as learning from current industry challenges. The result is that we have undertaken several breakthrough initiatives to make the Company resilient and future-ready.
Business Review | Research and Development | Quality Framework

Strides Pharma Science Limited Annual Report 2018-19
1918
ACCELERATING COMMUNITY INTERVENTIONS
We address social, environmental and economic requirements of the communities we work with. Our community interventions primarily focus on health, education and employability.
We believe a socially responsible ecosystem is key to inclusive development that benefits all sections of society. Therefore, we are focussed on creating sustainable value for communities—beyond compliance—through our numerous programmes.
School health camp Polio vaccine drive
Health
ArogyadhamaArogyadhama is a state-of-the-art primary health centre that caters to the people of surrounding 12 villages. During FY 2018-19, it completed four years of service in curative, preventive and promotive healthcare services at Honnakalasapura, Suragajakkanahalli, Karnataka.
The centre hosts advanced diagnostic equipment, including x-ray and scanning machines. It also has laboratory facilities and a minor OT, along with out-patient facilities. Additionally, the healthcare centre has other specialist's care like ophthalmology, gynaecology, paediatrics, dental treatments, pharmacy and daycare.
Arogyadhama also undertakes the cause of spreading awareness on various health and hygiene topics like the importance of a clean environment and symptoms of diseases like tuberculosis, leprosy, H1N1, malaria
and others. It further provides proactive treatment, persuades the community to keep the environment clean, identifies diabetes and hypertension patients, offers to counsel and administers regular medicines.
Arogyadhama has won appreciation and positive feedback from the surrounding villages, the Panchayat, along with the government primary healthcare centres (PHCs) and doctors.
RO water plantsWe arranged access to potable water for over 9,000 people in Suragajakkanahalli, Hennagra and Neralur panchayats in Anekal Taluk, Bangalore to ensure water-borne diseases are not transmitted. Till date, our CSR arm—Strides Foundation—has built eight self-sustainable RO water units, with 2,000 litres per hour capacity each. During the year under review, we commissioned new units at Guddahatti, Honnakalasapura and Ramakrishnapura.

Strides Pharma Science Limited Annual Report 2018-19
1918
Education
Leadership Adoption Program at Schools (LeAPS)LeAPS is designed to impart life skills training to government school students. It helps and motivates students through:
• Innovative training methodologies
• Life Application that takes the children beyond their classrooms
• A highly stimulating and enjoyable experience
We also organised educational tours for the students of government schools of Haragadde and Suragajakkanahalli, where 250 students participated. The children visited historical sites of Hampi, Badami, Aihole and Pattadkal.
Isha VidhyaWith our focus on enriching the quality of education, we made a grant to Isha Vidhya to support its educational infrastructure, in their Cuddalore school, for buying equipment, including computers/laptops; science and sports equipment; and arts and craft materials.
Life skills training at government schools
Life skills training at government schools
Installed RO water plant
Infrastructure development at school
Centre for Social Initiatives and Management (CSIM)We also supported Social Entrepreneurship programmes with financial assistance to the CSIM.
Employability
Vocational skill developmentWe offer vocational training to the youth in the fisherman community and other lesser privileged villages near Puducherry. The Employment Empowerment Program is organised in partnership with Swami Vivekananda Rural Community College (SVRCC), where 100 students are trained in several job-led courses, with a holistic approach, to make them responsible citizens.
Disaster relief
During the year under review, we contributed to the disaster relief efforts of Kerala and the Kodagu district of Karnataka.
Business Review | Corporate Social Responsibility

Strides Pharma Science Limited Annual Report 2018-19
2120
BOARD OF DIRECTORS
Arun Kumar Managing Director and Group CEO
Deepak VaidyaNon-Executive Director and Chairperson of the Board
S Sridhar Independent Director
Sangita Reddy Independent Director
Bharat D Shah Independent Director
Homi Rustam Khusrokhan Independent Director
Badree Komandur Executive Director – Finance and Group CFO
Strides Pharma Science Limited Annual Report 2018-19
2120
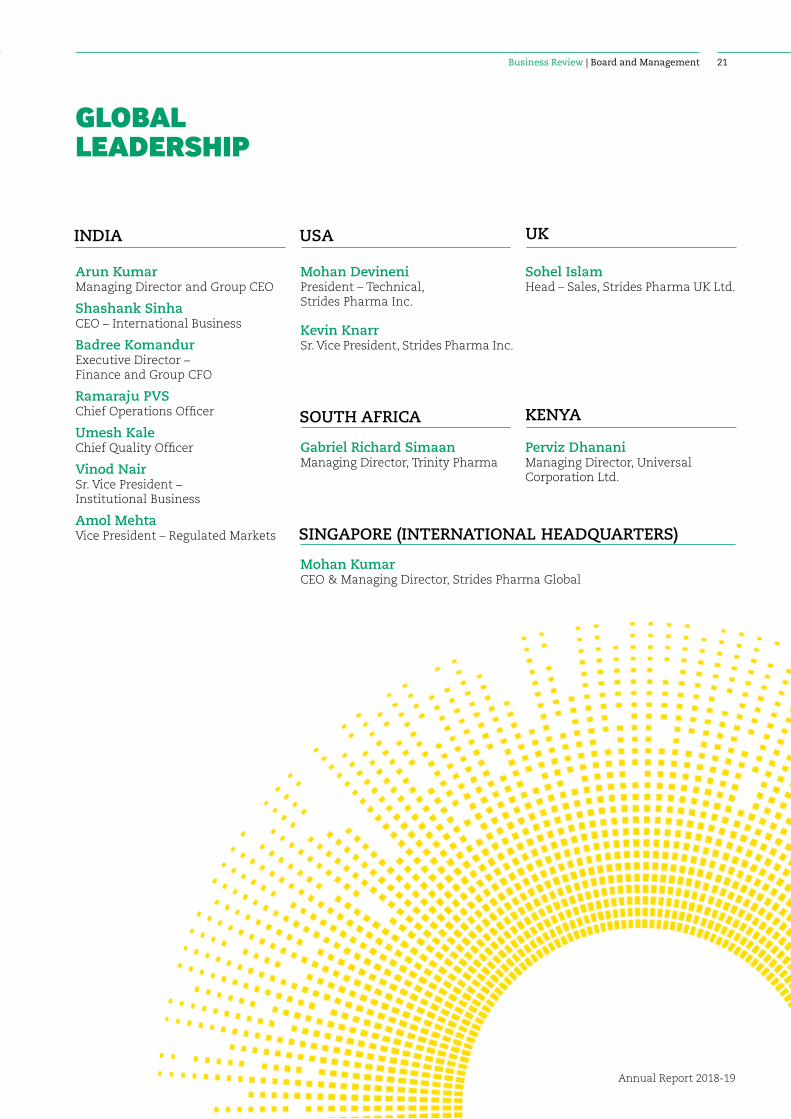
GLOBAL LEADERSHIP
Arun Kumar Managing Director and Group CEO
Shashank Sinha CEO – International Business
Badree Komandur Executive Director – Finance and Group CFO
Ramaraju PVS Chief Operations Officer
Umesh Kale Chief Quality Officer
Vinod Nair Sr. Vice President – Institutional Business
Amol Mehta Vice President – Regulated Markets
Mohan Devineni President – Technical, Strides Pharma Inc.
Gabriel Richard Simaan Managing Director, Trinity Pharma
Mohan Kumar CEO & Managing Director, Strides Pharma Global
Sohel Islam Head – Sales, Strides Pharma UK Ltd.
Perviz Dhanani Managing Director, Universal Corporation Ltd.
Kevin Knarr Sr. Vice President, Strides Pharma Inc.
INDIA USA
SOUTH AFRICA KENYA
UK
SINGAPORE (INTERNATIONAL HEADQUARTERS)
Business Review | Board and Management
Statutory Reports | Management Discussion and Analysis
Strides Pharma Science Limited Annual Report 2018-19
2322
Industry structure and development
Global economyWorld economic growth slowed to 3.6% in 2018, reversing a two-year cyclical upswing. There were a number of causative factors. Weakness in Eurozone economies, continued uncertainty around BREXIT, lingering US-China trade tensions, elevated threats of protectionism, decelerated global industrial production (particularly capital goods) in tandem with higher policy ambiguity and volatile oil prices contributed to the slower growth trajectory. Further, macroeconomic stress in Argentina and Turkey, stricter banking regulations in China and disruptions in the German auto industry due to the implementation of higher emission standards weighed heavily on the global economy, especially in the second half.
MANAGEMENT DISCUSSION AND ANALYSIS
In contrast, the US economic growth accelerated on the back of massive tax cuts approved in 2017, muted inflation, and a natural unemployment rate. China ramped up its fiscal and monetary stimulus to counter the imposition of higher tariffs; while the European Central Bank, the Bank of England and the Bank of Japan shifted to an accommodative policy stance.
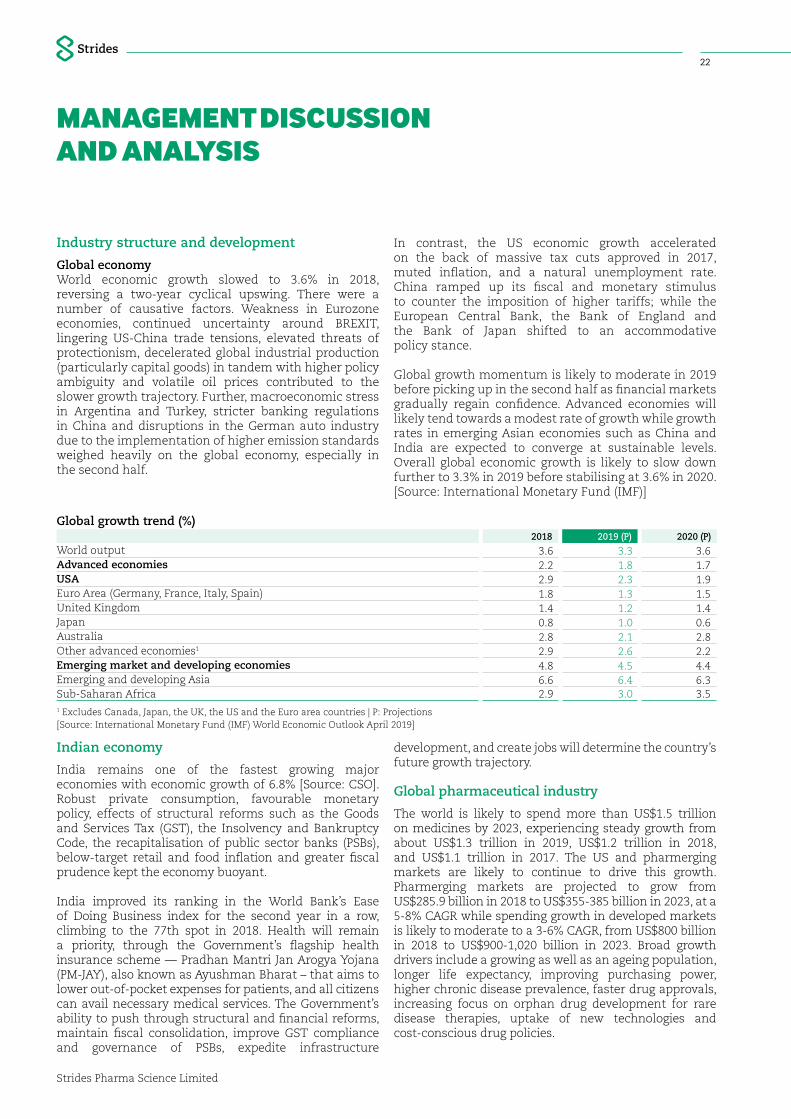
Global growth momentum is likely to moderate in 2019 before picking up in the second half as financial markets gradually regain confidence. Advanced economies will likely tend towards a modest rate of growth while growth rates in emerging Asian economies such as China and India are expected to converge at sustainable levels. Overall global economic growth is likely to slow down further to 3.3% in 2019 before stabilising at 3.6% in 2020. [Source: International Monetary Fund (IMF)]
Global growth trend (%) 2018 2019 (P) 2020 (P)
World output 3.6 3.3 3.6Advanced economies 2.2 1.8 1.7USA 2.9 2.3 1.9Euro Area (Germany, France, Italy, Spain) 1.8 1.3 1.5United Kingdom 1.4 1.2 1.4Japan 0.8 1.0 0.6Australia 2.8 2.1 2.8Other advanced economies1 2.9 2.6 2.2Emerging market and developing economies 4.8 4.5 4.4Emerging and developing Asia 6.6 6.4 6.3Sub-Saharan Africa 2.9 3.0 3.51 Excludes Canada, Japan, the UK, the US and the Euro area countries | P: Projections [Source: International Monetary Fund (IMF) World Economic Outlook April 2019]
Indian economy
India remains one of the fastest growing major economies with economic growth of 6.8% [Source: CSO]. Robust private consumption, favourable monetary policy, effects of structural reforms such as the Goods and Services Tax (GST), the Insolvency and Bankruptcy Code, the recapitalisation of public sector banks (PSBs), below-target retail and food inflation and greater fiscal prudence kept the economy buoyant.
India improved its ranking in the World Bank’s Ease of Doing Business index for the second year in a row, climbing to the 77th spot in 2018. Health will remain a priority, through the Government’s flagship health insurance scheme — Pradhan Mantri Jan Arogya Yojana (PM-JAY), also known as Ayushman Bharat – that aims to lower out-of-pocket expenses for patients, and all citizens can avail necessary medical services. The Government’s ability to push through structural and financial reforms, maintain fiscal consolidation, improve GST compliance and governance of PSBs, expedite infrastructure
development, and create jobs will determine the country’s future growth trajectory.
Global pharmaceutical industry
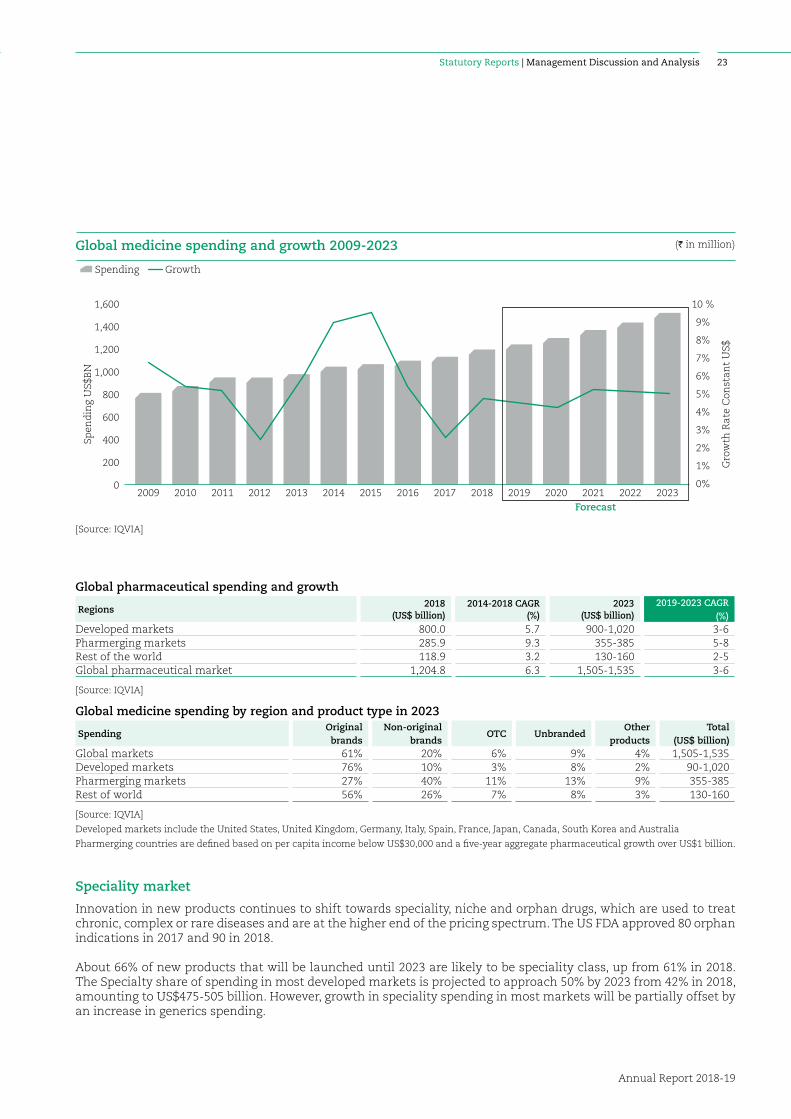
The world is likely to spend more than US$1.5 trillion on medicines by 2023, experiencing steady growth from about US$1.3 trillion in 2019, US$1.2 trillion in 2018, and US$1.1 trillion in 2017. The US and pharmerging markets are likely to continue to drive this growth. Pharmerging markets are projected to grow from US$285.9 billion in 2018 to US$355-385 billion in 2023, at a 5-8% CAGR while spending growth in developed markets is likely to moderate to a 3-6% CAGR, from US$800 billion in 2018 to US$900-1,020 billion in 2023. Broad growth drivers include a growing as well as an ageing population, longer life expectancy, improving purchasing power, higher chronic disease prevalence, faster drug approvals, increasing focus on orphan drug development for rare disease therapies, uptake of new technologies and cost-conscious drug policies.
Statutory Reports | Management Discussion and Analysis
Strides Pharma Science Limited Annual Report 2018-19
2322
Global pharmaceutical spending and growth
Regions2018
(US$ billion)2014-2018 CAGR
(%)2023
(US$ billion)2019-2023 CAGR
(%)Developed markets 800.0 5.7 900-1,020 3-6Pharmerging markets 285.9 9.3 355-385 5-8Rest of the world 118.9 3.2 130-160 2-5Global pharmaceutical market 1,204.8 6.3 1,505-1,535 3-6
[Source: IQVIA]
Global medicine spending by region and product type in 2023
Spending Original brands
Non-original brands
OTC UnbrandedOther
productsTotal
(US$ billion)Global markets 61% 20% 6% 9% 4% 1,505-1,535Developed markets 76% 10% 3% 8% 2% 90-1,020Pharmerging markets 27% 40% 11% 13% 9% 355-385Rest of world 56% 26% 7% 8% 3% 130-160
[Source: IQVIA]
Developed markets include the United States, United Kingdom, Germany, Italy, Spain, France, Japan, Canada, South Korea and Australia
Pharmerging countries are defined based on per capita income below US$30,000 and a five-year aggregate pharmaceutical growth over US$1 billion.
Speciality market
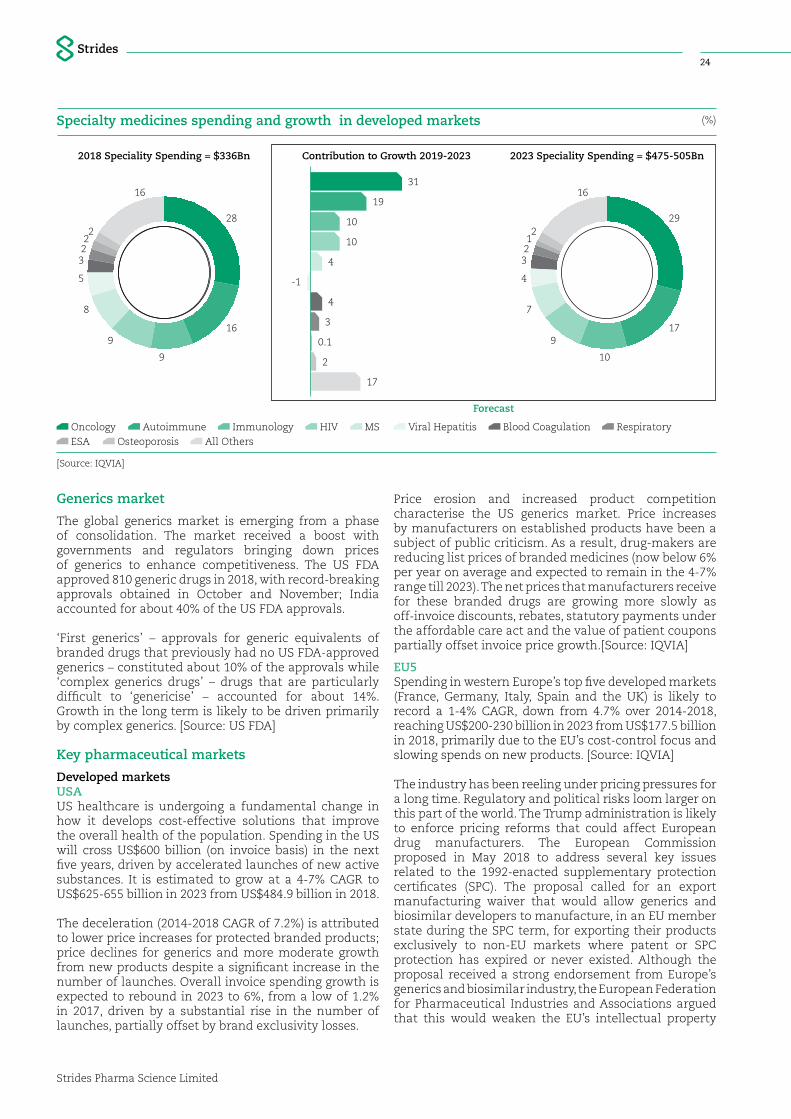
Innovation in new products continues to shift towards speciality, niche and orphan drugs, which are used to treat chronic, complex or rare diseases and are at the higher end of the pricing spectrum. The US FDA approved 80 orphan indications in 2017 and 90 in 2018.
About 66% of new products that will be launched until 2023 are likely to be speciality class, up from 61% in 2018. The Specialty share of spending in most developed markets is projected to approach 50% by 2023 from 42% in 2018, amounting to US$475-505 billion. However, growth in speciality spending in most markets will be partially offset by an increase in generics spending.
Global medicine spending and growth 2009-2023 (I in million)
2009 2010 2011 2012 2013 2014 2015 2016 2017 2018 2019 2020 2021 2022 2023
Spen
din
g U
S$B
N
Forecast
Gro
wth
Rat
e C
onst
ant
US$
GrowthSpending
10 %
9%
8%
7%
6%
5%
4%
3%
2%
1%
0%
1,600
1,400
1,200
1,000
800
600
400
200
0
[Source: IQVIA]
Statutory Reports | Management Discussion and Analysis
Strides Pharma Science Limited Annual Report 2018-19
2524
Generics market
The global generics market is emerging from a phase of consolidation. The market received a boost with governments and regulators bringing down prices of generics to enhance competitiveness. The US FDA approved 810 generic drugs in 2018, with record-breaking approvals obtained in October and November; India accounted for about 40% of the US FDA approvals.
‘First generics’ – approvals for generic equivalents of branded drugs that previously had no US FDA-approved generics – constituted about 10% of the approvals while ‘complex generics drugs’ – drugs that are particularly difficult to ‘genericise’ – accounted for about 14%. Growth in the long term is likely to be driven primarily by complex generics. [Source: US FDA]
Key pharmaceutical markets
Developed marketsUSAUS healthcare is undergoing a fundamental change in how it develops cost-effective solutions that improve the overall health of the population. Spending in the US will cross US$600 billion (on invoice basis) in the next five years, driven by accelerated launches of new active substances. It is estimated to grow at a 4-7% CAGR to US$625-655 billion in 2023 from US$484.9 billion in 2018.
The deceleration (2014-2018 CAGR of 7.2%) is attributed to lower price increases for protected branded products; price declines for generics and more moderate growth from new products despite a significant increase in the number of launches. Overall invoice spending growth is expected to rebound in 2023 to 6%, from a low of 1.2% in 2017, driven by a substantial rise in the number of launches, partially offset by brand exclusivity losses.
Price erosion and increased product competition characterise the US generics market. Price increases by manufacturers on established products have been a subject of public criticism. As a result, drug-makers are reducing list prices of branded medicines (now below 6% per year on average and expected to remain in the 4-7% range till 2023). The net prices that manufacturers receive for these branded drugs are growing more slowly as off-invoice discounts, rebates, statutory payments under the affordable care act and the value of patient coupons partially offset invoice price growth.[Source: IQVIA]
EU5Spending in western Europe’s top five developed markets (France, Germany, Italy, Spain and the UK) is likely to record a 1-4% CAGR, down from 4.7% over 2014-2018, reaching US$200-230 billion in 2023 from US$177.5 billion in 2018, primarily due to the EU’s cost-control focus and slowing spends on new products. [Source: IQVIA]
The industry has been reeling under pricing pressures for a long time. Regulatory and political risks loom larger on this part of the world. The Trump administration is likely to enforce pricing reforms that could affect European drug manufacturers. The European Commission proposed in May 2018 to address several key issues related to the 1992-enacted supplementary protection certificates (SPC). The proposal called for an export manufacturing waiver that would allow generics and biosimilar developers to manufacture, in an EU member state during the SPC term, for exporting their products exclusively to non-EU markets where patent or SPC protection has expired or never existed. Although the proposal received a strong endorsement from Europe’s generics and biosimilar industry, the European Federation for Pharmaceutical Industries and Associations argued that this would weaken the EU’s intellectual property
Specialty medicines spending and growth in developed markets (%)
2018 Speciality Spending = $336Bn Contribution to Growth 2019-2023 2023 Speciality Spending = $475-505Bn
Forecast
OncologyESA
AutoimmuneOsteoporosis
ImmunologyAll Others
HIV MS Viral Hepatitis Blood Coagulation Respiratory
31
19
10
10
4
-1
4
3
0.1
2
17
16
29
17
10
9
7
4
32
21
16
28
16
9
9
8
5
32
22
[Source: IQVIA]

Statutory Reports | Management Discussion and Analysis
Strides Pharma Science Limited Annual Report 2018-19
2524
protections and disincentivise investments in the EU by branded drug makers. Further, with the Brexit yet to be concluded, the full impact of the UK’s separation from the EU is still unknown.
JapanJapan spent US$86 billion on medicines in 2018, and the spending growth rate is expected to continue decelerating into 2023, reaching US$89-93 billion due to exchange rate dynamics and the continued uptake of generics. Japan’s government in 2014 announced its target of attaining 80% prescription volume of unbranded generics in the unprotected market by 2021. The aim is likely to be achieved a year earlier, as incentives boost commercial
interest in unbranded generics. The savings generated from generics will flow into speciality drugs spends without impacting the overall budget. Speciality share in spending is expected to rise from approximately 30% in 2018 to 41% in 2023. [Source: IQVIA]
AustraliaAustralia’s pharmaceutical market is set to grow marginally from US$13.1 billion in 2018 to US$13-17 billion by 2023, at a 0-3% CAGR. The government is under pressure to reduce its subsidy expenditure via the Pharmaceutical Benefits Scheme. Australia continues to focus on containing growth in speciality medicine spending and supporting lower drug prices. [Source: IQVIA]
Pharmerging marketsPharmaceutical spending growth for pharmerging markets by region (US$ billion)Region/Country 2018 2014-2018 CAGR 2023 2019-2023 CAGR
China 132.3 7.6% 140-170 3-6%Tier 2 markets 67.7 10.7% 91-95 7-10% Brazil 31.8 10.8% 39-43 5-8% India 20.4 11.2% 28-32 8-11% Russia 15.5 9.9% 21-25 7-10%Tier 3 markets 85.9 11.3% 105-135 7-10%Pharmerging markets 285.9 9.3% 355-385 5-8%[Source: IQVIA]
ChinaChina – the largest pharmerging and the second largest global pharmaceutical market – is nearing the combined spending level of the five major European markets to reach US$140-170 billion by 2023, at a 3-6% CAGR from US$132.3 billion in 2018 [Source: IQVIA]. A key growth driver has been the government’s thrust on expanding insurance access to both rural and urban residents, as well as modernising the hospital system and primary care services. Growth on the broader economy also stimulates spending. The government manages drug pricing through centralised schemes, where manufacturers offer substantial discounts in return for broader access allocation. The government has initiated a wide range of reforms aimed at reducing corruption and improving the efficiency of state agencies.
AfricaAfrica comprises 54 distinct markets, each varying from another by size, growth trajectory, economic landscape, legal structure and political complexity. South Africa remains the best-established region for pharmaceutical manufacturing in sub-Saharan Africa; however, local manufacturing markets in East and West Africa are relatively well developed. In many African countries, such as South Africa, Egypt, Algeria, Morocco, Nigeria and Kenya, generics are gaining market share at the expense of over-the-counter and branded products on the back of physician and pharmacist support, expansion in national insurance programmes and government interventions.
Overall, medicine spending in Africa is set to reach US$160.7 billion by 2024, at a CAGR of 20.4% from 2018 [Source: Goldstein Research]. Long-term growth is likely
to be driven by changing economic profiles, urbanisation, increased healthcare spending and investments, and a higher incidence of chronic lifestyle diseases.
Opportunity landscape
• Change in global demographics World population will cross 9.3 billion in the next
three decade and as much as 21% of these individuals are likely to be aged 60 and above [Source: United Nations’ World Population Prospects]. Societies are increasingly shifting towards healthier lifestyles and at the same time, medicine is making great progress in improving the quality of life. As a result, life expectancy rates are making considerable gains across the countries.
• Higher level of prosperity With a rapid pace of urbanisation and globalisation,
income levels are on the rise. Middle-income earning groups are expanding, supporting higher demand for both branded drugs and biosimilars. This is particularly seen in emerging and developing economies of the world, such as China and India.
• Rise in the incidence of chronic diseases The World Health Organization (WHO) estimates
that the prevalence of chronic ailments will increase by 57% by 2020. Since population growth is expected to be heavily concentrated in the developing countries of Asia and Africa, these are likely to contribute towards the majority share of all such chronic medical conditions. [Source: World Health Organization]
Statutory Reports | Management Discussion and Analysis
Strides Pharma Science Limited Annual Report 2018-19
2726
• Rapid pace of drug approvals Key drug regulator, US Food and Drug Administration
(US FDA) went ahead with 971 approval actions in the calendar year 2018 – highest ever in its history. [Source: US FDA]
• Growth in orphan drug research innovation The research focus on rare disease therapies is
intensifying, leading to a large pipeline of new orphan drugs across manufacturers. In 2018, the US FDA approved a total of 80 orphan indications; these innovations are targeted against significant medical needs. [Source: IQVIA]
Strides in a nutshell
Incorporated in 1990, Strides, listed on the BSE Limited (532531) and National Stock Exchange of India Limited (STAR), is a global pharmaceutical company headquartered in Bangalore, India. We primarily operate in the regulated markets and have forayed into Africa with an ‘in Africa for Africa’ strategy, along with an institutional business to service donor-funded markets. Our seven global manufacturing sites are located in India – Bangalore (two sites), Puducherry, and Chennai; Singapore; Italy – Milan; and Kenya – Nairobi. We focus on ‘difficult to manufacture’ products that are sold in over 100 countries.
Our manufacturing units are highly compliant and approved by various regulatory agencies such as the US Food and Drug Administration (US FDA); the Medicines and Healthcare Products Regulatory Agency (MHRA); the Therapeutic Goods Administration (TGA); the World Health Organisation (WHO) and the Pharmaceuticals and Medical Devices Agency (PMDA). We manufacture a range of dosage forms, including orals, liquids, creams and ointments, soft gels, sachets, tablets, and modified release dosage formats.
Over the years, we have built a formidable research and development framework in India and other regulated markets, which facilitates 25+ ANDA filings per annum. Additionally, it allows us to expand the product portfolio with niche and technically complex pharmaceutical offerings.
Reset and resurgent
We are pursuing sustainability with a reset business model and have made significant progress in terms of course correction and execution. With all the growth pivots in place, we are confident about scaling our diversified B2C business and maintaining the growth momentum across key markets. We are maintaining our product filing and approval trajectory for the US and other regulated markets.
Our resurgent actions are a result of several corporate initiatives, which are enabling us to look towards an optimal growth momentum with improved margins and a stronger balance sheet.
We intend to build a diversified consumer-focussed global formulations business. We have unlocked significant value by positioning our business as an important B2C player, both in the regulated and emerging markets. Our strategic progress has led to a robust branded generics portfolio in the regulated markets, where we are now scaling our front-end presence.
Regulated markets
Our regulated markets operations span the US and Australia and other regulated markets comprising the UK, South Africa and Canada, among others. Our revenue from the regulated markets increased 21% to `24,530 million in FY 2018-19 from `20,325 million in FY 2017-18.
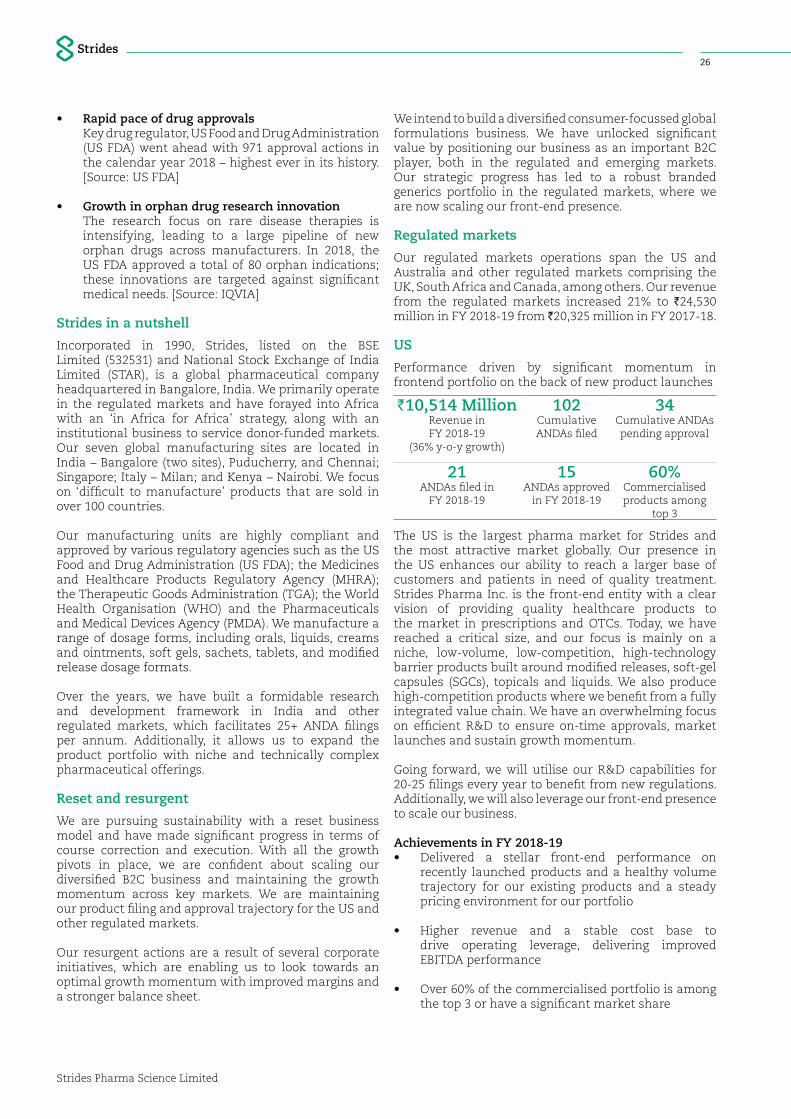
US
Performance driven by significant momentum in frontend portfolio on the back of new product launches
`10,514 MillionRevenue in FY 2018-19
(36% y-o-y growth)
102Cumulative ANDAs filed
34 Cumulative ANDAs pending approval
21ANDAs filed in
FY 2018-19
15ANDAs approved
in FY 2018-19
60% Commercialised products among
top 3
The US is the largest pharma market for Strides and the most attractive market globally. Our presence in the US enhances our ability to reach a larger base of customers and patients in need of quality treatment. Strides Pharma Inc. is the front-end entity with a clear vision of providing quality healthcare products to the market in prescriptions and OTCs. Today, we have reached a critical size, and our focus is mainly on a niche, low-volume, low-competition, high-technology barrier products built around modified releases, soft-gel capsules (SGCs), topicals and liquids. We also produce high-competition products where we benefit from a fully integrated value chain. We have an overwhelming focus on efficient R&D to ensure on-time approvals, market launches and sustain growth momentum.
Going forward, we will utilise our R&D capabilities for 20-25 filings every year to benefit from new regulations. Additionally, we will also leverage our front-end presence to scale our business.
Achievements in FY 2018-19• Delivered a stellar front-end performance on
recently launched products and a healthy volume trajectory for our existing products and a steady pricing environment for our portfolio
• Higher revenue and a stable cost base to drive operating leverage, delivering improved EBITDA performance
• Over 60% of the commercialised portfolio is among the top 3 or have a significant market share
Statutory Reports | Management Discussion and Analysis
Strides Pharma Science Limited Annual Report 2018-19
2726
• Re-launched erstwhile partnership molecules through front-end business witnessing encouraging traction which contributed to a sequential ramp-up in the US business
• Witnessed healthy order book visibility driven by significant order wins
• R&D spend as % of US sales stood at ~12%
• Maintained strong ANDA filing momentum with 21 filings and received 15 product approvals including PARA IV approvals for Cinacalcet and Milnacipran Hydrochloride
• Completed acquisition of Vensun Pharmaceuticals and took 100% ownership in a joint venture with Vivimed Labs adding ~US$ 25 million additional sales and a combined portfolio of 100+ ANDAs
• Entered into a strategic partnership with SUDA Pharmaceuticals for an exclusive agreement for novel and a fast‐acting oral spray of sumatriptan in the US market
Future strategy• Drive linearity in filings and approvals with
significant upside from new strategic acquisitions
• Drive continued growth in the base portfolio with market share gains and pricing improvements
• Continued focus on R&D filings with a strategic shift towards complex or speciality generics going forward
• Strengthen manufacturing and compliances
• Ensure filing momentum continues with 20-25 ANDA per year
• Expand front-end capabilities further
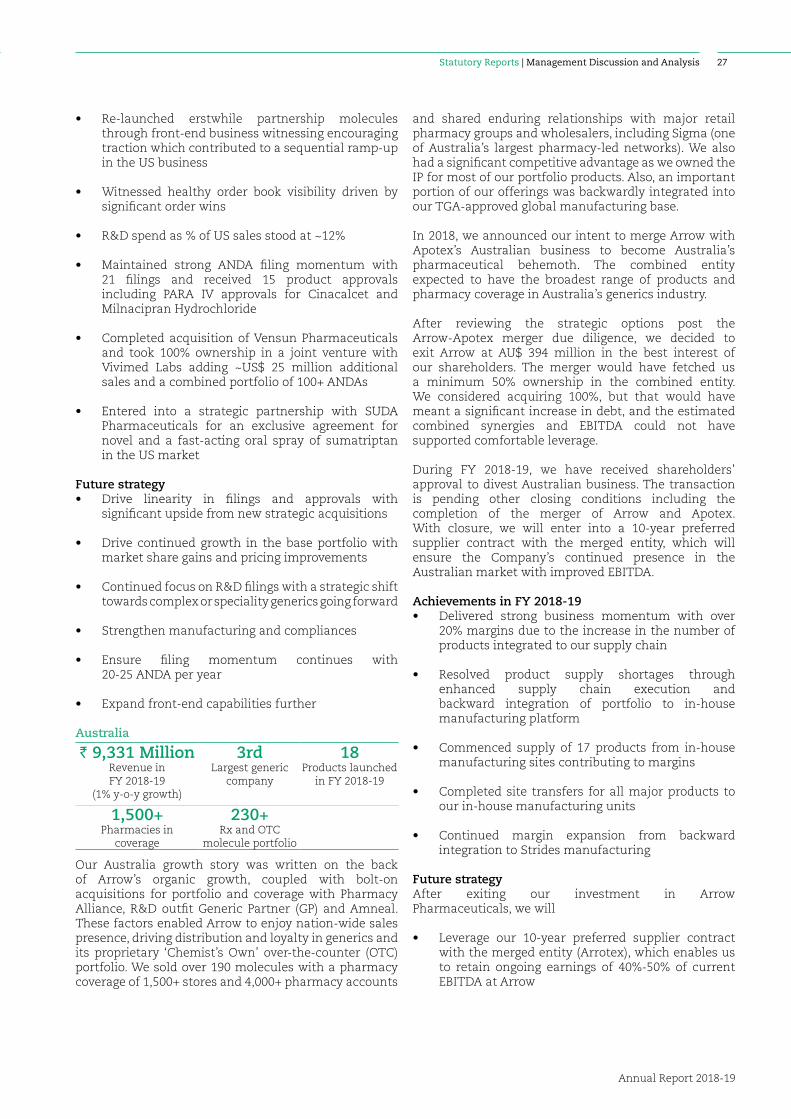
Australia
` 9,331 MillionRevenue in FY 2018-19
(1% y-o-y growth)
3rdLargest generic
company
18Products launched
in FY 2018-19
1,500+Pharmacies in
coverage
230+Rx and OTC
molecule portfolio
Our Australia growth story was written on the back of Arrow’s organic growth, coupled with bolt-on acquisitions for portfolio and coverage with Pharmacy Alliance, R&D outfit Generic Partner (GP) and Amneal. These factors enabled Arrow to enjoy nation-wide sales presence, driving distribution and loyalty in generics and its proprietary ‘Chemist’s Own’ over-the-counter (OTC) portfolio. We sold over 190 molecules with a pharmacy coverage of 1,500+ stores and 4,000+ pharmacy accounts
and shared enduring relationships with major retail pharmacy groups and wholesalers, including Sigma (one of Australia’s largest pharmacy-led networks). We also had a significant competitive advantage as we owned the IP for most of our portfolio products. Also, an important portion of our offerings was backwardly integrated into our TGA-approved global manufacturing base.
In 2018, we announced our intent to merge Arrow with Apotex’s Australian business to become Australia’s pharmaceutical behemoth. The combined entity expected to have the broadest range of products and pharmacy coverage in Australia’s generics industry.
After reviewing the strategic options post the Arrow-Apotex merger due diligence, we decided to exit Arrow at AU$ 394 million in the best interest of our shareholders. The merger would have fetched us a minimum 50% ownership in the combined entity. We considered acquiring 100%, but that would have meant a significant increase in debt, and the estimated combined synergies and EBITDA could not have supported comfortable leverage.
During FY 2018-19, we have received shareholders’ approval to divest Australian business. The transaction is pending other closing conditions including the completion of the merger of Arrow and Apotex. With closure, we will enter into a 10-year preferred supplier contract with the merged entity, which will ensure the Company’s continued presence in the Australian market with improved EBITDA.
Achievements in FY 2018-19• Delivered strong business momentum with over
20% margins due to the increase in the number of products integrated to our supply chain
• Resolved product supply shortages through enhanced supply chain execution and backward integration of portfolio to in-house manufacturing platform
• Commenced supply of 17 products from in-house manufacturing sites contributing to margins
• Completed site transfers for all major products to our in-house manufacturing units
• Continued margin expansion from backward integration to Strides manufacturing
Future strategyAfter exiting our investment in Arrow Pharmaceuticals, we will
• Leverage our 10-year preferred supplier contract with the merged entity (Arrotex), which enables us to retain ongoing earnings of 40%-50% of current EBITDA at Arrow
Statutory Reports | Management Discussion and Analysis
Strides Pharma Science Limited Annual Report 2018-19
2928
• Offer supply chain assurance to encourage further backward integration and deliver superior margins
• Retain access to IP of 140+ products in Arrow portfolio with fungibility in other global markets including key regulated markets
• Strengthen balance sheet with a significant reduction in debt without substantially impacting EBITDA
Other regulated markets
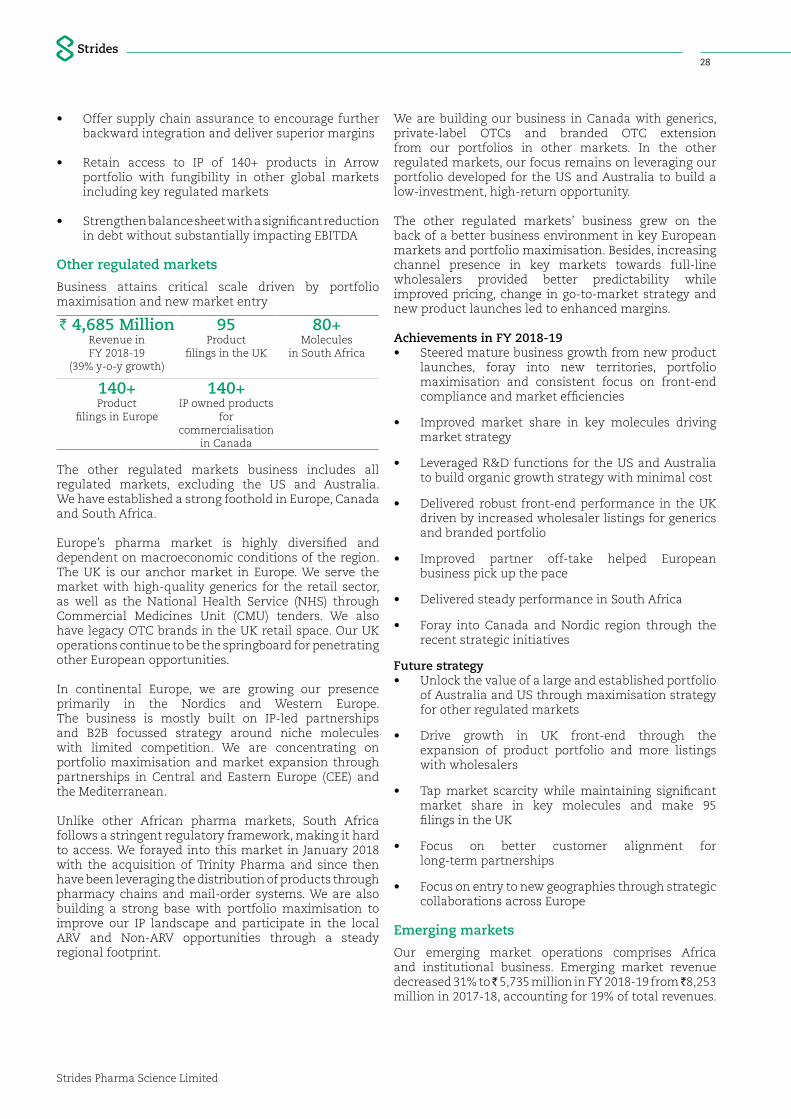
Business attains critical scale driven by portfolio maximisation and new market entry
` 4,685 MillionRevenue in FY 2018-19
(39% y-o-y growth)
95Product
filings in the UK
80+Molecules
in South Africa
140+Product
filings in Europe
140+ IP owned products
for commercialisation
in Canada
The other regulated markets business includes all regulated markets, excluding the US and Australia. We have established a strong foothold in Europe, Canada and South Africa.
Europe’s pharma market is highly diversified and dependent on macroeconomic conditions of the region. The UK is our anchor market in Europe. We serve the market with high-quality generics for the retail sector, as well as the National Health Service (NHS) through Commercial Medicines Unit (CMU) tenders. We also have legacy OTC brands in the UK retail space. Our UK operations continue to be the springboard for penetrating other European opportunities.
In continental Europe, we are growing our presence primarily in the Nordics and Western Europe. The business is mostly built on IP-led partnerships and B2B focussed strategy around niche molecules with limited competition. We are concentrating on portfolio maximisation and market expansion through partnerships in Central and Eastern Europe (CEE) and the Mediterranean.
Unlike other African pharma markets, South Africa follows a stringent regulatory framework, making it hard to access. We forayed into this market in January 2018 with the acquisition of Trinity Pharma and since then have been leveraging the distribution of products through pharmacy chains and mail-order systems. We are also building a strong base with portfolio maximisation to improve our IP landscape and participate in the local ARV and Non-ARV opportunities through a steady regional footprint.
We are building our business in Canada with generics, private-label OTCs and branded OTC extension from our portfolios in other markets. In the other regulated markets, our focus remains on leveraging our portfolio developed for the US and Australia to build a low-investment, high-return opportunity.
The other regulated markets’ business grew on the back of a better business environment in key European markets and portfolio maximisation. Besides, increasing channel presence in key markets towards full-line wholesalers provided better predictability while improved pricing, change in go-to-market strategy and new product launches led to enhanced margins.
Achievements in FY 2018-19• Steered mature business growth from new product
launches, foray into new territories, portfolio maximisation and consistent focus on front-end compliance and market efficiencies
• Improved market share in key molecules driving market strategy
• Leveraged R&D functions for the US and Australia to build organic growth strategy with minimal cost
• Delivered robust front-end performance in the UK driven by increased wholesaler listings for generics and branded portfolio
• Improved partner off-take helped European business pick up the pace
• Delivered steady performance in South Africa
• Foray into Canada and Nordic region through the recent strategic initiatives
Future strategy• Unlock the value of a large and established portfolio
of Australia and US through maximisation strategy for other regulated markets
• Drive growth in UK front-end through the expansion of product portfolio and more listings with wholesalers
• Tap market scarcity while maintaining significant market share in key molecules and make 95 filings in the UK
• Focus on better customer alignment for long-term partnerships
• Focus on entry to new geographies through strategic collaborations across Europe
Emerging markets
Our emerging market operations comprises Africa and institutional business. Emerging market revenue decreased 31% to ̀ 5,735 million in FY 2018-19 from ̀ 8,253 million in 2017-18, accounting for 19% of total revenues.
Statutory Reports | Management Discussion and Analysis
Strides Pharma Science Limited Annual Report 2018-19
2928
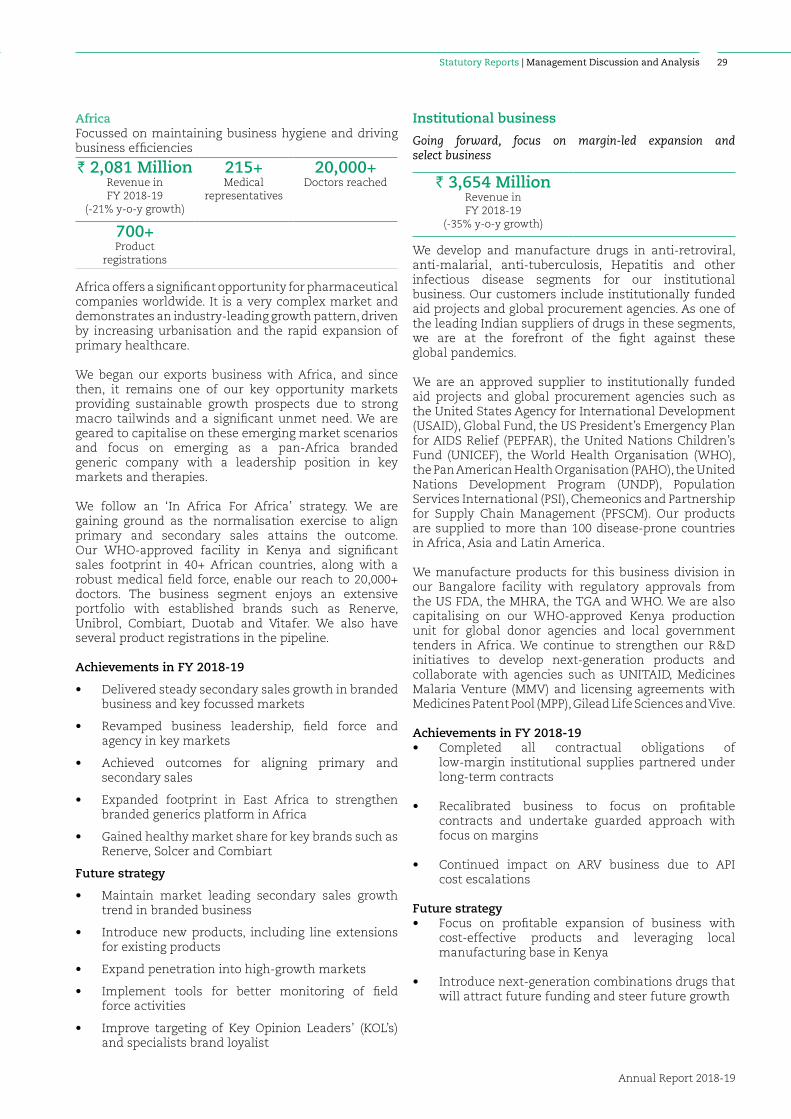
AfricaFocussed on maintaining business hygiene and driving business efficiencies
` 2,081 MillionRevenue in FY 2018-19
(-21% y-o-y growth)
215+Medical
representatives
20,000+Doctors reached
700+Product
registrations
Africa offers a significant opportunity for pharmaceutical companies worldwide. It is a very complex market and demonstrates an industry-leading growth pattern, driven by increasing urbanisation and the rapid expansion of primary healthcare.
We began our exports business with Africa, and since then, it remains one of our key opportunity markets providing sustainable growth prospects due to strong macro tailwinds and a significant unmet need. We are geared to capitalise on these emerging market scenarios and focus on emerging as a pan-Africa branded generic company with a leadership position in key markets and therapies.
We follow an ‘In Africa For Africa’ strategy. We are gaining ground as the normalisation exercise to align primary and secondary sales attains the outcome. Our WHO-approved facility in Kenya and significant sales footprint in 40+ African countries, along with a robust medical field force, enable our reach to 20,000+ doctors. The business segment enjoys an extensive portfolio with established brands such as Renerve, Unibrol, Combiart, Duotab and Vitafer. We also have several product registrations in the pipeline.
Achievements in FY 2018-19
• Delivered steady secondary sales growth in branded business and key focussed markets
• Revamped business leadership, field force and agency in key markets
• Achieved outcomes for aligning primary and secondary sales
• Expanded footprint in East Africa to strengthen branded generics platform in Africa
• Gained healthy market share for key brands such as Renerve, Solcer and Combiart
Future strategy
• Maintain market leading secondary sales growth trend in branded business
• Introduce new products, including line extensions for existing products
• Expand penetration into high-growth markets
• Implement tools for better monitoring of field force activities
• Improve targeting of Key Opinion Leaders’ (KOL’s) and specialists brand loyalist
Institutional business
Going forward, focus on margin-led expansion and select business
` 3,654 MillionRevenue in FY 2018-19
(-35% y-o-y growth)
We develop and manufacture drugs in anti-retroviral, anti-malarial, anti-tuberculosis, Hepatitis and other infectious disease segments for our institutional business. Our customers include institutionally funded aid projects and global procurement agencies. As one of the leading Indian suppliers of drugs in these segments, we are at the forefront of the fight against these global pandemics.
We are an approved supplier to institutionally funded aid projects and global procurement agencies such as the United States Agency for International Development (USAID), Global Fund, the US President’s Emergency Plan for AIDS Relief (PEPFAR), the United Nations Children’s Fund (UNICEF), the World Health Organisation (WHO), the Pan American Health Organisation (PAHO), the United Nations Development Program (UNDP), Population Services International (PSI), Chemeonics and Partnership for Supply Chain Management (PFSCM). Our products are supplied to more than 100 disease-prone countries in Africa, Asia and Latin America.
We manufacture products for this business division in our Bangalore facility with regulatory approvals from the US FDA, the MHRA, the TGA and WHO. We are also capitalising on our WHO-approved Kenya production unit for global donor agencies and local government tenders in Africa. We continue to strengthen our R&D initiatives to develop next-generation products and collaborate with agencies such as UNITAID, Medicines Malaria Venture (MMV) and licensing agreements with Medicines Patent Pool (MPP), Gilead Life Sciences and Vive.
Achievements in FY 2018-19• Completed all contractual obligations of
low-margin institutional supplies partnered under long-term contracts
• Recalibrated business to focus on profitable contracts and undertake guarded approach with focus on margins
• Continued impact on ARV business due to API cost escalations
Future strategy• Focus on profitable expansion of business with
cost-effective products and leveraging local manufacturing base in Kenya
• Introduce next-generation combinations drugs that will attract future funding and steer future growth
Statutory Reports | Management Discussion and Analysis
Strides Pharma Science Limited Annual Report 2018-19
3130
• Invest in new product regimens and transition from current product mix
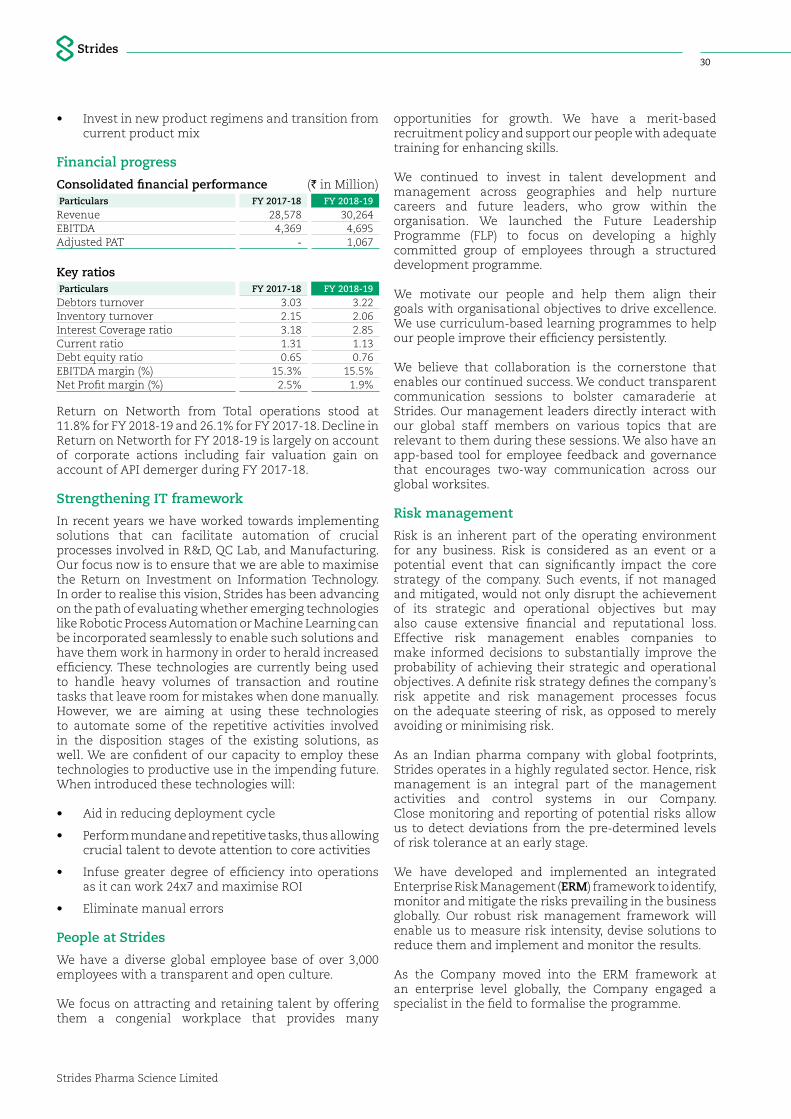
Financial progress
Consolidated financial performance (` in Million)Particulars FY 2017-18 FY 2018-19
Revenue 28,578 30,264EBITDA 4,369 4,695Adjusted PAT - 1,067
Key ratiosParticulars FY 2017-18 FY 2018-19
Debtors turnover 3.03 3.22Inventory turnover 2.15 2.06Interest Coverage ratio 3.18 2.85Current ratio 1.31 1.13Debt equity ratio 0.65 0.76EBITDA margin (%) 15.3% 15.5%Net Profit margin (%) 2.5% 1.9%
Return on Networth from Total operations stood at 11.8% for FY 2018-19 and 26.1% for FY 2017-18. Decline in Return on Networth for FY 2018-19 is largely on account of corporate actions including fair valuation gain on account of API demerger during FY 2017-18.
Strengthening IT framework
In recent years we have worked towards implementing solutions that can facilitate automation of crucial processes involved in R&D, QC Lab, and Manufacturing. Our focus now is to ensure that we are able to maximise the Return on Investment on Information Technology. In order to realise this vision, Strides has been advancing on the path of evaluating whether emerging technologies like Robotic Process Automation or Machine Learning can be incorporated seamlessly to enable such solutions and have them work in harmony in order to herald increased efficiency. These technologies are currently being used to handle heavy volumes of transaction and routine tasks that leave room for mistakes when done manually. However, we are aiming at using these technologies to automate some of the repetitive activities involved in the disposition stages of the existing solutions, as well. We are confident of our capacity to employ these technologies to productive use in the impending future. When introduced these technologies will:
• Aid in reducing deployment cycle
• Perform mundane and repetitive tasks, thus allowing crucial talent to devote attention to core activities
• Infuse greater degree of efficiency into operations as it can work 24x7 and maximise ROI
• Eliminate manual errors
People at Strides
We have a diverse global employee base of over 3,000 employees with a transparent and open culture.
We focus on attracting and retaining talent by offering them a congenial workplace that provides many
opportunities for growth. We have a merit-based recruitment policy and support our people with adequate training for enhancing skills.
We continued to invest in talent development and management across geographies and help nurture careers and future leaders, who grow within the organisation. We launched the Future Leadership Programme (FLP) to focus on developing a highly committed group of employees through a structured development programme.
We motivate our people and help them align their goals with organisational objectives to drive excellence. We use curriculum-based learning programmes to help our people improve their efficiency persistently.
We believe that collaboration is the cornerstone that enables our continued success. We conduct transparent communication sessions to bolster camaraderie at Strides. Our management leaders directly interact with our global staff members on various topics that are relevant to them during these sessions. We also have an app-based tool for employee feedback and governance that encourages two-way communication across our global worksites.
Risk management
Risk is an inherent part of the operating environment for any business. Risk is considered as an event or a potential event that can significantly impact the core strategy of the company. Such events, if not managed and mitigated, would not only disrupt the achievement of its strategic and operational objectives but may also cause extensive financial and reputational loss. Effective risk management enables companies to make informed decisions to substantially improve the probability of achieving their strategic and operational objectives. A definite risk strategy defines the company’s risk appetite and risk management processes focus on the adequate steering of risk, as opposed to merely avoiding or minimising risk.
As an Indian pharma company with global footprints, Strides operates in a highly regulated sector. Hence, risk management is an integral part of the management activities and control systems in our Company. Close monitoring and reporting of potential risks allow us to detect deviations from the pre-determined levels of risk tolerance at an early stage.
We have developed and implemented an integrated Enterprise Risk Management (ERM) framework to identify, monitor and mitigate the risks prevailing in the business globally. Our robust risk management framework will enable us to measure risk intensity, devise solutions to reduce them and implement and monitor the results.
As the Company moved into the ERM framework at an enterprise level globally, the Company engaged a specialist in the field to formalise the programme.
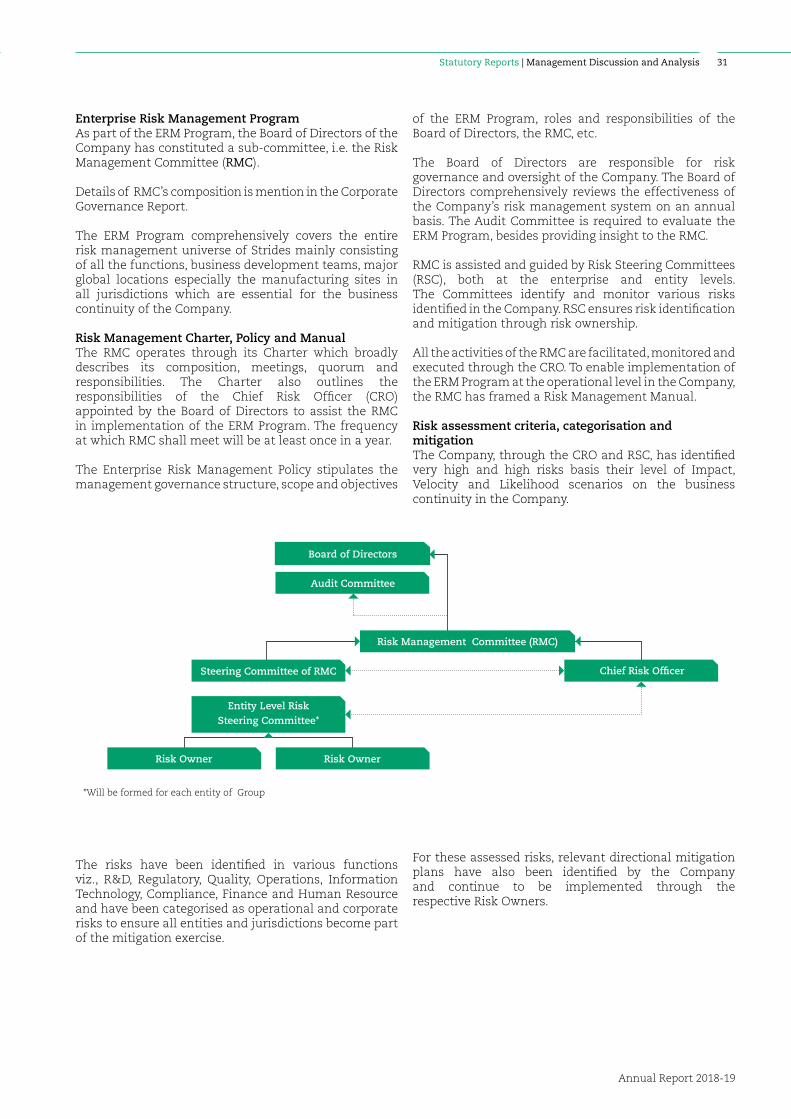
Statutory Reports | Management Discussion and Analysis
Strides Pharma Science Limited Annual Report 2018-19
3130
of the ERM Program, roles and responsibilities of the Board of Directors, the RMC, etc.
The Board of Directors are responsible for risk governance and oversight of the Company. The Board of Directors comprehensively reviews the effectiveness of the Company’s risk management system on an annual basis. The Audit Committee is required to evaluate the ERM Program, besides providing insight to the RMC.
RMC is assisted and guided by Risk Steering Committees (RSC), both at the enterprise and entity levels. The Committees identify and monitor various risks identified in the Company. RSC ensures risk identification and mitigation through risk ownership.
All the activities of the RMC are facilitated, monitored and executed through the CRO. To enable implementation of the ERM Program at the operational level in the Company, the RMC has framed a Risk Management Manual.
Risk assessment criteria, categorisation and mitigationThe Company, through the CRO and RSC, has identified very high and high risks basis their level of Impact, Velocity and Likelihood scenarios on the business continuity in the Company.
The risks have been identified in various functions viz., R&D, Regulatory, Quality, Operations, Information Technology, Compliance, Finance and Human Resource and have been categorised as operational and corporate risks to ensure all entities and jurisdictions become part of the mitigation exercise.
Enterprise Risk Management ProgramAs part of the ERM Program, the Board of Directors of the Company has constituted a sub-committee, i.e. the Risk Management Committee (RMC).
Details of RMC’s composition is mention in the Corporate Governance Report.
The ERM Program comprehensively covers the entire risk management universe of Strides mainly consisting of all the functions, business development teams, major global locations especially the manufacturing sites in all jurisdictions which are essential for the business continuity of the Company.
Risk Management Charter, Policy and ManualThe RMC operates through its Charter which broadly describes its composition, meetings, quorum and responsibilities. The Charter also outlines the responsibilities of the Chief Risk Officer (CRO) appointed by the Board of Directors to assist the RMC in implementation of the ERM Program. The frequency at which RMC shall meet will be at least once in a year.
The Enterprise Risk Management Policy stipulates the management governance structure, scope and objectives
For these assessed risks, relevant directional mitigation plans have also been identified by the Company and continue to be implemented through the respective Risk Owners.
*Will be formed for each entity of Group
Board of Directors
Audit Committee
Risk Owner Risk Owner
Steering Committee of RMC
Entity Level Risk Steering Committee*
Chief Risk Officer
Risk Management Committee (RMC)

Statutory Reports | Management Discussion and Analysis
Strides Pharma Science Limited Annual Report 2018-19
PB32
Some of the corporate and operational Risks identified by the Company are :
Risk and its Definition Risk Mitigation
Research & Development - Delay in regulatory product approvals beyond goal dates, consequent delay in product launches, impacting our growth targets
The Company closely monitors product approvals and liaison with the regulators to ensure timely approvals
Regulatory - Critical inspection observations related to facilities/systems/deployment could culminate into organisational action disrupting supply and business continuity
The Company strives to adhere to cGMP practices and procedures to meet, preferably to exceed the metrics defined by the regulatory agencies
Quality - Product quality issues impacting patient safety and product efficacy leading to rejections, product recalls, financial loss and reputational damages
The Company has implemented quality systems during the entire product life cycle, ensures robust product qualityThe company has implemented a robust pharmacovigilance system which provides a mechanism for addressing any adverse drug event impacting patient safety and product efficacy
Marketing - Impact on the pricing of products as a result of competition, regulations, high input costs and high cost of manufacturing leading to margin erosion
The company has implemented several initiatives for cost optimisation through enhanced manufacturing efficiencies and portfolio enhancement to address pricing and margin challengesThe company also proactively evaluates vendors for strategic arrangements including pricing/alternate vendors for existing APIs
Operation - Impact on business continuity due to natural calamity/disasters/accidents and non-compliance to EHSStandards
The Company has comprehensive EHS programs to ensure employee/facility safety and compliance to EHS norms
Information Technology - Cyber Attacks (Malware, phishing, ransomware), security breaches, threats to information system causing financial, reputational and legal damages to the organisation
The Company has IT controls in place to ensure consistency and protection and security of data and IT systems. The Company is in the process of enhancing the existing cybersecurity framework.
Compliance - Failure to comply with statutory requirements in India and/ or Overseas jurisdictions may result inpenalties, compounding, negative press coverage, or penal prosecution
The Company has a compliance framework to manage the various compliance requirements and is in the process of strengthening its statutory compliance mechanism by implementing IT-enabled monitoring
Human Resource - Inability to attract, integrate and retain key personnel may lead to adverse marketplace reputation and performance
The Company has various employee engagement initiatives to attract and retain the right talent through well-defined progression path, effective learning and development program, rewards and recognition program and succession planning for critical roles
The Company has also compared the risks identified during this exercise with similar global and Indian pharma companies.
While we strengthened the comprehensive ERM Program across the organisation, the key priorities for the Company in FY 2019-20 is to measure, report and mitigate not only the critical risks but also the residual risks in a timely and consistent manner. We need to be extraordinarily alert to the fast changing Geo – Political and regulatory environments. We also need to seamlessly spot and update the risk registers to be ahead of the curve. As a company we are very conscious of all the risks we encounter regularly and the ERM Program will only strengthen our manner of addressing the
risks. We continue to be guided by the analysts reports which give us a perspective and new trends evolving in this industry, accordingly making us fine tune our ERM Program.
Internal control systems and adequacyThe Company’s advanced IT infrastructure ensures adequate internal controls over business processes and practices. This internal control system provides reasonable assurance about the integrity and reliability of financial statements. Moreover, the Company has an active in-system audit programme, supported by Grant Thornton, which regularly encompasses various operations consistently. Our Audit Committee reviews internal audit observations regularly.
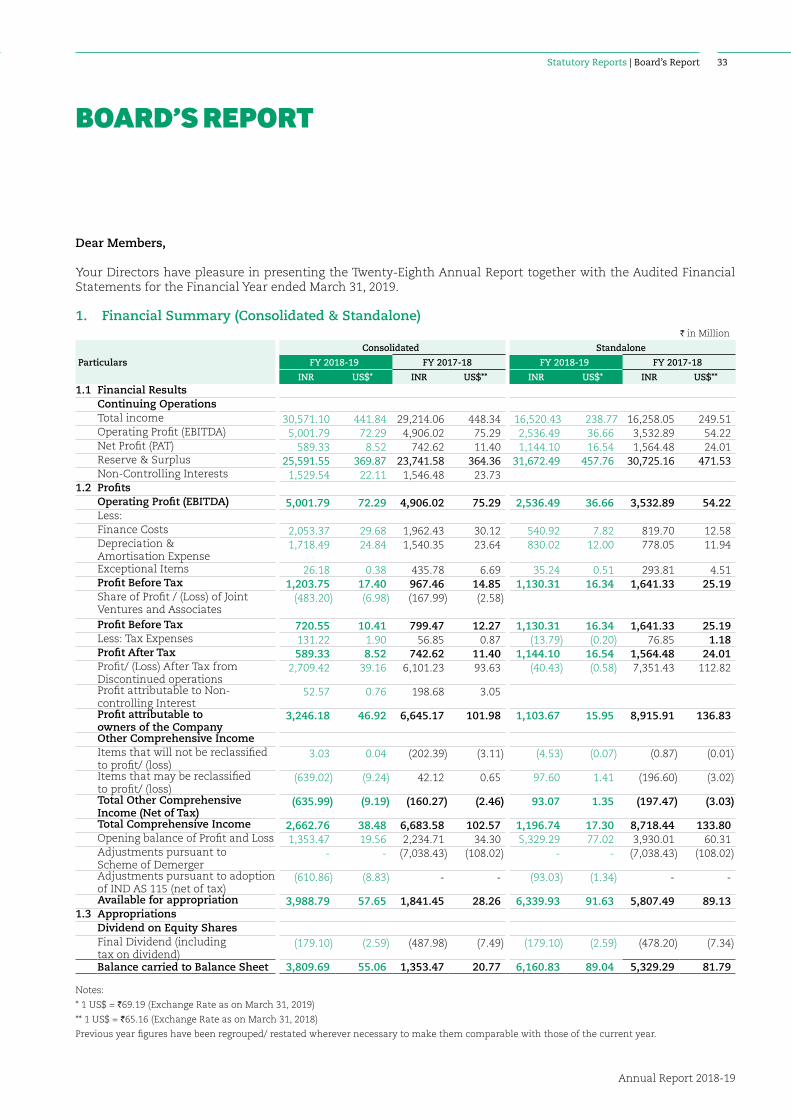
Statutory Reports | Board’s Report
Annual Report 2018-19
33
Dear Members,
Your Directors have pleasure in presenting the Twenty-Eighth Annual Report together with the Audited Financial Statements for the Financial Year ended March 31, 2019.
1. Financial Summary (Consolidated & Standalone)I in Million
Particulars
Consolidated Standalone
FY 2018-19 FY 2017-18 FY 2018-19 FY 2017-18
INR US$* INR US$** INR US$* INR US$**1.1 Financial Results
Continuing OperationsTotal income 30,571.10 441.84 29,214.06 448.34 16,520.43 238.77 16,258.05 249.51 Operating Profit (EBITDA) 5,001.79 72.29 4,906.02 75.29 2,536.49 36.66 3,532.89 54.22 Net Profit (PAT) 589.33 8.52 742.62 11.40 1,144.10 16.54 1,564.48 24.01 Reserve & Surplus 25,591.55 369.87 23,741.58 364.36 31,672.49 457.76 30,725.16 471.53 Non-Controlling Interests 1,529.54 22.11 1,546.48 23.73
1.2 ProfitsOperating Profit (EBITDA) 5,001.79 72.29 4,906.02 75.29 2,536.49 36.66 3,532.89 54.22 Less:Finance Costs 2,053.37 29.68 1,962.43 30.12 540.92 7.82 819.70 12.58 Depreciation & Amortisation Expense
1,718.49 24.84 1,540.35 23.64 830.02 12.00 778.05 11.94
Exceptional Items 26.18 0.38 435.78 6.69 35.24 0.51 293.81 4.51 Profit Before Tax 1,203.75 17.40 967.46 14.85 1,130.31 16.34 1,641.33 25.19 Share of Profit / (Loss) of Joint Ventures and Associates
(483.20) (6.98) (167.99) (2.58)
Profit Before Tax 720.55 10.41 799.47 12.27 1,130.31 16.34 1,641.33 25.19 Less: Tax Expenses 131.22 1.90 56.85 0.87 (13.79) (0.20) 76.85 1.18 Profit After Tax 589.33 8.52 742.62 11.40 1,144.10 16.54 1,564.48 24.01 Profit/ (Loss) After Tax from Discontinued operations
2,709.42 39.16 6,101.23 93.63 (40.43) (0.58) 7,351.43 112.82
Profit attributable to Non-controlling Interest
52.57 0.76 198.68 3.05
Profit attributable to owners of the Company
3,246.18 46.92 6,645.17 101.98 1,103.67 15.95 8,915.91 136.83
Other Comprehensive IncomeItems that will not be reclassified to profit/ (loss)
3.03 0.04 (202.39) (3.11) (4.53) (0.07) (0.87) (0.01)
Items that may be reclassified to profit/ (loss)
(639.02) (9.24) 42.12 0.65 97.60 1.41 (196.60) (3.02)
Total Other Comprehensive Income (Net of Tax)
(635.99) (9.19) (160.27) (2.46) 93.07 1.35 (197.47) (3.03)
Total Comprehensive Income 2,662.76 38.48 6,683.58 102.57 1,196.74 17.30 8,718.44 133.80 Opening balance of Profit and Loss 1,353.47 19.56 2,234.71 34.30 5,329.29 77.02 3,930.01 60.31 Adjustments pursuant to Scheme of Demerger
- - (7,038.43) (108.02) - - (7,038.43) (108.02)
Adjustments pursuant to adoption of IND AS 115 (net of tax)
(610.86) (8.83) - - (93.03) (1.34) - -
Available for appropriation 3,988.79 57.65 1,841.45 28.26 6,339.93 91.63 5,807.49 89.13 1.3 Appropriations
Dividend on Equity SharesFinal Dividend (including tax on dividend)
(179.10) (2.59) (487.98) (7.49) (179.10) (2.59) (478.20) (7.34)
Balance carried to Balance Sheet 3,809.69 55.06 1,353.47 20.77 6,160.83 89.04 5,329.29 81.79
Notes:
* 1 US$ = `69.19 (Exchange Rate as on March 31, 2019)
** 1 US$ = `65.16 (Exchange Rate as on March 31, 2018)
Previous year figures have been regrouped/ restated wherever necessary to make them comparable with those of the current year.
BOARD’S REPORT
Strides Pharma Science Limited
34
2. Company’s Performance
FY 2019 was a challenging year for the Company in which we focused on course correction and building the right enablers. Most of the strategic outcomes have been met and your Company is now resurgent with its strategy and executing to plan.
On a consolidated basis, the operating revenue grew by 6% from `28,578 million in FY 2018 to `30,264 million in FY 2019 and EBITDA grew by 7% from `4,369 million in FY 2018 to ̀ 4,695 million in FY 2019.
The Regulated Markets of the US, Australia and the Other Regulated Markets comprising of UK, European Union, South Africa, Canada amongst others, registered a 21% year on year growth and contributed 81% to total revenues in FY 2019 as compared to 71% in FY 2018.
US business delivered a stellar performance during the year to be the largest market for your Company. This market contributed `10,514 million to FY 2019 revenues, growing 36% over FY 2018. The performance of the business was primarily driven by improved market share in the base portfolio, new product launches and a stable price environment across several products in the company’s portfolio.
In Australia, while the business reported a modest growth to register revenues of `9,331 Million; it delivered over 20% margins on account of backward integration of products to the Company owned manufacturing facilities in India and Singapore.
Other Regulated Markets Business continued to scale up sequentially to become the fastest growing market for your company, registering a growth of 39% year on year. It contributed `4,685 Million to FY 2019 revenues with growth attributed to an improved business environment in the key European markets and portfolio expansion.
During the year, the Emerging Markets and Institutional Business witnessed challenges as a result of a weak business environment. The contribution from these markets to the revenues stood at `2,081 Million and `3,654 Million, respectively. Your Company remains focused to turnaround its performance in these markets as it expects the recalibrated strategy to deliver an improved performance in the future.
During the year, R&D operations of the Company remained on track with 21 ANDAs filings as against the planned range of 20-25 ANDA filings in the year. Your Company also received 15 product approvals in FY 2019 including PARA IV approvals for Cinacalcet and Milnacipran Hydrochloride.
Your Company is progressing steadily with the outcomes from the reset strategy across each of the businesses both in terms of course correction
and execution. In FY 2020, we expect to build on the momentum,targeting profitable growth and superior cash flows through anticipated operating leverage.
A detailed analysis of each of the businesses of the Company is provided in the Management Discussion and Analysis Report.
3. Corporate Updates
During the year under review, your Company has undertaken the following key corporate actions:
Acquisitions• Acquisition of 100% stake in Vensun
Pharmaceuticals, Inc., USA Strides Pharma Inc, a step-down subsidiary of
the Company in the US, acquired 100% stake in Vensun Pharmaceuticals, Inc (‘Vensun’), a US-based generic company to bolster its US marketed portfolio and front-end presence. The transaction enabled Strides an unencumbered access to its partnered IP with Vensun.
• Acquisition of 80% stake in Pharmapar Inc., Canada
Strides Pharma Canada Inc, a step-down subsidiary of the Company in Canada, acquired 80% stake in Pharmapar Inc., a Canada based specialised generic front-end company. The transaction enabled Strides to head-start in the Quebec market with an established front-end and distribution network.
• Conversion of 50:50 JV with Vivimed to 100% ownership
The Company acquired balance 50% stake in Vivimed Life Sciences Private Limited, India and Strides Pharma Global Pte. Limited, Singapore (‘SPG’) acquired the balance 50% stake in Strides Vivimed Pte. Ltd., Singapore to own and operate the erstwhile JV companies.
The transaction complements Strides’ front-end growth strategy with a de-risked manufacturing base and enables expansion of US portfolio.
Divestments• Update on the divestment of Strides
Chemicals Private Limited to Solara Active Pharma Sciences Limited
In line with the Company’s B2C led growth strategy to focus on finished dosage formulations and Solara’s offer to provide the Company a long term “most favoured status” for API supplies and new product development, the Company, divested its 100% stake in Strides Chemicals Private Limited to Solara Active Pharma Sciences Limited. Pursuant to the said divestment, the residual API manufacturing facility held by Strides was transferred to Solara.
Statutory Reports | Board’s Report
Annual Report 2018-19
35
• Consumer Health Care (CHC) Business In October 2018, Strides partnered with
India Life Sciences III LLC, a fund advised by ICP-III Investment Advisors, to fund its nascent CHC Business.
India Life Sciences agreed to provide the business with US$ 20 Million growth capital. Accordingly, in term of the arrangement, India Life Sciences invested into Strides Consumer Private Limited, India and Strides Global Consumer Healthcare Limited, UK.
Strides’ CHC business comprises of key brands of JointFlex®, Pediacare®, NiteThruTM and NixItTM sold across key regulated and emerging markets.
• Divestment of Australian business Pursuant to the approval of the Member’s of
the Company in March 2019, the Company proposes to divest its entire shareholding in the step-down subsidiary (i) Strides Arcolab (Australia) Pty Ltd., Australia and (ii) Generic Partners Holding Co Pty Ltd., Australia. Both these subsidiaries are held through SPG.
Consideration for the said transaction including the transfer of assets relevant to the Australian Business which are held by SPG or its affiliates to Arrotex Holdings Pty. Ltd., Australia is AUD 394 Million on a ‘cash-free/ debt-free’ basis and on such terms and conditions as may be decided by the Board.
As part of the arrangement, SPG will:
a) Enter into a ten year preferred supplier contract with Arrotex, which will enable SPG to retain 40-50% of current EBITDA of the Australian business. The Australian business for Strides is estimated to have an annualised EBITDA of AUD 40 Million.
b) Retain IP of 140+ products in the Arrow portfolio with fungibility to be commercialised in other regulated markets where Strides operates.
c) Retain the right to commercialise these products in Australia post completion of the non-compete period of three years.
The transaction is currently pending for other closing conditions, including completion of the merger of Arrow and Apotex and closure of ten year preferred supply contract.
Other Updates• Additional Investments in Stelis Biopharma
Private Limited (Stelis) In November 2018, considering the future
prospects of Stelis, the Board of Directors
approved the proposal to invest upto US$ 15 Million in the Compulsorily Convertible Preference Shares (CCPS) of Stelis to maintain a significant ownership. As at March 31, 2019, the Company has invested approximately US$ 10.70 Million in the CCPS of Stelis.
• Strategic Partnership with SUDA Pharmaceuticals Ltd for the US Market
In November 2018, Strides Pharma Global Pte. Limited, a step-down wholly owned subsidiary of the Company in Singapore, entered into exclusive product development, licensing and supply agreement with SUDA Pharmaceuticals for its novel drug SUD-001H, an oral spray of Sumatriptan to treat migraine headache for the US market.
4. Board of Directors and Key Managerial Personnel of the Company as at the date of this Report
Board of Directors of the Company • Mr. Deepak Vaidya (DIN: 00337276),
Non-Executive Director, Chairperson of the Board.
• Mr. S Sridhar (DIN: 00004272), Mr Bharat D Shah (DIN: 00136969), Ms. Sangita Reddy (DIN: 00006285) and Mr. Homi Rustam Khusrokhan (DIN: 00005085) - Independent Directors of the Company.
• Mr. Arun Kumar (DIN: 00084845), Managing Director and Group CEO
• Mr. Badree Komandur (DIN: 07803242), Executive Director, Finance and Group CFO
Key Managerial Personnel • Mr. Arun Kumar (DIN: 00084845), Managing
Director and Group CEO
• Mr Badree Komandur (DIN: 07803242), Executive Director, Finance and Group CFO
• Ms Manjula Ramamurthy (A30515), Company Secretary
Details of changes in the Board of Directors and KMPs are provided in the Corporate Governance Report, which forms part of this Report.
Appointment/ Re-appointment, Continuation of Directorship & Retirement by Rotation
Proposal for the appointments/ re-appointment/ continuation of directorship of the following Directors shall be placed before the Members’ of the Company at the ensuing Annual General Meeting:
1) Mr. Deepak Vaidya, Non-Executive Director, who retires by rotation at the ensuing Annual
Strides Pharma Science Limited
36
General Meeting (AGM) and being eligible, offers himself for re-appointment.
Further, in terms of the SEBI Listing Regulations, proposal for continuation of Mr. Vaidya's directorship in the Company, who will attain the age of 75 years in January 2020, will also be placed for Members’ approval;
2) Re-appointment of Mr. S Sridhar and Ms. Sangita Reddy as Independent Directors of the Company for a second term of 5 (Five) years from the conclusion of ensuing AGM till the conclusion of the 33rd AGM of the Company.
Your Directors recommend their appointment/ re-appointment/continuation of directorship on the Board.
Meetings of the Board and Board Committees Details of the meetings of the Board and Board
Committees and their respective composition are provided in the Corporate Governance Report, which forms part of this report.
5. Share Capital
As on March 31, 2019, the Authorised Share Capital of the Company stood at `1,767,500,000/- divided into 176,750,000 equity shares of `10/- each.
The Issued, Subscribed and Paid-up Equity Share Capital of the Company as on March 31, 2019, stood at `895,494,760/- divided into `89,549,476 equity shares of `10/- each.
There has been an increase in the paid-up equity share capital of the Company during the Financial Year on account of allotment of 49,441 equity shares consequent to exercise of stock options by employees.
6. Dividend
Your Directors are pleased to recommend a Dividend of ̀ 3.00 (Indian Rupees Three Only) per equity share of face value of `10/- each for the Financial Year ended March 31, 2019, subject to the approval of the Members’ of the Company at the ensuing AGM, which is scheduled on July 30, 2019.
The Register of Members’ and Share Transfer Books will remain closed from July 23, 2019, to July 30, 2019 (both days inclusive) for payment of final dividend for the Financial Year ended March 31, 2019, and the AGM.
In terms of Regulation 43(A) of the SEBI Listing Regulations, the Company has in place a Dividend Distribution Policy.
The said Policy is available on the Company’s website and can be accessed at http://www.strides.com/ investor-committeboard.html
7. Transfer to Reserves
During the Financial Year, the Company has not made any transfer to the reserves.
8. Subsidiary, JVs and Associate Companies
Details of Subsidiaries, JVs and Associate Companies are provided herein below:Nature of Relationship India Overseas Total
Subsidiaries 5 48 53
Joint Ventures - 2 2
Associates 2 4 6
Total 61
Accounts of Subsidiaries In accordance with Section 129 (3) of the Companies
Act, 2013, the Company has prepared a consolidated financial statement.
A statement containing salient features of the financial statements of the Company’s subsidiaries, joint ventures and associate companies as required in Form AOC 1 is enclosed as Annexure 1 to this Report.
9. Corporate Governance and Management Discussion and Analysis
As per SEBI Listing Regulations, the Corporate Governance Report with the Auditor’s Certificate thereon, and the Management Discussion and Analysis Report forms part of this report.
10. Employee's Stock Option Plan
As at March 31, 2019, the Company has two Employee's Stock Option Plan viz., Strides Arcolab Employee's Stock Option Plan 2015 and Strides Shasun Employee's Stock Option Plan 2016.
Statement giving detailed information on stock options granted to Employees under the Company’s Employee Stock Option Plans as required under Section 62 of the Companies Act, 2013 read with Rule 12 of Companies (Share Capital and Debentures) Rules, 2014 and Regulation 14 of SEBI (Share Based Employee Benefits) Regulations, 2014 is enclosed as Annexure 2 to this Report and is also available at http://www.strides.com/investor-financial.html
11. Particulars of Employees
The statement containing particulars in terms of Section 197 (12) of the Companies Act, 2013 read with Rule 5(1) of the Companies (Appointment and Remuneration of Managerial Personnel) Rules, 2014 forms part of this report and is appended herewith as Annexure 3 to this report.
The statement containing particulars in terms of Section 197(12) of the Companies Act, 2013 read with Rule 5(2) and 5(3) of the Companies (Appointment and Remuneration of Managerial Personnel) Rules, 2014 forms part of this report.
Statutory Reports | Board’s Report
Annual Report 2018-19
37
Considering the first proviso to Section 136(1) of the Companies Act, 2013, the Annual Report, excluding the aforesaid information, is being sent to the Members’ of the Company and others entitled thereto. The said information is available for inspection at the registered office of the Company during business hours on working days of the Company up to the date of the ensuing AGM. Any Member interested in obtaining a copy thereof, may write to the Company Secretary in this regard.
12. Corporate Social Responsibility (CSR)
The Company has undertaken “Corporate Social Responsibility (CSR)”, initiatives in areas of Health, Education and Employability which are projects in accordance with Schedule VII of the Companies Act, 2013.
The Policy is available on the Company’s website and can be accessed at http://www.strides.com/ investor-committeboard.html
A detailed report on the CSR activities undertaken during FY 2018-19 is enclosed as Annexure 4 to this Report.
13. Loans, Guarantees or Investments
Details of Loans granted, Guarantees given and Investments made during the year under review, covered under the provisions of Section 186 of the Companies Act, 2013 are given in the Note no. 39 to the standalone financial statements in the Annual Report.
14. Contracts or Arrangements with Related Parties
All the transactions with related parties are in the ordinary course of business and at arm’s length basis. Further, there are no materially significant related party transactions made by the Company which may have potential conflict with the interests of the Company.
The information on transactions with related parties pursuant to section 134(3)(h) of the Companies Act 2013 read with Rule 8(2) of the Companies (Accounts) Rules, 2014 is attached as Annexure 5 to this Report.
All the transactions with related parties are disclosed in Note no. 44 to the standalone financial statements in the Annual Report.
Policy for Governance of Related Party Transactions is available on the Company’s website at http://www.strides.com/ investor-committeboard.html
15. Auditors and Audit Reports
Secretarial Audit Report M/s. Gopalkrishnaraj H H & Associates, a firm
of Company Secretaries in Practice (Certificate of Practice No: 4152) is the Secretarial Auditor for the Company.
The Secretarial Audit for FY 2018-19, inter-alia, included audit of compliance with the Companies Act, 2013 and the Rules made under, SEBI Listing Regulations and applicable Regulations prescribed by SEBI amongst others.
The Secretarial Audit Report is enclosed as Annexure 6 to the Board’s Report. The Secretarial Audit Report does not contain any qualifications, reservations or adverse remarks.
Statutory Auditors M/s. B S R & Co. LLP, Chartered Accountants
(Firm Registration no. 101248W/ W-100022) were appointed as Statutory Auditors of the Company for a period of 5 years at the 26th AGM of the Company to hold office till the conclusion of the 31st AGM of the Company.
Auditors Report for the Financial Year ended March 31, 2019, is enclosed with the financial statements in the Annual Report. Auditors Report for the year ended March 31, 2019, does not contain any qualification, observations or adverse remarks.
Internal Auditors M/s. Grant Thornton India LLP are the Internal
Auditors of the Company.
During the year under review, the Internal Auditors were satisfied with the management response on the observations and recommendations made by them during the course of their audit and have expressed satisfaction with the internal controls implemented by the Company.
Cost Auditors Pursuant to Section 148(1) of the Companies Act,
2013, Company is required to maintain cost records and accordingly such accounts and records are made and maintained
Pursuant to Section 148(3) and the Companies (Cost Records and Audit) Rules, 2014, M/s. Rao, Murthy & Associates, Cost Accountants (Firm Registration No.: 000065), were appointed as Cost Auditors of the Company for the Financial Year 2018-19.
The remuneration proposed to be paid to the Cost Auditors forms part of the AGM Notice for ratification by the Members.
Strides Pharma Science Limited
38
16. Internal Financial Controls
The Company has in place adequate framework for Internal Financial Controls as required under Section 134 (5) (e) of the Companies Act, 2013.
During the year under review, such controls were tested and no material weaknesses in their design or operations were observed.
17. Risk Management
The Company has a risk management framework for the identification and management of risks.
In line with the requirement under the amended SEBI Listing Regulations, the Company has constituted a Risk Management Committee (RMC) effective April 1, 2019, comprising of members of the Board and Senior Management personnel. Composition of the RMC is provided in the Corporate Governance Report, which forms part of this Report.
RMC is entrusted with the responsibility of overseeing strategic, operational and financial risks that the organisation faces, along with the adequacy of mitigation plans to address such risks.
Additional details relating to Risk Management are provided in the “Management Discussion and Analysis” report forming part of this Report.
18. Other Disclosures
Nature of Business of the Company There has been no change in the nature of business
of the Company during the year under review.
Deposits The Company has not accepted any deposits
covered under chapter V of the Companies Act, 2013. Accordingly, no disclosure or reporting is required in respect of details relating to deposits.
Whistle Blower Policy Pursuant to provisions of Section 177(9) of the
Companies Act, 2013 and SEBI Listing Regulations, the Company has a Whistle Blower Policy in place.
The Policy provides appropriate avenues to the directors, employees and stakeholders of the Company to make protected disclosures in relation to the matters concerning the Company.
Pursuant to the amendment in the SEBI (Prohibition of Insider Trading) Regulations, 2015, the Whistle Blower Policy has been appropriately amended to enable employees to report instances of leak or suspected leak of unpublished price sensitive information.
During the year, the Company has not received any protected disclosure.
The Policy is available on the Company’s website and can be accessed at http://www.strides.com/ investor-committeboard.html
Policy on Directors Appointment and Remuneration
The policy of the Company on Directors’ appointment and remuneration, including the criteria for determining qualifications, positive attributes, independence of a director and other matters, as required under Section 178 of the Companies Act, 2013 is available on the Company’s website and can be accessed at http://www.strides.com/ investor-committeboard.html
Disclosure on compliance with Secretarial Standards
The Company complies with all applicable mandatory secretarial standards issued by the Institute of Company Secretaries of India.
Insurance The assets/ properties of the Company are
adequately insured against loss due to fire, riots, earthquake, terrorism, amongst others and against other perils that are considered necessary by the management.
Reporting of Fraud No frauds were reported by the Auditors as specified
under Section 143 of the Companies Act, 2013 for the Financial Year ended March 31, 2019.
Significant and material orders passed by the Regulators or Courts
There were no significant and material orders passed by the Regulators/ Courts that would impact the going concern status of the Company and its future operations.
Extract of Annual Return Extract of Annual Return in Form MGT– 9 is enclosed
as Annexure 7 to the Board’s Report and is available at http://www.strides.com/investor-financial.html
Conservation of Energy, R&D, Technology Absorption and Foreign Exchange Earnings/ Outgo
Details of Energy Conversation, R&D, Technology Absorption and Foreign Exchange Earnings/ Outgo are enclosed as Annexure 8 to this Report.
Policy on prevention of Sexual Harassment at workplace
Your Company has in place a Policy on Prevention of Sexual Harassment in line with the requirements of The Sexual Harassment of Women at the work place (Prevention, Prohibition & Redressal) Act, 2013 (PoSH Act). Strides has adopted a gender-neutral policy.
Statutory Reports | Board’s Report
Annual Report 2018-19
39
As per the PoSH Act, the Company has constituted Internal Complaints Committee. During the year, there were no PoSH instances reported in terms of the Policy.
A disclosure relating to PoSH is provided in the Corporate Governance Reports, which forms part of the Board’s Report.
19. Declaration by Independent Directors
In accordance with Section 149(7) of the Companies Act, 2013 and Regulation 25(8) of the SEBI Listing Regulations, each independent director has confirmed to the Company that he/she meets the criteria of independence as laid down in Section 149 (6) of the Companies Act, 2013 and Regulation 16(1)(b) of the Listing Regulations.
20. Board Evaluation
The evaluation of all the Directors, Committees, Chairperson of the Board, and the Board as a whole was conducted for the year. The evaluation parameters and the process have been explained in the Corporate Governance Report, which is part of this report.
21. Material changes and commitments, if any
There were no material changes and commitments affecting the financial position of the Company which occurred between the end of the Financial Year to which this financial statement relates and the date of this report.
22. Directors’ Responsibility Statement
Pursuant to the requirement under section 134 (3) (c) of the Companies Act, 2013 with respect to the Directors’ Responsibility Statement, the Board of Directors of your company state that:
(a) in the preparation of the annual accounts, the applicable accounting standards have been followed along with proper explanation relating to material departures;
(b) directors have selected such accounting policies and applied them consistently and made judgments and estimates that are reasonable and prudent so as to give a true and fair view of the state of affairs of the Company at the end of the Financial Year and of the profit and loss of the Company for that period;
(c) directors have taken proper and sufficient care for the maintenance of adequate accounting records in accordance with the provisions of this Act for safeguarding the assets of the Company and for preventing and detecting fraud and other irregularities;
(d) directors have prepared the annual accounts of the Company on a going concern basis;
(e) the directors have laid down internal financial controls to be followed by the Company and that such internal financial controls are adequate and are operating effectively.
(f) the directors have devised proper systems to ensure compliance with the provisions of all applicable laws and that such systems were adequate and operating effectively.
23. Acknowledgement
Your Directors sincerely thank all the stakeholders, employees, medical professionals, business partners, government & other statutory bodies, banks, financial institutions, analysts and members for their continued assistance, support and valuable cooperation.
For and on behalf of the Board of Directors
Deepak Vaidya Non-Executive Director
Date: May 10, 2019 Chairperson of the BoardPlace: Bengaluru DIN: 00337276
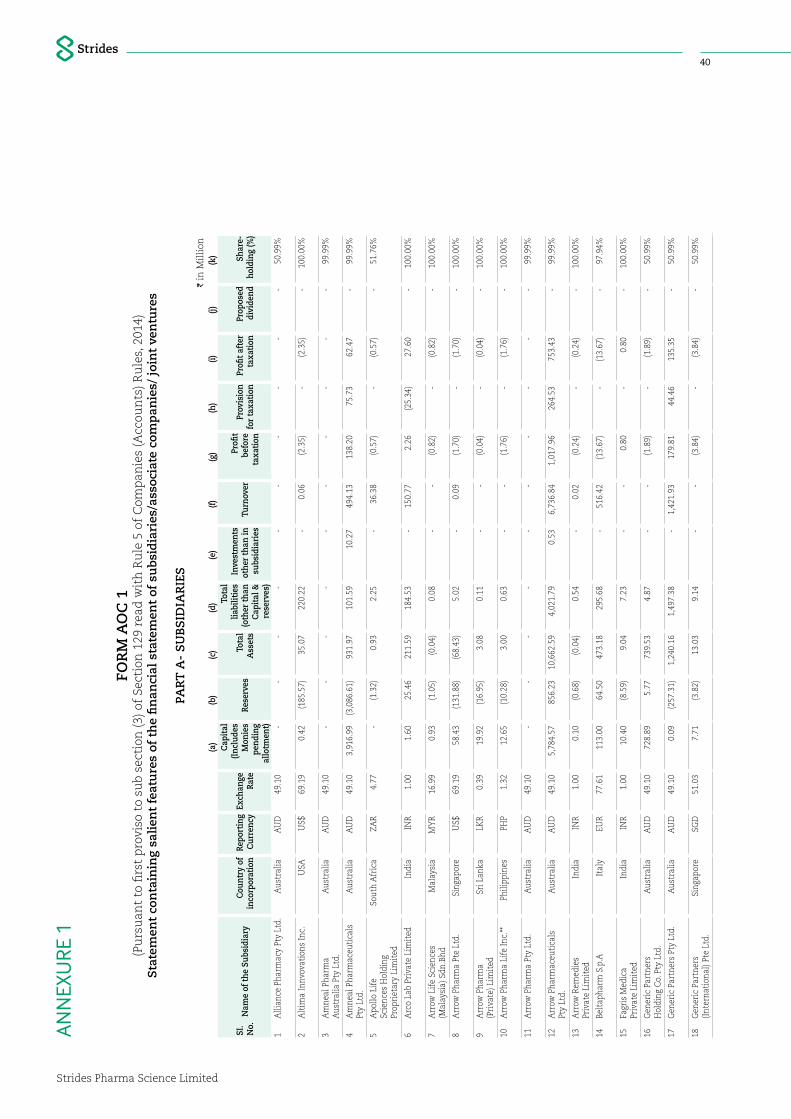
Strides Pharma Science Limited
40
FOR
M A
OC
1(P
urs
uan
t to
firs
t p
rovi
so t
o su
b s
ecti
on (
3) o
f Se
ctio
n 1
29 r
ead
wit
h R
ule
5 o
f C
omp
anie
s (A
ccou
nts
) R
ule
s, 2
014)
Sta
tem
ent
con
tain
ing
sali
ent
feat
ure
s of
th
e fi
nan
cial
sta
tem
ent
of s
ub
sid
iari
es/a
ssoc
iate
com
pan
ies/
joi
nt
ven
ture
s
PAR
T A
- S
UB
SID
IAR
IES
I in
Mil
lion
(a)
(b)
(c)
(d)
(e)
(f)(g
)(h
)(i)
(j)(k
)
SI.
No.
Nam
e of
the
Subs
idia
ryC
ount
ry o
f in
corp
orat
ion
Repo
rtin
g C
urre
ncy
Exch
ange
Ra
te
Cap
ital
(In
clud
es
Mon
ies
pend
ing
allo
tmen
t)
Rese
rves
Tota
l A
sset
s
Tota
l lia
bilit
ies
(oth
er th
an
Cap
ital
&
rese
rves
)
Inve
stm
ents
ot
her
than
in
subs
idia
ries
Turn
over
Profi
t be
fore
ta
xati
on
Prov
isio
n fo
r ta
xati
onPr
ofit a
fter
ta
xati
onPr
opos
ed
divi
dend
Shar
e-ho
ldin
g (%
)
1A
llian
ce P
harm
acy
Pty
Ltd.
Aus
tral
iaA
UD
49.
10
-
-
-
-
-
-
-
-
-
-
50.9
9%
2A
ltim
a In
nvov
atio
ns In
c.U
SAU
S$ 6
9.19
0
.42
(185
.57)
35.
07
220
.22
-
0.0
6 (2
.35)
-
(2.3
5) -
10
0.00
%
3A
mne
al P
harm
a A
ustr
alia
Pty
Ltd
.A
ustr
alia
AU
D 4
9.10
-
-
-
-
-
-
-
-
-
-
99
.99%
4A
mne
al P
harm
aceu
tica
ls
Pty
Ltd.
Aus
tral
iaA
UD
49.
10
3,9
16.9
9 (3
,086
.61)
931
.97
101
.59
10.
27
494
.13
138
.20
75.
73
62.
47
-
99.9
9%
5A
pollo
Lif
e Sc
ienc
es H
oldi
ng
Prop
riet
ary
Lim
ited
Sout
h A
fric
aZA
R 4
.77
-
(1.3
2) 0
.93
2.2
5 -
3
6.38
(0
.57)
-
(0.5
7) -
51
.76%
6A
rco
Lab
Priv
ate
Lim
ited
Indi
aIN
R 1
.00
1.6
0 2
5.46
2
11.5
9 1
84.5
3 -
1
50.7
7 2
.26
(25.
34)
27.
60
-
100.
00%
7A
rrow
Lif
e Sc
ienc
es
(Mal
aysi
a) S
dn.B
hdM
alay
sia
MY
R 1
6.99
0
.93
(1.0
5) (0
.04)
0.0
8 -
-
(0
.82)
-
(0.8
2) -
10
0.00
%
8A
rrow
Pha
rma
Pte
Ltd.
Sing
apor
eU
S$ 6
9.19
5
8.43
(1
31.8
8) (6
8.43
) 5
.02
-
0.0
9 (1
.70)
-
(1.7
0) -
10
0.00
%
9A
rrow
Pha
rma
(Pri
vate
) Lim
ited
Sri L
anka
LKR
0.3
9 1
9.92
(1
6.95
) 3
.08
0.1
1 -
-
(0
.04)
-
(0.0
4) -
10
0.00
%
10A
rrow
Pha
rma
Life
Inc.
**Ph
ilipp
ines
PHP
1.3
2 1
2.65
(1
0.28
) 3
.00
0.6
3 -
-
(1
.76)
-
(1.7
6) -
10
0.00
%
11A
rrow
Pha
rma
Pty
Ltd.
Aus
tral
iaA
UD
49.
10
-
-
-
-
-
-
-
-
-
-
99.9
9%
12A
rrow
Pha
rmac
euti
cals
Pt
y Lt
d.A
ustr
alia
AU
D 4
9.10
5
,784
.57
856
.23
10,
662.
59
4,0
21.7
9 0
.53
6,7
36.8
4 1
,017
.96
264
.53
753
.43
-
99.9
9%
13A
rrow
Rem
edie
s Pr
ivat
e Li
mit
edIn
dia
INR
1.0
0 0
.10
(0.6
8) (0
.04)
0.5
4 -
0
.02
(0.2
4) -
(0
.24)
-
100.
00%
14Be
ltap
harm
S.p
.AIt
aly
EUR
77.
61
113
.00
64.
50
473
.18
295
.68
-
516
.42
(13.
67)
-
(13.
67)
-
97.9
4%
15Fa
gris
Med
ica
Priv
ate
Lim
ited
Indi
aIN
R 1
.00
10.
40
(8.5
9) 9
.04
7.2
3 -
-
0
.80
-
0.8
0 -
10
0.00
%
16G
ener
ic P
artn
ers
Hol
ding
Co.
Pty
Ltd
.A
ustr
alia
AU
D 4
9.10
7
28.8
9 5
.77
739
.53
4.8
7 -
-
(1
.89)
-
(1.8
9) -
50
.99%
17G
ener
ic P
artn
ers
Pty
Ltd.
Aus
tral
iaA
UD
49.
10
0.0
9 (2
57.3
1) 1
,240
.16
1,4
97.3
8 -
1
,421
.93
179
.81
44.
46
135
.35
-
50.9
9%
18G
ener
ic P
artn
ers
(Inte
rnat
iona
l) Pt
e Lt
d.Si
ngap
ore
SGD
51.
03
7.7
1 (3
.82)
13.
03
9.1
4 -
-
(3
.84)
-
(3.8
4) -
50
.99%
AN
NEX
URE
1

Statutory Reports | Board’s Report
Annual Report 2018-19
41
I in
Mil
lion
(a)
(b)
(c)
(d)
(e)
(f)(g
)(h
)(i)
(j)(k
)
SI.
No.
Nam
e of
the
Subs
idia
ryC
ount
ry o
f in
corp
orat
ion
Repo
rtin
g C
urre
ncy
Exch
ange
Ra
te
Cap
ital
(In
clud
es
Mon
ies
pend
ing
allo
tmen
t)
Rese
rves
Tota
l A
sset
s
Tota
l lia
bilit
ies
(oth
er th
an
Cap
ital
&
rese
rves
)
Inve
stm
ents
ot
her
than
in
subs
idia
ries
Turn
over
Profi
t be
fore
ta
xati
on
Prov
isio
n fo
r ta
xati
onPr
ofit a
fter
ta
xati
onPr
opos
ed
divi
dend
Shar
e-ho
ldin
g (%
)
19G
ener
ic
Part
ners
(Can
ada)
Inc
Can
ada
CA
D 5
1.84
0
.01
4.4
7 1
34.1
2 1
29.6
4 -
1
0.13
(2
3.43
) 5
.00
(28.
43)
-
50.9
9%
20G
ener
ic
Part
ners
(M) S
dn.B
hd**
Mal
aysi
aM
YR
16.
99
-
-
-
-
-
-
0.3
0 0
.28
0.0
2 -
50
.99%
21G
ener
ic P
artn
ers
(NZ)
Ltd
.N
ew Z
eala
ndN
ZD 4
7.14
-
(4
.72)
0.6
3 5
.35
-
-
(2.4
1) -
(2
.41)
-
50.9
9%
22G
ener
ic P
artn
ers
(Sou
th
Afr
ica)
Pty
Lim
ited
**So
uth
Afr
ica
ZAR
4.7
7 -
(0
.33)
-
0.3
3 -
-
(0
.33)
-
(0.3
3) -
10
0.00
%
23G
ener
ic P
artn
ers
UK
Ltd
.U
KG
BP 9
0.17
0
.01
63.
28
71.
87
8.5
8 -
2
8.37
8
.12
0.9
0 7
.22
-
100.
00%
24Ph
arm
apar
Inc.
C
anad
aC
AD
51.
84
259
.22
(203
.06)
167
.99
111
.83
-
44.
26
13.
52
-
13.
52
-
80.0
0%
25Ph
arm
acy
Alli
ance
Gro
up
Hol
ding
s Pt
y Lt
d.A
ustr
alia
AU
D 4
9.10
1
,335
.76
(1,3
35.7
8) 3
5.04
3
5.06
-
-
1
2.69
-
1
2.69
1
2.70
50
.99%
26Ph
arm
acy
Alli
ance
In
vest
men
ts P
ty L
td.
Aus
tral
iaA
UD
49.
10
693
.12
35.
06
728
.18
-
-
-
6.4
8 -
6
.48
-
99.9
9%
27Ph
arm
acy
Alli
ance
Pty
Ltd
.A
ustr
alia
AU
D 4
9.10
7
2.96
2
45.3
6 5
87.8
7 2
69.5
5 -
8
63.6
5 1
31.1
2 3
9.06
9
2.06
1
2.70
50
.99%
28Sh
asun
Ph
arm
a So
luti
ons
Inc.
USA
US$
69.
19
37.
87
(38.
20)
-
0.3
3 -
-
0
.09
-
0.0
9 -
10
0.00
%
29Sm
arte
rpha
rm P
ty L
td.
Aus
tral
iaA
UD
49.
10
0.0
7 3
6.73
5
1.77
1
4.97
-
1
4.52
1
1.39
3
.42
7.9
7 -
50
.99%
30St
abili
s Ph
arm
a In
c.U
SAU
S$ 6
9.19
0
.06
0.0
9 0
.32
0.1
7 -
-
0
.15
0.1
1 0
.04
-
100.
00%
31St
elis
Bio
phar
ma
(Mal
aysi
a) S
dn.B
hdM
alay
sia
MY
R 1
6.99
1
41.3
6 (5
5.85
) 8
5.72
0
.21
-
-
3.4
3 0
.09
3.3
4 -
10
0.00
%
32St
ride
s A
rcol
ab
(Aus
tral
ia) P
ty L
td.
Aus
tral
iaA
UD
49.
10
5,8
75.1
6 (4
38.8
7) 1
0,06
5.13
4
,628
.84
-
-
(340
.37)
-
(340
.37)
-
99.9
9%
33St
ride
s A
rcol
ab
Inte
rnat
iona
l Ltd
.U
KU
S$ 6
9.19
4
,251
.69
(507
.99)
4,8
02.2
6 1
,058
.56
1,3
58.3
3 -
(8
94.1
3) -
(8
94.1
3) -
10
0.00
%
34St
ride
s C
hem
ical
s Pr
ivat
e Li
mit
edIn
dia
INR
1.0
0 -
-
-
-
-
1
56.6
7 1
4.27
-
1
4.27
-
-
35St
ride
s C
IS L
imit
edC
ypru
sU
S$ 6
9.19
0
.22
5.9
7 7
4.19
6
8.00
-
9
0.45
(1
0.66
) (3
.05)
(7.6
1) -
10
0.00
%
36St
ride
s C
onsu
mer
Pr
ivat
e Li
mit
edIn
dia
INR
1.0
0 -
-
-
-
-
3
.69
19.
63
-
19.
63
-
37St
ride
s Em
ergi
ng
Mar
kets
Lim
ited
Indi
aIN
R 1
.00
56.
27
(303
.81)
488
.53
736
.07
-
36.
12
(159
.66)
-
(159
.66)
-
100.
00%
38St
ride
s Fo
unda
tion
Tru
stIn
dia
INR
1.0
0 -
2
6.20
3
5.04
8
.84
-
-
(6.3
0) -
(6
.30)
-
-
39St
ride
s Li
fe
Scie
nces
Lim
ited
N
iger
iaN
GN
0.1
9 0
.56
(75.
26)
165
.10
239
.80
-
35.
84
(35.
26)
-
(35.
26)
-
100.
00%
40St
ride
s Ph
arm
a (C
ypru
s) L
td.
Cyp
rus
EUR
77.
61
0.2
0 1
,033
.92
1,6
73.1
3 6
39.0
1 -
5
31.5
2 (9
56.5
4) (1
5.96
) (9
40.5
8) -
10
0.00
%
41St
ride
s Ph
arm
a (S
A) P
ty L
td.
Sout
h A
fric
aZA
R 4
.77
-
31.
22
41.
78
10.
56
-
0.2
5 (1
0.82
) (5
.71)
(5.1
1) -
60
.00%
42St
ride
s Ph
arm
a G
loba
l (U
K) L
td.
UK
GBP
90.
17
3,9
09.4
8 (2
,423
.08)
1,4
91.8
8 5
.48
111
.30
-
(413
.81)
-
(413
.81)
-
100.
00%
43St
ride
s Ph
arm
a A
sia
Pte
Ltd.
Sing
apor
eU
S$ 6
9.19
1
2,13
0.16
2
,222
.26
15,
103.
35
750
.93
-
-
2,5
44.2
7 0
.59
2,5
43.6
8 2
58.9
7 10
0.00
%
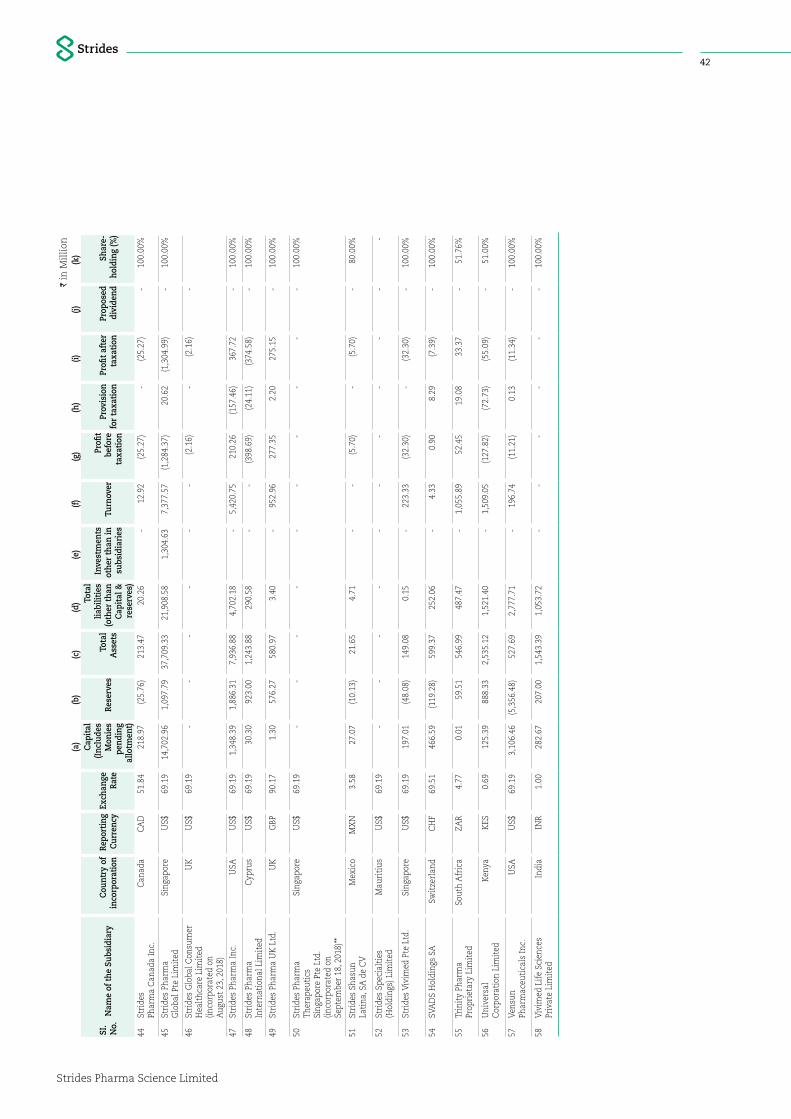
Strides Pharma Science Limited
42I in
Mil
lion
(a)
(b)
(c)
(d)
(e)
(f)(g
)(h
)(i)
(j)(k
)
SI.
No.
Nam
e of
the
Subs
idia
ryC
ount
ry o
f in
corp
orat
ion
Repo
rtin
g C
urre
ncy
Exch
ange
Ra
te
Cap
ital
(In
clud
es
Mon
ies
pend
ing
allo
tmen
t)
Rese
rves
Tota
l A
sset
s
Tota
l lia
bilit
ies
(oth
er th
an
Cap
ital
&
rese
rves
)
Inve
stm
ents
ot
her
than
in
subs
idia
ries
Turn
over
Profi
t be
fore
ta
xati
on
Prov
isio
n fo
r ta
xati
onPr
ofit a
fter
ta
xati
onPr
opos
ed
divi
dend
Shar
e-ho
ldin
g (%
)
44St
ride
s Ph
arm
a C
anad
a In
c.C
anad
aC
AD
51.
84
218
.97
(25.
76)
213
.47
20.
26
-
12.
92
(25.
27)
-
(25.
27)
-
100.
00%
45St
ride
s Ph
arm
a G
loba
l Pte
Lim
ited
Sing
apor
eU
S$ 6
9.19
1
4,70
2.96
1
,097
.79
37,
709.
33
21,
908.
58
1,3
04.6
3 7
,377
.57
(1,2
84.3
7) 2
0.62
(1
,304
.99)
-
100.
00%
46St
ride
s G
loba
l Con
sum
er
Hea
lthc
are
Lim
ited
(in
corp
orat
ed o
n A
ugus
t 23
, 201
8)
UK
US$
69.
19
-
-
-
-
-
-
(2.1
6) -
(2
.16)
-
47St
ride
s Ph
arm
a In
c.U
SAU
S$ 6
9.19
1
,348
.39
1,8
86.3
1 7
,936
.88
4,7
02.1
8 -
5
,420
.75
210
.26
(157
.46)
367
.72
-
100.
00%
48St
ride
s Ph
arm
a In
tern
atio
nal L
imit
edC
ypru
sU
S$ 6
9.19
3
0.30
9
23.0
0 1
,243
.88
290
.58
-
-
(398
.69)
(24.
11)
(374
.58)
-
100.
00%
49St
ride
s Ph
arm
a U
K L
td.
UK
GBP
90.
17
1.3
0 5
76.2
7 5
80.9
7 3
.40
-
952
.96
277
.35
2.2
0 2
75.1
5 -
10
0.00
%
50St
ride
s Ph
arm
a Th
erap
euti
cs
Sing
apor
e Pt
e Lt
d.
(inco
rpor
ated
on
Sept
embe
r 18
, 201
8)**
Sing
apor
eU
S$ 6
9.19
-
-
-
-
-
-
-
-
-
-
10
0.00
%
51St
ride
s Sh
asun
La
tina
, SA
de
CV
Mex
ico
MX
N 3
.58
27.
07
(10.
13)
21.
65
4.7
1 -
-
(5
.70)
-
(5.7
0) -
80
.00%
52St
ride
s Sp
ecia
ltie
s (H
oldi
ngs)
Lim
ited
Mau
riti
usU
S$ 6
9.19
-
-
-
-
-
-
-
-
-
-
-
53St
ride
s Vi
vim
ed P
te L
td.
Sing
apor
eU
S$ 6
9.19
1
97.0
1 (4
8.08
) 1
49.0
8 0
.15
-
223
.33
(32.
30)
-
(32.
30)
-
100.
00%
54SV
AD
S H
oldi
ngs
SASw
itze
rlan
dC
HF
69.
51
466
.59
(119
.28)
599
.37
252
.06
-
4.3
3 0
.90
8.2
9 (7
.39)
-
100.
00%
55Tr
init
y Ph
arm
a Pr
opri
etar
y Li
mit
edSo
uth
Afr
ica
ZAR
4.7
7 0
.01
59.
51
546
.99
487
.47
-
1,0
55.8
9 5
2.45
1
9.08
3
3.37
-
51
.76%
56U
nive
rsal
C
orpo
rati
on L
imit
edK
enya
KES
0.6
9 1
25.3
9 8
88.3
3 2
,535
.12
1,5
21.4
0 -
1
,509
.05
(127
.82)
(72.
73)
(55.
09)
-
51.0
0%
57Ve
nsun
Ph
arm
aceu
tica
ls In
c.U
SAU
S$ 6
9.19
3
,106
.46
(5,3
56.4
8) 5
27.6
9 2
,777
.71
-
196
.74
(11.
21)
0.1
3 (1
1.34
) -
10
0.00
%
58Vi
vim
ed L
ife
Scie
nces
Pr
ivat
e Li
mit
edIn
dia
INR
1.0
0 2
82.6
7 2
07.0
0 1
,543
.39
1,0
53.7
2 -
-
-
-
-
-
10
0.00
%
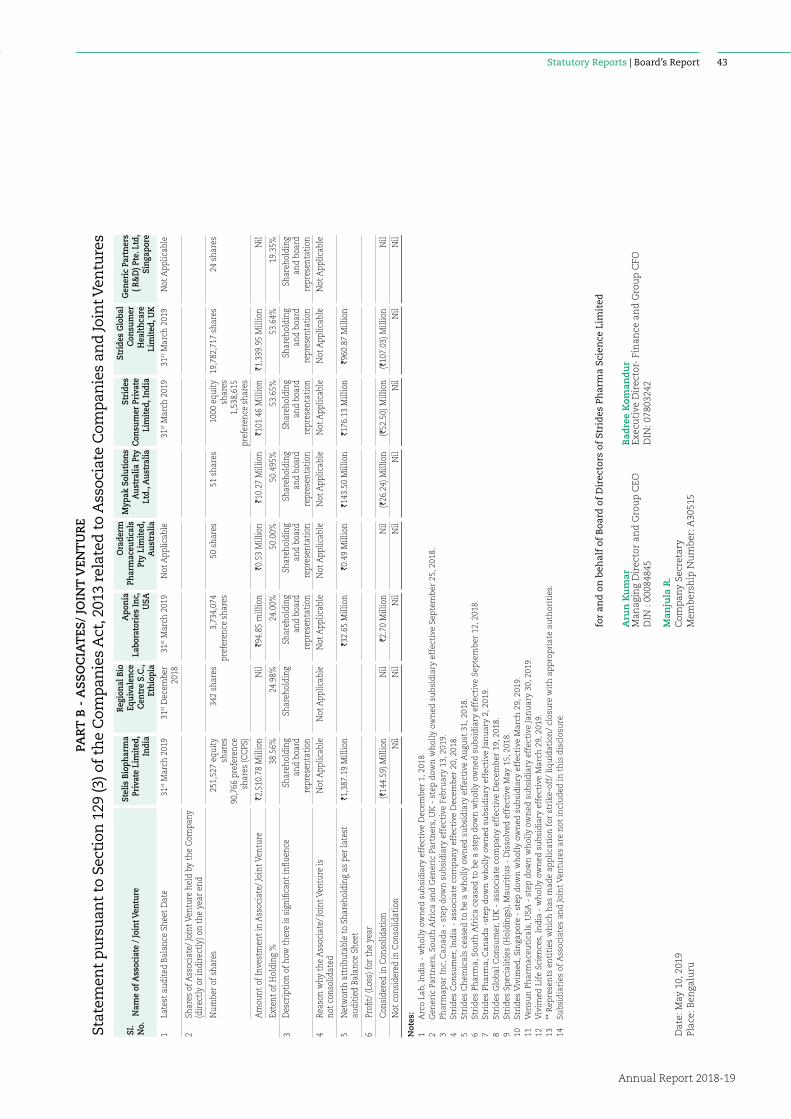
Statutory Reports | Board’s Report
Annual Report 2018-19
43
PAR
T B
- A
SS
OC
IAT
ES/
JOIN
T V
ENT
UR
E
Stat
emen
t p
urs
uan
t to
Sec
tion
129
(3) o
f th
e C
omp
anie
s A
ct, 2
013
rela
ted
to
Ass
ocia
te C
omp
anie
s an
d Jo
int V
entu
res
SI.
No.
Nam
e of
Ass
ocia
te /
Join
t Ven
ture
Stel
is B
ioph
arm
a Pr
ivat
e Li
mit
ed,
Indi
a
Regi
onal
Bio
Eq
uiva
lenc
e C
entr
e S.
C.,
Ethi
opia
Apo
nia
Labo
rato
ries
Inc,
U
SA
Ora
derm
Ph
arm
aceu
tica
ls
Pty
Lim
ited
, A
ustr
alia
Myp
ak S
olut
ions
A
ustr
alia
Pty
Lt
d., A
ustr
alia
Stri
des
Con
sum
er P
riva
te
Lim
ited
, Ind
ia
Stri
des
Glo
bal
Con
sum
er
Hea
lthc
are
Lim
ited
, UK
Gen
eric
Par
tner
s ( R
&D
) Pte
. Ltd
, Si
ngap
ore
1La
test
aud
ited
Bal
ance
She
et D
ate
31st M
arch
201
931
st D
ecem
ber
2018
31st M
arch
201
9N
ot A
pplic
able
31st M
arch
201
931
st M
arch
201
9N
ot A
pplic
able
2Sh
ares
of A
ssoc
iate
/ Jo
int V
entu
re h
eld
by t
he C
ompa
ny
(dir
ectl
y or
indi
rect
ly) o
n th
e ye
ar e
nd
Num
ber
of s
hare
s25
1,52
7 eq
uity
sh
ares
90
,766
pre
fere
nce
shar
es (C
CPS
)
342
shar
es3,
734,
074
pref
eren
ce s
hare
s50
sha
res
51 s
hare
s10
00 e
quit
y sh
ares
1,
538,
615
pref
eren
ce s
hare
s
19,7
82,7
17 s
hare
s 24
sha
res
Am
ount
of I
nves
tmen
t in
Ass
ocia
te/
Join
t Ven
ture
`2,5
10.7
8 M
illio
nN
il`9
4.85
mill
ion
`0.5
3 M
illio
n`1
0.27
Mill
ion
`101
.46
Mill
ion
`1,3
39.9
5 M
illio
nN
il
Exte
nt o
f Hol
ding
%38
.56%
24.9
8%24
.00%
50.0
0%50
.495
%53
.65%
53.6
4%19
.35%
3D
escr
ipti
on o
f how
the
re is
sig
nific
ant
influ
ence
Shar
ehol
ding
an
d bo
ard
repr
esen
tati
on
Shar
ehol
ding
Shar
ehol
ding
an
d bo
ard
repr
esen
tati
on
Shar
ehol
ding
an
d bo
ard
repr
esen
tati
on
Shar
ehol
ding
an
d bo
ard
repr
esen
tati
on
Shar
ehol
ding
an
d bo
ard
repr
esen
tati
on
Shar
ehol
ding
an
d bo
ard
repr
esen
tati
on
Shar
ehol
ding
an
d bo
ard
repr
esen
tati
on
4Re
ason
why
the
Ass
ocia
te/
Join
t Ven
ture
is
not
cons
olid
ated
Not
App
licab
leN
ot A
pplic
able
Not
App
licab
leN
ot A
pplic
able
Not
App
licab
leN
ot A
pplic
able
Not
App
licab
leN
ot A
pplic
able
5N
etw
orth
att
ribu
tabl
e to
Sha
reho
ldin
g as
per
late
st
audi
tied
Bal
ance
She
et`1
,387
.19
Mill
ion
`32.
65 M
illio
n`0
.49
Mill
ion
`143
.50
Mill
ion
`176
.13
Mill
ion
`960
.87
Mill
ion
6Pr
ofit/
(Los
s) fo
r th
e ye
ar
Con
side
red
in C
onso
lidat
ion
(`14
4.59
) Mill
ion
Nil
`2.7
0 M
illio
nN
il (`
26.2
4) M
illio
n (`
52.5
0) M
illio
n (`
107.
03) M
illio
n N
il N
ot c
onsi
dere
d in
Con
solid
atio
n N
il N
il N
il N
il N
il N
il N
il N
il
Not
es:
1 A
rco
Lab,
In
dia
- w
hol
ly o
wn
ed s
ub
sid
iary
eff
ecti
ve D
ecem
ber
1, 2
018.
2 G
ener
ic P
artn
ers,
Sou
th A
fric
a an
d G
ener
ic P
artn
ers,
UK
- s
tep
dow
n w
hol
ly o
wn
ed s
ub
sid
iary
eff
ecti
ve S
epte
mb
er 2
5, 2
018.
3 Ph
arm
apar
In
c, C
anad
a -
step
dow
n s
ub
sid
iary
eff
ecti
ve F
ebru
ary
13, 2
019.
4
Stri
des
Con
sum
er, I
nd
ia -
ass
ocia
te c
omp
any
effe
ctiv
e D
ecem
ber
20,
201
8.
5 St
rid
es C
hem
ical
s ce
ased
to
be
a w
hol
ly o
wn
ed s
ub
sid
iary
eff
ecti
ve A
ugu
st 3
1, 2
018.
6
Stri
des
Ph
arm
a, S
outh
Afr
ica
ceas
ed t
o b
e a
step
dow
n w
hol
ly o
wn
ed s
ub
sid
iary
eff
ecti
ve S
epte
mb
er 1
2, 2
018.
7
Stri
des
Ph
arm
a, C
anad
a -s
tep
dow
n w
hol
ly o
wn
ed s
ub
sid
iary
eff
ecti
ve Ja
nu
ary
2, 2
019.
8 St
rid
es G
lob
al C
onsu
mer
, UK
- a
ssoc
iate
com
pan
y ef
fect
ive
Dec
emb
er 1
9, 2
018.
9
Stri
des
Sp
ecia
liti
es (
Hol
din
gs),
Mau
riti
us
- D
isso
lved
eff
ecti
ve M
ay 1
5, 2
018.
10
Stri
des
Viv
imed
, Sin
gap
ore
- st
ep d
own
wh
olly
ow
ned
su
bsi
dia
ry e
ffec
tive
Mar
ch 2
9, 2
019.
11
Ven
sun
Ph
arm
aceu
tica
ls, U
SA -
ste
p d
own
wh
olly
ow
ned
su
bsi
dia
ry e
ffec
tive
Jan
uar
y 30
, 201
9.12
V
ivim
ed L
ife
Scie
nce
s, I
nd
ia -
wh
olly
ow
ned
su
bsi
dia
ry e
ffec
tive
Mar
ch 2
9, 2
019.
13
** R
epre
sen
ts e
nti
ties
wh
ich
has
mad
e ap
pli
cati
on f
or s
trik
e-of
f/ l
iqu
idat
ion
/ cl
osu
re w
ith
ap
pro
pri
ate
auth
orit
ies.
14
Sub
sid
iari
es o
f A
ssoc
iate
s an
d Jo
int
Ven
ture
s ar
e n
ot in
clu
ded
in t
his
dis
clos
ure
.
for
and
on
beh
alf
of B
oard
of
Dir
ecto
rs o
f St
rid
es P
har
ma
Scie
nce
Lim
ited
Aru
n K
um
arB
adre
e K
oman
du
rM
anag
ing
Dir
ecto
r an
d G
rou
p C
EOEx
ecu
tive
Dir
ecto
r- F
inan
ce a
nd
Gro
up
CFO
DIN
: 00
0848
45D
IN: 0
7803
242
Man
jula
R.
Dat
e: M
ay 1
0, 2
019
Com
pan
y Se
cret
ary
Plac
e: B
enga
luru
Mem
ber
ship
Nu
mb
er: A
3051
5
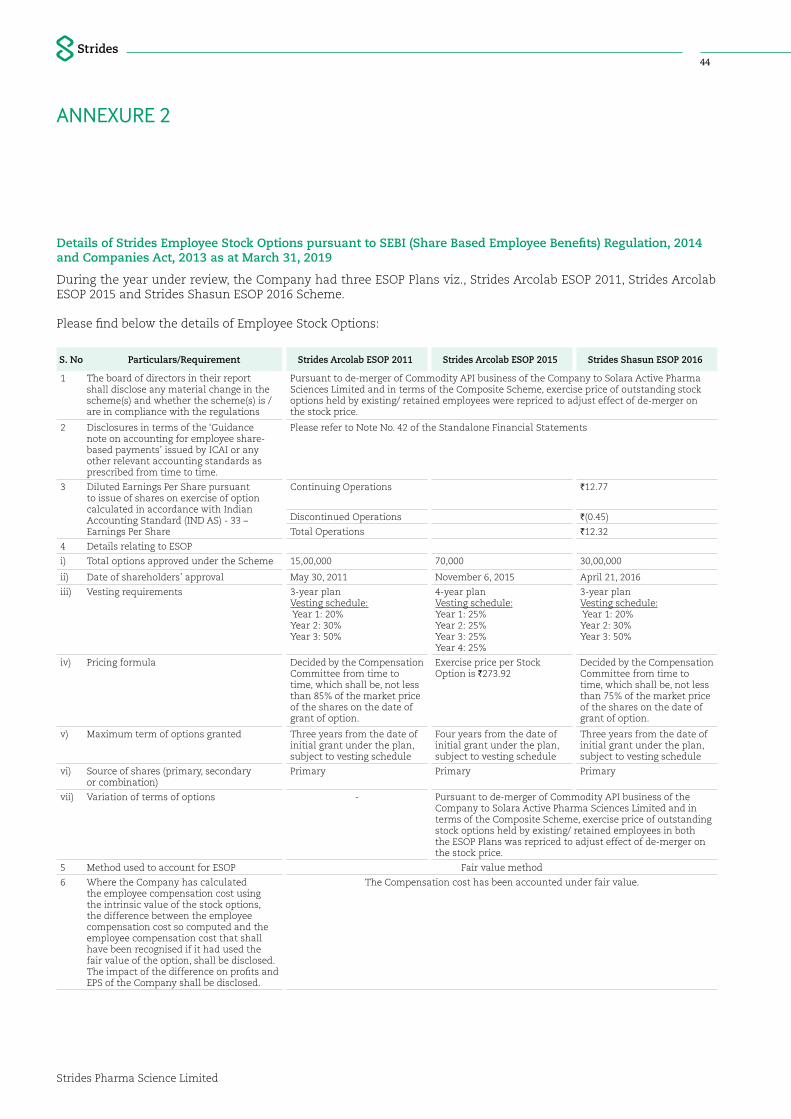
Strides Pharma Science Limited
44
Details of Strides Employee Stock Options pursuant to SEBI (Share Based Employee Benefits) Regulation, 2014 and Companies Act, 2013 as at March 31, 2019
During the year under review, the Company had three ESOP Plans viz., Strides Arcolab ESOP 2011, Strides Arcolab ESOP 2015 and Strides Shasun ESOP 2016 Scheme.
Please find below the details of Employee Stock Options:
S. No Particulars/Requirement Strides Arcolab ESOP 2011 Strides Arcolab ESOP 2015 Strides Shasun ESOP 2016
1 The board of directors in their report shall disclose any material change in the scheme(s) and whether the scheme(s) is / are in compliance with the regulations
Pursuant to de-merger of Commodity API business of the Company to Solara Active Pharma Sciences Limited and in terms of the Composite Scheme, exercise price of outstanding stock options held by existing/ retained employees were repriced to adjust effect of de-merger on the stock price.
2 Disclosures in terms of the ‘Guidance note on accounting for employee share-based payments’ issued by ICAI or any other relevant accounting standards as prescribed from time to time.
Please refer to Note No. 42 of the Standalone Financial Statements
3 Diluted Earnings Per Share pursuant to issue of shares on exercise of option calculated in accordance with Indian Accounting Standard (IND AS) - 33 – Earnings Per Share
Continuing Operations `12.77
Discontinued Operations `(0.45)
Total Operations `12.32
4 Details relating to ESOP
i) Total options approved under the Scheme 15,00,000 70,000 30,00,000
ii) Date of shareholders’ approval May 30, 2011 November 6, 2015 April 21, 2016
iii) Vesting requirements 3-year plan Vesting schedule: Year 1: 20%Year 2: 30%Year 3: 50%
4-year planVesting schedule:Year 1: 25%Year 2: 25%Year 3: 25%Year 4: 25%
3-year planVesting schedule: Year 1: 20%Year 2: 30%Year 3: 50%
iv) Pricing formula
Decided by the Compensation Committee from time to time, which shall be, not less than 85% of the market price of the shares on the date of grant of option.
Exercise price per Stock Option is `273.92
Decided by the Compensation Committee from time to time, which shall be, not less than 75% of the market price of the shares on the date of grant of option.
v) Maximum term of options granted Three years from the date of initial grant under the plan, subject to vesting schedule
Four years from the date of initial grant under the plan, subject to vesting schedule
Three years from the date of initial grant under the plan, subject to vesting schedule
vi) Source of shares (primary, secondary or combination)
Primary Primary Primary
vii) Variation of terms of options - Pursuant to de-merger of Commodity API business of the Company to Solara Active Pharma Sciences Limited and in terms of the Composite Scheme, exercise price of outstanding stock options held by existing/ retained employees in both the ESOP Plans was repriced to adjust effect of de-merger on the stock price.
5 Method used to account for ESOP Fair value method
6 Where the Company has calculated the employee compensation cost using the intrinsic value of the stock options, the difference between the employee compensation cost so computed and the employee compensation cost that shall have been recognised if it had used the fair value of the option, shall be disclosed. The impact of the difference on profits and EPS of the Company shall be disclosed.
The Compensation cost has been accounted under fair value.
ANNEXURE 2
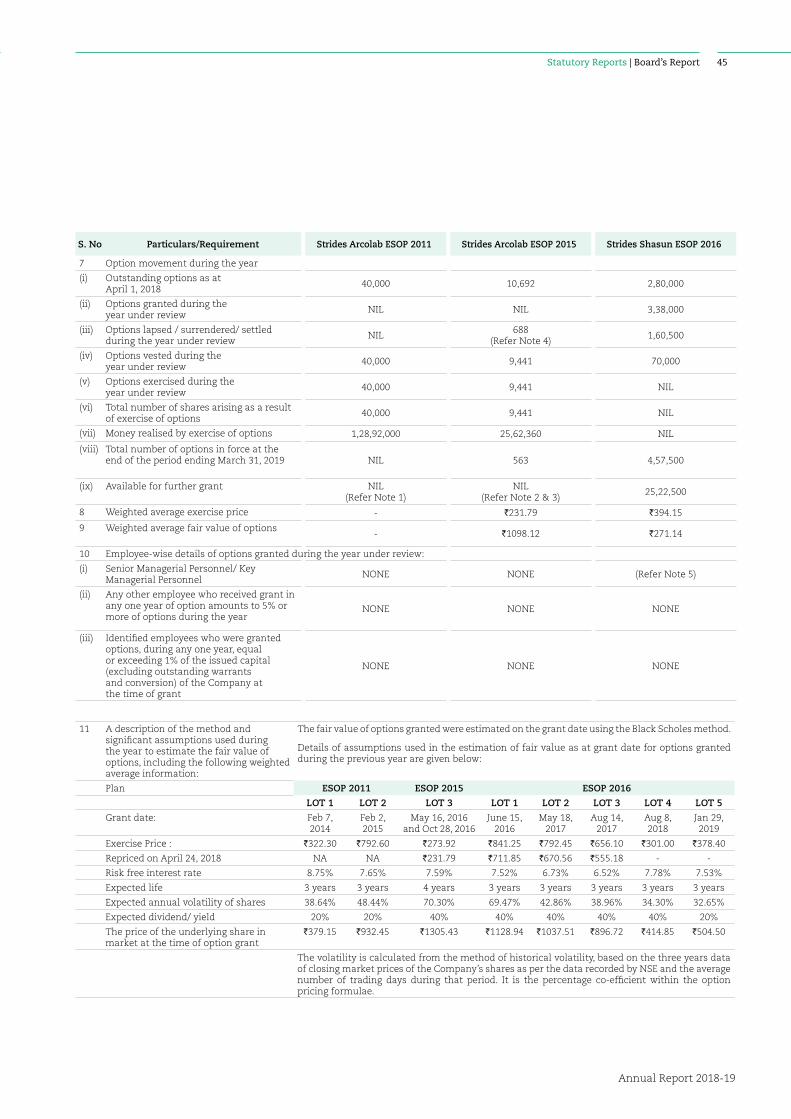
Statutory Reports | Board’s Report
Annual Report 2018-19
45
S. No Particulars/Requirement Strides Arcolab ESOP 2011 Strides Arcolab ESOP 2015 Strides Shasun ESOP 2016
7 Option movement during the year
(i) Outstanding options as atApril 1, 2018
40,000 10,692 2,80,000
(ii) Options granted during the year under review
NIL NIL 3,38,000
(iii) Options lapsed / surrendered/ settled during the year under review
NIL688
(Refer Note 4)1,60,500
(iv) Options vested during the year under review
40,000 9,441 70,000
(v) Options exercised during the year under review
40,000 9,441 NIL
(vi) Total number of shares arising as a result of exercise of options
40,000 9,441 NIL
(vii) Money realised by exercise of options 1,28,92,000 25,62,360 NIL
(viii) Total number of options in force at the end of the period ending March 31, 2019 NIL 563 4,57,500
(ix) Available for further grant NIL (Refer Note 1)
NIL (Refer Note 2 & 3)
25,22,500
8 Weighted average exercise price - `231.79 `394.15
9 Weighted average fair value of options- `1098.12 `271.14
10 Employee-wise details of options granted during the year under review:
(i) Senior Managerial Personnel/ Key Managerial Personnel
NONE NONE (Refer Note 5)
(ii) Any other employee who received grant in any one year of option amounts to 5% or more of options during the year
NONE NONE NONE
(iii) Identified employees who were granted options, during any one year, equal or exceeding 1% of the issued capital (excluding outstanding warrants and conversion) of the Company at the time of grant
NONE NONE NONE
11 A description of the method and significant assumptions used during the year to estimate the fair value of options, including the following weighted average information:
The fair value of options granted were estimated on the grant date using the Black Scholes method.
Details of assumptions used in the estimation of fair value as at grant date for options granted during the previous year are given below:
Plan ESOP 2011 ESOP 2015 ESOP 2016
LOT 1 LOT 2 LOT 3 LOT 1 LOT 2 LOT 3 LOT 4 LOT 5
Grant date: Feb 7, 2014
Feb 2, 2015
May 16, 2016 and Oct 28, 2016
June 15, 2016
May 18, 2017
Aug 14, 2017
Aug 8, 2018
Jan 29, 2019
Exercise Price : `322.30 `792.60 `273.92 `841.25 `792.45 `656.10 `301.00 `378.40
Repriced on April 24, 2018 NA NA `231.79 `711.85 `670.56 `555.18 - -
Risk free interest rate 8.75% 7.65% 7.59% 7.52% 6.73% 6.52% 7.78% 7.53%
Expected life 3 years 3 years 4 years 3 years 3 years 3 years 3 years 3 years
Expected annual volatility of shares 38.64% 48.44% 70.30% 69.47% 42.86% 38.96% 34.30% 32.65%
Expected dividend/ yield 20% 20% 40% 40% 40% 40% 40% 20%
The price of the underlying share in market at the time of option grant
`379.15 `932.45 `1305.43 `1128.94 `1037.51 `896.72 `414.85 `504.50
The volatility is calculated from the method of historical volatility, based on the three years data of closing market prices of the Company’s shares as per the data recorded by NSE and the average number of trading days during that period. It is the percentage co-efficient within the option pricing formulae.

Strides Pharma Science Limited
46
Note 1 All outstanding options issued under Strides ESOP 2011 were exercised during the year. The Plan was as per the erstwhile SEBI (Employee Stock Option Scheme and Employee Stock Purchase Scheme) Guidelines. Considering the revised ESOP Regulation, the Nomination and Remuneration Committee resolved to terminate this Plan.
Note 2 ESOP 2015 was an exclusive Plan for the employees of erstwhile Shasun Pharmaceuticals and its subsidiaries which merged into Strides. Under the Plan, 30,625 options were granted to employees of erstwhile Shasun and 6,813 options were granted to employee of its subsidiary.
Stock Options as per the Scheme of Arrangement to all Eligible Employees of erstwhile Shasun have already been granted and no further grant is pending under the Plan.
Note 3 Pursuant to Demerger of Commodity API business of the Company to Solara Active Pharma Sciences Limited, the Company accelerated vesting of 9,128 stock options under the Strides Arcolab ESOP 2015 Plan held by identified employees who were transferred to Solara. Out of the accelerated options, 8,878 options were exercised by the employees and balance 250 options were lapsed. However, the outstanding options under the ESOP 2015 shall continue to vest as per the offer letter granted to identified employees of the Company.
Note 4 R&D business of the Company viz., Shasun Research Centre (SRC) in Chennai was divested to Solara Active Pharma Sciences Limited (Solara) effective April 1, 2018.
As part of the transaction, an employee holding 688 stock options under Strides Arcolab ESOP 2015 Plan was transferred to Solara. In terms of the ESOP Plan, the employee was provided a cash compensation for the outstanding stock options held by him.
Note 5 Employee wise details of options granted during the year under review:
Name of Employee Designation Category No. of options Exercise price(in `)
Plan name
1 Badree Komandur Executive Director – Finance & Group CFO KMP 25,000 301.00 ESOP 20162 Manjula Ramamurthy Company Secretary KMP 5,000 301.00 ESOP 20163 Shashank Sinha CEO - International Operations SMP 25,000 301.00 ESOP 20164 Ramaraju PVS COO - Global Head Manufacturing SMP 25,000 301.00 ESOP 20165 Umesh Kale CQO -Quality Assurance SMP 25,000 301.00 ESOP 20166 Amit Gupta Vice President – Finance SMP 7,500 301.00 ESOP 20167 Vikesh Kumar Vice President – Finance SMP 7,500 301.00 ESOP 2016
Kindly note that this report is also available at http://www.strides.com/investor-financial.html
For and on behalf of the Board of Directors
Deepak VaidyaNon-Executive Director
Date: May 10, 2019 Chairperson of the BoardPlace: Bengaluru DIN: 00337276

Statutory Reports | Board’s Report
Annual Report 2018-19
47
Details pursuant to Section 197 of the Companies Act, 2013 read with Rule 5(1) of the Companies (Appointment and Remuneration of Managerial Personnel) Rules, 2014
a The ratio of the remuneration of each director to the median remuneration of the employees of the Company for the financial year ending March 31, 2019
As at March 31, 2019, the Board comprises of 7 Directors - comprising of 2 Executive Directors, 4 Independent Directors and 1 Non-Executive Director.
The Non-Executive & Independent Directors receive sitting fees of `100,000/- for attending each meeting of the Board and Audit Committee.
The ratio of remuneration of the Executive Directors of the Company to the median remuneration of the employees of the Company for the Financial Year ended March 31, 2019 are as below:
1) Mr. Arun Kumar, Managing Director & Group CEO – 1:119
2) Mr. Badree Komandur, Executive Director, Finance & Group CFO – 1:63
The median remuneration* for the period under review is `502,436/- per annum.
*One-time payment made to employees for individual projects is excluded in calculation of above median remuneration.
b. The percentage increase in remuneration of each Director, Chief Executive Officer, Chief Financial Officer, Company Secretary in the Financial Year ending March 31, 2019:
# Particulars % Increase
1Mr. Arun Kumar
Managing Director & Group CEO N.A.
2Badree Komandur
Executive Director, Finance & Group CFO0%
3Manjula Ramamurthy
Company Secretary8%
c. The percentage increase in the median remuneration of employees in the financial year ending March 31, 2019
3%
d. The number of permanent employees on the rolls of Company as at March 31, 2019
2,036 Employees
e. Average percentile increase already made in the salaries of employees other than the managerial personnel in the last financial year and its comparison with the percentile increase in the managerial remuneration and justification thereof and point out if there are any exceptional circumstances for increase in the managerial remuneration
The average annual increase across the organisation was around 8%.
The Company affirms remuneration to the Directors and Key Managerial Personnel is as per the remuneration policy of the Company.
For and on behalf of the Board of Directors
Deepak VaidyaNon-Executive Director
Date: May 10, 2019 Chairperson of the BoardPlace: Bengaluru DIN: 00337276
ANNEXURE 3
Strides Pharma Science Limited
48
ACTIVITIES UNDER CORPORATE SOCIAL RESPONSIBILITY FOR FY 2018-19
1. Introduction
At Strides, social responsibility is an integral part of the organisational culture. The Company strives to drive its social responsibility initiatives beyond ‘compliance’ and create sustainable value for the community. The Company endeavours to create a lasting impact in the domain of health, education and employability through need-based interventions.
Strides is focused on developing a socially responsible ecosystem for inclusive and equitable growth through several initiatives that enable the marginalised communities to transform their vulnerability and aspirations into their strength and actuality.
During the year, it pursued several projects undertaken in the previous Financial Years and initiated some new projects as well.
2. The Composition of the CSR Committee as at the date of this report is as under:# Name of the Director Category
1 Sangita Reddy Chairperson2 Homi Rustam Khusrokhan Member3 Arun Kumar Member4 Deepak Vaidya Member5 Badree Komandur Member
3. Average Net Profit of the Company for the last three Financial Years is: `1,205.55 Million
4. The prescribed CSR Expenditure, which is two per cent of the amount mentioned in 3 above, is `24.11 Million for FY 2018-19
5. Details of CSR spend during the FY 2018-19
The Total CSR expenditure for FY 2018-19 stood at `25.84* Million
# Particulars Amount (` in Million)
1 Prescribed CSR spend for the FY 2018-19 24.112 Total spend during the year under review
(Amount spent directly by Strides + Transferred to Strides Foundation)25.84
3 Amount unspent, if any -
ANNEXURE 4
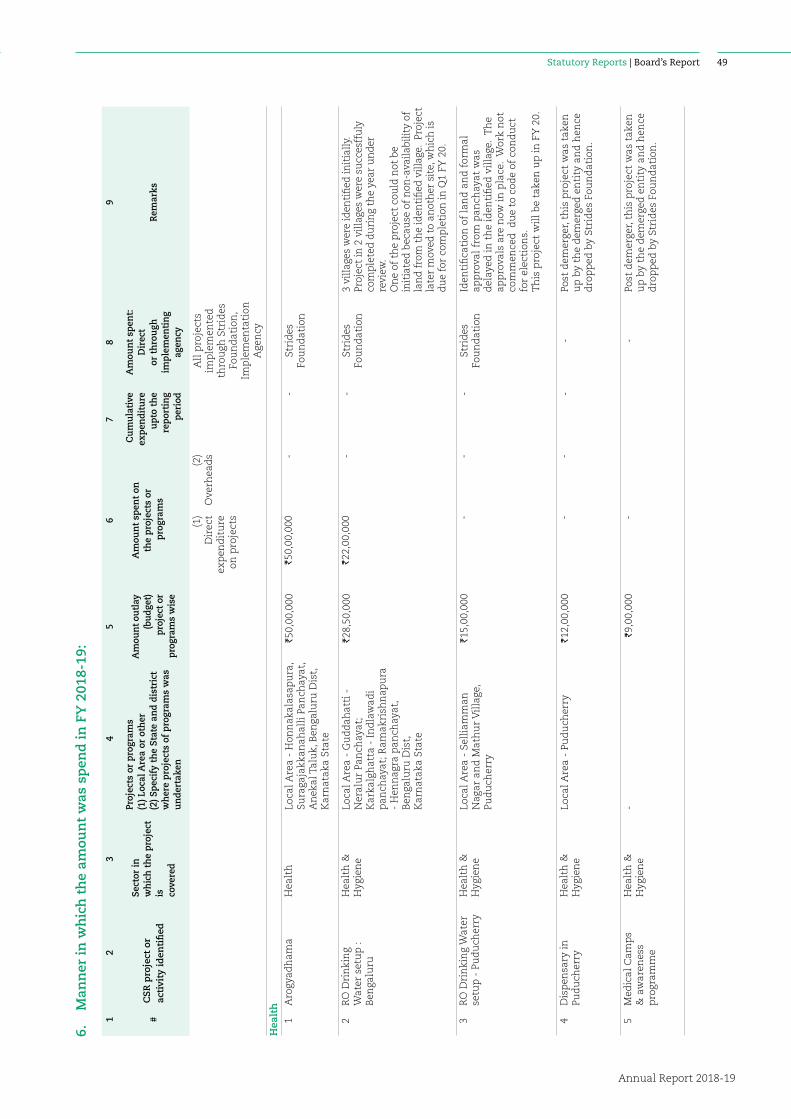
Statutory Reports | Board’s Report
Annual Report 2018-19
49
12
34
56
78
9
#C
SR
pro
ject
or
ac
tivi
ty i
den
tifi
ed
Sect
or in
w
hic
h t
he
proj
ect
is
cove
red
Proj
ects
or
prog
ram
s (1
) Loc
al A
rea
or o
ther
(2
) Spe
cify
th
e St
ate
and
dist
rict
w
her
e pr
ojec
ts o
f pr
ogra
ms
was
u
nde
rtak
en
Am
oun
t ou
tlay
(b
udg
et)
proj
ect
or
prog
ram
s w
ise
Am
oun
t sp
ent
on
the
proj
ects
or
pro
gram
s
Cu
mu
l ati
ve
expe
ndi
ture
u
pto
the
repo
rtin
g pe
riod
Am
oun
t sp
ent:
D
irec
t
or t
hro
ugh
im
plem
enti
ng
ag
ency
Rem
arks
(1)
Dir
ect
exp
end
itu
re
on p
roje
cts
(2)
Ove
rhea
ds
All
pro
ject
s im
ple
men
ted
th
rou
gh S
trid
es
Fou
nd
atio
n,
Imp
lem
enta
tion
A
gen
cy
Hea
lth
1A
rogy
adh
ama
Hea
lth
Loca
l Are
a -
Hon
nak
alas
apu
ra,
Sura
gaja
kkan
ahal
li P
anch
ayat
, A
nek
al T
alu
k, B
enga
luru
Dis
t,
Kar
nat
aka
Stat
e
`50,
00,0
00`5
0,00
,000
-
-
Stri
des
Fo
un
dat
ion
2R
O D
rin
kin
g
Wat
er s
etu
p :
B
enga
luru
Hea
lth
&
Hyg
ien
eLo
cal A
rea
- G
ud
dah
atti
-
Ner
alu
r Pa
nch
ayat
; K
arka
lgh
atta
- I
nd
law
adi
pan
chay
at; R
amak
rish
nap
ura
-
Hen
nag
ra p
anch
ayat
, B
enga
luru
Dis
t,
Kar
nat
aka
Stat
e
`28,
50,0
00`2
2,00
,000
-
-
Stri
des
Fo
un
dat
ion
3
vill
ages
wer
e id
enti
fied
init
iall
y.
Proj
ect
in 2
vil
lage
s w
ere
succ
esff
uly
co
mp
lete
d d
uri
ng
the
year
un
der
re
view
. O
ne
of t
he
pro
ject
cou
ld n
ot b
e in
itia
ted
bec
ause
of
non
-ava
ilab
ilit
y of
la
nd
fro
m t
he
iden
tifi
ed v
illa
ge.
Proj
ect
late
r m
oved
to
anot
her
sit
e, w
hic
h is
d
ue
for
com
ple
tion
in Q
1 FY
20.
3R
O D
rin
kin
g W
ater
se
tup
- P
ud
uch
erry
Hea
lth
&H
ygie
ne
Loca
l Are
a -
Sell
iam
man
N
agar
an
d M
ath
ur
Vil
lage
, Pu
du
cher
ry
`15,
00,0
00 -
-
-
St
rid
es
Fou
nd
atio
n
Iden
tifi
cati
on o
f la
nd
an
d f
orm
al
app
rova
l fr
om p
anch
ayat
was
d
elay
ed in
th
e id
enti
fied
vil
lage
. T
he
app
rova
ls a
re n
ow in
pla
ce.
Wor
k n
ot
com
men
ced
du
e to
cod
e of
con
du
ct
for
elec
tion
s.
Th
is p
roje
ct w
ill
be
take
n u
p in
FY
20.
4D
isp
ensa
ry in
Pu
du
cher
ryH
ealt
h &
H
ygie
ne
Loca
l Are
a -
Pud
uch
erry
`12,
00,0
00 -
-
-
-
Post
dem
erge
r, th
is p
roje
ct w
as t
aken
u
p b
y th
e d
emer
ged
en
tity
an
d h
ence
d
rop
ped
by
Stri
des
Fou
nd
atio
n.
5M
edic
al C
amp
s
& a
war
enes
s p
rogr
amm
e
Hea
lth
&
Hyg
ien
e-
`9,0
0,00
0 -
-
Post
dem
erge
r, th
is p
roje
ct w
as t
aken
u
p b
y th
e d
emer
ged
en
tity
an
d h
ence
d
rop
ped
by
Stri
des
Fou
nd
atio
n.
6.
Man
ner
in
wh
ich
th
e am
oun
t w
as s
pen
d i
n F
Y 2
018-
19:
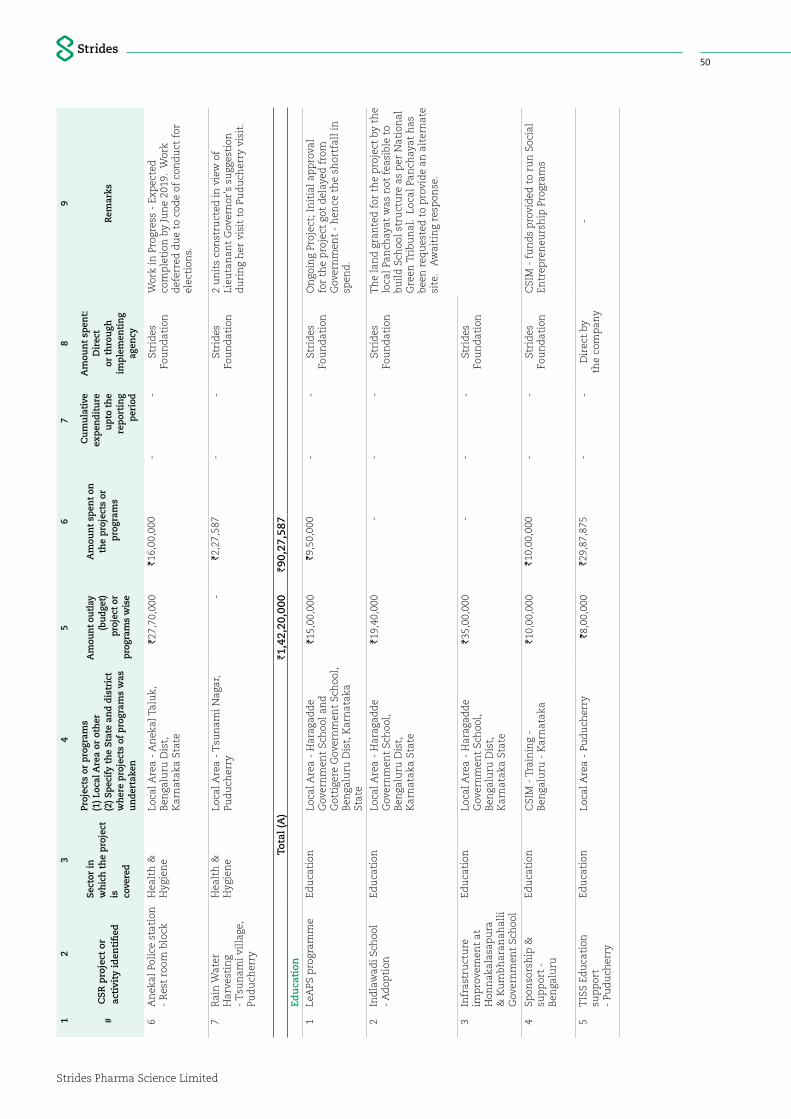
Strides Pharma Science Limited
501
23
45
67
89
#C
SR
pro
ject
or
ac
tivi
ty i
den
tifi
ed
Sect
or in
w
hic
h t
he
proj
ect
is
cove
red
Proj
ects
or
prog
ram
s (1
) Loc
al A
rea
or o
ther
(2
) Spe
cify
th
e St
ate
and
dist
rict
w
her
e pr
ojec
ts o
f pr
ogra
ms
was
u
nde
rtak
en
Am
oun
t ou
tlay
(b
udg
et)
proj
ect
or
prog
ram
s w
ise
Am
oun
t sp
ent
on
the
proj
ects
or
pro
gram
s
Cu
mu
l ati
ve
expe
ndi
ture
u
pto
the
repo
rtin
g pe
riod
Am
oun
t sp
ent:
D
irec
t
or t
hro
ugh
im
plem
enti
ng
ag
ency
Rem
arks
6A
nek
al P
olic
e st
atio
n
- R
est
room
blo
ckH
ealt
h &
Hyg
ien
eLo
cal A
rea
- A
nek
al T
alu
k,
Ben
galu
ru D
ist,
K
arn
atak
a St
ate
`27,
70,0
00`1
6,00
,000
-
-
Stri
des
Fo
un
dat
ion
W
ork
in P
rogr
ess
- Ex
pec
ted
co
mp
leti
on b
y Ju
ne
2019
. W
ork
def
erre
d d
ue
to c
ode
of c
ond
uct
for
el
ecti
ons.
7R
ain
Wat
er
Har
vest
ing
- T
sun
ami v
illa
ge,
Pud
uch
erry
Hea
lth
&H
ygie
ne
Loca
l Are
a -
Tsu
nam
i Nag
ar,
Pud
uch
erry
-
`2,2
7,58
7 -
-
St
rid
es
Fou
nd
atio
n
2 u
nit
s co
nst
ruct
ed in
vie
w o
f Li
euta
nan
t G
over
nor
's s
ugg
esti
on
du
rin
g h
er v
isit
to
Pud
uch
erry
vis
it.
Tota
l (A
)`1
,42,
20,0
00`9
0,27
,587
Edu
cati
on1
LeA
PS p
rogr
amm
e Ed
uca
tion
Loca
l Are
a -
Har
agad
de
G
over
nm
ent
Sch
ool
and
G
otti
gere
Gov
ern
men
t Sc
hoo
l, B
enga
luru
Dis
t, K
arn
atak
a St
ate
`15,
00,0
00`9
,50,
000
-
-
Stri
des
Fo
un
dat
ion
On
goin
g Pr
ojec
t; I
nit
ial
app
rova
l fo
r th
e p
roje
ct g
ot d
elay
ed f
rom
G
over
nm
ent
- h
ence
th
e sh
ortf
all
in
spen
d.
2In
dla
wad
i Sch
ool
- A
dop
tion
Edu
cati
onLo
cal A
rea
- H
arag
add
e
Gov
ern
men
t Sc
hoo
l,
Ben
galu
ru D
ist,
K
arn
atak
a St
ate
`19,
40,0
00 -
-
-
St
rid
es
Fou
nd
atio
nT
he
lan
d g
ran
ted
for
th
e p
roje
ct b
y th
e lo
cal
Pan
chay
at w
as n
ot f
easi
ble
to
bu
ild
Sch
ool
stru
ctu
re a
s p
er N
atio
nal
G
reen
Tri
bu
nal
. Lo
cal
Pan
chay
at h
as
bee
n r
equ
este
d t
o p
rovi
de
an a
lter
nat
e si
te.
Aw
aiti
ng
resp
onse
.
3In
fras
tru
ctu
re
imp
rove
men
t at
H
onn
akal
asap
ura
&
Ku
mb
har
anah
alli
G
over
nm
ent
Sch
ool
Edu
cati
onLo
cal A
rea
- H
arag
add
e
Gov
ern
men
t Sc
hoo
l,
Ben
galu
ru D
ist,
K
arn
atak
a St
ate
`35,
00,0
00 -
-
-
St
rid
es
Fou
nd
atio
n
4Sp
onso
rsh
ip &
su
pp
ort
- B
enga
luru
Edu
cati
onC
SIM
- T
rain
ing
-
Ben
galu
ru -
Kar
nat
aka
`10,
00,0
00`1
0,00
,000
-
-
Stri
des
Fo
un
dat
ion
CSI
M -
fu
nd
s p
rovi
ded
to
run
Soc
ial
Entr
epre
neu
rsh
ip P
rogr
ams
5T
ISS
Edu
cati
on
sup
por
t
- Pu
du
cher
ry
Edu
cati
onLo
cal A
rea
- Pu
du
cher
ry`8
,00,
000
`29,
87,8
75 -
-
D
irec
t by
th
e co
mp
any
-
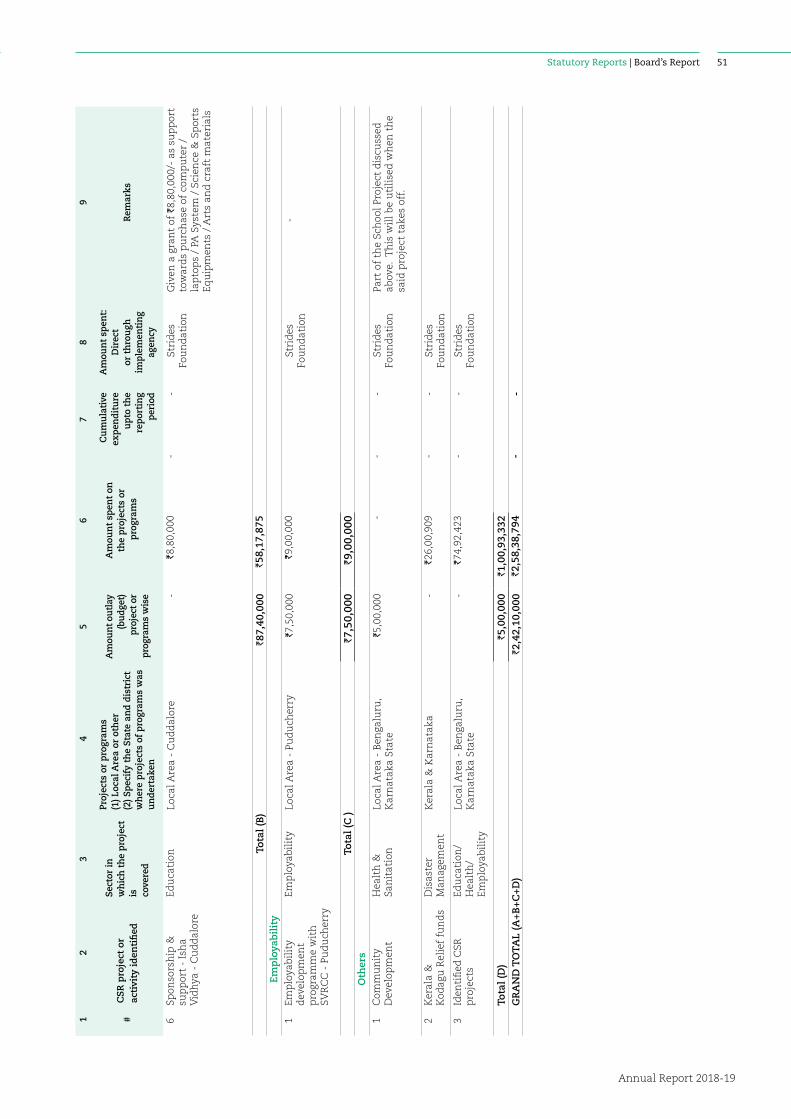
Statutory Reports | Board’s Report
Annual Report 2018-19
51
12
34
56
78
9
#C
SR
pro
ject
or
ac
tivi
ty i
den
tifi
ed
Sect
or in
w
hic
h t
he
proj
ect
is
cove
red
Proj
ects
or
prog
ram
s (1
) Loc
al A
rea
or o
ther
(2
) Spe
cify
th
e St
ate
and
dist
rict
w
her
e pr
ojec
ts o
f pr
ogra
ms
was
u
nde
rtak
en
Am
oun
t ou
tlay
(b
udg
et)
proj
ect
or
prog
ram
s w
ise
Am
oun
t sp
ent
on
the
proj
ects
or
pro
gram
s
Cu
mu
l ati
ve
expe
ndi
ture
u
pto
the
repo
rtin
g pe
riod
Am
oun
t sp
ent:
D
irec
t
or t
hro
ugh
im
plem
enti
ng
ag
ency
Rem
arks
6Sp
onso
rsh
ip &
su
pp
ort
- Is
ha
Vid
hya
- C
ud
dal
ore
Edu
cati
onLo
cal A
rea
- C
ud
dal
ore
-
`8,8
0,00
0 -
-
St
rid
es
Fou
nd
atio
nG
iven
a g
ran
t of
`8,
80,0
00/-
as
sup
por
t to
war
ds
pu
rch
ase
of c
omp
ute
r /
lap
top
s /
PA S
yste
m /
Sci
ence
& S
por
ts
Equ
ipm
ents
/ A
rts
and
cra
ft m
ater
ials
Tota
l (B
)`8
7,40
,000
`58,
17,8
75
Em
plo
yab
ilit
y 1
Emp
loya
bil
ity
dev
elop
men
t p
rogr
amm
e w
ith
SV
RC
C -
Pu
du
cher
ry
Emp
loya
bil
ity
Loca
l Are
a -
Pud
uch
erry
`7,5
0,00
0`9
,00,
000
Stri
des
Fo
un
dat
ion
-
Tota
l (C
)`7
,50,
000
`9,0
0,00
0O
ther
s1
Com
mu
nit
y
Dev
elop
men
tH
ealt
h &
Sa
nit
atio
nLo
cal A
rea
- B
enga
luru
, K
arn
atak
a St
ate
`5,0
0,00
0 -
-
-
St
rid
es
Fou
nd
atio
nPa
rt o
f th
e Sc
hoo
l Pr
ojec
t d
iscu
ssed
ab
ove.
Th
is w
ill
be
uti
lise
d w
hen
th
e sa
id p
roje
ct t
akes
off
.
2K
eral
a &
K
odag
u R
elie
f fu
nd
sD
isas
ter
M
anag
emen
tK
eral
a &
Kar
nat
aka
-
`26,
00,9
09 -
-
St
rid
es
Fou
nd
atio
n
3Id
enti
fied
CSR
p
roje
cts
Edu
cati
on/
Hea
lth
/ Em
plo
yab
ilit
y
Loca
l Are
a -
Ben
galu
ru,
Kar
nat
aka
Stat
e-
`74,
92,4
23-
-St
rid
es
Fou
nd
atio
n
Tota
l (D
)`5
,00,
000
`1,0
0,93
,332
GR
AN
D T
OT
AL
(A+B
+C+D
)`2
,42,
10,0
00`2
,58,
38,7
94 -
-
Strides Pharma Science Limited
52
7. Brief on the projects taken up
A. Health 1. Arogyadhama – State of the art Primary
Health Centre: With its untiring service to the people of the
surrounding 12 villages and extending beyond, Arogyadhama has completed its 4 years of service in Curative, preventive and promotive healthcare / services at Honnakalasapura, Suragajakkanahalli.
Equipped with state-of-the-art equipment viz X-ray, Scan, laboratory and minor OT along with out-patient facilities, Arogyadhama has other specialists facilities like Ophthalmology, Gynaecology, Paediatrics, Dental Treatments, Pharmacy and day care. In the past year it has catered to more than 10,500 patients.
Arogyadhama has taken up the cause of spreading awareness on different facets of health and hygiene like importance of clean environment, symptoms of different diseases such as Tuberculosis, Leprosy, H1N1, Malaria etc and their proactive treatment, persuading the community to keep the environment clean, identifying diabetes and hypertension patients, counselling and administering regular medicines are some of Arogyadhama’s routine activities in addition to providing healthcare at the centre.
Milestones for FY 2018-19 :
• Over 2800 students covered from 44 schools from the panchayats of Suragajakkanahalli, Indlawadi, Haragadde and Hennagra
• Eye Camps - covered 4 villages - 8 successful cataract surgeries done
• Tuberculosis survey conducted in 11 villages - 9 positive cases being treated at Arogyadhama
• Malaria camp conducted in 11 villages via blood smear test - no positive cases found
• Leprosy camp conducted at 5 villages - covered 631 families - 18 suspected sent for further diagnosis
• Awareness Camp on H1N1 – covered 3000+ population.
• H1N1 special camp was conducted - 600 people covered - 3 positive cases are being treated.
• Polio vaccines administered to 340 kids in 11 villages. This programme was in collaboration with Government PHC
• 2 HIV positive cases found referred to the government hospital for further investigations
Arogyadhama has won a lot of appreciation and positive feedback from the surrounding villages, the Panchayat and also from the Government PHCs & Doctors.
2. RO Water plants
To avoid water borne diseases and to provide accessibility to safe drinking water, Strides has made permanent arrangements for safe drinking water to over 9000 people at Suragajakkanahalli, Hennagra and Neralur panchayats in Anekal Taluk, Bengaluru. Till date, Strides Foundation, has built 8 self-sustainable RO water units, with 2000 litres per hour capacity each. We have commissioned new units at Guddahatti, Honnakalasapura and Ramakrishnapura this year.
B. Education: 1. LeAPS : Leadership Adoption Programme at Schools,
popularly known as LeAPS programme is designed with an aim to provide life skills training to children of Government schools. It helps and motivate students through:
• Innovative training methodologies
• Life Application that takes the children beyond their classrooms
• A highly stimulating and totally fun experience
The programme involves Children, Parents and Teachers and looks at overall development of the child.
Continuing our efforts, 250 students were covered under this programme from Haragadde Government Primary School. Recognising the impact of the programme, this year we have extended and covered 254 students from Government High School, Haragadde for 8th & 9th standard students
“Examination Strategy” workshop for class 10 students at Haragadde Government High School conducted on February 4, 2019 – 75 students were benefitted
Statutory Reports | Board’s Report
Annual Report 2018-19
53
For and on behalf of the Board of Directors
Sangita Reddy Deepak VaidyaIndependent Director Non-Executive Director
Date: May 10, 2019 Chairperson of the CSR Committee Chairperson of the BoardPlace: Bengaluru DIN - 00006285 DIN – 00337276
Responsibility Statement:We hereby confirm that the implementation of the policy and monitoring of the CSR projects and activities is in compliance with the CSR objectives and CSR Policy of the Company.
Educational tour for Students of Government School of Haragadde and Suragajakkanahalli was organised. A total of 250 students enjoyed and were benefitted from the tour took part,
• Class 5 to 7 went to Hampi, Badami, Aihole & Pattadkal – theme “History” – learning Vijayanagar empire and Chalukyan dynasty – 130 students
• Class 2 to 4 to Government Aquarium and Cubbon park – theme “Marine life and nature” – 120 students participated
2. Sponsorship Support Isha Vidhya:
With our focus on quality Education, a grant of `8,80,000/- was given to Isha Vidhya as support towards purchase of the following for their school at Cuddalore:
• Computer / laptops
• Science & Sports Equipment
• Arts and craft Materials
Centre for social initiatives and management (CSIM):
To support Social Entrepreneurship programs a grant of `10 Lakh was given to CSIM.
C. Employability 1. Vocational Skill Development: As part of our continuing programmes to
provide vocational skills to the fisherman community and other lesser privileged villages
at Puducherry, we are able to launch the 3rd batch of 100 students. It is a matter of pride that we achieved success in empowering the local youths for employment through placement of 194 students out of 200 in our last two batches.
Also, Employment Empowerment Programme is being organised in partnership with Swami Vivekananda Rural Community College (SVRCC), where 100 students will be trained in several job-led courses, with a holistic approach, to make them responsible citizens.
D. Relief and rehabilitation 1. Kerala and Kodagu relief: Total of `50 Lakh was contributed towards the flood
disaster at Kerala & Kodagu in during August 2018 for the cause as under:
• `39 Lakh to the Kerala CMDRF
• `6 Lakh to the Karnataka Chief Minister's Calamity Relief Fund for the relief work at Kodagu (Coorg)
• `5 Lakh to Isha Foundation, towards the relief supplies to the stranded population of Kerala.
• `26 Lakh was contributed from CSR funds.
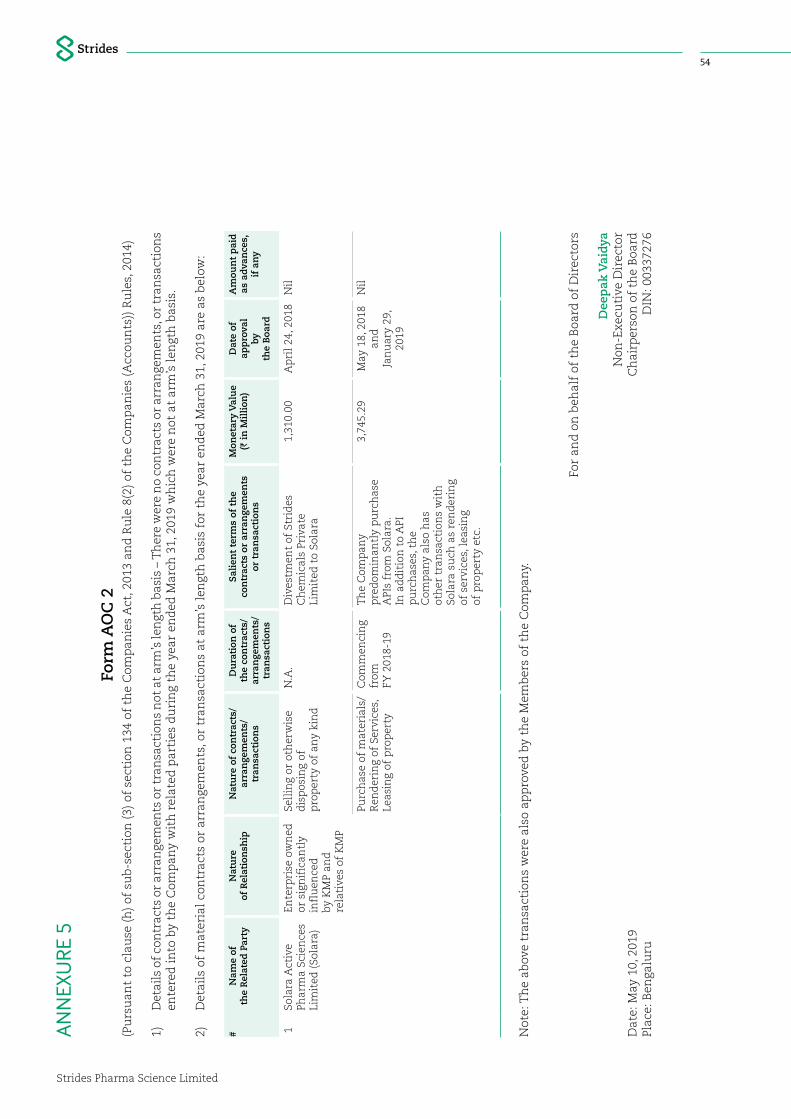
Strides Pharma Science Limited
54
Form
AO
C 2
(Pu
rsu
ant
to c
lau
se (
h)
of s
ub
-sec
tion
(3)
of
sect
ion
134
of
the
Com
pan
ies
Act
, 201
3 an
d R
ule
8(2
) of
th
e C
omp
anie
s (A
ccou
nts
)) R
ule
s, 2
014)
1)
Det
ails
of
con
trac
ts o
r ar
ran
gem
ents
or
tran
sact
ion
s n
ot a
t ar
m’s
len
gth
bas
is –
Th
ere
wer
e n
o co
ntr
acts
or
arra
nge
men
ts, o
r tr
ansa
ctio
ns
ente
red
into
by
the
Com
pan
y w
ith
rel
ated
par
ties
du
rin
g th
e ye
ar e
nd
ed M
arch
31,
201
9 w
hic
h w
ere
not
at
arm
’s l
engt
h b
asis
.
2)
Det
ails
of
mat
eria
l co
ntr
acts
or
arra
nge
men
ts, o
r tr
ansa
ctio
ns
at a
rm’s
len
gth
bas
is f
or t
he
year
en
ded
Mar
ch 3
1, 2
019
are
as b
elow
:
#N
ame
of
the
Rel
ated
Par
ty
Nat
ure
of
Rel
atio
nsh
ipN
atu
re o
f co
ntr
acts
/ ar
ran
gem
ents
/ tr
ansa
ctio
ns
Du
rati
on o
f th
e co
ntr
acts
/ ar
ran
gem
ents
/ tr
ansa
ctio
ns
Sal
ien
t te
rms
of t
he
con
trac
ts o
r ar
ran
gem
ents
or
tra
nsa
ctio
ns
Mon
etar
y V
alu
e (`
in
Mil
lion
)D
ate
of
app
rova
l by
th
e B
oard
Am
oun
t p
aid
as
ad
van
ces,
if
an
y
1So
lara
Act
ive
Phar
ma
Scie
nce
s Li
mit
ed (
Sola
ra)
Ente
rpri
se o
wn
ed
or s
ign
ific
antl
y in
flu
ence
d
by K
MP
and
re
lati
ves
of K
MP
Sell
ing
or o
ther
wis
e d
isp
osin
g of
p
rop
erty
of
any
kin
d
N.A
.D
ives
tmen
t of
Str
ides
C
hem
ical
s Pr
ivat
e Li
mit
ed t
o So
lara
1,31
0.00
Ap
ril
24, 2
018
Nil
Purc
has
e of
mat
eria
ls/
Ren
der
ing
of S
ervi
ces,
Le
asin
g of
pro
per
ty
Com
men
cin
g fr
om
FY 2
018-
19
Th
e C
omp
any
pre
dom
inan
tly
pu
rch
ase
API
s fr
om S
olar
a.
In a
dd
itio
n t
o A
PI
pu
rch
ases
, th
e C
omp
any
also
has
ot
her
tra
nsa
ctio
ns
wit
h
Sola
ra s
uch
as
ren
der
ing
of s
ervi
ces,
lea
sin
g of
pro
per
ty e
tc.
3,74
5.29
May
18,
201
8 an
d
Jan
uar
y 29
, 20
19
Nil
Not
e: T
he
abov
e tr
ansa
ctio
ns
wer
e al
so a
pp
rove
d b
y th
e M
emb
ers
of t
he
Com
pan
y.
AN
NEX
URE
5
For
and
on
beh
alf
of t
he
Boa
rd o
f D
irec
tors
Dee
pak
Vai
dya
Dat
e: M
ay 1
0, 2
019
Non
-Exe
cuti
ve D
irec
tor
Ch
airp
erso
n o
f th
e B
oard
Plac
e: B
enga
luru
DIN
: 003
3727
6
Statutory Reports | Board’s Report
Annual Report 2018-19
55
To,The Members,Strides Pharma Science Limited (formerly Strides Shasun Limited) CIN: L24230MH1990PLC057062
Regd. Office:201, ‘Devavrata’, Sector 17Vashi, Navi Mumbai – 400 703 Maharashtra
Corporate Office:Strides House, BilekahalliBannerghatta RoadBengaluru – 560 076Karnataka
We have conducted the secretarial audit of the compliance of applicable statutory provisions and the adherence to good corporate practices by ‘Strides Pharma Science Limited’ (‘the Company’). Secretarial Audit was conducted in a manner that provided us a reasonable basis for evaluating the corporate conducts/statutory compliances and expressing our opinion thereon.
Based on our verification of the books, papers, minute books, forms and returns filed and other records maintained by the company and also the information provided by the Company, its officers, agents and authorised representatives during the conduct of secretarial audit, we hereby report that in our opinion, the Company has, during the audit period covering the Financial Year ended on 31st March 2019 complied with the statutory provisions listed hereunder and also that the Company has proper Board processes and compliance mechanism in place to the extent, in the manner and subject to the reporting made hereinafter.
We have examined the books, papers, minute books, forms and returns filed and other records maintained by the Company for the Financial Year ended on 31st March 2019 according to the provisions of:
1) The Companies Act, 2013 (the Act) and the rules made thereunder.
2) The Securities Contracts (Regulation) Act, 1956 (SCRA) and the rules made thereunder.
Form No. MR-3Secretarial Audit Report
For the Financial Year ended March 31, 2019
[Pursuant to section 204(1) of the Companies Act, 2013 and rule No.9 of the Companies (Appointment and Remuneration Personnel) Rules, 2014]
3) The Depositories Act, 1996 and the Regulations and Bye-laws framed thereunder.
4) Foreign Exchange Management Act, 1999 (FEMA) and the rules and regulations made there under to the extent of Foreign Direct Investment and Overseas Direct Investment.
5) The Securities and Exchange Board of India (Registrars to an Issue and Share Transfer Agents) Regulations, 1993 regarding the Companies Act and dealing with client.
6) The following Regulations and Guidelines prescribed under the Securities and Exchange Board of India Act, 1992 (SEBI Act):
a) The Securities and Exchange Board of India (Substantial Acquisition of Shares and Takeovers) Regulations, 2011.
b) The Securities and Exchange Board of India (Prohibition of Insider Trading) Regulations, 2015.
c) The Securities and Exchange Board of India (Share Based Employee Benefits) Regulations, 2014.
During the period under review the Company has complied with the provisions of the Act, Rules, Regulations, Guidelines etc. mentioned above.
We further report that, there were no events/ actions in pursuance of the following requiring compliance thereof by the Company during the Audit period.
1) The Securities and Exchange Board of India (Issue of Capital and Disclosure Requirements) Regulations, 2009.
2) The Securities and Exchange Board of India (Issue and Listing of Debt Securities) Regulations, 2008.
3) The Securities and Exchange Board of India (Delisting of Equity Shares) Regulations, 2009
4) The Securities and Exchange Board of India (Buyback of Securities) Regulations, 1998.
ANNEXURE 6
Strides Pharma Science Limited
56
We have also examined compliance with the applicable clauses of the following:
1) Secretarial Standards issued by the Institute of Company Secretaries of India.
2) SEBI (Listing Obligations and Disclosure Requirements) Regulations, 2015 and the Listing Agreements entered into by the Company with the National Stock Exchange of India Limited and BSE Limited.
We further state that, during the period under review and based on our verification of the records maintained by the Company and also on review of compliance reports/ statements by the respective department heads/Chief Financial Officer/Company Secretary taken on record by the Board of Directors of the Company, in our opinion, adequate systems and processes and control mechanism commensurate to the size and nature of the Company’s business exist in the Company to monitor and ensure compliances with applicable laws, industry specific laws, labour laws, intellectual property laws and environmental laws. We have not reviewed the applicable financial laws, direct and indirect tax laws since the same have been subject to review and audit by the Statutory Auditors of the Company.
We, further report that:
1) As at March 31, 2019, the Board of Directors of the Company is duly constituted with proper balance of Executive Directors, Non-Executive Directors and Independent Directors. The changes in the composition of the Board of Directors that took place during the period under review were carried out in compliance with the provisions of the Act.
2) Adequate notice is given to all directors to schedule the Board Meetings, agenda and detailed notes on agenda were sent at least seven days in advance and in couple of meeting(s) with shorter notice as per the Secretarial Standard 1 and a system exists for seeking and obtaining further information and clarifications on the agenda items before the meeting and for meaningful participation at the meeting.
3) Majority decisions of the Board were unanimous and there were no dissenting views by any Members’ of the Board during the period under review.
We further report that during the audit period:
1) the Company has not issued any equity or preference shares/ debentures/ sweat equity except those equity shares issued to employees of the Company under ESOP schemes.
2) the Company has sought Members approval in pursuance of Section 180 of the Act and Regulation 24 of the SEBI (Listing Obligations and Disclosure Requirements) Regulations, 2015 relating to Divestment of Australian Business.
3) The Company has changed its name from ‘Strides Shasun Limited’ to ‘Strides Pharma Science Limited’ and has made consequential amendments to Memorandum and Articles of Association of the Company.
4) The Company has not undertaken any foreign technical collaborations.
5) Other key matters for which the Company has sought Members’ approval are as under:
Divestment of Strides Chemicals Private Limited, a wholly owned subsidiary of the Company, pursuant to the provisions of Section 188 of the Act.
Approval for grant of loan and continuing of guarantee/ security provided to Stelis Biopharma Private Limited, an Associate Company, pursuant to the provisions of Section 185 and other applicable provisions of the Act.
Approval for Transactions/ Contracts/ Arrangements with Solara Active Pharma Sciences Limited upto `500 Crore in each Financial Year, pursuant to the provisions of Regulation 23 of the SEBI (Listing Obligations and Disclosure Requirements) Regulations, 2015.
For Gopalakrishnaraj H H & Associates Company Secretaries
Gopalakrishnaraj H HDate: April 26, 2019 ProprietorPlace: Bengaluru FCS: 5654; CP: 4152
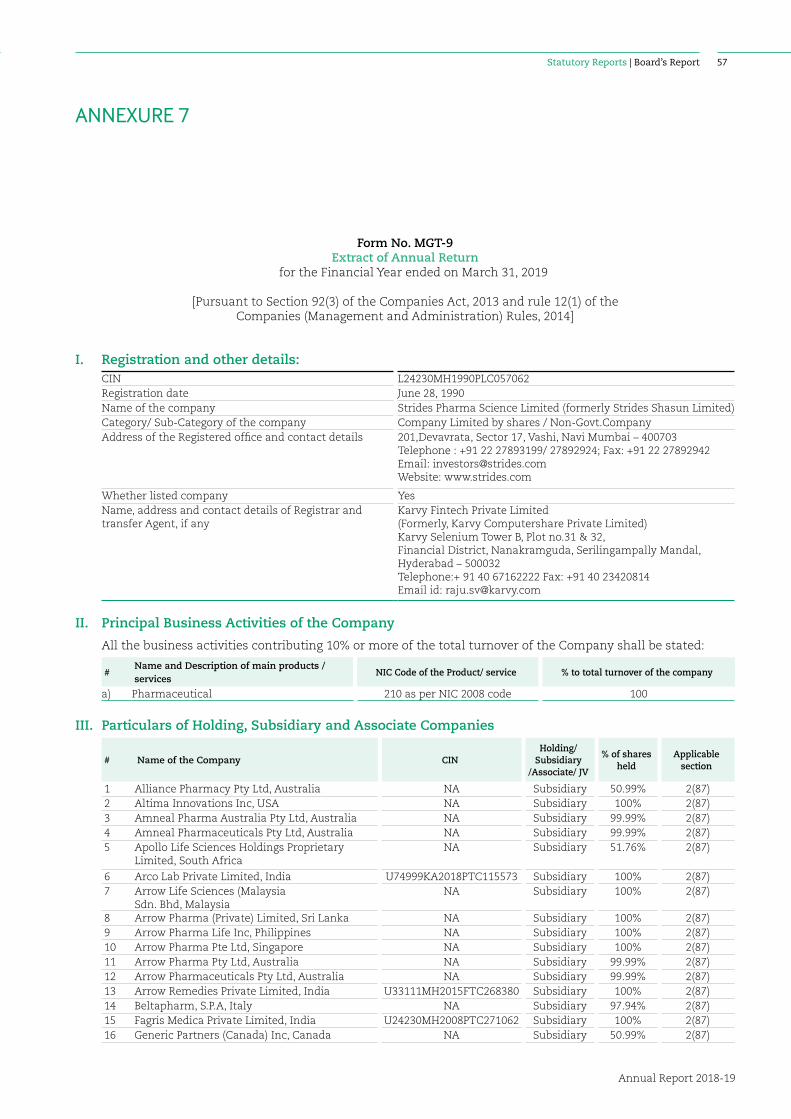
Statutory Reports | Board’s Report
Annual Report 2018-19
57
Form No. MGT-9Extract of Annual Return
for the Financial Year ended on March 31, 2019
[Pursuant to Section 92(3) of the Companies Act, 2013 and rule 12(1) of the Companies (Management and Administration) Rules, 2014]
I. Registration and other details:CIN L24230MH1990PLC057062Registration date June 28, 1990Name of the company Strides Pharma Science Limited (formerly Strides Shasun Limited)Category/ Sub-Category of the company Company Limited by shares / Non-Govt.CompanyAddress of the Registered office and contact details 201,Devavrata, Sector 17, Vashi, Navi Mumbai – 400703
Telephone : +91 22 27893199/ 27892924; Fax: +91 22 27892942Email: [email protected]: www.strides.com
Whether listed company YesName, address and contact details of Registrar and transfer Agent, if any
Karvy Fintech Private Limited(Formerly, Karvy Computershare Private Limited)Karvy Selenium Tower B, Plot no.31 & 32, Financial District, Nanakramguda, Serilingampally Mandal, Hyderabad – 500032Telephone:+ 91 40 67162222 Fax: +91 40 23420814Email id: [email protected]
II. Principal Business Activities of the Company
All the business activities contributing 10% or more of the total turnover of the Company shall be stated:
#Name and Description of main products / services
NIC Code of the Product/ service % to total turnover of the company
a) Pharmaceutical 210 as per NIC 2008 code 100
III. Particulars of Holding, Subsidiary and Associate Companies
# Name of the Company CINHolding/
Subsidiary /Associate/ JV
% of shares held
Applicable section
1 Alliance Pharmacy Pty Ltd, Australia NA Subsidiary 50.99% 2(87)2 Altima Innovations Inc, USA NA Subsidiary 100% 2(87)3 Amneal Pharma Australia Pty Ltd, Australia NA Subsidiary 99.99% 2(87)4 Amneal Pharmaceuticals Pty Ltd, Australia NA Subsidiary 99.99% 2(87)5 Apollo Life Sciences Holdings Proprietary
Limited, South AfricaNA Subsidiary 51.76% 2(87)
6 Arco Lab Private Limited, India U74999KA2018PTC115573 Subsidiary 100% 2(87)7 Arrow Life Sciences (Malaysia
Sdn. Bhd, MalaysiaNA Subsidiary 100% 2(87)
8 Arrow Pharma (Private) Limited, Sri Lanka NA Subsidiary 100% 2(87)9 Arrow Pharma Life Inc, Philippines NA Subsidiary 100% 2(87)10 Arrow Pharma Pte Ltd, Singapore NA Subsidiary 100% 2(87)11 Arrow Pharma Pty Ltd, Australia NA Subsidiary 99.99% 2(87)12 Arrow Pharmaceuticals Pty Ltd, Australia NA Subsidiary 99.99% 2(87)13 Arrow Remedies Private Limited, India U33111MH2015FTC268380 Subsidiary 100% 2(87)14 Beltapharm, S.P.A, Italy NA Subsidiary 97.94% 2(87)15 Fagris Medica Private Limited, India U24230MH2008PTC271062 Subsidiary 100% 2(87)16 Generic Partners (Canada) Inc, Canada NA Subsidiary 50.99% 2(87)
ANNEXURE 7
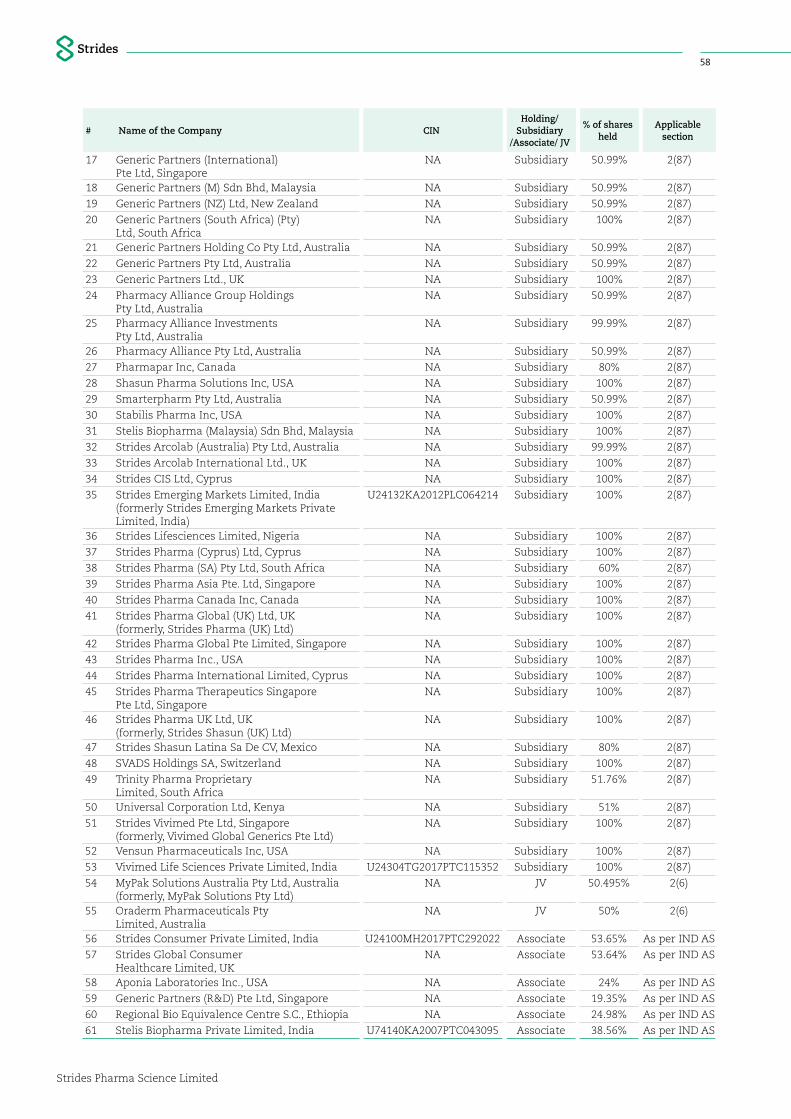
Strides Pharma Science Limited
58
# Name of the Company CINHolding/
Subsidiary /Associate/ JV
% of shares held
Applicable section
17 Generic Partners (International) Pte Ltd, Singapore
NA Subsidiary 50.99% 2(87)
18 Generic Partners (M) Sdn Bhd, Malaysia NA Subsidiary 50.99% 2(87)
19 Generic Partners (NZ) Ltd, New Zealand NA Subsidiary 50.99% 2(87)
20 Generic Partners (South Africa) (Pty) Ltd, South Africa
NA Subsidiary 100% 2(87)
21 Generic Partners Holding Co Pty Ltd, Australia NA Subsidiary 50.99% 2(87)
22 Generic Partners Pty Ltd, Australia NA Subsidiary 50.99% 2(87)
23 Generic Partners Ltd., UK NA Subsidiary 100% 2(87)
24 Pharmacy Alliance Group Holdings Pty Ltd, Australia
NA Subsidiary 50.99% 2(87)
25 Pharmacy Alliance Investments Pty Ltd, Australia
NA Subsidiary 99.99% 2(87)
26 Pharmacy Alliance Pty Ltd, Australia NA Subsidiary 50.99% 2(87)
27 Pharmapar Inc, Canada NA Subsidiary 80% 2(87)
28 Shasun Pharma Solutions Inc, USA NA Subsidiary 100% 2(87)
29 Smarterpharm Pty Ltd, Australia NA Subsidiary 50.99% 2(87)
30 Stabilis Pharma Inc, USA NA Subsidiary 100% 2(87)
31 Stelis Biopharma (Malaysia) Sdn Bhd, Malaysia NA Subsidiary 100% 2(87)
32 Strides Arcolab (Australia) Pty Ltd, Australia NA Subsidiary 99.99% 2(87)
33 Strides Arcolab International Ltd., UK NA Subsidiary 100% 2(87)
34 Strides CIS Ltd, Cyprus NA Subsidiary 100% 2(87)
35 Strides Emerging Markets Limited, India(formerly Strides Emerging Markets Private Limited, India)
U24132KA2012PLC064214 Subsidiary 100% 2(87)
36 Strides Lifesciences Limited, Nigeria NA Subsidiary 100% 2(87)
37 Strides Pharma (Cyprus) Ltd, Cyprus NA Subsidiary 100% 2(87)
38 Strides Pharma (SA) Pty Ltd, South Africa NA Subsidiary 60% 2(87)
39 Strides Pharma Asia Pte. Ltd, Singapore NA Subsidiary 100% 2(87)
40 Strides Pharma Canada Inc, Canada NA Subsidiary 100% 2(87)
41 Strides Pharma Global (UK) Ltd, UK(formerly, Strides Pharma (UK) Ltd)
NA Subsidiary 100% 2(87)
42 Strides Pharma Global Pte Limited, Singapore NA Subsidiary 100% 2(87)
43 Strides Pharma Inc., USA NA Subsidiary 100% 2(87)
44 Strides Pharma International Limited, Cyprus NA Subsidiary 100% 2(87)
45 Strides Pharma Therapeutics Singapore Pte Ltd, Singapore
NA Subsidiary 100% 2(87)
46 Strides Pharma UK Ltd, UK(formerly, Strides Shasun (UK) Ltd)
NA Subsidiary 100% 2(87)
47 Strides Shasun Latina Sa De CV, Mexico NA Subsidiary 80% 2(87)
48 SVADS Holdings SA, Switzerland NA Subsidiary 100% 2(87)
49 Trinity Pharma Proprietary Limited, South Africa
NA Subsidiary 51.76% 2(87)
50 Universal Corporation Ltd, Kenya NA Subsidiary 51% 2(87)
51 Strides Vivimed Pte Ltd, Singapore(formerly, Vivimed Global Generics Pte Ltd)
NA Subsidiary 100% 2(87)
52 Vensun Pharmaceuticals Inc, USA NA Subsidiary 100% 2(87)
53 Vivimed Life Sciences Private Limited, India U24304TG2017PTC115352 Subsidiary 100% 2(87)
54 MyPak Solutions Australia Pty Ltd, Australia(formerly, MyPak Solutions Pty Ltd)
NA JV 50.495% 2(6)
55 Oraderm Pharmaceuticals Pty Limited, Australia
NA JV 50% 2(6)
56 Strides Consumer Private Limited, India U24100MH2017PTC292022 Associate 53.65% As per IND AS
57 Strides Global Consumer Healthcare Limited, UK
NA Associate 53.64% As per IND AS
58 Aponia Laboratories Inc., USA NA Associate 24% As per IND AS
59 Generic Partners (R&D) Pte Ltd, Singapore NA Associate 19.35% As per IND AS
60 Regional Bio Equivalence Centre S.C., Ethiopia NA Associate 24.98% As per IND AS
61 Stelis Biopharma Private Limited, India U74140KA2007PTC043095 Associate 38.56% As per IND AS
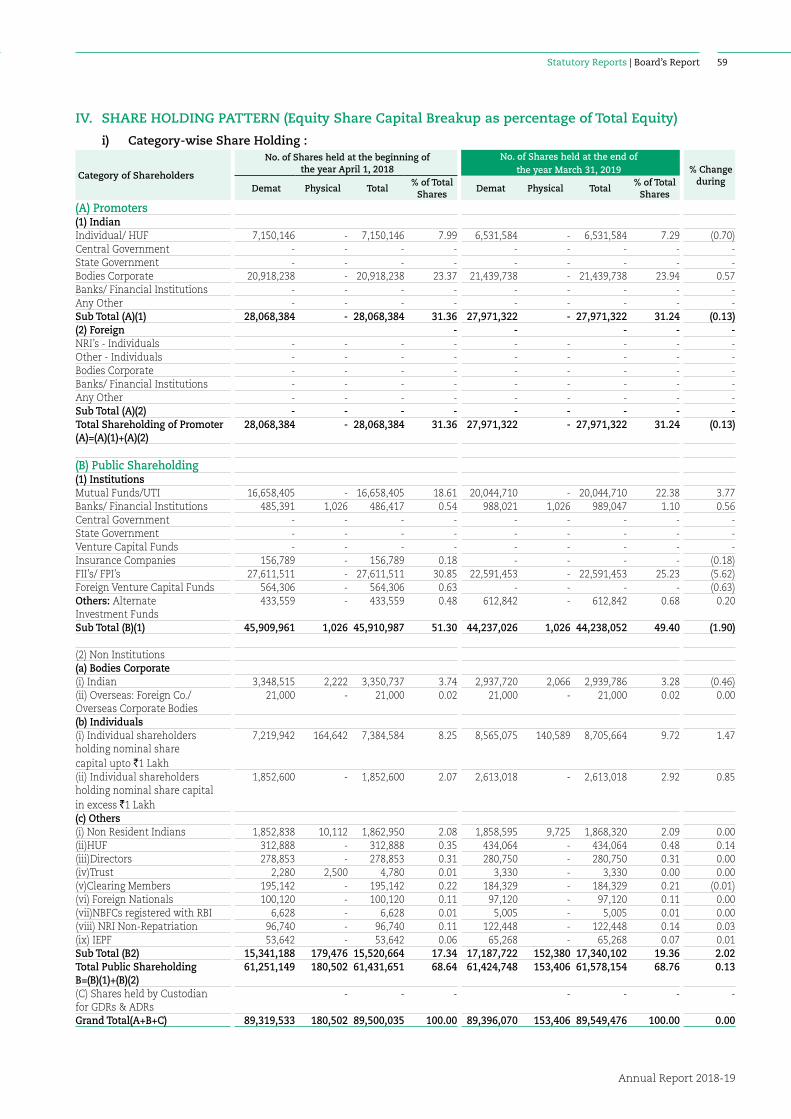
Statutory Reports | Board’s Report
Annual Report 2018-19
59
IV. SHARE HOLDING PATTERN (Equity Share Capital Breakup as percentage of Total Equity)
i) Category-wise Share Holding :
Category of Shareholders
No. of Shares held at the beginning of the year April 1, 2018
No. of Shares held at the end of the year March 31, 2019 % Change
duringDemat Physical Total
% of Total Shares
Demat Physical Total% of Total
Shares
(A) Promoters(1) IndianIndividual/ HUF 7,150,146 - 7,150,146 7.99 6,531,584 - 6,531,584 7.29 (0.70)Central Government - - - - - - - - - State Government - - - - - - - - - Bodies Corporate 20,918,238 - 20,918,238 23.37 21,439,738 - 21,439,738 23.94 0.57Banks/ Financial Institutions - - - - - - - - - Any Other - - - - - - - - - Sub Total (A)(1) 28,068,384 - 28,068,384 31.36 27,971,322 - 27,971,322 31.24 (0.13)(2) Foreign - - - - - NRI’s - Individuals - - - - - - - - - Other - Individuals - - - - - - - - - Bodies Corporate - - - - - - - - - Banks/ Financial Institutions - - - - - - - - - Any Other - - - - - - - - - Sub Total (A)(2) - - - - - - - - - Total Shareholding of Promoter (A)=(A)(1)+(A)(2)
28,068,384 - 28,068,384 31.36 27,971,322 - 27,971,322 31.24 (0.13)
(B) Public Shareholding(1) InstitutionsMutual Funds/UTI 16,658,405 - 16,658,405 18.61 20,044,710 - 20,044,710 22.38 3.77Banks/ Financial Institutions 485,391 1,026 486,417 0.54 988,021 1,026 989,047 1.10 0.56Central Government - - - - - - - - - State Government - - - - - - - - - Venture Capital Funds - - - - - - - - - Insurance Companies 156,789 - 156,789 0.18 - - - - (0.18)FII’s/ FPI’s 27,611,511 - 27,611,511 30.85 22,591,453 - 22,591,453 25.23 (5.62)Foreign Venture Capital Funds 564,306 - 564,306 0.63 - - - - (0.63)Others: Alternate Investment Funds
433,559 - 433,559 0.48 612,842 - 612,842 0.68 0.20
Sub Total (B)(1) 45,909,961 1,026 45,910,987 51.30 44,237,026 1,026 44,238,052 49.40 (1.90)
(2) Non Institutions(a) Bodies Corporate(i) Indian 3,348,515 2,222 3,350,737 3.74 2,937,720 2,066 2,939,786 3.28 (0.46)(ii) Overseas: Foreign Co./ Overseas Corporate Bodies
21,000 - 21,000 0.02 21,000 - 21,000 0.02 0.00
(b) Individuals(i) Individual shareholders holding nominal share capital upto `1 Lakh
7,219,942 164,642 7,384,584 8.25 8,565,075 140,589 8,705,664 9.72 1.47
(ii) Individual shareholders holding nominal share capital in excess `1 Lakh
1,852,600 - 1,852,600 2.07 2,613,018 - 2,613,018 2.92 0.85
(c) Others (i) Non Resident Indians 1,852,838 10,112 1,862,950 2.08 1,858,595 9,725 1,868,320 2.09 0.00(ii)HUF 312,888 - 312,888 0.35 434,064 - 434,064 0.48 0.14(iii)Directors 278,853 - 278,853 0.31 280,750 - 280,750 0.31 0.00(iv)Trust 2,280 2,500 4,780 0.01 3,330 - 3,330 0.00 0.00(v)Clearing Members 195,142 - 195,142 0.22 184,329 - 184,329 0.21 (0.01)(vi) Foreign Nationals 100,120 - 100,120 0.11 97,120 - 97,120 0.11 0.00(vii)NBFCs registered with RBI 6,628 - 6,628 0.01 5,005 - 5,005 0.01 0.00(viii) NRI Non-Repatriation 96,740 - 96,740 0.11 122,448 - 122,448 0.14 0.03(ix) IEPF 53,642 - 53,642 0.06 65,268 - 65,268 0.07 0.01Sub Total (B2) 15,341,188 179,476 15,520,664 17.34 17,187,722 152,380 17,340,102 19.36 2.02Total Public Shareholding B=(B)(1)+(B)(2)
61,251,149 180,502 61,431,651 68.64 61,424,748 153,406 61,578,154 68.76 0.13
(C) Shares held by Custodian for GDRs & ADRs
- - - - - - -
Grand Total(A+B+C) 89,319,533 180,502 89,500,035 100.00 89,396,070 153,406 89,549,476 100.00 0.00

Strides Pharma Science Limited
60
ii) Shareholding of Promoters :
# Category & Name of the Shareholder
Shareholding at the beginning of the year April 1, 2018
Shareholding at the end of the year March 31, 2019 % change in
shareholding during the
year No. of Shares
% of total Shares of the
company
% of Shares Pledged/
encumbered to total shares held
No. of Shares
% of total Shares of the
company
% of Shares Pledged/
encumbered to total shares held
PROMOTERS1 ARUN KUMAR PILLAI 1,370,797 1.53 - 1,370,797 1.53 - 0.002 K R RAVISHANKAR 1,255,593 1.40 - 1,255,593 1.40 - 0.00
3 DEVENDRA KUMAR S 11,272 0.01 96.82 11,272 0.01 - 0.004 VIMAL KUMAR S 215,012 0.24 79.07 265,012 0.30 47.73 0.065 PRONOMZ VENTURES LLP 12,665,000 14.15 - 12,665,000 14.14 7.90 (0.01)
PROMOTER GROUP6 ADITYA ARUN KUMAR 200,000 0.22 - - 0.00 - (0.22)7 CHAITANYA D 331,988 0.37 - 331,988 0.37 - 0.008 DEEPA ARUN KUMAR 201,000 0.22 - - 0.00 - (0.22)9 DEEPAK ABHAYA KUMAR 312 0.00 - - 0.00 - 0.0010 GAYATRI NAIR 33,000 0.04 - 33,000 0.04 - 0.0011 HEMALATHA PILLAI 48,000 0.05 - 48,000 0.05 - 0.0012 JATIN V 59,283 0.07 42.17 394,283 0.44 - 0.3713 JITESH D 364,125 0.41 27.46 364,125 0.41 - 0.0014 K R LAKSHMI 130,365 0.15 - 130,365 0.15 - 0.0015 LAKSHMI GOPALAKRISHNAN 50,000 0.06 - 50,000 0.06 - 0.0016 LEELA V 275,358 0.31 58.11 425,358 0.47 - 0.1717 MONISHA NITIN 593,750 0.66 - 158,750 0.18 - (0.49)18 NITIN KUMAR V 96,255 0.11 - 431,255 0.48 - 0.3719 PADMAKUMAR
KARUNAKARAN PILLAI 171,485 0.19 - 171,485 0.19 - 0.00
20 POOJA SRISRIMAL 93,750 0.10 - 93,750 0.10 - 0.0021 PURUSHOTHAMAN PILLAI G 33,013 0.04 - 33,013 0.04 - 0.0022 RAHUL NAIR 20,000 0.02 - 20,000 0.02 - 0.0023 RAJESWARI AMMA 93,760 0.10 - 93,760 0.10 - 0.0024 RAJITHA GOPALAKRISHNAN 45,000 0.05 - 45,000 0.05 - 0.0025 RUPALI JATIN 632,812 0.71 - 197,812 0.22 - (0.49)26 SAJITHA PILLAI 80,000 0.09 - 80,000 0.09 - 0.0027 SAJJAN D 159,400 0.18 - 162,000 0.18 - 0.0028 SUCHI CHAITANYA SRISRIMAL 93,750 0.10 - 93,750 0.10 - 0.0029 TARINI ARUN KUMAR 200,000 0.22 - - 0.00 - (0.22)30 V. JATIN (HUF) 408 0.00 - 408 0.00 - 0.0031 V. NITIN KUMAR (HUF) 500 0.00 - 500 0.00 - 0.0032 VIMAL KUMAR S - HUF 115,158 0.13 - 95,308 0.11 3.31 (0.02)33 VINEETHA
MOHANAKUMAR PILLAI 175,000 0.20 - 175,000 0.20 - 0.00
BODY CORPORATES34 ABUSHA INVESTMENT &
MANANGEMENT SERVICES LLP 1,681,221 1.88 100.00 281,221 0.31 2.49 (1.56)
35 AGNUS CAPITAL LLP 20,000 0.02 - 20,000 0.02 - 0.0036 AGNUS HOLDINGS PVT LTD 120,816 0.13 - 120,816 0.13 - 0.0037 AMBEMATA SECURITIES 481,660 0.54 95.50 481,660 0.54 - 0.0038 CHAYADEEP
PROPERTIES PRIVATE LTD 411,060 0.46 - 411,060 0.46 - 0.00
39 DEVENDRA ESTATES PRIVATE LIMITED
701,953 0.78 99.83 1,953 0.00 25.60 (0.78)
40 DEVENDRA ESTATES LLP 500,000 0.56 100.00 1,118,000 1.25 98.39 0.6941 SEQUENT SCIENTIFIC LIMITED 3,312,500 3.70 - 3,312,500 3.70 - 0.0042 SHASUN LEASING AND
FINANCE (P) LIMITED 968,091 1.08 99.27 968,091 1.08 33.26 0.00
43 TRIUMPH VENTURE HOLDINGS LLP
35,937 0.04 - 35,937 0.04 - 0.00
44 KARUNA VENTURES PRIVATE LIMITED
20,000 0.02 - 20,000 0.02 - 0.00
45 KARUNA BUSINESS SOLUTIONS LLP*
NA NA NA 603,500 0.67 100.00 0.67
46 LIFECELL INTERNATIONAL PRIVATE LIMITED**
NA NA NA 1,400,000 1.56 100.00 1.56
TOTAL 28,068,384 31.36 16.99 27,971,322 31.24 16.31 (0.13)* Became part of Promoter group effective November 2018
** Became part of Promoter group effective February 2019
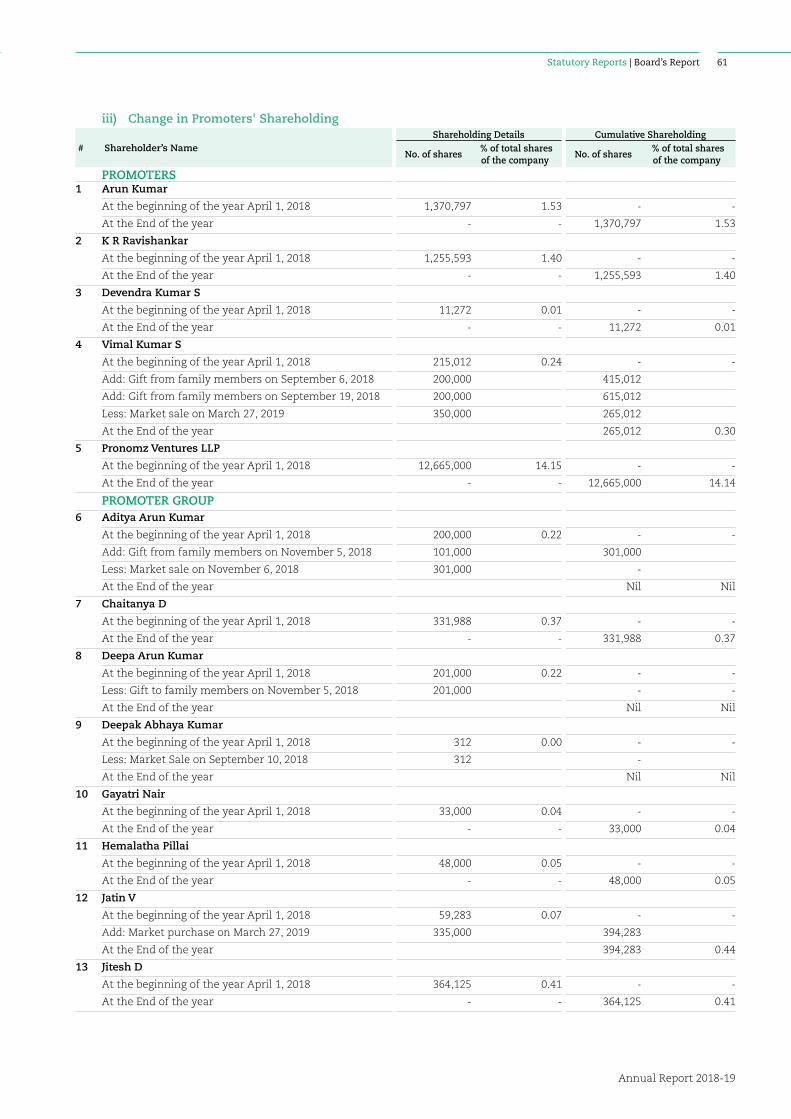
Statutory Reports | Board’s Report
Annual Report 2018-19
61
iii) Change in Promoters' Shareholding
# Shareholder’s Name Shareholding Details Cumulative Shareholding
No. of shares % of total shares of the company
No. of shares % of total shares of the company
PROMOTERS1 Arun Kumar
At the beginning of the year April 1, 2018 1,370,797 1.53 - -
At the End of the year - - 1,370,797 1.53
2 K R Ravishankar
At the beginning of the year April 1, 2018 1,255,593 1.40 - -
At the End of the year - - 1,255,593 1.40
3 Devendra Kumar S
At the beginning of the year April 1, 2018 11,272 0.01 - -
At the End of the year - - 11,272 0.01
4 Vimal Kumar S
At the beginning of the year April 1, 2018 215,012 0.24 - -
Add: Gift from family members on September 6, 2018 200,000 415,012
Add: Gift from family members on September 19, 2018 200,000 615,012
Less: Market sale on March 27, 2019 350,000 265,012
At the End of the year 265,012 0.30
5 Pronomz Ventures LLP
At the beginning of the year April 1, 2018 12,665,000 14.15 - -
At the End of the year - - 12,665,000 14.14
PROMOTER GROUP6 Aditya Arun Kumar
At the beginning of the year April 1, 2018 200,000 0.22 - -
Add: Gift from family members on November 5, 2018 101,000 301,000
Less: Market sale on November 6, 2018 301,000 -
At the End of the year Nil Nil
7 Chaitanya D
At the beginning of the year April 1, 2018 331,988 0.37 - -
At the End of the year - - 331,988 0.37
8 Deepa Arun Kumar
At the beginning of the year April 1, 2018 201,000 0.22 - -
Less: Gift to family members on November 5, 2018 201,000 - -
At the End of the year Nil Nil
9 Deepak Abhaya Kumar
At the beginning of the year April 1, 2018 312 0.00 - -
Less: Market Sale on September 10, 2018 312 -
At the End of the year Nil Nil
10 Gayatri Nair
At the beginning of the year April 1, 2018 33,000 0.04 - -
At the End of the year - - 33,000 0.04
11 Hemalatha Pillai
At the beginning of the year April 1, 2018 48,000 0.05 - -
At the End of the year - - 48,000 0.05
12 Jatin V
At the beginning of the year April 1, 2018 59,283 0.07 - -
Add: Market purchase on March 27, 2019 335,000 394,283
At the End of the year 394,283 0.44
13 Jitesh D
At the beginning of the year April 1, 2018 364,125 0.41 - -
At the End of the year - - 364,125 0.41
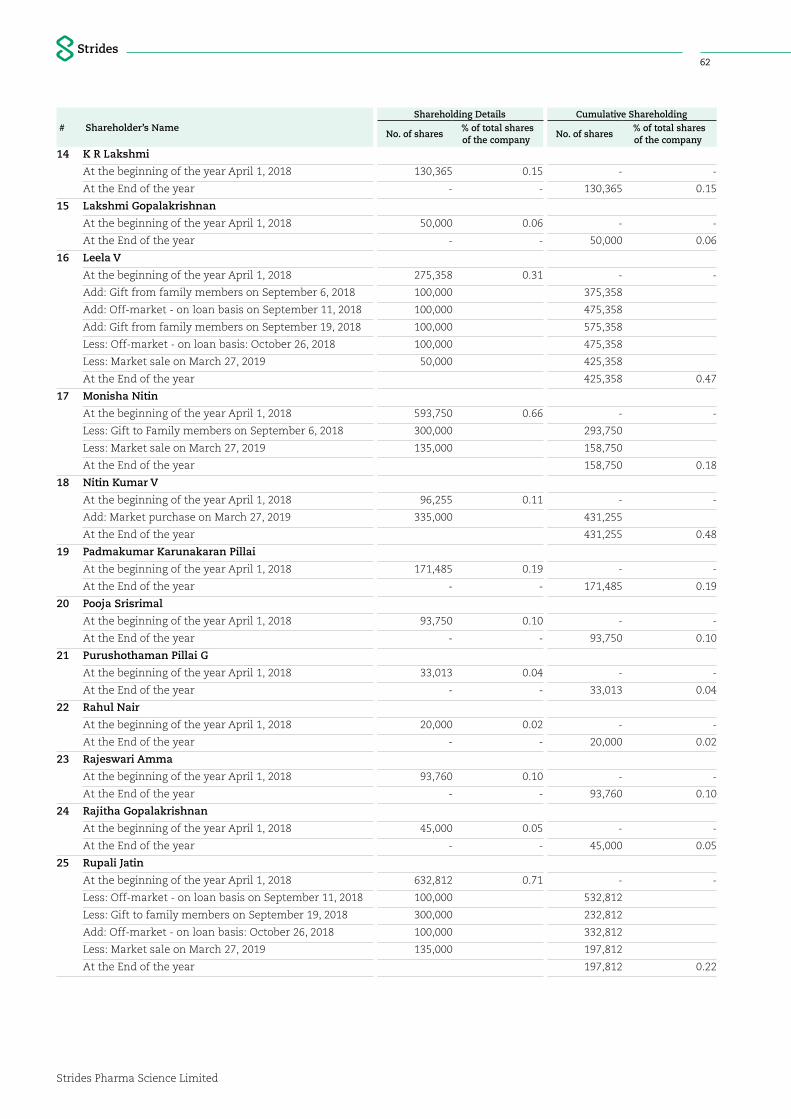
Strides Pharma Science Limited
62
# Shareholder’s Name Shareholding Details Cumulative Shareholding
No. of shares % of total shares of the company
No. of shares % of total shares of the company
14 K R Lakshmi
At the beginning of the year April 1, 2018 130,365 0.15 - -
At the End of the year - - 130,365 0.15
15 Lakshmi Gopalakrishnan
At the beginning of the year April 1, 2018 50,000 0.06 - -
At the End of the year - - 50,000 0.06
16 Leela V
At the beginning of the year April 1, 2018 275,358 0.31 - -
Add: Gift from family members on September 6, 2018 100,000 375,358
Add: Off-market - on loan basis on September 11, 2018 100,000 475,358
Add: Gift from family members on September 19, 2018 100,000 575,358
Less: Off-market - on loan basis: October 26, 2018 100,000 475,358
Less: Market sale on March 27, 2019 50,000 425,358
At the End of the year 425,358 0.47
17 Monisha Nitin
At the beginning of the year April 1, 2018 593,750 0.66 - -
Less: Gift to Family members on September 6, 2018 300,000 293,750
Less: Market sale on March 27, 2019 135,000 158,750
At the End of the year 158,750 0.18
18 Nitin Kumar V
At the beginning of the year April 1, 2018 96,255 0.11 - -
Add: Market purchase on March 27, 2019 335,000 431,255
At the End of the year 431,255 0.48
19 Padmakumar Karunakaran Pillai
At the beginning of the year April 1, 2018 171,485 0.19 - -
At the End of the year - - 171,485 0.19
20 Pooja Srisrimal
At the beginning of the year April 1, 2018 93,750 0.10 - -
At the End of the year - - 93,750 0.10
21 Purushothaman Pillai G
At the beginning of the year April 1, 2018 33,013 0.04 - -
At the End of the year - - 33,013 0.04
22 Rahul Nair
At the beginning of the year April 1, 2018 20,000 0.02 - -
At the End of the year - - 20,000 0.02
23 Rajeswari Amma
At the beginning of the year April 1, 2018 93,760 0.10 - -
At the End of the year - - 93,760 0.10
24 Rajitha Gopalakrishnan
At the beginning of the year April 1, 2018 45,000 0.05 - -
At the End of the year - - 45,000 0.05
25 Rupali Jatin
At the beginning of the year April 1, 2018 632,812 0.71 - -
Less: Off-market - on loan basis on September 11, 2018 100,000 532,812
Less: Gift to family members on September 19, 2018 300,000 232,812
Add: Off-market - on loan basis: October 26, 2018 100,000 332,812
Less: Market sale on March 27, 2019 135,000 197,812
At the End of the year 197,812 0.22
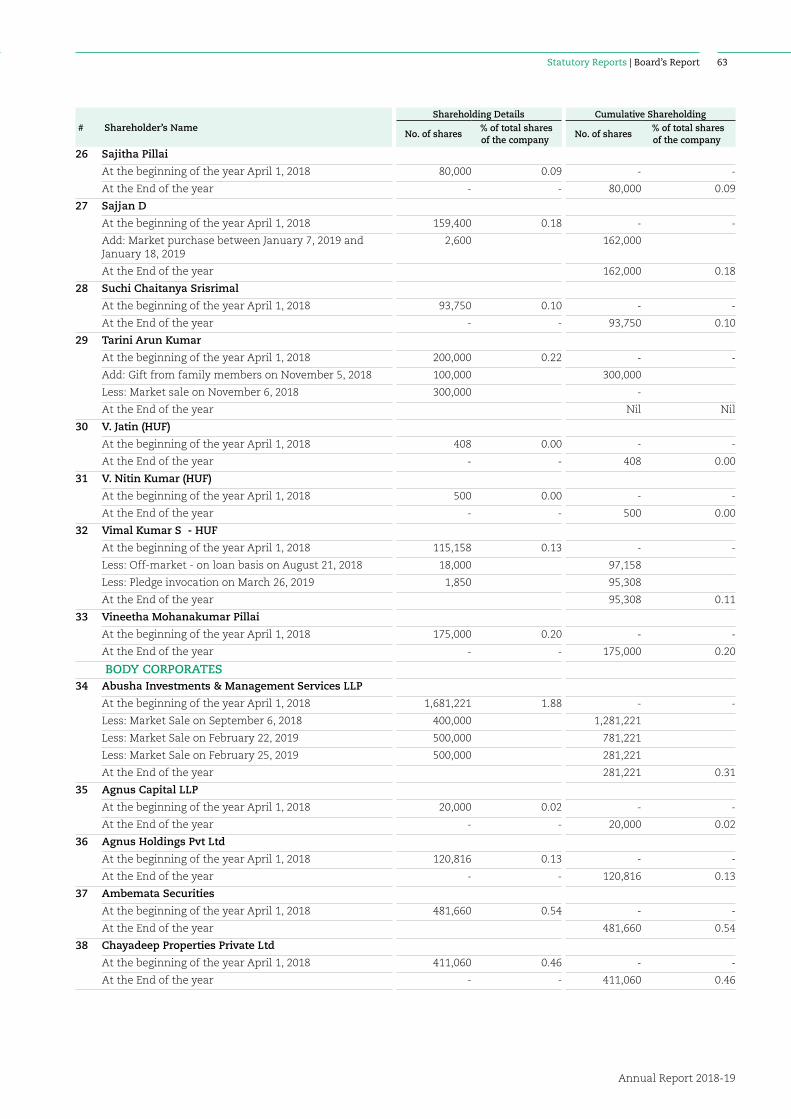
Statutory Reports | Board’s Report
Annual Report 2018-19
63
# Shareholder’s Name Shareholding Details Cumulative Shareholding
No. of shares % of total shares of the company
No. of shares % of total shares of the company
26 Sajitha Pillai
At the beginning of the year April 1, 2018 80,000 0.09 - -
At the End of the year - - 80,000 0.09
27 Sajjan D
At the beginning of the year April 1, 2018 159,400 0.18 - -
Add: Market purchase between January 7, 2019 and January 18, 2019
2,600 162,000
At the End of the year 162,000 0.18
28 Suchi Chaitanya Srisrimal
At the beginning of the year April 1, 2018 93,750 0.10 - -
At the End of the year - - 93,750 0.10
29 Tarini Arun Kumar
At the beginning of the year April 1, 2018 200,000 0.22 - -
Add: Gift from family members on November 5, 2018 100,000 300,000
Less: Market sale on November 6, 2018 300,000 -
At the End of the year Nil Nil
30 V. Jatin (HUF)
At the beginning of the year April 1, 2018 408 0.00 - -
At the End of the year - - 408 0.00
31 V. Nitin Kumar (HUF)
At the beginning of the year April 1, 2018 500 0.00 - -
At the End of the year - - 500 0.00
32 Vimal Kumar S - HUF
At the beginning of the year April 1, 2018 115,158 0.13 - -
Less: Off-market - on loan basis on August 21, 2018 18,000 97,158
Less: Pledge invocation on March 26, 2019 1,850 95,308
At the End of the year 95,308 0.11
33 Vineetha Mohanakumar Pillai
At the beginning of the year April 1, 2018 175,000 0.20 - -
At the End of the year - - 175,000 0.20
BODY CORPORATES 34 Abusha Investments & Management Services LLP
At the beginning of the year April 1, 2018 1,681,221 1.88 - -
Less: Market Sale on September 6, 2018 400,000 1,281,221
Less: Market Sale on February 22, 2019 500,000 781,221
Less: Market Sale on February 25, 2019 500,000 281,221
At the End of the year 281,221 0.31
35 Agnus Capital LLP
At the beginning of the year April 1, 2018 20,000 0.02 - -
At the End of the year - - 20,000 0.02
36 Agnus Holdings Pvt Ltd
At the beginning of the year April 1, 2018 120,816 0.13 - -
At the End of the year - - 120,816 0.13
37 Ambemata Securities
At the beginning of the year April 1, 2018 481,660 0.54 - -
At the End of the year 481,660 0.54
38 Chayadeep Properties Private Ltd
At the beginning of the year April 1, 2018 411,060 0.46 - -
At the End of the year - - 411,060 0.46
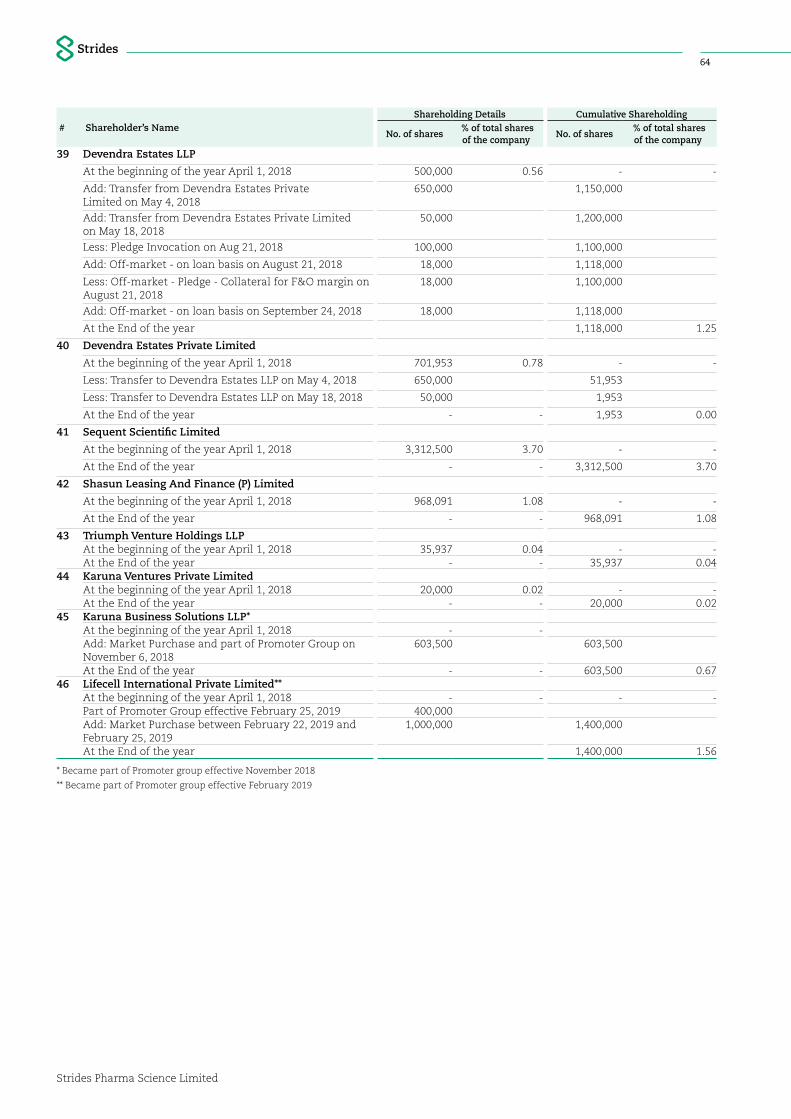
Strides Pharma Science Limited
64
# Shareholder’s Name Shareholding Details Cumulative Shareholding
No. of shares % of total shares of the company
No. of shares % of total shares of the company
39 Devendra Estates LLP
At the beginning of the year April 1, 2018 500,000 0.56 - -
Add: Transfer from Devendra Estates Private Limited on May 4, 2018
650,000 1,150,000
Add: Transfer from Devendra Estates Private Limited on May 18, 2018
50,000 1,200,000
Less: Pledge Invocation on Aug 21, 2018 100,000 1,100,000
Add: Off-market - on loan basis on August 21, 2018 18,000 1,118,000
Less: Off-market - Pledge - Collateral for F&O margin on August 21, 2018
18,000 1,100,000
Add: Off-market - on loan basis on September 24, 2018 18,000 1,118,000
At the End of the year 1,118,000 1.25
40 Devendra Estates Private Limited
At the beginning of the year April 1, 2018 701,953 0.78 - -
Less: Transfer to Devendra Estates LLP on May 4, 2018 650,000 51,953
Less: Transfer to Devendra Estates LLP on May 18, 2018 50,000 1,953
At the End of the year - - 1,953 0.00
41 Sequent Scientific Limited
At the beginning of the year April 1, 2018 3,312,500 3.70 - -
At the End of the year - - 3,312,500 3.70
42 Shasun Leasing And Finance (P) Limited
At the beginning of the year April 1, 2018 968,091 1.08 - -
At the End of the year - - 968,091 1.08
43 Triumph Venture Holdings LLPAt the beginning of the year April 1, 2018 35,937 0.04 - - At the End of the year - - 35,937 0.04
44 Karuna Ventures Private LimitedAt the beginning of the year April 1, 2018 20,000 0.02 - - At the End of the year - - 20,000 0.02
45 Karuna Business Solutions LLP*At the beginning of the year April 1, 2018 - - Add: Market Purchase and part of Promoter Group on November 6, 2018
603,500 603,500
At the End of the year - - 603,500 0.67 46 Lifecell International Private Limited**
At the beginning of the year April 1, 2018 - - - - Part of Promoter Group effective February 25, 2019 400,000 Add: Market Purchase between February 22, 2019 and February 25, 2019
1,000,000 1,400,000
At the End of the year 1,400,000 1.56
* Became part of Promoter group effective November 2018
** Became part of Promoter group effective February 2019
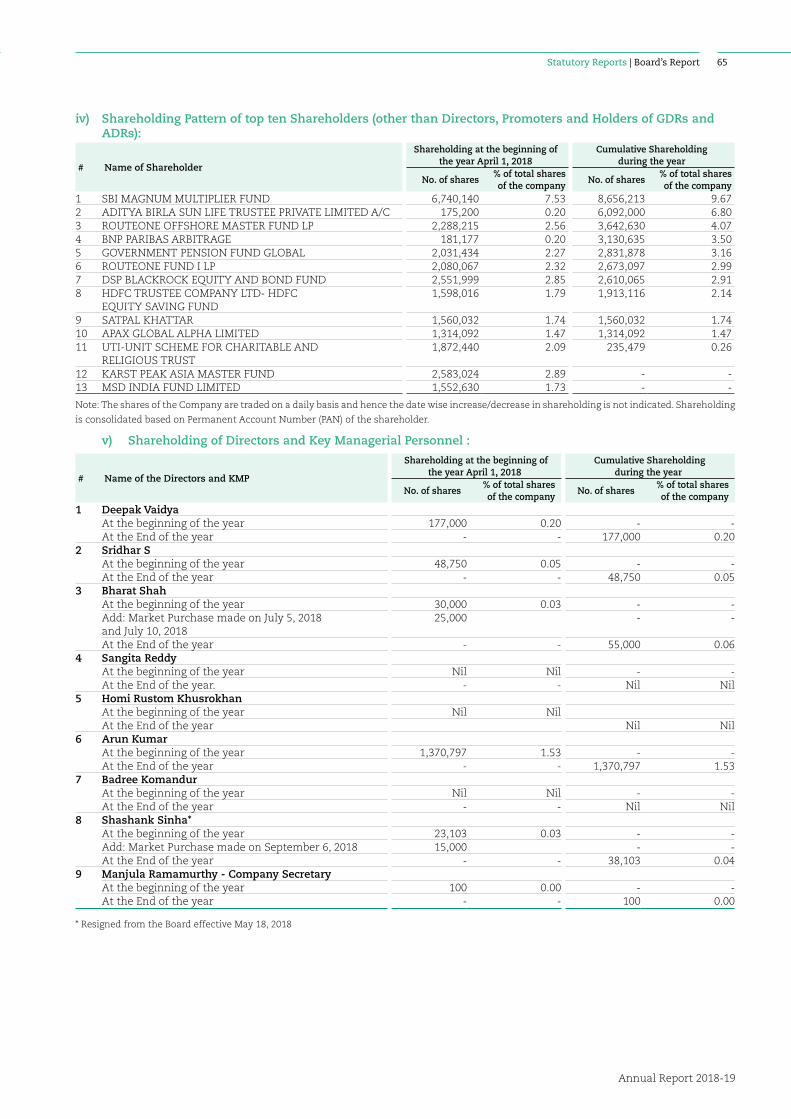
Statutory Reports | Board’s Report
Annual Report 2018-19
65
iv) Shareholding Pattern of top ten Shareholders (other than Directors, Promoters and Holders of GDRs and ADRs):
# Name of Shareholder
Shareholding at the beginning of the year April 1, 2018
Cumulative Shareholding during the year
No. of shares% of total shares of the company
No. of shares% of total shares of the company
1 SBI MAGNUM MULTIPLIER FUND 6,740,140 7.53 8,656,213 9.67 2 ADITYA BIRLA SUN LIFE TRUSTEE PRIVATE LIMITED A/C 175,200 0.20 6,092,000 6.80 3 ROUTEONE OFFSHORE MASTER FUND LP 2,288,215 2.56 3,642,630 4.07 4 BNP PARIBAS ARBITRAGE 181,177 0.20 3,130,635 3.50 5 GOVERNMENT PENSION FUND GLOBAL 2,031,434 2.27 2,831,878 3.16 6 ROUTEONE FUND I LP 2,080,067 2.32 2,673,097 2.99 7 DSP BLACKROCK EQUITY AND BOND FUND 2,551,999 2.85 2,610,065 2.91 8 HDFC TRUSTEE COMPANY LTD- HDFC
EQUITY SAVING FUND 1,598,016 1.79 1,913,116 2.14
9 SATPAL KHATTAR 1,560,032 1.74 1,560,032 1.74 10 APAX GLOBAL ALPHA LIMITED 1,314,092 1.47 1,314,092 1.47 11 UTI-UNIT SCHEME FOR CHARITABLE AND
RELIGIOUS TRUST 1,872,440 2.09 235,479 0.26
12 KARST PEAK ASIA MASTER FUND 2,583,024 2.89 - - 13 MSD INDIA FUND LIMITED 1,552,630 1.73 - -
Note: The shares of the Company are traded on a daily basis and hence the date wise increase/decrease in shareholding is not indicated. Shareholding
is consolidated based on Permanent Account Number (PAN) of the shareholder.
v) Shareholding of Directors and Key Managerial Personnel :
# Name of the Directors and KMP
Shareholding at the beginning of the year April 1, 2018
Cumulative Shareholding during the year
No. of shares % of total shares
of the company No. of shares
% of total shares of the company
1 Deepak Vaidya At the beginning of the year 177,000 0.20 - - At the End of the year - - 177,000 0.20
2 Sridhar SAt the beginning of the year 48,750 0.05 - - At the End of the year - - 48,750 0.05
3 Bharat ShahAt the beginning of the year 30,000 0.03 - - Add: Market Purchase made on July 5, 2018 and July 10, 2018
25,000 - -
At the End of the year - - 55,000 0.06 4 Sangita Reddy
At the beginning of the year Nil Nil - - At the End of the year. - - Nil Nil
5 Homi Rustom KhusrokhanAt the beginning of the year Nil Nil At the End of the year Nil Nil
6 Arun Kumar At the beginning of the year 1,370,797 1.53 - - At the End of the year - - 1,370,797 1.53
7 Badree KomandurAt the beginning of the year Nil Nil - - At the End of the year - - Nil Nil
8 Shashank Sinha*At the beginning of the year 23,103 0.03 - - Add: Market Purchase made on September 6, 2018 15,000 - - At the End of the year - - 38,103 0.04
9 Manjula Ramamurthy - Company SecretaryAt the beginning of the year 100 0.00 - - At the End of the year - - 100 0.00
* Resigned from the Board effective May 18, 2018
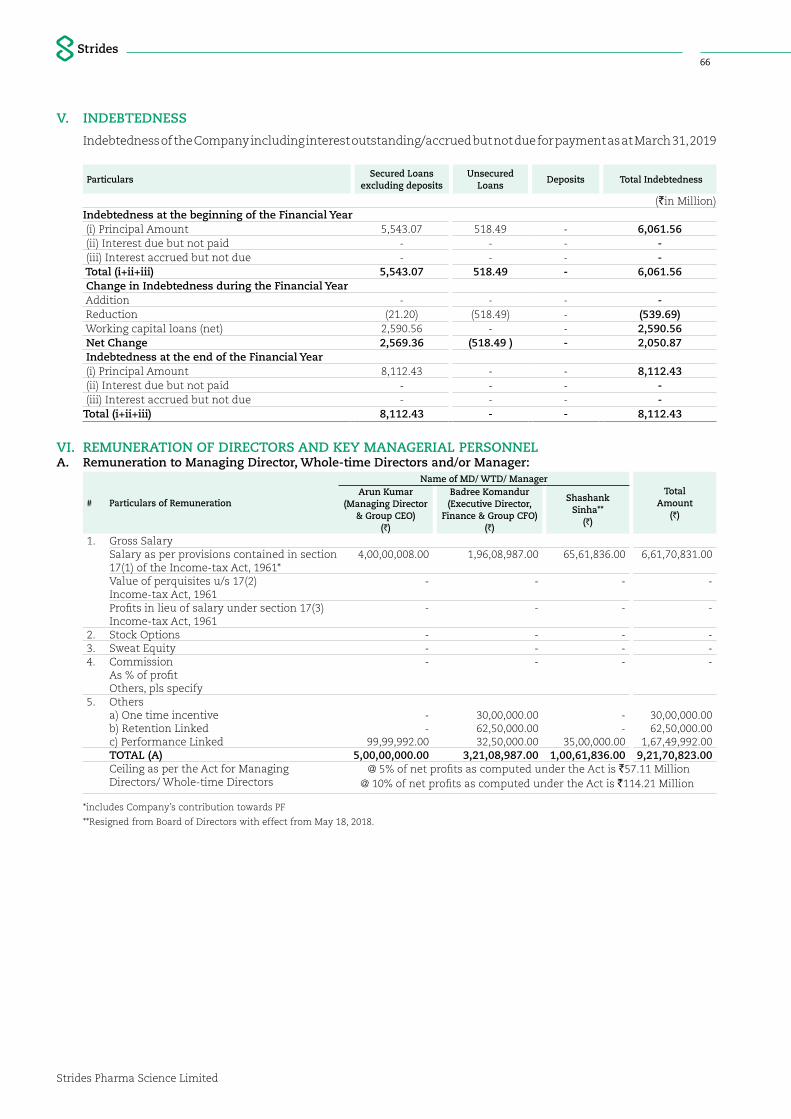
Strides Pharma Science Limited
66
V. INDEBTEDNESS
Indebtedness of the Company including interest outstanding/accrued but not due for payment as at March 31, 2019
ParticularsSecured Loans
excluding deposits Unsecured
LoansDeposits Total Indebtedness
(`in Million)Indebtedness at the beginning of the Financial Year (i) Principal Amount 5,543.07 518.49 - 6,061.56 (ii) Interest due but not paid - - - - (iii) Interest accrued but not due - - - - Total (i+ii+iii) 5,543.07 518.49 - 6,061.56 Change in Indebtedness during the Financial Year Addition - - - - Reduction (21.20) (518.49) - (539.69) Working capital loans (net) 2,590.56 - - 2,590.56 Net Change 2,569.36 (518.49 ) - 2,050.87 Indebtedness at the end of the Financial Year (i) Principal Amount 8,112.43 - - 8,112.43 (ii) Interest due but not paid - - - - (iii) Interest accrued but not due - - - -Total (i+ii+iii) 8,112.43 - - 8,112.43
VI. REMUNERATION OF DIRECTORS AND KEY MANAGERIAL PERSONNELA. Remuneration to Managing Director, Whole-time Directors and/or Manager:
# Particulars of Remuneration
Name of MD/ WTD/ ManagerTotal
Amount (`)
Arun Kumar(Managing Director
& Group CEO) (`)
Badree Komandur (Executive Director,
Finance & Group CFO) (`)
Shashank Sinha**
(`)
1. Gross SalarySalary as per provisions contained in section 17(1) of the Income-tax Act, 1961*
4,00,00,008.00 1,96,08,987.00 65,61,836.00 6,61,70,831.00
Value of perquisites u/s 17(2) Income-tax Act, 1961
- - - -
Profits in lieu of salary under section 17(3) Income-tax Act, 1961
- - - -
2. Stock Options - - - -3. Sweat Equity - - - -4. Commission
As % of profitOthers, pls specify
- - - -
5. Others a) One time incentiveb) Retention Linkedc) Performance Linked
--
99,99,992.00
30,00,000.0062,50,000.0032,50,000.00
--
35,00,000.00
30,00,000.0062,50,000.00
1,67,49,992.00TOTAL (A) 5,00,00,000.00 3,21,08,987.00 1,00,61,836.00 9,21,70,823.00Ceiling as per the Act for Managing Directors/ Whole-time Directors
@ 5% of net profits as computed under the Act is `57.11 Million@ 10% of net profits as computed under the Act is `114.21 Million
*includes Company’s contribution towards PF
**Resigned from Board of Directors with effect from May 18, 2018.
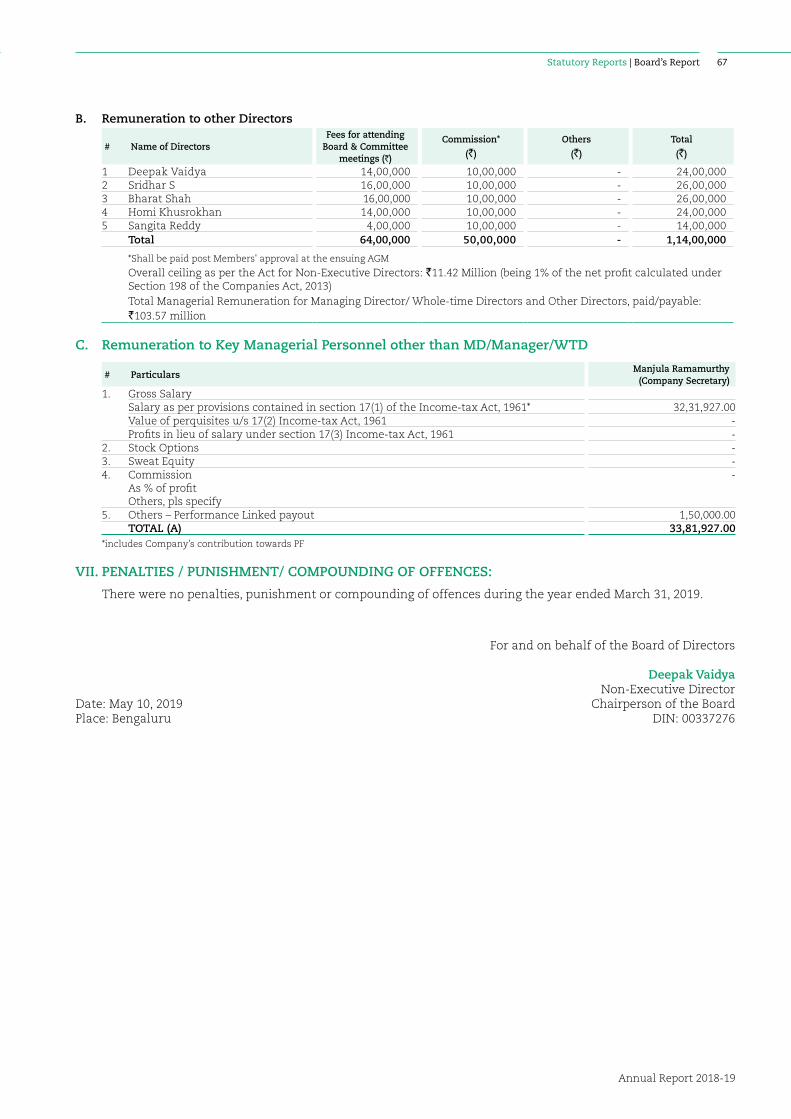
Statutory Reports | Board’s Report
Annual Report 2018-19
67
B. Remuneration to other Directors
# Name of DirectorsFees for attending
Board & Committee meetings (`)
Commission*
(`)
Others
(`)
Total
(`)
1 Deepak Vaidya 14,00,000 10,00,000 - 24,00,0002 Sridhar S 16,00,000 10,00,000 - 26,00,0003 Bharat Shah 16,00,000 10,00,000 - 26,00,0004 Homi Khusrokhan 14,00,000 10,00,000 - 24,00,0005 Sangita Reddy 4,00,000 10,00,000 - 14,00,000
Total 64,00,000 50,00,000 - 1,14,00,000
*Shall be paid post Members' approval at the ensuing AGM
Overall ceiling as per the Act for Non-Executive Directors: `11.42 Million (being 1% of the net profit calculated under Section 198 of the Companies Act, 2013)Total Managerial Remuneration for Managing Director/ Whole-time Directors and Other Directors, paid/payable: `103.57 million
C. Remuneration to Key Managerial Personnel other than MD/Manager/WTD
# ParticularsManjula Ramamurthy
(Company Secretary)1. Gross Salary
Salary as per provisions contained in section 17(1) of the Income-tax Act, 1961* 32,31,927.00Value of perquisites u/s 17(2) Income-tax Act, 1961 -Profits in lieu of salary under section 17(3) Income-tax Act, 1961 -
2. Stock Options -3. Sweat Equity -4. Commission
As % of profitOthers, pls specify
-
5. Others – Performance Linked payout 1,50,000.00TOTAL (A) 33,81,927.00
*includes Company’s contribution towards PF
VII. PENALTIES / PUNISHMENT/ COMPOUNDING OF OFFENCES:
There were no penalties, punishment or compounding of offences during the year ended March 31, 2019.
For and on behalf of the Board of Directors
Deepak Vaidya
Date: May 10, 2019Non-Executive Director
Chairperson of the BoardPlace: Bengaluru DIN: 00337276
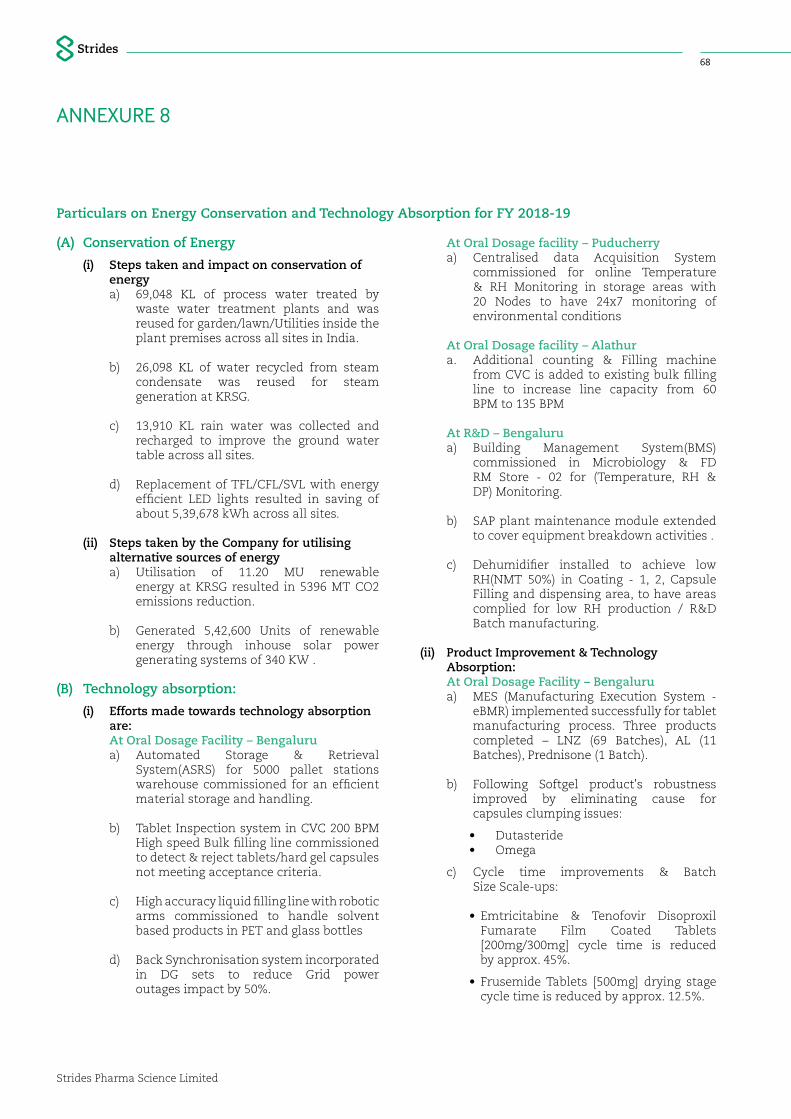
Strides Pharma Science Limited
68
(A) Conservation of Energy
(i) Steps taken and impact on conservation of energy
a) 69,048 KL of process water treated by waste water treatment plants and was reused for garden/lawn/Utilities inside the plant premises across all sites in India.
b) 26,098 KL of water recycled from steam condensate was reused for steam generation at KRSG.
c) 13,910 KL rain water was collected and recharged to improve the ground water table across all sites.
d) Replacement of TFL/CFL/SVL with energy efficient LED lights resulted in saving of about 5,39,678 kWh across all sites.
(ii) Steps taken by the Company for utilising alternative sources of energy
a) Utilisation of 11.20 MU renewable energy at KRSG resulted in 5396 MT CO2 emissions reduction.
b) Generated 5,42,600 Units of renewable energy through inhouse solar power generating systems of 340 KW .
(B) Technology absorption:
(i) Efforts made towards technology absorption are:
At Oral Dosage Facility – Bengaluru a) Automated Storage & Retrieval
System(ASRS) for 5000 pallet stations warehouse commissioned for an efficient material storage and handling.
b) Tablet Inspection system in CVC 200 BPM High speed Bulk filling line commissioned to detect & reject tablets/hard gel capsules not meeting acceptance criteria.
c) High accuracy liquid filling line with robotic arms commissioned to handle solvent based products in PET and glass bottles
d) Back Synchronisation system incorporated in DG sets to reduce Grid power outages impact by 50%.
Particulars on Energy Conservation and Technology Absorption for FY 2018-19
At Oral Dosage facility – Puducherry a) Centralised data Acquisition System
commissioned for online Temperature & RH Monitoring in storage areas with 20 Nodes to have 24x7 monitoring of environmental conditions
At Oral Dosage facility – Alathur a. Additional counting & Filling machine
from CVC is added to existing bulk filling line to increase line capacity from 60 BPM to 135 BPM
At R&D – Bengaluru a) Building Management System(BMS)
commissioned in Microbiology & FD RM Store - 02 for (Temperature, RH & DP) Monitoring.
b) SAP plant maintenance module extended to cover equipment breakdown activities .
c) Dehumidifier installed to achieve low RH(NMT 50%) in Coating - 1, 2, Capsule Filling and dispensing area, to have areas complied for low RH production / R&D Batch manufacturing.
(ii) Product Improvement & Technology Absorption:
At Oral Dosage Facility – Bengaluru a) MES (Manufacturing Execution System -
eBMR) implemented successfully for tablet manufacturing process. Three products completed – LNZ (69 Batches), AL (11 Batches), Prednisone (1 Batch).
b) Following Softgel product's robustness improved by eliminating cause for capsules clumping issues:
• Dutasteride• Omega
c) Cycle time improvements & Batch Size Scale-ups:
• Emtricitabine & Tenofovir Disoproxil Fumarate Film Coated Tablets [200mg/300mg] cycle time is reduced by approx. 45%.
• Frusemide Tablets [500mg] drying stage cycle time is reduced by approx. 12.5%.
ANNEXURE 8
Statutory Reports | Board’s Report
Annual Report 2018-19
69
d) Product Robustness Improvement Projects:
• Emtricitabine & Tenofovir Disoproxil Fumarate Film Coated Tablets [200mg/300mg] - Severe sticking issue of ET Tabs is resolved by change in spray granulation equipment.
• Quinine Bisulfate Coated Tablets BP [300mg] – Drying stage parameters are revised and validated to get consistent LOD results of dried granules.
• Quinine Sulphate 300mg - Sticking severity is reduced by change in granular profile by change in granulation suite.
• Prednisone Tabs 25 mg - Hardness is improved by change in granulation fluid uptake and change in drying stage parameters.
• Diphen hydramine & Ibuprofen 25 & 200mg Soft Gelatine Capsules - Capsules brittleness issue resolved by change in shell formulae and tunnel drying stage parameters.
• Potassium Chloride ER Tablets 8mEq & 10mEq - LG PSD issues by standardising the granulation process & dissolution release issues resolved by change in uncoated tablets curing time.
• Oxybutynin Hcl Tablets 2.5mg & 5.0mg - BU & CU issues resolved by standardising the API PSD.
e) Stoppage of Recurring Complaints:
• Quinine Bisulfate Coated Tablets BP [300mg] – Bursting of coated tablets stopped after coating process change.
• Efavirenz Tablets 200/600mg - Coating colour changed to match the description of PRS.
At Oral Dosage facility – Puducherry a) Following Exhibit batches were executed
and filed in 2018 to 2019 for US market
• Celecoxib capsules 100mg, 200mg and 400mg,
• Ibprofen Tablets 200mg (as Ibuprofen sodium 256mg) and Ibuprofen Tablets 400mg (as Ibuprofen Sodium512mg)
• Diltiazem Hydrochloride ER capsules 120mg/180mg/240mg/300mg/360mg
• Mirabegron ER tablets 50 mg
b) UK market (Exhibit batches)
• Ibuprofen Tablets 200mg (as Ibuprofen sodium 256mg) and Ibuprofen Tablets 400mg(as Ibuprofen Sodium512mg) – Poland (Europe)
• Ibuprofen ER tablets 300 mg – 3 VB (1500 kg) executed for filing – UK
c) 35 commercial launches for US market are achieved to have the higher share in regulated market & 2 are under progress
• Ketoprofen capsules USP 25mg
• Ketoconazole Tablets USP 200mg
• Gabapentin Capsules 100mg/300mg/400mg (ACI)
• Mesalamine ER Capsules 250mg/500mg (Validation bathes manufacturing under progress)
• Gabapentin Capsules 100mg/300mg/400mg (In-house) (Validation bathes manufacturing under progress)
d) Improved the productivity of 5 products by resolving / reducing the sticking frequency for overall efficiency
• Potassium citrate ER Tablets 10mEq and 15mEq – Reducing rattling of tablets
• Gabapentin Tablets 600mg ACI – Resolved sticking issue.
• Gabapentin Tablets 800mg ACI - Resolved sticking issue.
• Ibuprofen tablets 20 mg – Arrow - Reduced sticking issue.
• Ibuprofen tablets 400 mg – Dr. Max - Reduced sticking issue.
At Oral Dosage facility – Alathur a) The efforts made towards
technology absorption
• Improved the productivity of Amlodipine Besylate Tablets 10 mg by increasing the Batch size.
• Site transfer of 2 products were completed successfully and filed for approval – Clindamycin Capsules and Gabapentin Tablets.
• New Product was executed and filed for approval- Ranitidine Tablets (Cool mint).

Strides Pharma Science Limited
70
• New Product (Ranolazine Tablets) was executed for Customer. Filing to be done.
(iii) In case of import technology (imported during the last year), the year of Import whether the technology has been fully absorbed:
a) Integrated blister cartonator line from CAM commissioned in KRSG to improve blister packaging capacity to 500 Mn / annum
b) CVC counter – 75 BPM commissioned to increase installed capacity of bulk filling line in Alathur site
Expenditure on R&D:
` In Million
ParticularsMarch 31,
2019March 31,
2018
Capital 206.15 274.76
Revenue 1,217.45 1,741.69
Total 1,423.60 2,016.45
Total Foreign Exchange Earned and Used` In Million
ParticularsYear ended
March 31, 2019Foreign exchange earned in terms of actual inflows
61,695
Foreign exchange outgo in terms of actual outflows
63,835
For and on behalf of the Board of Directors
Date: May 10, 2019Place: Bengaluru
Deepak VaidyaNon-Executive Director
Chairperson of the Board DIN:00337276
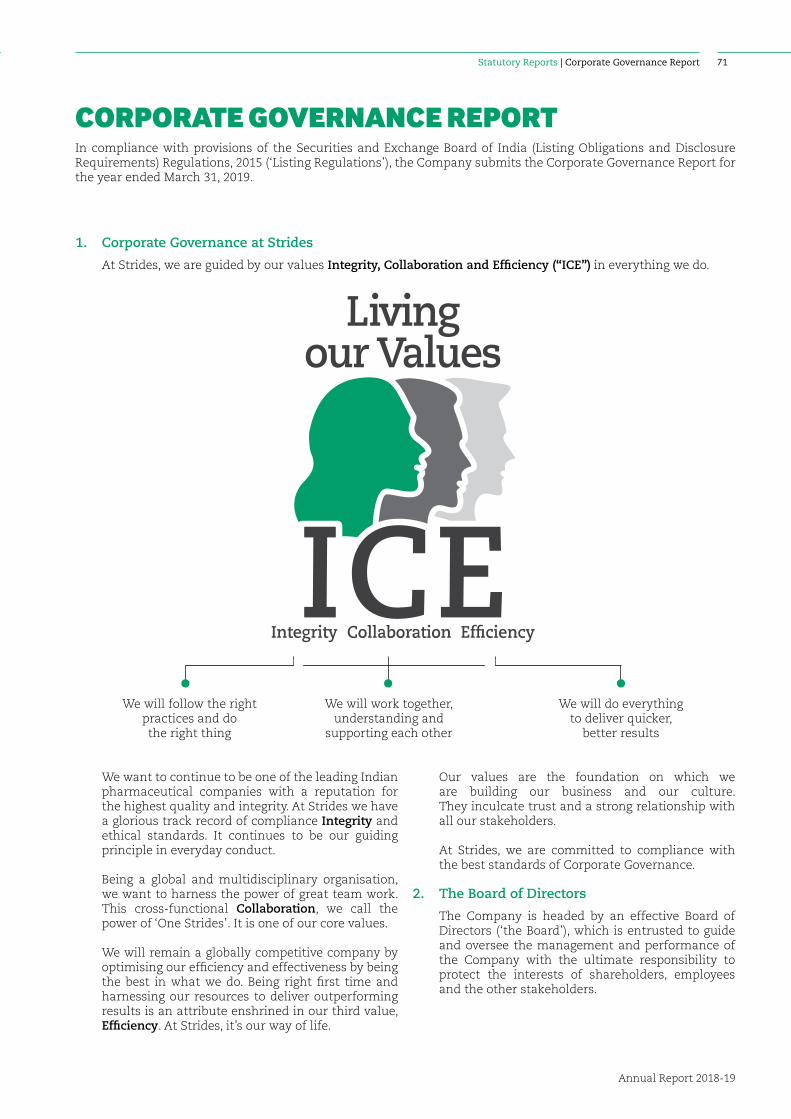
Statutory Reports | Corporate Governance Report
Annual Report 2018-19
71
CORPORATE GOVERNANCE REPORTIn compliance with provisions of the Securities and Exchange Board of India (Listing Obligations and Disclosure Requirements) Regulations, 2015 (‘Listing Regulations’), the Company submits the Corporate Governance Report for the year ended March 31, 2019.
1. Corporate Governance at Strides
At Strides, we are guided by our values Integrity, Collaboration and Efficiency (“ICE”) in everything we do.
We want to continue to be one of the leading Indian pharmaceutical companies with a reputation for the highest quality and integrity. At Strides we have a glorious track record of compliance Integrity and ethical standards. It continues to be our guiding principle in everyday conduct.
Being a global and multidisciplinary organisation, we want to harness the power of great team work. This cross-functional Collaboration, we call the power of ‘One Strides’. It is one of our core values.
We will remain a globally competitive company by optimising our efficiency and effectiveness by being the best in what we do. Being right first time and harnessing our resources to deliver outperforming results is an attribute enshrined in our third value, Efficiency. At Strides, it’s our way of life.
We will follow the right practices and do the right thing
We will work together, understanding and
supporting each other
We will do everything to deliver quicker,
better results
Our values are the foundation on which we are building our business and our culture. They inculcate trust and a strong relationship with all our stakeholders.
At Strides, we are committed to compliance with the best standards of Corporate Governance.
2. The Board of Directors
The Company is headed by an effective Board of Directors (‘the Board’), which is entrusted to guide and oversee the management and performance of the Company with the ultimate responsibility to protect the interests of shareholders, employees and the other stakeholders.
Strides Pharma Science Limited
72
We believe that our Board has an appropriate mix of Executive and Non-Executive Directors to maintain its independency and to separate its function of governance and management. The Board represents an optimal mix of professionalism, knowledge and experience.
2.1 Board Composition As on the date of this Report, the Board comprises
of Seven Directors – Two Executive Directors and Five Non-Executive Directors, of which Four are Independent Directors, Chairperson of the Board is a Non-Executive Director.
During the period under review, Board composition of the Company underwent the following changes:
Effective Date Remarks
April 1, 2018 a) Arun Kumar moved from Non-Executive position to Executive position.
May 18, 2018 a) Shashank Sinha stepped down from the Board of Directors owing to a newer role.b) Arun Kumar was re-designated as Managing Director & Group CEO of the Company.c) Deepak Vaidya was designated as the Chairperson of the Board.
Board and Committee Composition as at March 31, 2019 is as under:
Name of the Director Category BoardAudit
Committee
Nomination and Remuneration
Committee
Stakeholder Relationship Committee
CSR Committee
Risk Management Committee*
Deepak Vaidya Non-Executive Director -S Sridhar Independent Director - Bharat Shah Independent Director - Sangita Reddy Independent Director - - -Homi R Khusrokhan Independent Director - Arun Kumar Managing
Director & Group CEO - - -
Badree Komandur Executive Director - - -
* Effective April 1, 2019. Other members of the Committee are: 1. Ramaraju PVS, Chief Operating Officer – Global Head Manufacturing 2. Umesh Kale, Chief Quality Officer – Quality Assurance 3. Sormistha Ghosh, General Counsel and Chief Risk Officer
- Chairperson of the Board/Committee - Member
Note: The Company Secretary acts as the Secretary to the Board Committees.
The details of each member of the Board as at March 31, 2019 is as under:
# Name of DirectorCategory of Directorship
Date of Original Appointment
No. of shares held in the Company & % to paid up
capital
No. of Directorships
held
No. of Committees
of which Member
Chairmanship of Committees of Companies
1. Deepak Vaidya Chairperson & Non-Executive Director
January 16, 1998
177,000(0.20%)
11 8 3
2. S Sridhar Independent Director July 27, 2012 48,750(0.05%)
11 7 5
3. Bharat Shah Independent Director July 25, 2014 55,000(0.06%)
11 8 1
4. Sangita Reddy Independent Director February 7, 2014
- 16 1 -
5. Homi Rustam Khusrokhan
Independent Director May 18, 2017 - 4 2 1
6. Arun Kumar Managing Director & Group CEO
June 28, 1990 13,70,797(1.53%)
5 2 -
7. Badree Komandur Executive Director - Finance & Group CFO
May 18, 2017 - 1 - -
Note:
1. While considering the total number of directorships, directorships in Public Companies and Private Companies and Alternate Directorships (including Nominee Directorship) are considered. Directorships in Foreign Companies and Section 8 Companies, if any, have been excluded.
Further, position held in the Company as Director and/ or Member/ Chairperson of Committee is included in the above table.
2. None of the Directors is a member of the Board of more than twenty companies or a member of more than ten Board-level Committees or Chairperson of more than five Committees across all listed/ public entities.
Statutory Reports | Corporate Governance Report
Annual Report 2018-19
73
None of the Independent Directors serve as an Independent Director on more than seven listed entities.
3. In accordance with the provisions of Listing Regulations, while considering the position held as Member/ Chairperson in Committees, only Audit Committee and Stakeholder Relationship Committee are considered.
Committee membership in all public limited companies, whether listed or not, is included and all other companies including private limited companies, foreign companies and companies under Section 8 of the Companies Act, 2013 are excluded.
4. None of the Directors are related to any other Director.
5. During the year under review there were no pecuniary relationships or transactions between the Company and any of its Non-Executive Directors/ Independent Directors, other than the related party transactions which are reported as part of the financials.
6. The Company has not issued any convertible instruments. Accordingly, the Directors do not hold such instruments in the Company.
7. Details of Directorships and Committee memberships of the Directors in all other entities incorporated under Indian Companies Act 1956/ 2013 is annexed to this report as Annexure CG 1.
8. Mr. Gopalakrishnaraj of M/s. Gopalakrishnaraj HH& Associates, Company Secretaries, has issued a certificate as required under the Listing Regulations confirming that none of the directors on the Board of the Company has been debarred or disqualified from being appointed or continuing as director of companies by the SEBI/ Ministry of Corporate Affairs or any such statutory authority. The certificate is enclosed as Annexure CG 2 to this Report.
2.2 Appointment/ Re-appointment, Continuation of Directorship & Retirement by Rotation
Proposal for the appointment/ re-appointment/ continuation of directorship of the following Directors shall be placed before the Members of the Company at the ensuing Annual General Meeting:
1) Mr. Deepak Vaidya, Non-Executive Director, who retires by rotation at the ensuing Annual General Meeting and being eligible, offers himself for re-appointment;
Further, in terms of the Listing Regulations, proposal for continuing of Mr. Vaidya's directorship in the Company, who will attain the age of 75 years in January 2020, will also be placed for Members’ approval;
2) Re-appointment of Mr. S Sridhar and Ms. Sangita Reddy as Independent Directors of the Company for a second term of 5 (Five) years from the conclusion of ensuing Annual General Meeting till the conclusion of Thirty-Third Annual General Meeting of the Company.
Your Directors recommend their appointment/ re-appointment/ continuation of directorship on the Board.
2.3 Induction & Familiarisation programs for Board Members
Every newly appointed Director is taken through a formal induction programme.
The Managing Director provides a brief on Company’s current structure and performance of business and the Company Secretary provides new Directors with a brief on their responsibilities as Directors.
The Board members are provided with necessary documents/ brochures, reports and internal policies to enable them to familiarise with the Company’s procedures and practices. Periodic presentations are made at the Board and Board Committee Meetings, on business and performance updates of the Company, global business environment, business strategy and risks involved. Quarterly updates on relevant statutory changes encompassing important laws are updated to the Directors. Sessions by subject matter experts on various regulatory updates is also arranged.
Site visits to Company's facilities are organised for the Directors to enable them understand the operations of the Company.
The policy formulated by the Company for Familiarisation and details of familiarisation programme imparted to independent directors are uploaded on the website of the Company at http://www.strides.com/ investor-committeboard.html
2.4 Key Board skills/ expertise/ competence of the Board of Directors
The Board of Directors are collectively responsible for selection of a Member on the Board. The Nomination and Remuneration Committee of the Company follows a defined criteria for identifying, screening, recruiting and recommending candidates for election as a Director on the Board.
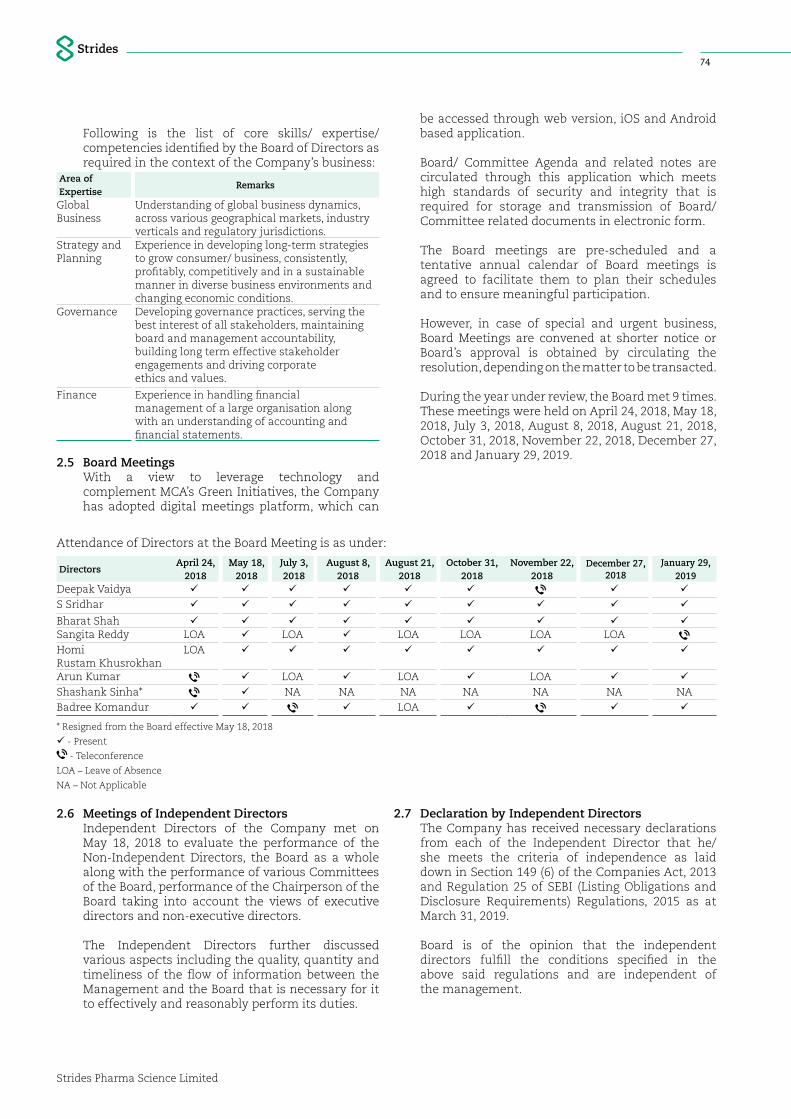
Strides Pharma Science Limited
74
Following is the list of core skills/ expertise/ competencies identified by the Board of Directors as required in the context of the Company’s business:
Area of Expertise
Remarks
Global Business
Understanding of global business dynamics, across various geographical markets, industry verticals and regulatory jurisdictions.
Strategy and Planning
Experience in developing long-term strategies to grow consumer/ business, consistently, profitably, competitively and in a sustainable manner in diverse business environments and changing economic conditions.
Governance Developing governance practices, serving the best interest of all stakeholders, maintaining board and management accountability, building long term effective stakeholder engagements and driving corporate ethics and values.
Finance Experience in handling financial management of a large organisation along with an understanding of accounting and financial statements.
2.5 Board Meetings With a view to leverage technology and
complement MCA’s Green Initiatives, the Company has adopted digital meetings platform, which can
be accessed through web version, iOS and Android based application.
Board/ Committee Agenda and related notes are circulated through this application which meets high standards of security and integrity that is required for storage and transmission of Board/ Committee related documents in electronic form.
The Board meetings are pre-scheduled and a tentative annual calendar of Board meetings is agreed to facilitate them to plan their schedules and to ensure meaningful participation.
However, in case of special and urgent business, Board Meetings are convened at shorter notice or Board’s approval is obtained by circulating the resolution, depending on the matter to be transacted.
During the year under review, the Board met 9 times. These meetings were held on April 24, 2018, May 18, 2018, July 3, 2018, August 8, 2018, August 21, 2018, October 31, 2018, November 22, 2018, December 27, 2018 and January 29, 2019.
Attendance of Directors at the Board Meeting is as under:
DirectorsApril 24,
2018May 18,
2018July 3, 2018
August 8, 2018
August 21, 2018
October 31, 2018
November 22, 2018
December 27, 2018
January 29, 2019
Deepak Vaidya
S Sridhar
Bharat Shah Sangita Reddy LOA LOA LOA LOA LOA LOAHomi Rustam Khusrokhan
LOA
Arun Kumar LOA LOA LOA
Shashank Sinha* NA NA NA NA NA NA NABadree Komandur LOA
* Resigned from the Board effective May 18, 2018
- Present
- Teleconference
LOA – Leave of Absence
NA – Not Applicable
2.6 Meetings of Independent Directors Independent Directors of the Company met on
May 18, 2018 to evaluate the performance of the Non-Independent Directors, the Board as a whole along with the performance of various Committees of the Board, performance of the Chairperson of the Board taking into account the views of executive directors and non-executive directors.
The Independent Directors further discussed various aspects including the quality, quantity and timeliness of the flow of information between the Management and the Board that is necessary for it to effectively and reasonably perform its duties.
2.7 Declaration by Independent Directors The Company has received necessary declarations
from each of the Independent Director that he/ she meets the criteria of independence as laid down in Section 149 (6) of the Companies Act, 2013 and Regulation 25 of SEBI (Listing Obligations and Disclosure Requirements) Regulations, 2015 as at March 31, 2019.
Board is of the opinion that the independent directors fulfill the conditions specified in the above said regulations and are independent of the management.
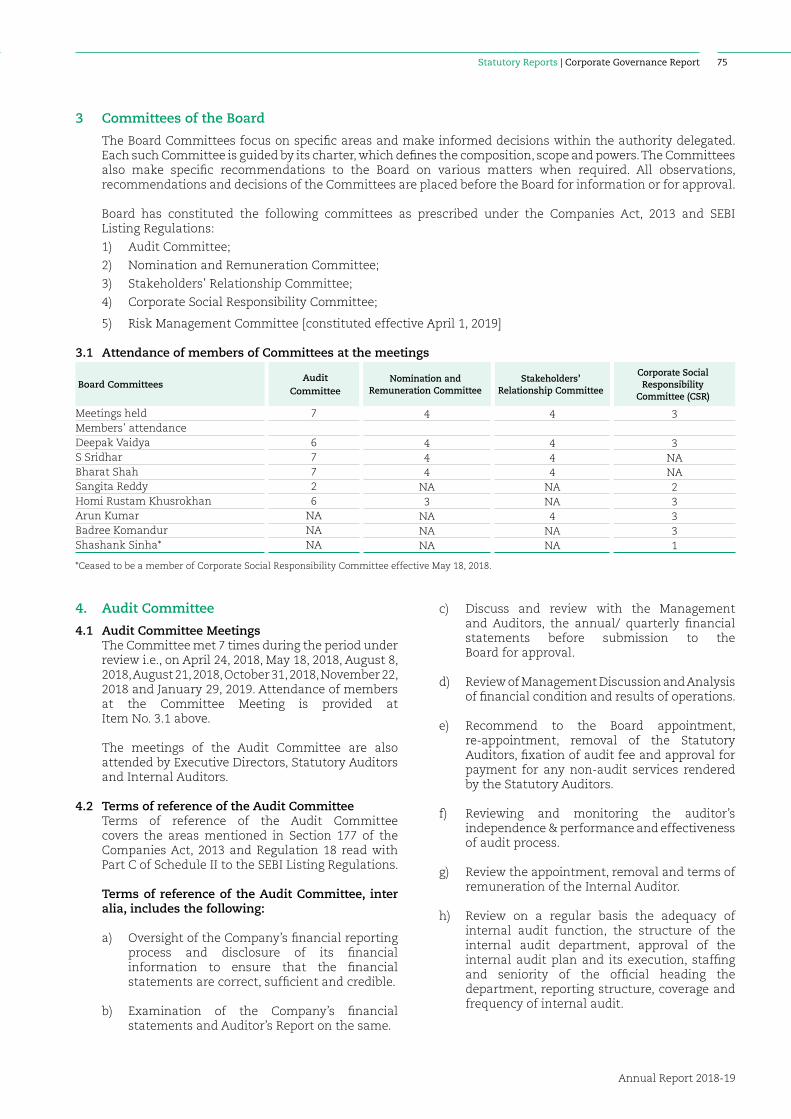
Statutory Reports | Corporate Governance Report
Annual Report 2018-19
75
3 Committees of the Board
The Board Committees focus on specific areas and make informed decisions within the authority delegated. Each such Committee is guided by its charter, which defines the composition, scope and powers. The Committees also make specific recommendations to the Board on various matters when required. All observations, recommendations and decisions of the Committees are placed before the Board for information or for approval.
Board has constituted the following committees as prescribed under the Companies Act, 2013 and SEBI Listing Regulations:
1) Audit Committee;
2) Nomination and Remuneration Committee;
3) Stakeholders’ Relationship Committee;
4) Corporate Social Responsibility Committee;
5) Risk Management Committee [constituted effective April 1, 2019]
3.1 Attendance of members of Committees at the meetings
Board CommitteesAudit
CommitteeNomination and
Remuneration CommitteeStakeholders’
Relationship Committee
Corporate Social Responsibility
Committee (CSR)
Meetings held 7 4 4 3Members’ attendanceDeepak Vaidya 6 4 4 3S Sridhar 7 4 4 NABharat Shah 7 4 4 NASangita Reddy 2 NA NA 2Homi Rustam Khusrokhan 6 3 NA 3Arun Kumar NA NA 4 3Badree Komandur NA NA NA 3Shashank Sinha* NA NA NA 1
*Ceased to be a member of Corporate Social Responsibility Committee effective May 18, 2018.
4. Audit Committee
4.1 Audit Committee Meetings The Committee met 7 times during the period under
review i.e., on April 24, 2018, May 18, 2018, August 8, 2018, August 21, 2018, October 31, 2018, November 22, 2018 and January 29, 2019. Attendance of members at the Committee Meeting is provided at Item No. 3.1 above.
The meetings of the Audit Committee are also attended by Executive Directors, Statutory Auditors and Internal Auditors.
4.2 Terms of reference of the Audit Committee Terms of reference of the Audit Committee
covers the areas mentioned in Section 177 of the Companies Act, 2013 and Regulation 18 read with Part C of Schedule II to the SEBI Listing Regulations.
Terms of reference of the Audit Committee, inter alia, includes the following:
a) Oversight of the Company’s financial reporting process and disclosure of its financial information to ensure that the financial statements are correct, sufficient and credible.
b) Examination of the Company’s financial statements and Auditor’s Report on the same.
c) Discuss and review with the Management and Auditors, the annual/ quarterly financial statements before submission to the Board for approval.
d) Review of Management Discussion and Analysis of financial condition and results of operations.
e) Recommend to the Board appointment, re-appointment, removal of the Statutory Auditors, fixation of audit fee and approval for payment for any non-audit services rendered by the Statutory Auditors.
f) Reviewing and monitoring the auditor’s independence & performance and effectiveness of audit process.
g) Review the appointment, removal and terms of remuneration of the Internal Auditor.
h) Review on a regular basis the adequacy of internal audit function, the structure of the internal audit department, approval of the internal audit plan and its execution, staffing and seniority of the official heading the department, reporting structure, coverage and frequency of internal audit.
Strides Pharma Science Limited
76
i) Review the findings of any internal investigations by the internal auditors into matters where there is suspected fraud or irregularity or a failure of internal control systems of a material nature and reporting the matter to the Board.
j) Discuss with internal auditors any significant findings and follow up thereon.
k) Review with Management, Statutory Auditors and Internal Auditors about the adequacy of internal control systems and related matters.
l) Review of Management letters/ letters of internal control weakness issued by Statutory Auditors/ Internal Auditors.
m) Review the appointment, removal and terms of remuneration payable to the Cost Auditor.
n) Evaluation of internal financial controls and risk management systems.
o) Review and approval of Related Party Transactions.
p) Reviewing the functioning of the Whistle Blower mechanism.
q) Review compliance of provisions of Insider Trading Regulations and verify that systems for internal control are adequate and operating effectively, at-least once in a Financial Year.
In addition, the Committee has discharged such other roles/ functions as envisaged under the Companies Act, 2013 and Listing Regulations.
5. Nomination and Remuneration Committee
5.1 Meetings of the Committee The Committee met 4 times during the period
under review on April 24, 2018, May 17, 2018, August 7, 2018 and January 29, 2019. Attendance of members at the Committee Meetings is provided at Item No. 3.1 above.
5.2 Terms of reference of the Committee Terms of reference of the Nomination and
Remuneration Committee (NRC) covers the areas mentioned in Section 178 of the Act and Regulation 19 read with Part D (A) of Schedule II to the SEBI Listing Regulations.
Terms of reference of the NRC, inter-alia are as follows:
a) To periodically review the size and composition of the Board to ensure that it is structured to make appropriate decisions, with a variety of perspectives and skills, in the best interests of the Company as a whole.
b) To formulate a criteria for determining qualifications, positive attributes and independence of a Director.
c) To formulate a criteria for evaluation of performance of all Independent Directors and the Board.
d) Committee to carry out evaluation of every Director’s performance.
e) To determine whether to extend or continue the term of appointment of the Independent Director, on the basis of the report of performance evaluation of independent directors.
f) To formulate criteria and evaluate the performance of the statutory committees of the Board viz., Audit Committee, Stakeholders Relationship Committee, Nomination & Remuneration Committee and Corporate Social Responsibility Committee.
g) To devise a policy on Board diversity and assist the Board in ensuring Board nomination process addresses diversity of gender, knowledge, experience, and perspective.
h) Identify persons who are qualified to become Directors and who may be appointed as Senior Management Personnel (SMP), in accordance with the criteria laid down in the policy.
i) To recommend to the Board the appointment and removal of Directors and SMP, in accordance with the criteria laid down in the policy.
j) To recommend to the Board, a policy relating to remuneration of Directors, Key Managerial Personnel (KMP) and SMP.
k) To recommend to the Board, all remuneration, in whatever form, payable to SMP.
l) To establish and review plans relating to orderly succession for appointment of the Board, KMP and SMP.
m) To assist the Board of Directors in the Board’s overall responsibilities relating to Employee Stock Option Plans, including the administration of the Company’s ESOP and other incentive plans and the interpretation and adoption of rules for the operation thereof.
To carry out any other function as may be mandated by the Board from time to time and/ or enforced by any statutory notification, amendment or modification, as may be applicable.

Statutory Reports | Corporate Governance Report
Annual Report 2018-19
77
5.4 Nomination and Remuneration Policy
The Company has formulated a Nomination and Remuneration Policy for the Board of Directors, Key Managerial Personnel and Senior Management Personnel of the Company which is uploaded on the website of the Company:
http://www.strides.com/investor-committeboard.html
5.5 Performance Evaluation The Nomination and Remuneration Committee
(NRC) has devised a criteria for evaluation of the performance of the Directors including Independent Directors (ID). The said criteria provides certain parameters like attendance, acquaintance with business, interpersonal relations with other directors and management etc., which is in compliance with applicable laws, regulations and guidelines.
Evaluation of performance is carried out once a year.
The evaluation is carried out based on the questionnaire and feedback form which forms part of the Board Evaluation policy of the Company.
Such an evaluation procedure provides a fine system of checks and balances on the performance of the directors and ensures that they exercise their powers in a rational manner.
With an aim to maintain a proactive and effective Board, NRC is committed to a continuing process of recommending and laying down the criteria to evaluate the performance of the entire Board of the Company.
The Chairperson of NRC in consultation with the members of the Committee carries out the evaluation of Directors and Committees of the Board.
5.6 Details of Remuneration to Directors Remuneration to Non-Executive Directors The Non-Executive Directors (NED) receive sitting
fees of `100,000/- each for attending each meeting of the Board and Audit Committee.
Recommendation of payment of commission to Non-Executive Directors
Considering the experience and expertise brought to the Board by the NEDs and in appreciation of their contribution and services, the Board of Directors in their meeting held on May 10, 2019 have recommended payment of commission upto 1% of the net profits of the Company in terms of the provisions of Section 197 of the Companies Act, 2013 and SEBI Listing Regulations.
It is proposed that such payment be effective from FY 2018-19, subject to approval of the Members.
The said remuneration shall be in addition to the sitting fee paid to them and out-of-pocket expenses incurred for attending meetings of the Board and various Board Committees thereof.
Approval of the Members for this matter shall be sought at the upcoming AGM of the Company.
For FY 2018-19, the Board of Directors have recommended a commission of `10 Lakh per Non-Executive Director under this provision, which shall be paid to them post Members’ approval at the ensuing AGM.
Details of remuneration paid/ payable to Non-Executive Directors during FY 2018-19 is as under:
# Name of the DirectorsSitting fee
(`)Commission
(`)*Total
(`)1 Deepak Vaidya 14,00,000 10,00,000 24,00,000
2 S Sridhar 16,00,000 10,00,000 26,00,000
3 Bharat Shah 16,00,000 10,00,000 26,00,0004 Sangita Reddy 4,00,000 10,00,000 14,00,0005 Homi Khusrokhan 14,00,000 10,00,000 24,00,000
Total 64,00,000 50,00,000 1,14,00,000
* Shall be paid post Members’ approval at the ensuing AGM.
Remuneration to Executive Directors The Company pays remuneration in combination of fixed and variable component to its Executive Directors.
Annual increments are recommended by the Nomination and Remuneration Committee in line with the remuneration approved by Members of the Company.
The Board of Directors, on the recommendation of the Nomination and Remuneration Committee, decides the remuneration payable to the Executive Directors out of the profits for the Financial Year and within the ceilings prescribed under the Act.
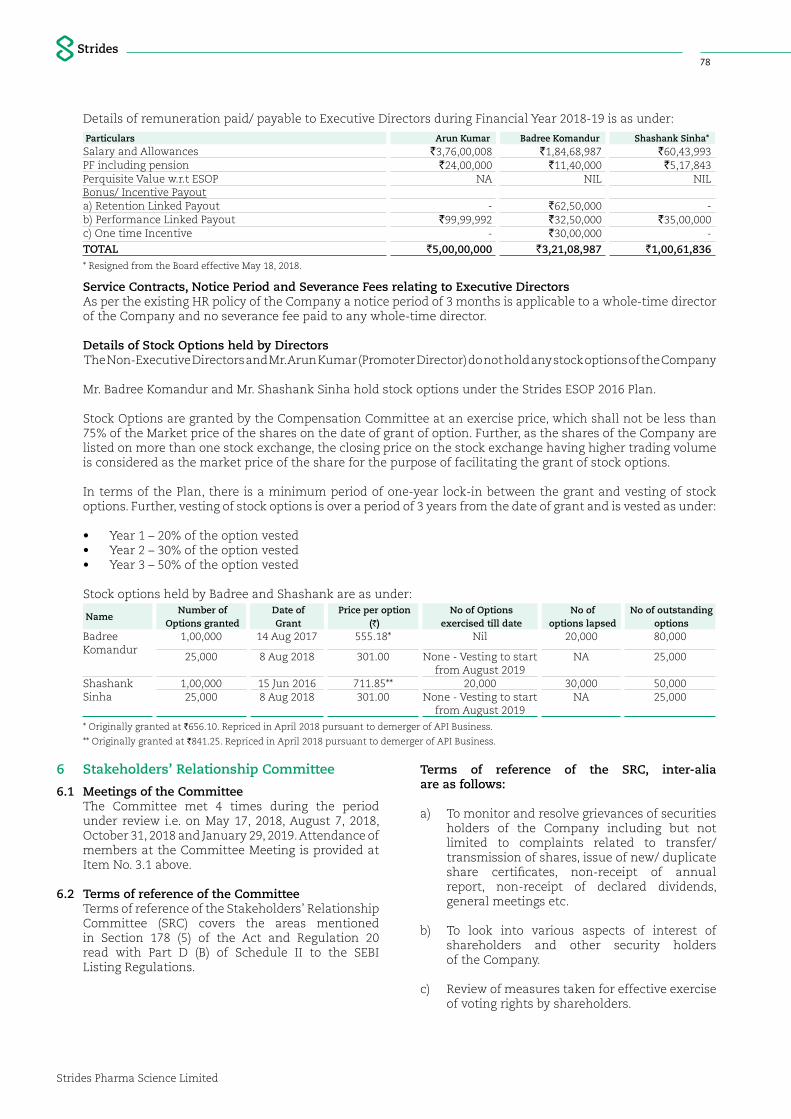
Strides Pharma Science Limited
78
Details of remuneration paid/ payable to Executive Directors during Financial Year 2018-19 is as under:
Particulars Arun Kumar Badree Komandur Shashank Sinha*Salary and Allowances `3,76,00,008 `1,84,68,987 `60,43,993PF including pension `24,00,000 `11,40,000 `5,17,843Perquisite Value w.r.t ESOP NA NIL NILBonus/ Incentive Payouta) Retention Linked Payout - `62,50,000 -b) Performance Linked Payout `99,99,992 `32,50,000 `35,00,000c) One time Incentive - `30,00,000 -
TOTAL `5,00,00,000 `3,21,08,987 `1,00,61,836 * Resigned from the Board effective May 18, 2018.
Service Contracts, Notice Period and Severance Fees relating to Executive Directors As per the existing HR policy of the Company a notice period of 3 months is applicable to a whole-time director
of the Company and no severance fee paid to any whole-time director.
Details of Stock Options held by Directors The Non-Executive Directors and Mr. Arun Kumar (Promoter Director) do not hold any stock options of the Company
Mr. Badree Komandur and Mr. Shashank Sinha hold stock options under the Strides ESOP 2016 Plan.
Stock Options are granted by the Compensation Committee at an exercise price, which shall not be less than 75% of the Market price of the shares on the date of grant of option. Further, as the shares of the Company are listed on more than one stock exchange, the closing price on the stock exchange having higher trading volume is considered as the market price of the share for the purpose of facilitating the grant of stock options.
In terms of the Plan, there is a minimum period of one-year lock-in between the grant and vesting of stock options. Further, vesting of stock options is over a period of 3 years from the date of grant and is vested as under:
• Year 1 – 20% of the option vested • Year 2 – 30% of the option vested • Year 3 – 50% of the option vested
Stock options held by Badree and Shashank are as under:
NameNumber of
Options grantedDate of Grant
Price per option(`)
No of Options exercised till date
No of options lapsed
No of outstanding options
Badree Komandur
1,00,000 14 Aug 2017 555.18* Nil 20,000 80,000
25,000 8 Aug 2018 301.00 None - Vesting to start from August 2019
NA 25,000
Shashank Sinha
1,00,000 15 Jun 2016 711.85** 20,000 30,000 50,00025,000 8 Aug 2018 301.00 None - Vesting to start
from August 2019NA 25,000
* Originally granted at `656.10. Repriced in April 2018 pursuant to demerger of API Business.
** Originally granted at `841.25. Repriced in April 2018 pursuant to demerger of API Business.
6 Stakeholders’ Relationship Committee
6.1 Meetings of the Committee The Committee met 4 times during the period
under review i.e. on May 17, 2018, August 7, 2018, October 31, 2018 and January 29, 2019. Attendance of members at the Committee Meeting is provided at Item No. 3.1 above.
6.2 Terms of reference of the Committee Terms of reference of the Stakeholders’ Relationship
Committee (SRC) covers the areas mentioned in Section 178 (5) of the Act and Regulation 20 read with Part D (B) of Schedule II to the SEBI Listing Regulations.
Terms of reference of the SRC, inter-alia are as follows:
a) To monitor and resolve grievances of securities holders of the Company including but not limited to complaints related to transfer/ transmission of shares, issue of new/ duplicate share certificates, non-receipt of annual report, non-receipt of declared dividends, general meetings etc.
b) To look into various aspects of interest of shareholders and other security holders of the Company.
c) Review of measures taken for effective exercise of voting rights by shareholders.
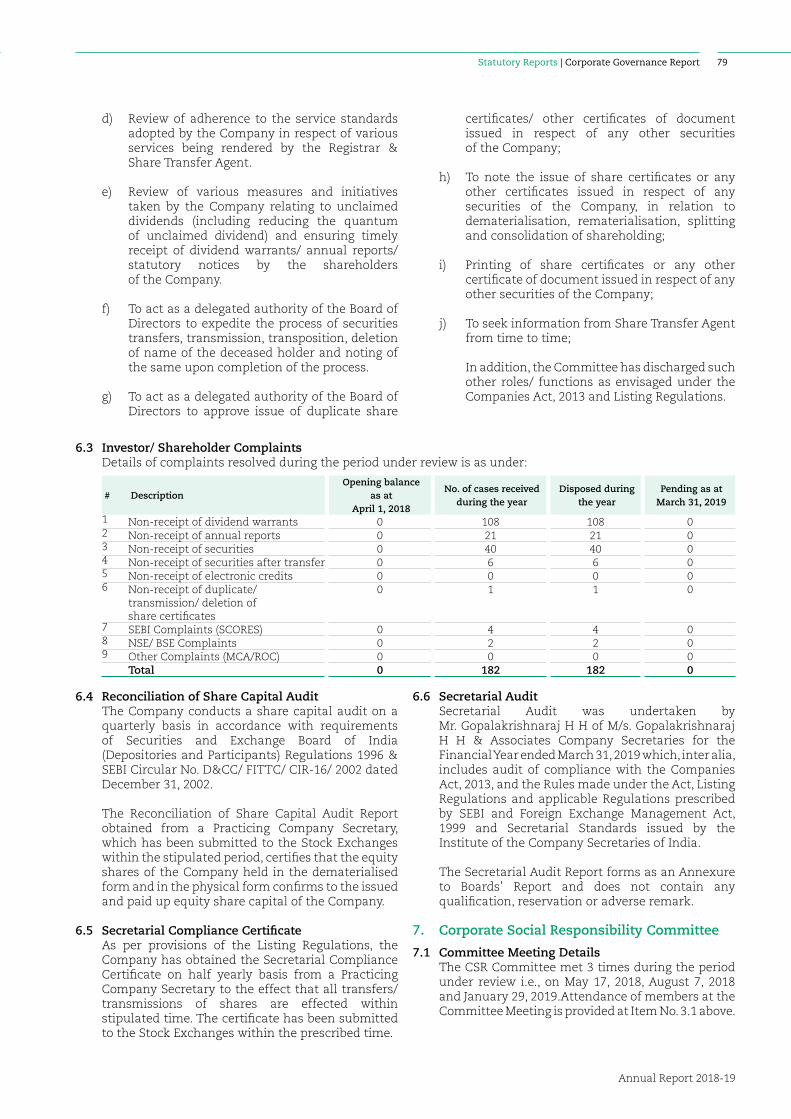
Statutory Reports | Corporate Governance Report
Annual Report 2018-19
79
d) Review of adherence to the service standards adopted by the Company in respect of various services being rendered by the Registrar & Share Transfer Agent.
e) Review of various measures and initiatives taken by the Company relating to unclaimed dividends (including reducing the quantum of unclaimed dividend) and ensuring timely receipt of dividend warrants/ annual reports/ statutory notices by the shareholders of the Company.
f) To act as a delegated authority of the Board of Directors to expedite the process of securities transfers, transmission, transposition, deletion of name of the deceased holder and noting of the same upon completion of the process.
g) To act as a delegated authority of the Board of Directors to approve issue of duplicate share
certificates/ other certificates of document issued in respect of any other securities of the Company;
h) To note the issue of share certificates or any other certificates issued in respect of any securities of the Company, in relation to dematerialisation, rematerialisation, splitting and consolidation of shareholding;
i) Printing of share certificates or any other certificate of document issued in respect of any other securities of the Company;
j) To seek information from Share Transfer Agent from time to time;
In addition, the Committee has discharged such other roles/ functions as envisaged under the Companies Act, 2013 and Listing Regulations.
6.3 Investor/ Shareholder Complaints Details of complaints resolved during the period under review is as under:
# DescriptionOpening balance
as at April 1, 2018
No. of cases received during the year
Disposed during the year
Pending as at March 31, 2019
1 Non-receipt of dividend warrants 0 108 108 02 Non-receipt of annual reports 0 21 21 03 Non-receipt of securities 0 40 40 04 Non-receipt of securities after transfer 0 6 6 05 Non-receipt of electronic credits 0 0 0 06 Non-receipt of duplicate/
transmission/ deletion of share certificates
0 1 1 0
7 SEBI Complaints (SCORES) 0 4 4 08 NSE/ BSE Complaints 0 2 2 09 Other Complaints (MCA/ROC) 0 0 0 0 Total 0 182 182 0
6.4 Reconciliation of Share Capital Audit The Company conducts a share capital audit on a
quarterly basis in accordance with requirements of Securities and Exchange Board of India (Depositories and Participants) Regulations 1996 & SEBI Circular No. D&CC/ FITTC/ CIR-16/ 2002 dated December 31, 2002.
The Reconciliation of Share Capital Audit Report obtained from a Practicing Company Secretary, which has been submitted to the Stock Exchanges within the stipulated period, certifies that the equity shares of the Company held in the dematerialised form and in the physical form confirms to the issued and paid up equity share capital of the Company.
6.5 Secretarial Compliance Certificate As per provisions of the Listing Regulations, the
Company has obtained the Secretarial Compliance Certificate on half yearly basis from a Practicing Company Secretary to the effect that all transfers/ transmissions of shares are effected within stipulated time. The certificate has been submitted to the Stock Exchanges within the prescribed time.
6.6 Secretarial Audit Secretarial Audit was undertaken by
Mr. Gopalakrishnaraj H H of M/s. Gopalakrishnaraj H H & Associates Company Secretaries for the Financial Year ended March 31, 2019 which, inter alia, includes audit of compliance with the Companies Act, 2013, and the Rules made under the Act, Listing Regulations and applicable Regulations prescribed by SEBI and Foreign Exchange Management Act, 1999 and Secretarial Standards issued by the Institute of the Company Secretaries of India.
The Secretarial Audit Report forms as an Annexure to Boards’ Report and does not contain any qualification, reservation or adverse remark.
7. Corporate Social Responsibility Committee
7.1 Committee Meeting Details The CSR Committee met 3 times during the period
under review i.e., on May 17, 2018, August 7, 2018 and January 29, 2019.Attendance of members at the Committee Meeting is provided at Item No. 3.1 above.
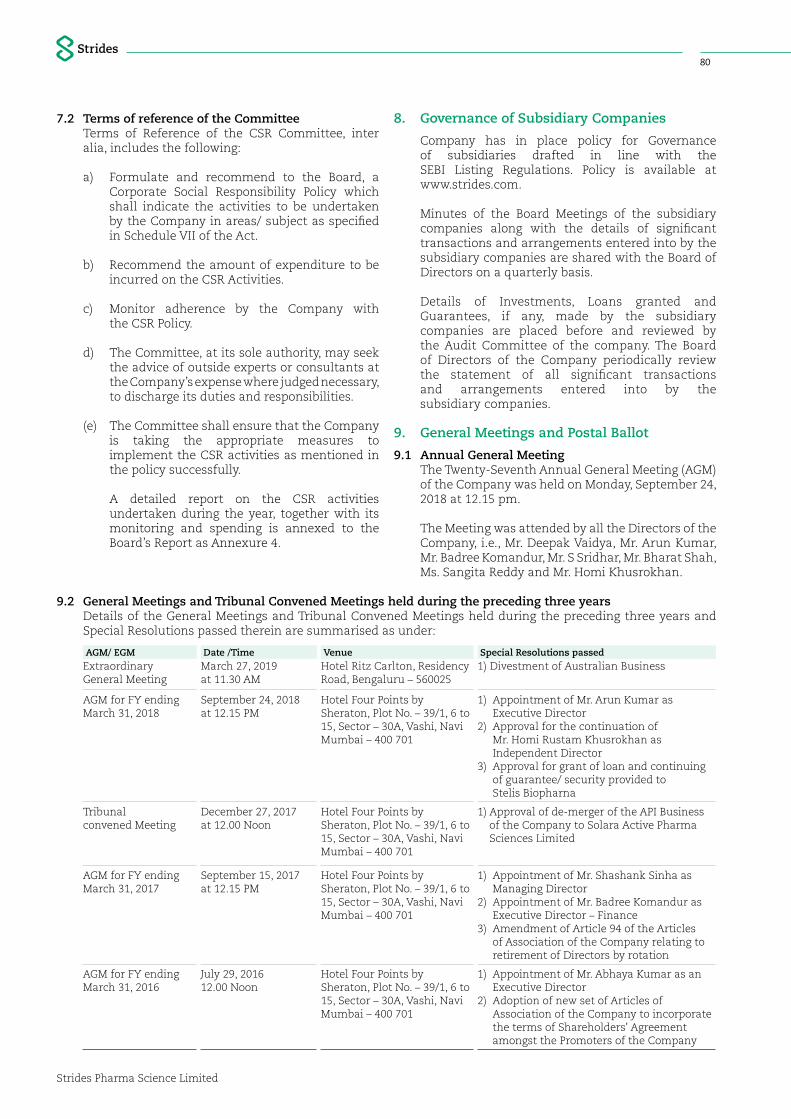
Strides Pharma Science Limited
80
7.2 Terms of reference of the Committee Terms of Reference of the CSR Committee, inter
alia, includes the following:
a) Formulate and recommend to the Board, a Corporate Social Responsibility Policy which shall indicate the activities to be undertaken by the Company in areas/ subject as specified in Schedule VII of the Act.
b) Recommend the amount of expenditure to be incurred on the CSR Activities.
c) Monitor adherence by the Company with the CSR Policy.
d) The Committee, at its sole authority, may seek the advice of outside experts or consultants at the Company’s expense where judged necessary, to discharge its duties and responsibilities.
(e) The Committee shall ensure that the Company is taking the appropriate measures to implement the CSR activities as mentioned in the policy successfully.
A detailed report on the CSR activities undertaken during the year, together with its monitoring and spending is annexed to the Board’s Report as Annexure 4.
8. Governance of Subsidiary Companies
Company has in place policy for Governance of subsidiaries drafted in line with the SEBI Listing Regulations. Policy is available at www.strides.com.
Minutes of the Board Meetings of the subsidiary companies along with the details of significant transactions and arrangements entered into by the subsidiary companies are shared with the Board of Directors on a quarterly basis.
Details of Investments, Loans granted and Guarantees, if any, made by the subsidiary companies are placed before and reviewed by the Audit Committee of the company. The Board of Directors of the Company periodically review the statement of all significant transactions and arrangements entered into by the subsidiary companies.
9. General Meetings and Postal Ballot
9.1 Annual General Meeting The Twenty-Seventh Annual General Meeting (AGM)
of the Company was held on Monday, September 24, 2018 at 12.15 pm.
The Meeting was attended by all the Directors of the Company, i.e., Mr. Deepak Vaidya, Mr. Arun Kumar, Mr. Badree Komandur, Mr. S Sridhar, Mr. Bharat Shah, Ms. Sangita Reddy and Mr. Homi Khusrokhan.
9.2 General Meetings and Tribunal Convened Meetings held during the preceding three years Details of the General Meetings and Tribunal Convened Meetings held during the preceding three years and
Special Resolutions passed therein are summarised as under:
AGM/ EGM Date /Time Venue Special Resolutions passedExtraordinary General Meeting
March 27, 2019 at 11.30 AM
Hotel Ritz Carlton, Residency Road, Bengaluru – 560025
1) Divestment of Australian Business
AGM for FY ending March 31, 2018
September 24, 2018 at 12.15 PM
Hotel Four Points by Sheraton, Plot No. – 39/1, 6 to 15, Sector – 30A, Vashi, Navi Mumbai – 400 701
1) Appointment of Mr. Arun Kumar as Executive Director
2) Approval for the continuation of Mr. Homi Rustam Khusrokhan as Independent Director
3) Approval for grant of loan and continuing of guarantee/ security provided to Stelis Biopharna
Tribunal convened Meeting
December 27, 2017 at 12.00 Noon
Hotel Four Points by Sheraton, Plot No. – 39/1, 6 to 15, Sector – 30A, Vashi, Navi Mumbai – 400 701
1) Approval of de-merger of the API Business of the Company to Solara Active Pharma Sciences Limited
AGM for FY ending March 31, 2017
September 15, 2017 at 12.15 PM
Hotel Four Points by Sheraton, Plot No. – 39/1, 6 to 15, Sector – 30A, Vashi, Navi Mumbai – 400 701
1) Appointment of Mr. Shashank Sinha as Managing Director
2) Appointment of Mr. Badree Komandur as Executive Director – Finance
3) Amendment of Article 94 of the Articles of Association of the Company relating to retirement of Directors by rotation
AGM for FY ending March 31, 2016
July 29, 201612.00 Noon
Hotel Four Points by Sheraton, Plot No. – 39/1, 6 to 15, Sector – 30A, Vashi, Navi Mumbai – 400 701
1) Appointment of Mr. Abhaya Kumar as an Executive Director
2) Adoption of new set of Articles of Association of the Company to incorporate the terms of Shareholders' Agreement amongst the Promoters of the Company
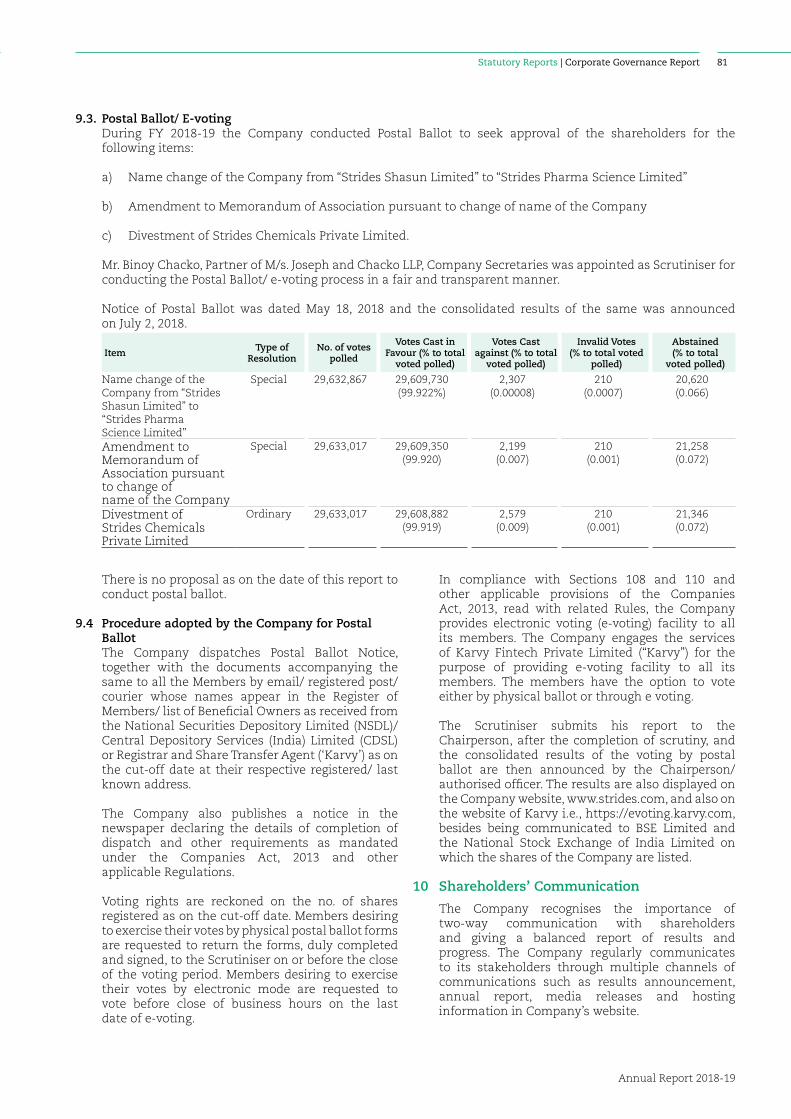
Statutory Reports | Corporate Governance Report
Annual Report 2018-19
81
9.3. Postal Ballot/ E-voting During FY 2018-19 the Company conducted Postal Ballot to seek approval of the shareholders for the
following items:
a) Name change of the Company from “Strides Shasun Limited” to “Strides Pharma Science Limited”
b) Amendment to Memorandum of Association pursuant to change of name of the Company
c) Divestment of Strides Chemicals Private Limited.
Mr. Binoy Chacko, Partner of M/s. Joseph and Chacko LLP, Company Secretaries was appointed as Scrutiniser for conducting the Postal Ballot/ e-voting process in a fair and transparent manner.
Notice of Postal Ballot was dated May 18, 2018 and the consolidated results of the same was announced on July 2, 2018.
Item Type of Resolution
No. of votes polled
Votes Cast in Favour (% to total
voted polled)
Votes Cast against (% to total
voted polled)
Invalid Votes(% to total voted
polled)
Abstained(% to total
voted polled)
Name change of the Company from “Strides Shasun Limited” to “Strides Pharma Science Limited”
Special 29,632,867 29,609,730(99.922%)
2,307(0.00008)
210(0.0007)
20,620(0.066)
Amendment to Memorandum of Association pursuant to change of name of the Company
Special 29,633,017 29,609,350(99.920)
2,199(0.007)
210(0.001)
21,258(0.072)
Divestment of Strides Chemicals Private Limited
Ordinary 29,633,017 29,608,882(99.919)
2,579(0.009)
210(0.001)
21,346(0.072)
There is no proposal as on the date of this report to conduct postal ballot.
9.4 Procedure adopted by the Company for Postal Ballot
The Company dispatches Postal Ballot Notice, together with the documents accompanying the same to all the Members by email/ registered post/ courier whose names appear in the Register of Members/ list of Beneficial Owners as received from the National Securities Depository Limited (NSDL)/ Central Depository Services (India) Limited (CDSL) or Registrar and Share Transfer Agent (‘Karvy’) as on the cut-off date at their respective registered/ last known address.
The Company also publishes a notice in the newspaper declaring the details of completion of dispatch and other requirements as mandated under the Companies Act, 2013 and other applicable Regulations.
Voting rights are reckoned on the no. of shares registered as on the cut-off date. Members desiring to exercise their votes by physical postal ballot forms are requested to return the forms, duly completed and signed, to the Scrutiniser on or before the close of the voting period. Members desiring to exercise their votes by electronic mode are requested to vote before close of business hours on the last date of e-voting.
In compliance with Sections 108 and 110 and other applicable provisions of the Companies Act, 2013, read with related Rules, the Company provides electronic voting (e-voting) facility to all its members. The Company engages the services of Karvy Fintech Private Limited (“Karvy”) for the purpose of providing e-voting facility to all its members. The members have the option to vote either by physical ballot or through e voting.
The Scrutiniser submits his report to the Chairperson, after the completion of scrutiny, and the consolidated results of the voting by postal ballot are then announced by the Chairperson/ authorised officer. The results are also displayed on the Company website, www.strides.com, and also on the website of Karvy i.e., https://evoting.karvy.com, besides being communicated to BSE Limited and the National Stock Exchange of India Limited on which the shares of the Company are listed.
10 Shareholders’ Communication
The Company recognises the importance of two-way communication with shareholders and giving a balanced report of results and progress. The Company regularly communicates to its stakeholders through multiple channels of communications such as results announcement, annual report, media releases and hosting information in Company’s website.
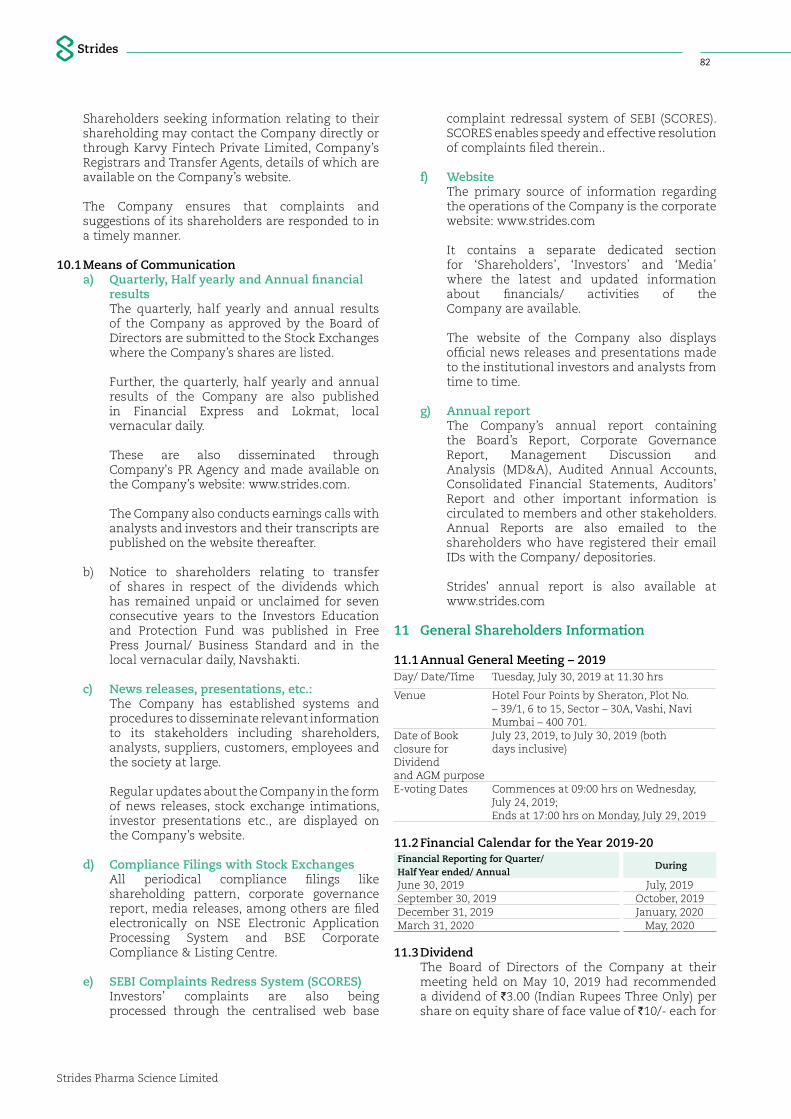
Strides Pharma Science Limited
82
Shareholders seeking information relating to their shareholding may contact the Company directly or through Karvy Fintech Private Limited, Company’s Registrars and Transfer Agents, details of which are available on the Company’s website.
The Company ensures that complaints and suggestions of its shareholders are responded to in a timely manner.
10.1 Means of Communication a) Quarterly, Half yearly and Annual financial
results The quarterly, half yearly and annual results
of the Company as approved by the Board of Directors are submitted to the Stock Exchanges where the Company’s shares are listed.
Further, the quarterly, half yearly and annual results of the Company are also published in Financial Express and Lokmat, local vernacular daily.
These are also disseminated through Company's PR Agency and made available on the Company’s website: www.strides.com.
The Company also conducts earnings calls with analysts and investors and their transcripts are published on the website thereafter.
b) Notice to shareholders relating to transfer of shares in respect of the dividends which has remained unpaid or unclaimed for seven consecutive years to the Investors Education and Protection Fund was published in Free Press Journal/ Business Standard and in the local vernacular daily, Navshakti.
c) News releases, presentations, etc.: The Company has established systems and
procedures to disseminate relevant information to its stakeholders including shareholders, analysts, suppliers, customers, employees and the society at large.
Regular updates about the Company in the form of news releases, stock exchange intimations, investor presentations etc., are displayed on the Company’s website.
d) Compliance Filings with Stock Exchanges All periodical compliance filings like
shareholding pattern, corporate governance report, media releases, among others are filed electronically on NSE Electronic Application Processing System and BSE Corporate Compliance & Listing Centre.
e) SEBI Complaints Redress System (SCORES) Investors’ complaints are also being
processed through the centralised web base
complaint redressal system of SEBI (SCORES). SCORES enables speedy and effective resolution of complaints filed therein..
f) Website The primary source of information regarding
the operations of the Company is the corporate website: www.strides.com
It contains a separate dedicated section for ‘Shareholders’, ‘Investors’ and ‘Media’ where the latest and updated information about financials/ activities of the Company are available.
The website of the Company also displays official news releases and presentations made to the institutional investors and analysts from time to time.
g) Annual report The Company’s annual report containing
the Board’s Report, Corporate Governance Report, Management Discussion and Analysis (MD&A), Audited Annual Accounts, Consolidated Financial Statements, Auditors’ Report and other important information is circulated to members and other stakeholders. Annual Reports are also emailed to the shareholders who have registered their email IDs with the Company/ depositories.
Strides' annual report is also available at www.strides.com
11 General Shareholders Information
11.1 Annual General Meeting – 2019Day/ Date/Time Tuesday, July 30, 2019 at 11.30 hrs
Venue Hotel Four Points by Sheraton, Plot No. – 39/1, 6 to 15, Sector – 30A, Vashi, Navi Mumbai – 400 701.
Date of Book closure for Dividend and AGM purpose
July 23, 2019, to July 30, 2019 (both days inclusive)
E-voting Dates Commences at 09:00 hrs on Wednesday, July 24, 2019; Ends at 17:00 hrs on Monday, July 29, 2019
11.2 Financial Calendar for the Year 2019-20Financial Reporting for Quarter/ Half Year ended/ Annual
During
June 30, 2019 July, 2019September 30, 2019 October, 2019December 31, 2019 January, 2020March 31, 2020 May, 2020
11.3 Dividend The Board of Directors of the Company at their
meeting held on May 10, 2019 had recommended a dividend of `3.00 (Indian Rupees Three Only) per share on equity share of face value of `10/- each for
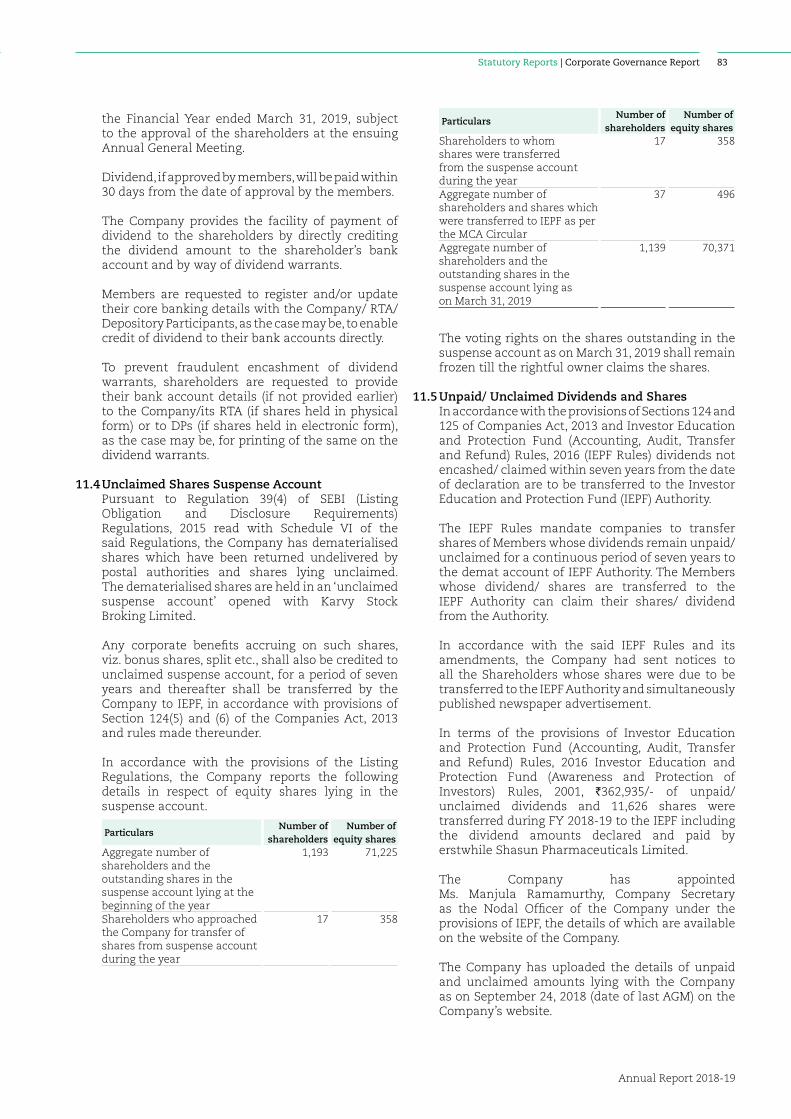
Statutory Reports | Corporate Governance Report
Annual Report 2018-19
83
the Financial Year ended March 31, 2019, subject to the approval of the shareholders at the ensuing Annual General Meeting.
Dividend, if approved by members, will be paid within 30 days from the date of approval by the members.
The Company provides the facility of payment of dividend to the shareholders by directly crediting the dividend amount to the shareholder’s bank account and by way of dividend warrants.
Members are requested to register and/or update their core banking details with the Company/ RTA/ Depository Participants, as the case may be, to enable credit of dividend to their bank accounts directly.
To prevent fraudulent encashment of dividend warrants, shareholders are requested to provide their bank account details (if not provided earlier) to the Company/its RTA (if shares held in physical form) or to DPs (if shares held in electronic form), as the case may be, for printing of the same on the dividend warrants.
11.4 Unclaimed Shares Suspense Account Pursuant to Regulation 39(4) of SEBI (Listing
Obligation and Disclosure Requirements) Regulations, 2015 read with Schedule VI of the said Regulations, the Company has dematerialised shares which have been returned undelivered by postal authorities and shares lying unclaimed. The dematerialised shares are held in an ‘unclaimed suspense account’ opened with Karvy Stock Broking Limited.
Any corporate benefits accruing on such shares, viz. bonus shares, split etc., shall also be credited to unclaimed suspense account, for a period of seven years and thereafter shall be transferred by the Company to IEPF, in accordance with provisions of Section 124(5) and (6) of the Companies Act, 2013 and rules made thereunder.
In accordance with the provisions of the Listing Regulations, the Company reports the following details in respect of equity shares lying in the suspense account.
ParticularsNumber of
shareholdersNumber of
equity sharesAggregate number of shareholders and the outstanding shares in the suspense account lying at the beginning of the year
1,193 71,225
Shareholders who approached the Company for transfer of shares from suspense account during the year
17 358
ParticularsNumber of
shareholdersNumber of
equity sharesShareholders to whom shares were transferred from the suspense account during the year
17 358
Aggregate number of shareholders and shares which were transferred to IEPF as per the MCA Circular
37 496
Aggregate number of shareholders and the outstanding shares in the suspense account lying as on March 31, 2019
1,139 70,371
The voting rights on the shares outstanding in the suspense account as on March 31, 2019 shall remain frozen till the rightful owner claims the shares.
11.5 Unpaid/ Unclaimed Dividends and Shares In accordance with the provisions of Sections 124 and
125 of Companies Act, 2013 and Investor Education and Protection Fund (Accounting, Audit, Transfer and Refund) Rules, 2016 (IEPF Rules) dividends not encashed/ claimed within seven years from the date of declaration are to be transferred to the Investor Education and Protection Fund (IEPF) Authority.
The IEPF Rules mandate companies to transfer shares of Members whose dividends remain unpaid/ unclaimed for a continuous period of seven years to the demat account of IEPF Authority. The Members whose dividend/ shares are transferred to the IEPF Authority can claim their shares/ dividend from the Authority.
In accordance with the said IEPF Rules and its amendments, the Company had sent notices to all the Shareholders whose shares were due to be transferred to the IEPF Authority and simultaneously published newspaper advertisement.
In terms of the provisions of Investor Education and Protection Fund (Accounting, Audit, Transfer and Refund) Rules, 2016 Investor Education and Protection Fund (Awareness and Protection of Investors) Rules, 2001, `362,935/- of unpaid/ unclaimed dividends and 11,626 shares were transferred during FY 2018-19 to the IEPF including the dividend amounts declared and paid by erstwhile Shasun Pharmaceuticals Limited.
The Company has appointed Ms. Manjula Ramamurthy, Company Secretary as the Nodal Officer of the Company under the provisions of IEPF, the details of which are available on the website of the Company.
The Company has uploaded the details of unpaid and unclaimed amounts lying with the Company as on September 24, 2018 (date of last AGM) on the Company’s website.
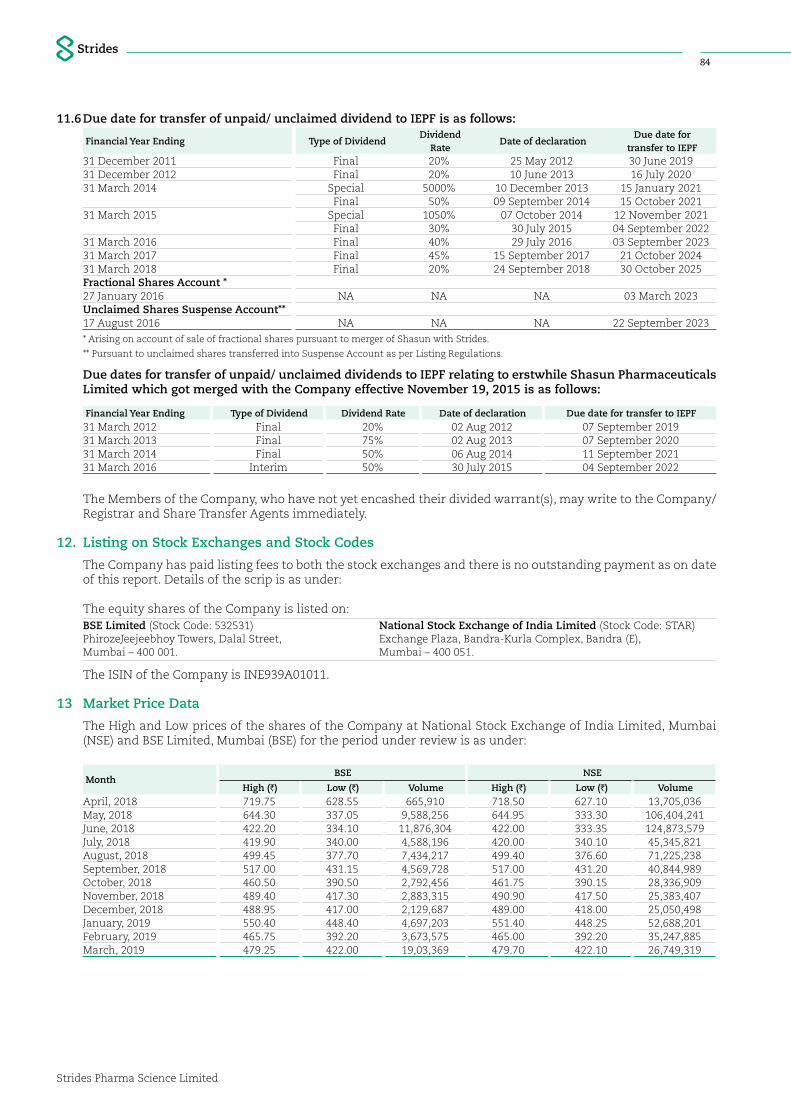
Strides Pharma Science Limited
84
11.6 Due date for transfer of unpaid/ unclaimed dividend to IEPF is as follows:
Financial Year Ending Type of DividendDividend
RateDate of declaration
Due date for transfer to IEPF
31 December 2011 Final 20% 25 May 2012 30 June 201931 December 2012 Final 20% 10 June 2013 16 July 202031 March 2014 Special 5000% 10 December 2013 15 January 2021
Final 50% 09 September 2014 15 October 202131 March 2015 Special 1050% 07 October 2014 12 November 2021
Final 30% 30 July 2015 04 September 202231 March 2016 Final 40% 29 July 2016 03 September 202331 March 2017 Final 45% 15 September 2017 21 October 202431 March 2018 Final 20% 24 September 2018 30 October 2025 Fractional Shares Account *27 January 2016 NA NA NA 03 March 2023Unclaimed Shares Suspense Account**17 August 2016 NA NA NA 22 September 2023
* Arising on account of sale of fractional shares pursuant to merger of Shasun with Strides.
** Pursuant to unclaimed shares transferred into Suspense Account as per Listing Regulations.
Due dates for transfer of unpaid/ unclaimed dividends to IEPF relating to erstwhile Shasun Pharmaceuticals Limited which got merged with the Company effective November 19, 2015 is as follows:
Financial Year Ending Type of Dividend Dividend Rate Date of declaration Due date for transfer to IEPF31 March 2012 Final 20% 02 Aug 2012 07 September 201931 March 2013 Final 75% 02 Aug 2013 07 September 202031 March 2014 Final 50% 06 Aug 2014 11 September 202131 March 2016 Interim 50% 30 July 2015 04 September 2022
The Members of the Company, who have not yet encashed their divided warrant(s), may write to the Company/ Registrar and Share Transfer Agents immediately.
12. Listing on Stock Exchanges and Stock Codes
The Company has paid listing fees to both the stock exchanges and there is no outstanding payment as on date of this report. Details of the scrip is as under:
The equity shares of the Company is listed on:BSE Limited (Stock Code: 532531)PhirozeJeejeebhoy Towers, Dalal Street, Mumbai – 400 001.
National Stock Exchange of India Limited (Stock Code: STAR)Exchange Plaza, Bandra-Kurla Complex, Bandra (E), Mumbai – 400 051.
The ISIN of the Company is INE939A01011.
13 Market Price Data
The High and Low prices of the shares of the Company at National Stock Exchange of India Limited, Mumbai (NSE) and BSE Limited, Mumbai (BSE) for the period under review is as under:
MonthBSE NSE
High (`) Low (`) Volume High (`) Low (`) Volume
April, 2018 719.75 628.55 665,910 718.50 627.10 13,705,036May, 2018 644.30 337.05 9,588,256 644.95 333.30 106,404,241June, 2018 422.20 334.10 11,876,304 422.00 333.35 124,873,579July, 2018 419.90 340.00 4,588,196 420.00 340.10 45,345,821August, 2018 499.45 377.70 7,434,217 499.40 376.60 71,225,238September, 2018 517.00 431.15 4,569,728 517.00 431.20 40,844,989October, 2018 460.50 390.50 2,792,456 461.75 390.15 28,336,909November, 2018 489.40 417.30 2,883,315 490.90 417.50 25,383,407December, 2018 488.95 417.00 2,129,687 489.00 418.00 25,050,498January, 2019 550.40 448.40 4,697,203 551.40 448.25 52,688,201February, 2019 465.75 392.20 3,673,575 465.00 392.20 35,247,885March, 2019 479.25 422.00 19,03,369 479.70 422.10 26,749,319

Statutory Reports | Corporate Governance Report
Annual Report 2018-19
85
15. Share Transfer System
The Company has appointed Karvy Fintech Private Limited, Hyderabad, as its Registrar and Share Transfer Agents (Karvy) to expedite the process of share transfers. All queries and requests relating to share transfers/ transmission may be addressed to Karvy. The share transfers lodged are being processed on a day-to-day basis and Memorandum of Transfers is generated on a fortnightly basis.
16. Distribution of Shareholding as on March 31, 2019
Slab of ShareholdingNo. of
Shareholders% to Total Number
of ShareholdersNo. of Shares
Amount(`)
% to paid up capital
1 – 5,000 75,937 95.64 5,241,420 52,414,200.00 5.855,001 – 10,000 1,788 2.25 1,353,416 13,534,160.00 1.5110,001-20,000 832 1.05 1,213,010 12,130,100.00 1.3520,001-30,000 253 0.32 633,307 6,333,070.00 0.7130,001-40,000 114 0.14 406,458 4,064,580.00 0.4540,001-50,000 75 0.09 351,258 3,512,580.00 0.3950,001-1,00,000 139 0.18 1,019,166 10,191,660.00 1.141,00,001 and above 258 0.32 79,331,441 793,314,410.00 88.59TOTAL 79,396 100.00 89,549,476 895,494,760.00 100.00
17. Shareholding Pattern as at March 31, 2019
# Category No. of shares held% to total
shareholding1. Indian Promoters 2,79,71,322 31.242. Mutual Funds 2,00,44,710 22.383. Banks, Indian Financial Institutions, Insurance Companies 9,89,047 1.104. Foreign Institutional Investors/ Foreign Portfolio Investors 2,25,91,453 25.235. Bodies Corporate & NBFC 29,44,791 3.296. Non-Resident Indians/ Foreign Nationals/ Overseas Corporate Bodies 19,86,440 2.227. Others (including Indian Public, Clearing Members, Trust, etc) 1,30,21,713 14.54
TOTAL 89,549,476 100.00
18 Dematerialisation of Shares & Liquidity
The Company's shares are traded in dematerialised form. The Company has established connectivity with both the Depositories viz., National Securities Depository Limited (NSDL) and Central Depository Services (India) Limited (CDSL) through the Registrar, Karvy Fintech Private Limited.
As at March 31, 2019, 99.83% of the paid-up share capital of the Company representing 89,396,070 shares has been dematerialised and balance 0.17% representing 153,406 shares of the Company is in physical form.
Members who continue to hold shares in physical form are advised to dematerialise their shares at the earliest. Further, in line with the various SEBI circulars, Members are also requested to update their PAN and Bank details. For any clarification, assistance or information – members may contact the Company or Karvy.
19 Employee Stock Options
Statement providing detailed information on stock options granted to Employees under the Company’s Employee Stock Option Schemes as required under the SEBI Regulation is annexed to the Board’s Report as Annexure 2.
14. Performance of Strides Pharma Science Limited Share Price to Broad Based Index (BSE Sensex and NSE Nifty)
NSE Chart BSE Chart
12000750
600
450
300
150
11400
10800
10200
9600
9000
Ap
r-18
STAR (LHS) Nifty (RHS)
May
-18
Jun
-18
Jul-
18
Au
g-18
Sep
-18
Oct
-18
Nov
-18
Dec
-18
Jan
-19
Feb
-19
Mar
-19
40000750
600
450
300
150
Ap
r-18
May
-18
Jun
-18
Jul-
18
Au
g-18
Sep
-18
Oct
-18
Nov
-18
Dec
-18
Jan
-19
Feb
-19
Mar
-19
0
38000
36000
34000
32000
30000
STAR (LHS) Sensex (LHS)
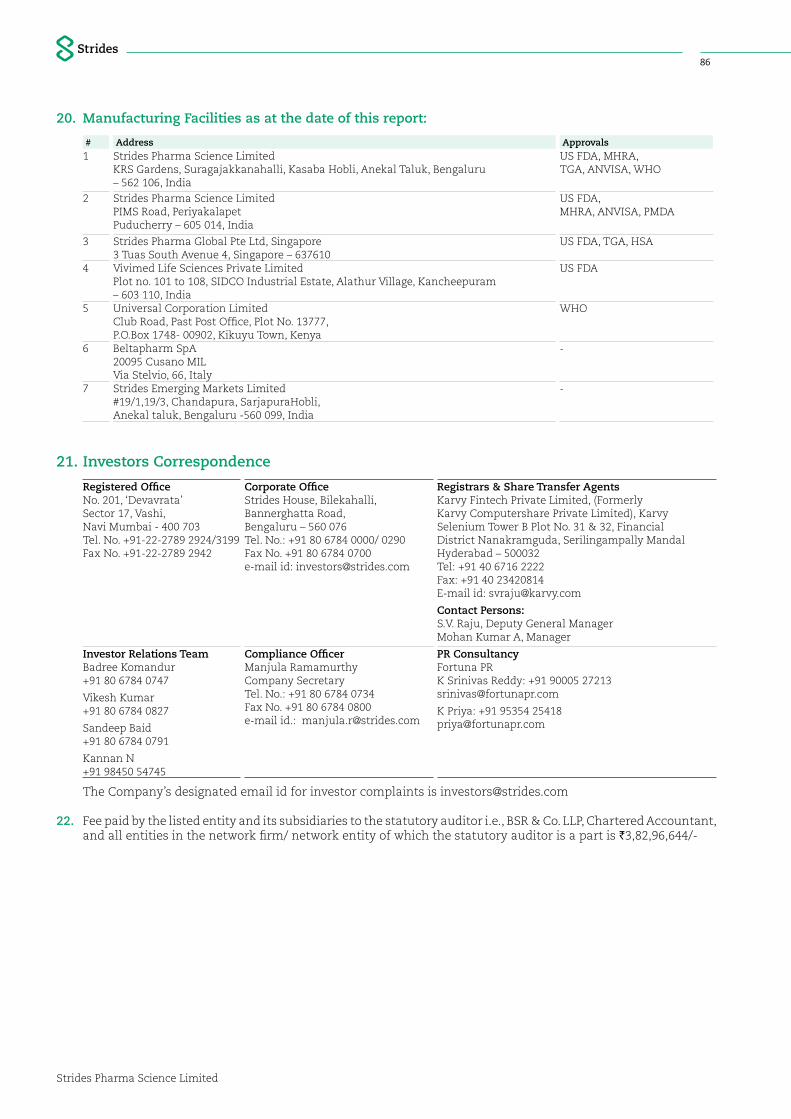
Strides Pharma Science Limited
86
20. Manufacturing Facilities as at the date of this report:
# Address Approvals1 Strides Pharma Science Limited
KRS Gardens, Suragajakkanahalli, Kasaba Hobli, Anekal Taluk, Bengaluru – 562 106, India
US FDA, MHRA, TGA, ANVISA, WHO
2 Strides Pharma Science LimitedPIMS Road, Periyakalapet Puducherry – 605 014, India
US FDA, MHRA, ANVISA, PMDA
3 Strides Pharma Global Pte Ltd, Singapore3 Tuas South Avenue 4, Singapore – 637610
US FDA, TGA, HSA
4 Vivimed Life Sciences Private LimitedPlot no. 101 to 108, SIDCO Industrial Estate, Alathur Village, Kancheepuram – 603 110, India
US FDA
5 Universal Corporation LimitedClub Road, Past Post Office, Plot No. 13777,P.O.Box 1748- 00902, Kikuyu Town, Kenya
WHO
6 Beltapharm SpA20095 Cusano MILVia Stelvio, 66, Italy
-
7 Strides Emerging Markets Limited#19/1,19/3, Chandapura, SarjapuraHobli,Anekal taluk, Bengaluru -560 099, India
-
21. Investors Correspondence
Registered Office No. 201, ‘Devavrata’Sector 17, Vashi,Navi Mumbai - 400 703Tel. No. +91-22-2789 2924/3199Fax No. +91-22-2789 2942
Corporate Office Strides House, Bilekahalli, Bannerghatta Road,Bengaluru – 560 076Tel. No.: +91 80 6784 0000/ 0290Fax No. +91 80 6784 0700e-mail id: [email protected]
Registrars & Share Transfer AgentsKarvy Fintech Private Limited, (Formerly Karvy Computershare Private Limited), Karvy Selenium Tower B Plot No. 31 & 32, Financial District Nanakramguda, Serilingampally Mandal Hyderabad – 500032Tel: +91 40 6716 2222Fax: +91 40 23420814E-mail id: [email protected]
Contact Persons:S.V. Raju, Deputy General ManagerMohan Kumar A, Manager
Investor Relations TeamBadree Komandur +91 80 6784 0747
Vikesh Kumar+91 80 6784 0827
Sandeep Baid +91 80 6784 0791
Kannan N+91 98450 54745
Compliance OfficerManjula RamamurthyCompany SecretaryTel. No.: +91 80 6784 0734Fax No. +91 80 6784 0800e-mail id.: [email protected]
PR Consultancy Fortuna PR K Srinivas Reddy: +91 90005 27213 [email protected]
K Priya: +91 95354 25418 [email protected]
The Company’s designated email id for investor complaints is [email protected]
22. Fee paid by the listed entity and its subsidiaries to the statutory auditor i.e., BSR & Co. LLP, Chartered Accountant, and all entities in the network firm/ network entity of which the statutory auditor is a part is `3,82,96,644/-
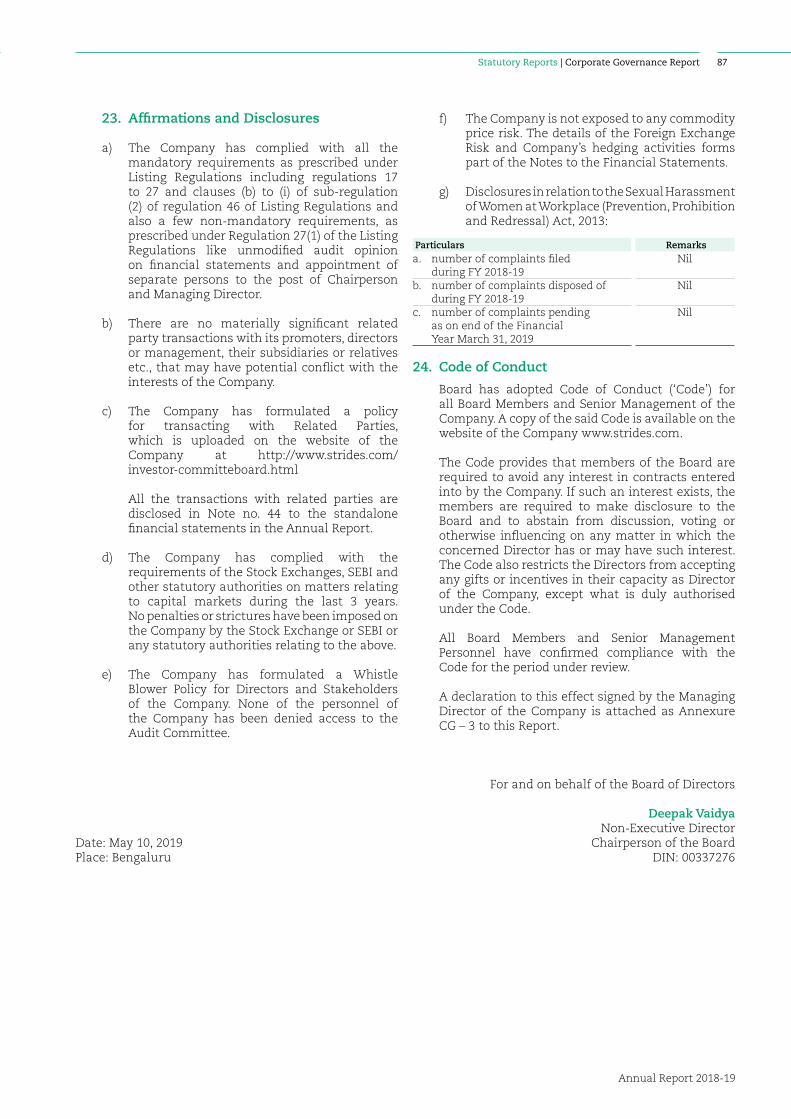
Statutory Reports | Corporate Governance Report
Annual Report 2018-19
87
23. Affirmations and Disclosures
a) The Company has complied with all the mandatory requirements as prescribed under Listing Regulations including regulations 17 to 27 and clauses (b) to (i) of sub-regulation (2) of regulation 46 of Listing Regulations and also a few non-mandatory requirements, as prescribed under Regulation 27(1) of the Listing Regulations like unmodified audit opinion on financial statements and appointment of separate persons to the post of Chairperson and Managing Director.
b) There are no materially significant related party transactions with its promoters, directors or management, their subsidiaries or relatives etc., that may have potential conflict with the interests of the Company.
c) The Company has formulated a policy for transacting with Related Parties, which is uploaded on the website of the Company at http://www.strides.com/ investor-committeboard.html
All the transactions with related parties are disclosed in Note no. 44 to the standalone financial statements in the Annual Report.
d) The Company has complied with the requirements of the Stock Exchanges, SEBI and other statutory authorities on matters relating to capital markets during the last 3 years. No penalties or strictures have been imposed on the Company by the Stock Exchange or SEBI or any statutory authorities relating to the above.
e) The Company has formulated a Whistle Blower Policy for Directors and Stakeholders of the Company. None of the personnel of the Company has been denied access to the Audit Committee.
f) The Company is not exposed to any commodity price risk. The details of the Foreign Exchange Risk and Company’s hedging activities forms part of the Notes to the Financial Statements.
g) Disclosures in relation to the Sexual Harassment of Women at Workplace (Prevention, Prohibition and Redressal) Act, 2013:
Particulars Remarksa. number of complaints filed
during FY 2018-19Nil
b. number of complaints disposed of during FY 2018-19
Nil
c. number of complaints pending as on end of the Financial Year March 31, 2019
Nil
24. Code of Conduct
Board has adopted Code of Conduct (‘Code’) for all Board Members and Senior Management of the Company. A copy of the said Code is available on the website of the Company www.strides.com.
The Code provides that members of the Board are required to avoid any interest in contracts entered into by the Company. If such an interest exists, the members are required to make disclosure to the Board and to abstain from discussion, voting or otherwise influencing on any matter in which the concerned Director has or may have such interest. The Code also restricts the Directors from accepting any gifts or incentives in their capacity as Director of the Company, except what is duly authorised under the Code.
All Board Members and Senior Management Personnel have confirmed compliance with the Code for the period under review.
A declaration to this effect signed by the Managing Director of the Company is attached as Annexure CG – 3 to this Report.
For and on behalf of the Board of Directors
Deepak Vaidya
Date: May 10, 2019Non-Executive Director
Chairperson of the BoardPlace: Bengaluru DIN: 00337276
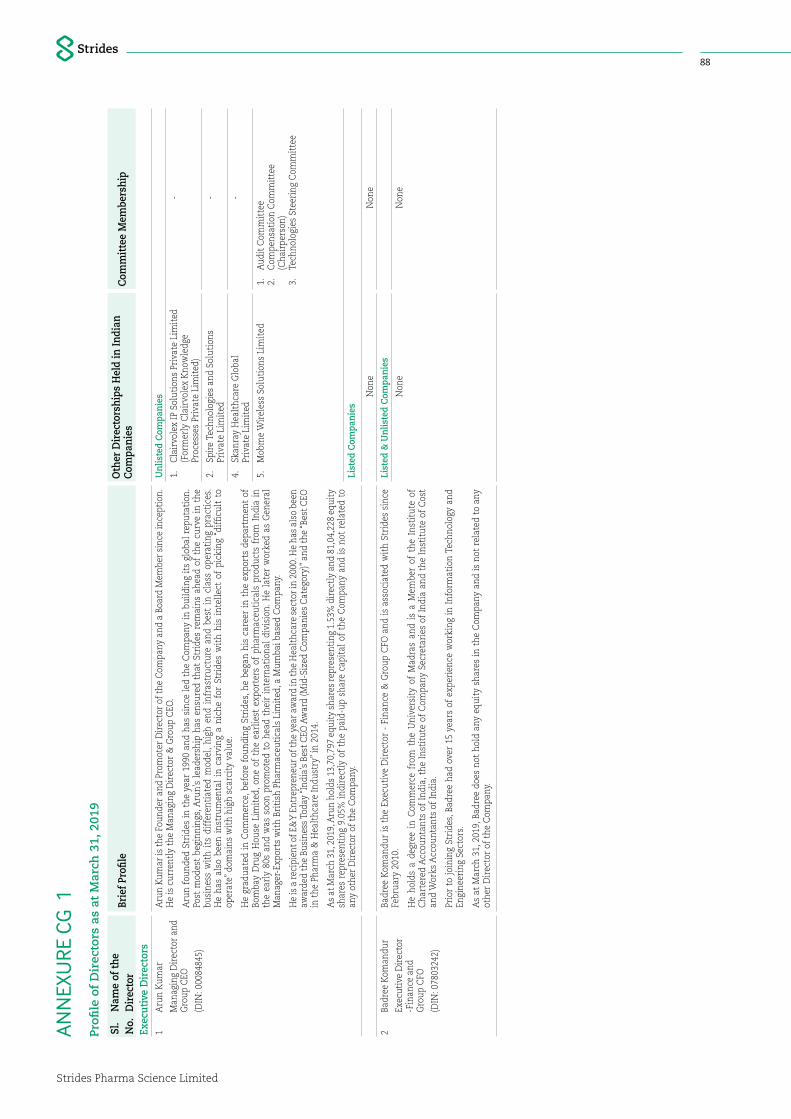
Strides Pharma Science Limited
88
Profi
le o
f D
irec
tors
as
at M
arch
31,
201
9
Sl.
No.
Nam
e of
the
Dir
ecto
rBr
ief P
rofil
eO
ther
Dir
ecto
rshi
ps H
eld
in In
dian
C
ompa
nies
Com
mit
tee
Mem
bers
hip
Exec
utiv
e D
irec
tors
1A
run
Kum
ar
Man
agin
g D
irec
tor
and
Gro
up C
EO
(DIN
: 000
8484
5)
Aru
n Ku
mar
is th
e Fo
unde
r an
d Pr
omot
er D
irec
tor
of th
e C
ompa
ny a
nd a
Boa
rd M
embe
r si
nce
ince
ptio
n.
He
is c
urre
ntly
the
Man
agin
g D
irec
tor
& G
roup
CEO
.
Aru
n fo
unde
d St
ride
s in
the
yea
r 19
90 a
nd h
as s
ince
led
the
Com
pany
in b
uild
ing
its
glob
al r
eput
atio
n.
Post
mod
est
begi
nnin
gs, A
run’
s le
ader
ship
has
ens
ured
tha
t St
ride
s re
mai
ns a
head
of
the
curv
e in
the
bu
sine
ss w
ith
its
diff
eren
tiat
ed m
odel
, hi
gh e
nd i
nfra
stru
ctur
e an
d be
st i
n cl
ass
oper
atin
g pr
acti
ces.
H
e ha
s al
so b
een
inst
rum
enta
l in
car
ving
a n
iche
for
Str
ides
wit
h hi
s in
telle
ct o
f pi
ckin
g “d
iffic
ult
to
oper
ate”
dom
ains
wit
h hi
gh s
carc
ity
valu
e.
He
grad
uate
d in
Com
mer
ce, b
efor
e fo
undi
ng S
trid
es, h
e be
gan
his
care
er in
the
exp
orts
dep
artm
ent
of
Bom
bay
Dru
g H
ouse
Lim
ited
, one
of
the
earl
iest
exp
orte
rs o
f ph
arm
aceu
tica
ls p
rodu
cts
from
Ind
ia i
n th
e ea
rly
80s
and
was
soo
n pr
omot
ed t
o he
ad t
heir
int
erna
tion
al d
ivis
ion.
He
late
r w
orke
d as
Gen
eral
M
anag
er-E
xpor
ts w
ith
Brit
ish
Phar
mac
euti
cals
Lim
ited
, a M
umba
i bas
ed C
ompa
ny.
He
is a
reci
pien
t of E
&Y
Ent
repr
eneu
r of
the
year
aw
ard
in th
e H
ealt
hcar
e se
ctor
in 2
000.
He
has
also
bee
n aw
arde
d th
e Bu
sine
ss T
oday
“Ind
ia’s
Bes
t CEO
Aw
ard
(Mid
-Siz
ed C
ompa
nies
Cat
egor
y)” a
nd th
e “B
est C
EO
in t
he P
harm
a &
Hea
lthc
are
Indu
stry
” in
2014
.
As
at M
arch
31,
201
9, A
run
hold
s 13
,70,
797
equi
ty s
hare
s re
pres
enti
ng 1
.53%
dir
ectl
y an
d 81
,04,
228
equi
ty
shar
es r
epre
sent
ing
9.05
% in
dire
ctly
of
the
paid
-up
shar
e ca
pita
l of
the
Com
pany
and
is n
ot r
elat
ed t
o an
y ot
her
Dir
ecto
r of
the
Com
pany
.
Unl
iste
d C
ompa
nies
1.
Cla
irvo
lex
IP S
olut
ions
Pri
vate
Lim
ited
(F
orm
erly
Cla
irvo
lex
Kno
wle
dge
Proc
esse
s Pr
ivat
e Li
mit
ed)
-
2.
Spir
e Te
chno
logi
es a
nd S
olut
ions
Pr
ivat
e Li
mit
ed-
4.
Skan
ray
Hea
lthc
are
Glo
bal
Priv
ate
Lim
ited
-
5.
Mob
me
Wir
eles
s So
luti
ons
Lim
ited
1.
Aud
it C
omm
itte
e2.
C
ompe
nsat
ion
Com
mit
tee
(Cha
irpe
rson
)3.
Te
chno
logi
es S
teer
ing
Com
mit
tee
List
ed C
ompa
nies
Non
eN
one
2Ba
dree
Kom
andu
r
Exec
utiv
e D
irec
tor
-Fin
ance
and
G
roup
CFO
(DIN
: 078
0324
2)
Badr
ee K
oman
dur
is t
he E
xecu
tive
Dir
ecto
r -
Fina
nce
& G
roup
CFO
and
is a
ssoc
iate
d w
ith
Stri
des
sinc
e Fe
brua
ry 2
010.
He
hold
s a
degr
ee i
n C
omm
erce
fro
m t
he U
nive
rsit
y of
Mad
ras
and
is a
Mem
ber
of t
he I
nsti
tute
of
Cha
rter
ed A
ccou
ntan
ts o
f In
dia,
the
Ins
titu
te o
f C
ompa
ny S
ecre
tari
es o
f In
dia
and
the
Inst
itut
e of
Cos
t an
d W
orks
Acc
ount
ants
of I
ndia
.
Prio
r to
join
ing
Stri
des,
Bad
ree
had
over
15
year
s of
exp
erie
nce
wor
king
in I
nfor
mat
ion
Tech
nolo
gy a
nd
Engi
neer
ing
Sect
ors.
As
at M
arch
31,
201
9, B
adre
e do
es n
ot h
old
any
equi
ty s
hare
s in
the
Com
pany
and
is n
ot r
elat
ed t
o an
y ot
her
Dir
ecto
r of
the
Com
pany
.
List
ed &
Unl
iste
d C
ompa
nies
Non
eN
one
AN
NEX
URE
CG
1
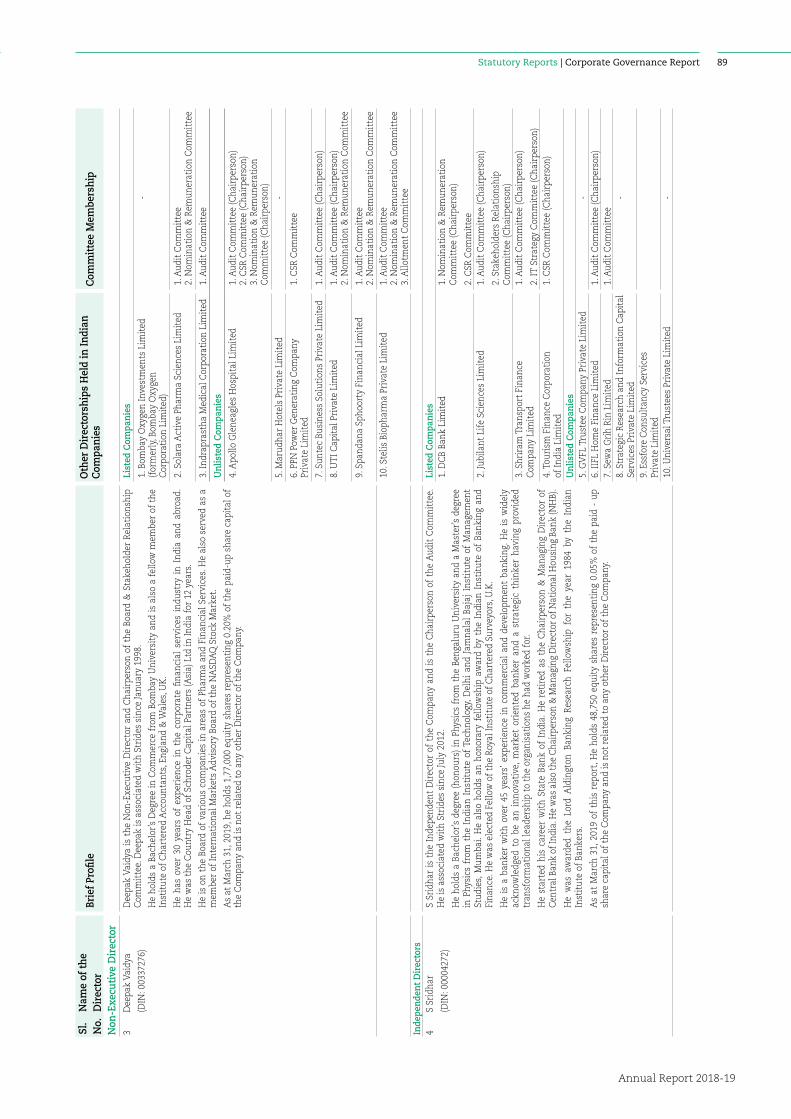
Statutory Reports | Corporate Governance Report
Annual Report 2018-19
89
Sl.
No.
Nam
e of
the
Dir
ecto
rBr
ief P
rofil
eO
ther
Dir
ecto
rshi
ps H
eld
in In
dian
C
ompa
nies
Com
mit
tee
Mem
bers
hip
Non
-Exe
cutiv
e D
irec
tor
3D
eepa
k Va
idya
(DIN
: 003
3727
6)
Dee
pak
Vaid
ya is
the
Non
-Exe
cuti
ve D
irec
tor
and
Cha
irpe
rson
of
the
Boar
d &
Sta
keho
lder
Rel
atio
nshi
p C
omm
itte
e. D
eepa
k is
ass
ocia
ted
wit
h St
ride
s si
nce
Janu
ary
1998
.
He
hold
s a
Bach
elor
’s D
egre
e in
Com
mer
ce f
rom
Bom
bay
Uni
vers
ity
and
is a
lso
a fe
llow
mem
ber
of t
he
Inst
itut
e of
Cha
rter
ed A
ccou
ntan
ts, E
ngla
nd &
Wal
es, U
K.
He
has
over
30
year
s of
exp
erie
nce
in t
he c
orpo
rate
fina
ncia
l se
rvic
es i
ndus
try
in I
ndia
and
abr
oad.
H
e w
as t
he C
ount
ry H
ead
of S
chro
der
Cap
ital
Par
tner
s (A
sia)
Ltd
in In
dia
for
12 y
ears
.
He
is o
n th
e Bo
ard
of v
ario
us c
ompa
nies
in a
reas
of
Phar
ma
and
Fina
ncia
l Ser
vice
s. H
e al
so s
erve
d as
a
mem
ber
of In
tern
atio
nal M
arke
ts A
dvis
ory
Boar
d of
the
NA
SDA
Q S
tock
Mar
ket.
As
at M
arch
31,
201
9, h
e ho
lds
1,77
,000
equ
ity
shar
es r
epre
sent
ing
0.20
% o
f th
e pa
id-u
p sh
are
capi
tal o
f th
e C
ompa
ny a
nd is
not
rel
ated
to
any
othe
r D
irec
tor
of t
he C
ompa
ny.
List
ed C
ompa
nies
1. B
omba
y O
xyge
n In
vest
men
ts L
imit
ed(f
orm
erly
, Bom
bay
Oxy
gen
Cor
pora
tion
Lim
ited
)
-
2. S
olar
a A
ctiv
e Ph
arm
a Sc
ienc
es L
imit
ed1.
Aud
it C
omm
itte
e2.
Nom
inat
ion
& R
emun
erat
ion
Com
mit
tee
3. In
drap
rast
ha M
edic
al C
orpo
rati
on L
imit
ed1.
Aud
it C
omm
itte
e
Unl
iste
d C
ompa
nies
4. A
pollo
Gle
neag
les
Hos
pita
l Lim
ited
1. A
udit
Com
mit
tee
(Cha
irpe
rson
)2.
CSR
Com
mit
tee
(Cha
irpe
rson
)3.
Nom
inat
ion
& R
emun
erat
ion
Com
mit
tee
(Cha
irpe
rson
)
5. M
arud
har
Hot
els
Priv
ate
Lim
ited
-
6. P
PN P
ower
Gen
erat
ing
Com
pany
Pr
ivat
e Li
mit
ed1.
CSR
Com
mit
tee
7. S
unte
c Bu
sine
ss S
olut
ions
Pri
vate
Lim
ited
1. A
udit
Com
mit
tee
(Cha
irpe
rson
)
8. U
TI C
apit
al P
riva
te L
imit
ed1.
Aud
it C
omm
itte
e (C
hair
pers
on)
2. N
omin
atio
n &
Rem
uner
atio
n C
omm
itte
e
9. S
pand
ana
Spho
orty
Fin
anci
al L
imit
ed1.
Aud
it C
omm
itte
e2.
Nom
inat
ion
& R
emun
erat
ion
Com
mit
tee
10. S
telis
Bio
phar
ma
Priv
ate
Lim
ited
1. A
udit
Com
mit
tee
2. N
omin
atio
n &
Rem
uner
atio
n C
omm
itte
e3.
Allo
tmen
t C
omm
itte
eIn
depe
nden
t Dir
ecto
rs4
S Sr
idha
r
(DIN
: 000
0427
2)
S Sr
idha
r is
the
Ind
epen
dent
Dir
ecto
r of
the
Com
pany
and
is t
he C
hair
pers
on o
f th
e A
udit
Com
mit
tee.
H
e is
ass
ocia
ted
wit
h St
ride
s si
nce
July
201
2.
He
hold
s a
Bach
elor
’s d
egre
e (h
onou
rs) i
n Ph
ysic
s fr
om t
he B
enga
luru
Uni
vers
ity
and
a M
aste
r’s d
egre
e in
Phy
sics
fro
m t
he I
ndia
n In
stit
ute
of T
echn
olog
y, D
elhi
and
Jam
nala
l Ba
jaj
Inst
itut
e of
Man
agem
ent
Stud
ies,
Mum
bai.
He
also
hol
ds a
n ho
nora
ry f
ello
wsh
ip a
war
d by
the
Ind
ian
Inst
itut
e of
Ban
king
and
Fi
nanc
e. H
e w
as e
lect
ed F
ello
w o
f the
Roy
al In
stit
ute
of C
hart
ered
Sur
veyo
rs, U
.K.
He
is a
ban
ker
wit
h ov
er 4
5 ye
ars’
exp
erie
nce
in c
omm
erci
al a
nd d
evel
opm
ent
bank
ing.
He
is w
idel
y ac
know
ledg
ed t
o be
an
inno
vati
ve,
mar
ket
orie
nted
ban
ker
and
a st
rate
gic
thin
ker
havi
ng p
rovi
ded
tran
sfor
mat
iona
l lea
ders
hip
to t
he o
rgan
isat
ions
he
had
wor
ked
for.
He
star
ted
his
care
er w
ith
Stat
e Ba
nk o
f In
dia.
He
reti
red
as t
he C
hair
pers
on &
Man
agin
g D
irec
tor
of
Cen
tral
Ban
k of
Indi
a. H
e w
as a
lso
the
Cha
irpe
rson
& M
anag
ing
Dir
ecto
r of
Nat
iona
l Hou
sing
Ban
k (N
HB)
.
He
was
aw
arde
d th
e Lo
rd A
ldin
gton
Ban
king
Res
earc
h Fe
llow
ship
for
the
yea
r 19
84 b
y th
e In
dian
In
stit
ute
of B
anke
rs.
As
at M
arch
31,
201
9 of
thi
s re
port
, He
hold
s 48
,750
equ
ity
shar
es r
epre
sent
ing
0.05
% o
f th
e pa
id -
up
shar
e ca
pita
l of t
he C
ompa
ny a
nd is
not
rel
ated
to
any
othe
r D
irec
tor
of t
he C
ompa
ny.
List
ed C
ompa
nies
1. D
CB
Bank
Lim
ited
1. N
omin
atio
n &
Rem
uner
atio
n C
omm
itte
e (C
hair
pers
on)
2. C
SR C
omm
itte
e2.
Jubi
lant
Lif
e Sc
ienc
es L
imit
ed1.
Aud
it C
omm
itte
e (C
hair
pers
on)
2. S
take
hold
ers
Rela
tion
ship
C
omm
itte
e (C
hair
pers
on)
3. S
hrir
am T
rans
port
Fin
ance
C
ompa
ny L
imit
ed1.
Aud
it C
omm
itte
e (C
hair
pers
on)
2. IT
Str
ateg
y C
omm
itte
e (C
hair
pers
on)
4. T
ouri
sm F
inan
ce C
orpo
rati
on
of In
dia
Lim
ited
1. C
SR C
omm
itte
e (C
hair
pers
on)
Unl
iste
d C
ompa
nies
5. G
VFL
Tru
stee
Com
pany
Pri
vate
Lim
ited
-6.
IIFL
Hom
e Fi
nanc
e Li
mit
ed1.
Aud
it C
omm
itte
e (C
hair
pers
on)
7. S
ewa
Gri
h Ri
n Li
mit
ed1.
Aud
it C
omm
itte
e8.
Str
ateg
ic R
esea
rch
and
Info
rmat
ion
Cap
ital
Se
rvic
es P
riva
te L
imit
ed-
9. E
ssfo
re C
onsu
ltan
cy S
ervi
ces
Priv
ate
Lim
ited
10. U
nive
rsal
Tru
stee
s Pr
ivat
e Li
mit
ed-
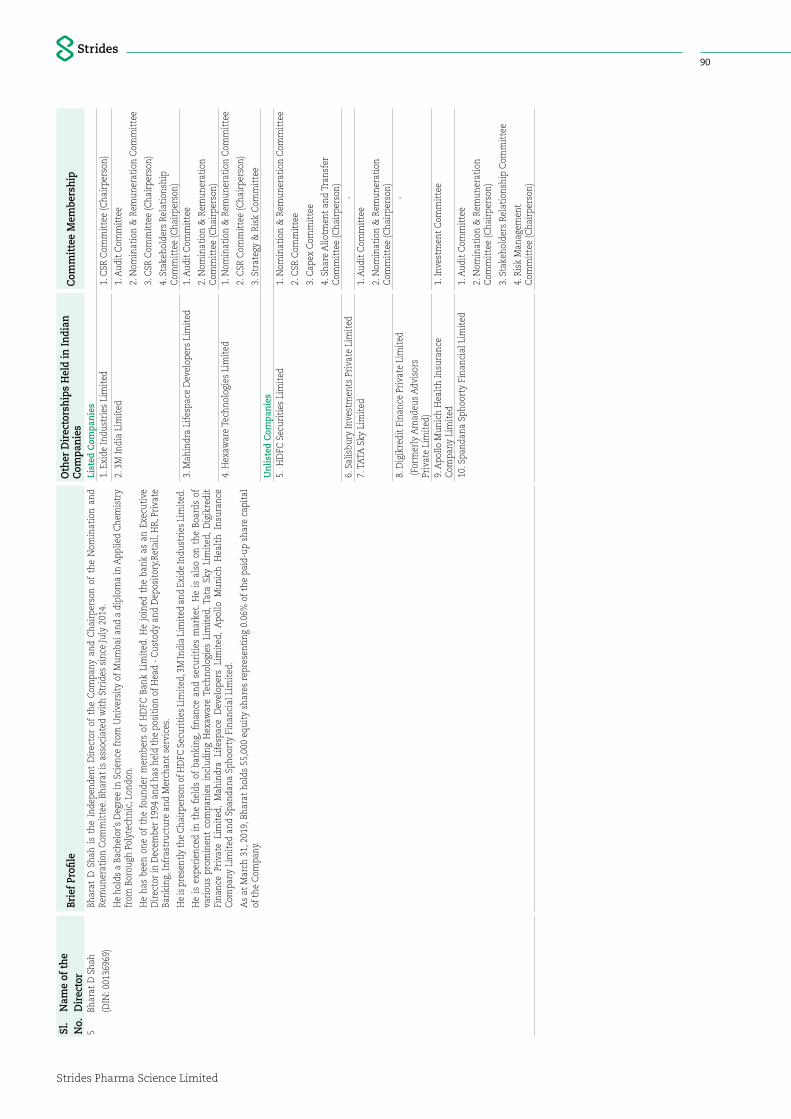
Strides Pharma Science Limited
90Sl
. N
o.N
ame
of th
e D
irec
tor
Brie
f Pro
file
Oth
er D
irec
tors
hips
Hel
d in
Indi
an
Com
pani
esC
omm
itte
e M
embe
rshi
p
5Bh
arat
D S
hah
(DIN
: 001
3696
9)
Bhar
at D
Sha
h is
the
Ind
epen
dent
Dir
ecto
r of
the
Com
pany
and
Cha
irpe
rson
of
the
Nom
inat
ion
and
Rem
uner
atio
n C
omm
itte
e. B
hara
t is
ass
ocia
ted
wit
h St
ride
s si
nce
July
201
4.
He
hold
s a
Bach
elor
’s D
egre
e in
Sci
ence
from
Uni
vers
ity
of M
umba
i and
a d
iplo
ma
in A
pplie
d C
hem
istr
y fr
om B
orou
gh P
olyt
echn
ic, L
ondo
n.
He
has
been
one
of
the
foun
der
mem
bers
of
HD
FC B
ank
Lim
ited
. He
join
ed t
he b
ank
as a
n Ex
ecut
ive
Dir
ecto
r in
Dec
embe
r 19
94 a
nd h
as h
eld
the
posi
tion
of H
ead
- Cus
tody
and
Dep
osit
ory,
Reta
il, H
R, P
riva
te
Bank
ing,
Infr
astr
uctu
re a
nd M
erch
ant
serv
ices
.
He
is p
rese
ntly
the
Cha
irpe
rson
of H
DFC
Sec
urit
ies
Lim
ited
, 3M
Indi
a Li
mit
ed a
nd E
xide
Indu
stri
es L
imit
ed.
He
is e
xper
ienc
ed i
n th
e fie
lds
of b
anki
ng, fi
nanc
e an
d se
curi
ties
mar
ket.
He
is a
lso
on t
he B
oard
s of
va
riou
s pr
omin
ent
com
pani
es i
nclu
ding
Hex
awar
e Te
chno
logi
es L
imit
ed, T
ata
Sky
Lim
ited
, D
igik
redi
t Fi
nanc
e Pr
ivat
e Li
mit
ed,
Mah
indr
a Li
fesp
ace
Dev
elop
ers
Lim
ited
, A
pollo
Mun
ich
Hea
lth
Insu
ranc
e C
ompa
ny L
imit
ed a
nd S
pand
ana
Spho
orty
Fin
anci
al L
imit
ed.
As
at M
arch
31,
201
9, B
hara
t ho
lds
55,0
00 e
quit
y sh
ares
rep
rese
ntin
g 0.
06%
of
the
paid
-up
shar
e ca
pita
l of
the
Com
pany
.
List
ed C
ompa
nies
1. E
xide
Indu
stri
es L
imit
ed1.
CSR
Com
mit
tee
(Cha
irpe
rson
)
2. 3
M In
dia
Lim
ited
1. A
udit
Com
mit
tee
2. N
omin
atio
n &
Rem
uner
atio
n C
omm
itte
e
3. C
SR C
omm
itte
e (C
hair
pers
on)
4. S
take
hold
ers
Rela
tion
ship
C
omm
itte
e (C
hair
pers
on)
3. M
ahin
dra
Life
spac
e D
evel
oper
s Li
mit
ed1.
Aud
it C
omm
itte
e
2. N
omin
atio
n &
Rem
uner
atio
n C
omm
itte
e (C
hair
pers
on)
4. H
exaw
are
Tech
nolo
gies
Lim
ited
1. N
omin
atio
n &
Rem
uner
atio
n C
omm
itte
e
2. C
SR C
omm
itte
e (C
hair
pers
on)
3. S
trat
egy
& R
isk
Com
mit
tee
Unl
iste
d C
ompa
nies
5. H
DFC
Sec
urit
ies
Lim
ited
1. N
omin
atio
n &
Rem
uner
atio
n C
omm
itte
e
2. C
SR C
omm
itte
e
3. C
apex
Com
mit
tee
4. S
hare
Allo
tmen
t an
d Tr
ansf
er
Com
mit
tee
(Cha
irpe
rson
)6.
Sal
isbu
ry In
vest
men
ts P
riva
te L
imit
ed-
7. T
ATA
Sky
Lim
ited
1. A
udit
Com
mit
tee
2. N
omin
atio
n &
Rem
uner
atio
n C
omm
itte
e (C
hair
pers
on)
8. D
igik
redi
t Fi
nanc
e Pr
ivat
e Li
mit
ed
(For
mer
ly A
mad
eus
Adv
isor
s Pr
ivat
e Li
mit
ed)
-
9. A
pollo
Mun
ich
Hea
lth
Insu
ranc
e C
ompa
ny L
imit
ed1.
Inve
stm
ent
Com
mit
tee
10. S
pand
ana
Spho
orty
Fin
anci
al L
imit
ed1.
Aud
it C
omm
itte
e
2. N
omin
atio
n &
Rem
uner
atio
n C
omm
itte
e (C
hair
pers
on)
3. S
take
hold
ers
Rela
tion
ship
Com
mit
tee
4. R
isk
Man
agem
ent
Com
mit
tee
(Cha
irpe
rson
)
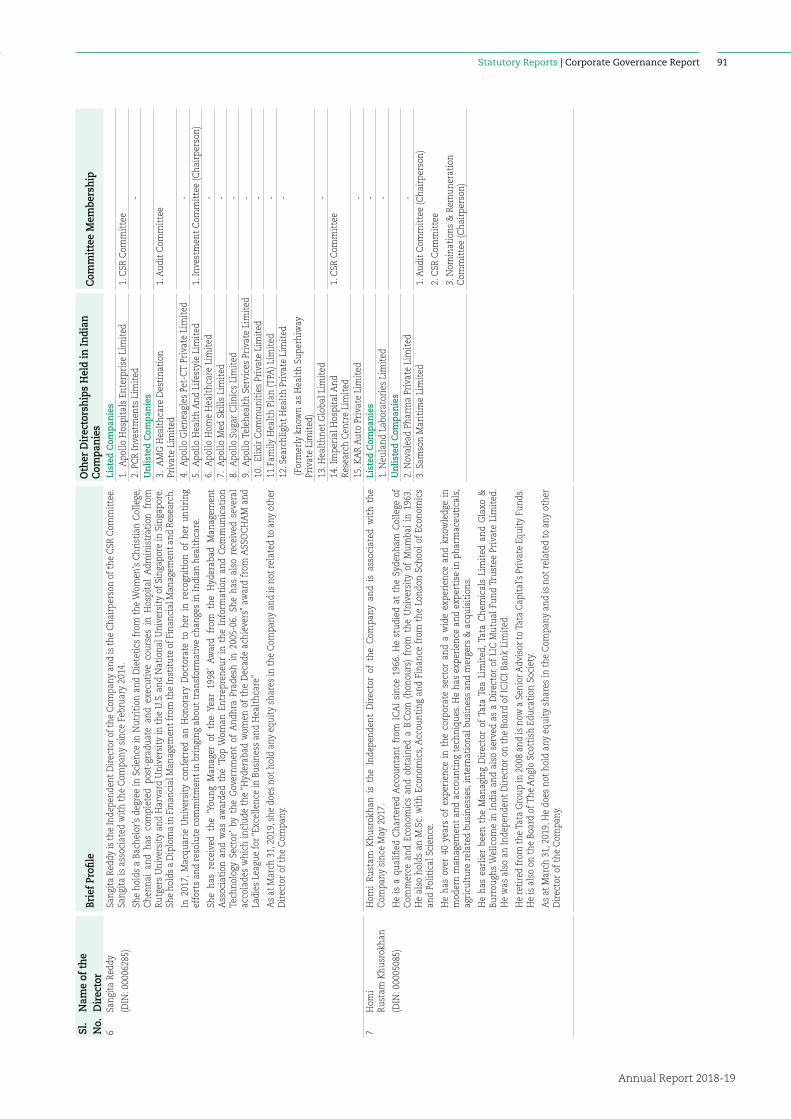
Statutory Reports | Corporate Governance Report
Annual Report 2018-19
91
Sl.
No.
Nam
e of
the
Dir
ecto
rBr
ief P
rofil
eO
ther
Dir
ecto
rshi
ps H
eld
in In
dian
C
ompa
nies
Com
mit
tee
Mem
bers
hip
6Sa
ngit
a Re
ddy
(DIN
: 000
0628
5)
Sang
ita
Redd
y is
the
Inde
pend
ent D
irec
tor
of th
e C
ompa
ny a
nd is
the
Cha
irpe
rson
of t
he C
SR C
omm
itte
e.
Sang
ita
is a
ssoc
iate
d w
ith
the
Com
pany
sin
ce F
ebru
ary
2014
.
She
hold
s a
Bach
elor
’s d
egre
e in
Sci
ence
in N
utri
tion
and
Die
teti
cs f
rom
the
Wom
en’s
Chr
isti
an C
olle
ge,
Che
nnai
and
has
com
plet
ed p
ost-
grad
uate
and
exe
cuti
ve c
ours
es i
n H
ospi
tal
Adm
inis
trat
ion
from
Ru
tger
s U
nive
rsit
y an
d H
arva
rd U
nive
rsit
y in
the
U.S
. and
Nat
iona
l Uni
vers
ity
of S
inga
pore
in S
inga
pore
. Sh
e ho
lds
a D
iplo
ma
in F
inan
cial
Man
agem
ent f
rom
the
Inst
itut
e of
Fin
anci
al M
anag
emen
t and
Res
earc
h.
In 2
017,
Mac
quar
ie U
nive
rsit
y co
nfer
red
an H
onor
ary
Doc
tora
te t
o he
r in
rec
ogni
tion
of
her
unti
ring
ef
fort
s an
d re
solu
te c
omm
itm
ent
in b
ring
ing
abou
t tr
ansf
orm
ativ
e ch
ange
s in
Indi
an h
ealt
hcar
e.
She
has
rece
ived
the
‘Yo
ung
Man
ager
of
the
Year
199
8’ A
war
d fr
om t
he H
yder
abad
Man
agem
ent
Ass
ocia
tion
and
was
aw
arde
d th
e ‘T
op W
oman
Ent
repr
eneu
r in
the
Inf
orm
atio
n an
d C
omm
unic
atio
n Te
chno
logy
Sec
tor’
by
the
Gov
ernm
ent
of A
ndhr
a Pr
ades
h in
200
5-06
. Sh
e ha
s al
so r
ecei
ved
seve
ral
acco
lade
s w
hich
incl
ude
the
“Hyd
erab
ad w
omen
of
the
Dec
ade
achi
ever
s” a
war
d fr
om A
SSO
CH
AM
and
La
dies
Lea
gue
for “
Exce
llenc
e in
Bus
ines
s an
d H
ealt
hcar
e”
As
at M
arch
31,
201
9, s
he d
oes
not h
old
any
equi
ty s
hare
s in
the
Com
pany
and
is n
ot r
elat
ed to
any
oth
er
Dir
ecto
r of
the
Com
pany
.
List
ed C
ompa
nies
1. A
pollo
Hos
pita
ls E
nter
pris
e Li
mit
ed
1. C
SR C
omm
itte
e2.
PC
R In
vest
men
ts L
imit
ed-
Unl
iste
d C
ompa
nies
3. A
MG
Hea
lthc
are
Des
tina
tion
Pr
ivat
e Li
mit
ed
1. A
udit
Com
mit
tee
4. A
pollo
Gle
neag
les
Pet-
CT
Pri
vate
Lim
ited
-
5. A
pollo
Hea
lth
And
Lif
esty
le L
imit
ed
1. In
vest
men
t C
omm
itte
e (C
hair
pers
on)
6. A
pollo
Hom
e H
ealt
hcar
e Li
mit
ed
-7.
Apo
llo M
ed S
kills
Lim
ited
-
8. A
pollo
Sug
ar C
linic
s Li
mit
ed
-9.
Apo
llo T
eleh
ealt
h Se
rvic
es P
riva
te L
imit
ed-
10.
Elix
ir C
omm
unit
ies
Priv
ate
Lim
ited
-11
.Fam
ily H
ealt
h Pl
an (T
PA) L
imit
ed
-12
. Sea
rchl
ight
Hea
lth
Priv
ate
Lim
ited
(For
mer
ly k
now
n as
Hea
lth
Supe
rhiw
ay
Priv
ate
Lim
ited
)
-
13. H
ealt
hnet
Glo
bal L
imit
ed
-14
. Im
peri
al H
ospi
tal A
nd
Rese
arch
Cen
tre
Lim
ited
1. C
SR C
omm
itte
e
15. K
AR
Aut
o Pr
ivat
e Li
mit
ed-
7H
omi
Rust
am K
husr
okha
n
(DIN
: 000
0508
5)
Hom
i Ru
stam
Khu
srok
han
is t
he I
ndep
ende
nt D
irec
tor
of t
he C
ompa
ny a
nd i
s as
soci
ated
wit
h th
e C
ompa
ny s
ince
May
201
7.
He
is a
qua
lified
Cha
rter
ed A
ccou
ntan
t fr
om I
CA
I si
nce
1966
. He
stud
ied
at t
he S
yden
ham
Col
lege
of
Com
mer
ce a
nd E
cono
mic
s an
d ob
tain
ed a
B.C
om (
hono
urs)
fro
m t
he U
nive
rsit
y of
Mum
bai
in 1
963.
H
e al
so h
olds
an
M.S
c. w
ith
Econ
omic
s, A
ccou
ntin
g an
d Fi
nanc
e fr
om t
he L
ondo
n Sc
hool
of
Econ
omic
s an
d Po
litic
al S
cien
ce.
He
has
over
40
year
s of
exp
erie
nce
in t
he c
orpo
rate
sec
tor
and
a w
ide
expe
rien
ce a
nd k
now
ledg
e in
m
oder
n m
anag
emen
t an
d ac
coun
ting
tec
hniq
ues.
He
has
expe
rien
ce a
nd e
xper
tise
in p
harm
aceu
tica
ls,
agri
cult
ure
rela
ted
busi
ness
es, i
nter
nati
onal
bus
ines
s an
d m
erge
rs &
acq
uisi
tion
s.
He
has
earl
ier
been
the
Man
agin
g D
irec
tor
of T
ata
Tea
Lim
ited
, Tat
a C
hem
ical
s Li
mit
ed a
nd G
laxo
&
Burr
ough
s W
ellc
ome
in I
ndia
and
als
o se
rved
as
a D
irec
tor
of L
IC M
utua
l Fun
d Tr
uste
e Pr
ivat
e Li
mit
ed.
He
was
als
o an
Inde
pend
ent
Dir
ecto
r on
the
Boa
rd o
f IC
ICI B
ank
Lim
ited
.
He
reti
red
from
the
Tata
Gro
up in
200
8 an
d is
now
a S
enio
r Adv
isor
to T
ata
Cap
ital
’s P
riva
te E
quit
y Fu
nds.
H
e is
als
o on
the
Boa
rd o
f The
Ang
lo S
cott
ish
Educ
atio
n So
ciet
y.
As
at M
arch
31,
201
9, H
e do
es n
ot h
old
any
equi
ty s
hare
s in
the
Com
pany
and
is n
ot r
elat
ed t
o an
y ot
her
Dir
ecto
r of
the
Com
pany
.
List
ed C
ompa
nies
-1.
Neu
land
Lab
orat
orie
s Li
mit
ed-
Unl
iste
d C
ompa
nies
2. N
oval
ead
Phar
ma
Priv
ate
Lim
ited
-3.
Sam
son
Mar
itim
e Li
mit
ed1.
Aud
it C
omm
itte
e (C
hair
pers
on)
2. C
SR C
omm
itte
e
3. N
omin
atio
ns &
Rem
uner
atio
n C
omm
itte
e (C
hair
pers
on)
Strides Pharma Science Limited
92
To, The Members of Strides Pharma Science Limited(formerly Strides Shasun Limited)201, ‘Devavrata’, Sector 17,Vashi, Navi Mumbai – 400 703
We have examined the relevant registers, records, forms, returns and disclosures received from the Directors of Strides Pharma Science Limited, having CIN L24230MH1990PLC057062 and having Registered Office at 201, ‘Devavrata’, Sector 17, Vashi, Navi Mumbai – 400 703 and Corporate Office at Strides House, Bilekahalli, Bannerghatta Road, Bengaluru – 560 078 (hereinafter referred to as ‘the Company’), produced before us by the Company for the purpose of issuing this Certificate, in accordance with Regulation 34(3) read with Schedule V Para-C Sub clause 10(i) of the Securities Exchange Board of India (Listing Obligations and Disclosure Requirements) Regulations, 2015.
In our opinion and to the best of our information and according to the verifications (including Directors Identification Number (DIN) status at the portal www.mca.gov.in) as considered necessary and explanations furnished to us by the Company and its officers, we hereby certify that none of the Directors on the Board of the Company as stated below for the Financial Year ending on 31/03/2019 have been debarred or disqualified from being appointed or continuing as Directors of companies by the Securities and Exchange Board of India, Ministry of Corporate Affairs or any such other Statutory Authorities.
DIN Name Designation Original Date of Appointment00084845 Mr. Arun Kumar Managing Director & Group CEO 28/06/199007803242 Mr. Badree Komandur Executive Director, Finance & Group CFO 18/05/201700004272 Mr. S Sridhar Independent Director 27/07/201200005085 Mr. Homi Rustam Khusrokhan Independent Director 18/05/201700006285 Ms. Sangita Reddy Independent Director 07/02/201400136969 Mr. Bharat Dhirajlal Shah Independent Director 25/07/201400337276 Mr. Deepak Calian Vaidya Non-Executive Director 16/01/1998
Ensuring the eligibility of for the appointment / continuity of every Director on the Board is the responsibility of the management of the Company. Our responsibility is to express an opinion on these based on our verification. This certificate is neither an assurance as to the future viability of the Company nor of the efficiency or effectiveness with which the management has conducted the affairs of the Company.
For Gopalakrishnaraj H H & Associates Company Secretaries
Sd/-Gopalakrishnaraj H H
ProprietorPlace: Bengaluru CP 4152; FCS 5654Date: May 25, 2019
CERTIFICATE OF NON-DISQUALIFICATION OF DIRECTORS(Pursuant to Regulation 34(3) and Schedule V Para C clause (10)(i) of the SEBI (Listing Obligations and
Disclosure Requirements) Regulations, 2015)
ANNEXURE CG 2
Statutory Reports | Corporate Governance Report
Annual Report 2018-19
93
Declaration of Compliance with the Code of Conduct
I hereby confirm that:
the Company has obtained from all the members of the Board and Senior Management Personnel, affirmations that they have complied with the Code of Conduct for Board Members and Senior Management Personnel in respect of the Financial Year ended March 31, 2019.
Place: Bengaluru Arun KumarDate: May 10, 2019 Managing Director & Group CEO
DIN: 0008485
ANNEXURE CG 3
Strides Pharma Science Limited
94
INDEPENDENT AUDITORS’ REPORT ON CORPORATE GOVERNANCE
ToThe Members of Strides Pharma Science Limited
We have examined the compliance of conditions of Corporate Governance by Strides Pharma Science Limited (formerly known as Strides Shasun Limited) (‘the Company’), for the year ended 31 March 2019, as per regulations 17 to 27, clauses (b) to (i) of Regulation 46(2) and paragraphs C, D and E of Schedule V of Securities and Exchange Board of India (Listing Obligations and Disclosure Requirements) Regulations, 2015, as amended [“Listing Regulations”].
Management’s Responsibility
The Company’s Management is responsible for compliance of conditions of Corporate Governance requirements as stipulated under the Listing Regulations. This responsibility includes the design, implementation and maintenance of corporate governance process relevant to the compliance of the conditions. Responsibility also includes collecting, collating and validating data and designing, implementing and monitoring of Corporate Governance process suitable for ensuring compliance with the above mentioned Listing Regulations.
Auditor’s Responsibility
Our examination was limited to procedures and implementation thereof, adopted by the Company for ensuring the compliance of the conditions of the Corporate Governance. It is neither an audit nor an expression of opinion on the financial statements of the Company.
Pursuant to the requirements of the Listing Regulations, it is our responsibility to provide a reasonable assurance whether the Company has complied with the conditions of Corporate Governance as stipulated in Listing Regulations for the year ended March 31, 2019.
We conducted our examination of the corporate governance compliance by the Company as per the Guidance Note on Reports or Certificates for Special Purposes (Revised 2016), Guidance Note on Certification of Corporate Governance both issued by the Institute of Chartered Accountants of India (“ICAI”) and the
Standards on Auditing specified under Section 143(10) of the Companies Act, 2013, in so far as applicable for the purpose of this certificate. The Guidance Note requires that we comply with the ethical requirements of the Code of Ethics issued by the ICAI.
We have complied with the relevant applicable requirements of the Standard on Quality Control (SQC) 1, Quality Control for Firms that Perform Audits and Reviews of Historical Financial Information; and Other Assurance and Related Services Engagements.
Opinion
In our opinion and to the best of our information and according to the explanations given to us, the Company has complied with the conditions of Corporate Governance as per regulations 17 to 27, clause (b) to (i) of regulation 46(2) and paragraph C, D and E of Schedule V of the Listing Regulations, as applicable.
We state that such compliance is neither an assurance as to the future viability of the Company nor the efficiency or effectiveness with which the management has conducted the affairs of the Company.
Restriction on Use
This report has been solely issued for the purpose of complying with the aforesaid Regulations and may not be suitable for any other purpose. Accordingly, we do not accept or assume any liability or duty of care for any other purpose or to any other person to whom this report is shown or into whose hands it may come save where expressly agreed by our prior consent in writing.
for B S R & Co. LLPChartered Accountants
Firm registration number: 101248W/W-100022
Sampad Guha ThakurtaPartner
Place: Bengaluru Membership number: 060573Date: June 28, 2019 UDIN No. 19060573AAAABS7477
Statutory Reports | Business Responsibility Report
Annual Report 2018-19
95
BUSINESS RESPONSIBILITY REPORT
SECTION A: GENERAL INFORMATION ABOUT THE COMPANY
# Description1. Corporate Identity Number (CIN) of the Company L24230MH1990PLC0570622. Name of the Company Strides Pharma Science Limited
(Formerly Strides Shasun Limited)3. Registered Address 201, Devavrata, Sector 17, Vashi,
Navi Mumbai – 400 703.4. Website www.strides.com5. E-mail id [email protected]. Financial Year reported 2018-197. Sector that the Company is engaged in (industrial
activity code-wise)Pharmaceutical
8. List three key products/services that the Company manufacture/provide (as in balance sheet)
1. Gabapentin Tablets2. LNZ Tablets3. Ranitidine Tablets
9. Total number of locations where business activity is undertaken by the CompanyNumber of international locations Singapore, USA, Canada, Australia, Europe, Africa
Three manufacturing facilities - one in Africa, one in Singapore and one in Europe
Number of national locations Registered Office: Vashi, Navi Mumbai, MaharashtraCorporate Office: Bengaluru, KarnatakaFacilities:
• Suragajakkanahalli, Bengaluru, Karnataka
• Chandapura, Bengaluru, Karnataka
• PIMS Road, Periyakalapet, Puducherry
• Alathur, KancheepuramR&D Center at Bengaluru, Karnataka
10. Markets served by the Company – Local/State/National/International
The Company has a strong commercial footprint across 100 countries.
SECTION B: FINANCIAL DETAILS OF THE COMPANY
# Description1. Paid-Up Capital – FY 2018-19 `89.549 Crore2. Total Turnover `16,520.43 Million3. Total profit after taxes `1,103.67 Million4. Total spending on Corporate Social Responsibility (CSR) as
percentage of profit after tax (%)2% of the average net profit of the last three years – `24.11 Million
5. List of activities in which expenditure in 4 above has been incurred
Areas in which the Company has spent under CSR:• Health & Hygiene,
• Education and
• Employability.
A detailed report on CSR initiatives forms part of the Board’s’ Report as Annexure 4.
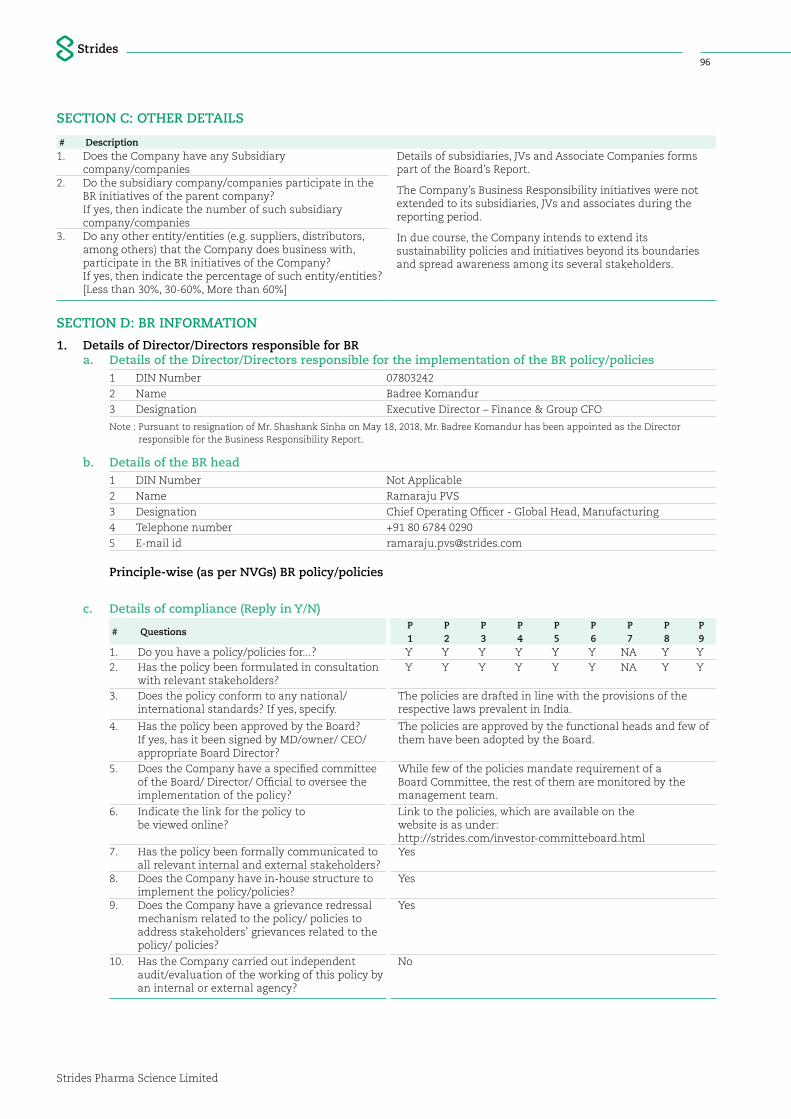
Strides Pharma Science Limited
96
SECTION C: OTHER DETAILS
# Description1. Does the Company have any Subsidiary
company/companiesDetails of subsidiaries, JVs and Associate Companies forms part of the Board’s Report.
The Company’s Business Responsibility initiatives were not extended to its subsidiaries, JVs and associates during the reporting period.
In due course, the Company intends to extend its sustainability policies and initiatives beyond its boundaries and spread awareness among its several stakeholders.
2. Do the subsidiary company/companies participate in the BR initiatives of the parent company?If yes, then indicate the number of such subsidiary company/companies
3. Do any other entity/entities (e.g. suppliers, distributors, among others) that the Company does business with, participate in the BR initiatives of the Company?If yes, then indicate the percentage of such entity/entities? [Less than 30%, 30-60%, More than 60%]
SECTION D: BR INFORMATION
1. Details of Director/Directors responsible for BR a. Details of the Director/Directors responsible for the implementation of the BR policy/policies
1 DIN Number 07803242
2 Name Badree Komandur
3 Designation Executive Director – Finance & Group CFO
Note : Pursuant to resignation of Mr. Shashank Sinha on May 18, 2018, Mr. Badree Komandur has been appointed as the Director responsible for the Business Responsibility Report.
b. Details of the BR head1 DIN Number Not Applicable
2 Name Ramaraju PVS
3 Designation Chief Operating Officer - Global Head, Manufacturing
4 Telephone number +91 80 6784 0290
5 E-mail id [email protected]
Principle-wise (as per NVGs) BR policy/policies
c. Details of compliance (Reply in Y/N)
# QuestionsP1
P2
P3
P4
P5
P6
P7
P8
P9
1. Do you have a policy/policies for...? Y Y Y Y Y Y NA Y Y2. Has the policy been formulated in consultation
with relevant stakeholders?Y Y Y Y Y Y NA Y Y
3. Does the policy conform to any national/international standards? If yes, specify.
The policies are drafted in line with the provisions of the respective laws prevalent in India.
4. Has the policy been approved by the Board?If yes, has it been signed by MD/owner/ CEO/ appropriate Board Director?
The policies are approved by the functional heads and few of them have been adopted by the Board.
5. Does the Company have a specified committee of the Board/ Director/ Official to oversee the implementation of the policy?
While few of the policies mandate requirement of a Board Committee, the rest of them are monitored by the management team.
6. Indicate the link for the policy to be viewed online?
Link to the policies, which are available on the website is as under:http://strides.com/investor-committeboard.html
7. Has the policy been formally communicated to all relevant internal and external stakeholders?
Yes
8. Does the Company have in-house structure to implement the policy/policies?
Yes
9. Does the Company have a grievance redressal mechanism related to the policy/ policies to address stakeholders’ grievances related to the policy/ policies?
Yes
10. Has the Company carried out independent audit/evaluation of the working of this policy by an internal or external agency?
No
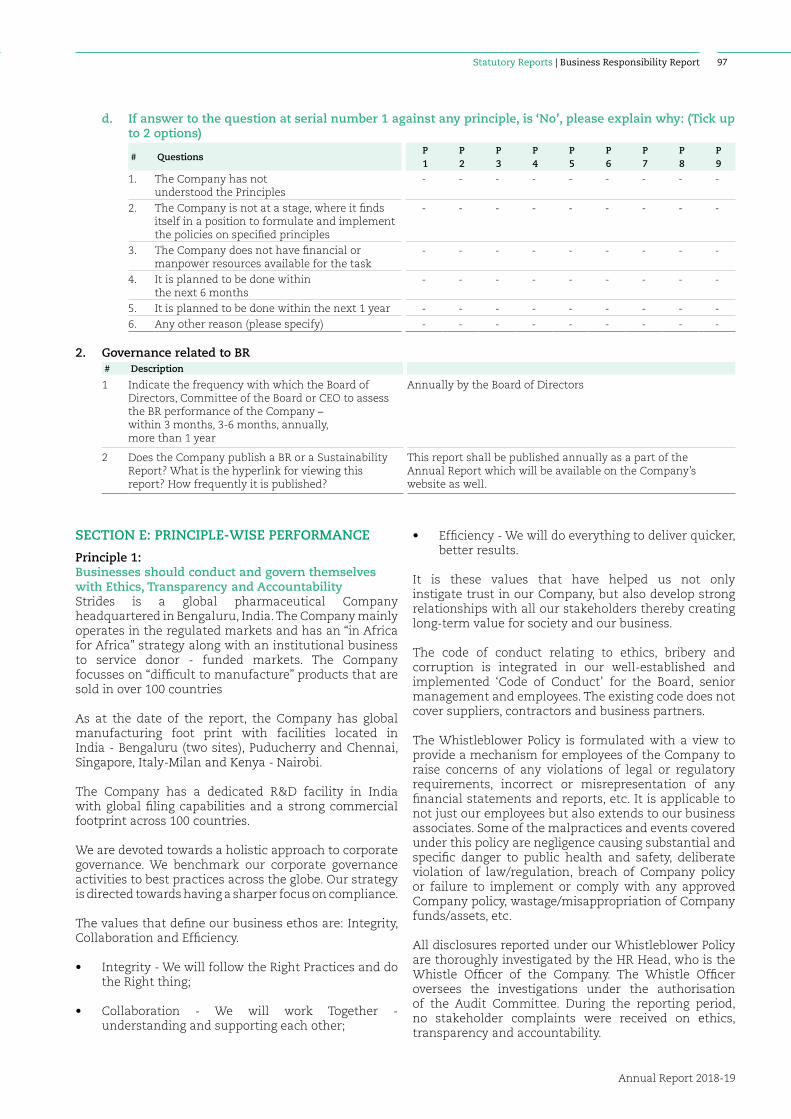
Statutory Reports | Business Responsibility Report
Annual Report 2018-19
97
d. If answer to the question at serial number 1 against any principle, is ‘No’, please explain why: (Tick up to 2 options)
# QuestionsP1
P2
P3
P4
P5
P6
P7
P8
P9
1. The Company has not understood the Principles
- - - - - - - - -
2. The Company is not at a stage, where it finds itself in a position to formulate and implement the policies on specified principles
- - - - - - - - -
3. The Company does not have financial or manpower resources available for the task
- - - - - - - - -
4. It is planned to be done within the next 6 months
- - - - - - - - -
5. It is planned to be done within the next 1 year - - - - - - - - -
6. Any other reason (please specify) - - - - - - - - -
2. Governance related to BR# Description
1 Indicate the frequency with which the Board of Directors, Committee of the Board or CEO to assess the BR performance of the Company –within 3 months, 3-6 months, annually, more than 1 year
Annually by the Board of Directors
2 Does the Company publish a BR or a Sustainability Report? What is the hyperlink for viewing this report? How frequently it is published?
This report shall be published annually as a part of the Annual Report which will be available on the Company’s website as well.
SECTION E: PRINCIPLE-WISE PERFORMANCE
Principle 1:Businesses should conduct and govern themselves with Ethics, Transparency and AccountabilityStrides is a global pharmaceutical Company headquartered in Bengaluru, India. The Company mainly operates in the regulated markets and has an “in Africa for Africa” strategy along with an institutional business to service donor - funded markets. The Company focusses on “difficult to manufacture” products that are sold in over 100 countries
As at the date of the report, the Company has global manufacturing foot print with facilities located in India - Bengaluru (two sites), Puducherry and Chennai, Singapore, Italy‐Milan and Kenya - Nairobi.
The Company has a dedicated R&D facility in India with global filing capabilities and a strong commercial footprint across 100 countries.
We are devoted towards a holistic approach to corporate governance. We benchmark our corporate governance activities to best practices across the globe. Our strategy is directed towards having a sharper focus on compliance.
The values that define our business ethos are: Integrity, Collaboration and Efficiency.
• Integrity - We will follow the Right Practices and do the Right thing;
• Collaboration - We will work Together - understanding and supporting each other;
• Efficiency - We will do everything to deliver quicker, better results.
It is these values that have helped us not only instigate trust in our Company, but also develop strong relationships with all our stakeholders thereby creating long-term value for society and our business.
The code of conduct relating to ethics, bribery and corruption is integrated in our well-established and implemented ‘Code of Conduct’ for the Board, senior management and employees. The existing code does not cover suppliers, contractors and business partners.
The Whistleblower Policy is formulated with a view to provide a mechanism for employees of the Company to raise concerns of any violations of legal or regulatory requirements, incorrect or misrepresentation of any financial statements and reports, etc. It is applicable to not just our employees but also extends to our business associates. Some of the malpractices and events covered under this policy are negligence causing substantial and specific danger to public health and safety, deliberate violation of law/regulation, breach of Company policy or failure to implement or comply with any approved Company policy, wastage/misappropriation of Company funds/assets, etc.
All disclosures reported under our Whistleblower Policy are thoroughly investigated by the HR Head, who is the Whistle Officer of the Company. The Whistle Officer oversees the investigations under the authorisation of the Audit Committee. During the reporting period, no stakeholder complaints were received on ethics, transparency and accountability.
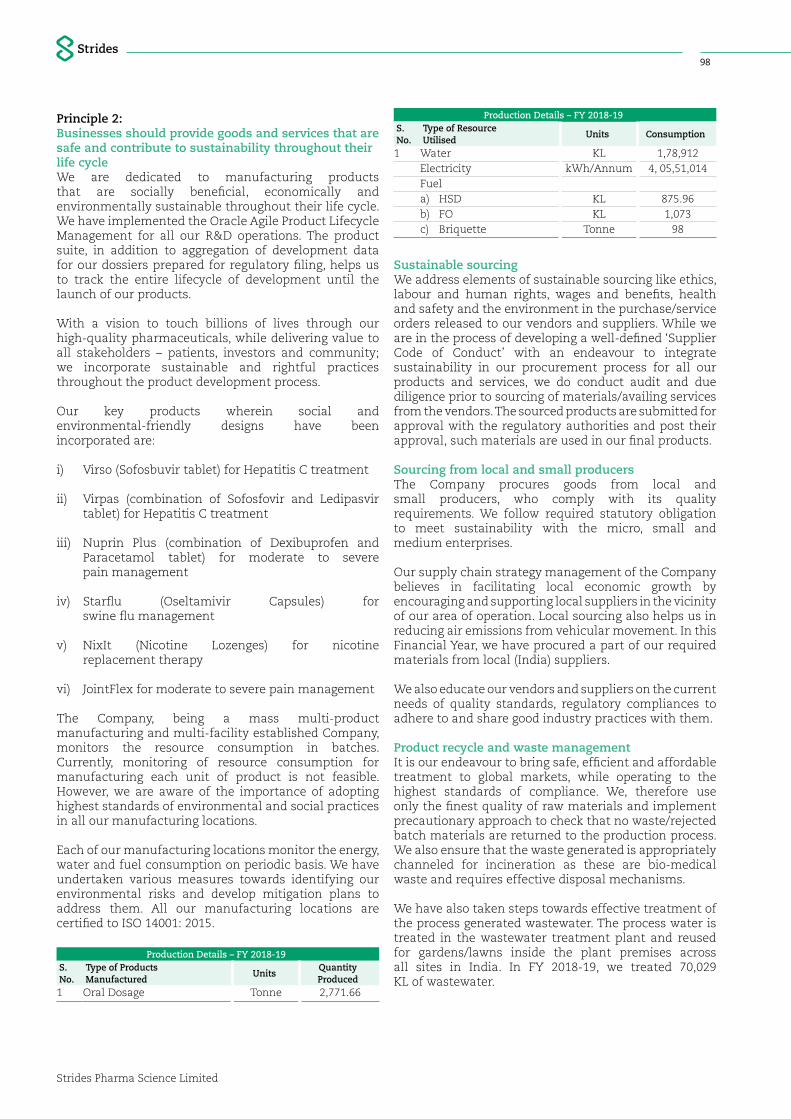
Strides Pharma Science Limited
98
Principle 2:Businesses should provide goods and services that are safe and contribute to sustainability throughout their life cycleWe are dedicated to manufacturing products that are socially beneficial, economically and environmentally sustainable throughout their life cycle. We have implemented the Oracle Agile Product Lifecycle Management for all our R&D operations. The product suite, in addition to aggregation of development data for our dossiers prepared for regulatory filing, helps us to track the entire lifecycle of development until the launch of our products.
With a vision to touch billions of lives through our high-quality pharmaceuticals, while delivering value to all stakeholders – patients, investors and community; we incorporate sustainable and rightful practices throughout the product development process.
Our key products wherein social and environmental-friendly designs have been incorporated are:
i) Virso (Sofosbuvir tablet) for Hepatitis C treatment
ii) Virpas (combination of Sofosfovir and Ledipasvir tablet) for Hepatitis C treatment
iii) Nuprin Plus (combination of Dexibuprofen and Paracetamol tablet) for moderate to severe pain management
iv) Starflu (Oseltamivir Capsules) for swine flu management
v) NixIt (Nicotine Lozenges) for nicotine replacement therapy
vi) JointFlex for moderate to severe pain management
The Company, being a mass multi-product manufacturing and multi-facility established Company, monitors the resource consumption in batches. Currently, monitoring of resource consumption for manufacturing each unit of product is not feasible. However, we are aware of the importance of adopting highest standards of environmental and social practices in all our manufacturing locations.
Each of our manufacturing locations monitor the energy, water and fuel consumption on periodic basis. We have undertaken various measures towards identifying our environmental risks and develop mitigation plans to address them. All our manufacturing locations are certified to ISO 14001: 2015.
Production Details – FY 2018-19S. No.
Type of Products Manufactured
UnitsQuantity Produced
1 Oral Dosage Tonne 2,771.66
Production Details – FY 2018-19S. No.
Type of Resource Utilised
Units Consumption
1 Water KL 1,78,912Electricity kWh/Annum 4, 05,51,014Fuel a) HSD KL 875.96b) FO KL 1,073c) Briquette Tonne 98
Sustainable sourcingWe address elements of sustainable sourcing like ethics, labour and human rights, wages and benefits, health and safety and the environment in the purchase/service orders released to our vendors and suppliers. While we are in the process of developing a well-defined ‘Supplier Code of Conduct’ with an endeavour to integrate sustainability in our procurement process for all our products and services, we do conduct audit and due diligence prior to sourcing of materials/availing services from the vendors. The sourced products are submitted for approval with the regulatory authorities and post their approval, such materials are used in our final products.
Sourcing from local and small producersThe Company procures goods from local and small producers, who comply with its quality requirements. We follow required statutory obligation to meet sustainability with the micro, small and medium enterprises.
Our supply chain strategy management of the Company believes in facilitating local economic growth by encouraging and supporting local suppliers in the vicinity of our area of operation. Local sourcing also helps us in reducing air emissions from vehicular movement. In this Financial Year, we have procured a part of our required materials from local (India) suppliers.
We also educate our vendors and suppliers on the current needs of quality standards, regulatory compliances to adhere to and share good industry practices with them.
Product recycle and waste managementIt is our endeavour to bring safe, efficient and affordable treatment to global markets, while operating to the highest standards of compliance. We, therefore use only the finest quality of raw materials and implement precautionary approach to check that no waste/rejected batch materials are returned to the production process. We also ensure that the waste generated is appropriately channeled for incineration as these are bio-medical waste and requires effective disposal mechanisms.
We have also taken steps towards effective treatment of the process generated wastewater. The process water is treated in the wastewater treatment plant and reused for gardens/lawns inside the plant premises across all sites in India. In FY 2018-19, we treated 70,029 KL of wastewater.
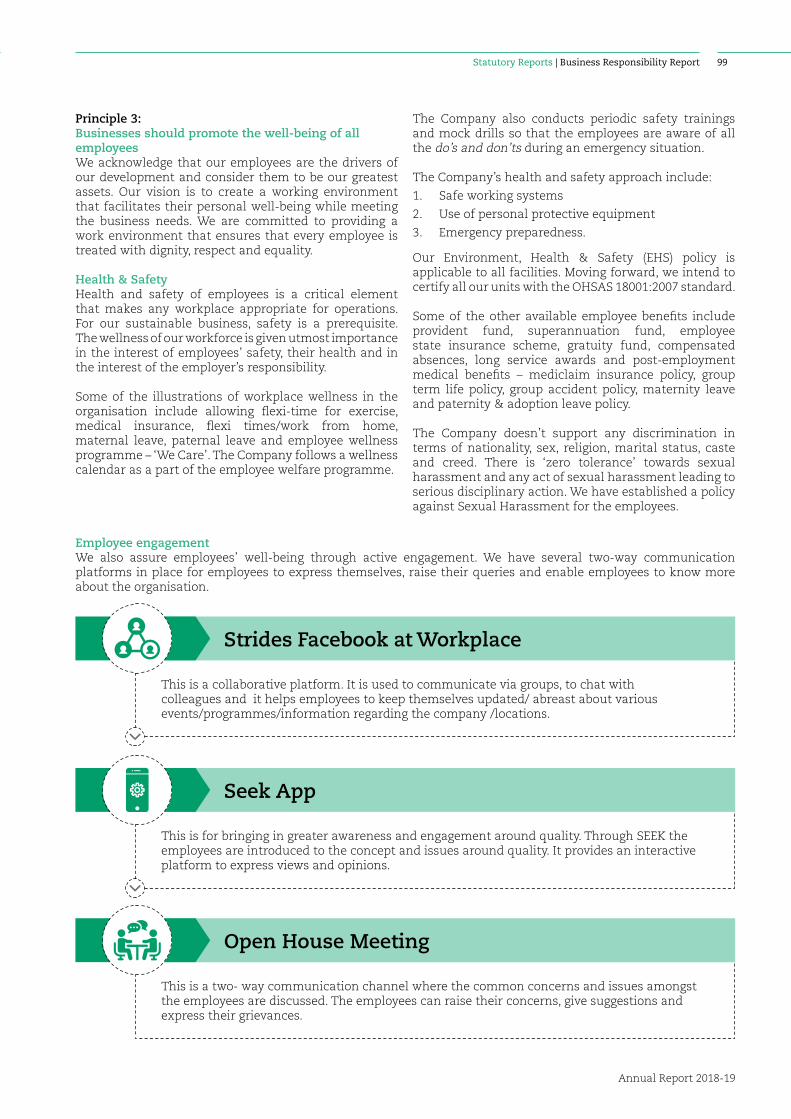
Statutory Reports | Business Responsibility Report
Annual Report 2018-19
99
Principle 3:Businesses should promote the well-being of all employeesWe acknowledge that our employees are the drivers of our development and consider them to be our greatest assets. Our vision is to create a working environment that facilitates their personal well-being while meeting the business needs. We are committed to providing a work environment that ensures that every employee is treated with dignity, respect and equality.
Health & SafetyHealth and safety of employees is a critical element that makes any workplace appropriate for operations. For our sustainable business, safety is a prerequisite. The wellness of our workforce is given utmost importance in the interest of employees’ safety, their health and in the interest of the employer’s responsibility.
Some of the illustrations of workplace wellness in the organisation include allowing flexi-time for exercise, medical insurance, flexi times/work from home, maternal leave, paternal leave and employee wellness programme – ‘We Care’. The Company follows a wellness calendar as a part of the employee welfare programme.
Employee engagementWe also assure employees’ well-being through active engagement. We have several two-way communication platforms in place for employees to express themselves, raise their queries and enable employees to know more about the organisation.
Strides Facebook at Workplace
Seek App
Open House Meeting
This is a collaborative platform. It is used to communicate via groups, to chat with colleagues and it helps employees to keep themselves updated/ abreast about various events/programmes/information regarding the company /locations.
This is for bringing in greater awareness and engagement around quality. Through SEEK the employees are introduced to the concept and issues around quality. It provides an interactive platform to express views and opinions.
This is a two- way communication channel where the common concerns and issues amongst the employees are discussed. The employees can raise their concerns, give suggestions and express their grievances.
The Company also conducts periodic safety trainings and mock drills so that the employees are aware of all the do’s and don’ts during an emergency situation.
The Company’s health and safety approach include:
1. Safe working systems
2. Use of personal protective equipment
3. Emergency preparedness.
Our Environment, Health & Safety (EHS) policy is applicable to all facilities. Moving forward, we intend to certify all our units with the OHSAS 18001:2007 standard.
Some of the other available employee benefits include provident fund, superannuation fund, employee state insurance scheme, gratuity fund, compensated absences, long service awards and post-employment medical benefits – mediclaim insurance policy, group term life policy, group accident policy, maternity leave and paternity & adoption leave policy.
The Company doesn’t support any discrimination in terms of nationality, sex, religion, marital status, caste and creed. There is ‘zero tolerance’ towards sexual harassment and any act of sexual harassment leading to serious disciplinary action. We have established a policy against Sexual Harassment for the employees.

Strides Pharma Science Limited
100
As a part of recreation camaraderie, we celebrate family day and employees are encouraged to opt for team outings.
At Strides, we also gives due credit to the employee’s union that pursues the interests of its members, with equal focus on the overall business expectations. Currently, we have a management-recognised employee association, which covers approximately 20% of our employee membership.
Strides Workforce Details – FY 2018-19S. No.
Type of Resource UtilisedNumber of Employees
1 Permanent employees 2,0362 Permanent women employees 2623 Permanent employees with disabilities 04 Temporary/contractual employees 1,134
Continuous learningAt Strides, we believe in expanding our ability to learn and increase our knowledge in response to a changing environment and new developments.
Some of our key programs are listed below:
a. Skill development Strides Continuous Learning Programme (CLP), is
an initiative designed to reinforce Strides values, acknowledge skill gaps, strengthen basic skills and enhance personal capabilities. The programme is flexible with multiple sessions planned for each training module, to enable you to plan your participation. The programme demands personal time and commitment (minimum of 3 - 6 hours per month) for a successful completion. Each CLP learning track — Foundation, Intermediate and Advanced, will be an engagement of approximately three months with the interventions targeted to develop your personal capabilities progressively. Training will be on Functional and Behavioral Competencies such as communication, innovative thinking, collaboration, problem solving, negotiation, accountability for results, and many more.
Bespoke training programmes are also conducted at regular intervals. In addition, we have collaborated with prestigious institutes like IIM Bengaluru, BITS Pilani, TISS, NMIMS and Acharya Institute of Pharmacy to enable continuous learning for our employees.
As a succession planning approach, we have introduced identification and development of future leaders through the Future Leadership Programme, which acts as an intrinsic motivation and retention.
Our managerial and leadership development programmes help enhance leadership capabilities across levels.
b. Talent management The talent management strategy at Strides is
derived based on many factors mainly:
a. Current talent pool
b. Analysis of department-wise and role-wise work
c. Future business plans
d. Recommendations from managers to develop their teams
The organisation has trainings in the form of Continuous Learning Programme and Pathway Programs to identify and nurture talent at various levels.
c. Self - managed teams Our facility for emerging markets in Chandapura,
Bengaluru, has implemented the Self-Managed Teams (SMT) philosophy to build a high-performing culture, thereby creating empowered teams.
We have established a Strides recognition programme to reward and recognise performers to makes a difference. This is applicable across all the levels and locations. The programme is aimed at institutionalising the culture of the organisation, sustained employee enrichment and engaging employees positively and progressively.
We strive to do the best to keep our employees happy and motivated, which is one of the factors for the organisational success. Some of our recognition programmes include:
Strides Recognition Programme
Star Performer of the month
Best
Tea
m o
f th
e qu
arte
r
Best Team of the year
Star Performer of th
e quarter
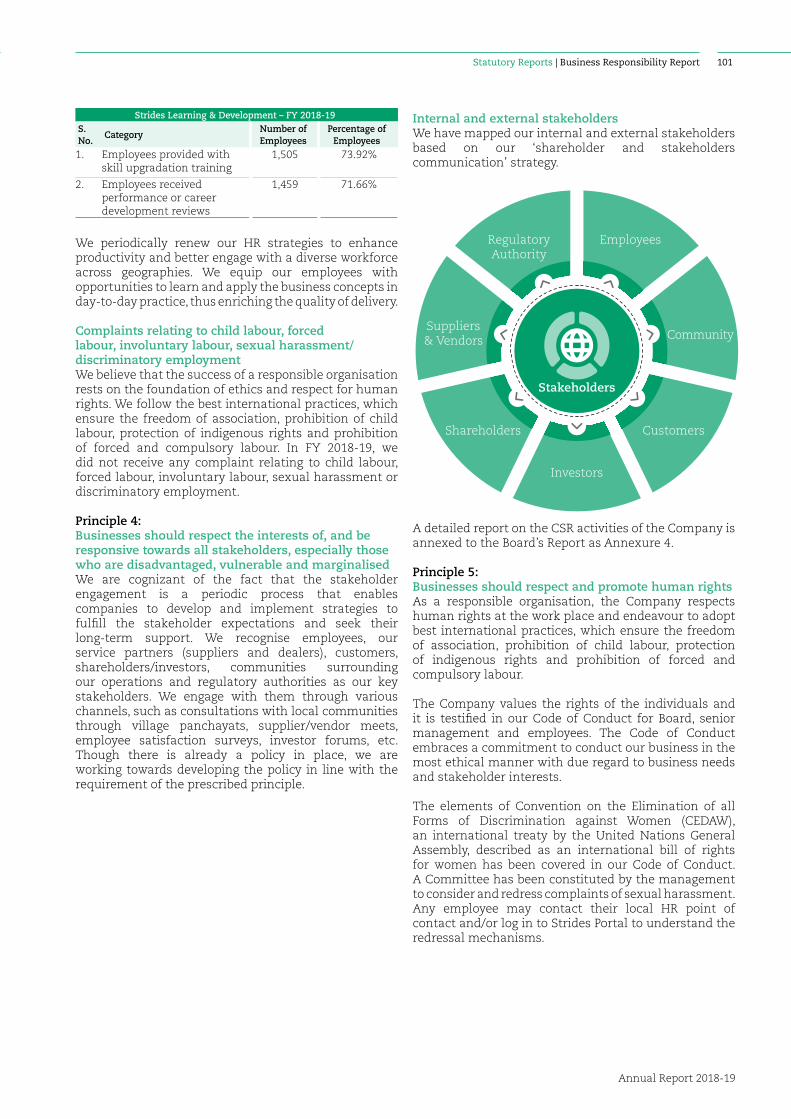
Statutory Reports | Business Responsibility Report
Annual Report 2018-19
101
Strides Learning & Development – FY 2018-19S. No.
CategoryNumber of Employees
Percentage of Employees
1. Employees provided with skill upgradation training
1,505 73.92%
2. Employees received performance or career development reviews
1,459 71.66%
We periodically renew our HR strategies to enhance productivity and better engage with a diverse workforce across geographies. We equip our employees with opportunities to learn and apply the business concepts in day-to-day practice, thus enriching the quality of delivery.
Complaints relating to child labour, forced labour, involuntary labour, sexual harassment/ discriminatory employmentWe believe that the success of a responsible organisation rests on the foundation of ethics and respect for human rights. We follow the best international practices, which ensure the freedom of association, prohibition of child labour, protection of indigenous rights and prohibition of forced and compulsory labour. In FY 2018-19, we did not receive any complaint relating to child labour, forced labour, involuntary labour, sexual harassment or discriminatory employment.
Principle 4:Businesses should respect the interests of, and be responsive towards all stakeholders, especially those who are disadvantaged, vulnerable and marginalisedWe are cognizant of the fact that the stakeholder engagement is a periodic process that enables companies to develop and implement strategies to fulfill the stakeholder expectations and seek their long-term support. We recognise employees, our service partners (suppliers and dealers), customers, shareholders/investors, communities surrounding our operations and regulatory authorities as our key stakeholders. We engage with them through various channels, such as consultations with local communities through village panchayats, supplier/vendor meets, employee satisfaction surveys, investor forums, etc. Though there is already a policy in place, we are working towards developing the policy in line with the requirement of the prescribed principle.
Internal and external stakeholdersWe have mapped our internal and external stakeholders based on our ‘shareholder and stakeholders communication’ strategy.
A detailed report on the CSR activities of the Company is annexed to the Board’s Report as Annexure 4.
Principle 5:Businesses should respect and promote human rightsAs a responsible organisation, the Company respects human rights at the work place and endeavour to adopt best international practices, which ensure the freedom of association, prohibition of child labour, protection of indigenous rights and prohibition of forced and compulsory labour.
The Company values the rights of the individuals and it is testified in our Code of Conduct for Board, senior management and employees. The Code of Conduct embraces a commitment to conduct our business in the most ethical manner with due regard to business needs and stakeholder interests.
The elements of Convention on the Elimination of all Forms of Discrimination against Women (CEDAW), an international treaty by the United Nations General Assembly, described as an international bill of rights for women has been covered in our Code of Conduct. A Committee has been constituted by the management to consider and redress complaints of sexual harassment. Any employee may contact their local HR point of contact and/or log in to Strides Portal to understand the redressal mechanisms.
Stakeholders
Regulatory Authority
Suppliers & Vendors
Shareholders Customers
Investors
Community
Employees
Strides Pharma Science Limited
102
In case of any non compliance, the employee or any of the business associates can directly approach the Chairperson of the Audit Committee. The Committee ensures the confidentiality and protects the complainant from being persecuted.
While the Code of Conduct covers employees of the organisation, we are working towards evolving the Code of Conduct in line with the requirements of the prescribed principle and International Labour Organisation (ILO), to extend it to our suppliers, contractors, and other stakeholders.
Stakeholder ComplaintsOur Code of Conduct discourages violation of human rights and provides a fair and transparent mechanism for reporting any such violation. No complaints were received pertaining to human rights violation during the reporting period.
Principle 6:Businesses should respect, protect and make efforts to restore the environmentWe believe as an organisation, it is our responsibility to ensure that all our business practices are carried out in a way that causes minimal impact on the environment. Our policy on ‘Environment, Health & Safety’ (EHS) provides us the necessary direction towards climate
change mitigation and adaptation efforts, as well as natural resource replenishment initiatives.
We follow our policy on Environment, Health & Safety which is applicable to all business operational facilities. As part of the policy, we commit to educating our stakeholders (employees, contractors, sub-contractors, transporters, visitors) about the EHS policy and emergency procedures.
We understand that global warming has relevance on our business and the markets that we serve. We try to address this issue through our Environment, Health & Safety policy and have taken various initiatives through its Environmental Management System. It is in the process of initiating specific business level strategies to address global warming and climate change.
We identify and assess all the potential environmental risks as per the Environmental Management System Standards ISO 14001:2015. We have developed appropriate standard operating procedures to address the key environmental risks.
Clean Development MechanismWe do not have any project related to Clean Development Mechanism.
Initiatives undertaken on clean technology, energy efficiency, renewable energyClean technology Energy efficiency Renewable energy
9,562 KL rain water collected and recharged to improve the ground water table in and around the plant.
26,098 KL of water recycled from steam condensate (80% of steam recovery) and reused for steam generation.
137.7 MT CO2 emissions reduction
achieved by utilisation of 2.25 Lakh kWh renewable energy source.
69,048 WWTP and reused for garden/lawn inside the plant premises across all sites in India.
Replacement of TFL/CFL/SVL with energy efficient LED lights resulted in saving of about 5,39,678 kWh per year.
Utilisation of 16.50MU of renewable energy resulted in 8,745 MT of CO
2
emission reduction13,910 KL of process water treated by ZLD and reused for cooling tower.
Compliance to CPCB/SPCB norms in relation to emission/waste generated by the CompanyEmission are monitored by Pollution Control Board (PCB) authorised laboratories and periodical emission test reports are submitted to regulatory authorities. The generated stack emissions and ambient air quality are well within the limits as defined by Central Pollution Control Board/ State Pollution Control Board.
All hazardous solid wastes are stored at designated places and disposed to approved recycler/ TSDF, as per the requirements of hazardous and other waste (Management and Transboundary Movement) Rules, 2016.
Show cause/legal notices received from CPCB/SPCBDuring the year under review, the Company did not receive any notice from CPCB/ SPCB.
Principle 7:Businesses when engaged in influencing public and regulatory policy, should do so in a responsible mannerWe strive to create a positive impact and participate in making sound policy decisions to facilitate change in public policies that are beneficial to the sector. We believe a sustainable business growth can be achieved when worked together with the regulatory authorities, government and trading bodies.
We are a part of various industry bodies and associations that influence public and regulatory bodies in a responsible manner, which include:
a. Pharmaceuticals Export Promotion Council of India
b. Bombay Chambers of Commerce

Statutory Reports | Business Responsibility Report
Annual Report 2018-19
103
c. Bangalore Chamber of Industry and Commerce
d. Export Promotion Council for EOUs & SEZs
e. Confederation of Indian Industry
f. Indian Drug Manufacturers’ Association
g. Karnataka Drugs & Pharmaceutical Manufacturers Association
h. Federation of Karnataka Chambers of Commerce and Industry
We actively support the policy advocacy campaigns which the above organisations take up from time to time.
Principle 8:Businesses should support inclusive growth and equitable developmentAt Strides, we always strive to secure the interests of all the stakeholders along with the healthy growth of the Company. Community development programs are integral to our sustainability strategy. We have always contributed towards CSR activities, even before it was mandated by the law. We have initiated many programs for the disadvantaged, surrounding our area of operation.
The Company have developed and implemented the CSR policy which encompasses our philosophy towards CSR and lays down guidelines and mechanisms for undertaking socially beneficial programs for welfare and sustainable development of the community at large.
Our CSR initiatives help address socioeconomic challenges in the realms of health, education, employability and disaster management.
We have implemented the CSR programmes through our unit CSR Team and CSR advisory committee along with Strides Foundation and external NGOs, to contribute to different sectors of society. Projects to promote the wellbeing of the society has been developed post a comprehensive Community Need Analysis. Our focus areas are:
a. Promoting hygiene and healthcare
b. Promoting education and
c. Employability
A detailed report on CSR initiatives and the amount spent during the period under review forms part of the Board’s Report as Annexure 4.
Impact assessmentWe intend to carry out a formal structured impact assessment of our various CSR programmes in FY 2020 since all our major CSR projects are in the domains of healthcare, education and livelihood and were commissioned 4 years back.
Our focus for Community development being Health & Hygiene and Education, our initiatives have been around providing:
• Preventive, promotive and curative healthcare at our Speciality healthcare center – Arogyadhama at Suragajakkanahalli village panchayat,
• Safe drinking water through self-sustainable RO drinking water plants at Anekal,
• Good healthcare, creating awareness through health camps etc., building awareness on health and hygiene
• Providing infrastructure and also empowering children to learn better and equip themselves for a better future.
Arogyadhama caters to over 12,500 populations in 12 villages giving the best of facilities. Over 10,500 people were benefitted in 2018-19.
In our efforts to provide safe drinking water and to improve the quality of living of people, new RO water units have been installed at Guddahatti and Ramakrishnapura in Anekal.
On Employability front, the Employment Empowerment Programme initiative in partnership with Swami Vivekananda Rural Community College (SVRCC), has upskilled 100 youths of our neighbouring villages, who are now under industrial training and will be ready to be employed by July. Owing to the success of the first two batches, we have initiated the process to upskill the next set of rural youths.
In line with our focus to provide better quality of education to children by improving the infrastructure of the schools, 2 classrooms along with a stage
Strides Pharma Science Limited
104
were constructed at Lakshmipura School, Indlawadi Panchayat. About 50 students will be benefitted with this initiative.
Under Leadership adoption programme for school (LeAPS) life skills are imparted to the students of the Government primary and high school to get the young students future ready. Also, Effective Examination Skills workshop was organised for the Boys and Girls of 10th standard to help them do better in the 10th exams.
Principle 9:Businesses should engage with and provide value to their customers and consumers in a responsible mannerWe give utmost priority to provide effective, superior quality and economically affordable products to our
customers. We work towards safe management of our products throughout its lifecycle and is committed to reducing risks. This is ensured by making factual disclosure of information during labelling and branding of our products. As a company, we are strongly connected with our customers. By understanding their needs, expectations and priorities, we are better equipped to develop products that offer great value.
We follow a standard operating procedure on providing the required factual information about our products to the customers. We ensure compliance towards all applicable legislations with respect to packaging and labelling. We realise the extent of influence we can have on our customers and we wish to engage with them in a responsible manner.
We have developed and implemented a robust pharmacovigilance system for handling and addressing complaints received from any of our stakeholders.
Customer Complaints – FY 2018-19
S. No.
CategoryNumber of Complaints
Received
Number of Complaints
Closed
Number of complaints
pending
% of Complaints/ Cases Pending
1 Customer Complaints 279 255 24 8.6 %
2 Customer Cases (legally filed) NA NA NA NA
We have a dedicated pharmacovigilance cell to resolve any customer concerns or queries related to our products. We have not received any complaints on unfair trade practices, irresponsible advertising and anti-competitive behavior.
Display of product information on the product labelThe customer is provided with the instructions on dosage and basic knowledge about the science behind the various ingredients added in different products. We also provide information on the composition of each ingredient in volume and percentage in the product. Storage Instructions and cautionary notes are also provided wherever required.
For and on behalf of the Board of Directors
Badree Komandur Ramaraju PVSDate: May 10, 2019 Executive Director – Finance & Group CFO COO – Global Head, ManufacturingPlace: Bengaluru DIN – 07803242
Annual Report 2018-19
105Financial Statements | Consolidated
To the Members of Strides Pharma Science Limited (formerly known as Strides Shasun Limited)
Report on the Audit of the Consolidated Financial Statements
Opinion
We have audited the consolidated financial statements of Strides Pharma Science Limited (formerly known as Strides Shasun Limited) (hereinafter referred to as the “Holding Company” or “the Company”) and its subsidiaries (Holding Company and its subsidiaries together referred to as “the Group”), its associates and its joint ventures, which comprise the consolidated balance sheet as at 31 March 2019, the consolidated statement of profit and loss (including other comprehensive income) , consolidated statement of changes in equity and consolidated statement of cash flows for the year then ended, and notes to the consolidated financial statements, including a summary of significant accounting policies and other explanatory information (hereinafter referred to as “the consolidated financial statements”).
In our opinion and to the best of our information and according to the explanations given to us, and based on the consideration of reports of other auditors on separate financial information of such subsidiaries as were audited by the other auditors, the aforesaid consolidated financial statements give the information required by the Companies Act, 2013 (“Act”) in the manner so required and give a true and fair view in conformity with the accounting principles generally accepted in
India, of the consolidated state of affairs of the Group, its associates and joint ventures as at 31 March 2019, of its consolidated profit and other comprehensive income, consolidated changes in equity and consolidated cash flows for the year then ended.
Basis for Opinion
We conducted our audit in accordance with the Standards on Auditing (SAs) specified under section 143(10) of the Act. Our responsibilities under those SAs are further described in the Auditor’s Responsibilities for the Audit of the Consolidated Financial Statements section of our report. We are independent of the Group including its associates and joint ventures in accordance with the Code of Ethics issued by the Institute of Chartered Accountants of India, and we have fulfilled our other ethical responsibilities in accordance with the provisions of the Act. We believe that the audit evidence we have obtained is sufficient and appropriate to provide a basis for our opinion.
Key Audit Matters
Key audit matters are those matters that, in our professional judgment, were of most significance in our audit of the consolidated financial statements of the current period. These matters were addressed in the context of our audit of the consolidated financial statements as a whole, and in forming our opinion thereon, and we do not provide a separate opinion on these matters.
INDEPENDENT AUDITOR'S REPORTAs at March 31, 2019
Key Audit Matters
Taxation [Refer Significant Accounting Policies and notes 11, 12, 26 and 35 to the consolidated financial statements]
The key audit matter How the matter was addressed in our audit
Restatement with respect to tax accounting on business combination
We draw attention to Note 56 to the consolidated financial statements which states that during the current year, the Group noted an error in one of its material foreign subsidiary with respect to accounting for deferred taxes on a business combination consummated during fiscal 2016.
The Group during the year noted that it should have recorded deferred tax liabilities on certain intangibles acquired in a business combination with a corresponding impact to goodwill as of the acquisition date, which was rectified during the current year by restating past periods.
With respect to the deferred tax accounting impact for business combinations and the impact of restatement of subsidiary information, we read the reporting from the component auditor and also performed procedures in compliance with the requirements of SA 600: Using the Work of Another Auditor. We also verified the adjustments made by the management to restate the comparative information in the consolidated financial statements arising from the aforesaid matter.
We tested the design of internal financial controls and operating effectiveness of the relevant key controls in respect of taxation
Strides Pharma Science Limited
106
INDEPENDENT AUDITOR'S REPORTAs at March 31, 2019
Key Audit Matters (Contd.)
Taxation [Refer Significant Accounting Policies and notes 11, 12, 26 and 35 to the consolidated financial statements]
The key audit matter How the matter was addressed in our audit
Other taxation mattersFurther, the Group operates across a large number of jurisdictions and is subject to periodic challenges by local tax authorities on a range of tax matters during the normal course of business, including transfer pricing, direct and indirect tax matters. In addition, the consolidated financial statements is subject to complexities involved in the assessment of recognition of deferred taxes on business combinations, owing to significant management judgment.
Given the complexity of tax accounting for multiple jurisdictions, impact of deferred taxes related to acquisitions accounting, intercompany transactions and restatement noted during the year, we assessed this to be an area of focus for our audit.
For uncertain tax positions, we read and analysed select key correspondences with tax authorities, assessed Management’s judgment regarding the eventual resolution of matters with various tax authorities, assessment of third-party opinions and the use of past experience, where available, with the tax authorities in the respective jurisdiction.
Additionally, we used our own local and international subject matter expert, to assess the accounting position taken by the management for current and deferred taxes.
Carrying value of goodwill and intangible assets [Refer Significant Accounting Policies and notes 6 and 7 to the consolidated financial statement
The key audit matter How the matter was addressed in our audit
The Group has goodwill and intangible assets of `13,691 million and `15,647 million respectively as at 31 March 2019.
The carrying values of goodwill and intangible assets will be recovered through future cash flows and there is a risk that the assets will be impaired if these cash flows do not meet the Group’s expectations. Goodwill including these intangibles are assessed for impairment at each reporting date based on triggers and / or is mandatorily tested annually for impairment. The Group determines the value in use by means of a discounted cash flow method which contains a number of significant assumptions and estimates including revenue growth, the success of new product launches, terminal growth rates and discount rate. Changes in these assumptions could affect the assessment of impairment to the carrying value of goodwill and intangible assets
There is a risk for the financial statements that impairment loss for an existing goodwill / intangible assets may not be recognized as of the reporting date. In addition, there is a risk that the related disclosures in the notes to the consolidated financial statements are not complete and appropriate.
Given the significance of the amounts involved and significant estimates involved in the above, we determined this to be an area of focus for our audit.
Our audit procedures included testing the Group’s controls around the carrying value of goodwill / intangible assets, assessing the Group’s budgeting procedures upon which the forecasts are based, validating the discounted cash flow models which management used to prepare the valuations and performing a retrospective review of the accuracy of the managements past projections by comparing historical forecast to actual results.
We did this by using our own valuation specialists to assist us in evaluating the assumptions and methodologies used by management, in particular those relating to the discount rates and by comparing relevant assumptions to industry and economic forecasts.
We also assessed whether the Group’s disclosures about the sensitivity of the outcome of the impairment assessment to changes in key assumptions reflect the risks inherent in the valuation of goodwill.
Annual Report 2018-19
107Financial Statements | Consolidated
INDEPENDENT AUDITOR'S REPORTAs at March 31, 2019
Key Audit Matters (Contd.)
Impact on adoption of new revenue standard (Ind AS 115)
[Refer Significant Accounting Policies and note 3.24 to the consolidated financial statements]
The key audit matter How the matter was addressed in our audit
The Group has adopted Ind AS 115: Revenue from Contracts with Customers effective 1 April 2018 using the modified retrospective approach, with the cumulative effect of initially applying the impact of any change being recorded in opening equity as at 1 April 2018.
The core principle of this standard is that the Group shall recognise revenue to depict the transfer of promised goods or services to customers in an amount that reflects the consideration to which the Group expects to be entitled in exchange for those goods or services. Under Ind AS 115, the Group recognises revenue when (or as) a performance obligation is satisfied, i.e. when ‘control’ of the goods or services underlying the particular performance obligation is transferred to the customer which is different from transfer of risk and rewards under the old revenue standard. Additionally, the Group also evaluated its out-licensing arrangements with reference to upfront non-refundable fees received in earlier periods.
With respect to control evaluation and out-licensing arrangements, the risk is to determine timing of transfer of control considering all the terms of the contract, shipping terms, whether all the identified performance obligations meet the criteria of being distinct and consequently its impact on timing and pattern of revenue recognition.
Pursuant to the above, implementation of the new revenue standard requires management to apply judgment in carrying out the above evaluations and hence was an area of focus for our audit.
We tested the design of internal financial controls and operating effectiveness of the relevant key controls in respect of sale of goods and services.
With reference to revenue recognition from sale of goods and from licensing income arrangements, we evaluated the appropriateness of management’s assessment of keys terms of the contract to determine transfer of control of goods, read underlying contracts on a sample basis and evaluated the appropriateness of the key judgments and estimates made by management.
We also evaluated management’s assessment whether the rights transferred under these arrangements qualified for revenue recognition and in particular whether the underlying performance obligations meet the criteria of being distinct and hence can be segregated from other obligations under the arrangement.

Strides Pharma Science Limited
108
Key Audit Matters (Contd.)
Business combinations
[Refer Significant Accounting Policies and note 38 to the consolidated financial statements]
The key audit matter How the matter was addressed in our audit
The Group completed the acquisition of 3 subsidiaries during the year and consequently recognised goodwill of `2,998 million. Accounting for the business combinations require the Group to determine fair value of consideration transferred (including earnouts, if any) and fair value of net assets acquired as a part of acquisition.
Given the significance of amounts involved and complexities involved we determined this to be an area of focus for our audit.
.
We evaluated the appropriateness of purchase price allocation (PPA) performed by management using third party valuation experts and tested the methodology and assumptions using our own valuation experts.
We also performed sensitivity analysis over certain assumptions such as sales volume and the discount rate used in management’s valuation to determine whether the cash flows applied within the valuation models and the key assumptions were appropriate.
We assessed the appropriateness of working capital balances on the acquisition date and obtained supporting evidence to corroborate these. In instances where business combination accounting was audited by component auditors, we read their reporting to us including procedures in compliance with the requirements of SA 600: Using the Work of Another Auditor, where necessary, for the purpose of our audit of consolidated financial statements.
INDEPENDENT AUDITOR'S REPORTAs at March 31, 2019
Annual Report 2018-19
109Financial Statements | Consolidated
INDEPENDENT AUDITOR'S REPORTAs at March 31, 2019
Information Other than the Consolidated Financial Statements and Auditor’s Report Thereon
The Holding Company’s management and Board of Directors are responsible for the other information. The other information comprises of Management Reports such as Board’s Report, Management Discussion and Analysis, Corporate Governance Report and Business Responsibility Report (but does not include the Consolidated Financial Statements and our Auditor’s Report thereon) which we obtained prior to the date of this Auditor’s Report, and the remaining sections of Annual Report, which are expected to be made available to us after that date.
Our opinion on the consolidated financial statements does not cover the other information and we do not express any form of assurance conclusion thereon.
In connection with our audit of the consolidated financial statements, our responsibility is to read the other information and, in doing so, consider whether the other information is materially inconsistent with the consolidated financial statements or our knowledge obtained in the audit or otherwise appears to be materially misstated.
If, based on the work we have performed on the other information that we obtained prior to the date of this Auditor’s Report, we conclude that there is a material misstatement of this other information, we are required to report that fact. We have nothing to report in this regard.
When we read the other sections of Annual Report (other than those mentioned above), if we conclude that there is a material misstatement therein, we are required to communicate the matter to those charged with governance and take necessary actions, as applicable under the applicable laws and regulations.
Responsibilities of Management and Those Charged with Governance for the Consolidated Financial Statements
The Holding Company’s management and Board of Directors are responsible for the preparation and presentation of these consolidated financial statements in term of the requirements of the Act that give a true and fair view of the consolidated state of affairs, consolidated profit / loss and other comprehensive income, consolidated statement of changes in equity and consolidated cash flows of the Group including its associates and joint ventures in accordance with
the accounting principles generally accepted in India, including the Indian Accounting Standards (Ind AS) specified under section 133 of the Act. The respective Board of Directors of the companies included in the Group and of its associates and joint ventures are responsible for maintenance of adequate accounting records in accordance with the provisions of the Act for safeguarding the assets of each company and for preventing and detecting frauds and other irregularities; the selection and application of appropriate accounting policies; making judgments and estimates that are reasonable and prudent; and the design, implementation and maintenance of adequate internal financial controls, that were operating effectively for ensuring accuracy and completeness of the accounting records, relevant to the preparation and presentation of the consolidated financial statements that give a true and fair view and are free from material misstatement, whether due to fraud or error, which have been used for the purpose of preparation of the consolidated financial statements by the Directors of the Holding Company, as aforesaid.
In preparing the consolidated financial statements, the respective management and Board of Directors of the companies included in the Group and of its associates and joint ventures are responsible for assessing the ability of each company to continue as a going concern, disclosing, as applicable, matters related to going concern and using the going concern basis of accounting unless management either intends to liquidate the Company or to cease operations, or has no realistic alternative but to do so.
The respective Board of Directors of the companies included in the Group and of its associates and joint ventures is responsible for overseeing the financial reporting process of each company.
Auditor’s Responsibilities for the Audit of the Consolidated Financial Statements
Our objectives are to obtain reasonable assurance about whether the consolidated financial statements as a whole are free from material misstatement, whether due to fraud or error, and to issue an auditor’s report that includes our opinion. Reasonable assurance is a high level of assurance, but is not a guarantee that an audit conducted in accordance with SAs will always detect a material misstatement when it exists. Misstatements can arise from fraud or error and are considered material if, individually or in the aggregate, they could reasonably be expected to influence the economic decisions of users taken on the basis of these consolidated financial statements.
Strides Pharma Science Limited
110
As part of an audit in accordance with SAs, we exercise professional judgment and maintain professional skepticism throughout the audit. We also:
• Identify and assess the risks of material misstatement of the consolidated financial statements, whether due to fraud or error, design and perform audit procedures responsive to those risks, and obtain audit evidence that is sufficient and appropriate to provide a basis for our opinion. The risk of not detecting a material misstatement resulting from fraud is higher than for one resulting from error, as fraud may involve collusion, forgery, intentional omissions, misrepresentations, or the override of internal controls.
• Obtain an understanding of internal controls relevant to the audit in order to design audit procedures that are appropriate in the circumstances. Under section 143(3)(i) of the Act, we are also responsible for expressing our opinion on whether the Holding Company and such companies incorporated in India which are its subsidiary companies and its associate companies have adequate internal financial controls with reference to financial statements in place and the operating effectiveness of such controls.
• Evaluate the appropriateness of accounting policies used and the reasonableness of accounting estimates and related disclosures made by management.
• Conclude on the appropriateness of management’s use of the going concern basis of accounting in preparation of consolidated financial statements and, based on the audit evidence obtained, whether a material uncertainty exists related to events or conditions that may cast significant doubt on the appropriateness of this assumption. If we conclude that a material uncertainty exists, we are required to draw attention in our auditor’s report to the related disclosures in the consolidated financial statements or, if such disclosures are inadequate, to modify our opinion. Our conclusions are based on the audit evidence obtained up to the date of our auditor’s report. However, future events or conditions may cause the Group (Company and subsidiaries) as well as associates and joint ventures to cease to continue as a going concern.
• Evaluate the overall presentation, structure and content of the consolidated financial statements, including the disclosures, and whether the consolidated financial
statements represent the underlying transactions and events in a manner that achieves fair presentation.
• Obtain sufficient appropriate audit evidence regarding the financial information of such entities or business activities within the Group and its associates and joint ventures to express an opinion on the consolidated financial statements, of which we are the independent auditors. We are responsible for the direction, supervision and performance of the audit of financial information of such entities. For the other entities included in the consolidated financial statements, which have been audited by other auditors, such other auditors remain responsible for the direction, supervision and performance of the audits carried out by them. We remain solely responsible for our audit opinion. Our responsibilities in this regard are further described in para (a) of the section titled ‘Other Matters’ in this audit report. We believe that the audit evidence obtained by us along with the consideration of audit reports of the other auditors referred to in sub-paragraph (a) of the Other Matters paragraph below, is sufficient and appropriate to provide a basis for our audit opinion on the consolidated financial statements.
We communicate with those charged with governance of the Holding Company and such other entities included in the consolidated financial statements of which we are the independent auditors regarding, among other matters, the planned scope and timing of the audit and significant audit findings, including any significant deficiencies in internal controls that we identify during our audit.
We also provide those charged with governance with a statement that we have complied with relevant ethical requirements regarding independence, and to communicate with them all relationships and other matters that may reasonably be thought to bear on our independence, and where applicable, related safeguards.
From the matters communicated with those charged with governance, we determine those matters that were of most significance in the audit of the consolidated financial statements of the current period and are therefore the key audit matters. We describe these matters in our auditor’s report unless law or regulation precludes public disclosure about the matter or when,
INDEPENDENT AUDITOR'S REPORTAs at March 31, 2019
Annual Report 2018-19
111Financial Statements | Consolidated
INDEPENDENT AUDITOR'S REPORTAs at March 31, 2019
in extremely rare circumstances, we determine that a matter should not be communicated in our report because the adverse consequences of doing so would reasonably be expected to outweigh the public interest benefits of such communication.
Other Matters
(a) We did not audit the financial statements of 9 subsidiaries, whose financial statements reflect total assets of `64,313 million as at 31 March 2019, total revenues of `19,799 million and net cash flows amounting to ̀ 975 million for the year ended on that date, as considered in the consolidated financial statements. These financial statements have been audited by other auditors whose reports have been furnished to us by the Management and our opinion on the consolidated financial statements, in so far as it relates to the amounts and disclosures included in respect of these subsidiaries and our report in terms of sub-section (3) of Section 143 of the Act, in so far as it relates to the aforesaid subsidiaries is based solely on the audit reports of the other auditors.
(b) The financial statements/financial information of 45 subsidiaries, whose financial statements/financial information reflect total assets of `29,764 million as at 31 March 2019, total revenues of `2,720 million and net cash flows amounting to `124 million for the year ended on that date, as considered in the consolidated financial statements, have not been audited either by us or by other auditors. The consolidated financial statements also include the Group’s share of net loss (and other comprehensive income) of `376 million for the year ended 31 March 2019, as considered in the consolidated financial statements, in respect of 10 associates and joint ventures, whose financial statements/financial information have not been audited by us or by other auditors. These unaudited financial statements/financial information have been furnished to us by the Management and our opinion on the consolidated financial statements, in so far as it relates to the amounts and disclosures included in respect of these subsidiaries, joint ventures and associates, and our report in terms of sub-sections (3) of Section 143 of the Act in so far as it relates to the aforesaid subsidiaries, joint ventures and associates, is based solely on such unaudited financial statements / financial information.
In our opinion and according to the information and explanations given to us by the Management, these financial statements/financial information are not material to the Group.
(c) We also refer to note 56 to the consolidated financial statements which more fully explains that, based on the report from the auditor of a subsidiary, comparative information for fiscal 2018 has been restated with respect to accounting for deferred taxes on business combination. The balance sheet as at 1 April 2017 included in these consolidated financial statements, is based on the previously issued consolidated financial statements prepared in accordance with the Companies Act, 2013 and audited by the predecessor auditor whose audit report for the year ended 31 March 2017 dated 18 May 2017 expressed an unmodified opinion on those consolidated financial statements, as adjusted for the impact of the restatement, which have been audited by us based on the consideration of reports of the other auditor.
Our opinion on the consolidated financial statements, and our report on Other Legal and Regulatory Requirements below, is not modified in respect of the above matters with respect to our reliance on the work done and the reports of the other auditors and the financial statements/financial information certified by the Management.
A. As required by Section 143(3) of the Act, based on our audit and on the consideration of reports of the other auditors on separate financial statements of such subsidiaries as were audited by other auditors, as noted in the ‘Other Matters’ paragraph, we report, to the extent applicable, that:
a) We have sought and obtained all the information and explanations which to the best of our knowledge and belief were necessary for the purposes of our audit of the aforesaid consolidated financial statements.
b) In our opinion, proper books of account as required by law relating to preparation of the aforesaid consolidated financial statements have been kept so far as it appears from our examination of those books and the reports of the other auditors.
Strides Pharma Science Limited
112
c) The consolidated balance sheet, the consolidated statement of profit and loss (including other comprehensive income), the consolidated statement of changes in equity and the consolidated statement of cash flows dealt with by this Report are in agreement with the relevant books of account maintained for the purpose of preparation of the consolidated financial statements.
d) In our opinion, the aforesaid consolidated financial statements comply with the Ind AS specified under section 133 of the Act.
e) On the basis of the written representations received from the directors of the Holding Company, its subsidiary companies and associate companies as on 31 March 2019 taken on record by the Board of Directors of the respective companies incorporated in India, none of the directors of the Group companies and its associate companies incorporated in India is disqualified as on 31 March 2019 from being appointed as a director in terms of Section 164(2) of the Act.
f) With respect to the adequacy of the internal financial controls with reference to financial statements of the Holding Company, its subsidiary companies, associate companies and joint ventures incorporated in India and the operating effectiveness of such controls, refer to our separate Report in “Annexure A”.
B. With respect to the other matters to be included in the Auditor's Report in accordance with Rule 11 of the Companies (Audit and Auditor’s) Rules, 2014, in our opinion and to the best of our information
and according to the explanations given to us and based on the consideration of the reports of the other auditors on separate financial statements of the subsidiaries, as noted in the ‘Other Matters’ paragraph:
i. The consolidated financial statements disclose the impact of pending litigations as at 31 March 2019 on the consolidated financial position of the Group, its associates and joint ventures. Refer Note 41 to the consolidated financial statements.
ii. The Group, its associates and joint ventures did not have any material foreseeable losses on long-term contracts including derivative contracts during the year ended 31 March 2019. Refer Note 51 to the consolidated financial statements.
iii. There has been no delay in transferring amounts to the Investor Education and Protection Fund by the Holding Company incorporated in India during the year ended 31 March 2019. Further there were no amounts which were required to be transferred, to the Investor Education and Protection Fund by the subsidiary companies and associate companies incorporated in India.
iv. The disclosures in the consolidated financial statements regarding holdings as well as dealings in specified bank notes during the period from 8 November 2016 to 30 December 2016 have not been made in these consolidated financial statements since they do not pertain to the financial year ended 31 March 2019.
INDEPENDENT AUDITOR'S REPORTAs at March 31, 2019
Annual Report 2018-19
113Financial Statements | Consolidated
C. With respect to the matter to be included in the Auditor’s report under section 197(16):
In our opinion and according to the information and explanations given to us and based on the reports of the statutory auditors and representations from management of such subsidiary companies and associate companies incorporated in India which were not audited by us as referred to in ‘Other Matters’ paragraph above, the remuneration paid during the current year by the Holding Company, its subsidiary companies and associate companies to its directors is in accordance with the provisions of Section 197 of the Act. The remuneration paid to any director by the Holding Company, its subsidiary
companies and associate companies is not in excess of the limit laid down under Section 197 of the Act. The Ministry of Corporate Affairs has not prescribed other details under Section 197(16) which are required to be commented upon by us.
for B S R & Co. LLPChartered Accountants
Firm’s Registration No: 101248W/W-100022
Sampad Guha ThakurtaBengaluru Partner10 May 2019 Membership No: 060573
INDEPENDENT AUDITOR'S REPORTAs at March 31, 2019
Strides Pharma Science Limited
114
Opinion
In conjunction with our audit of the consolidated financial statements of the Company as of and for the year ended 31 March 2019, we have audited the internal financial controls with reference to consolidated financial statements of Strides Pharma Science Limited (formerly known as Strides Shasun Limited) (hereinafter referred to as “the Holding Company”) and such companies incorporated in India under the Companies Act, 2013 which are its subsidiary companies and its associate companies as of that date.
In our opinion, the Holding Company and such companies incorporated in India which are its subsidiary companies and its associate companies, have, in all material respects, adequate internal financial controls with reference to consolidated financial statements and such internal financial controls were operating effectively as at 31 March 2019, based on the internal financial controls with reference to consolidated financial statements criteria established by such companies considering the essential components of such internal controls stated in the Guidance Note on Audit of Internal Financial Controls Over Financial Reporting issued by the Institute of Chartered Accountants of India (the “Guidance Note”).
Management’s Responsibility for Internal Financial Controls
The respective Company’s management and the Board of Directors are responsible for establishing and maintaining internal financial controls with reference to consolidated financial statements based on the criteria established by the respective Company considering the essential components of internal controls stated in the Guidance Note. These responsibilities include the design, implementation and maintenance of adequate internal financial controls that were operating effectively for ensuring the orderly and efficient conduct of its business, including adherence to the respective company’s policies, the safeguarding of its assets, the prevention and detection of frauds and errors, the accuracy and completeness of the accounting records, and the timely preparation of reliable financial information, as required under the Companies Act, 2013 (hereinafter referred to as “the Act”).
Auditor’s Responsibility
Our responsibility is to express an opinion on the internal financial controls with reference to consolidated financial statements based on our audit. We conducted our audit in accordance with the Guidance Note and the Standards on Auditing, prescribed under section 143(10) of the Act, to the extent applicable to an audit of internal financial controls with reference to consolidated financial statements. Those Standards and the Guidance Note require that we comply with ethical requirements and plan and perform the audit to obtain reasonable assurance about whether adequate internal financial controls with reference to consolidated financial statements were established and maintained and if such controls operated effectively in all material respects.
Our audit involves performing procedures to obtain audit evidence about the adequacy of the internal financial controls with reference to consolidated financial statements and their operating effectiveness. Our audit of internal financial controls with reference to consolidated financial statements included obtaining an understanding of internal financial controls with reference to consolidated financial statements, assessing the risk that a material weakness exists, and testing and evaluating the design and operating effectiveness of the internal controls based on the assessed risk. The procedures selected depend on the auditor’s judgement, including the assessment of the risks of material misstatement of the consolidated financial statements, whether due to fraud or error.
We believe that the audit evidence we have obtained is sufficient and appropriate to provide a basis for our audit opinion on the internal financial control system with reference to consolidated financial statements.
Meaning of Internal Financial controls with Reference to Consolidated Financial Statements
A company's internal financial controls with reference to consolidated financial statements is a process designed to provide reasonable assurance regarding the reliability of financial reporting and the preparation of financial statements for external purposes in accordance with generally accepted accounting principles. A company's internal financial controls with reference to consolidated
ANNEXURE - A TO THE INDEPENDENT AUDITOR’S REPORT ON THE CONSOLIDATED FINANCIAL STATEMENTS OF STRIDES PHARMA SCIENCE LIMITED (“THE COMPANY”) FOR THE YEAR ENDED 31 MARCH 2019:Report on the internal financial controls with reference to the aforesaid consolidated financial statements under Clause (i) of Sub-section 3 of Section 143 of the Companies Act, 2013
(Referred to in paragraph A(f) under ‘Report on Other Legal and Regulatory Requirements’ section of our report of even date)
Annual Report 2018-19
115Financial Statements | Consolidated
financial statements includes those policies and procedures that (1) pertain to the maintenance of records that, in reasonable detail, accurately and fairly reflect the transactions and dispositions of the assets of the company; (2) provide reasonable assurance that transactions are recorded as necessary to permit preparation of financial statements in accordance with generally accepted accounting principles, and that receipts and expenditures of the company are being made only in accordance with authorisations of management and directors of the company; and (3) provide reasonable assurance regarding prevention or timely detection of unauthorised acquisition, use, or disposition of the company's assets that could have a material effect on the financial statements.
Inherent Limitations of Internal Financial controls with Reference to consolidated Financial Statements
Because of the inherent limitations of internal financial controls with reference to consolidated financial
statements, including the possibility of collusion or improper management override of controls, material misstatements due to error or fraud may occur and not be detected. Also, projections of any evaluation of the internal financial controls with reference to consolidated financial statements to future periods are subject to the risk that the internal financial controls with reference to consolidated financial statements may become inadequate because of changes in conditions, or that the degree of compliance with the policies or procedures may deteriorate.
for B S R & Co. LLPChartered Accountants
Firm’s Registration No: 101248W/W-100022
Sampad Guha ThakurtaBengaluru Partner10 May 2019 Membership No: 060573
ANNEXURE - A TO THE INDEPENDENT AUDITOR’S REPORT ON THE CONSOLIDATED FINANCIAL STATEMENTS OF STRIDES PHARMA SCIENCE LIMITED (“THE COMPANY”) FOR THE YEAR ENDED 31 MARCH 2019:Report on the internal financial controls with reference to the aforesaid consolidated financial statements under Clause (i) of Sub-section 3 of Section 143 of the Companies Act, 2013
(Referred to in paragraph A(f) under ‘Report on Other Legal and Regulatory Requirements’ section of our report of even date)
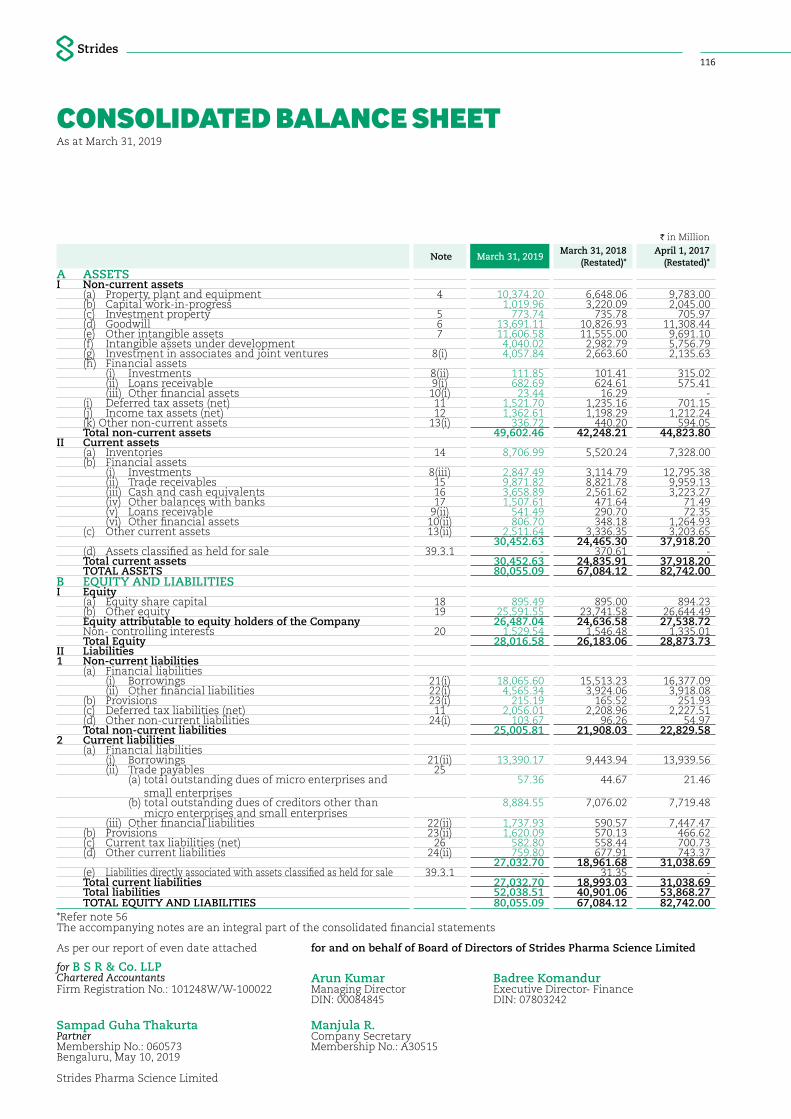
Strides Pharma Science Limited
116
CONSOLIDATED BALANCE SHEETAs at March 31, 2019
I in Million
Note March 31, 2019March 31, 2018
(Restated)*April 1, 2017
(Restated)*A ASSETSI Non-current assets
(a) Property, plant and equipment 4 10,374.20 6,648.06 9,783.00 (b) Capital work-in-progress 1,019.96 3,220.09 2,045.00 (c) Investment property 5 773.74 735.78 705.97 (d) Goodwill 6 13,691.11 10,826.93 11,308.44 (e) Other intangible assets 7 11,606.58 11,555.00 9,691.10 (f) Intangible assets under development 4,040.02 2,982.79 5,756.79 (g) Investment in associates and joint ventures 8(i) 4,057.84 2,663.60 2,135.63 (h) Financial assets (i) Investments 8(ii) 111.85 101.41 315.02 (ii) Loans receivable 9(i) 682.69 624.61 575.41 (iii) Other financial assets 10(i) 23.44 16.29 - (i) Deferred tax assets (net) 11 1,521.70 1,235.16 701.15 (j) Income tax assets (net) 12 1,362.61 1,198.29 1,212.24 (k) Other non-current assets 13(i) 336.72 440.20 594.05 Total non-current assets 49,602.46 42,248.21 44,823.80
II Current assets(a) Inventories 14 8,706.99 5,520.24 7,328.00 (b) Financial assets (i) Investments 8(iii) 2,847.49 3,114.79 12,795.38 (ii) Trade receivables 15 9,871.82 8,821.78 9,959.13 (iii) Cash and cash equivalents 16 3,658.89 2,561.62 3,223.27 (iv) Other balances with banks 17 1,507.61 471.64 71.49 (v) Loans receivable 9(ii) 541.49 290.70 72.35 (vi) Other financial assets 10(ii) 806.70 348.18 1,264.93 (c) Other current assets 13(ii) 2,511.64 3,336.35 3,203.65
30,452.63 24,465.30 37,918.20 (d) Assets classified as held for sale 39.3.1 - 370.61 - Total current assets 30,452.63 24,835.91 37,918.20 TOTAL ASSETS 80,055.09 67,084.12 82,742.00
B EQUITY AND LIABILITIESI Equity
(a) Equity share capital 18 895.49 895.00 894.23 (b) Other equity 19 25,591.55 23,741.58 26,644.49 Equity attributable to equity holders of the Company 26,487.04 24,636.58 27,538.72 Non- controlling interests 20 1,529.54 1,546.48 1,335.01 Total Equity 28,016.58 26,183.06 28,873.73
II Liabilities1 Non-current liabilities
(a) Financial liabilities (i) Borrowings 21(i) 18,065.60 15,513.23 16,377.09 (ii) Other financial liabilities 22(i) 4,565.34 3,924.06 3,918.08 (b) Provisions 23(i) 215.19 165.52 251.93 (c) Deferred tax liabilities (net) 11 2,056.01 2,208.96 2,227.51 (d) Other non-current liabilities 24(i) 103.67 96.26 54.97 Total non-current liabilities 25,005.81 21,908.03 22,829.58
2 Current liabilities(a) Financial liabilities (i) Borrowings 21(ii) 13,390.17 9,443.94 13,939.56 (ii) Trade payables 25 (a) total outstanding dues of micro enterprises and
small enterprises 57.36 44.67 21.46
(b) total outstanding dues of creditors other than micro enterprises and small enterprises
8,884.55 7,076.02 7,719.48
(iii) Other financial liabilities 22(ii) 1,737.93 590.57 7,447.47 (b) Provisions 23(ii) 1,620.09 570.13 466.62 (c) Current tax liabilities (net) 26 582.80 558.44 700.73 (d) Other current liabilities 24(ii) 759.80 677.91 743.37
27,032.70 18,961.68 31,038.69 (e) Liabilities directly associated with assets classified as held for sale 39.3.1 - 31.35 - Total current liabilities 27,032.70 18,993.03 31,038.69 Total liabilities 52,038.51 40,901.06 53,868.27 TOTAL EQUITY AND LIABILITIES 80,055.09 67,084.12 82,742.00
*Refer note 56The accompanying notes are an integral part of the consolidated financial statements
As per our report of even date attached for and on behalf of Board of Directors of Strides Pharma Science Limited
for B S R & Co. LLPChartered Accountants Arun Kumar Badree KomandurFirm Registration No.: 101248W/W-100022 Managing Director Executive Director- Finance
DIN: 00084845 DIN: 07803242
Sampad Guha Thakurta Manjula R.Partner Company SecretaryMembership No.: 060573 Membership No.: A30515Bengaluru, May 10, 2019
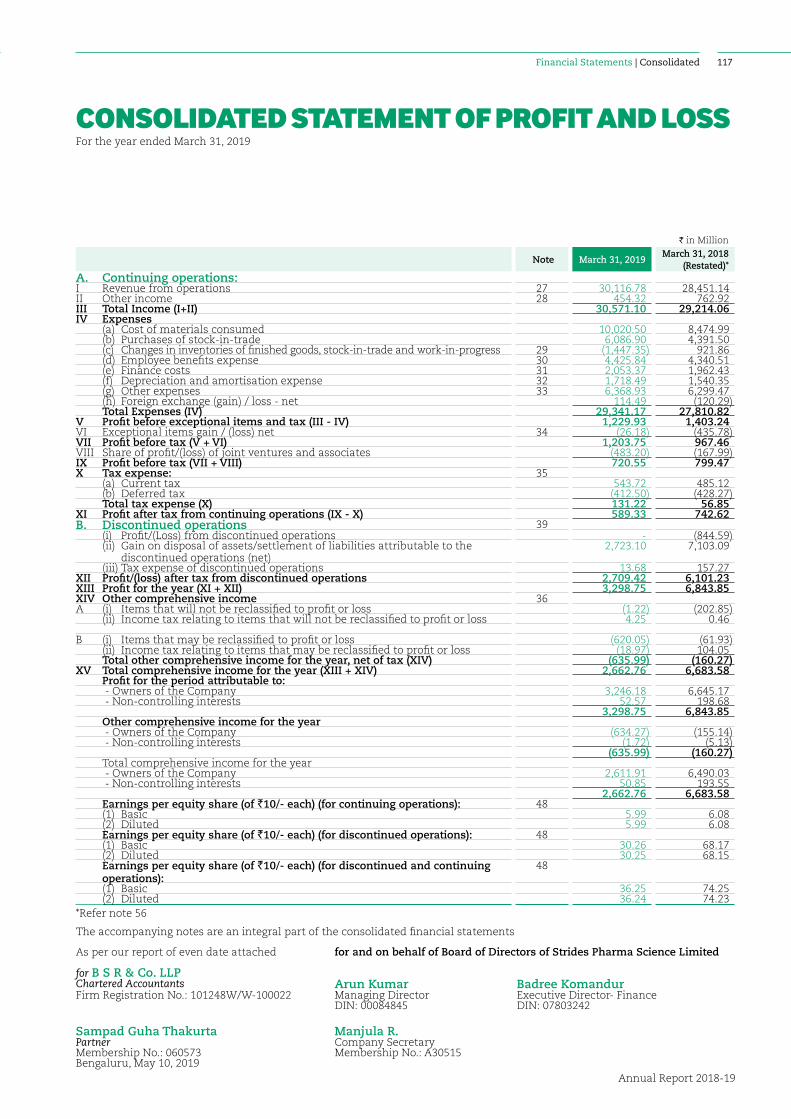
Annual Report 2018-19
117Financial Statements | Consolidated
The accompanying notes are an integral part of the consolidated financial statements
As per our report of even date attached for and on behalf of Board of Directors of Strides Pharma Science Limited
for B S R & Co. LLPChartered Accountants Arun Kumar Badree KomandurFirm Registration No.: 101248W/W-100022 Managing Director Executive Director- Finance
DIN: 00084845 DIN: 07803242
Sampad Guha Thakurta Manjula R.Partner Company SecretaryMembership No.: 060573 Membership No.: A30515Bengaluru, May 10, 2019
CONSOLIDATED STATEMENT OF PROFIT AND LOSSFor the year ended March 31, 2019
I in Million
Note March 31, 2019March 31, 2018
(Restated)*A. Continuing operations:I Revenue from operations 27 30,116.78 28,451.14 II Other income 28 454.32 762.92III Total Income (I+II) 30,571.10 29,214.06 IV Expenses
(a) Cost of materials consumed 10,020.50 8,474.99 (b) Purchases of stock-in-trade 6,086.90 4,391.50 (c) Changes in inventories of finished goods, stock-in-trade and work-in-progress 29 (1,447.35) 921.86 (d) Employee benefits expense 30 4,425.84 4,340.51 (e) Finance costs 31 2,053.37 1,962.43 (f) Depreciation and amortisation expense 32 1,718.49 1,540.35 (g) Other expenses 33 6,368.93 6,299.47 (h) Foreign exchange (gain) / loss - net 114.49 (120.29)Total Expenses (IV) 29,341.17 27,810.82
V Profit before exceptional items and tax (III - IV) 1,229.93 1,403.24 VI Exceptional items gain / (loss) net 34 (26.18) (435.78)VII Profit before tax (V + VI) 1,203.75 967.46 VIII Share of profit/(loss) of joint ventures and associates (483.20) (167.99)IX Profit before tax (VII + VIII) 720.55 799.47 X Tax expense: 35
(a) Current tax 543.72 485.12 (b) Deferred tax (412.50) (428.27)Total tax expense (X) 131.22 56.85
XI Profit after tax from continuing operations (IX - X) 589.33 742.62 B. Discontinued operations 39
(i) Profit/(Loss) from discontinued operations - (844.59)(ii) Gain on disposal of assets/settlement of liabilities attributable to the
discontinued operations (net) 2,723.10 7,103.09
(iii) Tax expense of discontinued operations 13.68 157.27 XII Profit/(loss) after tax from discontinued operations 2,709.42 6,101.23 XIII Profit for the year (XI + XII) 3,298.75 6,843.85 XIV Other comprehensive income 36A (i) Items that will not be reclassified to profit or loss (1.22) (202.85)
(ii) Income tax relating to items that will not be reclassified to profit or loss 4.25 0.46
B (i) Items that may be reclassified to profit or loss (620.05) (61.93)(ii) Income tax relating to items that may be reclassified to profit or loss (18.97) 104.05 Total other comprehensive income for the year, net of tax (XIV) (635.99) (160.27)
XV Total comprehensive income for the year (XIII + XIV) 2,662.76 6,683.58 Profit for the period attributable to: - Owners of the Company 3,246.18 6,645.17 - Non-controlling interests 52.57 198.68
3,298.75 6,843.85 Other comprehensive income for the year - Owners of the Company (634.27) (155.14) - Non-controlling interests (1.72) (5.13)
(635.99) (160.27)Total comprehensive income for the year - Owners of the Company 2,611.91 6,490.03 - Non-controlling interests 50.85 193.55
2,662.76 6,683.58 Earnings per equity share (of `10/- each) (for continuing operations): 48(1) Basic 5.99 6.08 (2) Diluted 5.99 6.08 Earnings per equity share (of `10/- each) (for discontinued operations): 48(1) Basic 30.26 68.17 (2) Diluted 30.25 68.15 Earnings per equity share (of `10/- each) (for discontinued and continuing operations):
48
(1) Basic 36.25 74.25 (2) Diluted 36.24 74.23
*Refer note 56
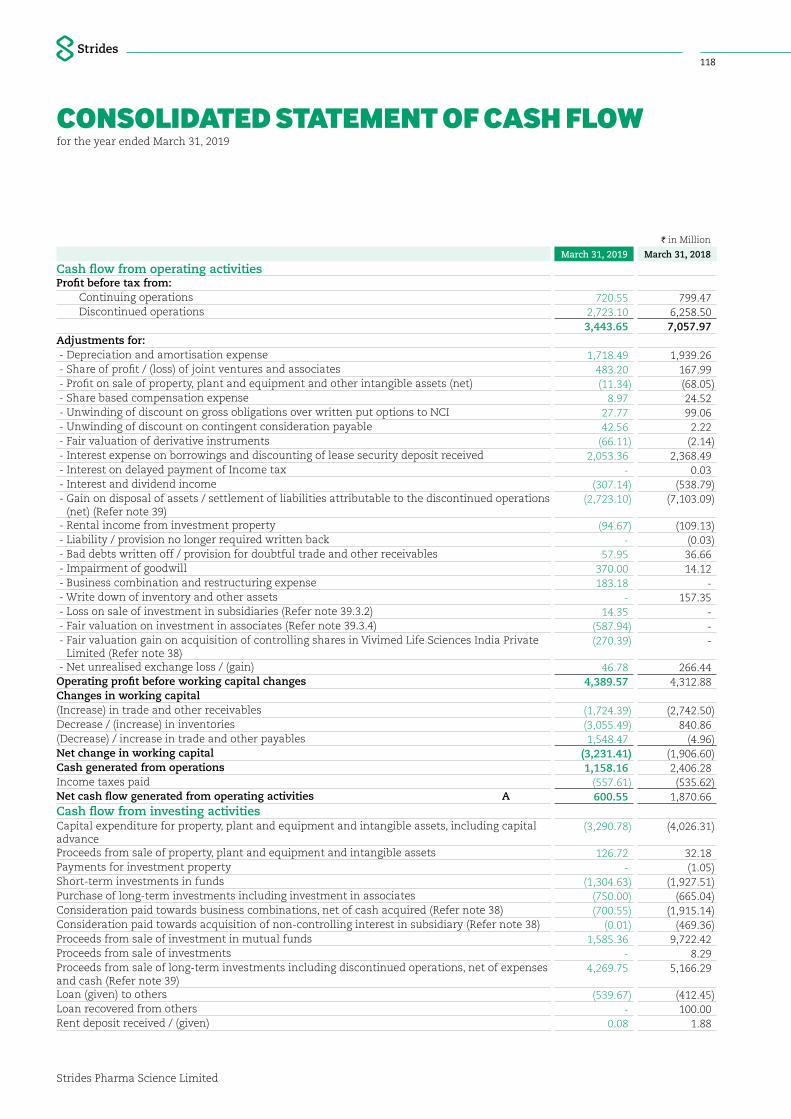
Strides Pharma Science Limited
118
CONSOLIDATED STATEMENT OF CASH FLOWfor the year ended March 31, 2019
I in Million
March 31, 2019 March 31, 2018
Cash flow from operating activitiesProfit before tax from: Continuing operations 720.55 799.47 Discontinued operations 2,723.10 6,258.50
3,443.65 7,057.97 Adjustments for: - Depreciation and amortisation expense 1,718.49 1,939.26 - Share of profit / (loss) of joint ventures and associates 483.20 167.99 - Profit on sale of property, plant and equipment and other intangible assets (net) (11.34) (68.05) - Share based compensation expense 8.97 24.52 - Unwinding of discount on gross obligations over written put options to NCI 27.77 99.06 - Unwinding of discount on contingent consideration payable 42.56 2.22 - Fair valuation of derivative instruments (66.11) (2.14) - Interest expense on borrowings and discounting of lease security deposit received 2,053.36 2,368.49 - Interest on delayed payment of Income tax - 0.03 - Interest and dividend income (307.14) (538.79) - Gain on disposal of assets / settlement of liabilities attributable to the discontinued operations
(net) (Refer note 39) (2,723.10) (7,103.09)
- Rental income from investment property (94.67) (109.13) - Liability / provision no longer required written back - (0.03) - Bad debts written off / provision for doubtful trade and other receivables 57.95 36.66 - Impairment of goodwill 370.00 14.12 - Business combination and restructuring expense 183.18 - - Write down of inventory and other assets - 157.35 - Loss on sale of investment in subsidiaries (Refer note 39.3.2) 14.35 - - Fair valuation on investment in associates (Refer note 39.3.4) (587.94) - - Fair valuation gain on acquisition of controlling shares in Vivimed Life Sciences India Private
Limited (Refer note 38) (270.39) -
- Net unrealised exchange loss / (gain) 46.78 266.44 Operating profit before working capital changes 4,389.57 4,312.88 Changes in working capital(Increase) in trade and other receivables (1,724.39) (2,742.50)Decrease / (increase) in inventories (3,055.49) 840.86 (Decrease) / increase in trade and other payables 1,548.47 (4.96)Net change in working capital (3,231.41) (1,906.60)Cash generated from operations 1,158.16 2,406.28 Income taxes paid (557.61) (535.62)Net cash flow generated from operating activities A 600.55 1,870.66 Cash flow from investing activitiesCapital expenditure for property, plant and equipment and intangible assets, including capital advance
(3,290.78) (4,026.31)
Proceeds from sale of property, plant and equipment and intangible assets 126.72 32.18 Payments for investment property - (1.05)Short-term investments in funds (1,304.63) (1,927.51)Purchase of long-term investments including investment in associates (750.00) (665.04)Consideration paid towards business combinations, net of cash acquired (Refer note 38) (700.55) (1,915.14)Consideration paid towards acquisition of non-controlling interest in subsidiary (Refer note 38) (0.01) (469.36)Proceeds from sale of investment in mutual funds 1,585.36 9,722.42 Proceeds from sale of investments - 8.29 Proceeds from sale of long-term investments including discontinued operations, net of expenses and cash (Refer note 39)
4,269.75 5,166.29
Loan (given) to others (539.67) (412.45)Loan recovered from others - 100.00 Rent deposit received / (given) 0.08 1.88
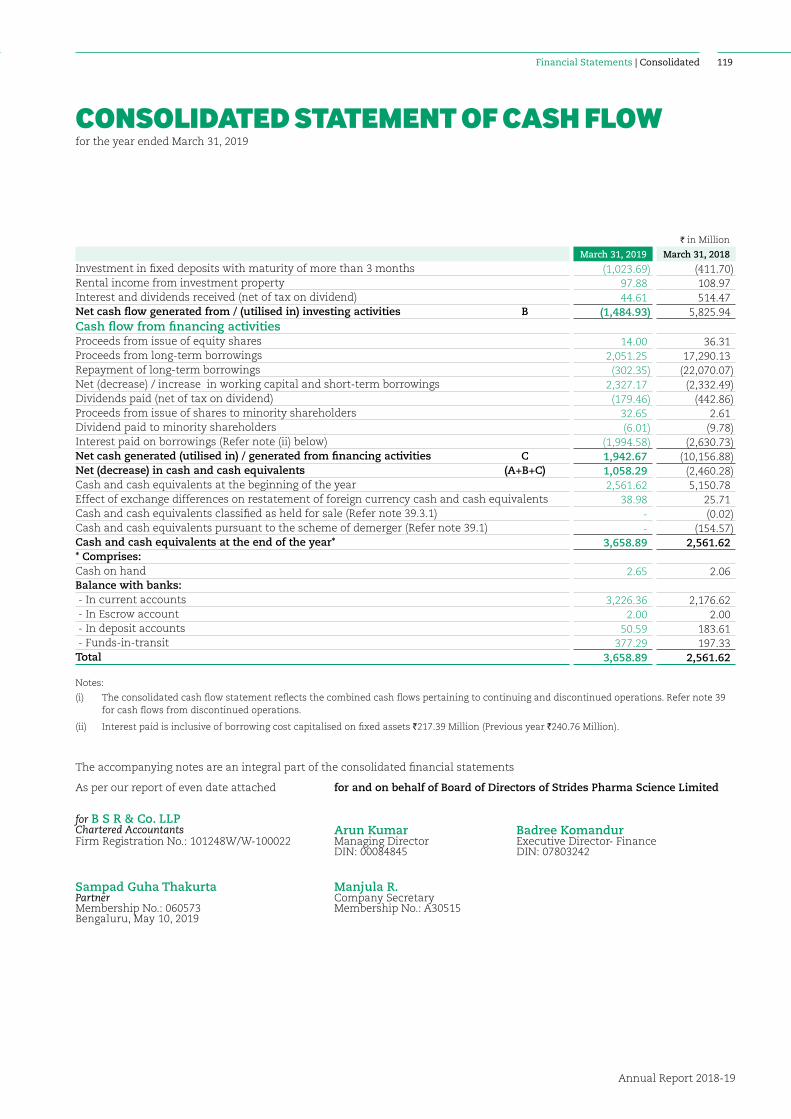
Annual Report 2018-19
119Financial Statements | Consolidated
CONSOLIDATED STATEMENT OF CASH FLOWfor the year ended March 31, 2019
I in Million
March 31, 2019 March 31, 2018
Investment in fixed deposits with maturity of more than 3 months (1,023.69) (411.70)Rental income from investment property 97.88 108.97 Interest and dividends received (net of tax on dividend) 44.61 514.47 Net cash flow generated from / (utilised in) investing activities B (1,484.93) 5,825.94 Cash flow from financing activitiesProceeds from issue of equity shares 14.00 36.31 Proceeds from long-term borrowings 2,051.25 17,290.13 Repayment of long-term borrowings (302.35) (22,070.07)Net (decrease) / increase in working capital and short-term borrowings 2,327.17 (2,332.49)Dividends paid (net of tax on dividend) (179.46) (442.86)Proceeds from issue of shares to minority shareholders 32.65 2.61 Dividend paid to minority shareholders (6.01) (9.78)Interest paid on borrowings (Refer note (ii) below) (1,994.58) (2,630.73)Net cash generated (utilised in) / generated from financing activities C 1,942.67 (10,156.88)Net (decrease) in cash and cash equivalents (A+B+C) 1,058.29 (2,460.28)Cash and cash equivalents at the beginning of the year 2,561.62 5,150.78 Effect of exchange differences on restatement of foreign currency cash and cash equivalents 38.98 25.71 Cash and cash equivalents classified as held for sale (Refer note 39.3.1) - (0.02)Cash and cash equivalents pursuant to the scheme of demerger (Refer note 39.1) - (154.57)Cash and cash equivalents at the end of the year* 3,658.89 2,561.62 * Comprises:Cash on hand 2.65 2.06 Balance with banks: - In current accounts 3,226.36 2,176.62 - In Escrow account 2.00 2.00 - In deposit accounts 50.59 183.61 - Funds-in-transit 377.29 197.33 Total 3,658.89 2,561.62
Notes:
(i) The consolidated cash flow statement reflects the combined cash flows pertaining to continuing and discontinued operations. Refer note 39 for cash flows from discontinued operations.
(ii) Interest paid is inclusive of borrowing cost capitalised on fixed assets `217.39 Million (Previous year `240.76 Million).
The accompanying notes are an integral part of the consolidated financial statements
As per our report of even date attached for and on behalf of Board of Directors of Strides Pharma Science Limited
for B S R & Co. LLPChartered Accountants Arun Kumar Badree KomandurFirm Registration No.: 101248W/W-100022 Managing Director Executive Director- Finance
DIN: 00084845 DIN: 07803242
Sampad Guha Thakurta Manjula R.Partner Company SecretaryMembership No.: 060573 Membership No.: A30515Bengaluru, May 10, 2019
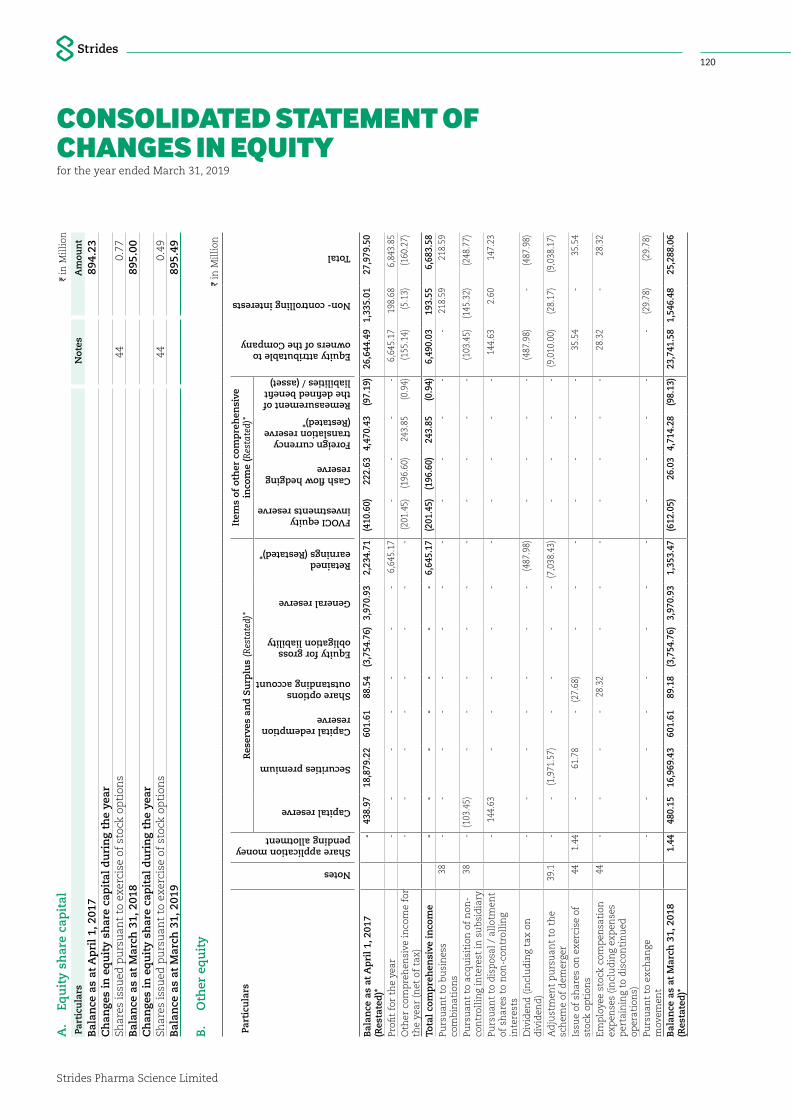
Strides Pharma Science Limited
120A
. Eq
uit
y sh
are
cap
ital
I in
Mil
lion
Part
icu
lars
Not
esA
mou
nt
Bal
ance
as
at A
pri
l 1,
201
7 8
94.2
3 C
han
ges
in e
qu
ity
shar
e ca
pit
al d
uri
ng
the
year
Shar
es is
sued
pu
rsu
ant
to e
xerc
ise
of s
tock
op
tion
s44
0.7
7 B
alan
ce a
s at
Mar
ch 3
1, 2
018
895
.00
Ch
ange
s in
eq
uit
y sh
are
cap
ital
du
rin
g th
e ye
arSh
ares
issu
ed p
urs
uan
t to
exe
rcis
e of
sto
ck o
pti
ons
44 0
.49
Bal
ance
as
at M
arch
31,
201
9 8
95.4
9
B.
Oth
er e
qu
ity
I in
Mil
lion
Part
icu
lars
Notes
Share application money pending allotment
Res
erve
s an
d S
urp
lus
(Res
tate
d)*
Item
s of
oth
er c
omp
reh
ensi
ve
inco
me
(Res
tate
d)*
Equity attributable to owners of the Company
Non- controlling interests
Total
Capital reserve
Securities premium
Capital redemption reserve
Share options outstanding account
Equity for gross obligation liability
General reserve
Retained earnings (Restated)*
FVOCI equity investments reserve
Cash flow hedging reserve
Foreign currency translation reserve (Restated)*
Remeasurement of the defined benefit liabilities / (asset)
Bal
ance
as
at A
pri
l 1,
201
7 (R
esta
ted
)* -
4
38.9
7 1
8,87
9.22
6
01.6
1 8
8.54
(3
,754
.76)
3,9
70.9
3 2
,234
.71
(410
.60)
222
.63
4,4
70.4
3 (9
7.19
) 2
6,64
4.49
1,
335.
01
27,
979.
50
Profi
t fo
r th
e ye
ar -
-
-
-
-
-
-
6
,645
.17
-
-
-
-
6,6
45.1
7 1
98.6
8 6
,843
.85
Oth
er c
omp
reh
ensi
ve in
com
e fo
r th
e ye
ar (
net
of
tax)
-
-
-
-
-
-
-
-
(201
.45)
(196
.60)
243
.85
(0.9
4) (1
55.1
4) (5
.13)
(160
.27)
Tota
l co
mp
reh
ensi
ve i
nco
me
-
-
-
-
-
-
-
6,6
45.1
7 (2
01.4
5) (1
96.6
0) 2
43.8
5 (0
.94)
6,4
90.0
3 1
93.5
5 6
,683
.58
Purs
uan
t to
bu
sin
ess
com
bin
atio
ns
38 -
-
-
-
-
-
-
-
-
-
-
-
-
2
18.5
9 2
18.5
9
Purs
uan
t to
acq
uis
itio
n o
f n
on-
con
trol
lin
g in
tere
st in
su
bsi
dia
ry38
-
(103
.45)
-
-
-
-
-
-
-
-
-
-
(103
.45)
(145
.32)
(248
.77)
Purs
uan
t to
dis
pos
al /
all
otm
ent
of s
har
es t
o n
on-c
ontr
olli
ng
inte
rest
s
-
144
.63
-
-
-
-
-
-
-
-
-
-
144
.63
2.6
0 1
47.2
3
Div
iden
d (
incl
ud
ing
tax
on
div
iden
d)
-
-
-
-
-
-
-
(487
.98)
-
-
-
-
(487
.98)
-
(487
.98)
Ad
just
men
t p
urs
uan
t to
th
e sc
hem
e of
dem
erge
r39
.1 -
-
(1
,971
.57)
-
-
-
-
(7,0
38.4
3) -
-
-
-
(9
,010
.00)
(28.
17)
(9,0
38.1
7)
Issu
e of
sh
ares
on
exe
rcis
e of
st
ock
opti
ons
44 1
.44
-
61.7
8 -
(2
7.68
) -
-
-
-
-
-
-
35
.54
-35
.54
Emp
loye
e st
ock
com
pen
sati
on
exp
ense
s (i
ncl
ud
ing
exp
ense
s p
erta
inin
g to
dis
con
tin
ued
op
erat
ion
s)
44 -
-
-
-
2
8.32
-
-
-
-
-
-
-
2
8.32
-
2
8.32
Purs
uan
t to
exc
han
ge
mov
emen
t -
-
-
-
-
-
-
-
-
-
-
-
-
(2
9.78
) (2
9.78
)
Bal
ance
as
at M
arch
31,
201
8 (R
esta
ted
)* 1
.44
480
.15
16,
969.
43
601
.61
89.
18
(3,7
54.7
6) 3
,970
.93
1,3
53.4
7 (6
12.0
5) 2
6.03
4,
714.
28
(98.
13)
23,
741.
58
1,54
6.48
2
5,28
8.06
CONSOLIDATED STATEMENT OF CHANGES IN EQUITYfor the year ended March 31, 2019
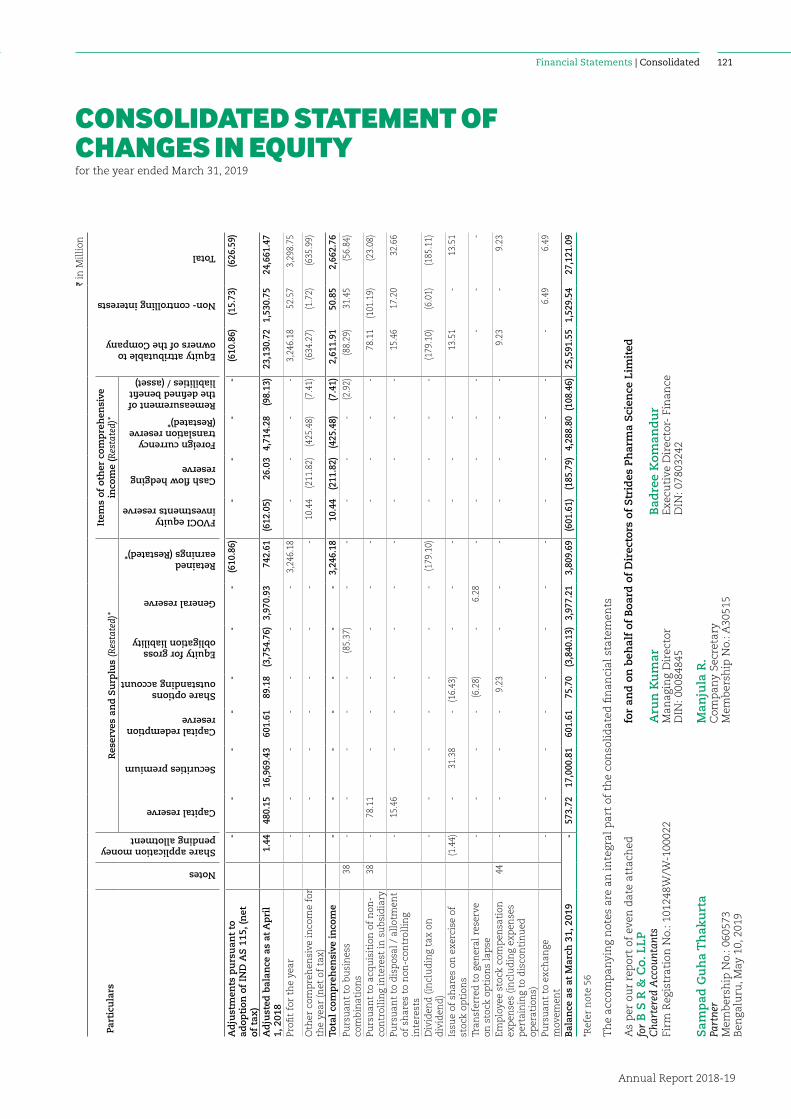
Annual Report 2018-19
121Financial Statements | Consolidated
I in
Mil
lion
Part
icu
lars
Notes
Share application money pending allotment
Res
erve
s an
d S
urp
lus
(Res
tate
d)*
Item
s of
oth
er c
omp
reh
ensi
ve
inco
me
(Res
tate
d)*
Equity attributable to owners of the Company
Non- controlling interests
Total
Capital reserve
Securities premium
Capital redemption reserve
Share options outstanding account
Equity for gross obligation liability
General reserve
Retained earnings (Restated)*
FVOCI equity investments reserve
Cash flow hedging reserve
Foreign currency translation reserve (Restated)*
Remeasurement of the defined benefit liabilities / (asset)
Ad
just
men
ts p
urs
uan
t to
ad
opti
on o
f IN
D A
S 1
15, (
net
of
tax
)
-
-
-
-
-
-
-
(610
.86)
-
-
-
-
(610
.86)
(15.
73)
(626
.59)
Ad
just
ed b
alan
ce a
s at
Ap
ril
1, 2
018
1.4
4 4
80.1
5 1
6,96
9.43
6
01.6
1 8
9.18
(3
,754
.76)
3,9
70.9
3 7
42.6
1 (6
12.0
5) 2
6.03
4,
714.
28
(98.
13)
23,
130.
72
1,53
0.75
2
4,66
1.47
Profi
t fo
r th
e ye
ar -
-
-
-
-
-
-
3
,246
.18
-
-
-
-
3,2
46.1
8 5
2.57
3
,298
.75
Oth
er c
omp
reh
ensi
ve in
com
e fo
r th
e ye
ar (
net
of
tax)
-
-
-
-
-
-
-
-
10.
44
(211
.82)
(425
.48)
(7.4
1) (6
34.2
7) (1
.72)
(635
.99)
Tota
l co
mp
reh
ensi
ve i
nco
me
-
-
-
-
-
-
-
3,2
46.1
8 1
0.44
(2
11.8
2) (4
25.4
8) (7
.41)
2,6
11.9
1 5
0.85
2
,662
.76
Purs
uan
t to
bu
sin
ess
com
bin
atio
ns
38 -
-
-
-
-
(8
5.37
) -
-
-
-
-
(2
.92)
(88.
29)
31.
45
(56.
84)
Purs
uan
t to
acq
uis
itio
n o
f n
on-
con
trol
lin
g in
tere
st in
su
bsi
dia
ry38
-
78.
11
-
-
-
-
-
-
-
-
-
-
78.
11
(101
.19)
(23.
08)
Purs
uan
t to
dis
pos
al /
all
otm
ent
of s
har
es t
o n
on-c
ontr
olli
ng
inte
rest
s
-
15.
46
-
-
-
-
-
-
-
-
-
-
15.
46
17.
20
32.
66
Div
iden
d (
incl
ud
ing
tax
on
div
iden
d)
-
-
-
-
-
-
-
(179
.10)
-
-
-
-
(179
.10)
(6.0
1) (1
85.1
1)
Issu
e of
sh
ares
on
exe
rcis
e of
st
ock
opti
ons
(1.4
4)-
31.
38
- (1
6.43
)-
--
--
- 1
3.51
-
1
3.51
Tran
sfer
red
to
gen
eral
res
erve
on
sto
ck o
pti
ons
lap
se
-
-
-
-
(6.2
8) -
6
.28
-
-
-
-
-
-
-
-
Emp
loye
e st
ock
com
pen
sati
on
exp
ense
s (i
ncl
ud
ing
exp
ense
s p
erta
inin
g to
dis
con
tin
ued
op
erat
ion
s)
44 -
-
-
-
9
.23
-
-
-
-
-
-
-
9.2
3 -
9
.23
Purs
uan
t to
exc
han
ge
mov
emen
t -
-
-
-
-
-
-
-
-
-
-
-
-
6
.49
6.4
9
Bal
ance
as
at M
arch
31,
201
9 -
5
73.7
2 1
7,00
0.81
6
01.6
1 75
.70
(3,8
40.1
3) 3
,977
.21
3,8
09.6
9 (6
01.6
1) (1
85.7
9) 4
,288
.80
(108
.46)
25,
591.
55
1,52
9.54
2
7,12
1.09
*Ref
er n
ote
56
Th
e ac
com
pan
yin
g n
otes
are
an
inte
gral
par
t of
th
e co
nso
lid
ated
fin
anci
al s
tate
men
ts
As
per
ou
r re
por
t of
eve
n d
ate
atta
ched
for
and
on
beh
alf
of B
oard
of
Dir
ecto
rs o
f S
trid
es P
har
ma
Sci
ence
Lim
ited
for
B S
R &
Co.
LLP
Cha
rter
ed A
ccou
ntan
tsA
run
Ku
mar
Bad
ree
Kom
and
ur
Firm
Reg
istr
atio
n N
o.: 1
0124
8W/W
-100
022
Man
agin
g D
irec
tor
Exec
uti
ve D
irec
tor-
Fin
ance
DIN
: 000
8484
5D
IN: 0
7803
242
Sam
pad
Gu
ha
Th
aku
rta
Man
jula
R.
Part
ner
Com
pan
y Se
cret
ary
Mem
ber
ship
No.
: 060
573
Mem
ber
ship
No.
: A30
515
Ben
galu
ru, M
ay 1
0, 2
019
CONSOLIDATED STATEMENT OF CHANGES IN EQUITYfor the year ended March 31, 2019
NOTESforming part of the consolidated financial statements for the year ended March 31, 2019
Strides Pharma Science Limited
122
Note No. 01 // General Information
Strides Pharma Science Limited (formerly Strides Shasun Limited) (the ‘Company’ or ‘Strides’) and its subsidiaries (together referred to as the ‘Group’) are into the development and manufacture of pharmaceutical products. The Group has its registered office situated at 201, Devavrata, Sector 17, Vashi, Navi Mumbai – 400703, with corporate office in Bengaluru, India and operates across many countries spreading across developed and emerging markets. The Company has changed its name from Strides Shasun Limited to Strdes Pharama Science Limited with effect from July 18, 2018. Strides is listed on the National Stock Exchange (NSE) and Bombay Stock Exchange (BSE) in India.
Note No. 02 // Basis of preparation of consolidated financial statements
2.1 Statement of complianceThese consolidated financial statements have been prepared in accordance with Indian Accounting Standards (“Ind AS”) as per the Companies (Indian Accounting Standards) Rules 2015, as amended, notified under Section 133 of Companies Act, 2013, (the 'Act') and other relevant provisions of the Act.
These consolidated Ind AS financial statements ('consolidated financial statements') were approved by the Board of Directors and authorised for issue on May 10, 2019.
2.2 Functional and presentation currencyThese consolidated financial statements are presented in Indian Rupees (`), which is also the Company's functional currency. All amounts have been rounded-off to two decimal places to the nearest million, unless otherwise indicated.
2.3 Basis of measurementThe consolidated financial statements have been prepared on the historical cost basis except for the following items:
- Certain financial assets and liabilities (including derivative instruments) are measured at fair value;
- Net defined benefit assets/(liability) are measured at fair value of plan assets, less present value of defined benefit obligations; and
- Equity settled share based payments that are measured at fair value
2.4 Basis of consolidationThe consolidated financial statements includes the financial statements of the Company and entities (including structured entities) controlled by the Company and its subsidiaries. Control is achieved when the Group:
- has power over the investee;
- is exposed, or has rights, to variable returns from its involvement with the investee; and
- has the ability to use its power to affect its returns.
The Group reassesses whether or not it controls an investee if facts and circumstances indicate that there are changes to one or more of the three elements of control listed above.
When the Group has less than a majority of the voting rights of an investee, it has power over the investee when the voting rights are sufficient to give it the practical ability to direct the relevant activities of the investee unilaterally. The Group considers all relevant facts and circumstances in assessing whether or not the Group’s voting rights in an investee are sufficient to give it power, including:
- the size of the Group's holding of voting rights relative to the size and dispersion of holdings of the other vote holders;
- potential voting rights held by the Group, other vote holders or other parties;
- rights arising from other contractual arrangements; and
- any additional facts and circumstances that indicate that the Group has, or does not have, the current ability to direct the relevant activities at the time that decisions need to be made, including voting patterns at previous shareholders' meetings.
Consolidation of a subsidiary begins when the Group obtains control over the subsidiary and ceases when the Group loses control of the subsidiary. Specifically, income and expenses of a subsidiary acquired or disposed of during the year are included in the consolidated statement of profit and loss from the date the Group gains control until the date when the Group ceases to control the subsidiary.
Profit or loss and each component of other comprehensive income are attributed to the owners of the Company and to the non-controlling interests. Total comprehensive
NOTESforming part of the consolidated financial statements for the year ended March 31, 2019
Annual Report 2018-19
123Financial Statements | Consolidated
income of subsidiaries is attributed to the owners of the Company and to the non-controlling interests even if this results in the non-controlling interests having a deficit balance.
When necessary, adjustments are made to the financial statements of subsidiaries to bring their accounting policies into line with the Group's accounting policies.
The financial statements of the Group are consolidated on line-by-line basis. Intra-group transactions, balances and any unrealised gains arising from intra-group transactions, are eliminated. Unrealised losses are eliminated, but only to the extent that there is no evidence of impairment. All temporary differences that arise from the elimination of profits and losses resulting from intragroup transactions are recognised as per Ind AS 12 Income Taxes.
Changes in the Group's ownership interests in existing subsidiariesChanges in the Group’s ownership interests in subsidiaries that do not result in the Group losing control over the subsidiaries are accounted for as equity transactions. The carrying amounts of the Group’s interests and the non-controlling interests are adjusted to reflect the changes in their relative interests in the subsidiaries. Any difference between the amount by which the non-controlling interests are adjusted and the fair value of the consideration paid or received is recognised directly in equity and attributed to owners of the Company.
When the Group loses control of a subsidiary, a gain or loss is recognised in statement of profit and loss and is calculated as the difference between (i) the aggregate of the fair value of the consideration received and the fair value of any retained interest and (ii) the previous carrying amount of the assets (including goodwill), and liabilities of the subsidiary and any non-controlling interests. All amounts previously recognised in other comprehensive income in relation to that subsidiary are accounted for as if the Group had directly disposed of the related assets or liabilities of the subsidiary (i.e. reclassified to statement of profit and loss or transferred to another category of equity as specified/permitted by applicable Ind AS). The fair value of any investment retained in the former subsidiary at the date when control is lost is regarded as the fair value on initial recognition for subsequent accounting under Ind AS 109, or, when applicable, the cost on initial recognition of an investment in an associate or a joint venture.
Refer note 50 for details of subsidiaries considered in these consolidated financial statements.
2.5 Use of estimates and judgementsThe preparation of the consolidated financial statements in conformity with Ind AS requires management to make estimates, judgements and assumptions. These estimates, judgements and assumptions affect the application of accounting policies and the reported amounts of assets and liabilities, the disclosures of contingent assets and liabilities at the date of the consolidated financial statements and reported amounts of revenues and expenses during the period. Accounting estimates could change from period to period. Actual results could differ from those estimates. Appropriate changes in estimates are made as management becomes aware of changes in circumstances surrounding the estimates. Changes in estimates are reflected in the consolidated financial statements in the period in which changes are made and, if material, their effects are disclosed in the notes to the consolidated financial statements.
2.5.1 JudgementsInformation about judgements made in applying accounting policies that have the most significant effects on the amounts recognised in the financial statements is included in the following notes:
• Note 2.2 — Assessment of functional currency;
• Note 3.5 — Revenue recognition: whether revenue from sale of product and services is recognised overtime or at a point of time;
• Note 3.18 and 51 — Financial instruments;
• Note 3.12, 3.13 and 3.14— Useful lives of property, plant and equipment, intangible assets and investment property;
• Note 3.6 — Lease classification;
• Note 45 — measurement of defined benefit obligation; key actuarial assumptions;
• Note 44 — Share based payments;
• Note 3.11 and 41— Provision for income taxes and related tax contingencies and evaluation of recoverability of deferred tax assets;
• Note 3.15 — Impairment testing for non financial assets.
2.5.2 Control over subsidiariesThe following entities are considered subsidiaries of the Group even though the Group and non-controlling interests have about 50% of the ownership interest and the voting rights in such entities:
NOTESforming part of the consolidated financial statements for the year ended March 31, 2019
Strides Pharma Science Limited
124
Proportion of ownership interest and voting power held by the Group
Name of the entities March 31, 2019 March 31, 2018
1. Generic Partners Pty Limited 51% 51%2. Generic Partners Holding Co. Pty Limited 51% 51%3. Generic Partners (International) Pte Limited 51% 51%4. Generic Partners (Canada) Inc 51% 51%5. Generic Partners (M) SDN BHD 51% 51%6. Generic Partners (NZ) Limited 51% 51%7. Pharmacy Alliance Pty Limited 51% 51%8. Alliance Pharmacy Pty Ltd 51% 51%9. Pharmacy Alliance Group Holdings Pty Ltd 51% 51%10. Smarterpharm Pty Limited 51% 51%11. Universal Corporation Limited 51% 51%12. Trinity Pharma (Pty) Limited 51.76% 51.76%13. Apollo Life Sciences Holdings (Pty) Limited 51.76% 51.76%
The management of the Group assessed whether or not the Group has control over the above mentioned entities based on whether the Group has the practical ability to direct the relevant activities of such entities unilaterally. Based on such assessment, the directors concluded that the Group has sufficient management rights to unilaterally direct the relevant activities of such entities and therefore the Group has control.
2.6 Assumption and estimation uncertaintyInformation about assumptions and estimation uncertainties that have a significant risk of resulting in a material adjustment in the year ending March 31, 2019 is included in the following notes:
2.6.1 Impairment of non-financial assetsDetermining whether the asset is impaired requires to assess the recoverable amount of the asset or Cash Generating Unit (CGU) which is compared to the carrying amount of the asset or CGU, as applicable. Recoverable amount is the higher of fair value less costs of disposal and value in use. Where the carrying amount of an asset or CGU exceeds the recoverable amount, the asset is considered impaired and is written down to its recoverable amount.
The value in use calculation requires the management to estimate the future cash flows expected to arise from the cash-generating unit and a suitable discount rate in order to calculate present value. Where the actual future cash flows are less than expected, a material impairment loss may arise.
2.6.2 Impairment of financial assetsThe impairment provisions for financial assets are based on assumptions about risk of default and expected cash loss rates. The Group uses judgement in making these assumptions and selecting the inputs to the impairment
calculation, based on Group’s past history, existing market conditions as well as forward looking estimates at the end of each reporting period.
2.6.3 Useful lives of property, plant and equipment, Intangible assets and Investment propertyThe Group reviews the useful life of property, plant and equipment at the end of each reporting period. This assessment may result in change in the depreciation expense in future periods.
2.6.4 Employee benefitsThe cost of defined benefit plans are determined using actuarial valuations. The actuarial valuation involves making assumptions about discount rates, expected future salary increases, attrition rate and mortality rates. Due to the long-term nature of these plans, such estimates are subject to significant uncertainty.
2.6.5 Share based compensation to employeesThe Company has granted share based payment plans to its employees. Valuation models are used to calculate the expense for such share-based compensation to employees. These models require a number of assumptions to be made as input. These include financial assumptions as well as various assumptions around individual employee behaviour.
2.6.6 LitigationsAs explained in note 41, the Group is a party to certain commercial disputes and has also received notification of claims for significant amounts. There are number of factors that may affect the ultimate outcome in respect of this matter and accordingly, it is difficult to assess the impact of these disputes with accuracy.
2.7 Operating cycleAs mentioned in para 1 above under 'Corporate information’, the Group is into development and
NOTESforming part of the consolidated financial statements for the year ended March 31, 2019
Annual Report 2018-19
125Financial Statements | Consolidated
manufacture of pharmaceutical products. Based on the normal time between acquisition of assets and their realisation in cash or cash equivalents, the Group has determined its operating cycle as 3 years to 5 years and 12 months relating to research and development activities and manufacturing of pharmaceutical products respectively. The above basis is used for classifying the assets and liabilities into current and non-current as the case may be.
2.8 Cash flow statementCash flows are reported using indirect method, whereby net profits before tax is adjusted for the effects of transactions of a non-cash nature and any deferrals or accruals of past or future cash receipts or payments and items of income or expenses associated with investing or financing cash flows. The cash flows from regular revenue generating (operating activities), investing and financing activities of the Group are segregated.
Note No. 03 // Significant accounting policies3.1 Business combinationsAcquisitions of businesses are accounted for using the acquisition method. The consideration transferred in a business combination is measured at fair value, which is calculated as the sum of the acquisition-date fair values of the assets transferred by the Group, liabilities incurred by the Group to the former owners of the acquiree and the equity interests issued by the Group in exchange of control of the acquiree. Acquisition-related costs are generally recognised in statement of profit and loss as incurred.
At the acquisition date, the identifiable assets acquired and the liabilities assumed are recognised at their fair value, except that:
- deferred tax assets or liabilities, and assets or liabilities related to employee benefit arrangements are recognised and measured in accordance with Ind AS 12 Income Taxes and Ind AS 19 Employee Benefits respectively;
- liabilities or equity instruments related to share-based payment arrangements of the acquiree or share-based payment arrangements of the Group entered into to replace share-based payment arrangements of the acquiree are measured in accordance with Ind AS 102 Share-based Payment at the acquisition date (see note 3.10.2); and
- assets (or disposal groups) that are classified as held for sale in accordance with Ind AS 105 Non-current Assets Held for Sale and Discontinued Operations are measured in accordance with that Standard.
Goodwill is measured as the excess of the sum of the consideration transferred, the amount of any non-controlling interests in the acquiree, and the fair value of the acquirer’s previously held equity interest in the acquiree (if any) over the net of the acquisition-date amounts of the identifiable assets acquired and the liabilities assumed.
In case of a bargain purchase, before recognising a gain in respect thereof, the Group determines whether there exists clear evidence of the underlying reasons for classifying the business combination as a bargain purchase. Thereafter, the Group reassesses whether it has correctly identified all of the assets acquired and all of the liabilities assumed and recognises any additional assets or liabilities that are identified in that reassessment. The Group then reviews the procedures used to measure the amounts that Ind AS requires for the purposes of calculating the bargain purchase. If the gain remains after this reassessment and review, the Group recognises it in other comprehensive income and accumulates the same in equity as capital reserve. This gain is attributed to the acquirer. If there does not exist clear evidence of the underlying reasons for classifying the business combination as a bargain purchase, the Group recognises the gain, after reassessing and reviewing (as described above), directly in equity as capital reserve.
Non-controlling interests that are present ownership interests and entitle their holders to a proportionate share of the entity’s net assets in the event of liquidation may be initially measured either at fair value or at the non-controlling interests’ proportionate share of the recognised amounts of the acquiree’s identifiable net assets. The choice of measurement basis is made on a transaction-by-transaction basis. Other types of non-controlling interests are measured at fair value or, when applicable, on the basis specified in another Ind AS.
When the consideration transferred by the Group in a business combination includes assets or liabilities resulting from a contingent consideration arrangement, the contingent consideration is measured at its acquisition-date fair value and included as part of the consideration transferred in a business combination. Changes in the fair value of the contingent consideration that qualify as measurement period adjustments are adjusted retrospectively, with corresponding adjustments against goodwill or capital reserve, as the case maybe. Measurement period adjustments are adjustments that arise from additional information obtained during the ‘measurement period’ (which cannot exceed one year from the acquisition date) about facts and circumstances that existed at the acquisition date.
NOTESforming part of the consolidated financial statements for the year ended March 31, 2019
Strides Pharma Science Limited
126
The subsequent accounting for changes in the fair value of the contingent consideration that do not qualify as measurement period adjustments depends on how the contingent consideration is classified. Contingent consideration that is classified as equity is not remeasured at subsequent reporting dates and its subsequent settlement is accounted for within equity. Contingent consideration that is classified as an asset or a liability is remeasured at fair value at subsequent reporting dates with the corresponding gain or loss being recognised in statement of profit and loss.
When a business combination is achieved in stages, the Group’s previously held equity interest in the acquiree is remeasured to its acquisition-date fair value and the resulting gain or loss, if any, is recognised in statement of profit and loss. Amounts arising from interests in the acquiree prior to the acquisition date that have previously been recognised in other comprehensive income are reclassified to statement of profit and loss where such treatment would be appropriate if that interest were disposed of.
If the initial accounting for a business combination is incomplete by the end of the reporting period in which the combination occurs, the Group reports provisional amounts for the items for which the accounting is incomplete. Those provisional amounts are adjusted during the measurement period (see above), or additional assets or liabilities are recognised, to reflect new information obtained about facts and circumstances that existed at the acquisition date that, if known, would have affected the amounts recognised at that date.
3.2 GoodwillGoodwill arising on an acquisition of a business is carried at cost as established at the date of acquisition of the business less accumulated impairment losses, if any.
For the purposes of impairment testing, goodwill is allocated to cash-generating units. The allocation is made to those cash generating units or groups of cash generating units that are expected to benefit from the business combination in which such goodwill arose.
A cash-generating unit to which goodwill has been allocated is tested for impairment annually, or more frequently when there is an indication that the unit may be impaired. If the recoverable amount of the cash-generating unit is less than its carrying amount, the impairment loss is allocated first to reduce the carrying amount of any goodwill allocated to the unit and then to the other assets of the unit pro rata based on the carrying amount of each asset in the unit. Any impairment loss for goodwill is recognised directly in statement of profit
and loss. An impairment loss recognised for goodwill is not reversed in subsequent periods.
On disposal of the relevant cash-generating unit, the attributable amount of goodwill is included in the determination of the profit or loss on disposal.
The Group's policy for goodwill arising on the acquisition of an associate and a joint venture is described at note 3.3 below.
3.3 Investments in associates and joint venturesAn associate is an entity over which the Group has significant influence. Significant influence is the power to participate in the financial and operating policy decisions of the investee but is not control or joint control over those policies.
A joint venture is a joint arrangement whereby the parties that have joint control of the arrangement have rights to the net assets of the joint arrangement. Joint control is the contractually agreed sharing of control of an arrangement, which exists only when decisions about the relevant activities require unanimous consent of the parties sharing control.
The results and assets and liabilities of associates or joint ventures are incorporated in these consolidated financial statements using the equity method of accounting, except when the investment, or a portion thereof, is classified as held for sale, in which case it is accounted for in accordance with Ind AS 105. Under the equity method, an investment in an associate or a joint venture is initially recognised in the consolidated balance sheet at cost and adjusted thereafter to recognise the Group's share of the profit or loss and other comprehensive income of the associate or joint venture. Distributions received from an associate or a joint venture reduce the carrying amount of the investment. When the Group's share of losses of an associate or a joint venture exceeds the Group's interest in that associate or joint venture (which includes any long-term interests that, in substance, form part of the Group's net investment in the associate or joint venture), the Group discontinues recognising its share of further losses. Additional losses are recognised only to the extent that the Group has incurred legal or constructive obligations or made payments on behalf of the associate or joint venture.
An investment in an associate or a joint venture is accounted for using the equity method from the date on which the investee becomes an associate or a joint venture. On acquisition of the investment in an associate or a joint venture, any excess of the cost of the investment over the Group's share of the net fair value
NOTESforming part of the consolidated financial statements for the year ended March 31, 2019
Annual Report 2018-19
127Financial Statements | Consolidated
of the identifiable assets and liabilities of the investee is recognised as goodwill, which is included within the carrying amount of the investment. Any excess of the Group's share of the net fair value of the identifiable assets and liabilities over the cost of the investment, after reassessment, is recognised directly in equity as capital reserve in the period in which the investment is acquired.
After application of the equity method of accounting, the Group determines whether there is any objective evidence of impairment as a result of one or more events that occurred after the initial recognition of the net investment in an associate or a joint venture and that event (or events) has an impact on the estimated future cash flows from the net investment that can be reliably estimated. If there exists such an objective evidence of impairment, then it is necessary to recognise impairment loss with respect to the Group’s investment in an associate or a joint venture.
When necessary, the entire carrying amount of the investment (including goodwill) is tested for impairment in accordance with Ind AS 36 Impairment of Assets as a single asset by comparing its recoverable amount (higher of value in use and fair value less costs of disposal) with its carrying amount. Any impairment loss recognised forms part of the carrying amount of the investment. Any reversal of that impairment loss is recognised in accordance with Ind AS 36 to the extent that the recoverable amount of the investment subsequently increases.
The Group discontinues the use of the equity method from the date when the investment ceases to be an associate or a joint venture, or when the investment is classified as held for sale. When the Group retains an interest in the former associate or joint venture and the retained interest is a financial asset, the Group measures the retained interest at fair value at that date and the fair value is regarded as its fair value on initial recognition in accordance with Ind AS 109. The difference between the carrying amount of the associate or joint venture at the date the equity method was discontinued, and the fair value of any retained interest and any proceeds from disposing of a part interest in the associate or joint venture is included in the determination of the gain or loss on disposal of the associate or joint venture. In addition, the Group accounts for all amounts previously recognised in other comprehensive income in relation to that associate or joint venture on the same basis as would be required if that associate or joint venture had directly disposed of the related assets or liabilities. Therefore, if a gain or loss previously recognised in other comprehensive income by that associate or joint venture would be reclassified to statement of profit and loss on the disposal of the
related assets or liabilities, the Group reclassifies the gain or loss from equity to statement of profit and loss (as a reclassification adjustment) when the equity method is discontinued.
The Group continues to use the equity method when an investment in an associate becomes an investment in a joint venture or an investment in a joint venture becomes an investment in an associate. There is no remeasurement to fair value upon such changes in ownership interests.
When the Group reduces its ownership interest in an associate or a joint venture but the Group continues to use the equity method, the Group reclassifies to statement of profit and loss the proportion of the gain or loss that had previously been recognised in other comprehensive income relating to that reduction in ownership interest if that gain or loss would be reclassified to statement of profit and loss on the disposal of the related assets or liabilities.
When a group entity transacts with an associate or a joint venture of the Group, profits and losses resulting from the transactions with the associate or joint venture are recognised in the Group’s consolidated financial statements only to the extent of interests in the associate or joint venture that are not related to the Group.
3.4 Non-current assets held for saleNon-current assets and disposal groups are classified as held for sale if their carrying amount will be recovered principally through a sale transaction rather than through continuing use. This condition is regarded as met only when the asset (or disposal group) is available for immediate sale in its present condition subject only to terms that are usual and customary for sales of such asset (or disposal group) and its sale is highly probable. Management must be committed to the sale, which should be expected to qualify for recognition as a completed sale within one year from the date of classification.
When the Group is committed to a sale plan involving loss of control of a subsidiary, all of the assets and liabilities of that subsidiary are classified as held for sale when the criteria described above are met, regardless of whether the Group will retain a non-controlling interest in its former subsidiary after the sale.
When the Group is committed to a sale plan involving disposal of an investment, or a portion of an investment, in an associate or joint venture, the investment or the portion of the investment that will be disposed of is classified as held for sale when the criteria described
NOTESforming part of the consolidated financial statements for the year ended March 31, 2019
Strides Pharma Science Limited
128
above are met, and the Group discontinues the use of the equity method in relation to the portion that is classified as held for sale. Any retained portion of an investment in an associate or a joint venture that has not been classified as held for sale continues to be accounted for using the equity method. The Group discontinues the use of the equity method at the time of disposal when the disposal results in the Group losing significant influence over the associate or joint venture.
After the disposal takes place, the Group accounts for any retained interest in the associate or joint venture in accordance with Ind AS 109 unless the retained interest continues to be an associate or a joint venture, in which case the Group uses the equity method (see the accounting policy regarding investments in associates or joint ventures above).
Non-current assets (and disposal groups) classified as held for sale are measured at the lower of their carrying amount and fair value less costs to sell.
3.5 Revenue from contracts with customersThe Group recognises revenue to depict the transfer of promised goods or services to customers in an amount that reflects the consideration to which the entity expects to be entitled in exchange for those goods or services. A 5-step approach is used to recognise revenue as below:
Step 1: Identify the contract(s) with a customer
Step 2: Identify the performance obligation in contract
Step 3: Determine the transaction price
Step 4: Allocate the transaction price to the performance obligations in the contract
Step 5: Recognise revenue when (or as) the entity satisfies a performance obligation
3.5.1 Sale of goodsRevenue is recognised when a promise in a customer contract (performance obligation) has been satisfied by transferring control over the promised goods to the customer. Control over a promised good refers to the ability to direct the use of, and obtain substantially all of the remaining benefits from, those goods. Control is usually transferred upon shipment, delivery to, upon receipt of goods by the customer, in accordance with the delivery and acceptance terms agreed with the customers. The amount of revenue to be recognised (transaction price) is based on the consideration expected to be received in exchange for goods, excluding amounts collected on behalf of third parties such as sales tax or other taxes directly linked to sales. If a contract contains more than one performance obligation, the
transaction price is allocated to each performance obligation based on their relative stand-alone selling prices. Revenue from product sales are recorded net of allowances for estimated rebates, cash discounts and estimates of product returns, all of which are established at the time of sale.
The consideration received by the Group in exchange for its goods may be fixed or variable. Variable consideration is only recognised when it is considered highly probable that a significant revenue reversal will not occur once the underlying uncertainty related to variable consideration is subsequently resolved.
Profit share revenuesThe Group from time to time enters into marketing arrangements with certain business partners for the sale of its products in certain markets. Under such arrangements, the Group sells its products to the business partners at a base purchase price agreed upon in the arrangement and is also entitled to a profit share which is over and above the base purchase price. The profit share is typically dependent on the business partner’s ultimate net sale proceeds or net profits, subject to any reductions or adjustments that are required by the terms of the arrangement. Such arrangements typically require the business partner to provide confirmation of units sold and net sales or net profit computations for the products covered under the arrangement.
Revenue in an amount equal to the base purchase price is recognised in these transactions upon delivery of products to the business partners. An additional amount representing the profit share component is recognised as revenue in the period which corresponds to the ultimate sales of the products made by business partners only when the collectability of the profit share becomes probable and a reliable measurement of the profit share is available. Otherwise, recognition is deferred to a subsequent period pending satisfaction of such collectability and measurability requirements. In measuring the amount of profit share revenue to be recognised for each period, the Group uses all available information and evidence, including any confirmations from the business partner of the profit share amount owed to the Group, to the extent made available before the date the Company’s Board of Directors authorises the issuance of its financial statements for the applicable period.
Sale to DistributorsThe Group appoints distributors in various territories who purchases the goods from the Group and thereafter sells them in the territory. In case the distributor is acting as an agent, the Group defers revenue recognition
NOTESforming part of the consolidated financial statements for the year ended March 31, 2019
Annual Report 2018-19
129Financial Statements | Consolidated
till the time goods are sold by the distributor to the end customer. On the other hand, if the distributor is principal, revenue is recognised upon the transfer of significant risks and rewards of ownership of the goods to the distributor.
Right to reject or return goodsThe Group sells its products to the customers with a right to return the goods within the specified period of time. If the probability of acceptance by the customer is uncertain, recognition of revenue is deferred till the expiry of right to return or acceptance by the customer whichever is earlier.
Free samplesThe Group distributes free samples to distributors, at various exhibitions and at medical conferences. The cost of samples distributed at exhibitions, medical conferences or to doctors directly are treated as marketing expense and clubbed under “Business Promotion Expense”. However, free samples given to distributors (that are not acting as agents) is recognised as cost of goods sold. In case the free samples are not delivered at the same time as the related sales consignment, a reliable provision is made in this regard.
Price Variations / IncentivesIncentives are accounted based on the assessment of whether the beneficiary (of the incentive) is acting as a principal or an agent. Where the beneficiary is a principal, the incentive is regarded as consideration paid to the customer and is reduced from revenue. However, where the beneficiary is an agent, the incentive payment is recognised as an expense as the same is in the nature of commission.
Chargebacks / Reptos claims by the wholesalers / distributors and Price ProtectionsChargebacks and reptos claims are estimated on the basis of the average trend of the past years and recognised as reduction to revenue.
3.5.2 Rendering of servicesRevenue from services rendered, which primarily relate to contract research, is recognised in the consolidated statement of profit and loss as the underlying services are performed. Upfront payments received under these arrangements are deferred and recognised as revenue over the expected period over which the related services are expected to be performed.
3.5.3 Royalty, sale of licenses and Intellectual property rights
The Group enters into certain dossier sales, royalties, licensing and supply arrangements with various parties. Income from licensing arrangements is generally
recognised over the term of the contract. Some of these arrangements include certain performance obligations by the Group. Revenue from such arrangements is recognised in the period in which the Group completes all its performance obligations.
3.5.4 Dividend and interest incomeDividend income from investments is recognised when the shareholder's right to receive payment has been established (provided that it is probable that the economic benefits will flow to the Group and the amount of income can be measured reliably).
Interest income from a financial asset is recognised when it is probable that the economic benefits will flow to the Group and the amount of income can be measured reliably. Interest income is accrued on a time basis, by reference to the principal outstanding and at the effective interest rate applicable, which is the rate that exactly discounts estimated future cash receipts through the expected life of the financial asset to that asset's net carrying amount on initial recognition.
3.5.5 Rental incomeThe Group's policy for recognition of revenue from operating leases is described in note 3.6.1 below.
3.5.6 Export IncentivesExport incentives are accrued for based on fulfilment of eligibility criteria for availing the incentives and when there is no uncertainty in receiving the same. These incentives include estimated realisable values/benefits from special import licenses and benefits under specified schemes as applicable.
3.5.7 TransitionThe Group has adopted IND AS 115 using the cumulative effect method (without practical expedients), with the effect of initially applying this standard recognised at the date of initial application (i.e. April 1, 2018). Accordingly, the information presented for the year ended March 31, 2018 has not been restated – i.e. it is presented, as previously reported, under IND AS 18 and related interpretations.
3.6 LeasesLeases are classified as finance leases whenever the terms of the lease transfer substantially all the risks and rewards of ownership to the lessee. All other leases are classified as operating leases.
3.6.1 The Group as lessorRental income from operating leases is generally recognised on a straight-line basis over the term of the relevant lease. Initial direct costs incurred in negotiating and arranging an operating lease are added to the
NOTESforming part of the consolidated financial statements for the year ended March 31, 2019
Strides Pharma Science Limited
130
carrying amount of the leased asset and recognised on a straight-line basis over the lease term.
3.6.2 The Group as lesseeAssets held under finance leases are initially recognised as assets of the Group at their fair value at the inception of the lease or, if lower, at the present value of the minimum lease payments. The corresponding liability to the lessor is included in the consolidated balance sheet as a finance lease obligation.
Lease payments are apportioned between finance costs and reduction of the lease obligation so as to achieve a constant rate of interest on the remaining balance of the liability. Finance costs are recognised immediately in statement of profit and loss, unless they are directly attributable to qualifying assets, in which case they are capitalised in accordance with the Group's general policy on borrowing costs (see note 3.8 below). Contingent rentals are recognised as expenses in the periods in which they are incurred.
Rental expense from operating leases is generally recognised on a straight-line basis over the term of the relevant lease. Where the rentals are structured solely to increase in line with expected general inflation to compensate for the lessor’s expected inflationary cost increases, such increases are recognised in the year in which such benefits accrue. Contingent rentals arising under operating leases are recognised as an expense in the period in which they are incurred.
3.7 Foreign currencies transactions and translationIn preparing the financial statements of each individual group entity, transactions in currencies other than the entity’s functional currency (foreign currencies) are recognised at the rates of exchange prevailing at the dates of the transactions. At the end of each reporting period, monetary items denominated in foreign currencies are retranslated at the rates prevailing at that date. Non-monetary items carried at fair value that are denominated in foreign currencies are retranslated at the rates prevailing at the date when the fair value was determined. Non-monetary items that are measured in terms of historical cost in a foreign currency are not retranslated.
Exchange differences arising on settlement or translation of monetary items are recognised in statement of profit and loss in the period in which they arise except for:
- exchange differences which are regarded as an adjustment to interest costs on foreign currency borrowings that are directly attributable to the
acquisition or construction of qualifying assets, are capitalized as cost of assets, and
- exchange differences on monetary items receivable from or payable to a foreign operation for which settlement is neither planned nor likely to occur (therefore forming part of the net investment in the foreign operation), are recognised initially in other comprehensive income and reclassified from equity to statement of profit and loss on repayment of the monetary items. On the disposal of a foreign operation, the cumulative amount of the exchange differences relating to that foreign operation, recognised in other comprehensive income and accumulated in the separate component of equity, will be reclassified from equity to statement of profit and loss when the gain or loss on disposal is recognised.
For the purposes of presenting these consolidated financial statements, the assets and liabilities of the Group’s foreign operations are translated into Indian Rupees using exchange rates prevailing at the end of each reporting period. Income and expense items are translated at the average exchange rates for the period, unless exchange rates fluctuate significantly during that period, in which case the exchange rates at the dates of the transactions are used. Exchange differences arising, if any, are recognised in other comprehensive income and accumulated in equity (and attributed to non-controlling interests as appropriate).
On the disposal of a foreign operation (i.e. a disposal of the Group’s entire interest in a foreign operation, a disposal involving loss of control over a subsidiary that includes a foreign operation, or a partial disposal of an interest in a joint arrangement or an associate that includes a foreign operation of which the retained interest becomes a financial asset), all of the exchange differences accumulated in equity in respect of that operation attributable to the owners of the Company are reclassified to the statement of profit and loss.
In addition, in relation to a partial disposal of a subsidiary that includes a foreign operation that does not result in the Group losing control over the subsidiary, the proportionate share of accumulated exchange differences are re-attributed to non-controlling interests and are not recognised in statement of profit and loss. For all other partial disposals (i.e. partial disposals of associates or joint arrangements that do not result in the Group losing significant influence or joint control), the proportionate share of the accumulated exchange differences is reclassified to the statement of profit and loss.
NOTESforming part of the consolidated financial statements for the year ended March 31, 2019
Annual Report 2018-19
131Financial Statements | Consolidated
Goodwill and fair value adjustments to identifiable assets acquired and liabilities assumed through acquisition of a foreign operation are treated as assets and liabilities of the foreign operation and translated at the rate of exchange prevailing at the end of each reporting period. Exchange differences arising are recognised in other comprehensive income.
3.8 Borrowing costsBorrowing costs include:(i) interest expense calculated using the effective
interest rate method,
(ii) finance charges in respect of finance leases, and
(iii) exchange differences arising from foreign currency borrowings to the extent that they are regarded as an adjustment to interest costs.
Borrowing costs directly attributable to the acquisition, construction or production of qualifying assets, which are assets that necessarily take a substantial period of time to get ready for their intended use or sale, are added to the cost of those assets, until such time as the assets are substantially ready for their intended use or sale.
Interest income earned on the temporary investment of specific borrowings pending their expenditure on qualifying assets is deducted from the borrowing costs eligible for capitalisation.
All other borrowing costs are recognised in statement of profit and loss in the period in which they are incurred.
3.9 Employee benefits3.9.1 Short-term employee benefitsAll employee benefits falling due wholly within twelve months of rendering the services are classified as short-term employee benefits, which include benefits like salaries, wages, short-term compensated absences and performance incentives and are recognised as expenses in the period in which the employee renders the related service.
3.9.2 Post-employment benefitsPayments to defined contribution retirement benefit plans are recognised as an expense when employees have rendered service entitling them to the contributions.
For defined benefit retirement plans, the cost of providing benefits is determined using the projected unit credit method, with actuarial valuations being carried out at the end of each annual reporting period. Remeasurement, comprising actuarial gains and losses, the effect of the changes to the asset ceiling (if applicable) and the
return on plan assets (excluding net interest), is reflected immediately in the balance sheet with a charge or credit recognised in other comprehensive income in the period in which they occur. Remeasurement recognised in other comprehensive income is reflected immediately in retained earnings and is not reclassified to statement of profit and loss. Past service cost is recognised in statement of profit and loss in the period of a plan amendment. Net interest is calculated by applying the discount rate at the beginning of the period to the net defined benefit liability or asset.
The retirement benefit obligation recognised in the consolidated balance sheet represents the actual deficit or surplus in the Group’s defined benefit plans. Any surplus resulting from this calculation is limited to the present value of any economic benefits available in the form of refunds from the plans or reductions in future contributions to the plans.
A liability for a termination benefit is recognised at the earlier of when the entity can no longer withdraw the offer of the termination benefit and when the entity recognises any related restructuring costs.
3.9.3 Compensated absencesThe Group has a policy on compensated absences which are both accumulating and non-accumulating in nature. The expected cost of accumulating compensated absences is determined by actuarial valuation performed by an independent actuary at each balance sheet date using the projected unit credit method on the additional amount expected to be paid/availed as a result of the unused entitlement that has accumulated at the balance sheet date. Expense on non-accumulating compensated absences is recognised in the period in which the absences occur.
3.10 Share-based payment arrangements3.10.1 Share-based payment transactions of the
CompanyEquity-settled share-based payments to employees and others providing similar services are measured at the fair value of the equity instruments at the grant date.
The fair value determined at the grant date of the equity-settled share-based payments is expensed on a straight-line basis over the vesting period, based on the Group's estimate of equity instruments that will eventually vest, with a corresponding increase in equity. At the end of each reporting period, the Group revises its estimate of the number of equity instruments expected to vest. The impact of the revision of the original estimates, if any, is recognised in statement of profit and loss such that the cumulative expense reflects the
NOTESforming part of the consolidated financial statements for the year ended March 31, 2019
Strides Pharma Science Limited
132
revised estimate, with a corresponding adjustment to the equity-settled employee benefits reserve.
3.10.2 Share-based payment transactions of the acquiree in a business combination
When the share-based payment awards held by the employees of an acquiree (acquiree awards) are replaced by the Group's share-based payment awards (replacement awards), both the acquiree awards and the replacement awards are measured in accordance with Ind AS 102 ("market-based measure") at the acquisition date. The portion of the replacement awards that is included in measuring the consideration transferred in a business combination equals the market-based measure of the acquiree awards multiplied by the ratio of the portion of the vesting period completed to the greater of the total vesting period or the original vesting period of the acquiree award. The excess of the market-based measure of the replacement awards over the market-based measure of the acquiree awards included in measuring the consideration transferred is recognised as remuneration cost for post-combination service.
However, when the acquiree awards expire as a consequence of a business combination and the Group replaces those awards when it does not have an obligation to do so, the replacement awards are measured at their market-based measure in accordance with Ind AS 102. All of the market-based measure of the replacement awards is recognised as remuneration cost for post-combination service.
At the acquisition date, when the outstanding equity-settled share-based payment transactions held by the employees of an acquiree are not exchanged by the Group for its share-based payment transactions, the acquiree share-based payment transactions are measured at their market-based measure at the acquisition date. If the share-based payment transactions have vested by the acquisition date, they are included as part of the non-controlling interest in the acquiree. However, if the share-based payment transactions have not vested by the acquisition date, the market-based measure of the unvested share-based payment transactions is allocated to the non-controlling interest in the acquiree based on the ratio of the portion of the vesting period completed to the greater of the total vesting period or the original vesting period of the share-based payment transaction. The balance is recognised as remuneration cost for post-combination service.
3.11 TaxationIncome tax expense represents the sum of the current tax payable and deferred tax.
3.11.1 Current taxThe current tax payable is based on taxable profit for the year. Taxable profit differs from ‘profit before tax’ as reported in the consolidated statement of profit and loss because of items of income or expense that are taxable or deductible in other years and items that are never taxable or deductible. The Group’s current tax is calculated using tax rates that have been enacted or substantively enacted by the end of the reporting period.
3.11.2 Deferred taxDeferred tax is recognised on temporary differences between the carrying amounts of assets and liabilities in the consolidated financial statements and the corresponding tax bases used in the computation of taxable profit. Deferred tax liabilities are generally recognised for all taxable temporary differences. Deferred tax assets are generally recognised for all deductible temporary differences to the extent that it is probable that taxable profits will be available against which those deductible temporary differences can be utilised. Such deferred tax assets and liabilities are not recognised if the temporary difference arises from the initial recognition (other than in a business combination) of assets and liabilities in a transaction that affects neither the taxable profit nor the accounting profit. In addition, deferred tax liabilities are not recognised if the temporary difference arises from the initial recognition of goodwill.
Deferred tax liabilities are recognised for taxable temporary differences associated with investments in subsidiaries and associates, and interests in joint ventures, except where the Group is able to control the reversal of the temporary difference and it is probable that the temporary difference will not reverse in the foreseeable future. Deferred tax assets arising from deductible temporary differences associated with such investments and interests are only recognised to the extent that it is probable that there will be sufficient taxable profits against which to utilise the benefits of the temporary differences can be utilised and they are expected to reverse in the foreseeable future.
The carrying amount of deferred tax assets is reviewed at the end of each reporting period and reduced to the extent that it is no longer probable that sufficient taxable profits will be available to allow all or part of the asset to be recovered.
Deferred tax liabilities and assets are measured at the tax rates that are expected to apply in the period in which the liability is settled or the asset realised, based on tax rates (and tax laws) that have been enacted or substantively enacted by the end of the reporting period.
NOTESforming part of the consolidated financial statements for the year ended March 31, 2019
Annual Report 2018-19
133Financial Statements | Consolidated
The measurement of deferred tax liabilities and assets reflects the tax consequences that would follow from the manner in which the Group expects, at the end of the reporting period, to recover or settle the carrying amount of its assets and liabilities.
Deferred tax assets include Minimum Alternate Tax (MAT) paid in accordance with the tax laws in India, which is likely to give future economic benefits in the form of availability of set-off against future tax liability. Accordingly, MAT is recognised as deferred tax asset in the Balance sheet when the asset can be measured reliably and it is probable that the future economic benefit associated with the asset will be realised.
Current and deferred tax are recognised in statement of profit and loss, except when they relate to items that are recognised in other comprehensive income or directly in equity, in which case, the current and deferred tax are also recognised in other comprehensive income or directly in equity respectively. Where current tax or deferred tax arises from the initial accounting for a business combination, the tax effect is included in the accounting for the business combination.
3.11.2.1 Deferred Tax on Undistributed EarningsWhen only a portion of undistributed earnings is remitted to the parent entity by its subsidiary, the parent recognises a deferred tax liability only for the portion of the undistributed earnings expected to be remitted in the foreseeable future.
3.11.2.2 Deferred Tax on Unrealised ProfitsThe intragroup elimination is made as a consolidation adjustment and not in the financial statements of any individual reporting entity. Therefore, the elimination will result in the creation of a temporary difference, as far as the group is concerned, between the carrying amount of the inventories in the consolidated financial statements and the tax base (assumed to be the carrying amount in the purchaser’s individual financial statements). The deferred tax effects arising in respect of this temporary difference is recognised. The tax rate used while recognising the deferred tax balance arising from the elimination of unrealised profits on intragroup transactions is determined by reference to the tax rate in the purchaser’s jurisdiction where the temporary difference will reverse.
3.12 Property, plant and equipmentProperty, plant and equipment held for use in the production or supply of goods or services, or for administrative purposes, are stated in the consolidated balance sheet at cost less accumulated depreciation and accumulated impairment losses.
Properties in the course of construction for production, supply or administrative purposes are carried at cost, less any impairment loss. Cost includes professional fees and, for qualifying assets, borrowing costs capitalised in accordance with the Group’s accounting policy. Such properties are classified to the appropriate categories of property, plant and equipment when completed and ready for intended use. Subsequent expenditure is capitalised only if it is probable that the future economic benefits associated with the expenditure will flow to the group. Depreciation of these assets, on the same basis as other property assets, commences when the assets are ready for their intended use.
The non refundable payments made with respect to Land taken on finance lease (where there is an option to purchase the same at the end of the lease period) is classified under Property, plant and Equipment as "Lease hold Land".
Depreciation is recognised so as to write off the cost of assets (other than freehold land and properties under construction) less their residual values over their useful lives, using the straight-line method. The estimated useful lives, residual values and depreciation method are reviewed at the end of each reporting period, with the effect of any changes in estimate accounted for on a prospective basis.
Assets held under finance leases are depreciated over their expected useful lives on the same basis as owned assets. However, when there is no reasonable certainty that ownership will be obtained by the end of the lease term, assets are depreciated over the shorter of the lease term and their useful lives.
Depreciation on tangible fixed assets has been provided on the straight-line method as per the useful life prescribed in Schedule II to the Companies Act, 2013 except in respect of the following categories of assets, in whose case the life of the assets has been assessed to be different and are as under based on technical advice, taking into account the nature of the asset, the estimated usage of the asset, the operating conditions of the asset, past history of replacement, anticipated technological changes, manufacturers warranties and maintenance support, etc.:
Dies and punches : 4 years
Mobile phones : 3 years
Certain factory buildings : 18 years
Freehold land is not depreciated.
NOTESforming part of the consolidated financial statements for the year ended March 31, 2019
Strides Pharma Science Limited
134
Depreciation on the tangible fixed assets of the Group's foreign subsidiaries has been provided on straight-line method as per the estimated useful life of such assets as follows:
Building : 20 years to 30 years
General plant and machinery : 5 years to 20 years
Furniture and fixtures : 5 years to 16 years
Office equipment : 5 years to 6 years
Motor vehicles : 8 years
Computers and data processing equipment : 3 years to 6 years
Freehold land is not depreciated.
Assets held under finance leases are depreciated over their expected useful lives on the same basis as owned assets. However, when there is no reasonable certainty that ownership will be obtained by the end of the lease term, assets are depreciated over the shorter of the lease term and their useful lives.
Individual assets costing less than ̀ 5,000 are depreciated in full in the year of purchase.
An item of property, plant and equipment is derecognised upon disposal or when no future economic benefits are expected to arise from the continued use of the asset. Any gain or loss arising on the disposal or retirement of an item of property, plant and equipment is determined as the difference between the sales proceeds and the carrying amount of the asset and is recognised in statement of profit and loss.
When an item of property, plant and equipment is acquired in exchange for a non-monetary asset or assets, or a combination of monetary and non-monetary assets, the cost of that item is measured at fair value (even if the entity cannot immediately derecognise the asset given up) unless the exchange transaction lacks commercial substance or the fair value of neither the asset received nor the asset given up is reliably measurable. If the acquired item is not measured at fair value, its cost is measured at the carrying amount of the asset given up.
3.13 Investment propertyProperties that is held for long-term rentals or for capital appreciation or both, and that is not occupied by the Group, is classified as investment property. Investment property is measured initially at its cost, including related transaction costs and where applicable borrowing costs. Subsequent expenditure is capitalised to the asset's carrying amount only when
it is probable that future economic benefits associated with the expenditure will flow to the group and the cost of the item can be measured reliably. All other repairs and maintenance costs are expensed when incurred. When part of the investment property is replaced, the carrying amount of the replaced part is derecognised.
Investment properties are depreciated using the straight line method over their estimated useful lives. Investment properties generally have a useful life of 25-40 years. The useful life has been determined based on technical evaluation performed by the management's expert.
3.14 Intangible assets3.14.1 Intangible assets acquired separatelyIntangible assets with finite useful lives that are acquired separately are carried at cost less accumulated amortisation and accumulated impairment losses. Amortisation is recognised on a straight-line basis over their estimated useful lives. The estimated useful life and amortisation method is reviewed at the end of each reporting period, with the effect of any changes in estimate being accounted for on a prospective basis. Intangible assets with indefinite useful lives that are acquired separately are carried at cost less accumulated impairment losses.
3.14.2 Internally-generated intangible assets - research and development expenditure
Expenditure on research activities is recognised as an expense in the period in which it is incurred.
An internally-generated intangible asset arising from development (or from the development phase of an internal project) is recognised if, and only if, all of the following have been demonstrated:
• the technical feasibility of completing the intangible asset so that it will be available for use or sale;
• the intention to complete the intangible asset and use or sell it;
• the ability to use or sell the intangible asset;
• how the intangible asset will generate probable future economic benefits;
• the availability of adequate technical, financial and other resources to complete the development and to use or sell the intangible asset; and
• the ability to measure reliably the expenditure attributable to the intangible asset during its development.
NOTESforming part of the consolidated financial statements for the year ended March 31, 2019
Annual Report 2018-19
135Financial Statements | Consolidated
The amount initially recognised for internally-generated intangible assets is the sum of the expenditure incurred from the date when the intangible asset first meets the recognition criteria listed above. Where no internally-generated intangible asset can be recognised, development expenditure is recognised in statement profit and loss in the period in which it is incurred.
Subsequent to initial recognition, internally-generated intangible assets are reported at cost less accumulated amortisation and accumulated impairment losses, on the same basis as intangible assets that are acquired separately.
3.14.3 Intangible assets acquired in a business combination
Intangible assets acquired in a business combination and recognised separately from goodwill are initially recognised at their fair value at the acquisition date (which is regarded as their cost).
Subsequent to initial recognition, intangible assets acquired in a business combination are reported at cost less accumulated amortisation and accumulated impairment losses, on the same basis as intangible assets that are acquired separately.
3.14.4 Derecognition of intangible assetsAn intangible asset is derecognised on disposal, or when no future economic benefits are expected from use or disposal. Gains or losses arising from derecognition of an intangible asset, measured as the difference between the net disposal proceeds and the carrying amount of the asset, are recognised in statement of profit and loss when the asset is derecognised.
3.14.5 Useful lives of intangible assetsIntangible assets are amortised over their estimated useful life on straight line method as follows:
Registration and Brands : 10 years to 25 years
Software Licenses : 5 years
Customer/supply contracts are amortised over the period of the contract or useful life, whichever is less.
3.15 Impairment of assets3.15.1 Impairment of financial assets:The Group assesses at each date of balance sheet, whether a financial asset or a group of financial assets is impaired. Ind AS 109 requires expected credit losses to be measured though a loss allowance. The Group recognises lifetime expected losses for all contract assets and / or all trade receivables that do not constitute a financing transaction. For all other financial assets, expected
credit losses are measured at an amount equal to the twelve-month expected credit losses or at an amount equal to the life time expected credit losses if the credit risk on the financial asset has increased significantly, since initial recognition.
3.15.2 Impairment of goodwill and investments in associates and joint ventures: Refer notes 3.2 and 3.3.
3.15.3 Impairment of non-financial assets other than goodwill
At the end of each reporting period, the Group reviews the carrying amounts of its tangible and intangible assets to determine whether there is any indication that those assets have suffered an impairment loss. If any such indication exists, the recoverable amount of the asset is estimated in order to determine the extent of the impairment loss (if any). When it is not possible to estimate the recoverable amount of an individual asset, the Group estimates the recoverable amount of the cash-generating unit to which the asset belongs. When a reasonable and consistent basis of allocation can be identified, corporate assets are also allocated to individual cash-generating units, or otherwise they are allocated to the smallest group of cash-generating units for which a reasonable and consistent allocation basis can be identified.
Intangible assets with indefinite useful lives and intangible assets not yet available for use are tested for impairment at least annually, and whenever there is an indication that the asset may be impaired.
Recoverable amount is the higher of fair value less costs of disposal and value in use. In assessing value in use, the estimated future cash flows are discounted to their present value using a pre-tax discount rate that reflects current market assessments of the time value of money and the risks specific to the asset for which the estimates of future cash flows have not been adjusted.
If the recoverable amount of an asset (or cash-generating unit) is estimated to be less than its carrying amount, the carrying amount of the asset (or cash-generating unit) is reduced to its recoverable amount. An impairment loss is recognised immediately in statement of profit and loss.
When an impairment loss subsequently reverses, the carrying amount of the asset (or a cash-generating unit) is increased to the revised estimate of its recoverable amount, but so that the increased carrying amount does not exceed the carrying amount that would have been determined had no impairment loss been recognised for the asset (or cash-generating unit) in prior years.

NOTESforming part of the consolidated financial statements for the year ended March 31, 2019
Strides Pharma Science Limited
136
A reversal of an impairment loss is recognised immediately in statement of profit and loss.
3.16 InventoriesInventories are valued at the lower of cost and the net realisable value after providing for obsolescence and other losses, where considered necessary. Cost includes all charges in bringing the goods to the point of sale, including octroi and other levies, transit insurance and receiving charges. Work-in-progress and finished goods include appropriate proportion of overheads. Cost is determined as follows:
Raw materials, packing materials, stores and spares: weighted average basis
Work-in progress: at material cost and an appropriate share of production overheads
Finished goods: material cost and an appropriate share of production overheads, wherever applicable
Stock-in trade: weighted average basis
Net realisable value is the estimated selling price in the ordinary course of business, less the estimated costs of completion and selling expenses. The net realisable value of work-in-progress is determined with reference to the selling prices of related finished products.
3.17 ProvisionsProvisions are recognised when the Group has a present obligation (legal or constructive) as a result of a past event, it is probable that the Group will be required to settle the obligation, and a reliable estimate can be made of the amount of the obligation.
The amount recognised as a provision is the best estimate of the consideration required to settle the present obligation at the end of the reporting period, taking into account the risks and uncertainties surrounding the obligation. When a provision is measured using the cash flows estimated to settle the present obligation, its carrying amount is the present value of those cash flows (when the effect of the time value of money is material).
When some or all of the economic benefits required to settle a provision are expected to be recovered from a third party, a receivable is recognised as an asset if it is virtually certain that reimbursement will be received and the amount of the receivable can be measured reliably.
3.17.1 Onerous contractsPresent obligations arising under onerous contracts are recognised and measured as provisions. An onerous
contract is considered to exist where the Group has a contract under which the unavoidable costs of meeting the obligations under the contract exceed the economic benefits expected to be received from the contract.
3.17.2 Contingent liabilitiesContingent liabilities are disclosed in notes when there is a possible obligation that arises from past events and whose existence will be confirmed only by the occurrence or non-occurrence of one or more uncertain future events not wholly within the control of the entity.
3.18 Financial instruments3.18.1 Financial assets and financial liabilitiesFinancial assets and financial liabilities are recognised when a group entity becomes a party to the contractual provisions of the instruments.
Initial recognition and measurement:Financial assets and financial liabilities are initially measured at fair value. Transaction costs that are directly attributable to the acquisition or issue of financial assets and financial liabilities (other than financial assets and financial liabilities at fair value through profit or loss) are added to or deducted from the fair value of the financial assets or financial liabilities, as appropriate, on initial recognition. Transaction costs directly attributable to the acquisition of financial assets or financial liabilities at fair value through profit or loss are recognised immediately in statement of profit and loss.
Subsequent measurement:Financial assets at amortised costFinancial assets are subsequently measured at amortised cost if these financial assets are held within a business whose objective is to hold these assets in order to collect contractual cash flows and contractual terms of financial asset give rise on specified dates to cash flows that are solely payments of principal and interest on the principal amount outstanding.
Financial assets at fair value through other comprehensive incomeFinancial assets are measured at fair value through other comprehensive income if these financial assets are held within business whose objective is achieved by both collecting contractual cash flows on specified dates that are solely payments of principal and interest on the principal amount outstanding and selling financial assets.
The Group has made an irrevocable election to present in other comprehensive income subsequent changes in the fair value of equity instruments in Outlook
NOTESforming part of the consolidated financial statements for the year ended March 31, 2019
Annual Report 2018-19
137Financial Statements | Consolidated
Therauputics Inc. (formerly Oncobiologics Inc.) which is not held for trading.
Financial assets at fair value through profit or lossFinancial assets are measured at fair value through profit or loss unless it measured at amortised cost or fair value through other comprehensive income on initial recognition. The transaction cost directly attributable to the acquisition of financial assets and liabilities at fair value through profit or loss are immediately recognised in the statement of profit and loss.
Financial liabilitiesFinancial liabilities are measured at amortised cost using effective interest method. For trade and other payables maturing within one year from the balance sheet date, the carrying amounts approximate fair value due to the short maturity of these instruments.
3.18.2 Equity instrumentsAn equity instrument is a contract that evidences residual interest in the assets of the company after deducting all of its liabilities. Equity instruments recognised by the Group are recognised at the proceeds received net off direct issue cost.
3.18.3 Derivative financial instruments and hedge accounting
The Group uses various derivative financial instruments such as interest rate swaps, currency swaps and forward contracts to mitigate the risk of changes in interest rates and foreign exchange rates. Such derivative financial instruments are initially recognised at fair value on the date on which a derivative contract is entered into and are also subsequently measured at fair value. Derivatives are carried as financial assets when the fair value is positive and as financial liabilities when the fair value is negative.
Any gains or losses arising from changes in the fair value of derivatives are taken directly to the statement of profit and loss, except for the effective portion of cash flow hedges which is recognised in Other Comprehensive Income and later to the statement of profit and loss when the hedged item affects profit or loss or treated as basis adjustment if a hedged forecast transaction subsequently results in the recognition of a non-financial assets or non-financial liability.
Hedges that meet the criteria for hedge accounting are accounted for as follows:
a) Cash flow hedgeThe Group designates derivative contracts or non derivative financial assets / liabilities as hedging instruments to mitigate the risk of movement in
interest rates and foreign exchange rates for foreign exchange exposure on highly probable future cash flows attributable to a recognised asset or liability or forecast cash transactions. When a derivative is designated as a cash flow hedging instrument, the effective portion of changes in the fair value of the derivative is recognized in the cash flow hedging reserve being part of other comprehensive income. Any ineffective portion of changes in the fair value of the derivative is recognized immediately in the statement of profit and loss. If the hedging relationship no longer meets the criteria for hedge accounting, then hedge accounting is discontinued prospectively. If the hedging instrument expires or is sold, terminated or exercised, the cumulative gain or loss on the hedging instrument recognized in cash flow hedging reserve till the period the hedge was effective remains in cash flow hedging reserve until the underlying transaction occurs. The cumulative gain or loss previously recognized in the cash flow hedging reserve is transferred to the statement of profit and loss upon the occurrence of the underlying transaction. If the forecasted transaction is no longer expected to occur, then the amount accumulated in cash flow hedging reserve is reclassified in the statement of profit and loss.
b) Fair value hedgeThe Group designates derivative contracts or non derivative financial assets / liabilities as hedging instruments to mitigate the risk of change in fair value of hedged item due to movement in interest rates, foreign exchange rates and commodity prices.
Changes in the fair value of hedging instruments and hedged items that are designated and qualify as fair value hedges are recorded in the statement of profit and loss. If the hedging relationship no longer meets the criteria for hedge accounting, the adjustment to the carrying amount of a hedged item for which the effective interest method is used is amortised to statement of profit and loss over the period of maturity.
3.18.4 Hedges of net investments in foreign operationsHedges of net investments in foreign operations are accounted for similarly to cash flow hedges. Any gain or loss on the hedging instrument relating to the effective portion of the hedge is recognised in other comprehensive income and accumulated under the heading of foreign currency translation reserve. The gain or loss relating to the ineffective portion is recognised immediately in statement of profit and loss, and is included in the 'Other income' line item.
Gains and losses on the hedging instrument relating to the effective portion of the hedge accumulated in the foreign currency translation reserve are reclassified to statement of profit and loss on the disposal of the foreign operation.
NOTESforming part of the consolidated financial statements for the year ended March 31, 2019
Strides Pharma Science Limited
138
3.18.5 Written put options issued to the non-controlling interests:
The Group has issued written put option to non-controlling interests in certain subsidiaries of the Group in accordance with the terms of underlying agreement with such option holders. Should the option be exercised, the Group has to settle such liability by payment of cash.
Accounting on initial recognition:The amount that may become payable under the option on exercise is recognised as a financial liability at its present value with a corresponding charge directly to the shareholders’ equity.
Subsequent measurement:The liability is subsequently accreted through finance charges recognised under exceptional items in the statement of profit and loss upto the redemption amount that is payable at the date on which the option first becomes exercisable. In the event that the option expires unexercised, the liability is derecognised with a corresponding adjustment to equity.
3.19 Exceptional itemsWhen an item of income or expense within profit or loss from ordinary activity is of such size, nature or incidence that their disclosure is relevant to explain the performance of the Group for the year, the nature and amount of such items are disclosed as exceptional items.
3.20 Cash and cash equivalentsCash and cash equivalents consist of cash on hand and cash at banks, demand deposits and short-term deposits with an original maturity of three months or less, highly liquid investments that are readily convertible into known amounts of cash and which are subject to insignificant risk of changes in value. Bank overdrafts that are repayable on demand and form an integral part of our cash management are included as a component of cash and cash equivalents for the purpose of the statement of cash flows.
3.21 Earnings per shareBasic Earnings Per Share ('EPS') is computed by dividing the net profit attributable to the equity shareholders by the weighted average number of equity shares outstanding during the year. Diluted earnings per share is computed by dividing the net profit by the weighted average number of equity shares considered for deriving basic earnings per share and also the weighted average number of equity shares that could have been issued upon conversion of all dilutive potential equity shares. Dilutive potential equity shares are deemed converted as of the beginning of the year, unless issued at a later date. In computing diluted earnings per share, only potential equity shares that are dilutive and that either
reduces earnings per share or increases loss per share are included. The number of shares and potentially dilutive equity shares are adjusted retrospectively for all periods presented in case of share splits.
3.22 Operating segmentsAn operating segment is a component of the Group that engages in business activities from which it may earn revenues and incur expenses, including revenues and expenses that relate to transactions with any of the Group’s other components, and for which discrete financial information is available. Operating segments are reported in a manner consistent with the internal reporting provided to the chief operating decision maker. The Chairperson and Managing Director of the Company is responsible for allocating resources and assessing performance of the operating segments and accordingly is identified as the Chief Operating Decision Maker (CODM). All operating segments’ operating results are reviewed regularly by the CODM to make decisions about resources to be allocated to the segments and assess their performance.
3.23 Standards / amendments not yet effectiveInd AS 116- LeasesIn March 2019, the Ministry of Corporate Affairs issued the Companies (Indian Accounting Standards) Amendment Rules, 2019, notifying Ind AS 116 ‘Leases’ (New lease Standard), which replaces Ind AS 17 ‘Leases’, including appendices thereto. Ind AS 116 is effective for annual periods beginning on or after April 01, 2019. Ind AS 116 sets out the principles for the recognition, measurement, presentation and disclosure of leases and requires lessees to account for all leases under a single on-balance sheet model similar to the accounting for finance leases under Ind AS 17. The standard includes two recognition exemptions for lessees – leases of ‘low-value’ assets (e.g., personal computers) and short-term leases (i.e., leases with a lease term of 12 months or less). At the commencement date of a lease, a lessee will recognise a liability to make lease payments (i.e., the lease liability) and an asset representing the right to use the underlying asset during the lease term (i.e., the right-of-use asset). Lessees will be required to separately recognise the interest expense on the lease liability and the depreciation expense on the right-of-use asset.
Lessees will be also required to remeasure the lease liability upon the occurrence of certain events (e.g., a change in the lease term, a change in future lease payments resulting from a change in an index or rate used to determine those payments). The lessee will generally recognise the amount of the remeasurement of the lease liability as an adjustment to the right-of-use asset.
Lessor accounting under Ind AS 116 is substantially unchanged from existing accounting under Ind AS
NOTESforming part of the consolidated financial statements for the year ended March 31, 2019
Annual Report 2018-19
139Financial Statements | Consolidated
17. Lessors will continue to classify all leases using the same classification principle as in Ind AS 17 and distinguish between two types of leases: operating and finance leases.
The Group intends to adopt these standards, if applicable, when they become effective. The Group is in the process of evaluating the potential impact of the adoption of Ind AS 116 on accounting policies followed in its financial statements. The quantitative impact of adoption of Ind AS 116 on the financial statements in the period of initial application is not reasonably estimable as at present.
Ind AS 12 Appendix C, Uncertainty over Income Tax TreatmentsOn March 30, 2019, the Ministry of Corporate Affairs has notified Ind AS 12 Appendix C, Uncertainty over Income Tax treatments which is to be applied while performing the determination of taxable profit (or loss), tax bases, unused tax credits and tax rates, when there is uncertainty over Income Tax treatments under Ind AS 12. According to the appendix, companies need to determine the probability of the relevant tax authority accepting each tax treatments, or group of tax treatments, that the companies have used or plan to use in their income tax filing which has to be considered to compute the most likely amount or the expected value of the tax treatment when determining taxable profit (or loss), tax base, unused tax losses, unused tax credits and tax rates.
The standard permits two possible method of transition – i) Full retrospective approach- Under this approach, Appendix C will be applied retrospectively to each reporting period presented in accordance with Ind AS 8 – Accounting policies, Changes in Accounting Estimates and Errors, without using hindsight and ii) Retrospectively with cumulative effect of initially applying Appendix C recognised by adjusting equity on initial application, without adjusting comparatives.
The effective date for adoption of Ind AS 12 Appendix C is annual period beginning on or after April 01, 2019. The Group will adopt the standard on April 01, 2019 and has decided to adjust the cumulative effect in equity on initial application i.e. April 01, 2019 without adjusting comparatives.
The effect of adoption of Ind AS 12 Appendix C would be insignificant in the consolidated financial statements.
Amendments to Ind AS 12- Income taxesOn March 30, 2019 , the Ministry of Corporate Affairs issued amendments to the guidance in Ind AS 12,
‘Income Taxes’, in connection with accounting for dividend distribution taxes.
The amendment clarified that an entity shall recognise the income tax consequences of dividend in profit or loss, other comprehensive income or equity according to where the entity originally recognised those past transactions or events.
Effective date for application of this amendment is annual period beginning on or after April 01, 2019. The Group is currently evaluating the effect of this amendment on the consolidated financial statements.
Amendment to Ind AS 19- plan amendment, curtailment or settlementOn March 30, 2019, Ministry of Corporate Affairs issued amendments to Ind AS 19, ‘Employee benefits’, in connection with accounting for plan amendments, curtailments and settlements.
The amendment require an entity:— To use updated assumptions to determine current
service cost and net interest for the remainder of the period after a plan amendment, curtailment or settlement; and
— To recognise in profit or loss as part of past of service cost, or a gain or loss on settlement, any reduction in a surplus, even if that surplus was not previously recognised because of the impact of the asset ceiling.
Effective date for application of this amendment is annual period beginning on or after April 01, 2019. The Group does not expect any impact from this amendment.
Ind AS 109 – Prepayment Features with Negative CompensationThe amendments relate to the existing requirements in Ind AS 109 regarding termination rights in order to allow measurement at amortised cost (or, depending on the business model, at fair value through other comprehensive income) even in the case of negative compensation payments. The Group does not expect any impact from this amendment.
Ind AS 23 – Borrowing CostsThe amendments clarify that if any specific borrowing remains outstanding after the related asset is ready for its intended use or sale, that borrowing becomes part of the funds that an entity borrows generally when calculating the capitalisation rate on general borrowings. The Group does not expect any impact from this amendment.
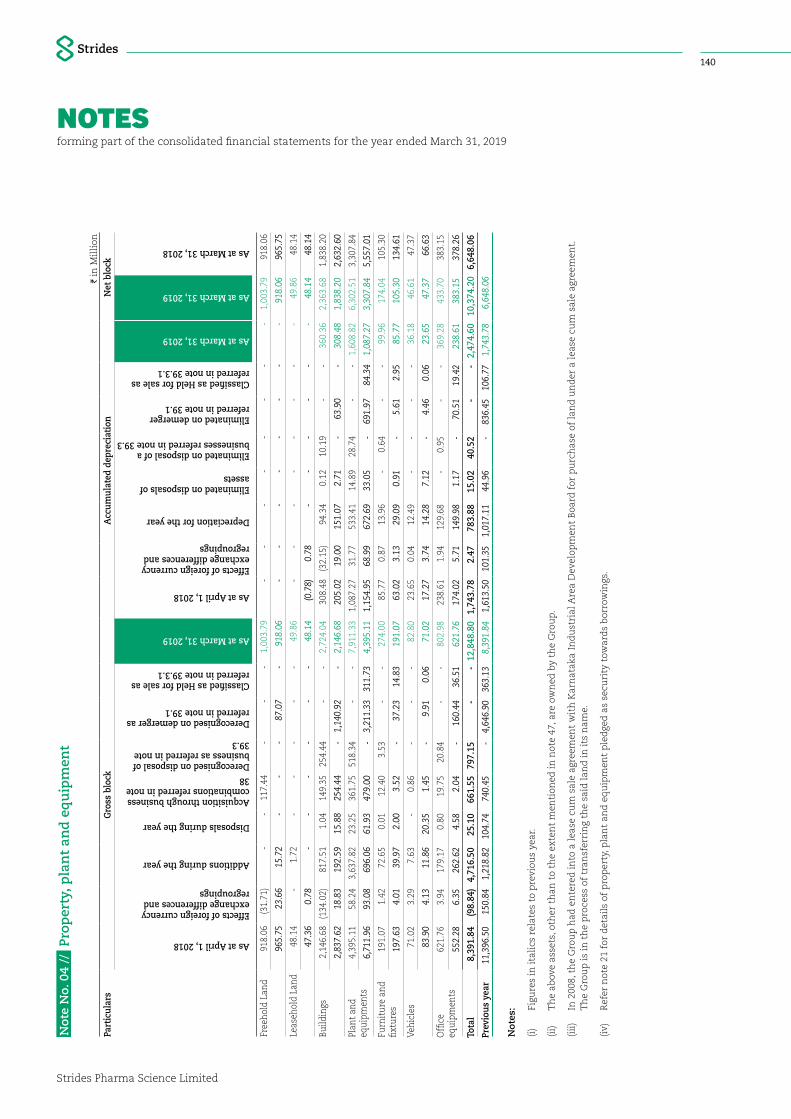
NOTESforming part of the consolidated financial statements for the year ended March 31, 2019
Strides Pharma Science Limited
140N
ote
No.
04
// P
rop
erty
, pla
nt
and
eq
uip
men
t
I in
Mil
lion
Part
icul
ars
Gro
ss b
lock
Acc
umul
ated
dep
reci
atio
nN
et b
lock
As at April 1, 2018
Effects of foreign currency exchange differences and regroupings
Additions during the year
Disposals during the year
Acquisition through business combinations referred in note 38
Derecognised on disposal of business as referred in note 39.3
Derecognised on demerger as referred in note 39.1
Classified as Held for sale as referred in note 39.3.1
As at March 31, 2019
As at April 1, 2018
Effects of foreign currency exchange differences and regroupings
Depreciation for the year
Eliminated on disposals of assets
Eliminated on disposal of a businesses referred in note 39.3
Eliminated on demerger referred in note 39.1
Classified as Held for sale as referred in note 39.3.1
As at March 31, 2019
As at March 31, 2019
As at March 31, 2018
Free
hold
Lan
d 9
18.0
6 (3
1.71
) -
-
1
17.4
4 -
-
-
1,0
03.7
9 -
-
-
-
-
-
-
-
1,00
3.79
918.
06
965
.75
23.
66
15.
72
- -
- 8
7.07
-
918
.06
- -
- -
- -
- -
918
.06
965
.75
Leas
ehol
d La
nd
48.
14
-
1.7
2 -
-
-
-
-
4
9.86
-
-
-
-
-
-
-
-
4
9.86
4
8.14
47.
36
0.7
8 -
- -
- -
- 4
8.14
(0
.78)
0.7
8 -
- -
- -
- 4
8.14
4
8.14
Build
ings
2
,146
.68
(134
.02)
817
.51
1.0
4 1
49.3
5 2
54.4
4 -
-
2
,724
.04
308
.48
(32.
15)
94.
34
0.1
2 1
0.19
-
-
3
60.3
6 2
,363
.68
1,8
38.2
0
2,8
37.6
2 1
8.83
1
92.5
9 1
5.88
2
54.4
4 -
1,1
40.9
2 -
2,1
46.6
8 2
05.0
2 1
9.00
1
51.0
7 2
.71
- 6
3.90
-
308
.48
1,8
38.2
0 2
,632
.60
Plan
t an
d eq
uipm
ents
4
,395
.11
58.
24
3,6
37.8
2 2
3.25
3
61.7
5 5
18.3
4 -
-
7
,911
.33
1,0
87.2
7 3
1.77
5
33.4
1 1
4.89
2
8.74
-
-
1
,608
.82
6,3
02.5
1 3
,307
.84
6,7
11.9
6 9
3.08
6
96.0
6 6
1.93
4
79.0
0 -
3,2
11.3
3 3
11.7
3 4
,395
.11
1,1
54.9
5 6
8.99
6
72.6
9 3
3.05
-
691
.97
84.
34
1,0
87.2
7 3
,307
.84
5,5
57.0
1
Furn
itur
e an
d fix
ture
s 1
91.0
7 1
.42
72.
65
0.0
1 1
2.40
3
.53
-
-
274
.00
85.
77
0.8
7 1
3.96
-
0
.64
-
-
99.
96
174
.04
105
.30
197
.63
4.0
1 3
9.97
2
.00
3.5
2 -
37.
23
14.
83
191
.07
63.
02
3.1
3 2
9.09
0
.91
- 5
.61
2.9
5 8
5.77
1
05.3
0 1
34.6
1
Vehi
cles
7
1.02
3
.29
7.6
3 -
0
.86
-
-
-
82.
80
23.
65
0.0
4 1
2.49
-
-
-
-
3
6.18
4
6.61
4
7.37
83.
90
4.1
3 1
1.86
2
0.35
1
.45
- 9
.91
0.0
6 7
1.02
1
7.27
3
.74
14.
28
7.1
2 -
4.4
6 0
.06
23.
65
47.
37
66.6
3
Offi
ce
equi
pmen
ts 6
21.7
6 3
.94
179
.17
0.8
0 1
9.75
2
0.84
-
-
8
02.9
8 2
38.6
1 1
.94
129
.68
-
0.9
5 -
-
3
69.2
8 43
3.70
383
.15
552
.28
6.3
5 2
62.6
2 4
.58
2.0
4 -
160
.44
36.
51
621
.76
174
.02
5.7
1 1
49.9
8 1
.17
- 7
0.51
1
9.42
2
38.6
1 3
83.1
5 3
78.2
6
Tota
l 8
,391
.84
(98.
84)
4,7
16.5
0 2
5.10
6
61.5
5 7
97.1
5 -
-
12,
848.
80
1,74
3.78
2
.47
783
.88
15.
02
40.
52
-
-
2,47
4.60
10
,374
.20
6,6
48.0
6
Prev
ious
yea
r 1
1,39
6.50
1
50.8
4 1
,218
.82
104
.74
740
.45
- 4
,646
.90
363
.13
8,3
91.8
4 1
,613
.50
101
.35
1,0
17.1
1 4
4.96
-
836
.45
106
.77
1,7
43.7
8 6
,648
.06
Not
es:
(i)
Fi
gure
s in
ital
ics
rela
tes
to p
revi
ous
year
.
(ii)
T
he
abov
e as
sets
, oth
er t
han
to
the
exte
nt
men
tion
ed in
not
e 47
, are
ow
ned
by
the
Gro
up.
(iii
)
In 2
008,
th
e G
rou
p h
ad e
nte
red
into
a l
ease
cu
m s
ale
agre
emen
t w
ith
Kar
nat
aka
Ind
ust
rial
Are
a D
evel
opm
ent
Boa
rd f
or p
urc
has
e of
lan
d u
nd
er a
lea
se c
um
sal
e ag
reem
ent.
T
he
Gro
up
is in
th
e p
roce
ss o
f tr
ansf
erri
ng
the
said
lan
d in
its
nam
e.
(iv)
R
efer
not
e 21
for
det
ails
of
pro
per
ty, p
lan
t an
d e
qu
ipm
ent
ple
dge
d a
s se
curi
ty t
owar
ds
bor
row
ings
.
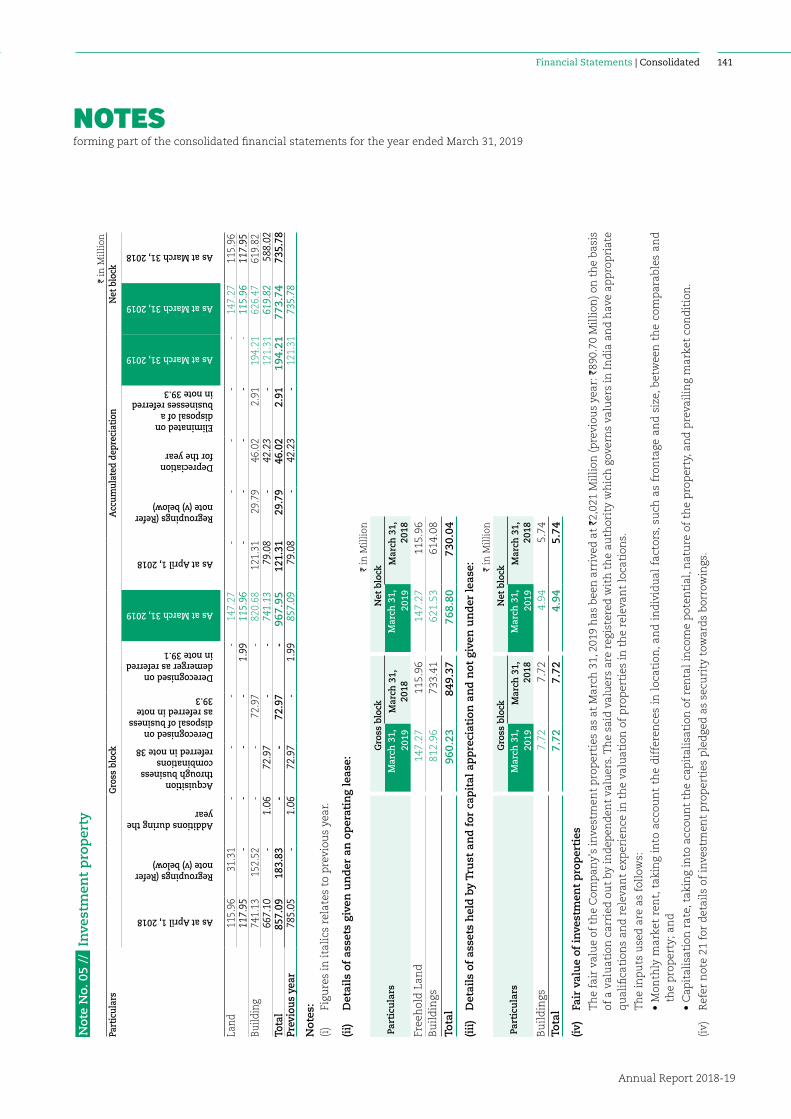
NOTESforming part of the consolidated financial statements for the year ended March 31, 2019
Annual Report 2018-19
141Financial Statements | Consolidated
Not
e N
o. 0
5 //
In
vest
men
t p
rop
erty
I in
Mil
lion
Part
icul
ars
Gro
ss b
lock
Acc
umul
ated
dep
reci
atio
nN
et b
lock
As at April 1, 2018
Regroupings (Refer note (v) below)
Additions during the year
Acquisition through business combinations referred in note 38
Derecognised on disposal of business as referred in note 39.3
Derecognised on demerger as referred in note 39.1
As at March 31, 2019
As at April 1, 2018
Regroupings (Refer note (v) below)
Depreciation for the year
Eliminated on disposal of a businesses referred in note 39.3
As at March 31, 2019
As at March 31, 2019
As at March 31, 2018
Land
115
.96
31.
31
-
-
-
-
147
.27
-
-
-
-
-
147
.27
115
.96
117
.95
- -
- -
1.9
9 1
15.9
6 -
- -
- -
1
15.9
6 1
17.9
5 Bu
ildin
g 7
41.1
3 1
52.5
2 -
-
7
2.97
-
8
20.6
8 1
21.3
1 2
9.79
4
6.02
2
.91
194
.21
626
.47
619
.82
667
.10
- 1
.06
72.
97
- -
741
.13
79.
08
- 4
2.23
-
121
.31
619
.82
588
.02
Tota
l 8
57.0
9 1
83.8
3 -
-
7
2.97
-
9
67.9
5 1
21.3
1 2
9.79
4
6.02
2
.91
194
.21
773
.74
735
.78
Prev
ious
yea
r 7
85.0
5 -
1.0
6 7
2.97
-
1.9
9 8
57.0
9 7
9.08
-
42.
23
- 1
21.3
1 7
35.7
8
Not
es:
(i)
Fi
gure
s in
ital
ics
rela
tes
to p
revi
ous
year
.
(ii)
D
etai
ls o
f as
sets
giv
en u
nd
er a
n o
per
atin
g le
ase:
I in
Mil
lion
Part
icu
lars
Gro
ss b
lock
Net
blo
ckM
arch
31,
20
19M
arch
31,
20
18M
arch
31,
20
19M
arch
31,
20
18
Free
hol
d L
and
147
.27
115
.96
147
.27
115
.96
Bu
ild
ings
812
.96
733
.41
621
.53
614
.08
Tota
l 9
60.2
3 8
49.3
7 7
68.8
0 7
30.0
4
(iii
) D
etai
ls o
f as
sets
hel
d b
y Tr
ust
an
d f
or c
apit
al a
pp
reci
atio
n a
nd
not
giv
en u
nd
er l
ease
:
I in
Mil
lion
Part
icu
lars
Gro
ss b
lock
Net
blo
ckM
arch
31,
20
19M
arch
31,
20
18M
arch
31,
20
19M
arch
31,
20
18
Bu
ild
ings
7.7
2 7
.72
4.9
4 5
.74
Tota
l 7
.72
7.7
2 4
.94
5.7
4
(iv)
Fair
val
ue
of i
nve
stm
ent
pro
per
ties
T
he
fair
val
ue
of t
he
Com
pan
y's
inve
stm
ent
pro
per
ties
as
at M
arch
31,
201
9 h
as b
een
arr
ived
at
`2,0
21 M
illi
on (p
revi
ous
year
: `89
0.70
Mil
lion
) on
th
e b
asis
of
a v
alu
atio
n c
arri
ed o
ut
by in
dep
end
ent
valu
ers.
Th
e sa
id v
alu
ers
are
regi
ster
ed w
ith
th
e au
thor
ity
wh
ich
gov
ern
s va
luer
s in
In
dia
an
d h
ave
app
rop
riat
e q
ual
ifica
tion
s an
d r
elev
ant
exp
erie
nce
in t
he
valu
atio
n o
f p
rop
erti
es in
th
e re
leva
nt
loca
tion
s.
T
he
inp
uts
use
d a
re a
s fo
llow
s:
•
Mon
thly
mar
ket
ren
t, t
akin
g in
to a
ccou
nt
the
dif
fere
nce
s in
loc
atio
n, a
nd
in
div
idu
al f
acto
rs, s
uch
as
fron
tage
an
d s
ize,
bet
wee
n t
he
com
par
able
s an
d
the
pro
per
ty; a
nd
•
Cap
ital
isat
ion
rat
e, t
akin
g in
to a
ccou
nt
the
cap
ital
isat
ion
of
ren
tal
inco
me
pot
enti
al, n
atu
re o
f th
e p
rop
erty
, an
d p
reva
ilin
g m
arke
t co
nd
itio
n.
(iv)
R
efer
not
e 21
for
det
ails
of
inve
stm
ent
pro
per
ties
ple
dge
d a
s se
curi
ty t
owar
ds
bor
row
ings
.
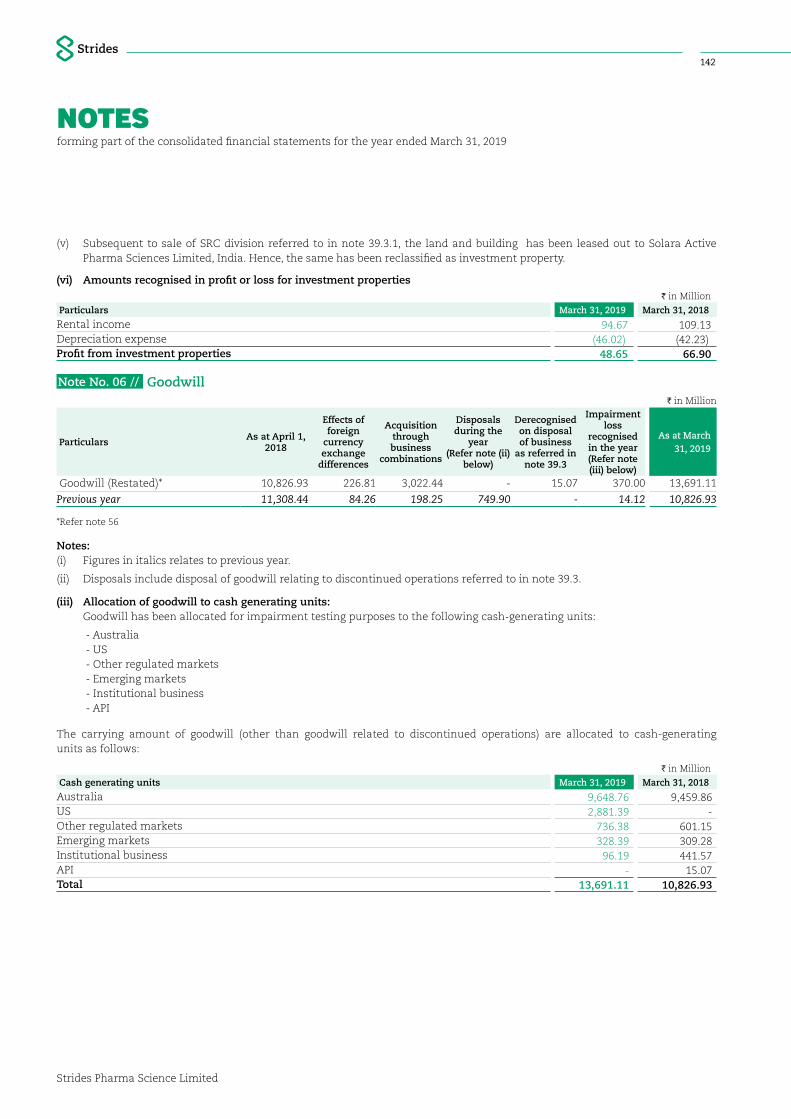
NOTESforming part of the consolidated financial statements for the year ended March 31, 2019
Strides Pharma Science Limited
142
(v) Subsequent to sale of SRC division referred to in note 39.3.1, the land and building has been leased out to Solara Active Pharma Sciences Limited, India. Hence, the same has been reclassified as investment property.
(vi) Amounts recognised in profit or loss for investment propertiesI in Million
Particulars March 31, 2019 March 31, 2018
Rental income 94.67 109.13 Depreciation expense (46.02) (42.23)Profit from investment properties 48.65 66.90
Note No. 06 // GoodwillI in Million
Particulars As at April 1, 2018
Effects of foreign
currency exchange
differences
Acquisition through business
combinations
Disposals during the
year (Refer note (ii)
below)
Derecognised on disposal of business
as referred in note 39.3
Impairment loss
recognised in the year (Refer note (iii) below)
As at March 31, 2019
Goodwill (Restated)* 10,826.93 226.81 3,022.44 - 15.07 370.00 13,691.11
Previous year 11,308.44 84.26 198.25 749.90 - 14.12 10,826.93
*Refer note 56
Notes:(i) Figures in italics relates to previous year.
(ii) Disposals include disposal of goodwill relating to discontinued operations referred to in note 39.3.
(iii) Allocation of goodwill to cash generating units: Goodwill has been allocated for impairment testing purposes to the following cash-generating units:
- Australia - US - Other regulated markets - Emerging markets - Institutional business - API
The carrying amount of goodwill (other than goodwill related to discontinued operations) are allocated to cash-generating units as follows:
I in Million
Cash generating units March 31, 2019 March 31, 2018
Australia 9,648.76 9,459.86 US 2,881.39 - Other regulated markets 736.38 601.15 Emerging markets 328.39 309.28 Institutional business 96.19 441.57 API - 15.07 Total 13,691.11 10,826.93

NOTESforming part of the consolidated financial statements for the year ended March 31, 2019
Annual Report 2018-19
143Financial Statements | Consolidated
The recoverable amount of the above cash generating units have been determined based on 'value in use' model, where in the value of cash generating unit is determined as a sum of the net present value of the projected post tax cash flows for a period of 4 to 5 years and terminal value. The terminal value of each cash generating unit is arrived at by extrapolating cash flows of latest forecasted year to perpetuity using a constant long term growth rate. Key assumptions used for determining the said value in use of each cash generating unit is as follows:
I in Million
Key Assumptions Australia US Other regulated markets
Emerging Markets
Institutional business
Discount Rate 11.54% - 14.80% 10.44% 8.22% 14.84% - 14.89% 19.36%Growth Rate (used for determining Terminal Value)
2.50% - 3% 2% 2% 3% 4%
The discount rates used are based on weighted average cost of capital.
The growth rates of the above cash generating units have been considered based on the market conditions prevalent in the countries that would fall in respective cash generating units.
The management believes that the projections used by the management for determining the "value in use" of cash generating units reflect past experience and external sources of information and any reasonably possible change in the key assumptions on which recoverable amount is based would not cause the aggregate carrying amount to exceed the aggregate recoverable amount of the cash generating unit.
With respect to the Goodwill in Australia CGU, management has identified that a reasonably possible change in two key assumptions could cause the carrying amount to exceed the recoverable amount. The following table shows the amount by which these two assumptions would need to change individually for the estimated recoverable amount to be equal to the carrying amount.
in percent
Changes required for recoverable amount to equal carrying amount March 31, 2019
Discount Rate 0.9Growth Rate (used for determining Terminal Value) (1.5)
During the current year, the Group has recognised impairment charge of ̀ 370.00 Million for goodwill pertaining to the Institutional business CGU based on the independent valuation report.
During the previous year ended March 31, 2018, the Group had recognised impairment charge of `14.12 Million for goodwill pertaining to the API CGU pursuant to the proposed sale of subsidiary as referred to in note 39.3.2.
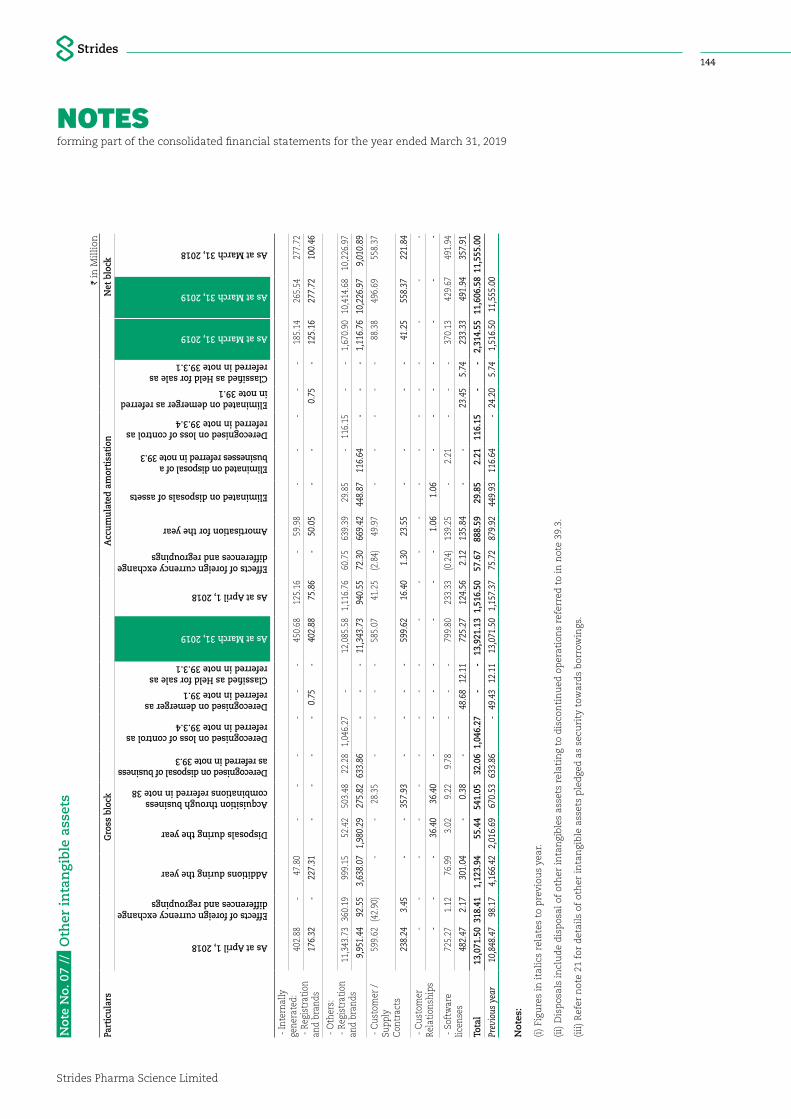
NOTESforming part of the consolidated financial statements for the year ended March 31, 2019
Strides Pharma Science Limited
144N
ote
No.
07
// O
ther
in
tan
gib
le a
sset
s
I in
Mil
lion
Part
icul
ars
Gro
ss b
lock
Acc
umul
ated
am
orti
sati
onN
et b
lock
As at April 1, 2018
Effects of foreign currency exchange differences and regroupings
Additions during the year
Disposals during the year
Acquisition through business combinations referred in note 38
Derecognised on disposal of business as referred in note 39.3
Derecognised on loss of control as referred in note 39.3.4
Derecognised on demerger as referred in note 39.1
Classified as Held for sale as referred in note 39.3.1
As at March 31, 2019
As at April 1, 2018
Effects of foreign currency exchange differences and regroupings
Amortisation for the year
Eliminated on disposals of assets
Eliminated on disposal of a businesses referred in note 39.3
Derecognised on loss of control as referred in note 39.3.4
Eliminated on demerger as referred in note 39.1
Classified as Held for sale as referred in note 39.3.1
As at March 31, 2019
As at March 31, 2019
As at March 31, 2018
- In
tern
ally
ge
nera
ted:
- R
egis
trat
ion
and
bran
ds
402
.88
- 4
7.80
-
- -
- -
- 4
50.6
8 1
25.1
6 -
59.
98
- -
- -
- 1
85.1
4 2
65.5
4 2
77.7
2
176
.32
- 2
27.3
1 -
- -
- 0
.75
- 4
02.8
8 7
5.86
-
50.
05
- -
0.7
5 -
125
.16
277
.72
100
.46
- O
ther
s:
- R
egis
trat
ion
and
bran
ds
11,
343.
73
360.
19
999
.15
52.
42
503
.48
22.
28
1,04
6.27
-
12,
085.
58
1,11
6.76
6
0.75
6
39.3
9 2
9.85
-
116
.15
- -
1,6
70.9
0 1
0,41
4.68
1
0,22
6.97
9,9
51.4
4 9
2.55
3
,638
.07
1,9
80.2
9 2
75.8
2 6
33.8
6 -
- -
11,
343.
73
940
.55
72.
30
669
.42
448
.87
116
.64
- -
- 1
,116
.76
10,
226.
97
9,0
10.8
9
- C
usto
mer
/
Supp
ly
Con
trac
ts
599
.62
(42.
90)
- -
28.
35
- -
- -
585
.07
41.
25
(2.8
4) 4
9.97
-
- -
- -
88.
38
496
.69
558
.37
238
.24
3.4
5 -
- 3
57.9
3 -
- -
- 5
99.6
2 1
6.40
1
.30
23.
55
- -
- -
41.
25
558
.37
221
.84
- C
usto
mer
Re
lati
onsh
ips
- -
- -
- -
- -
- -
- -
- -
- -
- -
- -
-
- -
- 3
6.40
3
6.40
-
- -
- -
- -
1.0
6 1
.06
- -
- -
- -
-
- S
oftw
are
licen
ses
725
.27
1.1
2 7
6.99
3
.02
9.2
2 9
.78
- -
- 7
99.8
0 2
33.3
3 (0
.24)
139
.25
- 2
.21
- -
- 3
70.1
3 4
29.6
7 4
91.9
4
482
.47
2.1
7 3
01.0
4 -
0.3
8 -
48.
68
12.1
1 7
25.2
7 1
24.5
6 2
.12
135
.84
- -
23.
45
5.7
4 2
33.3
3 4
91.9
4 3
57.9
1
Tota
l 1
3,07
1.50
318
.41
1,1
23.9
4 5
5.44
5
41.0
5 3
2.06
1,0
46.2
7 -
- 1
3,92
1.13
1,5
16.5
0 5
7.67
8
88.5
9 2
9.85
2
.21
116
.15
- -
2,3
14.5
5 1
1,60
6.58
11,
555.
00
Prev
ious
yea
r 1
0,84
8.47
9
8.17
4
,166
.42
2,01
6.69
6
70.5
3 6
33.8
6 -
49.
43
12.1
1 1
3,07
1.50
1,
157.
37
75.
72
879
.92
449
.93
116
.64
- 2
4.20
5
.74
1,5
16.5
0 1
1,55
5.00
Not
es:
(i)
Figu
res
in it
alic
s re
late
s to
pre
viou
s ye
ar.
(ii)
Dis
pos
als
incl
ud
e d
isp
osal
of
oth
er in
tan
gib
les
asse
ts r
elat
ing
to d
isco
nti
nu
ed o
per
atio
ns
refe
rred
to
in n
ote
39.3
.
(iii
) R
efer
not
e 21
for
det
ails
of
oth
er in
tan
gib
le a
sset
s p
led
ged
as
secu
rity
tow
ard
s b
orro
win
gs.
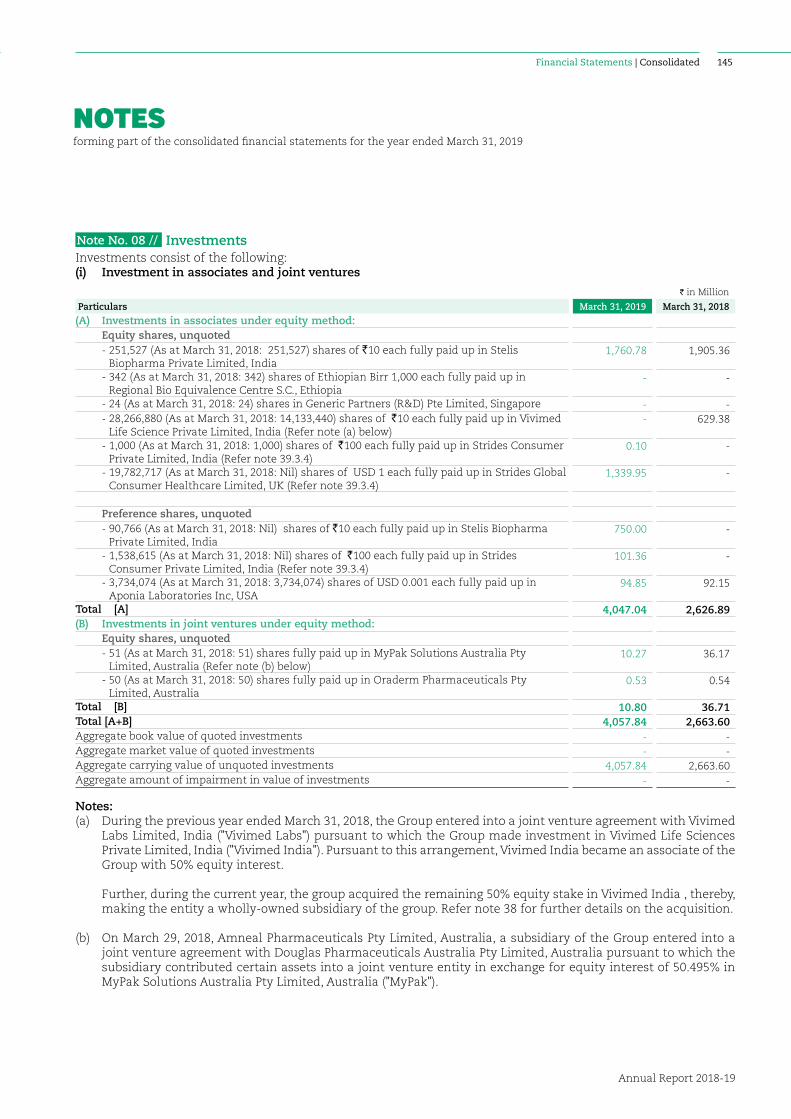
NOTESforming part of the consolidated financial statements for the year ended March 31, 2019
Annual Report 2018-19
145Financial Statements | Consolidated
Note No. 08 // Investments Investments consist of the following:(i) Investment in associates and joint ventures
I in Million
Particulars March 31, 2019 March 31, 2018
(A) Investments in associates under equity method: Equity shares, unquoted - 251,527 (As at March 31, 2018: 251,527) shares of `10 each fully paid up in Stelis
Biopharma Private Limited, India 1,760.78 1,905.36
- 342 (As at March 31, 2018: 342) shares of Ethiopian Birr 1,000 each fully paid up in Regional Bio Equivalence Centre S.C., Ethiopia
- -
- 24 (As at March 31, 2018: 24) shares in Generic Partners (R&D) Pte Limited, Singapore - - - 28,266,880 (As at March 31, 2018: 14,133,440) shares of `10 each fully paid up in Vivimed
Life Science Private Limited, India (Refer note (a) below) - 629.38
- 1,000 (As at March 31, 2018: 1,000) shares of `100 each fully paid up in Strides Consumer Private Limited, India (Refer note 39.3.4)
0.10 -
- 19,782,717 (As at March 31, 2018: Nil) shares of USD 1 each fully paid up in Strides Global Consumer Healthcare Limited, UK (Refer note 39.3.4)
1,339.95 -
Preference shares, unquoted - 90,766 (As at March 31, 2018: Nil) shares of `10 each fully paid up in Stelis Biopharma
Private Limited, India 750.00 -
- 1,538,615 (As at March 31, 2018: Nil) shares of `100 each fully paid up in Strides Consumer Private Limited, India (Refer note 39.3.4)
101.36 -
- 3,734,074 (As at March 31, 2018: 3,734,074) shares of USD 0.001 each fully paid up in Aponia Laboratories Inc, USA
94.85 92.15
Total [A] 4,047.04 2,626.89 (B) Investments in joint ventures under equity method: Equity shares, unquoted - 51 (As at March 31, 2018: 51) shares fully paid up in MyPak Solutions Australia Pty
Limited, Australia (Refer note (b) below) 10.27 36.17
- 50 (As at March 31, 2018: 50) shares fully paid up in Oraderm Pharmaceuticals Pty Limited, Australia
0.53 0.54
Total [B] 10.80 36.71 Total [A+B] 4,057.84 2,663.60 Aggregate book value of quoted investments - - Aggregate market value of quoted investments - - Aggregate carrying value of unquoted investments 4,057.84 2,663.60 Aggregate amount of impairment in value of investments - -
Notes:(a) During the previous year ended March 31, 2018, the Group entered into a joint venture agreement with Vivimed
Labs Limited, India ("Vivimed Labs") pursuant to which the Group made investment in Vivimed Life Sciences Private Limited, India ("Vivimed India"). Pursuant to this arrangement, Vivimed India became an associate of the Group with 50% equity interest.
Further, during the current year, the group acquired the remaining 50% equity stake in Vivimed India , thereby, making the entity a wholly-owned subsidiary of the group. Refer note 38 for further details on the acquisition.
(b) On March 29, 2018, Amneal Pharmaceuticals Pty Limited, Australia, a subsidiary of the Group entered into a joint venture agreement with Douglas Pharmaceuticals Australia Pty Limited, Australia pursuant to which the subsidiary contributed certain assets into a joint venture entity in exchange for equity interest of 50.495% in MyPak Solutions Australia Pty Limited, Australia ("MyPak").
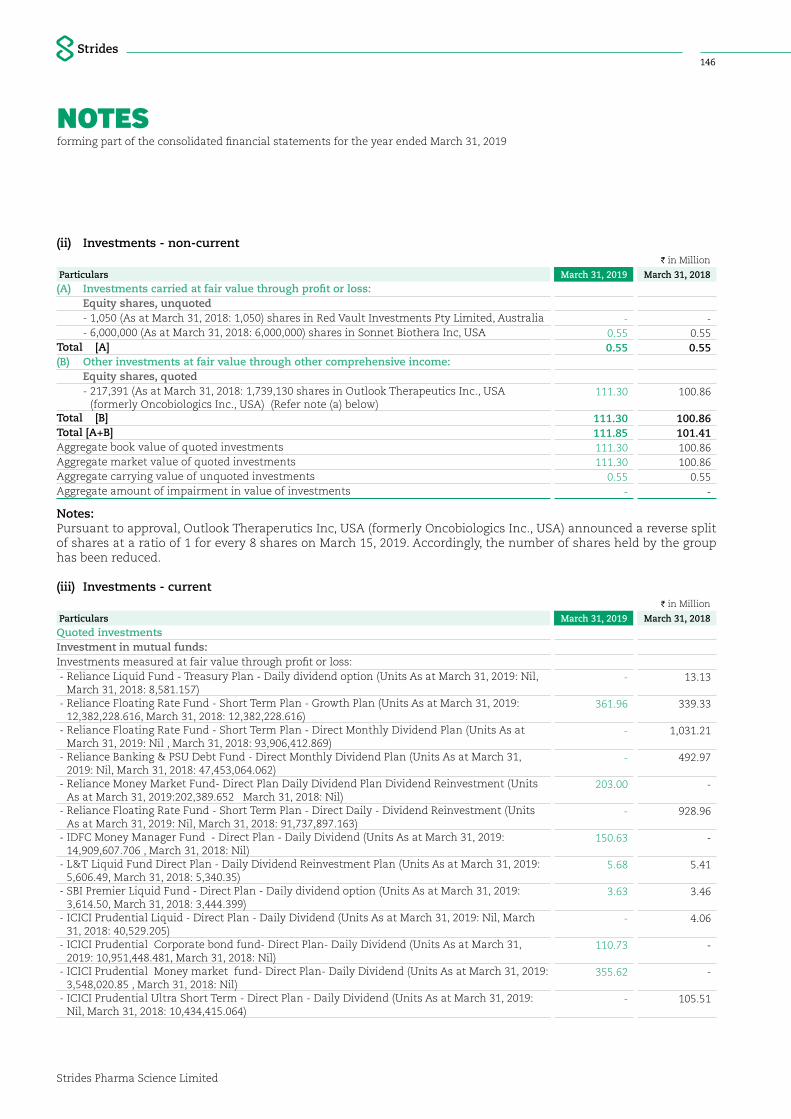
NOTESforming part of the consolidated financial statements for the year ended March 31, 2019
Strides Pharma Science Limited
146
(ii) Investments - non-currentI in Million
Particulars March 31, 2019 March 31, 2018
(A) Investments carried at fair value through profit or loss: Equity shares, unquoted - 1,050 (As at March 31, 2018: 1,050) shares in Red Vault Investments Pty Limited, Australia - - - 6,000,000 (As at March 31, 2018: 6,000,000) shares in Sonnet Biothera Inc, USA 0.55 0.55 Total [A] 0.55 0.55 (B) Other investments at fair value through other comprehensive income: Equity shares, quoted - 217,391 (As at March 31, 2018: 1,739,130 shares in Outlook Therapeutics Inc., USA
(formerly Oncobiologics Inc., USA) (Refer note (a) below) 111.30 100.86
Total [B] 111.30 100.86 Total [A+B] 111.85 101.41 Aggregate book value of quoted investments 111.30 100.86 Aggregate market value of quoted investments 111.30 100.86 Aggregate carrying value of unquoted investments 0.55 0.55 Aggregate amount of impairment in value of investments - -
Notes:Pursuant to approval, Outlook Theraperutics Inc, USA (formerly Oncobiologics Inc., USA) announced a reverse split of shares at a ratio of 1 for every 8 shares on March 15, 2019. Accordingly, the number of shares held by the group has been reduced.
(iii) Investments - currentI in Million
Particulars March 31, 2019 March 31, 2018
Quoted investmentsInvestment in mutual funds:Investments measured at fair value through profit or loss: - Reliance Liquid Fund - Treasury Plan - Daily dividend option (Units As at March 31, 2019: Nil,
March 31, 2018: 8,581.157) - 13.13
- Reliance Floating Rate Fund - Short Term Plan - Growth Plan (Units As at March 31, 2019: 12,382,228.616, March 31, 2018: 12,382,228.616)
361.96 339.33
- Reliance Floating Rate Fund - Short Term Plan - Direct Monthly Dividend Plan (Units As at March 31, 2019: Nil , March 31, 2018: 93,906,412.869)
- 1,031.21
- Reliance Banking & PSU Debt Fund - Direct Monthly Dividend Plan (Units As at March 31, 2019: Nil, March 31, 2018: 47,453,064.062)
- 492.97
- Reliance Money Market Fund- Direct Plan Daily Dividend Plan Dividend Reinvestment (Units As at March 31, 2019:202,389.652 March 31, 2018: Nil)
203.00 -
- Reliance Floating Rate Fund - Short Term Plan - Direct Daily - Dividend Reinvestment (Units As at March 31, 2019: Nil, March 31, 2018: 91,737,897.163)
- 928.96
- IDFC Money Manager Fund - Direct Plan - Daily Dividend (Units As at March 31, 2019: 14,909,607.706 , March 31, 2018: Nil)
150.63 -
- L&T Liquid Fund Direct Plan - Daily Dividend Reinvestment Plan (Units As at March 31, 2019: 5,606.49, March 31, 2018: 5,340.35)
5.68 5.41
- SBI Premier Liquid Fund - Direct Plan - Daily dividend option (Units As at March 31, 2019: 3,614.50, March 31, 2018: 3,444.399)
3.63 3.46
- ICICI Prudential Liquid - Direct Plan - Daily Dividend (Units As at March 31, 2019: Nil, March 31, 2018: 40,529.205)
- 4.06
- ICICI Prudential Corporate bond fund- Direct Plan- Daily Dividend (Units As at March 31, 2019: 10,951,448.481, March 31, 2018: Nil)
110.73 -
- ICICI Prudential Money market fund- Direct Plan- Daily Dividend (Units As at March 31, 2019: 3,548,020.85 , March 31, 2018: Nil)
355.62 -
- ICICI Prudential Ultra Short Term - Direct Plan - Daily Dividend (Units As at March 31, 2019: Nil, March 31, 2018: 10,434,415.064)
- 105.51
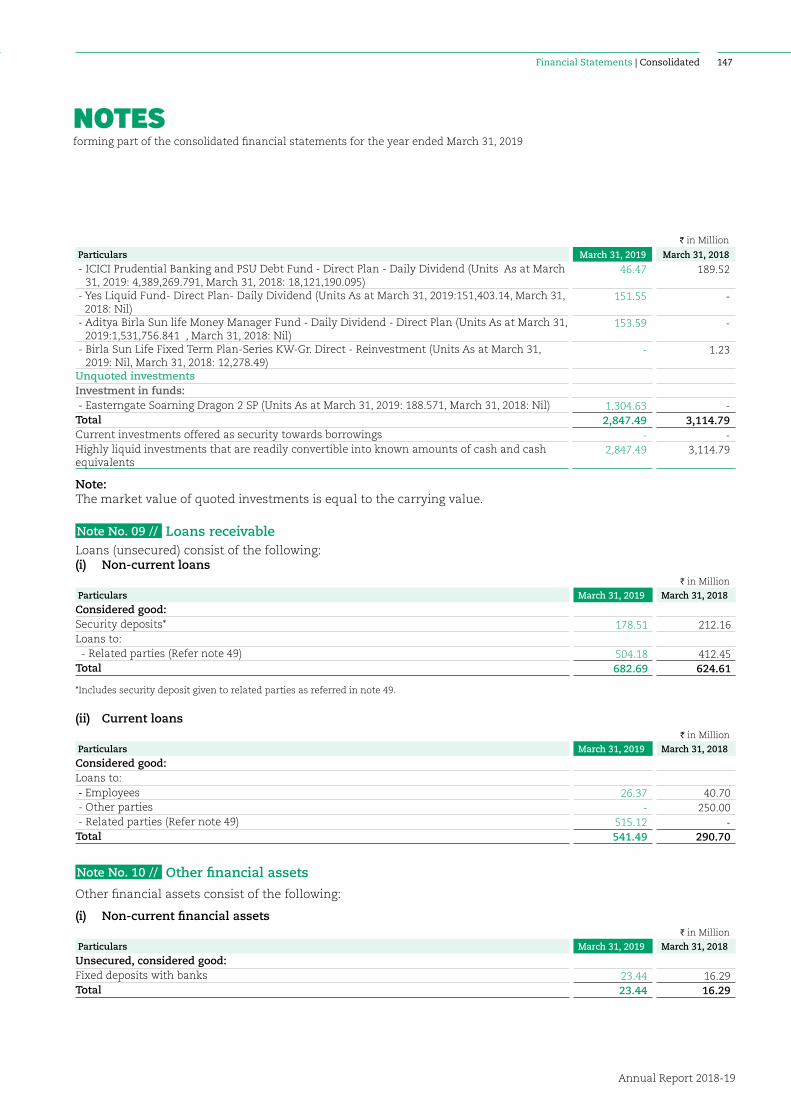
NOTESforming part of the consolidated financial statements for the year ended March 31, 2019
Annual Report 2018-19
147Financial Statements | Consolidated
I in Million
Particulars March 31, 2019 March 31, 2018
- ICICI Prudential Banking and PSU Debt Fund - Direct Plan - Daily Dividend (Units As at March 31, 2019: 4,389,269.791, March 31, 2018: 18,121,190.095)
46.47 189.52
- Yes Liquid Fund- Direct Plan- Daily Dividend (Units As at March 31, 2019:151,403.14, March 31, 2018: Nil)
151.55 -
- Aditya Birla Sun life Money Manager Fund - Daily Dividend - Direct Plan (Units As at March 31, 2019:1,531,756.841 , March 31, 2018: Nil)
153.59 -
- Birla Sun Life Fixed Term Plan-Series KW-Gr. Direct - Reinvestment (Units As at March 31, 2019: Nil, March 31, 2018: 12,278.49)
- 1.23
Unquoted investmentsInvestment in funds: - Easterngate Soarning Dragon 2 SP (Units As at March 31, 2019: 188.571, March 31, 2018: Nil) 1,304.63 - Total 2,847.49 3,114.79 Current investments offered as security towards borrowings - - Highly liquid investments that are readily convertible into known amounts of cash and cash equivalents
2,847.49 3,114.79
Note: The market value of quoted investments is equal to the carrying value.
Note No. 09 // Loans receivableLoans (unsecured) consist of the following:(i) Non-current loans
I in Million
Particulars March 31, 2019 March 31, 2018
Considered good:Security deposits* 178.51 212.16 Loans to: - Related parties (Refer note 49) 504.18 412.45 Total 682.69 624.61
*Includes security deposit given to related parties as referred in note 49.
(ii) Current loansI in Million
Particulars March 31, 2019 March 31, 2018
Considered good:Loans to: - Employees 26.37 40.70 - Other parties - 250.00 - Related parties (Refer note 49) 515.12 - Total 541.49 290.70
Note No. 10 // Other financial assets
Other financial assets consist of the following:
(i) Non-current financial assetsI in Million
Particulars March 31, 2019 March 31, 2018
Unsecured, considered good:Fixed deposits with banks 23.44 16.29 Total 23.44 16.29
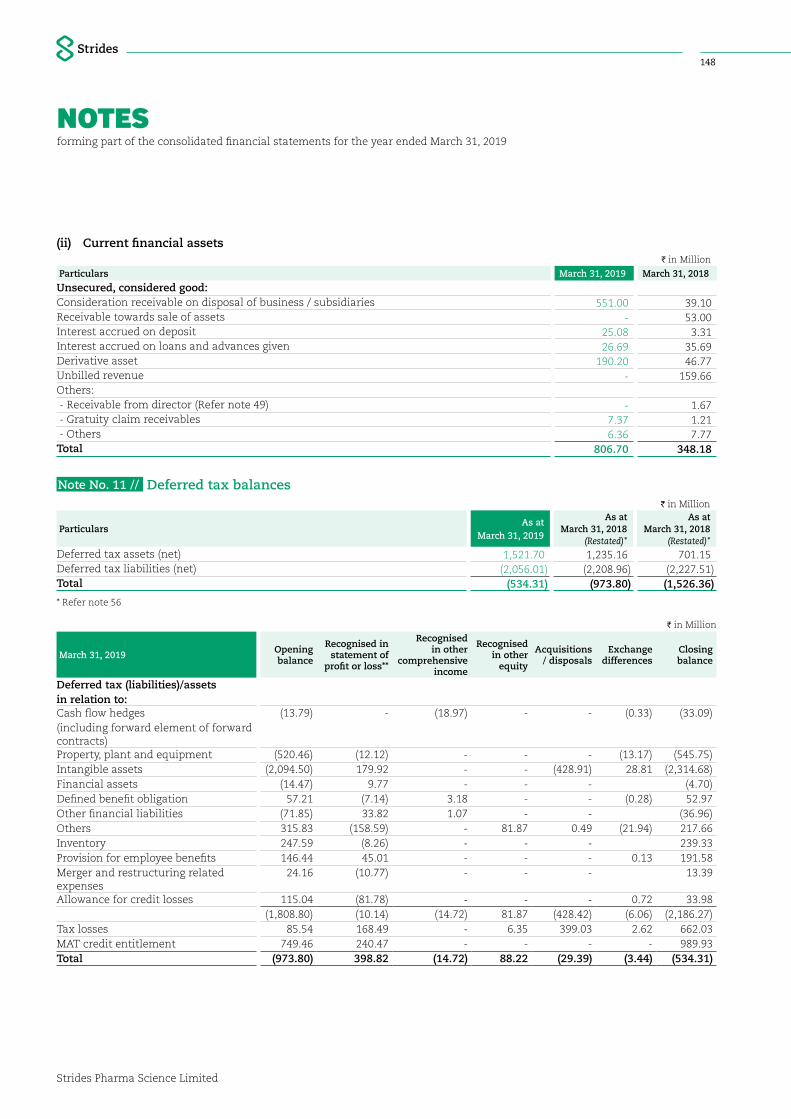
NOTESforming part of the consolidated financial statements for the year ended March 31, 2019
Strides Pharma Science Limited
148
(ii) Current financial assetsI in Million
Particulars March 31, 2019 March 31, 2018
Unsecured, considered good:Consideration receivable on disposal of business / subsidiaries 551.00 39.10 Receivable towards sale of assets - 53.00 Interest accrued on deposit 25.08 3.31 Interest accrued on loans and advances given 26.69 35.69 Derivative asset 190.20 46.77 Unbilled revenue - 159.66 Others: - Receivable from director (Refer note 49) - 1.67 - Gratuity claim receivables 7.37 1.21 - Others 6.36 7.77 Total 806.70 348.18
Note No. 11 // Deferred tax balancesI in Million
ParticularsAs at
March 31, 2019
As at March 31, 2018
(Restated)*
As at March 31, 2018
(Restated)*Deferred tax assets (net) 1,521.70 1,235.16 701.15 Deferred tax liabilities (net) (2,056.01) (2,208.96) (2,227.51)Total (534.31) (973.80) (1,526.36)
* Refer note 56
I in Million
March 31, 2019 Opening balance
Recognised in statement of
profit or loss**
Recognised in other
comprehensive income
Recognised in other
equity
Acquisitions / disposals
Exchange differences
Closing balance
Deferred tax (liabilities)/assets in relation to:Cash flow hedges (13.79) - (18.97) - - (0.33) (33.09)(including forward element of forward contracts) Property, plant and equipment (520.46) (12.12) - - - (13.17) (545.75)Intangible assets (2,094.50) 179.92 - - (428.91) 28.81 (2,314.68)Financial assets (14.47) 9.77 - - - (4.70)Defined benefit obligation 57.21 (7.14) 3.18 - - (0.28) 52.97 Other financial liabilities (71.85) 33.82 1.07 - - (36.96)Others 315.83 (158.59) - 81.87 0.49 (21.94) 217.66 Inventory 247.59 (8.26) - - - 239.33 Provision for employee benefits 146.44 45.01 - - - 0.13 191.58 Merger and restructuring related expenses
24.16 (10.77) - - - 13.39
Allowance for credit losses 115.04 (81.78) - - - 0.72 33.98 (1,808.80) (10.14) (14.72) 81.87 (428.42) (6.06) (2,186.27)
Tax losses 85.54 168.49 - 6.35 399.03 2.62 662.03 MAT credit entitlement 749.46 240.47 - - - - 989.93 Total (973.80) 398.82 (14.72) 88.22 (29.39) (3.44) (534.31)
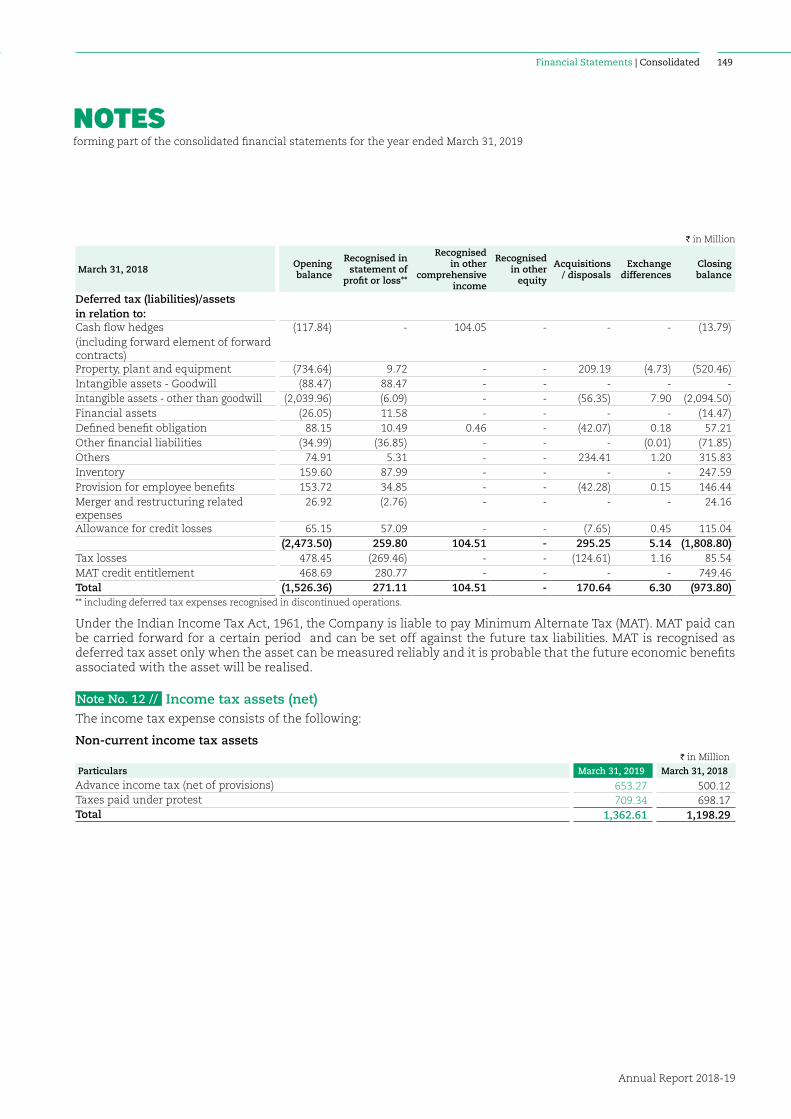
NOTESforming part of the consolidated financial statements for the year ended March 31, 2019
Annual Report 2018-19
149Financial Statements | Consolidated
I in Million
March 31, 2018 Opening balance
Recognised in statement of
profit or loss**
Recognised in other
comprehensive income
Recognised in other
equity
Acquisitions / disposals
Exchange differences
Closing balance
Deferred tax (liabilities)/assets in relation to:Cash flow hedges (117.84) - 104.05 - - - (13.79)(including forward element of forward contracts) Property, plant and equipment (734.64) 9.72 - - 209.19 (4.73) (520.46)Intangible assets - Goodwill (88.47) 88.47 - - - - - Intangible assets - other than goodwill (2,039.96) (6.09) - - (56.35) 7.90 (2,094.50)Financial assets (26.05) 11.58 - - - - (14.47)Defined benefit obligation 88.15 10.49 0.46 - (42.07) 0.18 57.21 Other financial liabilities (34.99) (36.85) - - - (0.01) (71.85)Others 74.91 5.31 - - 234.41 1.20 315.83 Inventory 159.60 87.99 - - - - 247.59 Provision for employee benefits 153.72 34.85 - - (42.28) 0.15 146.44 Merger and restructuring related expenses
26.92 (2.76) - - - - 24.16
Allowance for credit losses 65.15 57.09 - - (7.65) 0.45 115.04 (2,473.50) 259.80 104.51 - 295.25 5.14 (1,808.80)
Tax losses 478.45 (269.46) - - (124.61) 1.16 85.54 MAT credit entitlement 468.69 280.77 - - - - 749.46 Total (1,526.36) 271.11 104.51 - 170.64 6.30 (973.80)** including deferred tax expenses recognised in discontinued operations.
Under the Indian Income Tax Act, 1961, the Company is liable to pay Minimum Alternate Tax (MAT). MAT paid can be carried forward for a certain period and can be set off against the future tax liabilities. MAT is recognised as deferred tax asset only when the asset can be measured reliably and it is probable that the future economic benefits associated with the asset will be realised.
Note No. 12 // Income tax assets (net)The income tax expense consists of the following:
Non-current income tax assetsI in Million
Particulars March 31, 2019 March 31, 2018
Advance income tax (net of provisions) 653.27 500.12 Taxes paid under protest 709.34 698.17 Total 1,362.61 1,198.29
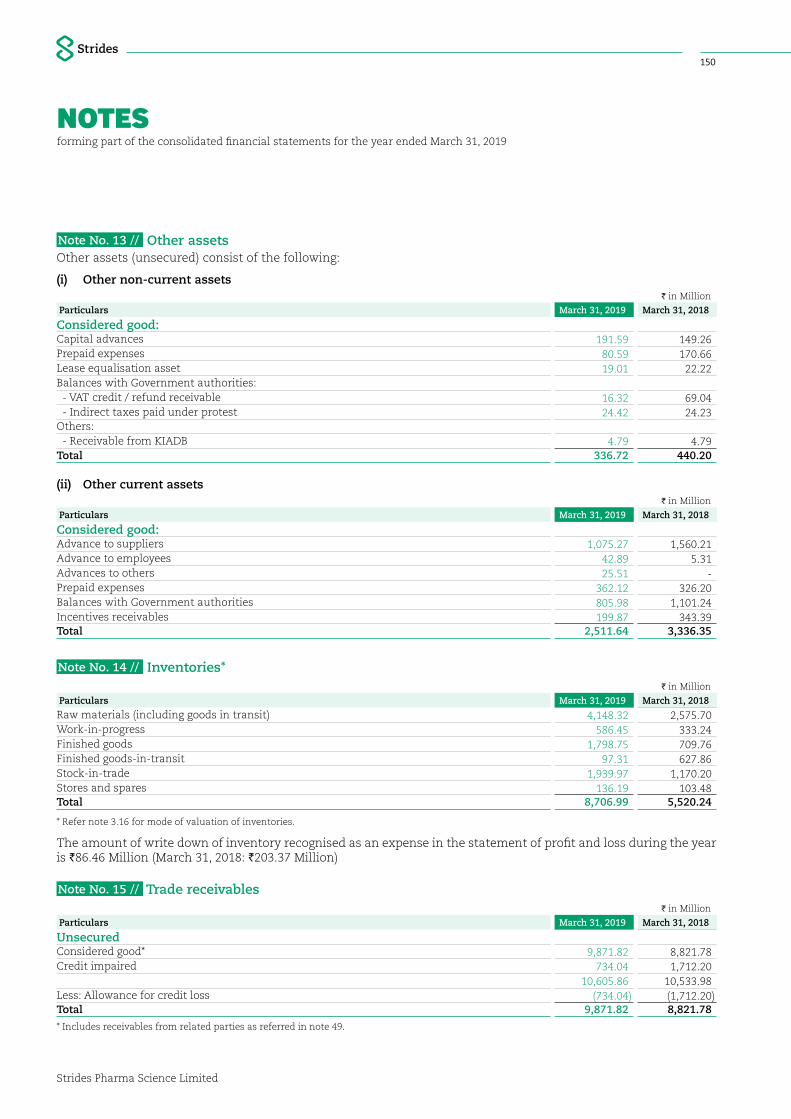
NOTESforming part of the consolidated financial statements for the year ended March 31, 2019
Strides Pharma Science Limited
150
Note No. 13 // Other assetsOther assets (unsecured) consist of the following:
(i) Other non-current assets I in Million
Particulars March 31, 2019 March 31, 2018
Considered good:Capital advances 191.59 149.26 Prepaid expenses 80.59 170.66 Lease equalisation asset 19.01 22.22 Balances with Government authorities: - VAT credit / refund receivable 16.32 69.04 - Indirect taxes paid under protest 24.42 24.23 Others: - Receivable from KIADB 4.79 4.79 Total 336.72 440.20
(ii) Other current assets I in Million
Particulars March 31, 2019 March 31, 2018
Considered good:Advance to suppliers 1,075.27 1,560.21 Advance to employees 42.89 5.31 Advances to others 25.51 - Prepaid expenses 362.12 326.20 Balances with Government authorities 805.98 1,101.24 Incentives receivables 199.87 343.39 Total 2,511.64 3,336.35
Note No. 14 // Inventories*I in Million
Particulars March 31, 2019 March 31, 2018
Raw materials (including goods in transit) 4,148.32 2,575.70 Work-in-progress 586.45 333.24 Finished goods 1,798.75 709.76 Finished goods-in-transit 97.31 627.86 Stock-in-trade 1,939.97 1,170.20 Stores and spares 136.19 103.48 Total 8,706.99 5,520.24
* Refer note 3.16 for mode of valuation of inventories.
The amount of write down of inventory recognised as an expense in the statement of profit and loss during the year is `86.46 Million (March 31, 2018: `203.37 Million)
Note No. 15 // Trade receivablesI in Million
Particulars March 31, 2019 March 31, 2018
UnsecuredConsidered good* 9,871.82 8,821.78 Credit impaired 734.04 1,712.20
10,605.86 10,533.98 Less: Allowance for credit loss (734.04) (1,712.20)Total 9,871.82 8,821.78
* Includes receivables from related parties as referred in note 49.
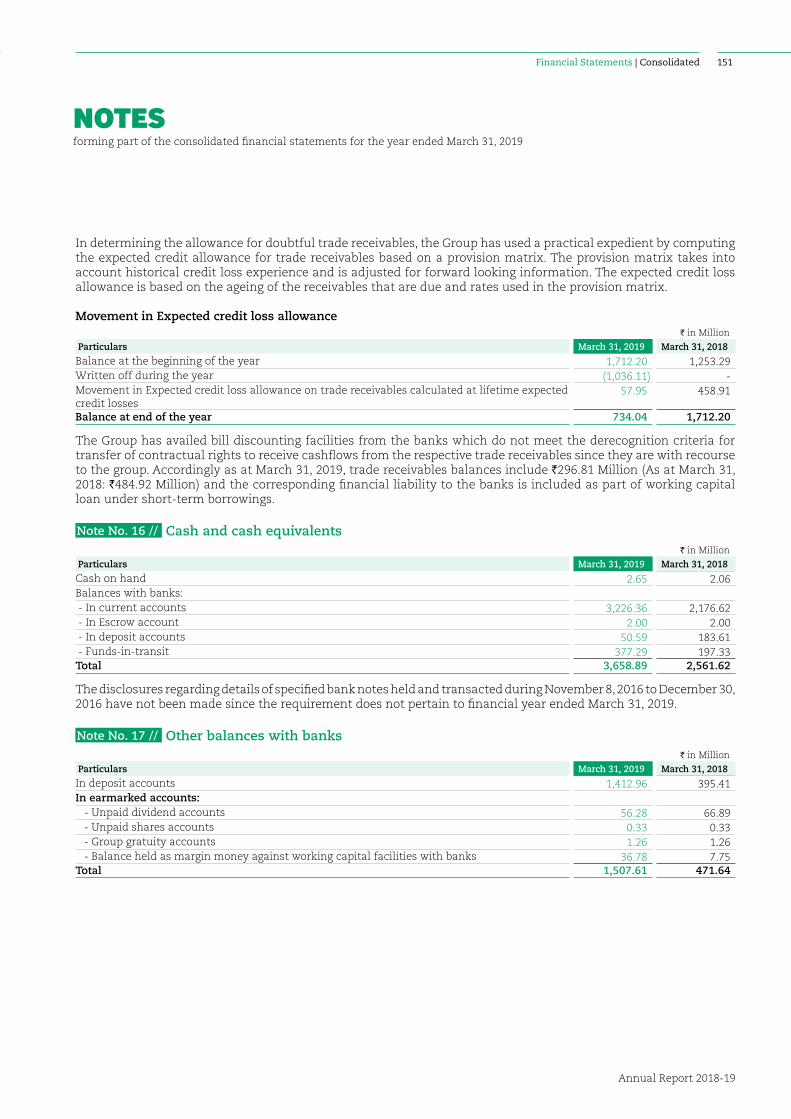
NOTESforming part of the consolidated financial statements for the year ended March 31, 2019
Annual Report 2018-19
151Financial Statements | Consolidated
In determining the allowance for doubtful trade receivables, the Group has used a practical expedient by computing the expected credit allowance for trade receivables based on a provision matrix. The provision matrix takes into account historical credit loss experience and is adjusted for forward looking information. The expected credit loss allowance is based on the ageing of the receivables that are due and rates used in the provision matrix.
Movement in Expected credit loss allowanceI in Million
Particulars March 31, 2019 March 31, 2018
Balance at the beginning of the year 1,712.20 1,253.29 Written off during the year (1,036.11) - Movement in Expected credit loss allowance on trade receivables calculated at lifetime expected credit losses
57.95 458.91
Balance at end of the year 734.04 1,712.20
The Group has availed bill discounting facilities from the banks which do not meet the derecognition criteria for transfer of contractual rights to receive cashflows from the respective trade receivables since they are with recourse to the group. Accordingly as at March 31, 2019, trade receivables balances include `296.81 Million (As at March 31, 2018: `484.92 Million) and the corresponding financial liability to the banks is included as part of working capital loan under short-term borrowings.
Note No. 16 // Cash and cash equivalentsI in Million
Particulars March 31, 2019 March 31, 2018
Cash on hand 2.65 2.06 Balances with banks: - In current accounts 3,226.36 2,176.62 - In Escrow account 2.00 2.00 - In deposit accounts 50.59 183.61 - Funds-in-transit 377.29 197.33 Total 3,658.89 2,561.62
The disclosures regarding details of specified bank notes held and transacted during November 8, 2016 to December 30, 2016 have not been made since the requirement does not pertain to financial year ended March 31, 2019.
Note No. 17 // Other balances with banksI in Million
Particulars March 31, 2019 March 31, 2018
In deposit accounts 1,412.96 395.41 In earmarked accounts: - Unpaid dividend accounts 56.28 66.89 - Unpaid shares accounts 0.33 0.33 - Group gratuity accounts 1.26 1.26 - Balance held as margin money against working capital facilities with banks 36.78 7.75 Total 1,507.61 471.64
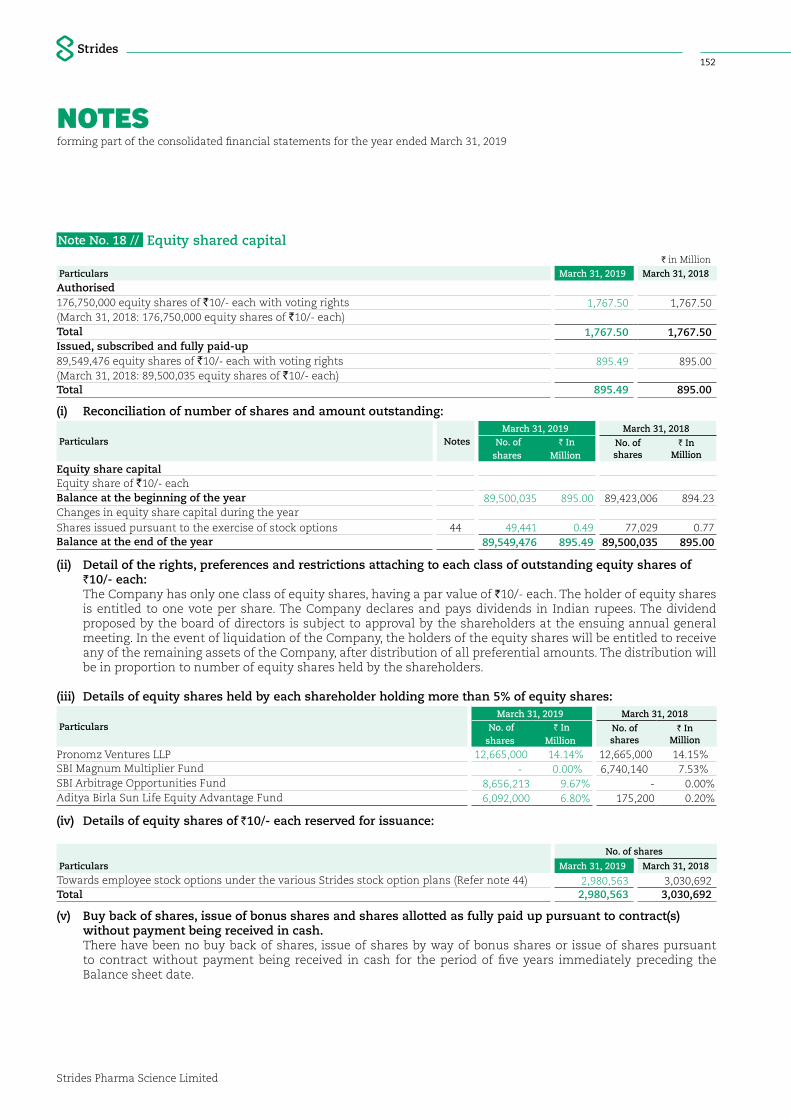
NOTESforming part of the consolidated financial statements for the year ended March 31, 2019
Strides Pharma Science Limited
152
Note No. 18 // Equity shared capitalI in Million
Particulars March 31, 2019 March 31, 2018
Authorised176,750,000 equity shares of `10/- each with voting rights 1,767.50 1,767.50 (March 31, 2018: 176,750,000 equity shares of `10/- each)Total 1,767.50 1,767.50 Issued, subscribed and fully paid-up89,549,476 equity shares of `10/- each with voting rights 895.49 895.00 (March 31, 2018: 89,500,035 equity shares of `10/- each)Total 895.49 895.00
(i) Reconciliation of number of shares and amount outstanding:
Particulars NotesMarch 31, 2019 March 31, 2018
No. of shares
` In Million
No. of shares
` In Million
Equity share capitalEquity share of `10/- eachBalance at the beginning of the year 89,500,035 895.00 89,423,006 894.23 Changes in equity share capital during the yearShares issued pursuant to the exercise of stock options 44 49,441 0.49 77,029 0.77 Balance at the end of the year 89,549,476 895.49 89,500,035 895.00
(ii) Detail of the rights, preferences and restrictions attaching to each class of outstanding equity shares of `10/- each:
The Company has only one class of equity shares, having a par value of `10/- each. The holder of equity shares is entitled to one vote per share. The Company declares and pays dividends in Indian rupees. The dividend proposed by the board of directors is subject to approval by the shareholders at the ensuing annual general meeting. In the event of liquidation of the Company, the holders of the equity shares will be entitled to receive any of the remaining assets of the Company, after distribution of all preferential amounts. The distribution will be in proportion to number of equity shares held by the shareholders.
(iii) Details of equity shares held by each shareholder holding more than 5% of equity shares:
ParticularsMarch 31, 2019 March 31, 2018
No. of shares
` In Million
No. of shares
` In Million
Pronomz Ventures LLP 12,665,000 14.14% 12,665,000 14.15%SBI Magnum Multiplier Fund - 0.00% 6,740,140 7.53%SBI Arbitrage Opportunities Fund 8,656,213 9.67% - 0.00%Aditya Birla Sun Life Equity Advantage Fund 6,092,000 6.80% 175,200 0.20%
(iv) Details of equity shares of `10/- each reserved for issuance:
No. of shares
Particulars March 31, 2019 March 31, 2018
Towards employee stock options under the various Strides stock option plans (Refer note 44) 2,980,563 3,030,692 Total 2,980,563 3,030,692
(v) Buy back of shares, issue of bonus shares and shares allotted as fully paid up pursuant to contract(s) without payment being received in cash.
There have been no buy back of shares, issue of shares by way of bonus shares or issue of shares pursuant to contract without payment being received in cash for the period of five years immediately preceding the Balance sheet date.
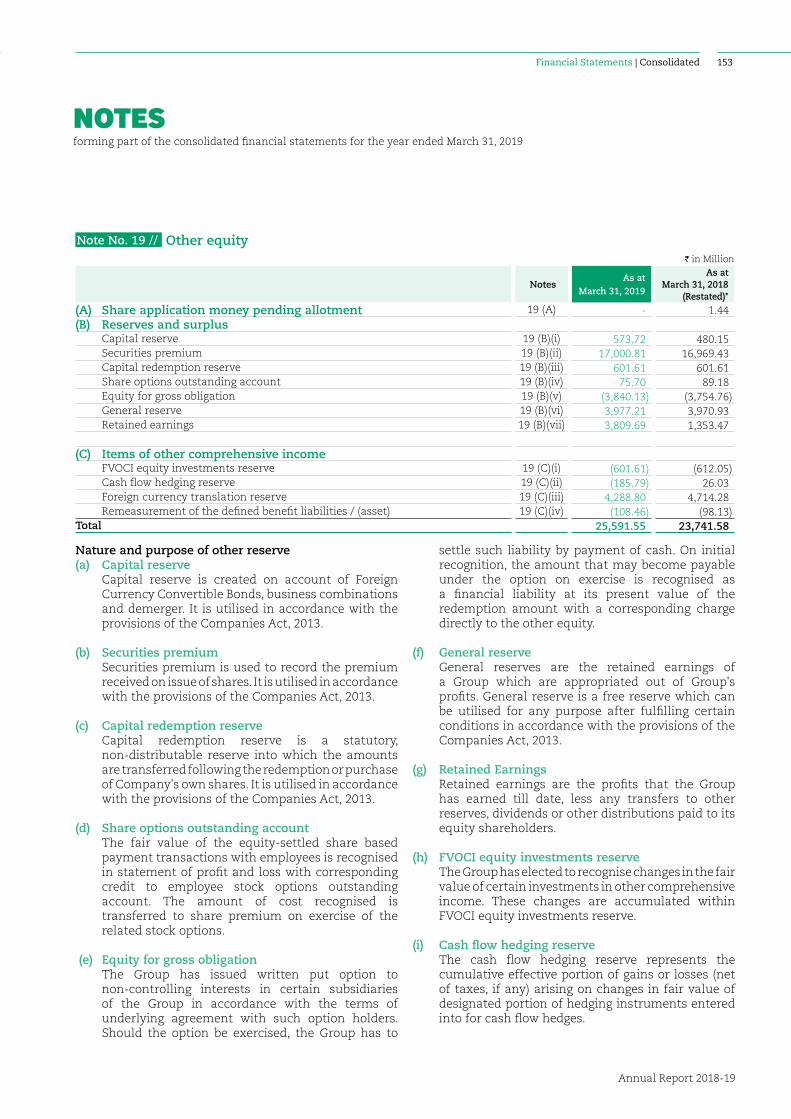
NOTESforming part of the consolidated financial statements for the year ended March 31, 2019
Annual Report 2018-19
153Financial Statements | Consolidated
Note No. 19 // Other equityI in Million
NotesAs at
March 31, 2019
As at March 31, 2018
(Restated)*
(A) Share application money pending allotment 19 (A) - 1.44 (B) Reserves and surplus Capital reserve 19 (B)(i) 573.72 480.15 Securities premium 19 (B)(ii) 17,000.81 16,969.43 Capital redemption reserve 19 (B)(iii) 601.61 601.61 Share options outstanding account 19 (B)(iv) 75.70 89.18 Equity for gross obligation 19 (B)(v) (3,840.13) (3,754.76) General reserve 19 (B)(vi) 3,977.21 3,970.93 Retained earnings 19 (B)(vii) 3,809.69 1,353.47
(C) Items of other comprehensive income FVOCI equity investments reserve 19 (C)(i) (601.61) (612.05) Cash flow hedging reserve 19 (C)(ii) (185.79) 26.03 Foreign currency translation reserve 19 (C)(iii) 4,288.80 4,714.28 Remeasurement of the defined benefit liabilities / (asset) 19 (C)(iv) (108.46) (98.13)Total 25,591.55 23,741.58
Nature and purpose of other reserve(a) Capital reserve Capital reserve is created on account of Foreign
Currency Convertible Bonds, business combinations and demerger. It is utilised in accordance with the provisions of the Companies Act, 2013.
(b) Securities premium Securities premium is used to record the premium
received on issue of shares. It is utilised in accordance with the provisions of the Companies Act, 2013.
(c) Capital redemption reserve Capital redemption reserve is a statutory,
non-distributable reserve into which the amounts are transferred following the redemption or purchase of Company's own shares. It is utilised in accordance with the provisions of the Companies Act, 2013.
(d) Share options outstanding account The fair value of the equity-settled share based
payment transactions with employees is recognised in statement of profit and loss with corresponding credit to employee stock options outstanding account. The amount of cost recognised is transferred to share premium on exercise of the related stock options.
(e) Equity for gross obligation The Group has issued written put option to
non-controlling interests in certain subsidiaries of the Group in accordance with the terms of underlying agreement with such option holders. Should the option be exercised, the Group has to
settle such liability by payment of cash. On initial recognition, the amount that may become payable under the option on exercise is recognised as a financial liability at its present value of the redemption amount with a corresponding charge directly to the other equity.
(f) General reserve General reserves are the retained earnings of
a Group which are appropriated out of Group's profits. General reserve is a free reserve which can be utilised for any purpose after fulfilling certain conditions in accordance with the provisions of the Companies Act, 2013.
(g) Retained Earnings Retained earnings are the profits that the Group
has earned till date, less any transfers to other reserves, dividends or other distributions paid to its equity shareholders.
(h) FVOCI equity investments reserve The Group has elected to recognise changes in the fair
value of certain investments in other comprehensive income. These changes are accumulated within FVOCI equity investments reserve.
(i) Cash flow hedging reserve The cash flow hedging reserve represents the
cumulative effective portion of gains or losses (net of taxes, if any) arising on changes in fair value of designated portion of hedging instruments entered into for cash flow hedges.
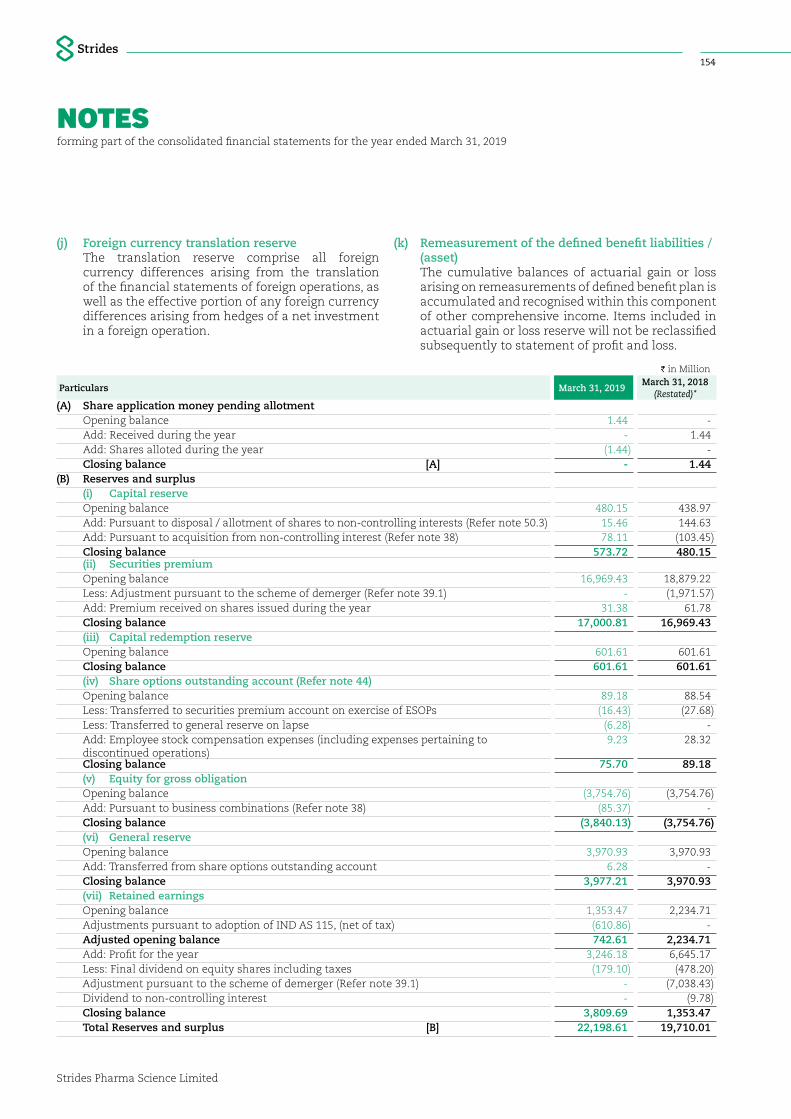
NOTESforming part of the consolidated financial statements for the year ended March 31, 2019
Strides Pharma Science Limited
154
(j) Foreign currency translation reserve The translation reserve comprise all foreign
currency differences arising from the translation of the financial statements of foreign operations, as well as the effective portion of any foreign currency differences arising from hedges of a net investment in a foreign operation.
(k) Remeasurement of the defined benefit liabilities / (asset)
The cumulative balances of actuarial gain or loss arising on remeasurements of defined benefit plan is accumulated and recognised within this component of other comprehensive income. Items included in actuarial gain or loss reserve will not be reclassified subsequently to statement of profit and loss.
I in Million
Particulars March 31, 2019March 31, 2018
(Restated)*(A) Share application money pending allotment Opening balance 1.44 - Add: Received during the year - 1.44 Add: Shares alloted during the year (1.44) - Closing balance [A] - 1.44 (B) Reserves and surplus (i) Capital reserve Opening balance 480.15 438.97 Add: Pursuant to disposal / allotment of shares to non-controlling interests (Refer note 50.3) 15.46 144.63 Add: Pursuant to acquisition from non-controlling interest (Refer note 38) 78.11 (103.45) Closing balance 573.72 480.15 (ii) Securities premium Opening balance 16,969.43 18,879.22 Less: Adjustment pursuant to the scheme of demerger (Refer note 39.1) - (1,971.57) Add: Premium received on shares issued during the year 31.38 61.78 Closing balance 17,000.81 16,969.43 (iii) Capital redemption reserve Opening balance 601.61 601.61 Closing balance 601.61 601.61 (iv) Share options outstanding account (Refer note 44) Opening balance 89.18 88.54 Less: Transferred to securities premium account on exercise of ESOPs (16.43) (27.68) Less: Transferred to general reserve on lapse (6.28) - Add: Employee stock compensation expenses (including expenses pertaining to
discontinued operations) 9.23 28.32
Closing balance 75.70 89.18 (v) Equity for gross obligation Opening balance (3,754.76) (3,754.76) Add: Pursuant to business combinations (Refer note 38) (85.37) - Closing balance (3,840.13) (3,754.76) (vi) General reserve Opening balance 3,970.93 3,970.93 Add: Transferred from share options outstanding account 6.28 - Closing balance 3,977.21 3,970.93 (vii) Retained earnings Opening balance 1,353.47 2,234.71 Adjustments pursuant to adoption of IND AS 115, (net of tax) (610.86) - Adjusted opening balance 742.61 2,234.71 Add: Profit for the year 3,246.18 6,645.17 Less: Final dividend on equity shares including taxes (179.10) (478.20) Adjustment pursuant to the scheme of demerger (Refer note 39.1) - (7,038.43) Dividend to non-controlling interest - (9.78) Closing balance 3,809.69 1,353.47 Total Reserves and surplus [B] 22,198.61 19,710.01
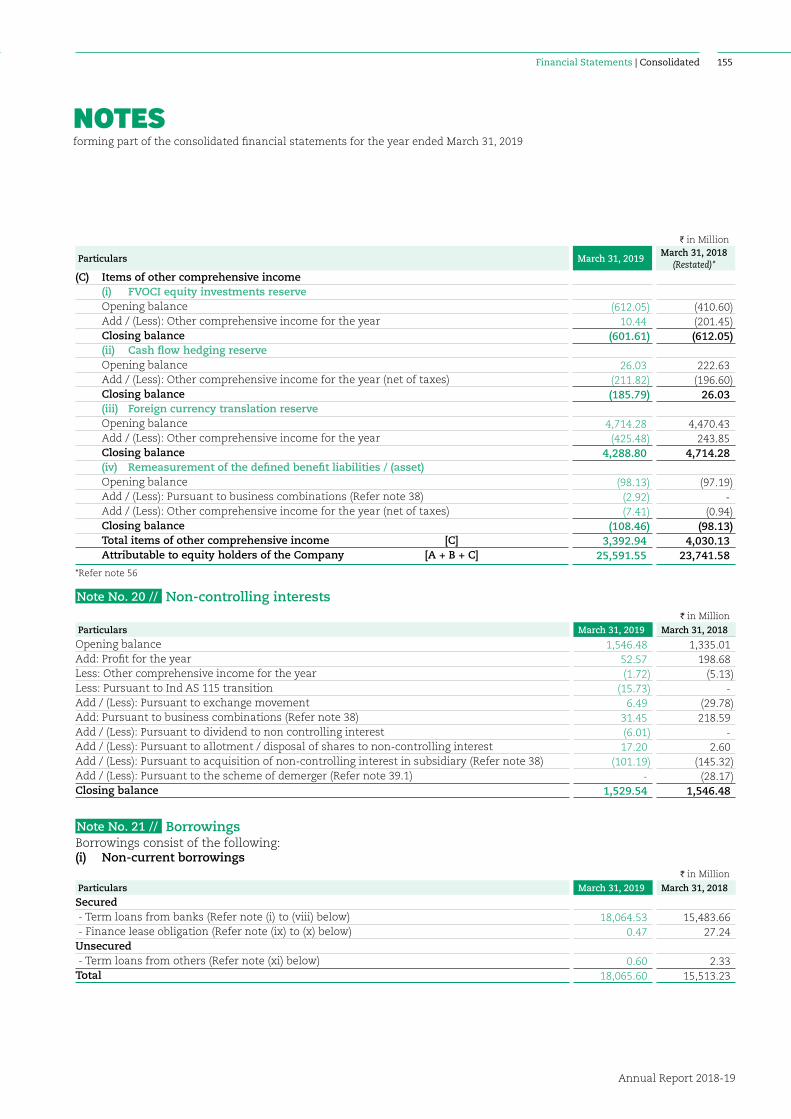
NOTESforming part of the consolidated financial statements for the year ended March 31, 2019
Annual Report 2018-19
155Financial Statements | Consolidated
I in Million
Particulars March 31, 2019March 31, 2018
(Restated)*(C) Items of other comprehensive income (i) FVOCI equity investments reserve Opening balance (612.05) (410.60) Add / (Less): Other comprehensive income for the year 10.44 (201.45) Closing balance (601.61) (612.05) (ii) Cash flow hedging reserve Opening balance 26.03 222.63 Add / (Less): Other comprehensive income for the year (net of taxes) (211.82) (196.60) Closing balance (185.79) 26.03 (iii) Foreign currency translation reserve Opening balance 4,714.28 4,470.43 Add / (Less): Other comprehensive income for the year (425.48) 243.85 Closing balance 4,288.80 4,714.28 (iv) Remeasurement of the defined benefit liabilities / (asset) Opening balance (98.13) (97.19) Add / (Less): Pursuant to business combinations (Refer note 38) (2.92) - Add / (Less): Other comprehensive income for the year (net of taxes) (7.41) (0.94) Closing balance (108.46) (98.13) Total items of other comprehensive income [C] 3,392.94 4,030.13 Attributable to equity holders of the Company [A + B + C] 25,591.55 23,741.58
*Refer note 56
Note No. 20 // Non-controlling interests I in Million
Particulars March 31, 2019 March 31, 2018
Opening balance 1,546.48 1,335.01 Add: Profit for the year 52.57 198.68 Less: Other comprehensive income for the year (1.72) (5.13)Less: Pursuant to Ind AS 115 transition (15.73) - Add / (Less): Pursuant to exchange movement 6.49 (29.78)Add: Pursuant to business combinations (Refer note 38) 31.45 218.59 Add / (Less): Pursuant to dividend to non controlling interest (6.01) - Add / (Less): Pursuant to allotment / disposal of shares to non-controlling interest 17.20 2.60 Add / (Less): Pursuant to acquisition of non-controlling interest in subsidiary (Refer note 38) (101.19) (145.32)Add / (Less): Pursuant to the scheme of demerger (Refer note 39.1) - (28.17)Closing balance 1,529.54 1,546.48
Note No. 21 // Borrowings Borrowings consist of the following:(i) Non-current borrowings
I in Million
Particulars March 31, 2019 March 31, 2018
Secured - Term loans from banks (Refer note (i) to (viii) below) 18,064.53 15,483.66 - Finance lease obligation (Refer note (ix) to (x) below) 0.47 27.24 Unsecured - Term loans from others (Refer note (xi) below) 0.60 2.33 Total 18,065.60 15,513.23
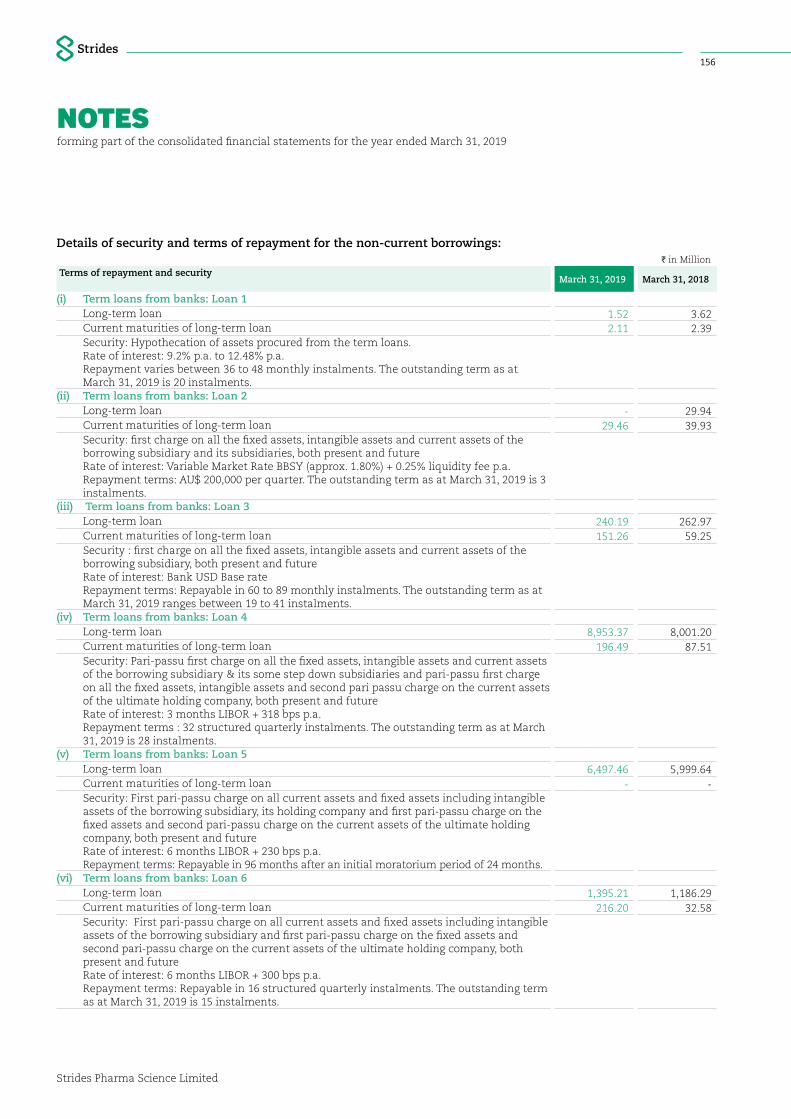
NOTESforming part of the consolidated financial statements for the year ended March 31, 2019
Strides Pharma Science Limited
156
Details of security and terms of repayment for the non-current borrowings:I in Million
Terms of repayment and securityMarch 31, 2019 March 31, 2018
(i) Term loans from banks: Loan 1 Long-term loan 1.52 3.62 Current maturities of long-term loan 2.11 2.39 Security: Hypothecation of assets procured from the term loans. Rate of interest: 9.2% p.a. to 12.48% p.a. Repayment varies between 36 to 48 monthly instalments. The outstanding term as at
March 31, 2019 is 20 instalments.(ii) Term loans from banks: Loan 2 Long-term loan - 29.94 Current maturities of long-term loan 29.46 39.93 Security: first charge on all the fixed assets, intangible assets and current assets of the
borrowing subsidiary and its subsidiaries, both present and future Rate of interest: Variable Market Rate BBSY (approx. 1.80%) + 0.25% liquidity fee p.a. Repayment terms: AU$ 200,000 per quarter. The outstanding term as at March 31, 2019 is 3 instalments.
(iii) Term loans from banks: Loan 3 Long-term loan 240.19 262.97 Current maturities of long-term loan 151.26 59.25 Security : first charge on all the fixed assets, intangible assets and current assets of the
borrowing subsidiary, both present and future Rate of interest: Bank USD Base rate Repayment terms: Repayable in 60 to 89 monthly instalments. The outstanding term as at March 31, 2019 ranges between 19 to 41 instalments.
(iv) Term loans from banks: Loan 4 Long-term loan 8,953.37 8,001.20 Current maturities of long-term loan 196.49 87.51 Security: Pari-passu first charge on all the fixed assets, intangible assets and current assets
of the borrowing subsidiary & its some step down subsidiaries and pari-passu first charge on all the fixed assets, intangible assets and second pari passu charge on the current assets of the ultimate holding company, both present and future Rate of interest: 3 months LIBOR + 318 bps p.a. Repayment terms : 32 structured quarterly instalments. The outstanding term as at March 31, 2019 is 28 instalments.
(v) Term loans from banks: Loan 5 Long-term loan 6,497.46 5,999.64 Current maturities of long-term loan - - Security: First pari-passu charge on all current assets and fixed assets including intangible
assets of the borrowing subsidiary, its holding company and first pari-passu charge on the fixed assets and second pari-passu charge on the current assets of the ultimate holding company, both present and future Rate of interest: 6 months LIBOR + 230 bps p.a. Repayment terms: Repayable in 96 months after an initial moratorium period of 24 months.
(vi) Term loans from banks: Loan 6 Long-term loan 1,395.21 1,186.29 Current maturities of long-term loan 216.20 32.58 Security: First pari-passu charge on all current assets and fixed assets including intangible
assets of the borrowing subsidiary and first pari-passu charge on the fixed assets and second pari-passu charge on the current assets of the ultimate holding company, both present and future Rate of interest: 6 months LIBOR + 300 bps p.a. Repayment terms: Repayable in 16 structured quarterly instalments. The outstanding term as at March 31, 2019 is 15 instalments.
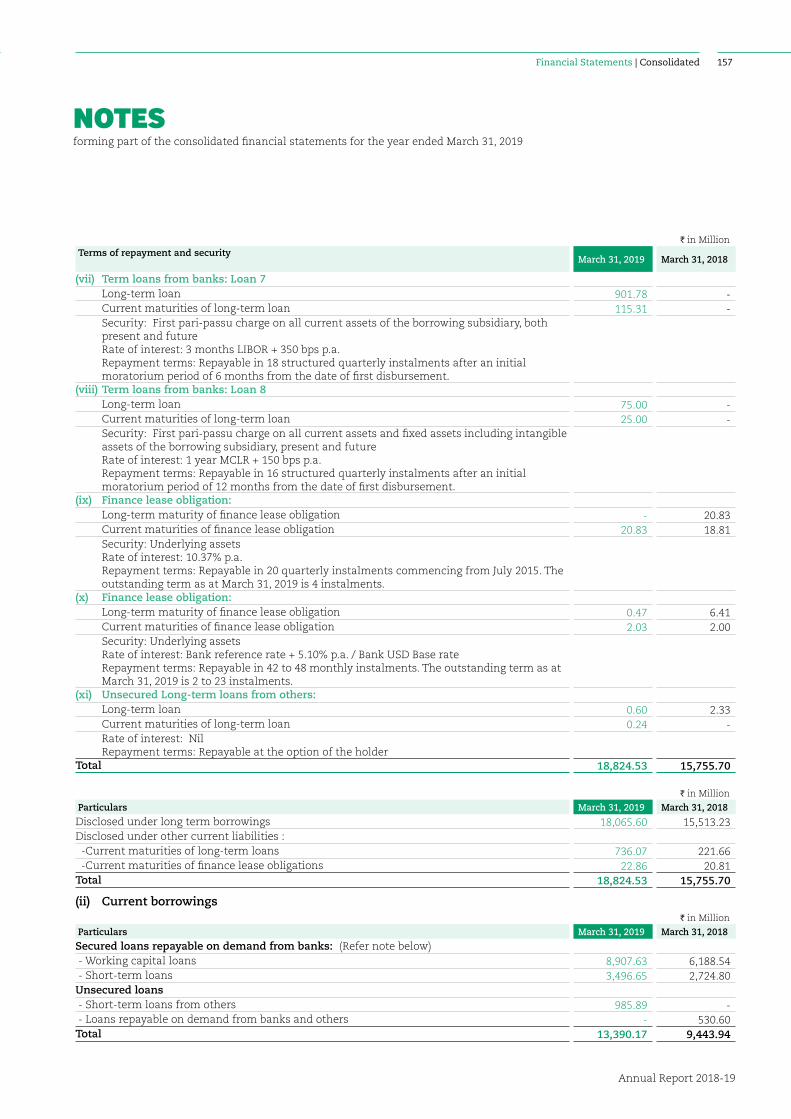
NOTESforming part of the consolidated financial statements for the year ended March 31, 2019
Annual Report 2018-19
157Financial Statements | Consolidated
I in MillionTerms of repayment and security
March 31, 2019 March 31, 2018
(vii) Term loans from banks: Loan 7 Long-term loan 901.78 - Current maturities of long-term loan 115.31 - Security: First pari-passu charge on all current assets of the borrowing subsidiary, both
present and future Rate of interest: 3 months LIBOR + 350 bps p.a. Repayment terms: Repayable in 18 structured quarterly instalments after an initial moratorium period of 6 months from the date of first disbursement.
(viii) Term loans from banks: Loan 8 Long-term loan 75.00 - Current maturities of long-term loan 25.00 - Security: First pari-passu charge on all current assets and fixed assets including intangible
assets of the borrowing subsidiary, present and future Rate of interest: 1 year MCLR + 150 bps p.a. Repayment terms: Repayable in 16 structured quarterly instalments after an initial moratorium period of 12 months from the date of first disbursement.
(ix) Finance lease obligation: Long-term maturity of finance lease obligation - 20.83 Current maturities of finance lease obligation 20.83 18.81 Security: Underlying assets
Rate of interest: 10.37% p.a. Repayment terms: Repayable in 20 quarterly instalments commencing from July 2015. The outstanding term as at March 31, 2019 is 4 instalments.
(x) Finance lease obligation: Long-term maturity of finance lease obligation 0.47 6.41 Current maturities of finance lease obligation 2.03 2.00 Security: Underlying assets
Rate of interest: Bank reference rate + 5.10% p.a. / Bank USD Base rate Repayment terms: Repayable in 42 to 48 monthly instalments. The outstanding term as at March 31, 2019 is 2 to 23 instalments.
(xi) Unsecured Long-term loans from others: Long-term loan 0.60 2.33 Current maturities of long-term loan 0.24 - Rate of interest: Nil
Repayment terms: Repayable at the option of the holderTotal 18,824.53 15,755.70
I in Million
Particulars March 31, 2019 March 31, 2018
Disclosed under long term borrowings 18,065.60 15,513.23 Disclosed under other current liabilities : -Current maturities of long-term loans 736.07 221.66 -Current maturities of finance lease obligations 22.86 20.81 Total 18,824.53 15,755.70
(ii) Current borrowingsI in Million
Particulars March 31, 2019 March 31, 2018
Secured loans repayable on demand from banks: (Refer note below) - Working capital loans 8,907.63 6,188.54 - Short-term loans 3,496.65 2,724.80 Unsecured loans - Short-term loans from others 985.89 - - Loans repayable on demand from banks and others - 530.60 Total 13,390.17 9,443.94
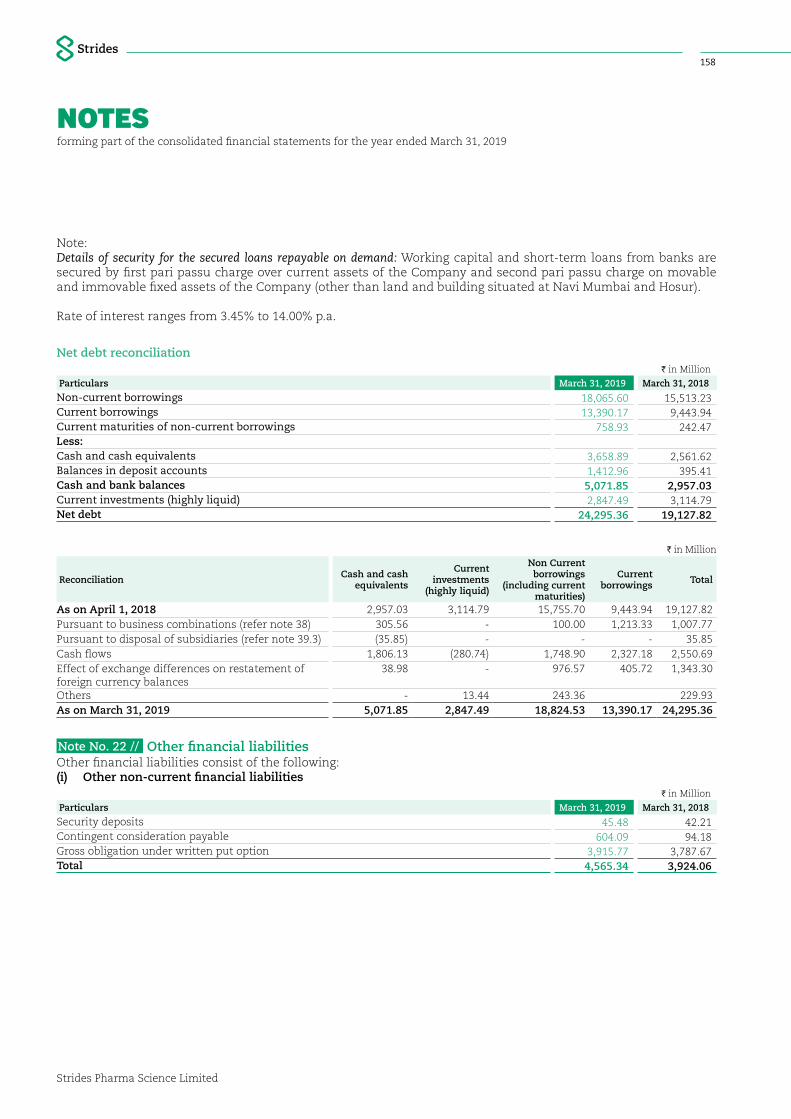
NOTESforming part of the consolidated financial statements for the year ended March 31, 2019
Strides Pharma Science Limited
158
Note:Details of security for the secured loans repayable on demand: Working capital and short-term loans from banks are secured by first pari passu charge over current assets of the Company and second pari passu charge on movable and immovable fixed assets of the Company (other than land and building situated at Navi Mumbai and Hosur).
Rate of interest ranges from 3.45% to 14.00% p.a.
Net debt reconciliationI in Million
Particulars March 31, 2019 March 31, 2018
Non-current borrowings 18,065.60 15,513.23 Current borrowings 13,390.17 9,443.94 Current maturities of non-current borrowings 758.93 242.47 Less:Cash and cash equivalents 3,658.89 2,561.62 Balances in deposit accounts 1,412.96 395.41 Cash and bank balances 5,071.85 2,957.03 Current investments (highly liquid) 2,847.49 3,114.79 Net debt 24,295.36 19,127.82
I in Million
Reconciliation Cash and cash equivalents
Current investments
(highly liquid)
Non Current borrowings
(including current maturities)
Current borrowings Total
As on April 1, 2018 2,957.03 3,114.79 15,755.70 9,443.94 19,127.82 Pursuant to business combinations (refer note 38) 305.56 - 100.00 1,213.33 1,007.77 Pursuant to disposal of subsidiaries (refer note 39.3) (35.85) - - - 35.85 Cash flows 1,806.13 (280.74) 1,748.90 2,327.18 2,550.69 Effect of exchange differences on restatement of foreign currency balances
38.98 - 976.57 405.72 1,343.30
Others - 13.44 243.36 229.93 As on March 31, 2019 5,071.85 2,847.49 18,824.53 13,390.17 24,295.36
Note No. 22 // Other financial liabilitiesOther financial liabilities consist of the following:(i) Other non-current financial liabilities
I in Million
Particulars March 31, 2019 March 31, 2018
Security deposits 45.48 42.21 Contingent consideration payable 604.09 94.18 Gross obligation under written put option 3,915.77 3,787.67 Total 4,565.34 3,924.06
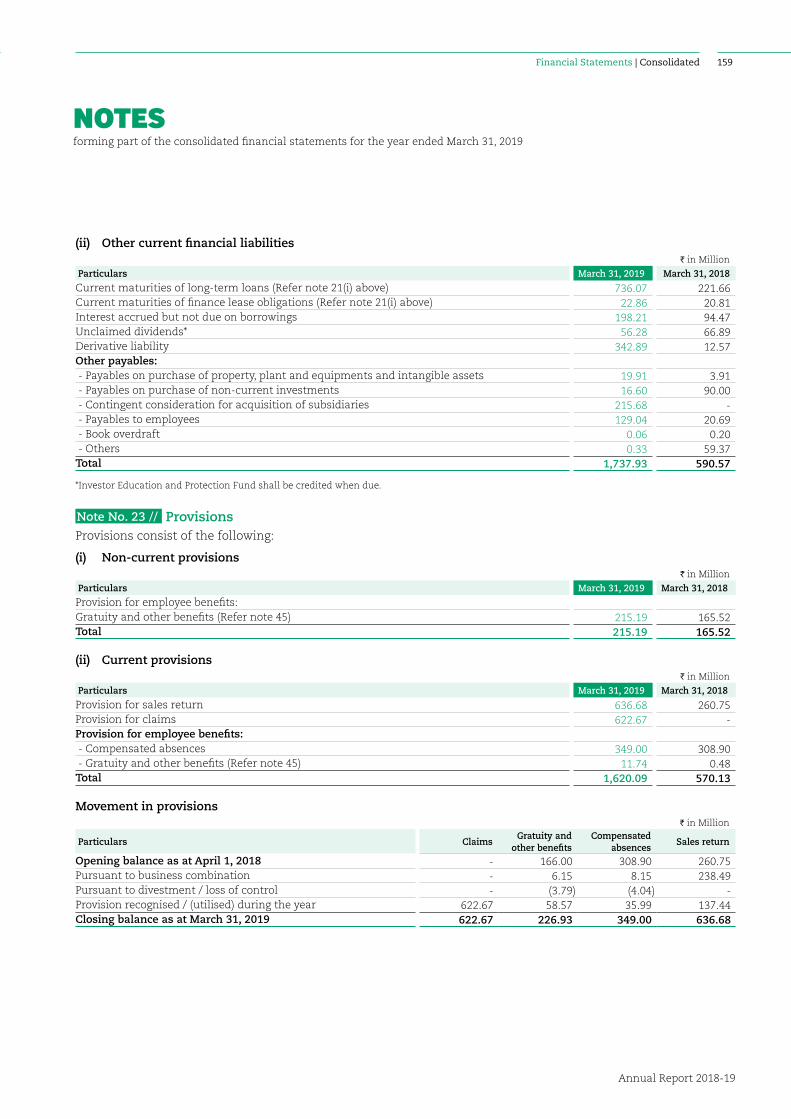
NOTESforming part of the consolidated financial statements for the year ended March 31, 2019
Annual Report 2018-19
159Financial Statements | Consolidated
(ii) Other current financial liabilitiesI in Million
Particulars March 31, 2019 March 31, 2018
Current maturities of long-term loans (Refer note 21(i) above) 736.07 221.66 Current maturities of finance lease obligations (Refer note 21(i) above) 22.86 20.81 Interest accrued but not due on borrowings 198.21 94.47 Unclaimed dividends* 56.28 66.89 Derivative liability 342.89 12.57 Other payables: - Payables on purchase of property, plant and equipments and intangible assets 19.91 3.91 - Payables on purchase of non-current investments 16.60 90.00 - Contingent consideration for acquisition of subsidiaries 215.68 - - Payables to employees 129.04 20.69 - Book overdraft 0.06 0.20 - Others 0.33 59.37 Total 1,737.93 590.57
*Investor Education and Protection Fund shall be credited when due.
Note No. 23 // ProvisionsProvisions consist of the following:
(i) Non-current provisions I in Million
Particulars March 31, 2019 March 31, 2018
Provision for employee benefits: Gratuity and other benefits (Refer note 45) 215.19 165.52 Total 215.19 165.52
(ii) Current provisions I in Million
Particulars March 31, 2019 March 31, 2018
Provision for sales return 636.68 260.75 Provision for claims 622.67 - Provision for employee benefits: - Compensated absences 349.00 308.90 - Gratuity and other benefits (Refer note 45) 11.74 0.48 Total 1,620.09 570.13
Movement in provisionsI in Million
Particulars ClaimsGratuity and
other benefitsCompensated
absencesSales return
Opening balance as at April 1, 2018 - 166.00 308.90 260.75 Pursuant to business combination - 6.15 8.15 238.49 Pursuant to divestment / loss of control - (3.79) (4.04) - Provision recognised / (utilised) during the year 622.67 58.57 35.99 137.44 Closing balance as at March 31, 2019 622.67 226.93 349.00 636.68

NOTESforming part of the consolidated financial statements for the year ended March 31, 2019
Strides Pharma Science Limited
160
Note No. 24 // Other liabilities Other liabilities consist of the following;
(i) Other non-current liabilitiesI in Million
Particulars March 31, 2019 March 31, 2018
Asset retirement obligation 13.61 12.41 Prepaid rent liability 6.38 6.57 Lease equalisation liability 83.68 77.28 Total 103.67 96.26
(ii) Other current liabilitiesI in Million
Particulars March 31, 2019 March 31, 2018
Other payables: - Advances from customers 438.47 428.30 - Advance for sale of property, plant and equipment 50.17 - - Statutory liabilities 271.16 249.61 Total 759.80 677.91
Note No. 25 // Trade payablesI in Million
Particulars March 31, 2019 March 31, 2018
Total outstanding dues of micro enterprises and small enterprises 57.36 44.67 Total outstanding dues of creditors other than micro and small enterprises* 8,884.55 7,076.02 Total 8,941.91 7,120.69
* includes dues to related party as referred in note 49.
(i) Disclosure required under Section 22 of the Micro, Small and Medium Enterprises Development Act, 2006 There are no material dues owed by the Group to Micro and Small enterprises, which are outstanding for more
than 45 days during the year and as at March 31, 2018. This information as required under the Micro, Small and Medium Enterprises Development Act, 2006 has been determined to the extent such parties have been identified on the basis of information available with the Group and has been relied upon by the auditors.
I in Million
Particulars March 31, 2019 March 31, 2018
(i) The principal amount and the interest due thereon remaining unpaid to any supplier as at the end of each year
- Principal amount due to micro and small enterprises 57.36 44.67 - Interest due on the above - - (ii) The amount of interest paid by the buyer in terms of section 16 of the MSMED Act, 2006
along with the amounts of the payment made to the supplier beyond the appointed day during each accounting year.
- -
(iii) The amount of interest due and payable for the period of delay in making payment (which has been paid but beyond appointed day during the year) but without adding the interest specified under the MSMED Act, 2006
- -
(iv) The amount of interest accrued and remaining un-paid at the end of each accounting year. - - (v) The amount of further interest remaining due and payable even in the succeeding years,
until such date when the interest dues as above are actually paid to the small enterprise for the purposes of disallowance as a deductible expenditure under the MSMED Act, 2006
- -
The above disclosures are provided by the Group based on the information available with the Group in respect of the registration status of its vendors/suppliers.
All trade payables are current. The Group's exposure to the currency and liquidity risks related to trade payables is disclosed in note no 51.
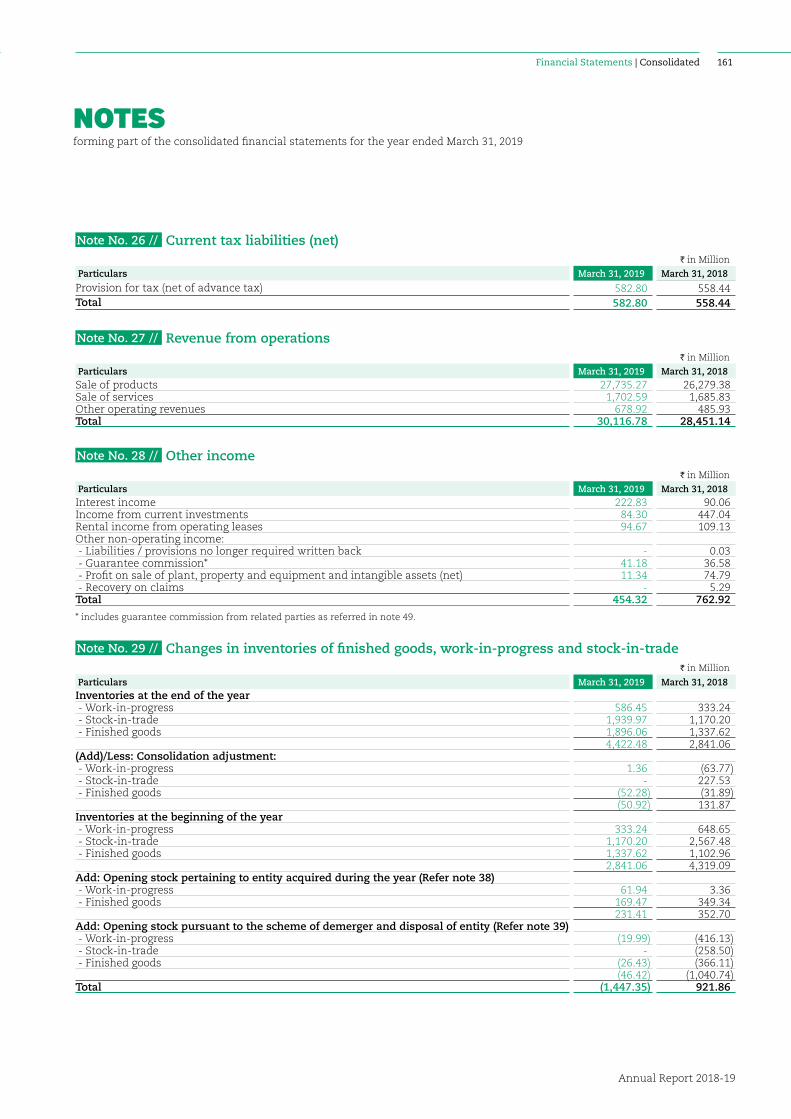
NOTESforming part of the consolidated financial statements for the year ended March 31, 2019
Annual Report 2018-19
161Financial Statements | Consolidated
Note No. 26 // Current tax liabilities (net)I in Million
Particulars March 31, 2019 March 31, 2018
Provision for tax (net of advance tax) 582.80 558.44 Total 582.80 558.44
Note No. 27 // Revenue from operationsI in Million
Particulars March 31, 2019 March 31, 2018Sale of products 27,735.27 26,279.38 Sale of services 1,702.59 1,685.83 Other operating revenues 678.92 485.93 Total 30,116.78 28,451.14
Note No. 28 // Other incomeI in Million
Particulars March 31, 2019 March 31, 2018Interest income 222.83 90.06 Income from current investments 84.30 447.04 Rental income from operating leases 94.67 109.13 Other non-operating income: - Liabilities / provisions no longer required written back - 0.03 - Guarantee commission* 41.18 36.58 - Profit on sale of plant, property and equipment and intangible assets (net) 11.34 74.79 - Recovery on claims - 5.29 Total 454.32 762.92
* includes guarantee commission from related parties as referred in note 49.
Note No. 29 // Changes in inventories of finished goods, work-in-progress and stock-in-tradeI in Million
Particulars March 31, 2019 March 31, 2018Inventories at the end of the year - Work-in-progress 586.45 333.24 - Stock-in-trade 1,939.97 1,170.20 - Finished goods 1,896.06 1,337.62
4,422.48 2,841.06 (Add)/Less: Consolidation adjustment: - Work-in-progress 1.36 (63.77) - Stock-in-trade - 227.53 - Finished goods (52.28) (31.89)
(50.92) 131.87 Inventories at the beginning of the year - Work-in-progress 333.24 648.65 - Stock-in-trade 1,170.20 2,567.48 - Finished goods 1,337.62 1,102.96
2,841.06 4,319.09 Add: Opening stock pertaining to entity acquired during the year (Refer note 38) - Work-in-progress 61.94 3.36 - Finished goods 169.47 349.34
231.41 352.70 Add: Opening stock pursuant to the scheme of demerger and disposal of entity (Refer note 39) - Work-in-progress (19.99) (416.13) - Stock-in-trade - (258.50) - Finished goods (26.43) (366.11)
(46.42) (1,040.74)Total (1,447.35) 921.86

NOTESforming part of the consolidated financial statements for the year ended March 31, 2019
Strides Pharma Science Limited
162
Note No. 30 // Employee benefits expenseI in Million
Particulars March 31, 2019 March 31, 2018Salaries, wages and bonus 3,827.40 3,667.21 Contribution to provident and other funds (Refer note 45) 297.70 323.97 Share based compensation expense (Refer note 44) 8.97 22.13 Staff welfare expenses 291.77 327.20 Total 4,425.84 4,340.51
Note No. 31 // Finance costsI in Million
Particulars March 31, 2019 March 31, 2018Interest expense on: - Borrowings 1,647.50 1,375.65 - Delayed payment of income tax - 0.03 - Discounting of deposits 3.19 2.46 Other finance costs 402.68 584.29 Total 2,053.37 1,962.43
Note No. 32 // Depreciation and amortisation expenseI in Million
Particulars March 31, 2019 March 31, 2018Depreciation on plant, property and equipments (Refer note 4) 783.88 1,017.11 Depreciation on investment property (Refer note 5) 46.02 42.23 Amortisation on other intangible asset (Refer note 7) 888.59 879.92 Amount charged to the statement of profit and loss: 1,718.49 1,939.26 - under continuing operations 1,718.49 1,540.35 - under discontinued operations - 398.91
Note No. 33 // Other expensesI in Million
Particulars March 31, 2019 March 31, 2018Subcontracting charges 281.74 206.19 Consumption of stores and spares 358.83 416.96 Power and fuel 491.43 496.93 Water 55.24 16.35 Rent including lease rentals (Refer note 46) 232.07 216.59 Repairs and maintenance: - Buildings 31.03 46.12 - Machinery 293.49 223.11 - Others 205.28 228.05 Insurance 100.88 113.02 Rates and taxes 487.33 335.47 Communication expense 104.84 110.08 Travelling and conveyance 237.65 289.45 Printing and stationery 47.31 47.25 Carriage, freight and forwarding 1,124.69 1,236.22 Business promotion 490.70 777.22 Royalty expenses 21.25 39.22 Sales commission 116.69 75.06 Failure to Supply 148.83 - Donations and contributions 7.11 31.05 Expenditure on corporate social responsibility 4.27 6.17 Legal and professional fees (Refer note (i) below) 856.60 831.96 Provision for doubtful debts (including bad debt written off) 57.95 14.14 Bio-study expenses 393.97 260.09 Miscellaneous expenses 219.75 282.77 Total 6,368.93 6,299.47
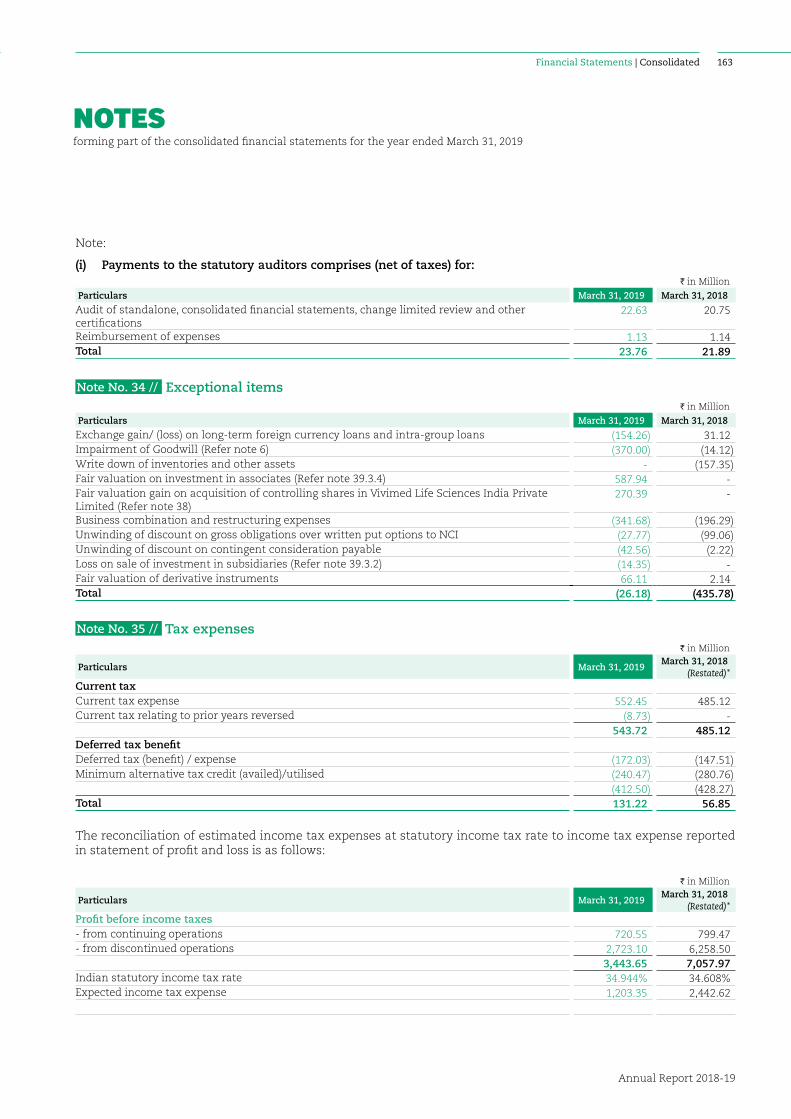
NOTESforming part of the consolidated financial statements for the year ended March 31, 2019
Annual Report 2018-19
163Financial Statements | Consolidated
Note:
(i) Payments to the statutory auditors comprises (net of taxes) for:I in Million
Particulars March 31, 2019 March 31, 2018
Audit of standalone, consolidated financial statements, change limited review and other certifications
22.63 20.75
Reimbursement of expenses 1.13 1.14Total 23.76 21.89
Note No. 34 // Exceptional itemsI in Million
Particulars March 31, 2019 March 31, 2018
Exchange gain/ (loss) on long-term foreign currency loans and intra-group loans (154.26) 31.12 Impairment of Goodwill (Refer note 6) (370.00) (14.12)Write down of inventories and other assets - (157.35)Fair valuation on investment in associates (Refer note 39.3.4) 587.94 - Fair valuation gain on acquisition of controlling shares in Vivimed Life Sciences India Private Limited (Refer note 38)
270.39 -
Business combination and restructuring expenses (341.68) (196.29)Unwinding of discount on gross obligations over written put options to NCI (27.77) (99.06)Unwinding of discount on contingent consideration payable (42.56) (2.22)Loss on sale of investment in subsidiaries (Refer note 39.3.2) (14.35) - Fair valuation of derivative instruments 66.11 2.14 Total (26.18) (435.78)
Note No. 35 // Tax expensesI in Million
Particulars March 31, 2019March 31, 2018
(Restated)*Current taxCurrent tax expense 552.45 485.12 Current tax relating to prior years reversed (8.73) -
543.72 485.12 Deferred tax benefitDeferred tax (benefit) / expense (172.03) (147.51)Minimum alternative tax credit (availed)/utilised (240.47) (280.76)
(412.50) (428.27)Total 131.22 56.85
The reconciliation of estimated income tax expenses at statutory income tax rate to income tax expense reported in statement of profit and loss is as follows:
I in Million
Particulars March 31, 2019March 31, 2018
(Restated)*Profit before income taxes - from continuing operations 720.55 799.47 - from discontinued operations 2,723.10 6,258.50
3,443.65 7,057.97 Indian statutory income tax rate 34.944% 34.608%Expected income tax expense 1,203.35 2,442.62
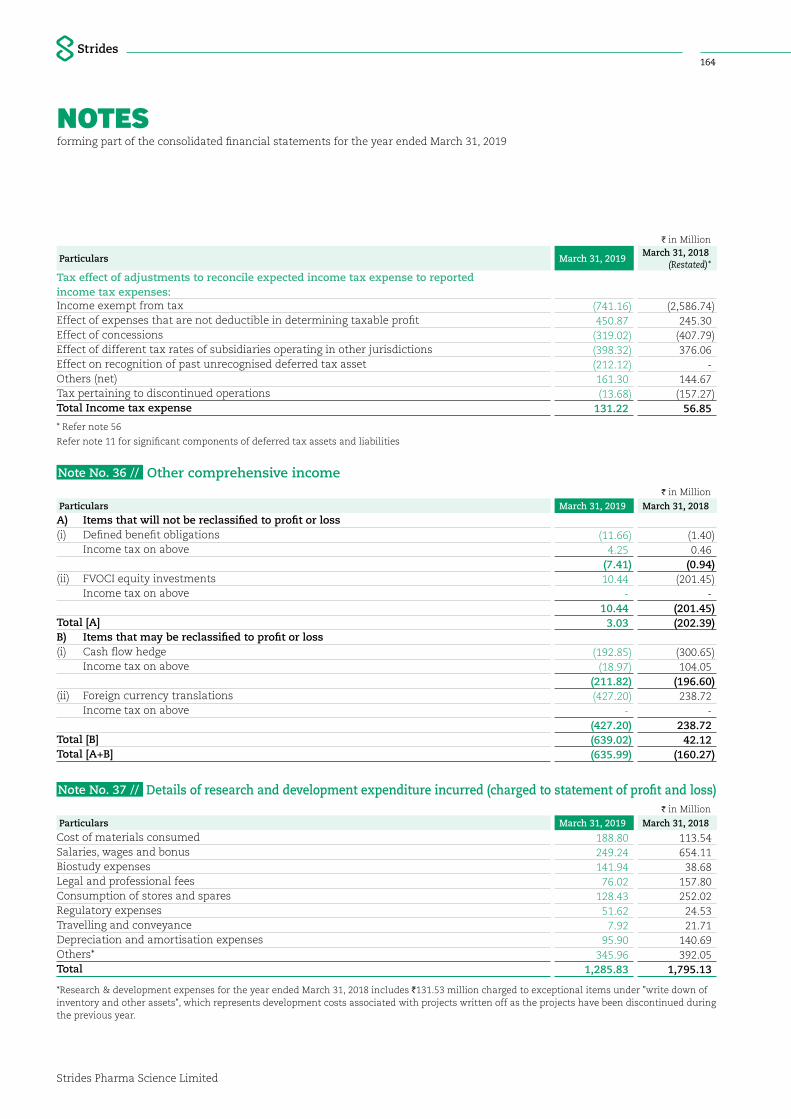
NOTESforming part of the consolidated financial statements for the year ended March 31, 2019
Strides Pharma Science Limited
164
I in Million
Particulars March 31, 2019March 31, 2018
(Restated)*Tax effect of adjustments to reconcile expected income tax expense to reported income tax expenses:Income exempt from tax (741.16) (2,586.74)Effect of expenses that are not deductible in determining taxable profit 450.87 245.30 Effect of concessions (319.02) (407.79)Effect of different tax rates of subsidiaries operating in other jurisdictions (398.32) 376.06 Effect on recognition of past unrecognised deferred tax asset (212.12) -Others (net) 161.30 144.67 Tax pertaining to discontinued operations (13.68) (157.27)Total Income tax expense 131.22 56.85
* Refer note 56
Refer note 11 for significant components of deferred tax assets and liabilities
Note No. 36 // Other comprehensive incomeI in Million
Particulars March 31, 2019 March 31, 2018
A) Items that will not be reclassified to profit or loss(i) Defined benefit obligations (11.66) (1.40) Income tax on above 4.25 0.46
(7.41) (0.94)(ii) FVOCI equity investments 10.44 (201.45) Income tax on above - -
10.44 (201.45)Total [A] 3.03 (202.39)B) Items that may be reclassified to profit or loss(i) Cash flow hedge (192.85) (300.65) Income tax on above (18.97) 104.05
(211.82) (196.60)(ii) Foreign currency translations (427.20) 238.72 Income tax on above - -
(427.20) 238.72 Total [B] (639.02) 42.12 Total [A+B] (635.99) (160.27)
Note No. 37 // Details of research and development expenditure incurred (charged to statement of profit and loss)I in Million
Particulars March 31, 2019 March 31, 2018
Cost of materials consumed 188.80 113.54 Salaries, wages and bonus 249.24 654.11 Biostudy expenses 141.94 38.68 Legal and professional fees 76.02 157.80 Consumption of stores and spares 128.43 252.02 Regulatory expenses 51.62 24.53 Travelling and conveyance 7.92 21.71 Depreciation and amortisation expenses 95.90 140.69 Others* 345.96 392.05 Total 1,285.83 1,795.13
*Research & development expenses for the year ended March 31, 2018 includes `131.53 million charged to exceptional items under "write down of inventory and other assets", which represents development costs associated with projects written off as the projects have been discontinued during the previous year.
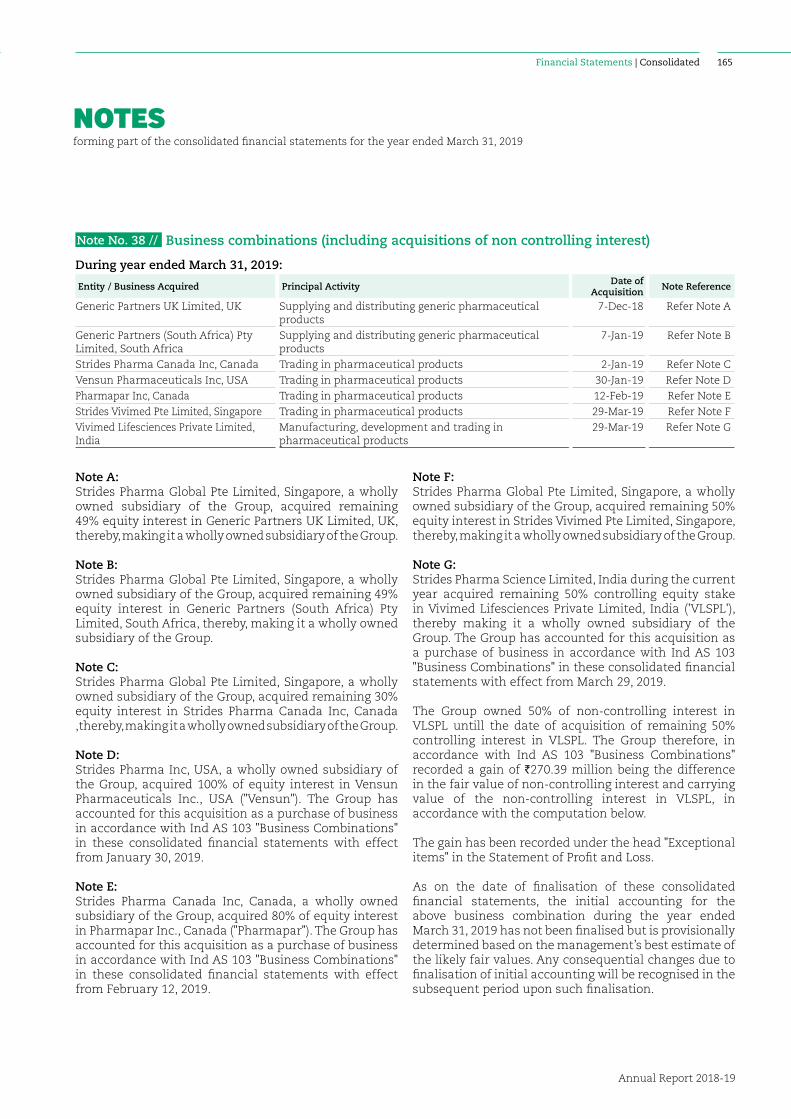
NOTESforming part of the consolidated financial statements for the year ended March 31, 2019
Annual Report 2018-19
165Financial Statements | Consolidated
Note No. 38 // Business combinations (including acquisitions of non controlling interest)
During year ended March 31, 2019:
Entity / Business Acquired Principal Activity Date of Acquisition Note Reference
Generic Partners UK Limited, UK Supplying and distributing generic pharmaceutical products
7-Dec-18 Refer Note A
Generic Partners (South Africa) Pty Limited, South Africa
Supplying and distributing generic pharmaceutical products
7-Jan-19 Refer Note B
Strides Pharma Canada Inc, Canada Trading in pharmaceutical products 2-Jan-19 Refer Note C
Vensun Pharmaceuticals Inc, USA Trading in pharmaceutical products 30-Jan-19 Refer Note D
Pharmapar Inc, Canada Trading in pharmaceutical products 12-Feb-19 Refer Note E
Strides Vivimed Pte Limited, Singapore Trading in pharmaceutical products 29-Mar-19 Refer Note F
Vivimed Lifesciences Private Limited, India
Manufacturing, development and trading in pharmaceutical products
29-Mar-19 Refer Note G
Note A:Strides Pharma Global Pte Limited, Singapore, a wholly owned subsidiary of the Group, acquired remaining 49% equity interest in Generic Partners UK Limited, UK, thereby, making it a wholly owned subsidiary of the Group.
Note B:Strides Pharma Global Pte Limited, Singapore, a wholly owned subsidiary of the Group, acquired remaining 49% equity interest in Generic Partners (South Africa) Pty Limited, South Africa, thereby, making it a wholly owned subsidiary of the Group.
Note C:Strides Pharma Global Pte Limited, Singapore, a wholly owned subsidiary of the Group, acquired remaining 30% equity interest in Strides Pharma Canada Inc, Canada ,thereby, making it a wholly owned subsidiary of the Group.
Note D:Strides Pharma Inc, USA, a wholly owned subsidiary of the Group, acquired 100% of equity interest in Vensun Pharmaceuticals Inc., USA ("Vensun"). The Group has accounted for this acquisition as a purchase of business in accordance with Ind AS 103 "Business Combinations" in these consolidated financial statements with effect from January 30, 2019.
Note E:Strides Pharma Canada Inc, Canada, a wholly owned subsidiary of the Group, acquired 80% of equity interest in Pharmapar Inc., Canada ("Pharmapar"). The Group has accounted for this acquisition as a purchase of business in accordance with Ind AS 103 "Business Combinations" in these consolidated financial statements with effect from February 12, 2019.
Note F:Strides Pharma Global Pte Limited, Singapore, a wholly owned subsidiary of the Group, acquired remaining 50% equity interest in Strides Vivimed Pte Limited, Singapore, thereby, making it a wholly owned subsidiary of the Group.
Note G:Strides Pharma Science Limited, India during the current year acquired remaining 50% controlling equity stake in Vivimed Lifesciences Private Limited, India ('VLSPL'), thereby making it a wholly owned subsidiary of the Group. The Group has accounted for this acquisition as a purchase of business in accordance with Ind AS 103 "Business Combinations" in these consolidated financial statements with effect from March 29, 2019.
The Group owned 50% of non-controlling interest in VLSPL untill the date of acquisition of remaining 50% controlling interest in VLSPL. The Group therefore, in accordance with Ind AS 103 "Business Combinations" recorded a gain of `270.39 million being the difference in the fair value of non-controlling interest and carrying value of the non-controlling interest in VLSPL, in accordance with the computation below.
The gain has been recorded under the head "Exceptional items" in the Statement of Profit and Loss.
As on the date of finalisation of these consolidated financial statements, the initial accounting for the above business combination during the year ended March 31, 2019 has not been finalised but is provisionally determined based on the management’s best estimate of the likely fair values. Any consequential changes due to finalisation of initial accounting will be recognised in the subsequent period upon such finalisation.
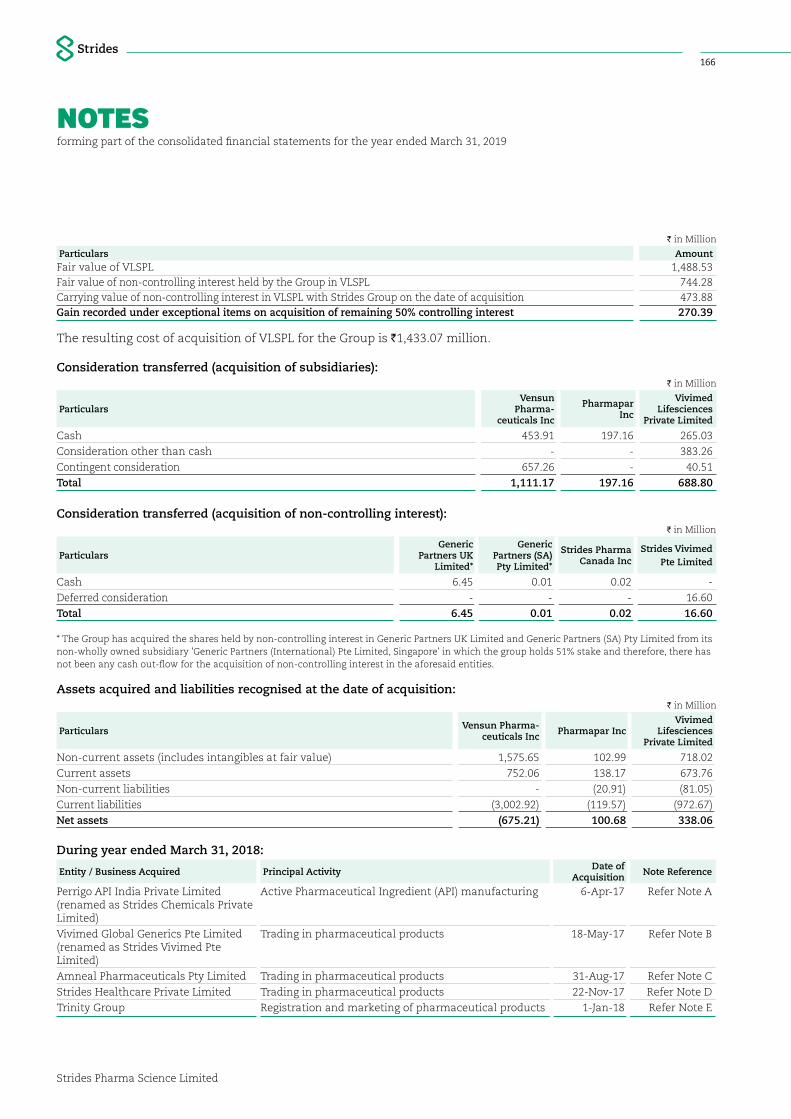
NOTESforming part of the consolidated financial statements for the year ended March 31, 2019
Strides Pharma Science Limited
166
I in Million
Particulars AmountFair value of VLSPL 1,488.53 Fair value of non-controlling interest held by the Group in VLSPL 744.28 Carrying value of non-controlling interest in VLSPL with Strides Group on the date of acquisition 473.88 Gain recorded under exceptional items on acquisition of remaining 50% controlling interest 270.39
The resulting cost of acquisition of VLSPL for the Group is `1,433.07 million.
Consideration transferred (acquisition of subsidiaries):I in Million
ParticularsVensun
Pharma-ceuticals Inc
Pharmapar Inc
Vivimed Lifesciences
Private Limited
Cash 453.91 197.16 265.03
Consideration other than cash - - 383.26
Contingent consideration 657.26 - 40.51
Total 1,111.17 197.16 688.80
Consideration transferred (acquisition of non-controlling interest):I in Million
ParticularsGeneric
Partners UK Limited*
Generic Partners (SA) Pty Limited*
Strides Pharma Canada Inc
Strides Vivimed Pte Limited
Cash 6.45 0.01 0.02 -
Deferred consideration - - - 16.60
Total 6.45 0.01 0.02 16.60
* The Group has acquired the shares held by non-controlling interest in Generic Partners UK Limited and Generic Partners (SA) Pty Limited from its non-wholly owned subsidiary 'Generic Partners (International) Pte Limited, Singapore' in which the group holds 51% stake and therefore, there has not been any cash out-flow for the acquisition of non-controlling interest in the aforesaid entities.
Assets acquired and liabilities recognised at the date of acquisition:I in Million
Particulars Vensun Pharma-ceuticals Inc Pharmapar Inc
Vivimed Lifesciences
Private Limited
Non-current assets (includes intangibles at fair value) 1,575.65 102.99 718.02
Current assets 752.06 138.17 673.76
Non-current liabilities - (20.91) (81.05)
Current liabilities (3,002.92) (119.57) (972.67)
Net assets (675.21) 100.68 338.06
During year ended March 31, 2018:
Entity / Business Acquired Principal Activity Date of Acquisition Note Reference
Perrigo API India Private Limited (renamed as Strides Chemicals Private Limited)
Active Pharmaceutical Ingredient (API) manufacturing 6-Apr-17 Refer Note A
Vivimed Global Generics Pte Limited (renamed as Strides Vivimed Pte Limited)
Trading in pharmaceutical products 18-May-17 Refer Note B
Amneal Pharmaceuticals Pty Limited Trading in pharmaceutical products 31-Aug-17 Refer Note C
Strides Healthcare Private Limited Trading in pharmaceutical products 22-Nov-17 Refer Note D
Trinity Group Registration and marketing of pharmaceutical products 1-Jan-18 Refer Note E
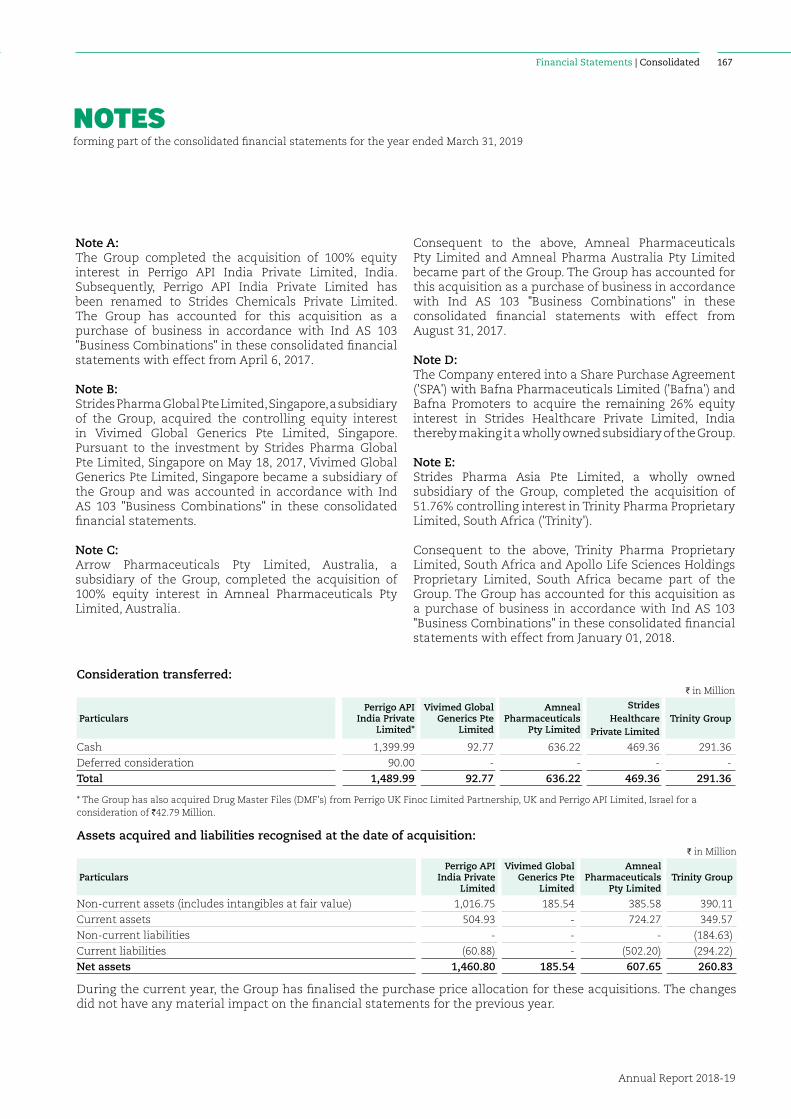
NOTESforming part of the consolidated financial statements for the year ended March 31, 2019
Annual Report 2018-19
167Financial Statements | Consolidated
Note A:The Group completed the acquisition of 100% equity interest in Perrigo API India Private Limited, India. Subsequently, Perrigo API India Private Limited has been renamed to Strides Chemicals Private Limited. The Group has accounted for this acquisition as a purchase of business in accordance with Ind AS 103 "Business Combinations" in these consolidated financial statements with effect from April 6, 2017.
Note B:Strides Pharma Global Pte Limited, Singapore, a subsidiary of the Group, acquired the controlling equity interest in Vivimed Global Generics Pte Limited, Singapore. Pursuant to the investment by Strides Pharma Global Pte Limited, Singapore on May 18, 2017, Vivimed Global Generics Pte Limited, Singapore became a subsidiary of the Group and was accounted in accordance with Ind AS 103 "Business Combinations" in these consolidated financial statements.
Note C:Arrow Pharmaceuticals Pty Limited, Australia, a subsidiary of the Group, completed the acquisition of 100% equity interest in Amneal Pharmaceuticals Pty Limited, Australia.
Consequent to the above, Amneal Pharmaceuticals Pty Limited and Amneal Pharma Australia Pty Limited became part of the Group. The Group has accounted for this acquisition as a purchase of business in accordance with Ind AS 103 "Business Combinations" in these consolidated financial statements with effect from August 31, 2017.
Note D:The Company entered into a Share Purchase Agreement ('SPA') with Bafna Pharmaceuticals Limited ('Bafna') and Bafna Promoters to acquire the remaining 26% equity interest in Strides Healthcare Private Limited, India thereby making it a wholly owned subsidiary of the Group.
Note E:Strides Pharma Asia Pte Limited, a wholly owned subsidiary of the Group, completed the acquisition of 51.76% controlling interest in Trinity Pharma Proprietary Limited, South Africa ('Trinity').
Consequent to the above, Trinity Pharma Proprietary Limited, South Africa and Apollo Life Sciences Holdings Proprietary Limited, South Africa became part of the Group. The Group has accounted for this acquisition as a purchase of business in accordance with Ind AS 103 "Business Combinations" in these consolidated financial statements with effect from January 01, 2018.
Consideration transferred:I in Million
ParticularsPerrigo API
India Private Limited*
Vivimed Global Generics Pte
Limited
Amneal Pharmaceuticals
Pty Limited
Strides Healthcare
Private LimitedTrinity Group
Cash 1,399.99 92.77 636.22 469.36 291.36
Deferred consideration 90.00 - - - -
Total 1,489.99 92.77 636.22 469.36 291.36
* The Group has also acquired Drug Master Files (DMF's) from Perrigo UK Finoc Limited Partnership, UK and Perrigo API Limited, Israel for a consideration of `42.79 Million.
Assets acquired and liabilities recognised at the date of acquisition:I in Million
ParticularsPerrigo API
India Private Limited
Vivimed Global Generics Pte
Limited
Amneal Pharmaceuticals
Pty LimitedTrinity Group
Non-current assets (includes intangibles at fair value) 1,016.75 185.54 385.58 390.11
Current assets 504.93 - 724.27 349.57
Non-current liabilities - - - (184.63)
Current liabilities (60.88) - (502.20) (294.22)
Net assets 1,460.80 185.54 607.65 260.83
During the current year, the Group has finalised the purchase price allocation for these acquisitions. The changes did not have any material impact on the financial statements for the previous year.
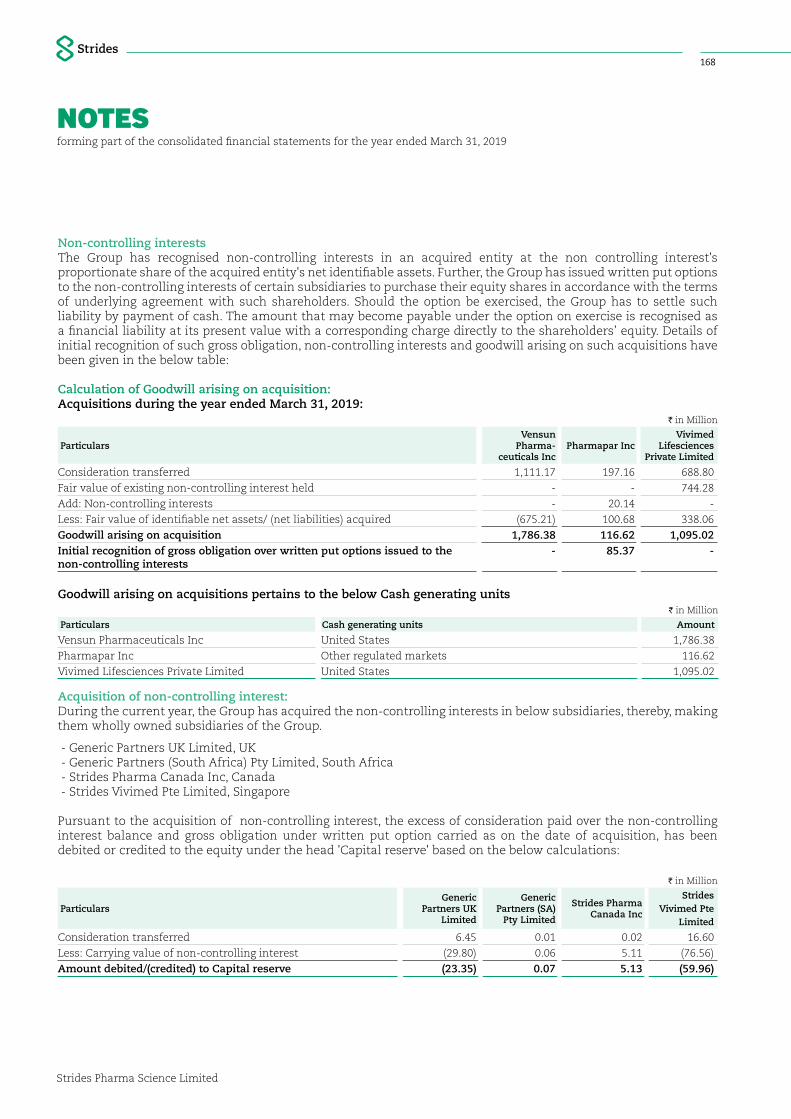
NOTESforming part of the consolidated financial statements for the year ended March 31, 2019
Strides Pharma Science Limited
168
Non-controlling interestsThe Group has recognised non-controlling interests in an acquired entity at the non controlling interest's proportionate share of the acquired entity's net identifiable assets. Further, the Group has issued written put options to the non-controlling interests of certain subsidiaries to purchase their equity shares in accordance with the terms of underlying agreement with such shareholders. Should the option be exercised, the Group has to settle such liability by payment of cash. The amount that may become payable under the option on exercise is recognised as a financial liability at its present value with a corresponding charge directly to the shareholders’ equity. Details of initial recognition of such gross obligation, non-controlling interests and goodwill arising on such acquisitions have been given in the below table:
Calculation of Goodwill arising on acquisition:Acquisitions during the year ended March 31, 2019:
I in Million
ParticularsVensun
Pharma-ceuticals Inc
Pharmapar IncVivimed
Lifesciences Private Limited
Consideration transferred 1,111.17 197.16 688.80
Fair value of existing non-controlling interest held - - 744.28
Add: Non-controlling interests - 20.14 -
Less: Fair value of identifiable net assets/ (net liabilities) acquired (675.21) 100.68 338.06
Goodwill arising on acquisition 1,786.38 116.62 1,095.02 Initial recognition of gross obligation over written put options issued to the non-controlling interests
- 85.37 -
Goodwill arising on acquisitions pertains to the below Cash generating units I in Million
Particulars Cash generating units Amount
Vensun Pharmaceuticals Inc United States 1,786.38
Pharmapar Inc Other regulated markets 116.62
Vivimed Lifesciences Private Limited United States 1,095.02
Acquisition of non-controlling interest:During the current year, the Group has acquired the non-controlling interests in below subsidiaries, thereby, making them wholly owned subsidiaries of the Group.
- Generic Partners UK Limited, UK - Generic Partners (South Africa) Pty Limited, South Africa - Strides Pharma Canada Inc, Canada - Strides Vivimed Pte Limited, Singapore
Pursuant to the acquisition of non-controlling interest, the excess of consideration paid over the non-controlling interest balance and gross obligation under written put option carried as on the date of acquisition, has been debited or credited to the equity under the head 'Capital reserve' based on the below calculations:
I in Million
ParticularsGeneric
Partners UK Limited
Generic Partners (SA)
Pty Limited
Strides Pharma Canada Inc
Strides Vivimed Pte
Limited
Consideration transferred 6.45 0.01 0.02 16.60
Less: Carrying value of non-controlling interest (29.80) 0.06 5.11 (76.56)
Amount debited/(credited) to Capital reserve (23.35) 0.07 5.13 (59.96)
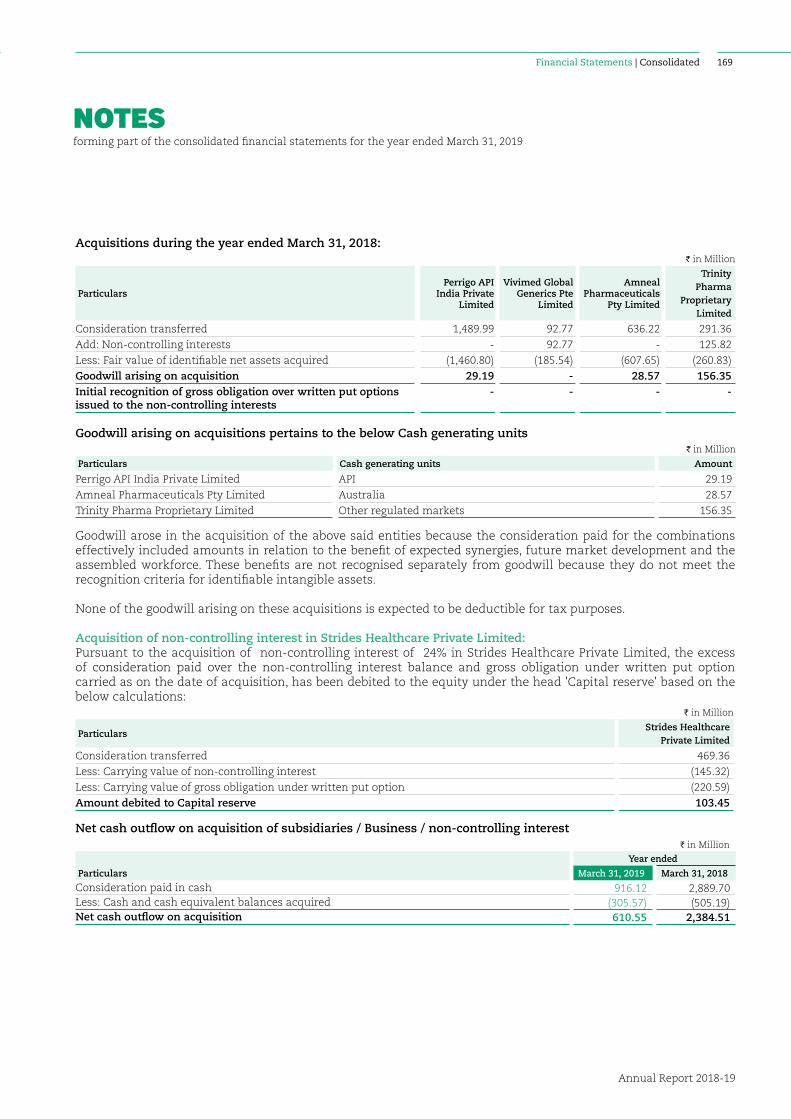
NOTESforming part of the consolidated financial statements for the year ended March 31, 2019
Annual Report 2018-19
169Financial Statements | Consolidated
Acquisitions during the year ended March 31, 2018:I in Million
ParticularsPerrigo API
India Private Limited
Vivimed Global Generics Pte
Limited
Amneal Pharmaceuticals
Pty Limited
Trinity Pharma
Proprietary Limited
Consideration transferred 1,489.99 92.77 636.22 291.36
Add: Non-controlling interests - 92.77 - 125.82
Less: Fair value of identifiable net assets acquired (1,460.80) (185.54) (607.65) (260.83)
Goodwill arising on acquisition 29.19 - 28.57 156.35 Initial recognition of gross obligation over written put options issued to the non-controlling interests
- - - -
Goodwill arising on acquisitions pertains to the below Cash generating unitsI in Million
Particulars Cash generating units Amount
Perrigo API India Private Limited API 29.19
Amneal Pharmaceuticals Pty Limited Australia 28.57
Trinity Pharma Proprietary Limited Other regulated markets 156.35
Goodwill arose in the acquisition of the above said entities because the consideration paid for the combinations effectively included amounts in relation to the benefit of expected synergies, future market development and the assembled workforce. These benefits are not recognised separately from goodwill because they do not meet the recognition criteria for identifiable intangible assets.
None of the goodwill arising on these acquisitions is expected to be deductible for tax purposes.
Acquisition of non-controlling interest in Strides Healthcare Private Limited:Pursuant to the acquisition of non-controlling interest of 24% in Strides Healthcare Private Limited, the excess of consideration paid over the non-controlling interest balance and gross obligation under written put option carried as on the date of acquisition, has been debited to the equity under the head 'Capital reserve' based on the below calculations:
I in Million
ParticularsStrides Healthcare
Private Limited
Consideration transferred 469.36
Less: Carrying value of non-controlling interest (145.32)
Less: Carrying value of gross obligation under written put option (220.59)
Amount debited to Capital reserve 103.45
Net cash outflow on acquisition of subsidiaries / Business / non-controlling interestI in Million
Year ended
Particulars March 31, 2019 March 31, 2018
Consideration paid in cash 916.12 2,889.70Less: Cash and cash equivalent balances acquired (305.57) (505.19)Net cash outflow on acquisition 610.55 2,384.51
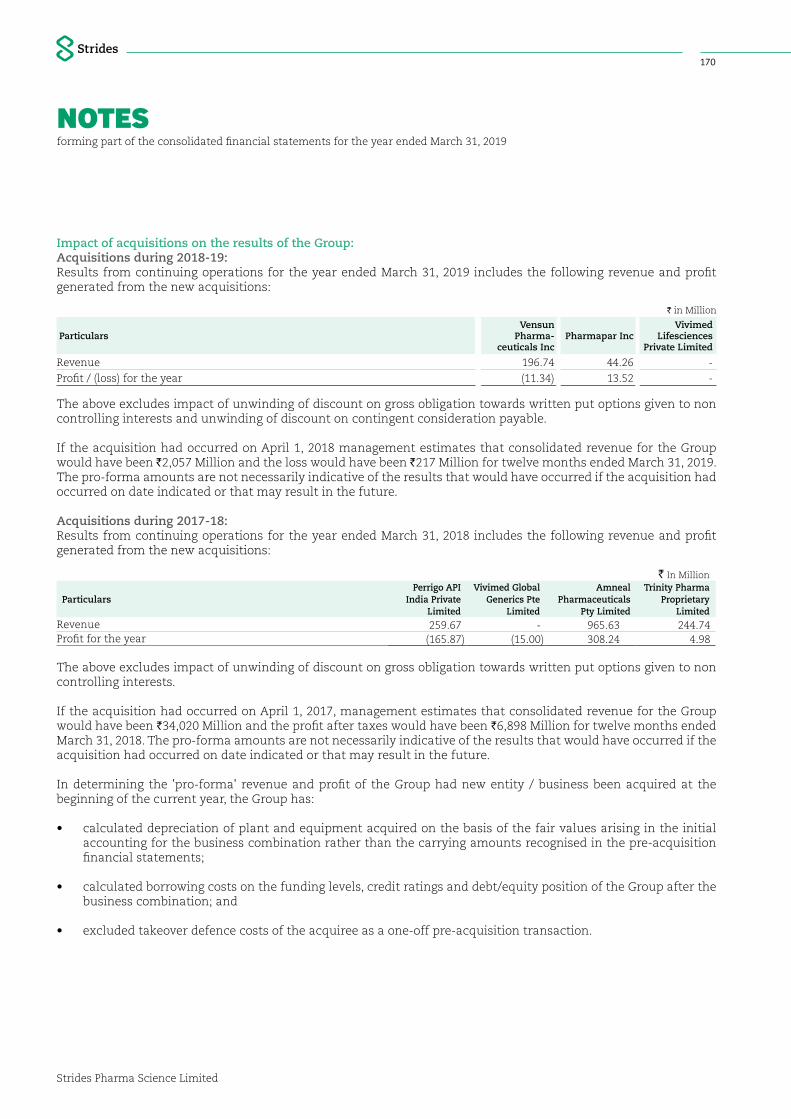
NOTESforming part of the consolidated financial statements for the year ended March 31, 2019
Strides Pharma Science Limited
170
Impact of acquisitions on the results of the Group: Acquisitions during 2018-19: Results from continuing operations for the year ended March 31, 2019 includes the following revenue and profit generated from the new acquisitions:
I in Million
ParticularsVensun
Pharma-ceuticals Inc
Pharmapar IncVivimed
Lifesciences Private Limited
Revenue 196.74 44.26 -
Profit / (loss) for the year (11.34) 13.52 -
The above excludes impact of unwinding of discount on gross obligation towards written put options given to non controlling interests and unwinding of discount on contingent consideration payable.
If the acquisition had occurred on April 1, 2018 management estimates that consolidated revenue for the Group would have been `2,057 Million and the loss would have been `217 Million for twelve months ended March 31, 2019. The pro-forma amounts are not necessarily indicative of the results that would have occurred if the acquisition had occurred on date indicated or that may result in the future.
Acquisitions during 2017-18:Results from continuing operations for the year ended March 31, 2018 includes the following revenue and profit generated from the new acquisitions:
` In Million
Particulars Perrigo API
India Private Limited
Vivimed Global Generics Pte
Limited
Amneal Pharmaceuticals
Pty Limited
Trinity Pharma Proprietary
LimitedRevenue 259.67 - 965.63 244.74 Profit for the year (165.87) (15.00) 308.24 4.98
The above excludes impact of unwinding of discount on gross obligation towards written put options given to non controlling interests.
If the acquisition had occurred on April 1, 2017, management estimates that consolidated revenue for the Group would have been `34,020 Million and the profit after taxes would have been `6,898 Million for twelve months ended March 31, 2018. The pro-forma amounts are not necessarily indicative of the results that would have occurred if the acquisition had occurred on date indicated or that may result in the future.
In determining the 'pro-forma' revenue and profit of the Group had new entity / business been acquired at the beginning of the current year, the Group has:
• calculated depreciation of plant and equipment acquired on the basis of the fair values arising in the initial accounting for the business combination rather than the carrying amounts recognised in the pre-acquisition financial statements;
• calculated borrowing costs on the funding levels, credit ratings and debt/equity position of the Group after the business combination; and
• excluded takeover defence costs of the acquiree as a one-off pre-acquisition transaction.

NOTESforming part of the consolidated financial statements for the year ended March 31, 2019
Annual Report 2018-19
171Financial Statements | Consolidated
Note No. 39 // Discontinued operations:The combined results of the discontinued operations of the businesses disposed-off as explained in Notes 39.1 to 39.3, are set out below. The comparative profit and cash flows from discontinued operations have been presented as if these operations were discontinued in the prior year as well.
I in Million
Particulars Reference Year ended
March 31, 2019 March 31, 2018
Revenue - 4,992.53 Other income - 12.40 Total revenue from discontinued operations (I) - 5,004.93 Depreciation and amortisation expense - 398.91 Other expenses charged-off to the Statement of Profit and Loss - 5,450.61 Total expenses from discontinued operations (II) - 5,849.52 Loss from discontinued operation (III = I - II) - (844.59)Gain / (loss) on disposal of:- pursuant to the scheme of demerger 39.1 - 6,885.08 - investments in entities manufacturing specialty products 39.2 2,738.74 (216.55)- Strides API Research Centre (SRC) 39.3.1 (47.01) - - India branded generics business 39.3.3 - 1,545.98 - pharma generics business in Africa 39.3.5 31.37 (1,111.42)Net gain / (loss) on disposal of businesses (IV) 2,723.10 7,103.09 Gain / (Loss) from discontinued operations before tax (V = III + IV) 2,723.10 6,258.50 Attributable income tax expense (VI) 13.68 157.27 Net gain / (loss) from discontinued operations after tax (V - VI) 2,709.42 6,101.23
Cash flows from discontinued operationsI in Million
Year ended
Particulars March 31, 2019 March 31, 2018
Net cash inflows/(outflows) from operating activities - (115.18)Net cash inflows/(outflows) from investing activities* 3,690.69 4,148.79 Net cash inflows/(outflows) from financing activities - 1,152.85Net cash inflows/(outflows) 3,690.69 5,186.46 * including cash flow on disposal of assets and liabilities of the discontinued operations.
39.1 Demerger:39.1.1 Demerger of Commodity API business: During the earlier year, the Board of Directors in their meeting held on March 20, 2017 had approved the proposal
to demerge the Commodity API Business, into Solara Active Pharma Sciences Limited (“Solara”), a wholly owned subsidiary of the Group.
As part of the Scheme of Arrangement (the 'Scheme') of demerger, the Human API business of SeQuent Scientific Limited (a promoter owned listed company) was also proposed to be carved out into Solara, providing critical size to this business.
The Scheme had an Appointed date of October 1, 2017.
The share entitlement ratio for the Scheme of demerger is as under:
1) For demerger of Commodity API business: 1 equity share of `10/- each of Solara for every 6 fully paid up equity shares of `10/- each held in Strides Shasun Limited.
2) For demerger of Human API business: 1 equity share of ̀ 10/- each of Solara for every 25 fully paid up equity shares of `2/- each held in SeQuent Scientific Limited.
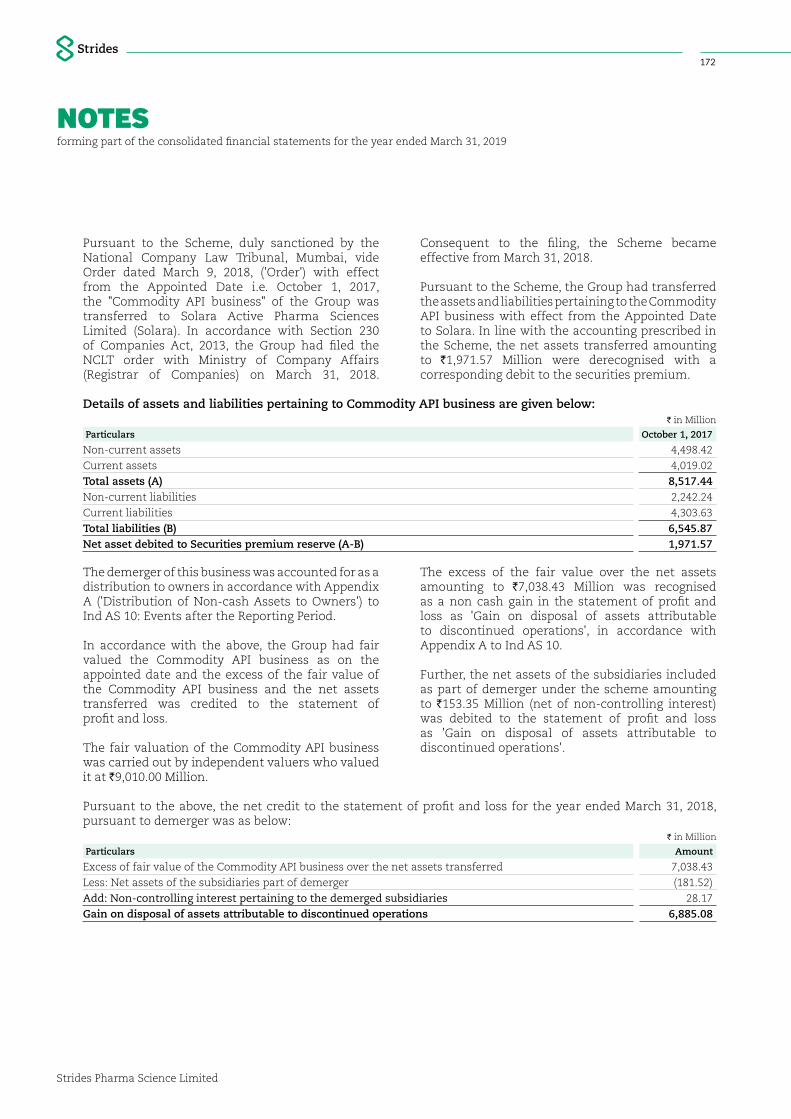
NOTESforming part of the consolidated financial statements for the year ended March 31, 2019
Strides Pharma Science Limited
172
Pursuant to the Scheme, duly sanctioned by the National Company Law Tribunal, Mumbai, vide Order dated March 9, 2018, ('Order') with effect from the Appointed Date i.e. October 1, 2017, the "Commodity API business" of the Group was transferred to Solara Active Pharma Sciences Limited (Solara). In accordance with Section 230 of Companies Act, 2013, the Group had filed the NCLT order with Ministry of Company Affairs (Registrar of Companies) on March 31, 2018.
Consequent to the filing, the Scheme became effective from March 31, 2018.
Pursuant to the Scheme, the Group had transferred the assets and liabilities pertaining to the Commodity API business with effect from the Appointed Date to Solara. In line with the accounting prescribed in the Scheme, the net assets transferred amounting to `1,971.57 Million were derecognised with a corresponding debit to the securities premium.
Details of assets and liabilities pertaining to Commodity API business are given below:I in Million
Particulars October 1, 2017
Non-current assets 4,498.42
Current assets 4,019.02
Total assets (A) 8,517.44 Non-current liabilities 2,242.24
Current liabilities 4,303.63
Total liabilities (B) 6,545.87 Net asset debited to Securities premium reserve (A-B) 1,971.57
The demerger of this business was accounted for as a distribution to owners in accordance with Appendix A ('Distribution of Non-cash Assets to Owners') to Ind AS 10: Events after the Reporting Period.
In accordance with the above, the Group had fair valued the Commodity API business as on the appointed date and the excess of the fair value of the Commodity API business and the net assets transferred was credited to the statement of profit and loss.
The fair valuation of the Commodity API business was carried out by independent valuers who valued it at `9,010.00 Million.
The excess of the fair value over the net assets amounting to `7,038.43 Million was recognised as a non cash gain in the statement of profit and loss as 'Gain on disposal of assets attributable to discontinued operations', in accordance with Appendix A to Ind AS 10.
Further, the net assets of the subsidiaries included as part of demerger under the scheme amounting to `153.35 Million (net of non-controlling interest) was debited to the statement of profit and loss as 'Gain on disposal of assets attributable to discontinued operations'.
Pursuant to the above, the net credit to the statement of profit and loss for the year ended March 31, 2018, pursuant to demerger was as below:
I in Million
Particulars Amount
Excess of fair value of the Commodity API business over the net assets transferred 7,038.43
Less: Net assets of the subsidiaries part of demerger (181.52)
Add: Non-controlling interest pertaining to the demerged subsidiaries 28.17
Gain on disposal of assets attributable to discontinued operations 6,885.08
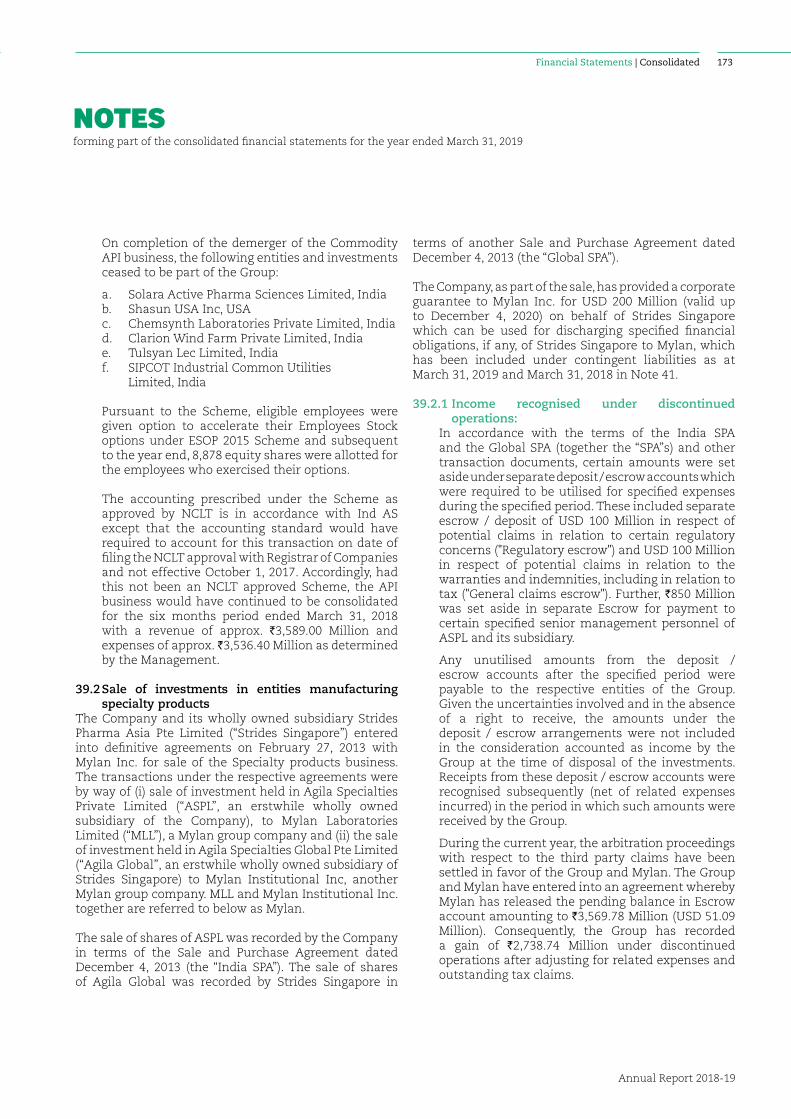
NOTESforming part of the consolidated financial statements for the year ended March 31, 2019
Annual Report 2018-19
173Financial Statements | Consolidated
On completion of the demerger of the Commodity API business, the following entities and investments ceased to be part of the Group:
a. Solara Active Pharma Sciences Limited, India b. Shasun USA Inc, USA c. Chemsynth Laboratories Private Limited, India d. Clarion Wind Farm Private Limited, India e. Tulsyan Lec Limited, India f. SIPCOT Industrial Common Utilities
Limited, India
Pursuant to the Scheme, eligible employees were given option to accelerate their Employees Stock options under ESOP 2015 Scheme and subsequent to the year end, 8,878 equity shares were allotted for the employees who exercised their options.
The accounting prescribed under the Scheme as approved by NCLT is in accordance with Ind AS except that the accounting standard would have required to account for this transaction on date of filing the NCLT approval with Registrar of Companies and not effective October 1, 2017. Accordingly, had this not been an NCLT approved Scheme, the API business would have continued to be consolidated for the six months period ended March 31, 2018 with a revenue of approx. `3,589.00 Million and expenses of approx. `3,536.40 Million as determined by the Management.
39.2 Sale of investments in entities manufacturing specialty products
The Company and its wholly owned subsidiary Strides Pharma Asia Pte Limited (“Strides Singapore”) entered into definitive agreements on February 27, 2013 with Mylan Inc. for sale of the Specialty products business. The transactions under the respective agreements were by way of (i) sale of investment held in Agila Specialties Private Limited (“ASPL”, an erstwhile wholly owned subsidiary of the Company), to Mylan Laboratories Limited (“MLL”), a Mylan group company and (ii) the sale of investment held in Agila Specialties Global Pte Limited (“Agila Global”, an erstwhile wholly owned subsidiary of Strides Singapore) to Mylan Institutional Inc, another Mylan group company. MLL and Mylan Institutional Inc. together are referred to below as Mylan.
The sale of shares of ASPL was recorded by the Company in terms of the Sale and Purchase Agreement dated December 4, 2013 (the “India SPA”). The sale of shares of Agila Global was recorded by Strides Singapore in
terms of another Sale and Purchase Agreement dated December 4, 2013 (the “Global SPA”).
The Company, as part of the sale, has provided a corporate guarantee to Mylan Inc. for USD 200 Million (valid up to December 4, 2020) on behalf of Strides Singapore which can be used for discharging specified financial obligations, if any, of Strides Singapore to Mylan, which has been included under contingent liabilities as at March 31, 2019 and March 31, 2018 in Note 41.
39.2.1 Income recognised under discontinued operations:
In accordance with the terms of the India SPA and the Global SPA (together the “SPA”s) and other transaction documents, certain amounts were set aside under separate deposit / escrow accounts which were required to be utilised for specified expenses during the specified period. These included separate escrow / deposit of USD 100 Million in respect of potential claims in relation to certain regulatory concerns ("Regulatory escrow") and USD 100 Million in respect of potential claims in relation to the warranties and indemnities, including in relation to tax ("General claims escrow"). Further, `850 Million was set aside in separate Escrow for payment to certain specified senior management personnel of ASPL and its subsidiary.
Any unutilised amounts from the deposit / escrow accounts after the specified period were payable to the respective entities of the Group. Given the uncertainties involved and in the absence of a right to receive, the amounts under the deposit / escrow arrangements were not included in the consideration accounted as income by the Group at the time of disposal of the investments. Receipts from these deposit / escrow accounts were recognised subsequently (net of related expenses incurred) in the period in which such amounts were received by the Group.
During the current year, the arbitration proceedings with respect to the third party claims have been settled in favor of the Group and Mylan. The Group and Mylan have entered into an agreement whereby Mylan has released the pending balance in Escrow account amounting to `3,569.78 Million (USD 51.09 Million). Consequently, the Group has recorded a gain of `2,738.74 Million under discontinued operations after adjusting for related expenses and outstanding tax claims.
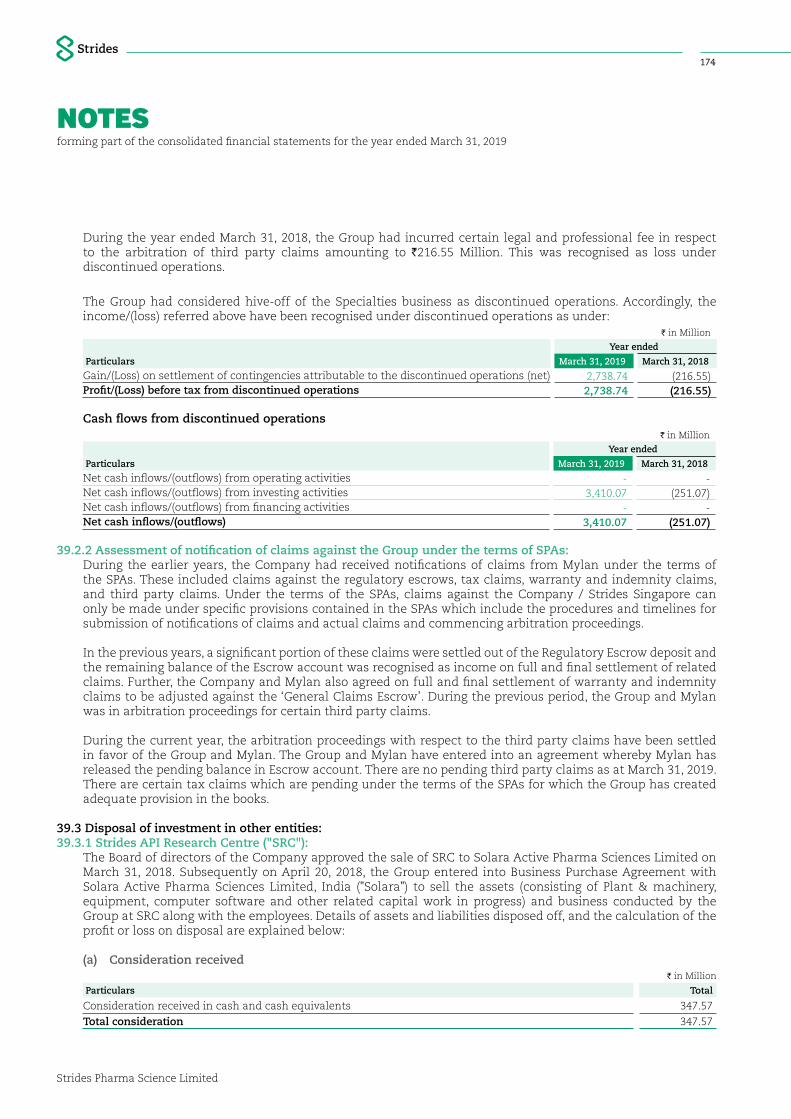
NOTESforming part of the consolidated financial statements for the year ended March 31, 2019
Strides Pharma Science Limited
174
During the year ended March 31, 2018, the Group had incurred certain legal and professional fee in respect to the arbitration of third party claims amounting to `216.55 Million. This was recognised as loss under discontinued operations.
The Group had considered hive-off of the Specialties business as discontinued operations. Accordingly, the income/(loss) referred above have been recognised under discontinued operations as under:
I in Million
Year ended
Particulars March 31, 2019 March 31, 2018
Gain/(Loss) on settlement of contingencies attributable to the discontinued operations (net) 2,738.74 (216.55)Profit/(Loss) before tax from discontinued operations 2,738.74 (216.55)
Cash flows from discontinued operationsI in Million
Year ended
Particulars March 31, 2019 March 31, 2018
Net cash inflows/(outflows) from operating activities - - Net cash inflows/(outflows) from investing activities 3,410.07 (251.07)Net cash inflows/(outflows) from financing activities - - Net cash inflows/(outflows) 3,410.07 (251.07)
39.2.2 Assessment of notification of claims against the Group under the terms of SPAs: During the earlier years, the Company had received notifications of claims from Mylan under the terms of
the SPAs. These included claims against the regulatory escrows, tax claims, warranty and indemnity claims, and third party claims. Under the terms of the SPAs, claims against the Company / Strides Singapore can only be made under specific provisions contained in the SPAs which include the procedures and timelines for submission of notifications of claims and actual claims and commencing arbitration proceedings.
In the previous years, a significant portion of these claims were settled out of the Regulatory Escrow deposit and the remaining balance of the Escrow account was recognised as income on full and final settlement of related claims. Further, the Company and Mylan also agreed on full and final settlement of warranty and indemnity claims to be adjusted against the ‘General Claims Escrow’. During the previous period, the Group and Mylan was in arbitration proceedings for certain third party claims.
During the current year, the arbitration proceedings with respect to the third party claims have been settled in favor of the Group and Mylan. The Group and Mylan have entered into an agreement whereby Mylan has released the pending balance in Escrow account. There are no pending third party claims as at March 31, 2019. There are certain tax claims which are pending under the terms of the SPAs for which the Group has created adequate provision in the books.
39.3 Disposal of investment in other entities:39.3.1 Strides API Research Centre ("SRC"): The Board of directors of the Company approved the sale of SRC to Solara Active Pharma Sciences Limited on
March 31, 2018. Subsequently on April 20, 2018, the Group entered into Business Purchase Agreement with Solara Active Pharma Sciences Limited, India ("Solara") to sell the assets (consisting of Plant & machinery, equipment, computer software and other related capital work in progress) and business conducted by the Group at SRC along with the employees. Details of assets and liabilities disposed off, and the calculation of the profit or loss on disposal are explained below:
(a) Consideration receivedI in Million
Particulars Total
Consideration received in cash and cash equivalents 347.57
Total consideration 347.57
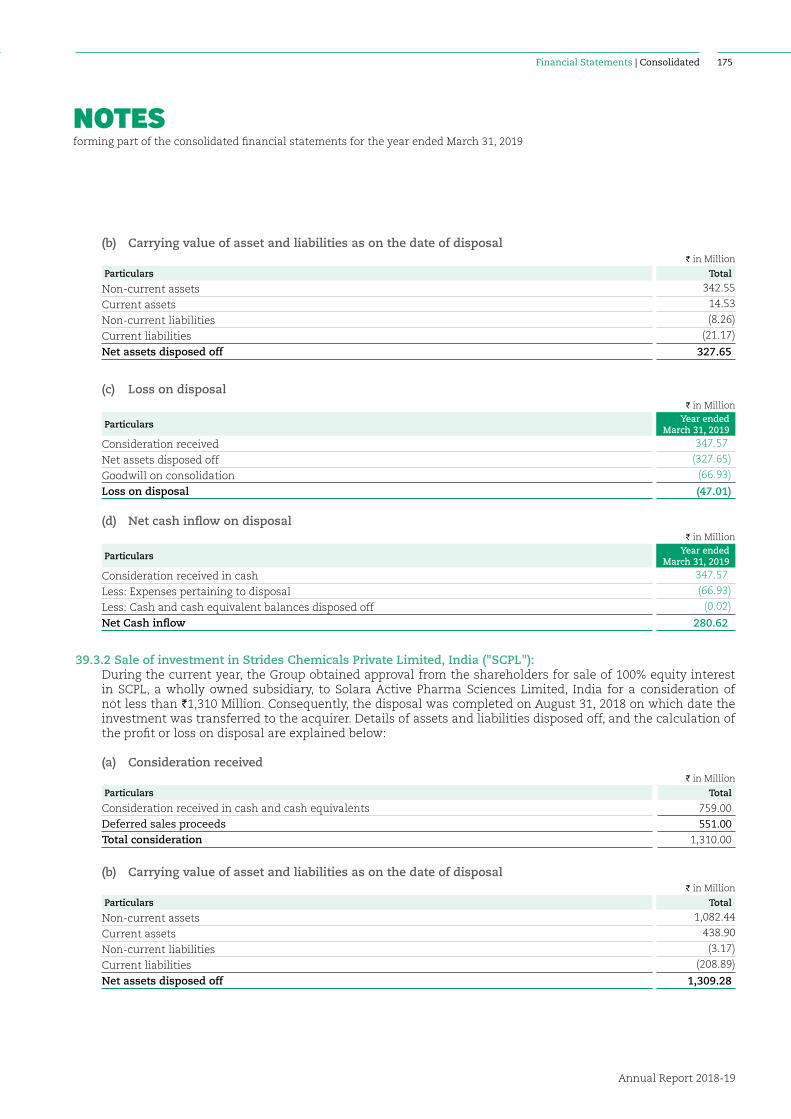
NOTESforming part of the consolidated financial statements for the year ended March 31, 2019
Annual Report 2018-19
175Financial Statements | Consolidated
(b) Carrying value of asset and liabilities as on the date of disposalI in Million
Particulars Total
Non-current assets 342.55
Current assets 14.53
Non-current liabilities (8.26)
Current liabilities (21.17)
Net assets disposed off 327.65
(c) Loss on disposalI in Million
Particulars Year endedMarch 31, 2019
Consideration received 347.57
Net assets disposed off (327.65)
Goodwill on consolidation (66.93)
Loss on disposal (47.01)
(d) Net cash inflow on disposal I in Million
Particulars Year endedMarch 31, 2019
Consideration received in cash 347.57
Less: Expenses pertaining to disposal (66.93)
Less: Cash and cash equivalent balances disposed off (0.02)
Net Cash inflow 280.62
39.3.2 Sale of investment in Strides Chemicals Private Limited, India ("SCPL"): During the current year, the Group obtained approval from the shareholders for sale of 100% equity interest
in SCPL, a wholly owned subsidiary, to Solara Active Pharma Sciences Limited, India for a consideration of not less than `1,310 Million. Consequently, the disposal was completed on August 31, 2018 on which date the investment was transferred to the acquirer. Details of assets and liabilities disposed off, and the calculation of the profit or loss on disposal are explained below:
(a) Consideration receivedI in Million
Particulars Total
Consideration received in cash and cash equivalents 759.00
Deferred sales proceeds 551.00 Total consideration 1,310.00
(b) Carrying value of asset and liabilities as on the date of disposalI in Million
Particulars Total
Non-current assets 1,082.44
Current assets 438.90
Non-current liabilities (3.17)
Current liabilities (208.89)
Net assets disposed off 1,309.28
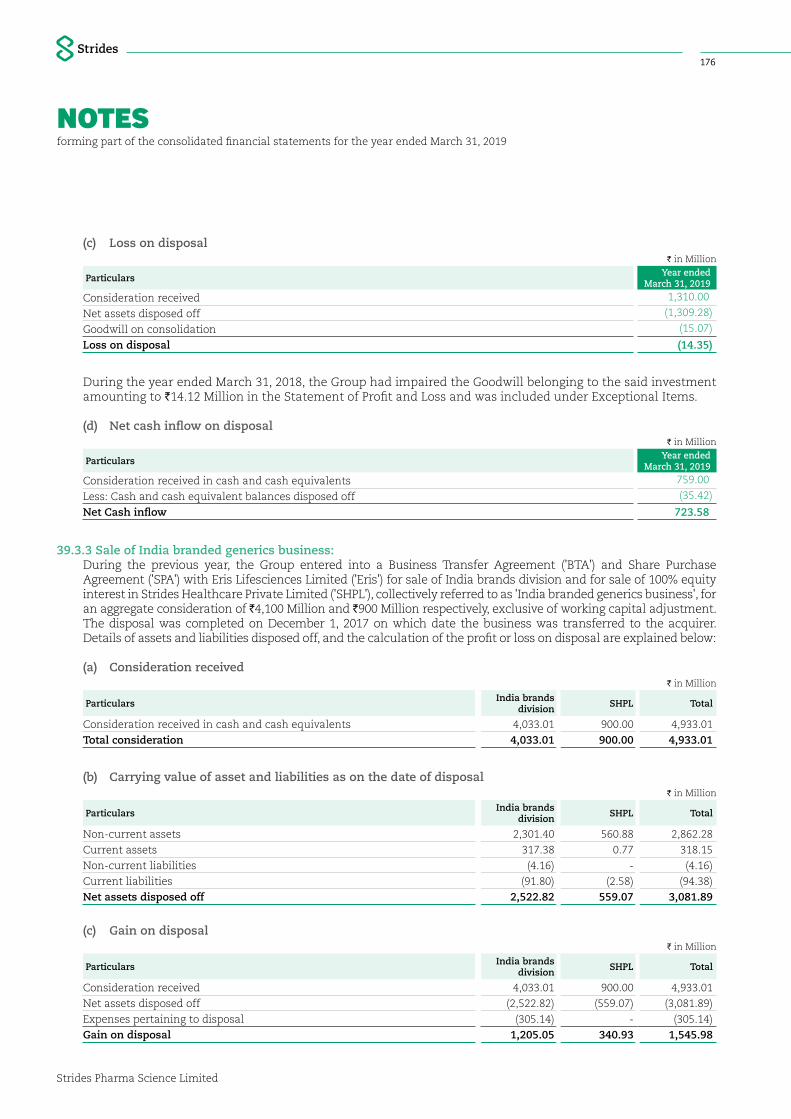
NOTESforming part of the consolidated financial statements for the year ended March 31, 2019
Strides Pharma Science Limited
176
(c) Loss on disposalI in Million
Particulars Year endedMarch 31, 2019
Consideration received 1,310.00
Net assets disposed off (1,309.28)
Goodwill on consolidation (15.07)
Loss on disposal (14.35)
During the year ended March 31, 2018, the Group had impaired the Goodwill belonging to the said investment amounting to `14.12 Million in the Statement of Profit and Loss and was included under Exceptional Items.
(d) Net cash inflow on disposal I in Million
Particulars Year endedMarch 31, 2019
Consideration received in cash and cash equivalents 759.00
Less: Cash and cash equivalent balances disposed off (35.42)
Net Cash inflow 723.58
39.3.3 Sale of India branded generics business: During the previous year, the Group entered into a Business Transfer Agreement ('BTA') and Share Purchase
Agreement ('SPA') with Eris Lifesciences Limited ('Eris') for sale of India brands division and for sale of 100% equity interest in Strides Healthcare Private Limited ('SHPL'), collectively referred to as 'India branded generics business', for an aggregate consideration of `4,100 Million and `900 Million respectively, exclusive of working capital adjustment. The disposal was completed on December 1, 2017 on which date the business was transferred to the acquirer. Details of assets and liabilities disposed off, and the calculation of the profit or loss on disposal are explained below:
(a) Consideration receivedI in Million
Particulars India brands division SHPL Total
Consideration received in cash and cash equivalents 4,033.01 900.00 4,933.01
Total consideration 4,033.01 900.00 4,933.01
(b) Carrying value of asset and liabilities as on the date of disposalI in Million
Particulars India brands division SHPL Total
Non-current assets 2,301.40 560.88 2,862.28
Current assets 317.38 0.77 318.15
Non-current liabilities (4.16) - (4.16)
Current liabilities (91.80) (2.58) (94.38)
Net assets disposed off 2,522.82 559.07 3,081.89
(c) Gain on disposalI in Million
Particulars India brands division SHPL Total
Consideration received 4,033.01 900.00 4,933.01
Net assets disposed off (2,522.82) (559.07) (3,081.89)
Expenses pertaining to disposal (305.14) - (305.14)
Gain on disposal 1,205.05 340.93 1,545.98

NOTESforming part of the consolidated financial statements for the year ended March 31, 2019
Annual Report 2018-19
177Financial Statements | Consolidated
(d) Net cash inflow on disposalI in Million
Particulars Year endedMarch 31, 2019
Consideration received in cash and cash equivalents 4,933.01
Less: Cash and cash equivalent balances disposed off (0.53)
Net Cash inflow 4,932.48
39.3.4 Disposal of Consumer Healthcare (CHC) Business (Loss of control): The Board of Directors of the Company in their meeting held on October 31, 2018, have approved the execution of
definitive agreements with India Lifescience Fund III, LLC (ILF) to provide growth capital and focused attention to its Consumer Healthcare Business (CHC). Pursuant to the above, Strides Global Consumer Healthcare Limited, UK and Strides Consumer LLC, USA have been formed as wholly owned subisidiaries of the group.
Further, the group entered into "Investment Agreements" on November 1, 2018 with ILF, wherein, ILF has agreed to invest an amount of USD 20.00 Million for 46.36% controlling stake in the CHC business. Out of the above, USD 12.50 Million has been invested during December 2018 and balance amount of USD 7.50 Million to be invested at the end of financial year 2019-20 contingent on fulfilling of certain conditions as specified in the agreement.
Pursuant to the above agreements, the Group’s representation in the Board of Directors of entities carrying out CHC business has been reduced to 2 director out of the total strength of 4 directors.
Considering that the Board of Directors of entities carrying out CHC business have rights and power to set the relevant activities of CHC business and appoint the managerial personnel to execute those activities and also the fact that the resolution in the meeting of Board of Directors can be passed by a simple majority of the directors, the group has lost control over CHC business with effect from December 18, 2018 as the Group would no longer be able to control the relevant activities decided by the Board of Directors of CHC business, even though the group continues to hold 53.64% stake in CHC business. However, considering the Group’s representation in the Board of Directors of CHC business to participate in the decision making process and its majority voting rights as shareholders, Strides exercises significant influence over CHC business. As a result, entities carrying out CHC business ceased to be the subsidiaries of the group with effect from December 18, 2018 and became associates of the group. In accordance with the accounting policy of the Group in line with the requirements of Ind AS 110 ‘Consolidated Financial Statements’, the resulting gain of `587.94 Million, being the excess of fair value of the retained interest over the carrying value of net assets in CHC business on loss of control over CHC business, has been accounted under exceptional items for the year ended March 31, 2019.
Following the above, the below entities have become associates of the group:
- Strides Consumer Private Limited, India
- Strides Global Consumer Healthcare Limited, UK
- Strides Consumer LLC, USA
(a) Fair value of Investment on the date of loss of controlI in Million
Particulars March 31, 2019
Investment commitment by ILF (USD Million) 20.00
% equity interest divested in CHC business (%) 46.36%
Fair value of 100% of CHC business (USD Million) 43.14
Strides retained % equity interest in CHC business (%) 53.64%
Fair value of retained investment (USD Million) 23.14
Fair value of retained investment (` Million) 1,616.79
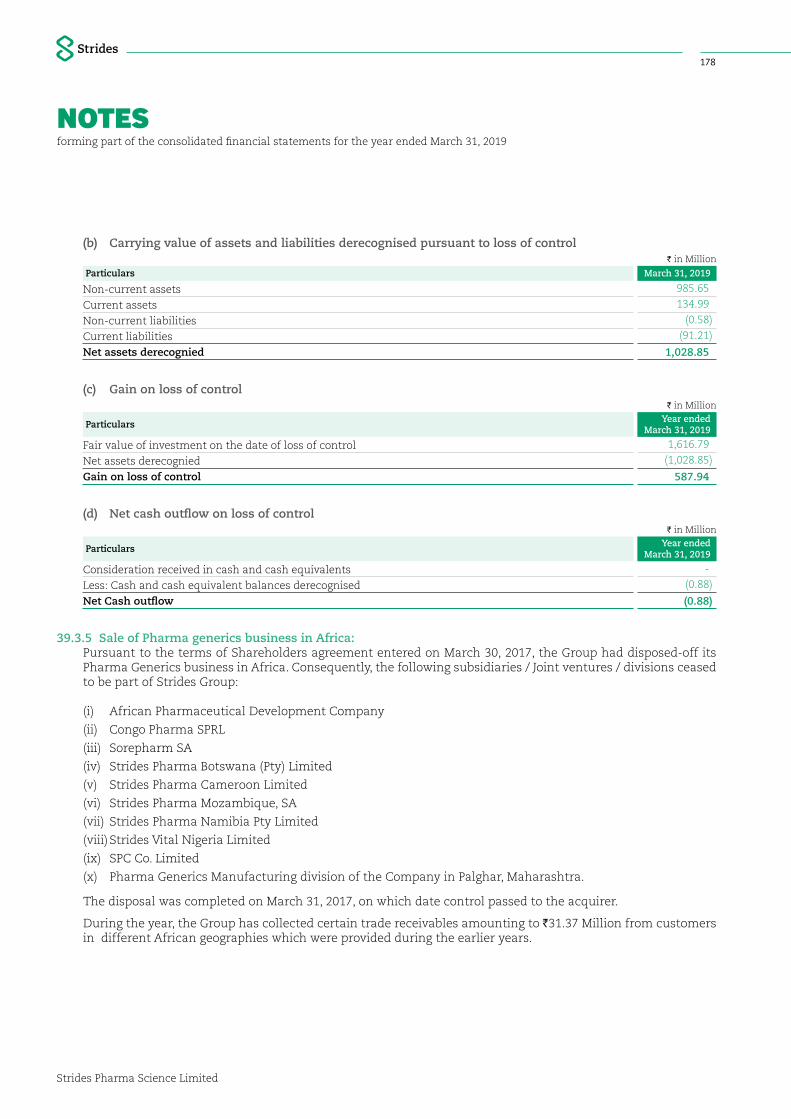
NOTESforming part of the consolidated financial statements for the year ended March 31, 2019
Strides Pharma Science Limited
178
(b) Carrying value of assets and liabilities derecognised pursuant to loss of controlI in Million
Particulars March 31, 2019
Non-current assets 985.65
Current assets 134.99
Non-current liabilities (0.58)
Current liabilities (91.21)
Net assets derecognied 1,028.85
(c) Gain on loss of controlI in Million
Particulars Year endedMarch 31, 2019
Fair value of investment on the date of loss of control 1,616.79
Net assets derecognied (1,028.85)
Gain on loss of control 587.94
(d) Net cash outflow on loss of controlI in Million
Particulars Year endedMarch 31, 2019
Consideration received in cash and cash equivalents -
Less: Cash and cash equivalent balances derecognised (0.88)
Net Cash outflow (0.88)
39.3.5 Sale of Pharma generics business in Africa: Pursuant to the terms of Shareholders agreement entered on March 30, 2017, the Group had disposed-off its
Pharma Generics business in Africa. Consequently, the following subsidiaries / Joint ventures / divisions ceased to be part of Strides Group:
(i) African Pharmaceutical Development Company
(ii) Congo Pharma SPRL
(iii) Sorepharm SA
(iv) Strides Pharma Botswana (Pty) Limited
(v) Strides Pharma Cameroon Limited
(vi) Strides Pharma Mozambique, SA
(vii) Strides Pharma Namibia Pty Limited
(viii) Strides Vital Nigeria Limited
(ix) SPC Co. Limited
(x) Pharma Generics Manufacturing division of the Company in Palghar, Maharashtra.
The disposal was completed on March 31, 2017, on which date control passed to the acquirer.
During the year, the Group has collected certain trade receivables amounting to `31.37 Million from customers in different African geographies which were provided during the earlier years.
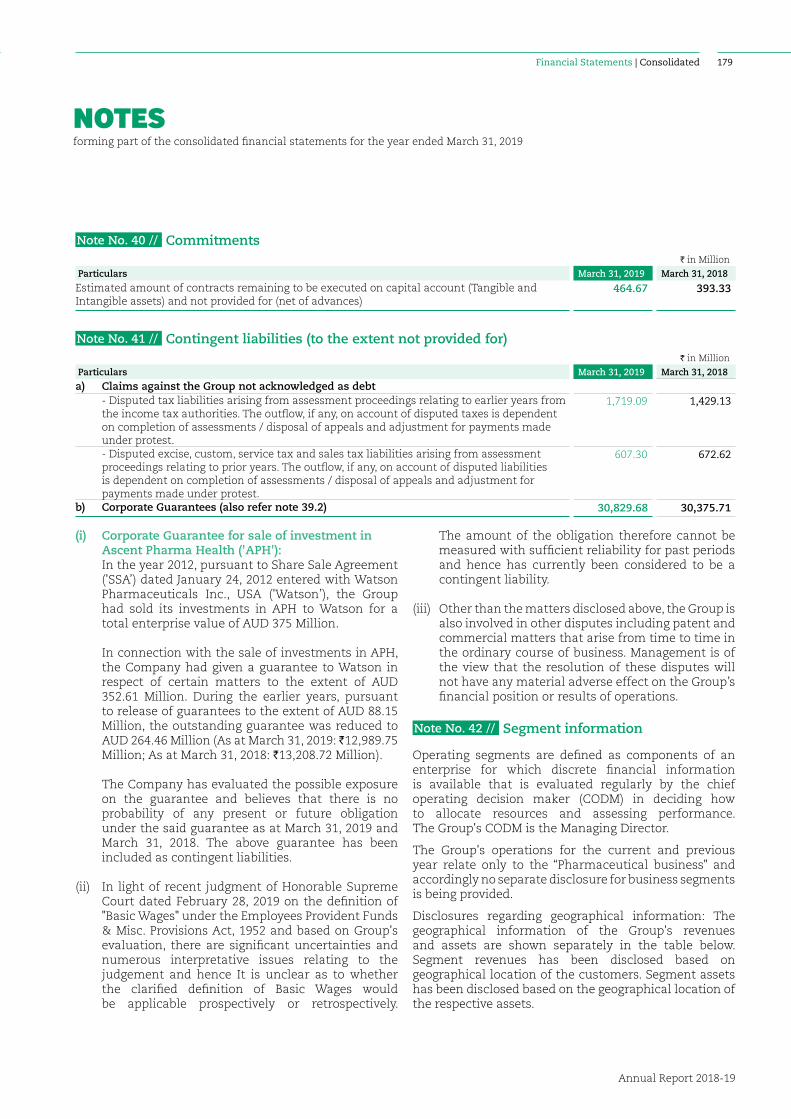
NOTESforming part of the consolidated financial statements for the year ended March 31, 2019
Annual Report 2018-19
179Financial Statements | Consolidated
Note No. 40 // CommitmentsI in Million
Particulars March 31, 2019 March 31, 2018
Estimated amount of contracts remaining to be executed on capital account (Tangible and Intangible assets) and not provided for (net of advances)
464.67 393.33
Note No. 41 // Contingent liabilities (to the extent not provided for)I in Million
Particulars March 31, 2019 March 31, 2018
a) Claims against the Group not acknowledged as debt - Disputed tax liabilities arising from assessment proceedings relating to earlier years from
the income tax authorities. The outflow, if any, on account of disputed taxes is dependent on completion of assessments / disposal of appeals and adjustment for payments made under protest.
1,719.09 1,429.13
- Disputed excise, custom, service tax and sales tax liabilities arising from assessment proceedings relating to prior years. The outflow, if any, on account of disputed liabilities is dependent on completion of assessments / disposal of appeals and adjustment for payments made under protest.
607.30 672.62
b) Corporate Guarantees (also refer note 39.2) 30,829.68 30,375.71
(i) Corporate Guarantee for sale of investment in Ascent Pharma Health ('APH'):
In the year 2012, pursuant to Share Sale Agreement ('SSA’) dated January 24, 2012 entered with Watson Pharmaceuticals Inc., USA ('Watson’), the Group had sold its investments in APH to Watson for a total enterprise value of AUD 375 Million.
In connection with the sale of investments in APH, the Company had given a guarantee to Watson in respect of certain matters to the extent of AUD 352.61 Million. During the earlier years, pursuant to release of guarantees to the extent of AUD 88.15 Million, the outstanding guarantee was reduced to AUD 264.46 Million (As at March 31, 2019: ̀ 12,989.75 Million; As at March 31, 2018: `13,208.72 Million).
The Company has evaluated the possible exposure on the guarantee and believes that there is no probability of any present or future obligation under the said guarantee as at March 31, 2019 and March 31, 2018. The above guarantee has been included as contingent liabilities.
(ii) In light of recent judgment of Honorable Supreme Court dated February 28, 2019 on the definition of "Basic Wages" under the Employees Provident Funds & Misc. Provisions Act, 1952 and based on Group's evaluation, there are significant uncertainties and numerous interpretative issues relating to the judgement and hence It is unclear as to whether the clarified definition of Basic Wages would be applicable prospectively or retrospectively.
The amount of the obligation therefore cannot be measured with sufficient reliability for past periods and hence has currently been considered to be a contingent liability.
(iii) Other than the matters disclosed above, the Group is also involved in other disputes including patent and commercial matters that arise from time to time in the ordinary course of business. Management is of the view that the resolution of these disputes will not have any material adverse effect on the Group’s financial position or results of operations.
Note No. 42 // Segment information
Operating segments are defined as components of an enterprise for which discrete financial information is available that is evaluated regularly by the chief operating decision maker (CODM) in deciding how to allocate resources and assessing performance. The Group's CODM is the Managing Director.
The Group's operations for the current and previous year relate only to the “Pharmaceutical business" and accordingly no separate disclosure for business segments is being provided.
Disclosures regarding geographical information: The geographical information of the Group's revenues and assets are shown separately in the table below. Segment revenues has been disclosed based on geographical location of the customers. Segment assets has been disclosed based on the geographical location of the respective assets.
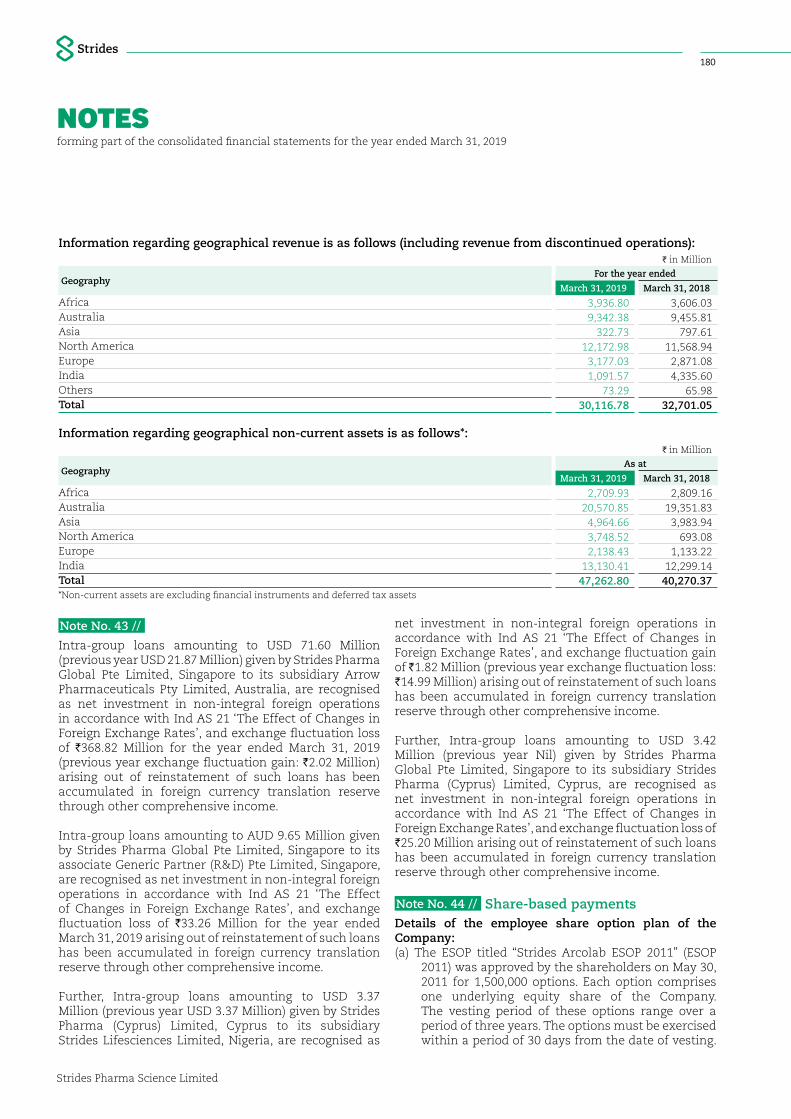
NOTESforming part of the consolidated financial statements for the year ended March 31, 2019
Strides Pharma Science Limited
180
Information regarding geographical revenue is as follows (including revenue from discontinued operations):I in Million
GeographyFor the year ended
March 31, 2019 March 31, 2018
Africa 3,936.80 3,606.03 Australia 9,342.38 9,455.81 Asia 322.73 797.61 North America 12,172.98 11,568.94 Europe 3,177.03 2,871.08 India 1,091.57 4,335.60 Others 73.29 65.98 Total 30,116.78 32,701.05
Information regarding geographical non-current assets is as follows*:I in Million
GeographyAs at
March 31, 2019 March 31, 2018
Africa 2,709.93 2,809.16 Australia 20,570.85 19,351.83 Asia 4,964.66 3,983.94 North America 3,748.52 693.08 Europe 2,138.43 1,133.22 India 13,130.41 12,299.14 Total 47,262.80 40,270.37 *Non-current assets are excluding financial instruments and deferred tax assets
Note No. 43 //
Intra-group loans amounting to USD 71.60 Million (previous year USD 21.87 Million) given by Strides Pharma Global Pte Limited, Singapore to its subsidiary Arrow Pharmaceuticals Pty Limited, Australia, are recognised as net investment in non-integral foreign operations in accordance with Ind AS 21 ‘The Effect of Changes in Foreign Exchange Rates’, and exchange fluctuation loss of `368.82 Million for the year ended March 31, 2019 (previous year exchange fluctuation gain: `2.02 Million) arising out of reinstatement of such loans has been accumulated in foreign currency translation reserve through other comprehensive income.
Intra-group loans amounting to AUD 9.65 Million given by Strides Pharma Global Pte Limited, Singapore to its associate Generic Partner (R&D) Pte Limited, Singapore, are recognised as net investment in non-integral foreign operations in accordance with Ind AS 21 ‘The Effect of Changes in Foreign Exchange Rates’, and exchange fluctuation loss of `33.26 Million for the year ended March 31, 2019 arising out of reinstatement of such loans has been accumulated in foreign currency translation reserve through other comprehensive income.
Further, Intra-group loans amounting to USD 3.37 Million (previous year USD 3.37 Million) given by Strides Pharma (Cyprus) Limited, Cyprus to its subsidiary Strides Lifesciences Limited, Nigeria, are recognised as
net investment in non-integral foreign operations in accordance with Ind AS 21 ‘The Effect of Changes in Foreign Exchange Rates’, and exchange fluctuation gain of ̀ 1.82 Million (previous year exchange fluctuation loss: `14.99 Million) arising out of reinstatement of such loans has been accumulated in foreign currency translation reserve through other comprehensive income.
Further, Intra-group loans amounting to USD 3.42 Million (previous year Nil) given by Strides Pharma Global Pte Limited, Singapore to its subsidiary Strides Pharma (Cyprus) Limited, Cyprus, are recognised as net investment in non-integral foreign operations in accordance with Ind AS 21 ‘The Effect of Changes in Foreign Exchange Rates’, and exchange fluctuation loss of `25.20 Million arising out of reinstatement of such loans has been accumulated in foreign currency translation reserve through other comprehensive income.
Note No. 44 // Share-based paymentsDetails of the employee share option plan of the Company:(a) The ESOP titled “Strides Arcolab ESOP 2011” (ESOP
2011) was approved by the shareholders on May 30, 2011 for 1,500,000 options. Each option comprises one underlying equity share of the Company. The vesting period of these options range over a period of three years. The options must be exercised within a period of 30 days from the date of vesting.
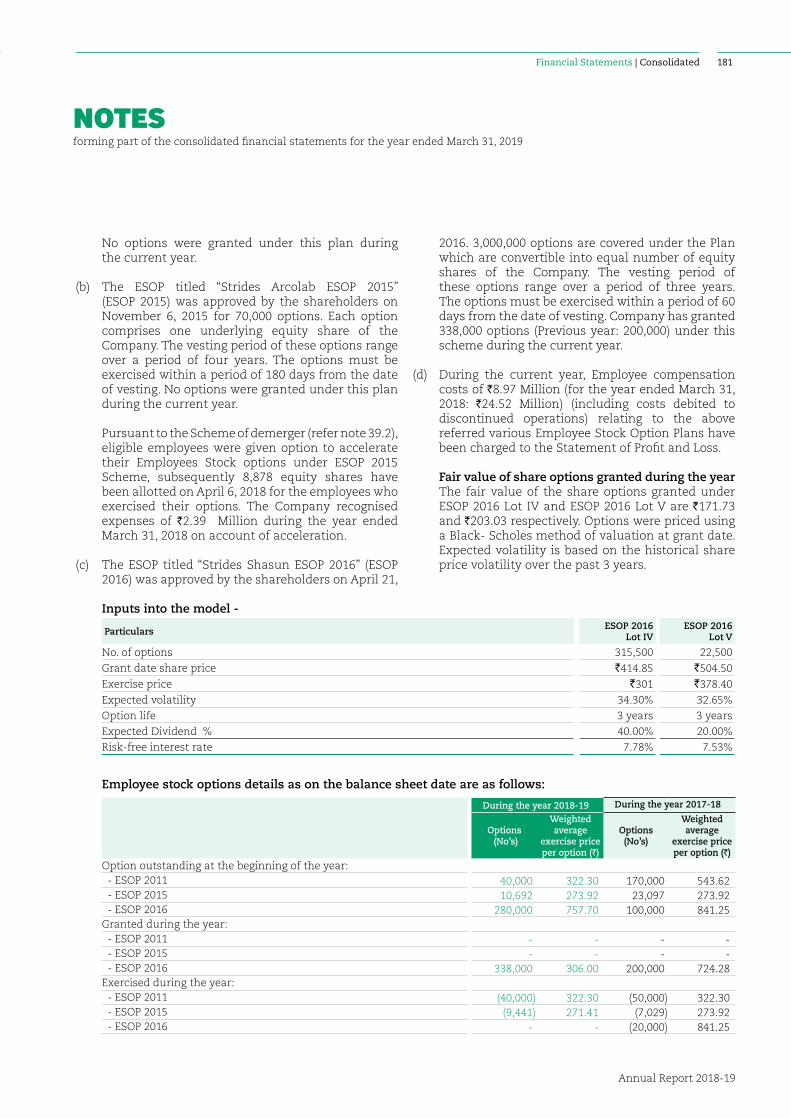
NOTESforming part of the consolidated financial statements for the year ended March 31, 2019
Annual Report 2018-19
181Financial Statements | Consolidated
No options were granted under this plan during the current year.
(b) The ESOP titled “Strides Arcolab ESOP 2015” (ESOP 2015) was approved by the shareholders on November 6, 2015 for 70,000 options. Each option comprises one underlying equity share of the Company. The vesting period of these options range over a period of four years. The options must be exercised within a period of 180 days from the date of vesting. No options were granted under this plan during the current year.
Pursuant to the Scheme of demerger (refer note 39.2), eligible employees were given option to accelerate their Employees Stock options under ESOP 2015 Scheme, subsequently 8,878 equity shares have been allotted on April 6, 2018 for the employees who exercised their options. The Company recognised expenses of `2.39 Million during the year ended March 31, 2018 on account of acceleration.
(c) The ESOP titled “Strides Shasun ESOP 2016” (ESOP 2016) was approved by the shareholders on April 21,
2016. 3,000,000 options are covered under the Plan which are convertible into equal number of equity shares of the Company. The vesting period of these options range over a period of three years. The options must be exercised within a period of 60 days from the date of vesting. Company has granted 338,000 options (Previous year: 200,000) under this scheme during the current year.
(d) During the current year, Employee compensation costs of `8.97 Million (for the year ended March 31, 2018: `24.52 Million) (including costs debited to discontinued operations) relating to the above referred various Employee Stock Option Plans have been charged to the Statement of Profit and Loss.
Fair value of share options granted during the year The fair value of the share options granted under
ESOP 2016 Lot IV and ESOP 2016 Lot V are `171.73 and `203.03 respectively. Options were priced using a Black- Scholes method of valuation at grant date. Expected volatility is based on the historical share price volatility over the past 3 years.
Inputs into the model -
Particulars ESOP 2016 Lot IV
ESOP 2016 Lot V
No. of options 315,500 22,500
Grant date share price `414.85 `504.50
Exercise price `301 `378.40
Expected volatility 34.30% 32.65%
Option life 3 years 3 years
Expected Dividend % 40.00% 20.00%
Risk-free interest rate 7.78% 7.53%
Employee stock options details as on the balance sheet date are as follows:
During the year 2018-19 During the year 2017-18
Options (No’s)
Weighted average
exercise price per option (`)
Options (No’s)
Weighted average
exercise price per option (`)
Option outstanding at the beginning of the year: - ESOP 2011 40,000 322.30 170,000 543.62 - ESOP 2015 10,692 273.92 23,097 273.92 - ESOP 2016 280,000 757.70 100,000 841.25 Granted during the year: - ESOP 2011 - - - - - ESOP 2015 - - - - - ESOP 2016 338,000 306.00 200,000 724.28 Exercised during the year: - ESOP 2011 (40,000) 322.30 (50,000) 322.30 - ESOP 2015 (9,441) 271.41 (7,029) 273.92 - ESOP 2016 - - (20,000) 841.25
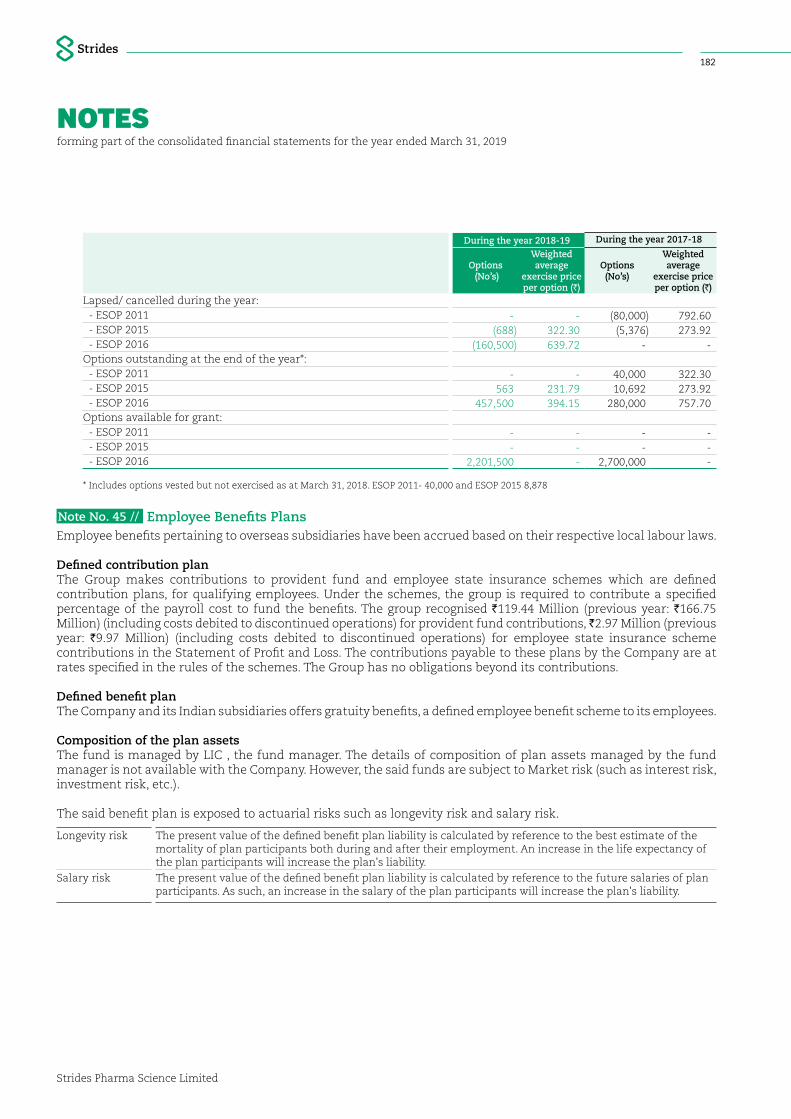
NOTESforming part of the consolidated financial statements for the year ended March 31, 2019
Strides Pharma Science Limited
182
During the year 2018-19 During the year 2017-18
Options (No’s)
Weighted average
exercise price per option (`)
Options (No’s)
Weighted average
exercise price per option (`)
Lapsed/ cancelled during the year: - ESOP 2011 - - (80,000) 792.60 - ESOP 2015 (688) 322.30 (5,376) 273.92 - ESOP 2016 (160,500) 639.72 - - Options outstanding at the end of the year*: - ESOP 2011 - - 40,000 322.30 - ESOP 2015 563 231.79 10,692 273.92 - ESOP 2016 457,500 394.15 280,000 757.70 Options available for grant: - ESOP 2011 - - - - - ESOP 2015 - - - - - ESOP 2016 2,201,500 - 2,700,000 -
* Includes options vested but not exercised as at March 31, 2018. ESOP 2011- 40,000 and ESOP 2015 8,878
Note No. 45 // Employee Benefits PlansEmployee benefits pertaining to overseas subsidiaries have been accrued based on their respective local labour laws.
Defined contribution planThe Group makes contributions to provident fund and employee state insurance schemes which are defined contribution plans, for qualifying employees. Under the schemes, the group is required to contribute a specified percentage of the payroll cost to fund the benefits. The group recognised `119.44 Million (previous year: `166.75 Million) (including costs debited to discontinued operations) for provident fund contributions, ̀ 2.97 Million (previous year: `9.97 Million) (including costs debited to discontinued operations) for employee state insurance scheme contributions in the Statement of Profit and Loss. The contributions payable to these plans by the Company are at rates specified in the rules of the schemes. The Group has no obligations beyond its contributions.
Defined benefit planThe Company and its Indian subsidiaries offers gratuity benefits, a defined employee benefit scheme to its employees.
Composition of the plan assetsThe fund is managed by LIC , the fund manager. The details of composition of plan assets managed by the fund manager is not available with the Company. However, the said funds are subject to Market risk (such as interest risk, investment risk, etc.).
The said benefit plan is exposed to actuarial risks such as longevity risk and salary risk.
Longevity risk The present value of the defined benefit plan liability is calculated by reference to the best estimate of the mortality of plan participants both during and after their employment. An increase in the life expectancy of the plan participants will increase the plan's liability.
Salary risk The present value of the defined benefit plan liability is calculated by reference to the future salaries of plan participants. As such, an increase in the salary of the plan participants will increase the plan's liability.
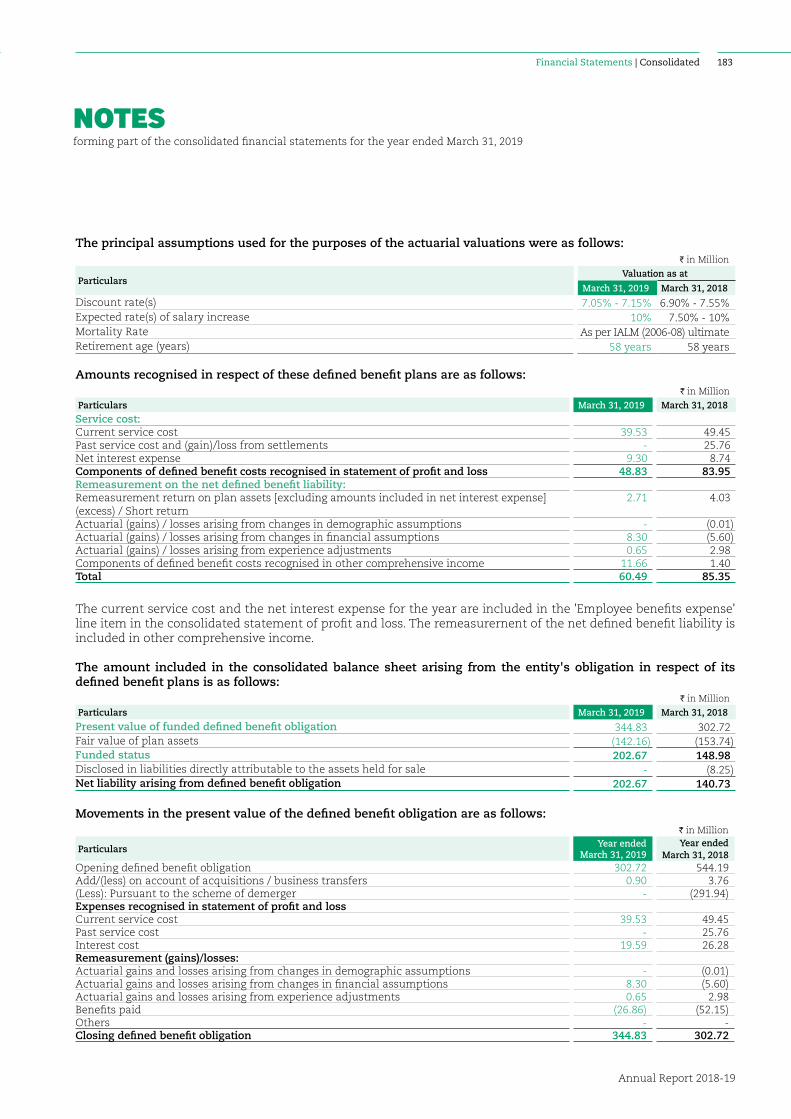
NOTESforming part of the consolidated financial statements for the year ended March 31, 2019
Annual Report 2018-19
183Financial Statements | Consolidated
The principal assumptions used for the purposes of the actuarial valuations were as follows:I in Million
ParticularsValuation as at
March 31, 2019 March 31, 2018
Discount rate(s) 7.05% - 7.15% 6.90% - 7.55%Expected rate(s) of salary increase 10% 7.50% - 10%Mortality Rate As per IALM (2006-08) ultimate Retirement age (years) 58 years 58 years
Amounts recognised in respect of these defined benefit plans are as follows:I in Million
Particulars March 31, 2019 March 31, 2018
Service cost:Current service cost 39.53 49.45 Past service cost and (gain)/loss from settlements - 25.76 Net interest expense 9.30 8.74 Components of defined benefit costs recognised in statement of profit and loss 48.83 83.95 Remeasurement on the net defined benefit liability:Remeasurement return on plan assets [excluding amounts included in net interest expense] (excess) / Short return
2.71 4.03
Actuarial (gains) / losses arising from changes in demographic assumptions - (0.01)Actuarial (gains) / losses arising from changes in financial assumptions 8.30 (5.60)Actuarial (gains) / losses arising from experience adjustments 0.65 2.98 Components of defined benefit costs recognised in other comprehensive income 11.66 1.40 Total 60.49 85.35
The current service cost and the net interest expense for the year are included in the 'Employee benefits expense' line item in the consolidated statement of profit and loss. The remeasurernent of the net defined benefit liability is included in other comprehensive income.
The amount included in the consolidated balance sheet arising from the entity's obligation in respect of its defined benefit plans is as follows:
I in Million
Particulars March 31, 2019 March 31, 2018
Present value of funded defined benefit obligation 344.83 302.72 Fair value of plan assets (142.16) (153.74)Funded status 202.67 148.98 Disclosed in liabilities directly attributable to the assets held for sale - (8.25)Net liability arising from defined benefit obligation 202.67 140.73
Movements in the present value of the defined benefit obligation are as follows:I in Million
Particulars Year endedMarch 31, 2019
Year ended March 31, 2018
Opening defined benefit obligation 302.72 544.19 Add/(less) on account of acquisitions / business transfers 0.90 3.76 (Less): Pursuant to the scheme of demerger - (291.94)Expenses recognised in statement of profit and loss Current service cost 39.53 49.45 Past service cost - 25.76 Interest cost 19.59 26.28 Remeasurement (gains)/losses:Actuarial gains and losses arising from changes in demographic assumptions - (0.01)Actuarial gains and losses arising from changes in financial assumptions 8.30 (5.60)Actuarial gains and losses arising from experience adjustments 0.65 2.98 Benefits paid (26.86) (52.15)Others - - Closing defined benefit obligation 344.83 302.72
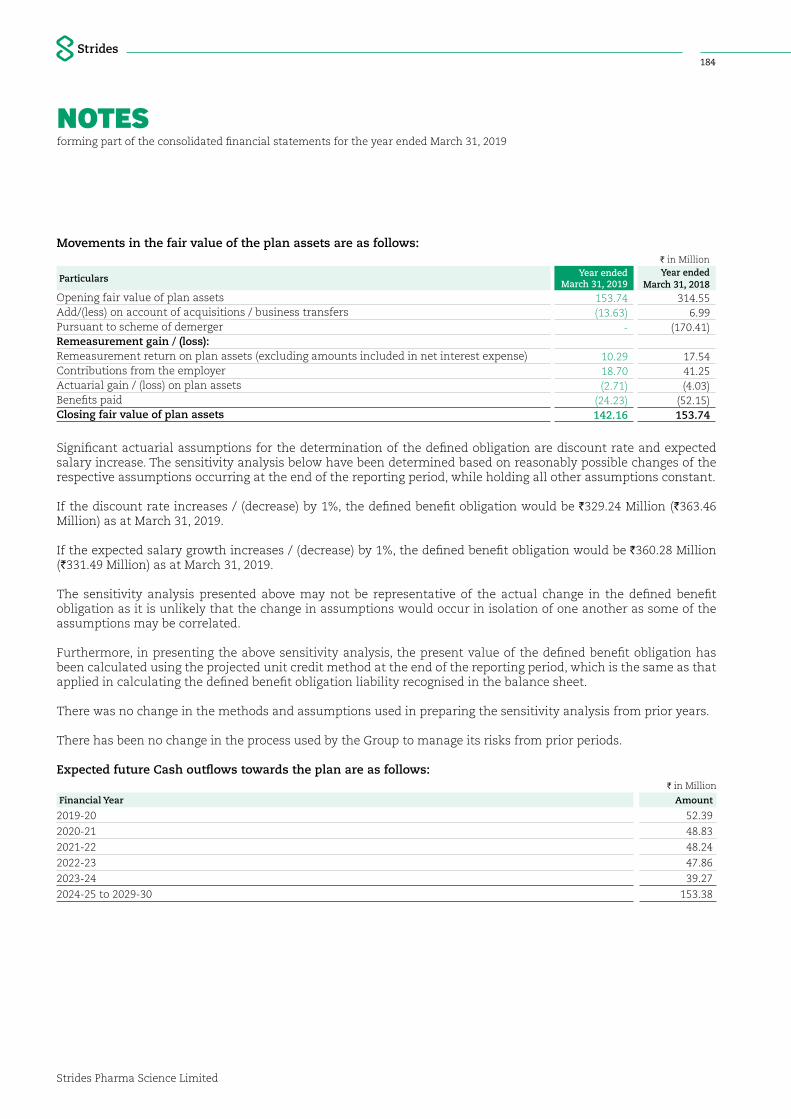
NOTESforming part of the consolidated financial statements for the year ended March 31, 2019
Strides Pharma Science Limited
184
Movements in the fair value of the plan assets are as follows:I in Million
Particulars Year endedMarch 31, 2019
Year ended March 31, 2018
Opening fair value of plan assets 153.74 314.55 Add/(less) on account of acquisitions / business transfers (13.63) 6.99 Pursuant to scheme of demerger - (170.41)Remeasurement gain / (loss):Remeasurement return on plan assets (excluding amounts included in net interest expense) 10.29 17.54 Contributions from the employer 18.70 41.25 Actuarial gain / (loss) on plan assets (2.71) (4.03)Benefits paid (24.23) (52.15)Closing fair value of plan assets 142.16 153.74
Significant actuarial assumptions for the determination of the defined obligation are discount rate and expected salary increase. The sensitivity analysis below have been determined based on reasonably possible changes of the respective assumptions occurring at the end of the reporting period, while holding all other assumptions constant.
If the discount rate increases / (decrease) by 1%, the defined benefit obligation would be `329.24 Million (`363.46 Million) as at March 31, 2019.
If the expected salary growth increases / (decrease) by 1%, the defined benefit obligation would be `360.28 Million (`331.49 Million) as at March 31, 2019.
The sensitivity analysis presented above may not be representative of the actual change in the defined benefit obligation as it is unlikely that the change in assumptions would occur in isolation of one another as some of the assumptions may be correlated.
Furthermore, in presenting the above sensitivity analysis, the present value of the defined benefit obligation has been calculated using the projected unit credit method at the end of the reporting period, which is the same as that applied in calculating the defined benefit obligation liability recognised in the balance sheet.
There was no change in the methods and assumptions used in preparing the sensitivity analysis from prior years.
There has been no change in the process used by the Group to manage its risks from prior periods.
Expected future Cash outflows towards the plan are as follows:I in Million
Financial Year Amount
2019-20 52.39
2020-21 48.83
2021-22 48.24
2022-23 47.86
2023-24 39.27
2024-25 to 2029-30 153.38
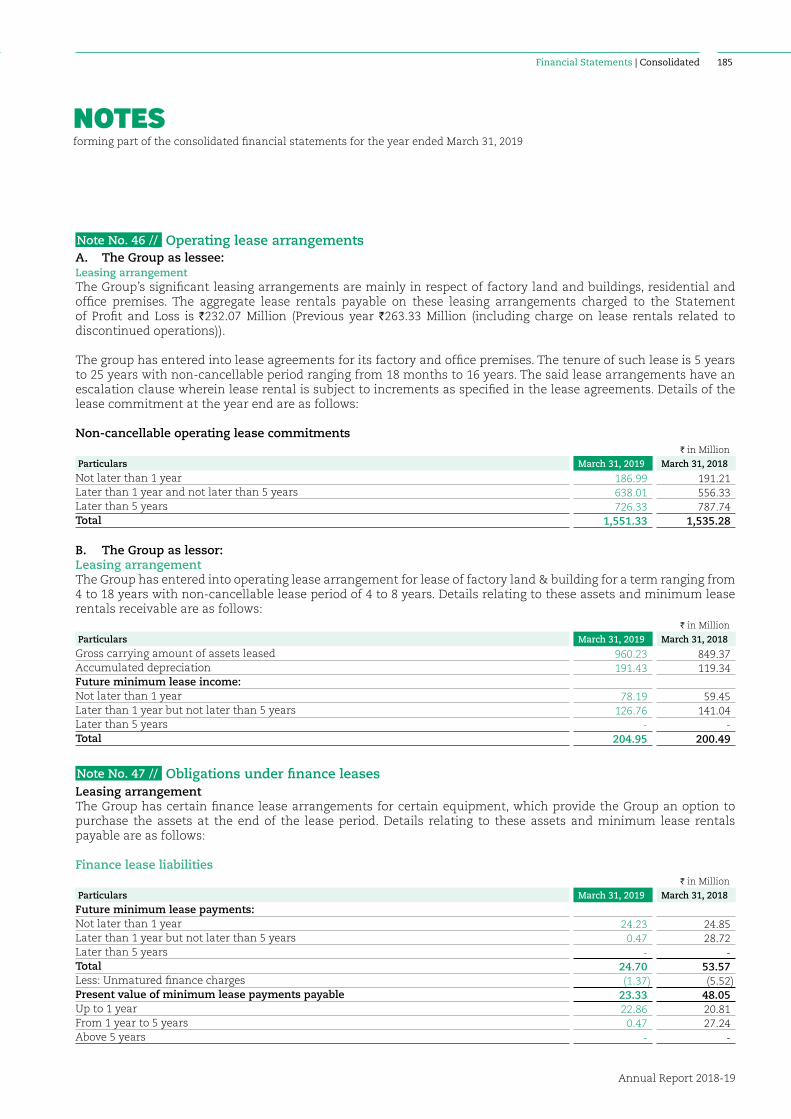
NOTESforming part of the consolidated financial statements for the year ended March 31, 2019
Annual Report 2018-19
185Financial Statements | Consolidated
Note No. 46 // Operating lease arrangementsA. The Group as lessee:Leasing arrangement The Group’s significant leasing arrangements are mainly in respect of factory land and buildings, residential and office premises. The aggregate lease rentals payable on these leasing arrangements charged to the Statement of Profit and Loss is `232.07 Million (Previous year `263.33 Million (including charge on lease rentals related to discontinued operations)).
The group has entered into lease agreements for its factory and office premises. The tenure of such lease is 5 years to 25 years with non-cancellable period ranging from 18 months to 16 years. The said lease arrangements have an escalation clause wherein lease rental is subject to increments as specified in the lease agreements. Details of the lease commitment at the year end are as follows:
Non-cancellable operating lease commitmentsI in Million
Particulars March 31, 2019 March 31, 2018
Not later than 1 year 186.99 191.21 Later than 1 year and not later than 5 years 638.01 556.33 Later than 5 years 726.33 787.74 Total 1,551.33 1,535.28
B. The Group as lessor:Leasing arrangement The Group has entered into operating lease arrangement for lease of factory land & building for a term ranging from 4 to 18 years with non-cancellable lease period of 4 to 8 years. Details relating to these assets and minimum lease rentals receivable are as follows:
I in Million
Particulars March 31, 2019 March 31, 2018
Gross carrying amount of assets leased 960.23 849.37 Accumulated depreciation 191.43 119.34 Future minimum lease income: Not later than 1 year 78.19 59.45 Later than 1 year but not later than 5 years 126.76 141.04 Later than 5 years - - Total 204.95 200.49
Note No. 47 // Obligations under finance leasesLeasing arrangement The Group has certain finance lease arrangements for certain equipment, which provide the Group an option to purchase the assets at the end of the lease period. Details relating to these assets and minimum lease rentals payable are as follows:
Finance lease liabilitiesI in Million
Particulars March 31, 2019 March 31, 2018
Future minimum lease payments: Not later than 1 year 24.23 24.85 Later than 1 year but not later than 5 years 0.47 28.72 Later than 5 years - - Total 24.70 53.57 Less: Unmatured finance charges (1.37) (5.52)Present value of minimum lease payments payable 23.33 48.05 Up to 1 year 22.86 20.81 From 1 year to 5 years 0.47 27.24 Above 5 years - -

NOTESforming part of the consolidated financial statements for the year ended March 31, 2019
Strides Pharma Science Limited
186
Details of assets taken on finance lease:I in Million
Particulars March 31, 2019 March 31, 2018
Gross block:Plant and equipment 15.06 14.11 Office equipment 87.99 87.99 Vehicles 11.17 10.46 Total Gross Block 114.22 112.56 Net Block:Plant and equipment 8.16 9.56 Office equipment 21.95 39.56 Vehicles 4.36 4.75 Total Net Block 34.47 53.87
Note No. 48 // Earnings per share
I in Million
Particulars Year endedMarch 31, 2019
Year ended March 31, 2018
Basic earnings per share:From continuing operations 5.99 6.08 From discontinued operations 30.26 68.17 Total basic earnings per share 36.25 74.25 Diluted earnings per share:From continuing operations 5.99 6.08 From discontinued operations 30.25 68.15 Total diluted earnings per share 36.24 74.23
Earnings used in computing basic and diluted earnings per shareI in Million
Particulars Year endedMarch 31, 2019
Year ended March 31, 2018
Profit/(loss) attributable to the equity holders of the CompanyFrom continuing operations 536.76 543.94 From discontinued operations 2,709.42 6,101.23 Total operations 3,246.18 6,645.17
Weighted average number of shares used as the denominatorI in Million
Particulars Year endedMarch 31, 2019
Year ended March 31, 2018
Weighted average number of equity shares used as denominator in calculating basic earnings per share
89,548,390 89,479,936
Adjustments for calculation of diluted earnings per share: - employee stock options 26,393 31,334 Weighted average number of equity shares used as denominator in calculating diluted earnings per share 89,574,783 89,511,270
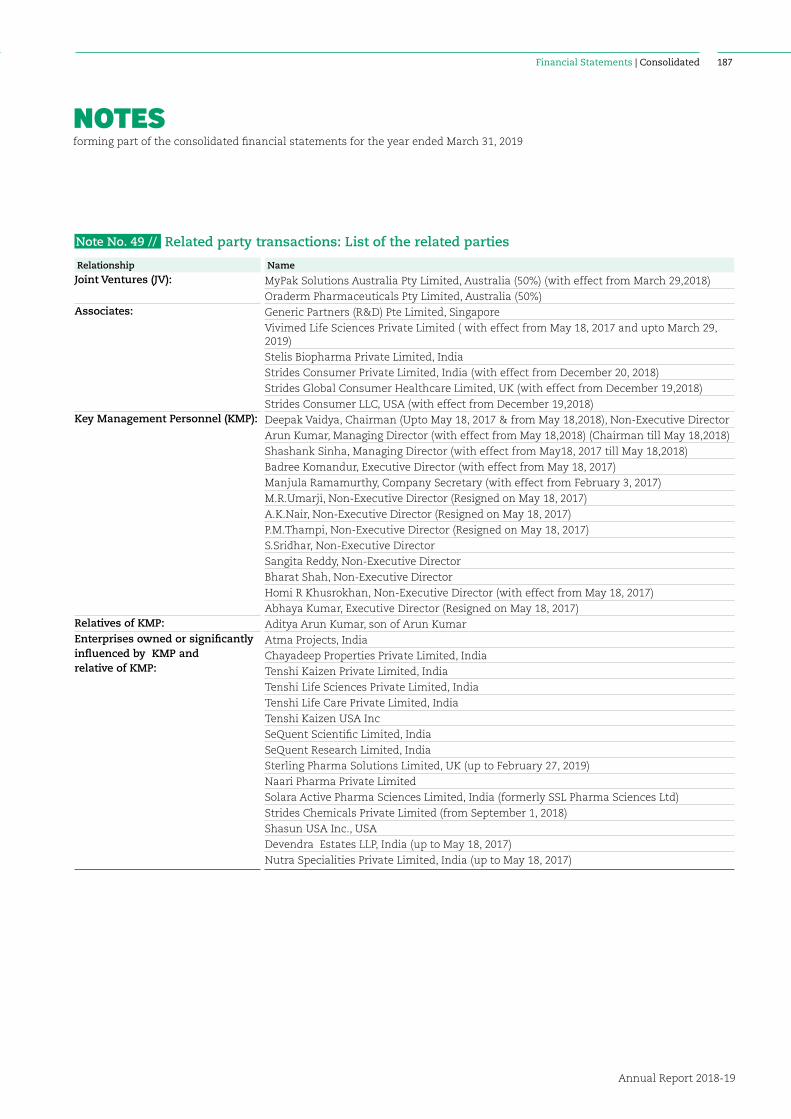
NOTESforming part of the consolidated financial statements for the year ended March 31, 2019
Annual Report 2018-19
187Financial Statements | Consolidated
Note No. 49 // Related party transactions: List of the related parties
Relationship Name
Joint Ventures (JV): MyPak Solutions Australia Pty Limited, Australia (50%) (with effect from March 29,2018)
Oraderm Pharmaceuticals Pty Limited, Australia (50%)Associates: Generic Partners (R&D) Pte Limited, Singapore
Vivimed Life Sciences Private Limited ( with effect from May 18, 2017 and upto March 29, 2019)
Stelis Biopharma Private Limited, India
Strides Consumer Private Limited, India (with effect from December 20, 2018)
Strides Global Consumer Healthcare Limited, UK (with effect from December 19,2018)
Strides Consumer LLC, USA (with effect from December 19,2018)Key Management Personnel (KMP): Deepak Vaidya, Chairman (Upto May 18, 2017 & from May 18,2018), Non-Executive Director
Arun Kumar, Managing Director (with effect from May 18,2018) (Chairman till May 18,2018)
Shashank Sinha, Managing Director (with effect from May18, 2017 till May 18,2018)
Badree Komandur, Executive Director (with effect from May 18, 2017)
Manjula Ramamurthy, Company Secretary (with effect from February 3, 2017)
M.R.Umarji, Non-Executive Director (Resigned on May 18, 2017)
A.K.Nair, Non-Executive Director (Resigned on May 18, 2017)
P.M.Thampi, Non-Executive Director (Resigned on May 18, 2017)
S.Sridhar, Non-Executive Director
Sangita Reddy, Non-Executive Director
Bharat Shah, Non-Executive Director
Homi R Khusrokhan, Non-Executive Director (with effect from May 18, 2017)
Abhaya Kumar, Executive Director (Resigned on May 18, 2017)Relatives of KMP: Aditya Arun Kumar, son of Arun KumarEnterprises owned or significantly influenced by KMP and relative of KMP:
Atma Projects, India
Chayadeep Properties Private Limited, India
Tenshi Kaizen Private Limited, India
Tenshi Life Sciences Private Limited, India
Tenshi Life Care Private Limited, India
Tenshi Kaizen USA Inc
SeQuent Scientific Limited, India
SeQuent Research Limited, India
Sterling Pharma Solutions Limited, UK (up to February 27, 2019)
Naari Pharma Private Limited
Solara Active Pharma Sciences Limited, India (formerly SSL Pharma Sciences Ltd)
Strides Chemicals Private Limited (from September 1, 2018)
Shasun USA Inc., USA
Devendra Estates LLP, India (up to May 18, 2017)
Nutra Specialities Private Limited, India (up to May 18, 2017)
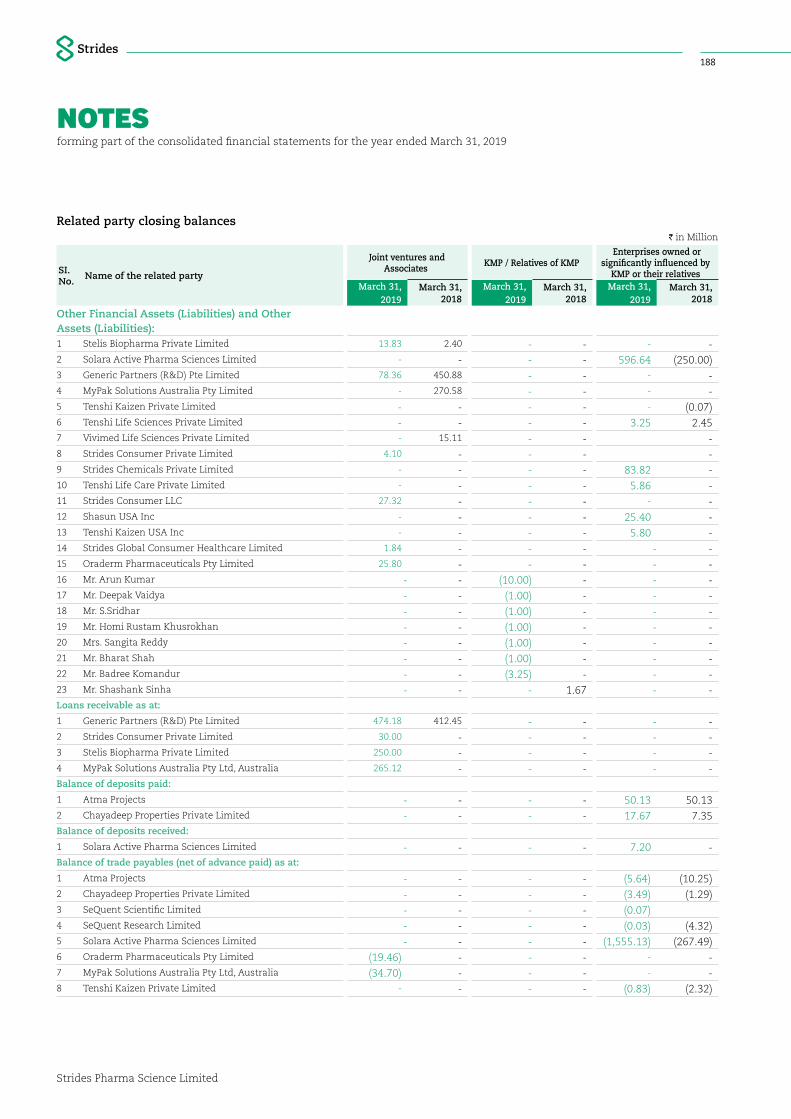
NOTESforming part of the consolidated financial statements for the year ended March 31, 2019
Strides Pharma Science Limited
188
Related party closing balances I in Million
SI. No. Name of the related party
Joint ventures and Associates KMP / Relatives of KMP
Enterprises owned or significantly influenced by
KMP or their relatives March 31,
2019March 31,
2018March 31,
2019March 31,
2018March 31,
2019March 31,
2018
Other Financial Assets (Liabilities) and Other Assets (Liabilities):1 Stelis Biopharma Private Limited 13.83 2.40 - - - -2 Solara Active Pharma Sciences Limited - - - - 596.64 (250.00)3 Generic Partners (R&D) Pte Limited 78.36 450.88 - - - -4 MyPak Solutions Australia Pty Limited - 270.58 - - - -5 Tenshi Kaizen Private Limited - - - - - (0.07)6 Tenshi Life Sciences Private Limited - - - - 3.25 2.45 7 Vivimed Life Sciences Private Limited - 15.11 - - -8 Strides Consumer Private Limited 4.10 - - - -9 Strides Chemicals Private Limited - - - - 83.82 -10 Tenshi Life Care Private Limited - - - - 5.86 -11 Strides Consumer LLC 27.32 - - - - -12 Shasun USA Inc - - - - 25.40 -13 Tenshi Kaizen USA Inc - - - - 5.80 -14 Strides Global Consumer Healthcare Limited 1.84 - - - - -15 Oraderm Pharmaceuticals Pty Limited 25.80 - - - - -16 Mr. Arun Kumar - - (10.00) - - -17 Mr. Deepak Vaidya - - (1.00) - - -18 Mr. S.Sridhar - - (1.00) - - -19 Mr. Homi Rustam Khusrokhan - - (1.00) - - -20 Mrs. Sangita Reddy - - (1.00) - - -21 Mr. Bharat Shah - - (1.00) - - -22 Mr. Badree Komandur - - (3.25) - - -23 Mr. Shashank Sinha - - - 1.67 - -Loans receivable as at:
1 Generic Partners (R&D) Pte Limited 474.18 412.45 - - - -2 Strides Consumer Private Limited 30.00 - - - - -3 Stelis Biopharma Private Limited 250.00 - - - - -4 MyPak Solutions Australia Pty Ltd, Australia 265.12 - - - - -Balance of deposits paid:
1 Atma Projects - - - - 50.13 50.13 2 Chayadeep Properties Private Limited - - - - 17.67 7.35 Balance of deposits received:
1 Solara Active Pharma Sciences Limited - - - - 7.20 -Balance of trade payables (net of advance paid) as at:
1 Atma Projects - - - - (5.64) (10.25)2 Chayadeep Properties Private Limited - - - - (3.49) (1.29)3 SeQuent Scientific Limited - - - - (0.07)4 SeQuent Research Limited - - - - (0.03) (4.32)5 Solara Active Pharma Sciences Limited - - - - (1,555.13) (267.49)6 Oraderm Pharmaceuticals Pty Limited (19.46) - - - - -7 MyPak Solutions Australia Pty Ltd, Australia (34.70) - - - - -8 Tenshi Kaizen Private Limited - - - - (0.83) (2.32)
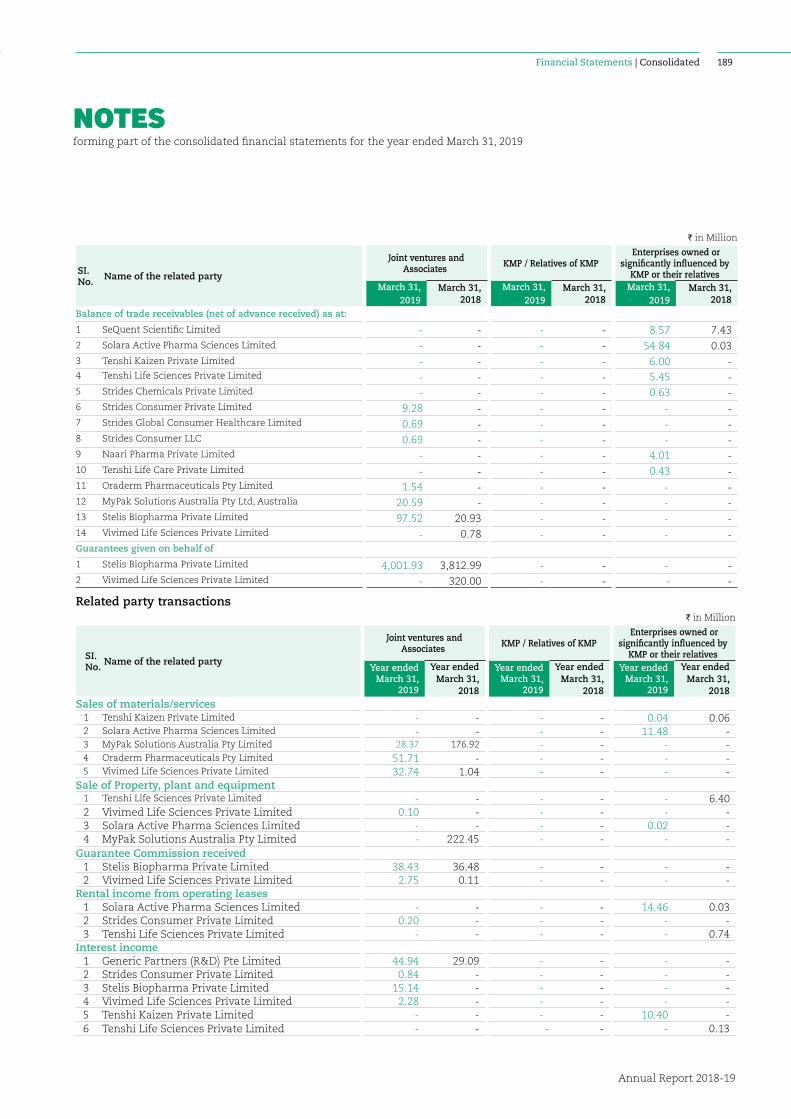
NOTESforming part of the consolidated financial statements for the year ended March 31, 2019
Annual Report 2018-19
189Financial Statements | Consolidated
I in Million
SI. No. Name of the related party
Joint ventures and Associates KMP / Relatives of KMP
Enterprises owned or significantly influenced by
KMP or their relatives March 31,
2019March 31,
2018March 31,
2019March 31,
2018March 31,
2019March 31,
2018Balance of trade receivables (net of advance received) as at:
1 SeQuent Scientific Limited - - - - 8.57 7.43 2 Solara Active Pharma Sciences Limited - - - - 54.84 0.03 3 Tenshi Kaizen Private Limited - - - - 6.00 -4 Tenshi Life Sciences Private Limited - - - - 5.45 -5 Strides Chemicals Private Limited - - - - 0.63 -6 Strides Consumer Private Limited 9.28 - - - - -7 Strides Global Consumer Healthcare Limited 0.69 - - - - -8 Strides Consumer LLC 0.69 - - - - -9 Naari Pharma Private Limited - - - - 4.01 -10 Tenshi Life Care Private Limited - - - - 0.43 -11 Oraderm Pharmaceuticals Pty Limited 1.54 - - - - -12 MyPak Solutions Australia Pty Ltd, Australia 20.59 - - - - -13 Stelis Biopharma Private Limited 97.52 20.93 - - - -14 Vivimed Life Sciences Private Limited - 0.78 - - - -Guarantees given on behalf of
1 Stelis Biopharma Private Limited 4,001.93 3,812.99 - - - -2 Vivimed Life Sciences Private Limited - 320.00 - - - -
Related party transactions I in Million
SI. No. Name of the related party
Joint ventures and Associates KMP / Relatives of KMP
Enterprises owned or significantly influenced by
KMP or their relatives Year ended
March 31, 2019
Year ended March 31,
2018
Year ended March 31,
2019
Year ended March 31,
2018
Year ended March 31,
2019
Year ended March 31,
2018Sales of materials/services
1 Tenshi Kaizen Private Limited - - - - 0.04 0.06 2 Solara Active Pharma Sciences Limited - - - - 11.48 -3 MyPak Solutions Australia Pty Limited 28.37 176.92 - - - -4 Oraderm Pharmaceuticals Pty Limited 51.71 - - - - -5 Vivimed Life Sciences Private Limited 32.74 1.04 - - - -
Sale of Property, plant and equipment1 Tenshi Life Sciences Private Limited - - - - - 6.40 2 Vivimed Life Sciences Private Limited 0.10 - - - - -3 Solara Active Pharma Sciences Limited - - - - 0.02 -4 MyPak Solutions Australia Pty Limited - 222.45 - - - -
Guarantee Commission received1 Stelis Biopharma Private Limited 38.43 36.48 - - - -2 Vivimed Life Sciences Private Limited 2.75 0.11 - - - -
Rental income from operating leases1 Solara Active Pharma Sciences Limited - - - - 14.46 0.03 2 Strides Consumer Private Limited 0.20 - - - - -3 Tenshi Life Sciences Private Limited - - - - - 0.74
Interest income1 Generic Partners (R&D) Pte Limited 44.94 29.09 - - - -2 Strides Consumer Private Limited 0.84 - - - - -3 Stelis Biopharma Private Limited 15.14 - - - - -4 Vivimed Life Sciences Private Limited 2.28 - - - - -5 Tenshi Kaizen Private Limited - - - - 10.40 -6 Tenshi Life Sciences Private Limited - - - - - 0.13

NOTESforming part of the consolidated financial statements for the year ended March 31, 2019
Strides Pharma Science Limited
190
I in Million
SI. No. Name of the related party
Joint ventures and Associates KMP / Relatives of KMP
Enterprises owned or significantly influenced by
KMP or their relatives Year ended
March 31, 2019
Year ended March 31,
2018
Year ended March 31,
2019
Year ended March 31,
2018
Year ended March 31,
2019
Year ended March 31,
2018Support service income from
1 Stelis Biopharma Private Limited 6.20 9.75 - - - -2 Strides Consumer Private Limited 1.20 - - - - -3 Strides Global Consumer Healthcare Ltd 1.87 - - - - -4 Strides Consumer LLC 3.03 - - - - -5 Vivimed Life Sciences Private Limited 24.50 - - - - -6 Sequent Scientific Limited - - - - 1.05 -7 Tenshi Life Care Private Limited - - - - 0.40 -8 Solara Active Pharma Sciences Limited - - - - 20.93 -9 Naari Pharma Private Limited - - - - 3.13 -10 Shasun USA Inc - - - - 25.65 -11 Strides Chemicals Private Limited - - - - 0.06 -12 Tenshi Life Sciences Private Limited - - - - 15.03 0.05
Purchase of materials/services1 SeQuent Research Limited - - - - 1.82 18.36 2 SeQuent Scientific Limited - - - - - 169.05 3 Solara Active Pharma Sciences Limited - - - - 3,200.63 590.67 4 Strides Chemicals Private Limited - - - - 97.24 -5 Vivimed Life Sciences Private Limited 2.43 - - - - -6 Oraderm Pharmaceuticals Pty Limited 213.85 - - - - -7 MyPak Solutions Australia Pty Limited 1.84 - - - - -8 Tenshi Kaizen Private Limited - - - 0.93 5.29
Purchase of Intangibles1 Generic Partners (R&D) Pte Limited 519.99 - - - - -
Short Term Employee Benefits paid to (Refer note (i) below)
1 Mr. Arun Kumar - - 50.00 14.03 - -2 Mr. Badree Komandur - - 32.11 33.33 - -3 Ms. Manjula Ramamurthy - - 3.38 3.18 - -4 Mr. Shashank Sinha - - 10.06 60.39 - -5 Mr. S Abhaya Kumar - - - 11.96 - -6 Mr. Aditya Arun Kumar - - - 0.27 - -
Sitting Fees paid to1 Mr. Arun Kumar - - - 0.70 - -2 Mr. Deepak Vaidya - - 1.40 0.60 - -3 Mr. M.R. Umarji - - - 0.10 - -4 Mr. P.M.Thampi - - - 0.10 - -5 Mr. S.Sridhar - - 1.60 0.90 - -6 Mr. Homi Rustam Khusrokhan - - 1.40 0.70 - -7 Mrs. Sangita Reddy - - 0.40 0.30 - -8 Mr. Bharat Shah - - 1.60 0.70 - -
Remuneration to Non-executive directors1 Mr. Deepak Vaidya - - 1.00 - - -2 Mr. S.Sridhar - - 1.00 - - -3 Mr. Homi Rustam Khusrokhan - - 1.00 - - -4 Mrs. Sangita Reddy - - 1.00 - - -5 Mr. Bharat Shah - - 1.00 - - -

NOTESforming part of the consolidated financial statements for the year ended March 31, 2019
Annual Report 2018-19
191Financial Statements | Consolidated
I in Million
SI. No. Name of the related party
Joint ventures and Associates KMP / Relatives of KMP
Enterprises owned or significantly influenced by
KMP or their relatives Year ended
March 31, 2019
Year ended March 31,
2018
Year ended March 31,
2019
Year ended March 31,
2018
Year ended March 31,
2019
Year ended March 31,
2018Rent expense
1 Atma Projects - - - - 60.44 62.08 2 Chayadeep Properties Private Limited - - - - 19.39 7.77 3 Devendra Estate LLP - - - - - 3.10
Loans / advances given / repaid by the group1 Solara Active Pharma Sciences Limited - - - - - 262.50 2 Stelis Biopharma Private Limited 250.00 78.00 - - - -3 Strides Consumer Private Limited 5.00 - - - - -4 Generic Partners (R&D) Pte Limited 24.63 412.45 - - - -5 Tenshi Kaizen Private Limited - - - - 150.00 -6 MyPak Solutions Australia Pty Limited - 270.58 - - - -7 Vivimed Life Sciences Private Limited 166.20 115.12 - - - -
Loans / advances taken by Company / repaid to the group
1 Solara Active Pharma Sciences Limited - - - - - 500.00 2 Stelis Biopharma Private Limited - 76.40 - - - -3 Tenshi Kaizen Private Limited - - - - 150.00 -4 Vivimed Life Sciences Private Limited - 100.00 - - - -
Reimbursement of expenses incurred on behalf of1 Solara Active Pharma Sciences Limited - - - - 74.24 124.03 2 Stelis Biopharma Private Limited 35.99 63.59 - - - -3 Generic Partners (R&D) Pte Limited 167.18 256.21 - - - -4 Strides Consumer Private Limited 4.02 - - - - -5 Vivimed Life Sciences Private Limited 4.90 - - - - -6 Oraderm Pharmaceuticals Pty Limited 30.46 - - - - -7 MyPak Solutions Australia Pty Limited 27.56 - - - - -8 Naari Pharma Private Limited - - - - 0.28 -9 Strides Chemicals Private Limited - - - - 0.53 -10 Tenshi Life Sciences Private Ltd - - - - 4.56 -11 Tenshi Kaizen Private Limited - - - - 15.84 -12 Tenshi Life Care Private Limited - - - - 3.41 -13 Tenshi Kaizen USA Inc - - - - 5.85 -14 Sterling Pharma Solutions Limited - - - - - 5.29
Reimbursement of expenses incurred by1 Chayadeep Properties Private Limited - - - - 13.38 -2 Solara Active Pharma Sciences Limited - - - - 119.25 -3 Sterling Pharma Solutions Limited - - - - 15.24 -
Lease deposit received1 Solara Active Pharma Sciences Limited - - - - 7.20 -
Lease deposit Paid1 Chayadeep Properties Private Limited - - - - 10.32 -
Investments during the year1 Vivimed Life Sciences Private Limited - 658.62 - - - -2 Stelis Biopharma Private Limited 750.00 - - - - -
Sale of Business Division1 Solara Active Pharma Sciences Limited - - - - 347.57 -
Investments sold to1 Solara Active Pharma Sciences Limited - - - - 1,310.00 -
Donation1 Strides Foundation Trust - - - - 22.75 13.99
Notes
i. The compensation excludes gratuity & compensated absences which cannot be separately identified from the composite amount advised by the actuary.
ii. Transactions and balances with its own subsidiaries which are eliminated on consolidation are not included above.
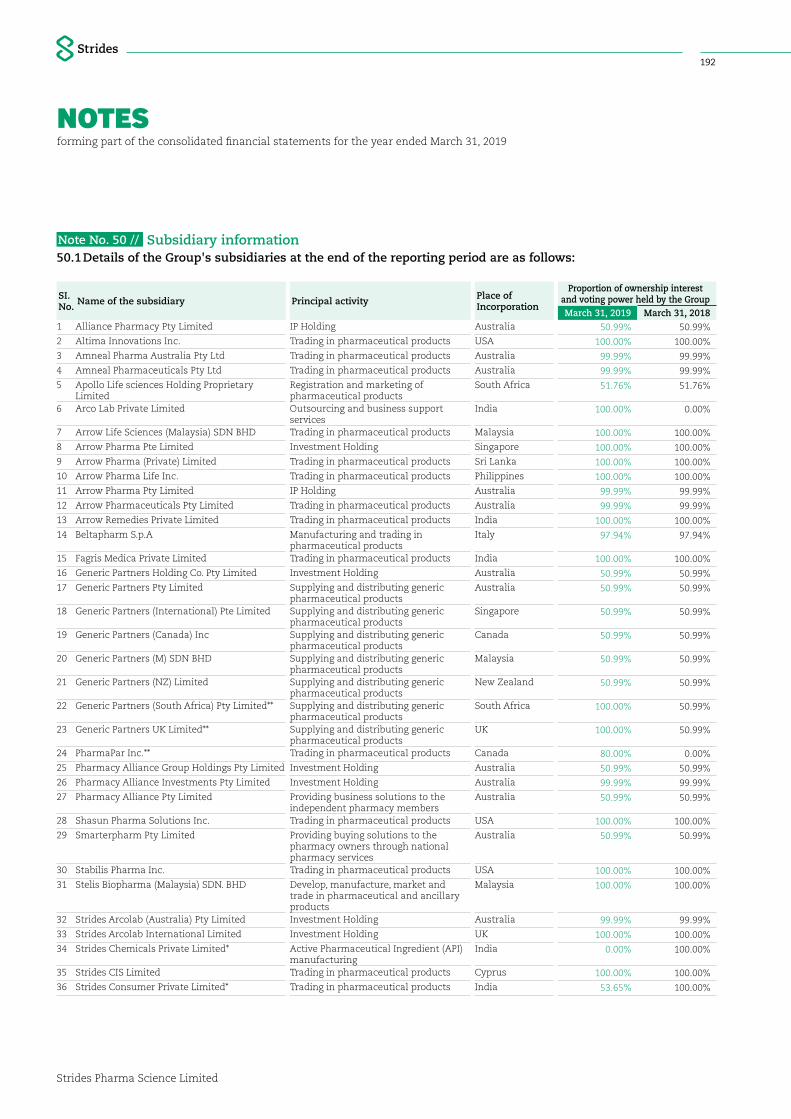
NOTESforming part of the consolidated financial statements for the year ended March 31, 2019
Strides Pharma Science Limited
192
Note No. 50 // Subsidiary information50.1 Details of the Group's subsidiaries at the end of the reporting period are as follows:
SI. No. Name of the subsidiary Principal activity Place of
Incorporation
Proportion of ownership interest and voting power held by the GroupMarch 31, 2019 March 31, 2018
1 Alliance Pharmacy Pty Limited IP Holding Australia 50.99% 50.99%
2 Altima Innovations Inc. Trading in pharmaceutical products USA 100.00% 100.00%
3 Amneal Pharma Australia Pty Ltd Trading in pharmaceutical products Australia 99.99% 99.99%
4 Amneal Pharmaceuticals Pty Ltd Trading in pharmaceutical products Australia 99.99% 99.99%
5 Apollo Life sciences Holding Proprietary Limited
Registration and marketing of pharmaceutical products
South Africa 51.76% 51.76%
6 Arco Lab Private Limited Outsourcing and business support services
India 100.00% 0.00%
7 Arrow Life Sciences (Malaysia) SDN BHD Trading in pharmaceutical products Malaysia 100.00% 100.00%
8 Arrow Pharma Pte Limited Investment Holding Singapore 100.00% 100.00%
9 Arrow Pharma (Private) Limited Trading in pharmaceutical products Sri Lanka 100.00% 100.00%
10 Arrow Pharma Life Inc. Trading in pharmaceutical products Philippines 100.00% 100.00%
11 Arrow Pharma Pty Limited IP Holding Australia 99.99% 99.99%
12 Arrow Pharmaceuticals Pty Limited Trading in pharmaceutical products Australia 99.99% 99.99%
13 Arrow Remedies Private Limited Trading in pharmaceutical products India 100.00% 100.00%
14 Beltapharm S.p.A Manufacturing and trading in pharmaceutical products
Italy 97.94% 97.94%
15 Fagris Medica Private Limited Trading in pharmaceutical products India 100.00% 100.00%
16 Generic Partners Holding Co. Pty Limited Investment Holding Australia 50.99% 50.99%
17 Generic Partners Pty Limited Supplying and distributing generic pharmaceutical products
Australia 50.99% 50.99%
18 Generic Partners (International) Pte Limited Supplying and distributing generic pharmaceutical products
Singapore 50.99% 50.99%
19 Generic Partners (Canada) Inc Supplying and distributing generic pharmaceutical products
Canada 50.99% 50.99%
20 Generic Partners (M) SDN BHD Supplying and distributing generic pharmaceutical products
Malaysia 50.99% 50.99%
21 Generic Partners (NZ) Limited Supplying and distributing generic pharmaceutical products
New Zealand 50.99% 50.99%
22 Generic Partners (South Africa) Pty Limited** Supplying and distributing generic pharmaceutical products
South Africa 100.00% 50.99%
23 Generic Partners UK Limited** Supplying and distributing generic pharmaceutical products
UK 100.00% 50.99%
24 PharmaPar Inc.** Trading in pharmaceutical products Canada 80.00% 0.00%
25 Pharmacy Alliance Group Holdings Pty Limited Investment Holding Australia 50.99% 50.99%
26 Pharmacy Alliance Investments Pty Limited Investment Holding Australia 99.99% 99.99%
27 Pharmacy Alliance Pty Limited Providing business solutions to the independent pharmacy members
Australia 50.99% 50.99%
28 Shasun Pharma Solutions Inc. Trading in pharmaceutical products USA 100.00% 100.00%
29 Smarterpharm Pty Limited Providing buying solutions to the pharmacy owners through national pharmacy services
Australia 50.99% 50.99%
30 Stabilis Pharma Inc. Trading in pharmaceutical products USA 100.00% 100.00%
31 Stelis Biopharma (Malaysia) SDN. BHD Develop, manufacture, market and trade in pharmaceutical and ancillary products
Malaysia 100.00% 100.00%
32 Strides Arcolab (Australia) Pty Limited Investment Holding Australia 99.99% 99.99%
33 Strides Arcolab International Limited Investment Holding UK 100.00% 100.00%
34 Strides Chemicals Private Limited* Active Pharmaceutical Ingredient (API) manufacturing
India 0.00% 100.00%
35 Strides CIS Limited Trading in pharmaceutical products Cyprus 100.00% 100.00%
36 Strides Consumer Private Limited* Trading in pharmaceutical products India 53.65% 100.00%
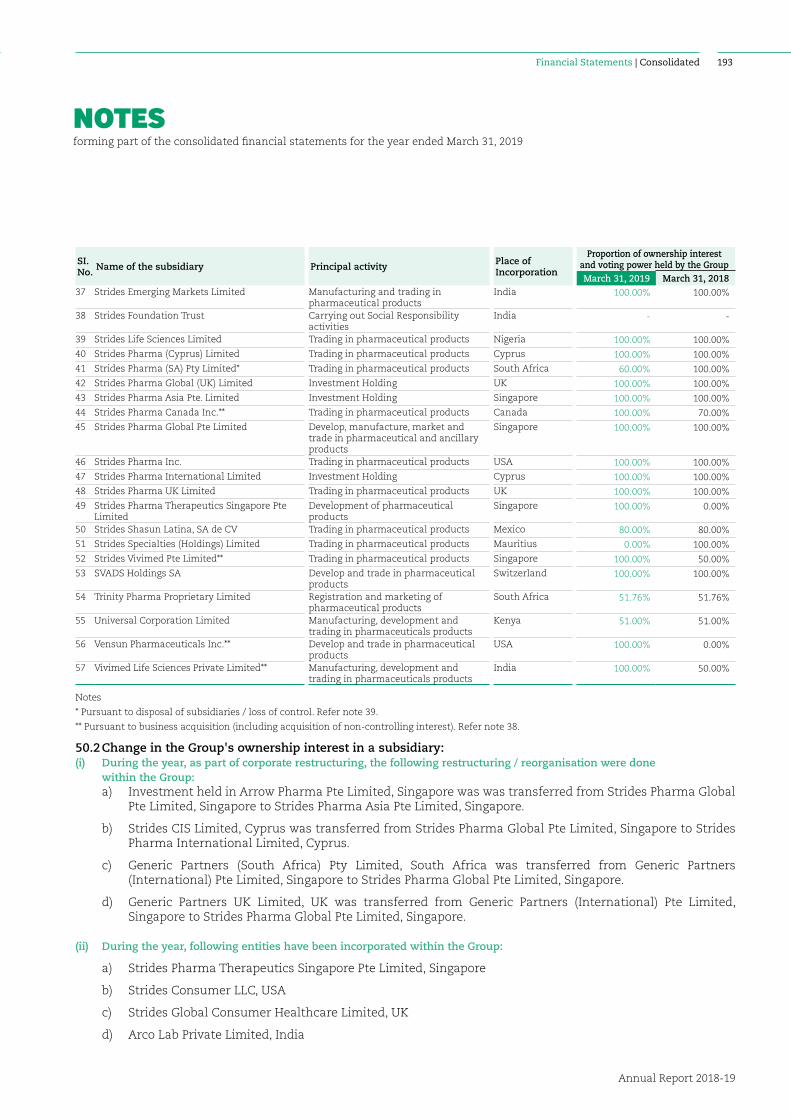
NOTESforming part of the consolidated financial statements for the year ended March 31, 2019
Annual Report 2018-19
193Financial Statements | Consolidated
SI. No. Name of the subsidiary Principal activity Place of
Incorporation
Proportion of ownership interest and voting power held by the GroupMarch 31, 2019 March 31, 2018
37 Strides Emerging Markets Limited Manufacturing and trading in pharmaceutical products
India 100.00% 100.00%
38 Strides Foundation Trust Carrying out Social Responsibility activities
India - -
39 Strides Life Sciences Limited Trading in pharmaceutical products Nigeria 100.00% 100.00%
40 Strides Pharma (Cyprus) Limited Trading in pharmaceutical products Cyprus 100.00% 100.00%
41 Strides Pharma (SA) Pty Limited* Trading in pharmaceutical products South Africa 60.00% 100.00%
42 Strides Pharma Global (UK) Limited Investment Holding UK 100.00% 100.00%
43 Strides Pharma Asia Pte. Limited Investment Holding Singapore 100.00% 100.00%
44 Strides Pharma Canada Inc.** Trading in pharmaceutical products Canada 100.00% 70.00%
45 Strides Pharma Global Pte Limited Develop, manufacture, market and trade in pharmaceutical and ancillary products
Singapore 100.00% 100.00%
46 Strides Pharma Inc. Trading in pharmaceutical products USA 100.00% 100.00%
47 Strides Pharma International Limited Investment Holding Cyprus 100.00% 100.00%
48 Strides Pharma UK Limited Trading in pharmaceutical products UK 100.00% 100.00%
49 Strides Pharma Therapeutics Singapore Pte Limited
Development of pharmaceutical products
Singapore 100.00% 0.00%
50 Strides Shasun Latina, SA de CV Trading in pharmaceutical products Mexico 80.00% 80.00%
51 Strides Specialties (Holdings) Limited Trading in pharmaceutical products Mauritius 0.00% 100.00%
52 Strides Vivimed Pte Limited** Trading in pharmaceutical products Singapore 100.00% 50.00%
53 SVADS Holdings SA Develop and trade in pharmaceutical products
Switzerland 100.00% 100.00%
54 Trinity Pharma Proprietary Limited Registration and marketing of pharmaceutical products
South Africa 51.76% 51.76%
55 Universal Corporation Limited Manufacturing, development and trading in pharmaceuticals products
Kenya 51.00% 51.00%
56 Vensun Pharmaceuticals Inc.** Develop and trade in pharmaceutical products
USA 100.00% 0.00%
57 Vivimed Life Sciences Private Limited** Manufacturing, development and trading in pharmaceuticals products
India 100.00% 50.00%
Notes
* Pursuant to disposal of subsidiaries / loss of control. Refer note 39.
** Pursuant to business acquisition (including acquisition of non-controlling interest). Refer note 38.
50.2 Change in the Group's ownership interest in a subsidiary:(i) During the year, as part of corporate restructuring, the following restructuring / reorganisation were done
within the Group: a) Investment held in Arrow Pharma Pte Limited, Singapore was was transferred from Strides Pharma Global
Pte Limited, Singapore to Strides Pharma Asia Pte Limited, Singapore.
b) Strides CIS Limited, Cyprus was transferred from Strides Pharma Global Pte Limited, Singapore to Strides Pharma International Limited, Cyprus.
c) Generic Partners (South Africa) Pty Limited, South Africa was transferred from Generic Partners (International) Pte Limited, Singapore to Strides Pharma Global Pte Limited, Singapore.
d) Generic Partners UK Limited, UK was transferred from Generic Partners (International) Pte Limited, Singapore to Strides Pharma Global Pte Limited, Singapore.
(ii) During the year, following entities have been incorporated within the Group:
a) Strides Pharma Therapeutics Singapore Pte Limited, Singapore
b) Strides Consumer LLC, USA
c) Strides Global Consumer Healthcare Limited, UK
d) Arco Lab Private Limited, India
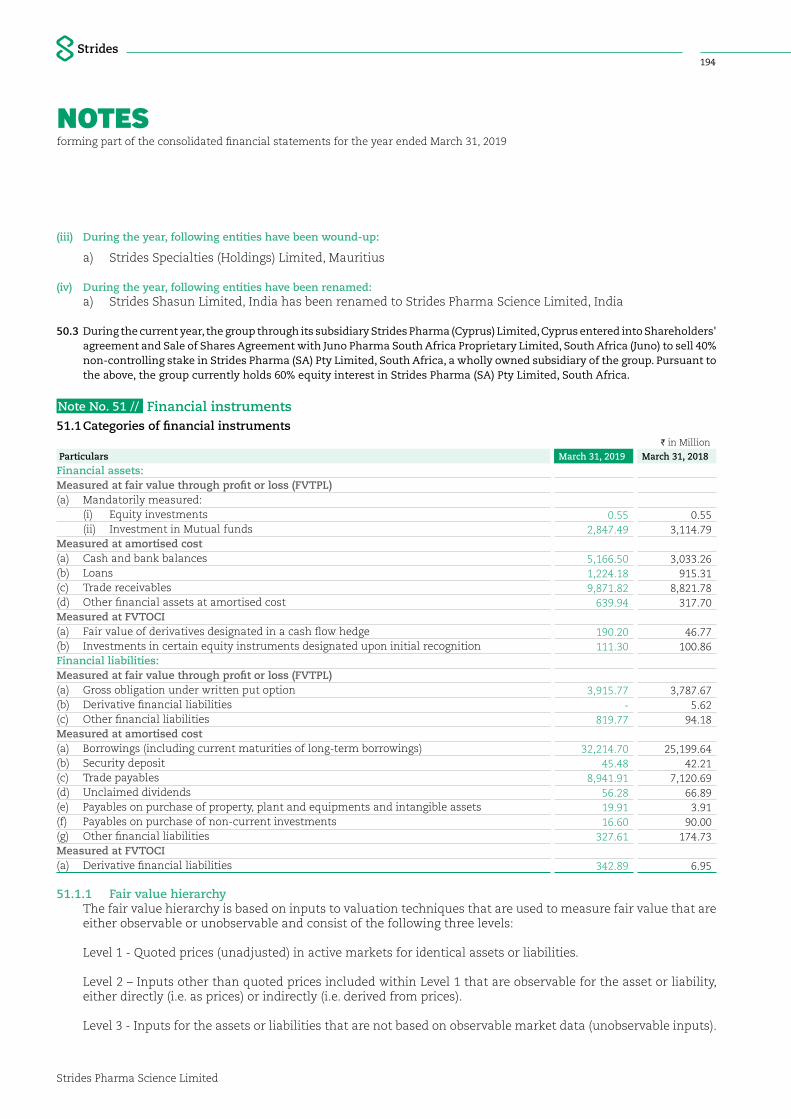
NOTESforming part of the consolidated financial statements for the year ended March 31, 2019
Strides Pharma Science Limited
194
(iii) During the year, following entities have been wound-up:
a) Strides Specialties (Holdings) Limited, Mauritius
(iv) During the year, following entities have been renamed: a) Strides Shasun Limited, India has been renamed to Strides Pharma Science Limited, India
50.3 During the current year, the group through its subsidiary Strides Pharma (Cyprus) Limited, Cyprus entered into Shareholders' agreement and Sale of Shares Agreement with Juno Pharma South Africa Proprietary Limited, South Africa (Juno) to sell 40% non-controlling stake in Strides Pharma (SA) Pty Limited, South Africa, a wholly owned subsidiary of the group. Pursuant to the above, the group currently holds 60% equity interest in Strides Pharma (SA) Pty Limited, South Africa.
Note No. 51 // Financial instruments51.1 Categories of financial instruments
I in Million
Particulars March 31, 2019 March 31, 2018
Financial assets:Measured at fair value through profit or loss (FVTPL)(a) Mandatorily measured: (i) Equity investments 0.55 0.55 (ii) Investment in Mutual funds 2,847.49 3,114.79 Measured at amortised cost(a) Cash and bank balances 5,166.50 3,033.26 (b) Loans 1,224.18 915.31 (c) Trade receivables 9,871.82 8,821.78 (d) Other financial assets at amortised cost 639.94 317.70 Measured at FVTOCI(a) Fair value of derivatives designated in a cash flow hedge 190.20 46.77 (b) Investments in certain equity instruments designated upon initial recognition 111.30 100.86 Financial liabilities:Measured at fair value through profit or loss (FVTPL)(a) Gross obligation under written put option 3,915.77 3,787.67 (b) Derivative financial liabilities - 5.62 (c) Other financial liabilities 819.77 94.18 Measured at amortised cost(a) Borrowings (including current maturities of long-term borrowings) 32,214.70 25,199.64 (b) Security deposit 45.48 42.21 (c) Trade payables 8,941.91 7,120.69 (d) Unclaimed dividends 56.28 66.89 (e) Payables on purchase of property, plant and equipments and intangible assets 19.91 3.91 (f) Payables on purchase of non-current investments 16.60 90.00 (g) Other financial liabilities 327.61 174.73 Measured at FVTOCI(a) Derivative financial liabilities 342.89 6.95
51.1.1 Fair value hierarchy The fair value hierarchy is based on inputs to valuation techniques that are used to measure fair value that are
either observable or unobservable and consist of the following three levels:
Level 1 - Quoted prices (unadjusted) in active markets for identical assets or liabilities.
Level 2 – Inputs other than quoted prices included within Level 1 that are observable for the asset or liability, either directly (i.e. as prices) or indirectly (i.e. derived from prices).
Level 3 - Inputs for the assets or liabilities that are not based on observable market data (unobservable inputs).

NOTESforming part of the consolidated financial statements for the year ended March 31, 2019
Annual Report 2018-19
195Financial Statements | Consolidated
51.1.2 Fair value of the Group's financial assets and financial liabilities that are measured at fair value on a recurring basis
Some of the Group's financial assets and financial liabilities are measured at fair value at the end of each reporting period. The following table gives information about how the fair values of these financial assets and financial liabilities are determined (in particular, the valuation technique(s) and input(s) used).
I in Million
Financial assets / financial liabilitiesFair value as at Fair value
hierarchy Valuation technique(s) and key input(s)
March 31, 2019 March 31, 2018
Financial assets:Foreign currency forward contracts designated in hedge accounting relationships (FVTOCI)
190.20 46.77 Level 2 The fair value of forward foreign contracts are determined using spot and forward exchange rates at the balance sheet date.
Equity investments (unquoted) 0.55 0.55 Level 3 The fair value of the equity instruments are determined using comparable quotes available.
Investment in Mutual fund (quoted) 2,847.49 3,114.79 Level 1 The fair value is determined based on the Net asset value published by respective funds.
Investment in equity instruments at FVTOCI (quoted) - Investment in Outlook Therapeutics Inc., USA (formerly Oncobiologics Inc., USA) (refer note a)
111.30 100.86 Level 1 The fair value of the said investment is derived based on the quoted prices on stock exchanges.
Financial liabilities:Gross obligation under put options 3,915.77 3,787.67 Level 3 The said obligation under put options are
valued using Black Scholes / Monte carlo simulation model. Significant unobservable inputs used for the said valuation are volatility and risk free interest rate (Discount rate). Refer note (b) below
Contingent consideration payable 819.77 94.18 Level 3 The fair value has been derived based on the estimated payout based on the projected profits of the subsidiary and discounted for the present value using the risk free interest rate / weighted average cost of capital.
Foreign currency forward contracts designated in hedge accounting relationships (FVTOCI)
0.15 6.95 Level 2 The fair value of forward foreign contracts are determined using forward exchange rates at the balance sheet date.
Interest rate swaps designated in hedge accounting relationships (FVTOCI)
342.74 - Level 2 Future cash flows are estimated based on forward interest rates (from observable yield curves at the end of the reporting period) and contract interest rates, discounted at a rate that reflects the credit risk of various counterparties.
Interest rate swaps designated as at FVTPL
- 5.62 Level 2 Future cash flows are estimated based on forward interest rates (from observable yield curves at the end of the reporting period) and contract interest rates, discounted at a rate that reflects the credit risk of various counterparties.
Notes:
a) These investments in equity instruments are not held for trading. Instead, they are held for medium or long-term strategic purpose. Upon the application of Ind AS 109, the Group has chosen to designate these investments in equity instruments as at FVTOCI as the directors believe that this provides a more meaningful presentation for a medium or long-term strategic investments, than reflecting changes in fair value immediately in Statement of profit and loss.
b) There is a wide range of possible fair value measurements for the valuation of exercise price of written-put options included in Level 3 of fair value hierarchy and the amount considered above represents the estimate of the fair value within that range.
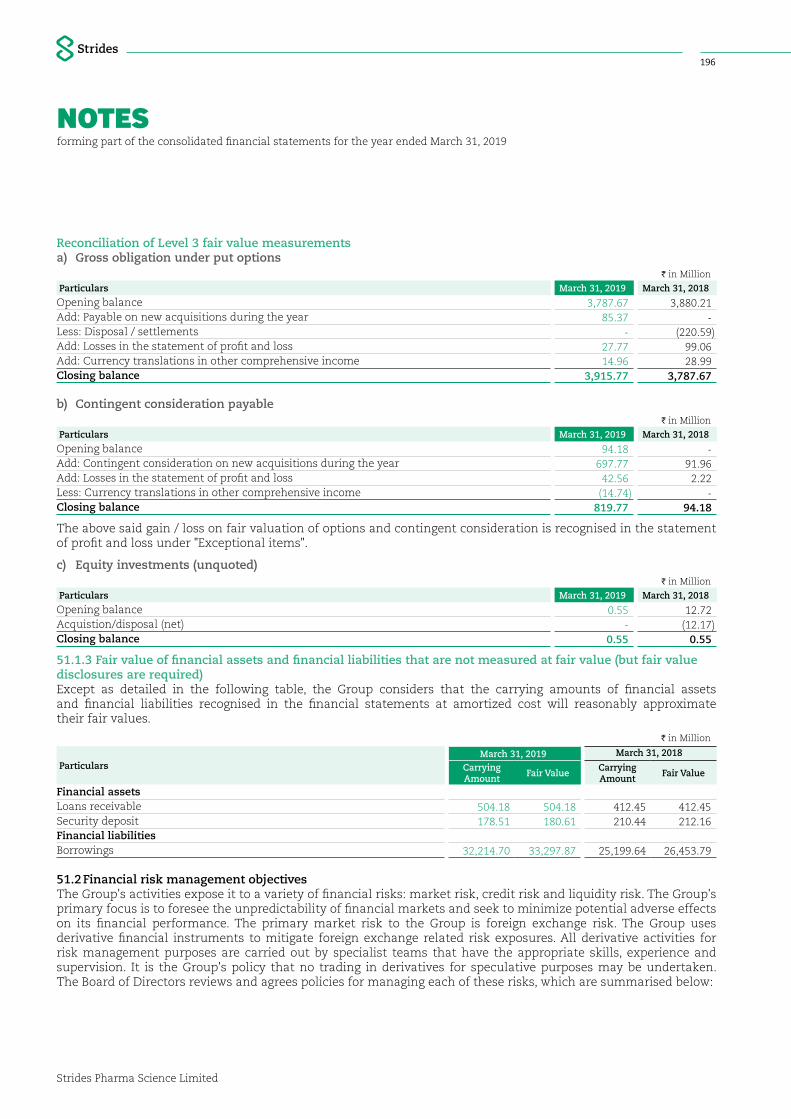
NOTESforming part of the consolidated financial statements for the year ended March 31, 2019
Strides Pharma Science Limited
196
Reconciliation of Level 3 fair value measurementsa) Gross obligation under put options
I in Million
Particulars March 31, 2019 March 31, 2018
Opening balance 3,787.67 3,880.21 Add: Payable on new acquisitions during the year 85.37 - Less: Disposal / settlements - (220.59)Add: Losses in the statement of profit and loss 27.77 99.06 Add: Currency translations in other comprehensive income 14.96 28.99 Closing balance 3,915.77 3,787.67
b) Contingent consideration payableI in Million
Particulars March 31, 2019 March 31, 2018
Opening balance 94.18 - Add: Contingent consideration on new acquisitions during the year 697.77 91.96 Add: Losses in the statement of profit and loss 42.56 2.22 Less: Currency translations in other comprehensive income (14.74) - Closing balance 819.77 94.18
The above said gain / loss on fair valuation of options and contingent consideration is recognised in the statement of profit and loss under "Exceptional items".
c) Equity investments (unquoted) I in Million
Particulars March 31, 2019 March 31, 2018
Opening balance 0.55 12.72 Acquistion/disposal (net) - (12.17)Closing balance 0.55 0.55
51.1.3 Fair value of financial assets and financial liabilities that are not measured at fair value (but fair value disclosures are required)Except as detailed in the following table, the Group considers that the carrying amounts of financial assets and financial liabilities recognised in the financial statements at amortized cost will reasonably approximate their fair values.
I in Million
ParticularsMarch 31, 2019 March 31, 2018
Carrying Amount Fair Value Carrying
Amount Fair Value
Financial assetsLoans receivable 504.18 504.18 412.45 412.45 Security deposit 178.51 180.61 210.44 212.16 Financial liabilitiesBorrowings 32,214.70 33,297.87 25,199.64 26,453.79
51.2 Financial risk management objectivesThe Group's activities expose it to a variety of financial risks: market risk, credit risk and liquidity risk. The Group's primary focus is to foresee the unpredictability of financial markets and seek to minimize potential adverse effects on its financial performance. The primary market risk to the Group is foreign exchange risk. The Group uses derivative financial instruments to mitigate foreign exchange related risk exposures. All derivative activities for risk management purposes are carried out by specialist teams that have the appropriate skills, experience and supervision. It is the Group's policy that no trading in derivatives for speculative purposes may be undertaken. The Board of Directors reviews and agrees policies for managing each of these risks, which are summarised below:
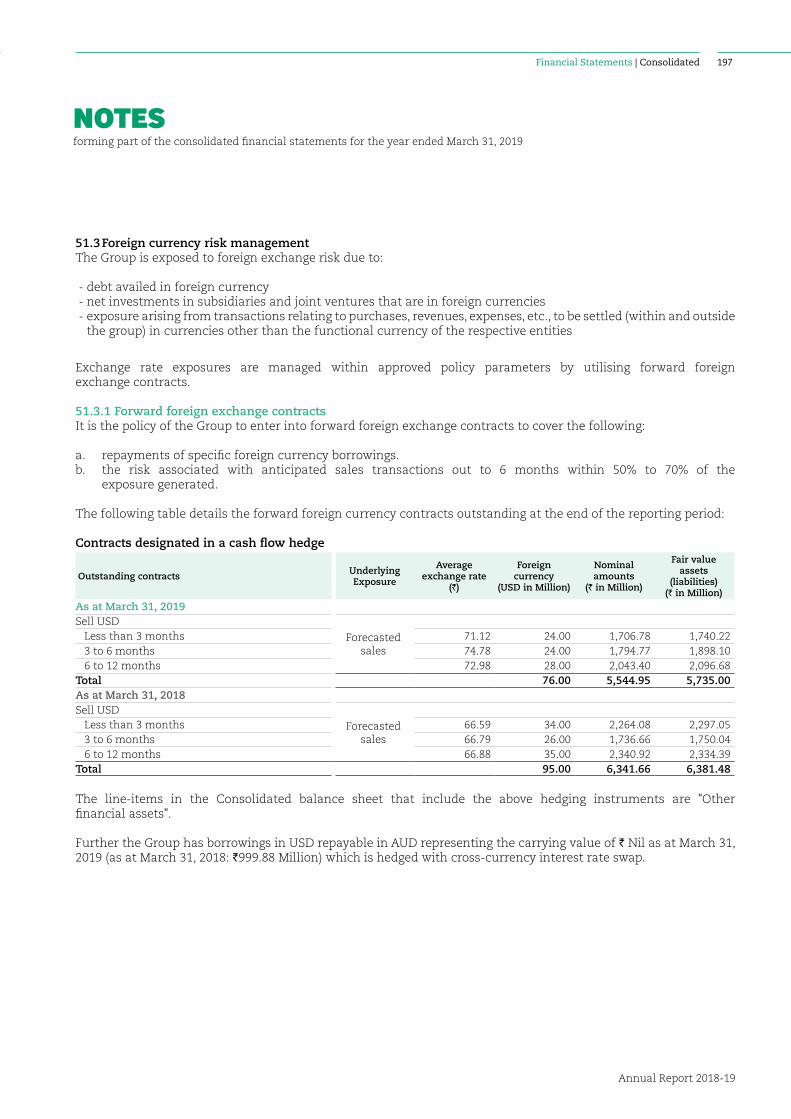
NOTESforming part of the consolidated financial statements for the year ended March 31, 2019
Annual Report 2018-19
197Financial Statements | Consolidated
51.3 Foreign currency risk managementThe Group is exposed to foreign exchange risk due to:
- debt availed in foreign currency - net investments in subsidiaries and joint ventures that are in foreign currencies - exposure arising from transactions relating to purchases, revenues, expenses, etc., to be settled (within and outside
the group) in currencies other than the functional currency of the respective entities
Exchange rate exposures are managed within approved policy parameters by utilising forward foreign exchange contracts.
51.3.1 Forward foreign exchange contractsIt is the policy of the Group to enter into forward foreign exchange contracts to cover the following:
a. repayments of specific foreign currency borrowings.b. the risk associated with anticipated sales transactions out to 6 months within 50% to 70% of the
exposure generated.
The following table details the forward foreign currency contracts outstanding at the end of the reporting period:
Contracts designated in a cash flow hedge
Outstanding contracts Underlying Exposure
Average exchange rate
(`)
Foreign currency
(USD in Million)
Nominal amounts
(` in Million)
Fair value assets
(liabilities) (` in Million)
As at March 31, 2019Sell USD
Forecasted sales
Less than 3 months 71.12 24.00 1,706.78 1,740.22 3 to 6 months 74.78 24.00 1,794.77 1,898.10 6 to 12 months 72.98 28.00 2,043.40 2,096.68 Total 76.00 5,544.95 5,735.00 As at March 31, 2018Sell USD
Forecasted sales
Less than 3 months 66.59 34.00 2,264.08 2,297.05 3 to 6 months 66.79 26.00 1,736.66 1,750.04 6 to 12 months 66.88 35.00 2,340.92 2,334.39 Total 95.00 6,341.66 6,381.48
The line-items in the Consolidated balance sheet that include the above hedging instruments are "Other financial assets".
Further the Group has borrowings in USD repayable in AUD representing the carrying value of ` Nil as at March 31, 2019 (as at March 31, 2018: `999.88 Million) which is hedged with cross-currency interest rate swap.
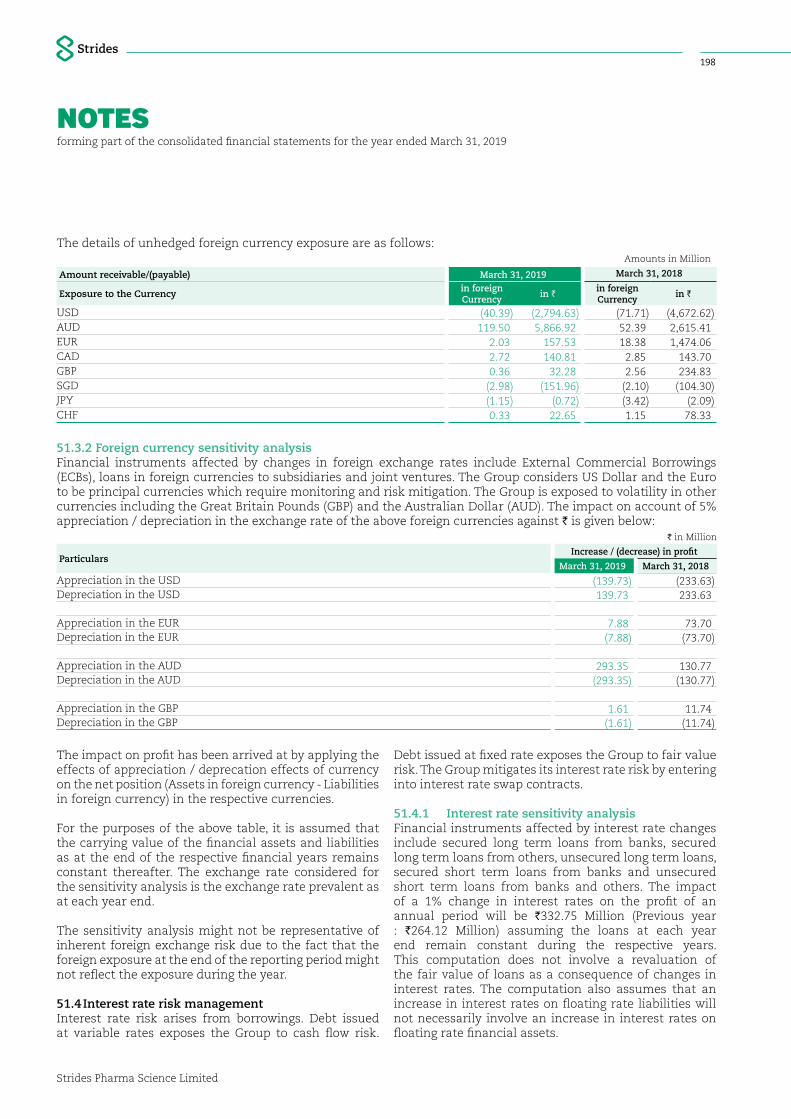
NOTESforming part of the consolidated financial statements for the year ended March 31, 2019
Strides Pharma Science Limited
198
The details of unhedged foreign currency exposure are as follows:Amounts in Million
Amount receivable/(payable) March 31, 2019 March 31, 2018
Exposure to the Currency in foreign Currency in ` in foreign
Currency in `
USD (40.39) (2,794.63) (71.71) (4,672.62)AUD 119.50 5,866.92 52.39 2,615.41 EUR 2.03 157.53 18.38 1,474.06 CAD 2.72 140.81 2.85 143.70 GBP 0.36 32.28 2.56 234.83 SGD (2.98) (151.96) (2.10) (104.30)JPY (1.15) (0.72) (3.42) (2.09)CHF 0.33 22.65 1.15 78.33
51.3.2 Foreign currency sensitivity analysisFinancial instruments affected by changes in foreign exchange rates include External Commercial Borrowings (ECBs), loans in foreign currencies to subsidiaries and joint ventures. The Group considers US Dollar and the Euro to be principal currencies which require monitoring and risk mitigation. The Group is exposed to volatility in other currencies including the Great Britain Pounds (GBP) and the Australian Dollar (AUD). The impact on account of 5% appreciation / depreciation in the exchange rate of the above foreign currencies against ` is given below:
I in Million
ParticularsIncrease / (decrease) in profit
March 31, 2019 March 31, 2018
Appreciation in the USD (139.73) (233.63)Depreciation in the USD 139.73 233.63
Appreciation in the EUR 7.88 73.70 Depreciation in the EUR (7.88) (73.70)
Appreciation in the AUD 293.35 130.77 Depreciation in the AUD (293.35) (130.77)
Appreciation in the GBP 1.61 11.74 Depreciation in the GBP (1.61) (11.74)
The impact on profit has been arrived at by applying the effects of appreciation / deprecation effects of currency on the net position (Assets in foreign currency - Liabilities in foreign currency) in the respective currencies.
For the purposes of the above table, it is assumed that the carrying value of the financial assets and liabilities as at the end of the respective financial years remains constant thereafter. The exchange rate considered for the sensitivity analysis is the exchange rate prevalent as at each year end.
The sensitivity analysis might not be representative of inherent foreign exchange risk due to the fact that the foreign exposure at the end of the reporting period might not reflect the exposure during the year.
51.4 Interest rate risk managementInterest rate risk arises from borrowings. Debt issued at variable rates exposes the Group to cash flow risk.
Debt issued at fixed rate exposes the Group to fair value risk. The Group mitigates its interest rate risk by entering into interest rate swap contracts.
51.4.1 Interest rate sensitivity analysisFinancial instruments affected by interest rate changes include secured long term loans from banks, secured long term loans from others, unsecured long term loans, secured short term loans from banks and unsecured short term loans from banks and others. The impact of a 1% change in interest rates on the profit of an annual period will be `332.75 Million (Previous year : `264.12 Million) assuming the loans at each year end remain constant during the respective years. This computation does not involve a revaluation of the fair value of loans as a consequence of changes in interest rates. The computation also assumes that an increase in interest rates on floating rate liabilities will not necessarily involve an increase in interest rates on floating rate financial assets.
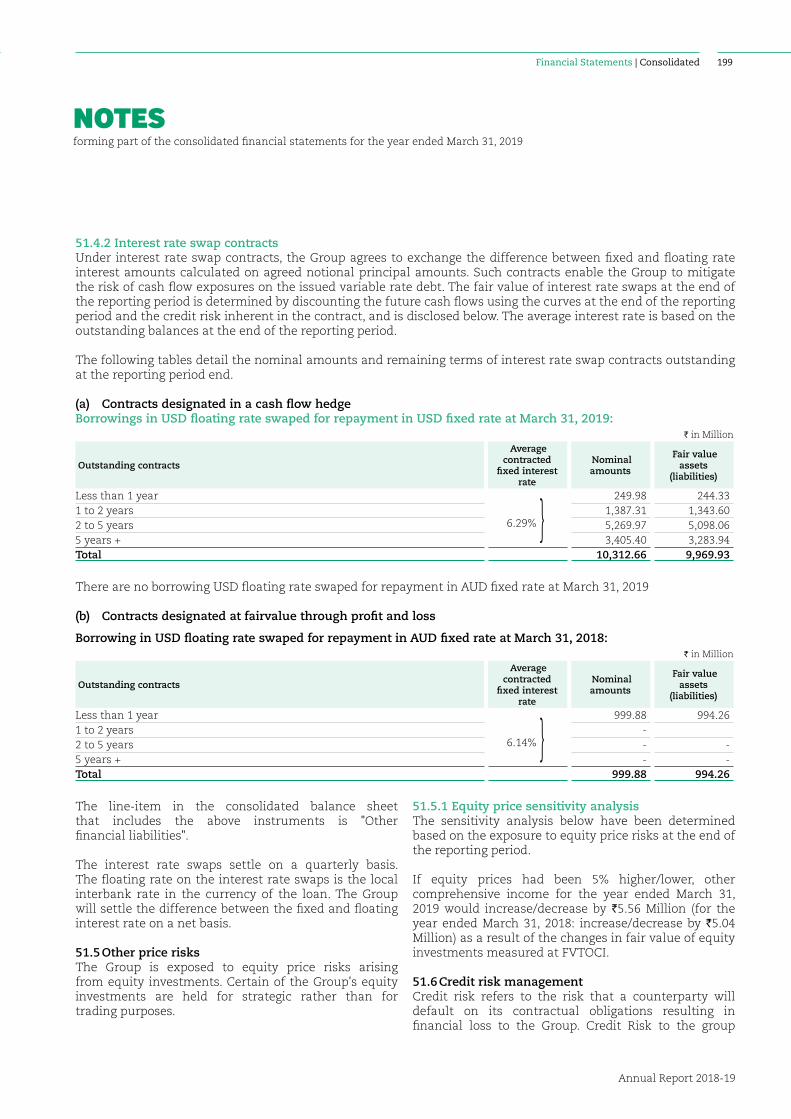
NOTESforming part of the consolidated financial statements for the year ended March 31, 2019
Annual Report 2018-19
199Financial Statements | Consolidated
51.4.2 Interest rate swap contractsUnder interest rate swap contracts, the Group agrees to exchange the difference between fixed and floating rate interest amounts calculated on agreed notional principal amounts. Such contracts enable the Group to mitigate the risk of cash flow exposures on the issued variable rate debt. The fair value of interest rate swaps at the end of the reporting period is determined by discounting the future cash flows using the curves at the end of the reporting period and the credit risk inherent in the contract, and is disclosed below. The average interest rate is based on the outstanding balances at the end of the reporting period.
The following tables detail the nominal amounts and remaining terms of interest rate swap contracts outstanding at the reporting period end.
(a) Contracts designated in a cash flow hedgeBorrowings in USD floating rate swaped for repayment in USD fixed rate at March 31, 2019:
I in Million
Outstanding contracts
Average contracted
fixed interest rate
Nominal amounts
Fair value assets
(liabilities)
Less than 1 year
6.29% } 249.98 244.33
1 to 2 years 1,387.31 1,343.60 2 to 5 years 5,269.97 5,098.06 5 years + 3,405.40 3,283.94 Total 10,312.66 9,969.93
There are no borrowing USD floating rate swaped for repayment in AUD fixed rate at March 31, 2019
(b) Contracts designated at fairvalue through profit and loss
Borrowing in USD floating rate swaped for repayment in AUD fixed rate at March 31, 2018:I in Million
Outstanding contracts
Average contracted
fixed interest rate
Nominal amounts
Fair value assets
(liabilities)
Less than 1 year
6.14% } 999.88 994.26
1 to 2 years - 2 to 5 years - - 5 years + - - Total 999.88 994.26
The line-item in the consolidated balance sheet that includes the above instruments is "Other financial liabilities".
The interest rate swaps settle on a quarterly basis. The floating rate on the interest rate swaps is the local interbank rate in the currency of the loan. The Group will settle the difference between the fixed and floating interest rate on a net basis.
51.5 Other price risksThe Group is exposed to equity price risks arising from equity investments. Certain of the Group's equity investments are held for strategic rather than for trading purposes.
51.5.1 Equity price sensitivity analysisThe sensitivity analysis below have been determined based on the exposure to equity price risks at the end of the reporting period.
If equity prices had been 5% higher/lower, other comprehensive income for the year ended March 31, 2019 would increase/decrease by `5.56 Million (for the year ended March 31, 2018: increase/decrease by `5.04 Million) as a result of the changes in fair value of equity investments measured at FVTOCI.
51.6 Credit risk managementCredit risk refers to the risk that a counterparty will default on its contractual obligations resulting in financial loss to the Group. Credit Risk to the group
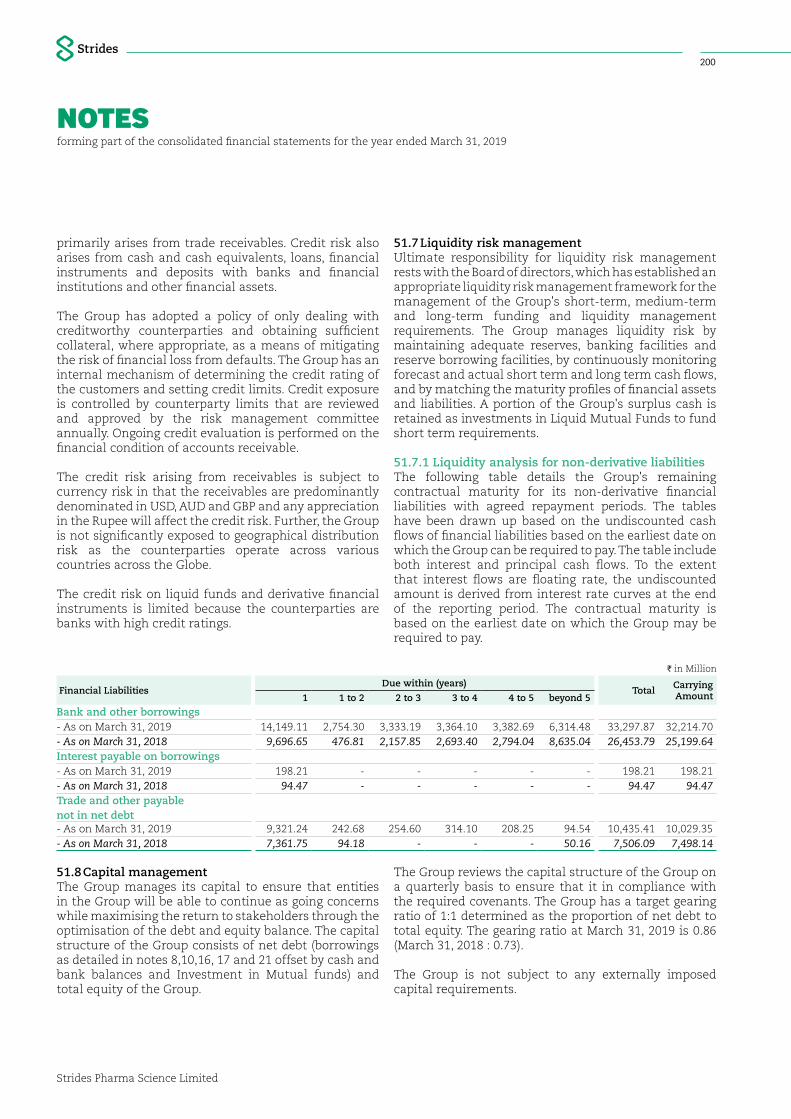
NOTESforming part of the consolidated financial statements for the year ended March 31, 2019
Strides Pharma Science Limited
200
primarily arises from trade receivables. Credit risk also arises from cash and cash equivalents, loans, financial instruments and deposits with banks and financial institutions and other financial assets.
The Group has adopted a policy of only dealing with creditworthy counterparties and obtaining sufficient collateral, where appropriate, as a means of mitigating the risk of financial loss from defaults. The Group has an internal mechanism of determining the credit rating of the customers and setting credit limits. Credit exposure is controlled by counterparty limits that are reviewed and approved by the risk management committee annually. Ongoing credit evaluation is performed on the financial condition of accounts receivable.
The credit risk arising from receivables is subject to currency risk in that the receivables are predominantly denominated in USD, AUD and GBP and any appreciation in the Rupee will affect the credit risk. Further, the Group is not significantly exposed to geographical distribution risk as the counterparties operate across various countries across the Globe.
The credit risk on liquid funds and derivative financial instruments is limited because the counterparties are banks with high credit ratings.
51.7 Liquidity risk managementUltimate responsibility for liquidity risk management rests with the Board of directors, which has established an appropriate liquidity risk management framework for the management of the Group's short-term, medium-term and long-term funding and liquidity management requirements. The Group manages liquidity risk by maintaining adequate reserves, banking facilities and reserve borrowing facilities, by continuously monitoring forecast and actual short term and long term cash flows, and by matching the maturity profiles of financial assets and liabilities. A portion of the Group's surplus cash is retained as investments in Liquid Mutual Funds to fund short term requirements.
51.7.1 Liquidity analysis for non-derivative liabilitiesThe following table details the Group's remaining contractual maturity for its non-derivative financial liabilities with agreed repayment periods. The tables have been drawn up based on the undiscounted cash flows of financial liabilities based on the earliest date on which the Group can be required to pay. The table include both interest and principal cash flows. To the extent that interest flows are floating rate, the undiscounted amount is derived from interest rate curves at the end of the reporting period. The contractual maturity is based on the earliest date on which the Group may be required to pay.
I in Million
Financial Liabilities Due within (years)
Total Carrying Amount1 1 to 2 2 to 3 3 to 4 4 to 5 beyond 5
Bank and other borrowings- As on March 31, 2019 14,149.11 2,754.30 3,333.19 3,364.10 3,382.69 6,314.48 33,297.87 32,214.70 - As on March 31, 2018 9,696.65 476.81 2,157.85 2,693.40 2,794.04 8,635.04 26,453.79 25,199.64 Interest payable on borrowings- As on March 31, 2019 198.21 - - - - - 198.21 198.21 - As on March 31, 2018 94.47 - - - - - 94.47 94.47 Trade and other payable not in net debt- As on March 31, 2019 9,321.24 242.68 254.60 314.10 208.25 94.54 10,435.41 10,029.35 - As on March 31, 2018 7,361.75 94.18 - - - 50.16 7,506.09 7,498.14
51.8 Capital managementThe Group manages its capital to ensure that entities in the Group will be able to continue as going concerns while maximising the return to stakeholders through the optimisation of the debt and equity balance. The capital structure of the Group consists of net debt (borrowings as detailed in notes 8,10,16, 17 and 21 offset by cash and bank balances and Investment in Mutual funds) and total equity of the Group.
The Group reviews the capital structure of the Group on a quarterly basis to ensure that it in compliance with the required covenants. The Group has a target gearing ratio of 1:1 determined as the proportion of net debt to total equity. The gearing ratio at March 31, 2019 is 0.86 (March 31, 2018 : 0.73).
The Group is not subject to any externally imposed capital requirements.
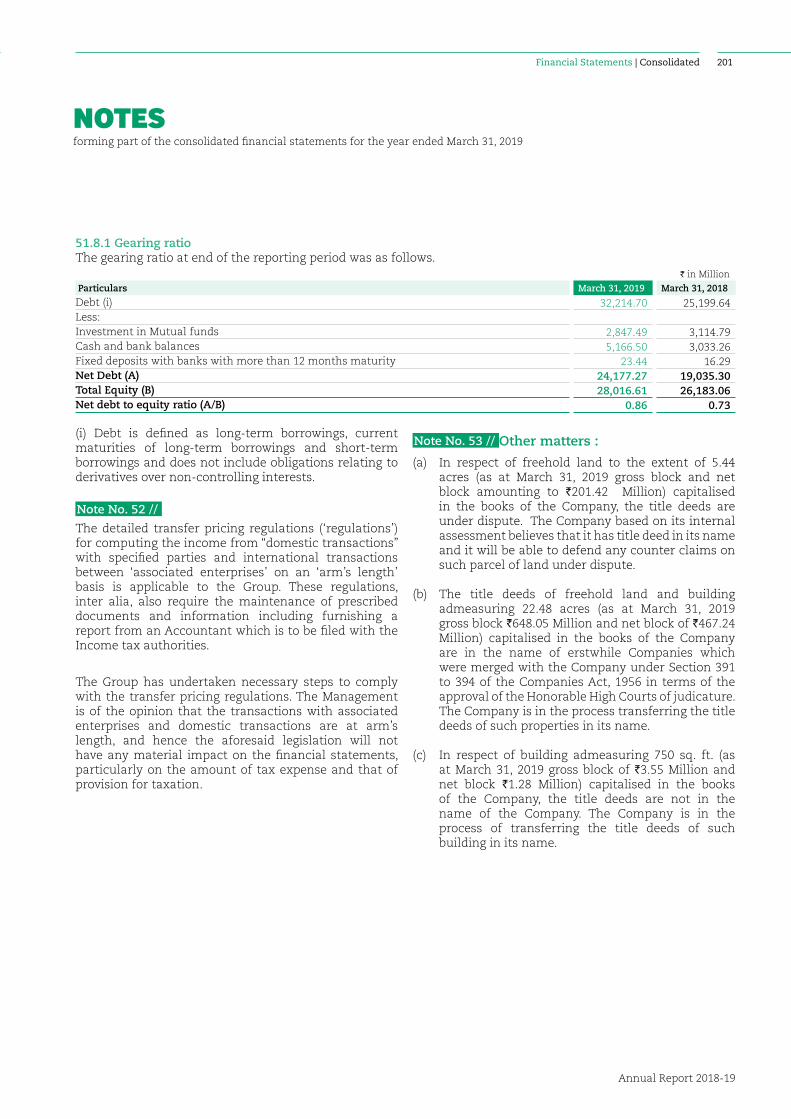
NOTESforming part of the consolidated financial statements for the year ended March 31, 2019
Annual Report 2018-19
201Financial Statements | Consolidated
51.8.1 Gearing ratioThe gearing ratio at end of the reporting period was as follows.
I in Million
Particulars March 31, 2019 March 31, 2018
Debt (i) 32,214.70 25,199.64 Less:Investment in Mutual funds 2,847.49 3,114.79 Cash and bank balances 5,166.50 3,033.26 Fixed deposits with banks with more than 12 months maturity 23.44 16.29 Net Debt (A) 24,177.27 19,035.30 Total Equity (B) 28,016.61 26,183.06 Net debt to equity ratio (A/B) 0.86 0.73
(i) Debt is defined as long-term borrowings, current maturities of long-term borrowings and short-term borrowings and does not include obligations relating to derivatives over non-controlling interests.
Note No. 52 //
The detailed transfer pricing regulations (‘regulations’) for computing the income from “domestic transactions” with specified parties and international transactions between ‘associated enterprises’ on an ‘arm’s length’ basis is applicable to the Group. These regulations, inter alia, also require the maintenance of prescribed documents and information including furnishing a report from an Accountant which is to be filed with the Income tax authorities.
The Group has undertaken necessary steps to comply with the transfer pricing regulations. The Management is of the opinion that the transactions with associated enterprises and domestic transactions are at arm’s length, and hence the aforesaid legislation will not have any material impact on the financial statements, particularly on the amount of tax expense and that of provision for taxation.
Note No. 53 // Other matters :
(a) In respect of freehold land to the extent of 5.44 acres (as at March 31, 2019 gross block and net block amounting to `201.42 Million) capitalised in the books of the Company, the title deeds are under dispute. The Company based on its internal assessment believes that it has title deed in its name and it will be able to defend any counter claims on such parcel of land under dispute.
(b) The title deeds of freehold land and building admeasuring 22.48 acres (as at March 31, 2019 gross block `648.05 Million and net block of `467.24 Million) capitalised in the books of the Company are in the name of erstwhile Companies which were merged with the Company under Section 391 to 394 of the Companies Act, 1956 in terms of the approval of the Honorable High Courts of judicature. The Company is in the process transferring the title deeds of such properties in its name.
(c) In respect of building admeasuring 750 sq. ft. (as at March 31, 2019 gross block of `3.55 Million and net block `1.28 Million) capitalised in the books of the Company, the title deeds are not in the name of the Company. The Company is in the process of transferring the title deeds of such building in its name.
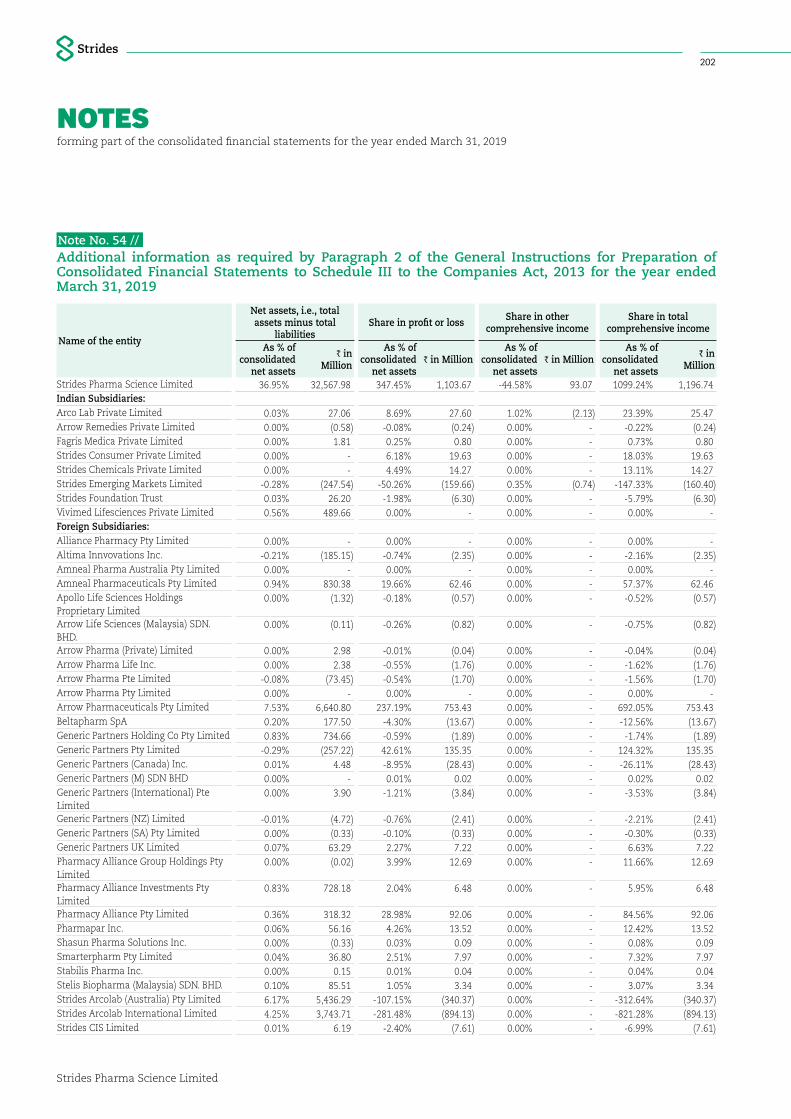
NOTESforming part of the consolidated financial statements for the year ended March 31, 2019
Strides Pharma Science Limited
202
Note No. 54 //Additional information as required by Paragraph 2 of the General Instructions for Preparation of Consolidated Financial Statements to Schedule III to the Companies Act, 2013 for the year ended March 31, 2019
Name of the entity
Net assets, i.e., total assets minus total
liabilitiesShare in profit or loss Share in other
comprehensive incomeShare in total
comprehensive income
As % of consolidated
net assets
R in Million
As % of consolidated
net assets R in Million
As % of consolidated
net assets R in Million
As % of consolidated
net assets
R in Million
Strides Pharma Science Limited 36.95% 32,567.98 347.45% 1,103.67 -44.58% 93.07 1099.24% 1,196.74 Indian Subsidiaries:Arco Lab Private Limited 0.03% 27.06 8.69% 27.60 1.02% (2.13) 23.39% 25.47 Arrow Remedies Private Limited 0.00% (0.58) -0.08% (0.24) 0.00% - -0.22% (0.24)Fagris Medica Private Limited 0.00% 1.81 0.25% 0.80 0.00% - 0.73% 0.80 Strides Consumer Private Limited 0.00% - 6.18% 19.63 0.00% - 18.03% 19.63 Strides Chemicals Private Limited 0.00% - 4.49% 14.27 0.00% - 13.11% 14.27 Strides Emerging Markets Limited -0.28% (247.54) -50.26% (159.66) 0.35% (0.74) -147.33% (160.40)Strides Foundation Trust 0.03% 26.20 -1.98% (6.30) 0.00% - -5.79% (6.30)Vivimed Lifesciences Private Limited 0.56% 489.66 0.00% - 0.00% - 0.00% - Foreign Subsidiaries:Alliance Pharmacy Pty Limited 0.00% - 0.00% - 0.00% - 0.00% - Altima Innvovations Inc. -0.21% (185.15) -0.74% (2.35) 0.00% - -2.16% (2.35)Amneal Pharma Australia Pty Limited 0.00% - 0.00% - 0.00% - 0.00% - Amneal Pharmaceuticals Pty Limited 0.94% 830.38 19.66% 62.46 0.00% - 57.37% 62.46 Apollo Life Sciences Holdings Proprietary Limited
0.00% (1.32) -0.18% (0.57) 0.00% - -0.52% (0.57)
Arrow Life Sciences (Malaysia) SDN. BHD.
0.00% (0.11) -0.26% (0.82) 0.00% - -0.75% (0.82)
Arrow Pharma (Private) Limited 0.00% 2.98 -0.01% (0.04) 0.00% - -0.04% (0.04)Arrow Pharma Life Inc. 0.00% 2.38 -0.55% (1.76) 0.00% - -1.62% (1.76)Arrow Pharma Pte Limited -0.08% (73.45) -0.54% (1.70) 0.00% - -1.56% (1.70)Arrow Pharma Pty Limited 0.00% - 0.00% - 0.00% - 0.00% - Arrow Pharmaceuticals Pty Limited 7.53% 6,640.80 237.19% 753.43 0.00% - 692.05% 753.43 Beltapharm SpA 0.20% 177.50 -4.30% (13.67) 0.00% - -12.56% (13.67)Generic Partners Holding Co Pty Limited 0.83% 734.66 -0.59% (1.89) 0.00% - -1.74% (1.89)Generic Partners Pty Limited -0.29% (257.22) 42.61% 135.35 0.00% - 124.32% 135.35 Generic Partners (Canada) Inc. 0.01% 4.48 -8.95% (28.43) 0.00% - -26.11% (28.43)Generic Partners (M) SDN BHD 0.00% - 0.01% 0.02 0.00% - 0.02% 0.02 Generic Partners (International) Pte Limited
0.00% 3.90 -1.21% (3.84) 0.00% - -3.53% (3.84)
Generic Partners (NZ) Limited -0.01% (4.72) -0.76% (2.41) 0.00% - -2.21% (2.41)Generic Partners (SA) Pty Limited 0.00% (0.33) -0.10% (0.33) 0.00% - -0.30% (0.33)Generic Partners UK Limited 0.07% 63.29 2.27% 7.22 0.00% - 6.63% 7.22 Pharmacy Alliance Group Holdings Pty Limited
0.00% (0.02) 3.99% 12.69 0.00% - 11.66% 12.69
Pharmacy Alliance Investments Pty Limited
0.83% 728.18 2.04% 6.48 0.00% - 5.95% 6.48
Pharmacy Alliance Pty Limited 0.36% 318.32 28.98% 92.06 0.00% - 84.56% 92.06 Pharmapar Inc. 0.06% 56.16 4.26% 13.52 0.00% - 12.42% 13.52 Shasun Pharma Solutions Inc. 0.00% (0.33) 0.03% 0.09 0.00% - 0.08% 0.09 Smarterpharm Pty Limited 0.04% 36.80 2.51% 7.97 0.00% - 7.32% 7.97 Stabilis Pharma Inc. 0.00% 0.15 0.01% 0.04 0.00% - 0.04% 0.04 Stelis Biopharma (Malaysia) SDN. BHD. 0.10% 85.51 1.05% 3.34 0.00% - 3.07% 3.34 Strides Arcolab (Australia) Pty Limited 6.17% 5,436.29 -107.15% (340.37) 0.00% - -312.64% (340.37)Strides Arcolab International Limited 4.25% 3,743.71 -281.48% (894.13) 0.00% - -821.28% (894.13)Strides CIS Limited 0.01% 6.19 -2.40% (7.61) 0.00% - -6.99% (7.61)
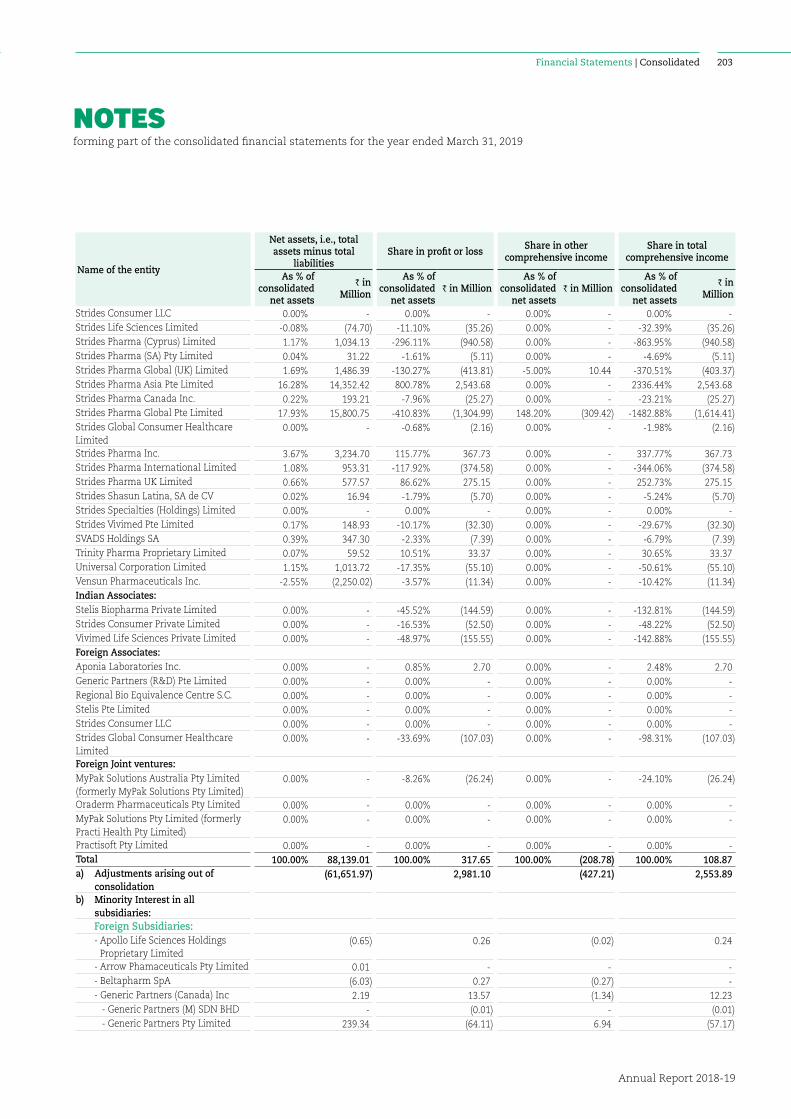
NOTESforming part of the consolidated financial statements for the year ended March 31, 2019
Annual Report 2018-19
203Financial Statements | Consolidated
Name of the entity
Net assets, i.e., total assets minus total
liabilitiesShare in profit or loss Share in other
comprehensive incomeShare in total
comprehensive income
As % of consolidated
net assets
R in Million
As % of consolidated
net assets R in Million
As % of consolidated
net assets R in Million
As % of consolidated
net assets
R in Million
Strides Consumer LLC 0.00% - 0.00% - 0.00% - 0.00% - Strides Life Sciences Limited -0.08% (74.70) -11.10% (35.26) 0.00% - -32.39% (35.26)Strides Pharma (Cyprus) Limited 1.17% 1,034.13 -296.11% (940.58) 0.00% - -863.95% (940.58)Strides Pharma (SA) Pty Limited 0.04% 31.22 -1.61% (5.11) 0.00% - -4.69% (5.11)Strides Pharma Global (UK) Limited 1.69% 1,486.39 -130.27% (413.81) -5.00% 10.44 -370.51% (403.37)Strides Pharma Asia Pte Limited 16.28% 14,352.42 800.78% 2,543.68 0.00% - 2336.44% 2,543.68 Strides Pharma Canada Inc. 0.22% 193.21 -7.96% (25.27) 0.00% - -23.21% (25.27)Strides Pharma Global Pte Limited 17.93% 15,800.75 -410.83% (1,304.99) 148.20% (309.42) -1482.88% (1,614.41)Strides Global Consumer Healthcare Limited
0.00% - -0.68% (2.16) 0.00% - -1.98% (2.16)
Strides Pharma Inc. 3.67% 3,234.70 115.77% 367.73 0.00% - 337.77% 367.73 Strides Pharma International Limited 1.08% 953.31 -117.92% (374.58) 0.00% - -344.06% (374.58)Strides Pharma UK Limited 0.66% 577.57 86.62% 275.15 0.00% - 252.73% 275.15 Strides Shasun Latina, SA de CV 0.02% 16.94 -1.79% (5.70) 0.00% - -5.24% (5.70)Strides Specialties (Holdings) Limited 0.00% - 0.00% - 0.00% - 0.00% - Strides Vivimed Pte Limited 0.17% 148.93 -10.17% (32.30) 0.00% - -29.67% (32.30)SVADS Holdings SA 0.39% 347.30 -2.33% (7.39) 0.00% - -6.79% (7.39)Trinity Pharma Proprietary Limited 0.07% 59.52 10.51% 33.37 0.00% - 30.65% 33.37 Universal Corporation Limited 1.15% 1,013.72 -17.35% (55.10) 0.00% - -50.61% (55.10)Vensun Pharmaceuticals Inc. -2.55% (2,250.02) -3.57% (11.34) 0.00% - -10.42% (11.34)Indian Associates:Stelis Biopharma Private Limited 0.00% - -45.52% (144.59) 0.00% - -132.81% (144.59)Strides Consumer Private Limited 0.00% - -16.53% (52.50) 0.00% - -48.22% (52.50)Vivimed Life Sciences Private Limited 0.00% - -48.97% (155.55) 0.00% - -142.88% (155.55)Foreign Associates:Aponia Laboratories Inc. 0.00% - 0.85% 2.70 0.00% - 2.48% 2.70 Generic Partners (R&D) Pte Limited 0.00% - 0.00% - 0.00% - 0.00% - Regional Bio Equivalence Centre S.C. 0.00% - 0.00% - 0.00% - 0.00% - Stelis Pte Limited 0.00% - 0.00% - 0.00% - 0.00% - Strides Consumer LLC 0.00% - 0.00% - 0.00% - 0.00% - Strides Global Consumer Healthcare Limited
0.00% - -33.69% (107.03) 0.00% - -98.31% (107.03)
Foreign Joint ventures:MyPak Solutions Australia Pty Limited (formerly MyPak Solutions Pty Limited)
0.00% - -8.26% (26.24) 0.00% - -24.10% (26.24)
Oraderm Pharmaceuticals Pty Limited 0.00% - 0.00% - 0.00% - 0.00% - MyPak Solutions Pty Limited (formerly Practi Health Pty Limited)
0.00% - 0.00% - 0.00% - 0.00% -
Practisoft Pty Limited 0.00% - 0.00% - 0.00% - 0.00% - Total 100.00% 88,139.01 100.00% 317.65 100.00% (208.78) 100.00% 108.87 a) Adjustments arising out of
consolidation (61,651.97) 2,981.10 (427.21) 2,553.89
b) Minority Interest in all subsidiaries:
Foreign Subsidiaries: - Apollo Life Sciences Holdings
Proprietary Limited (0.65) 0.26 (0.02) 0.24
- Arrow Phamaceuticals Pty Limited 0.01 - - - - Beltapharm SpA (6.03) 0.27 (0.27) - - Generic Partners (Canada) Inc 2.19 13.57 (1.34) 12.23 - Generic Partners (M) SDN BHD - (0.01) - (0.01) - Generic Partners Pty Limited 239.34 (64.11) 6.94 (57.17)
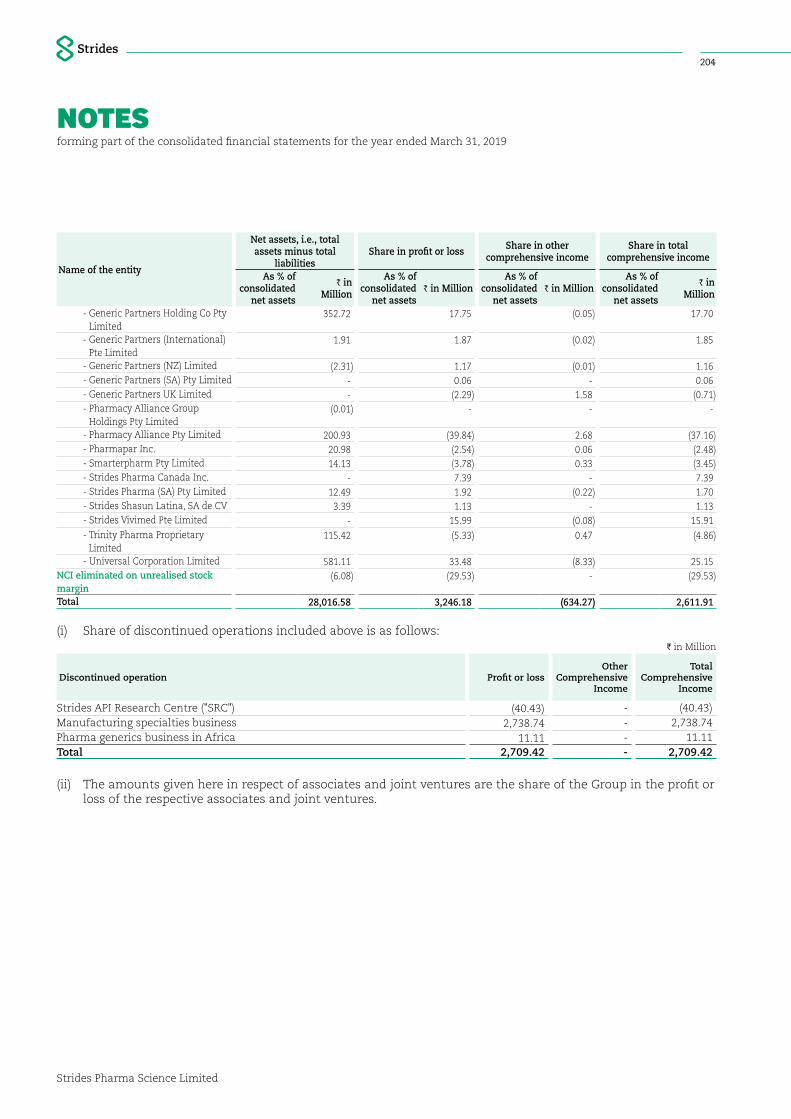
NOTESforming part of the consolidated financial statements for the year ended March 31, 2019
Strides Pharma Science Limited
204
Name of the entity
Net assets, i.e., total assets minus total
liabilitiesShare in profit or loss Share in other
comprehensive incomeShare in total
comprehensive income
As % of consolidated
net assets
R in Million
As % of consolidated
net assets R in Million
As % of consolidated
net assets R in Million
As % of consolidated
net assets
R in Million
- Generic Partners Holding Co Pty Limited
352.72 17.75 (0.05) 17.70
- Generic Partners (International) Pte Limited
1.91 1.87 (0.02) 1.85
- Generic Partners (NZ) Limited (2.31) 1.17 (0.01) 1.16 - Generic Partners (SA) Pty Limited - 0.06 - 0.06 - Generic Partners UK Limited - (2.29) 1.58 (0.71) - Pharmacy Alliance Group
Holdings Pty Limited (0.01) - - -
- Pharmacy Alliance Pty Limited 200.93 (39.84) 2.68 (37.16) - Pharmapar Inc. 20.98 (2.54) 0.06 (2.48) - Smarterpharm Pty Limited 14.13 (3.78) 0.33 (3.45) - Strides Pharma Canada Inc. - 7.39 - 7.39 - Strides Pharma (SA) Pty Limited 12.49 1.92 (0.22) 1.70 - Strides Shasun Latina, SA de CV 3.39 1.13 - 1.13 - Strides Vivimed Pte Limited - 15.99 (0.08) 15.91 - Trinity Pharma Proprietary
Limited 115.42 (5.33) 0.47 (4.86)
- Universal Corporation Limited 581.11 33.48 (8.33) 25.15 NCI eliminated on unrealised stock margin
(6.08) (29.53) - (29.53)
Total 28,016.58 3,246.18 (634.27) 2,611.91
(i) Share of discontinued operations included above is as follows:I in Million
Discontinued operation Profit or lossOther
Comprehensive Income
Total Comprehensive
Income
Strides API Research Centre ("SRC") (40.43) - (40.43)Manufacturing specialties business 2,738.74 - 2,738.74 Pharma generics business in Africa 11.11 - 11.11 Total 2,709.42 - 2,709.42
(ii) The amounts given here in respect of associates and joint ventures are the share of the Group in the profit or loss of the respective associates and joint ventures.
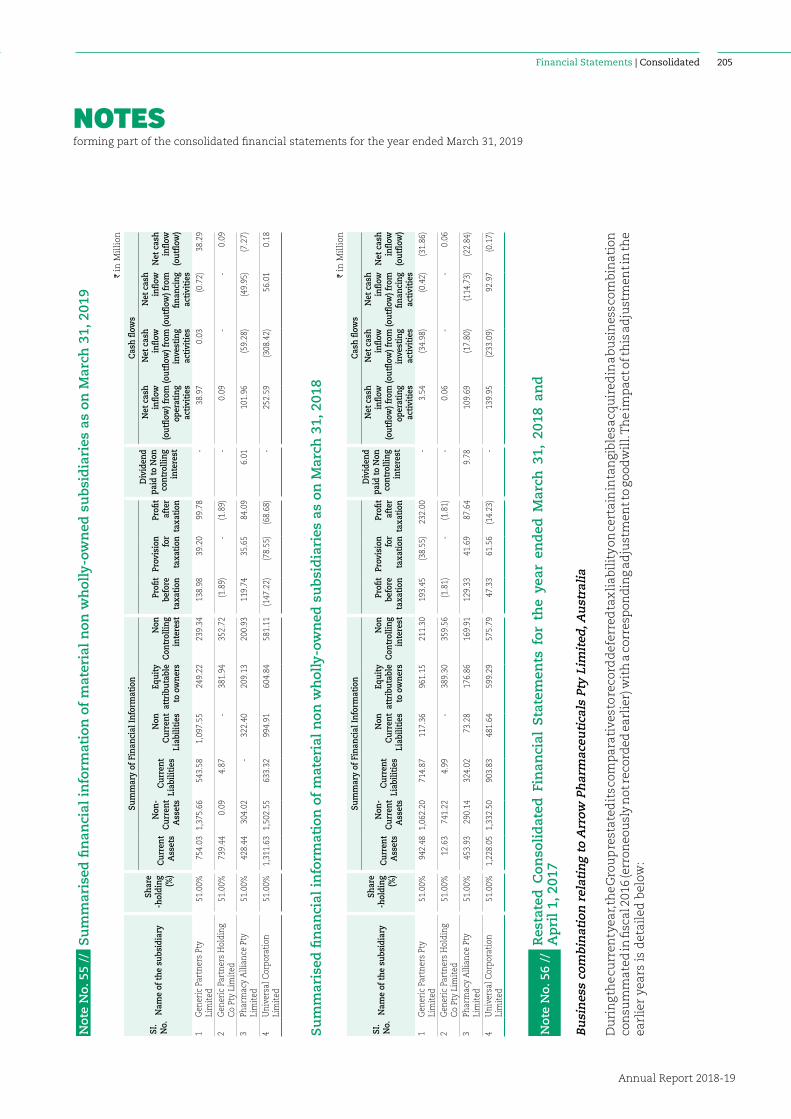
NOTESforming part of the consolidated financial statements for the year ended March 31, 2019
Annual Report 2018-19
205Financial Statements | Consolidated
Not
e N
o. 5
5 //
Su
mm
aris
ed fi
nan
cial
in
form
atio
n o
f m
ater
ial
non
wh
olly
-ow
ned
su
bsi
dia
ries
as
on M
arch
31,
201
9
I in
Mil
lion
SI.
No.
Nam
e of
the
subs
idia
ry
Shar
e-h
oldi
ng
(%)
Sum
mar
y of
Fin
anci
al In
form
atio
nD
ivid
end
paid
to N
on
cont
rolli
ng
inte
rest
Cas
h flo
ws
Cur
rent
A
sset
s
Non
-C
urre
nt
Ass
ets
Cur
rent
Li
abili
ties
Non
C
urre
nt
Liab
iliti
es
Equi
ty
attr
ibut
able
to
ow
ners
Non
C
ontr
ollin
g in
tere
st
Profi
t be
fore
ta
xati
on
Prov
isio
n fo
r ta
xati
on
Profi
t af
ter
taxa
tion
Net
cas
h in
flow
(o
utflo
w) f
rom
op
erat
ing
activ
itie
s
Net
cas
h in
flow
(o
utflo
w) f
rom
in
vest
ing
activ
itie
s
Net
cas
h in
flow
(o
utflo
w) f
rom
fin
anci
ng
activ
itie
s
Net
cas
h in
flow
(o
utflo
w)
1G
ener
ic P
artn
ers
Pty
Lim
ited
51.0
0% 7
54.0
3 1
,375
.66
543
.58
1,0
97.5
5 2
49.2
2 2
39.3
4 1
38.9
8 3
9.20
9
9.78
-
3
8.97
0
.03
(0.7
2) 3
8.29
2G
ener
ic P
artn
ers
Hol
ding
C
o Pt
y Li
mit
ed51
.00%
739
.44
0.0
9 4
.87
-
381
.94
352
.72
(1.8
9) -
(1
.89)
-
0.0
9 -
-
0
.09
3Ph
arm
acy
Alli
ance
Pty
Li
mit
ed51
.00%
428
.44
304
.02
-
322
.40
209
.13
200
.93
119
.74
35.
65
84.
09
6.0
1 1
01.9
6 (5
9.28
) (4
9.95
) (7
.27)
4U
nive
rsal
Cor
pora
tion
Li
mit
ed51
.00%
1,3
11.6
3 1
,502
.55
633
.32
994
.91
604
.84
581
.11
(147
.22)
(78.
55)
(68.
68)
-
252
.59
(308
.42)
56.
01
0.1
8
Su
mm
aris
ed fi
nan
cial
in
form
atio
n o
f m
ater
ial
non
wh
olly
-ow
ned
su
bsi
dia
ries
as
on M
arch
31,
201
8
I in
Mil
lion
SI.
No.
Nam
e of
the
subs
idia
ry
Shar
e-h
oldi
ng
(%)
Sum
mar
y of
Fin
anci
al In
form
atio
nD
ivid
end
paid
to N
on
cont
rolli
ng
inte
rest
Cas
h flo
ws
Cur
rent
A
sset
s
Non
-C
urre
nt
Ass
ets
Cur
rent
Li
abili
ties
Non
C
urre
nt
Liab
iliti
es
Equi
ty
attr
ibut
able
to
ow
ners
Non
C
ontr
ollin
g in
tere
st
Profi
t be
fore
ta
xati
on
Prov
isio
n fo
r ta
xati
on
Profi
t af
ter
taxa
tion
Net
cas
h in
flow
(o
utflo
w) f
rom
op
erat
ing
activ
itie
s
Net
cas
h in
flow
(o
utflo
w) f
rom
in
vest
ing
activ
itie
s
Net
cas
h in
flow
(o
utflo
w) f
rom
fin
anci
ng
activ
itie
s
Net
cas
h in
flow
(o
utflo
w)
1G
ener
ic P
artn
ers
Pty
Lim
ited
51.0
0% 9
42.4
8 1
,062
.20
714
.87
117
.36
961
.15
211
.30
193
.45
(38.
55)
232
.00
-
3.5
4 (3
4.98
) (0
.42)
(31.
86)
2G
ener
ic P
artn
ers
Hol
ding
C
o Pt
y Li
mit
ed51
.00%
12.
63
741
.22
4.9
9 -
3
89.3
0 3
59.5
6 (1
.81)
-
(1.8
1) -
0
.06
-
-
0.0
6
3Ph
arm
acy
Alli
ance
Pty
Li
mit
ed51
.00%
453
.93
290
.14
324
.02
73.
28
176
.86
169
.91
129
.33
41.
69
87.
64
9.7
8 1
09.6
9 (1
7.80
) (1
14.7
3) (2
2.84
)
4U
nive
rsal
Cor
pora
tion
Li
mit
ed51
.00%
1,2
28.0
5 1
,332
.50
903
.83
481
.64
599
.29
575
.79
47.
33
61.
56
(14.
23)
-
139
.95
(233
.09)
92.
97
(0.1
7)
Not
e N
o. 5
6 //
Res
tate
d C
onso
lid
ated
Fin
anci
al S
tate
men
ts f
or t
he
year
en
ded
Mar
ch 3
1, 2
018
and
A
pri
l 1,
201
7
Bu
sin
ess
com
bin
atio
n r
elat
ing
to A
rrow
Ph
arm
aceu
tica
ls P
ty L
imit
ed, A
ust
rali
a
Du
rin
g th
e cu
rren
t yea
r, th
e G
rou
p re
stat
ed it
s com
par
ativ
es to
reco
rd d
efer
red
tax
liab
ilit
y on
cert
ain
inta
ngi
ble
s acq
uir
ed in
a b
usi
nes
s com
bin
atio
n
con
sum
mat
ed in
fisc
al 2
016
(err
oneo
usl
y n
ot re
cord
ed e
arli
er) w
ith
a c
orre
spon
din
g ad
just
men
t to
good
wil
l. T
he
imp
act o
f th
is a
dju
stm
ent i
n th
e ea
rlie
r ye
ars
is d
etai
led
bel
ow:
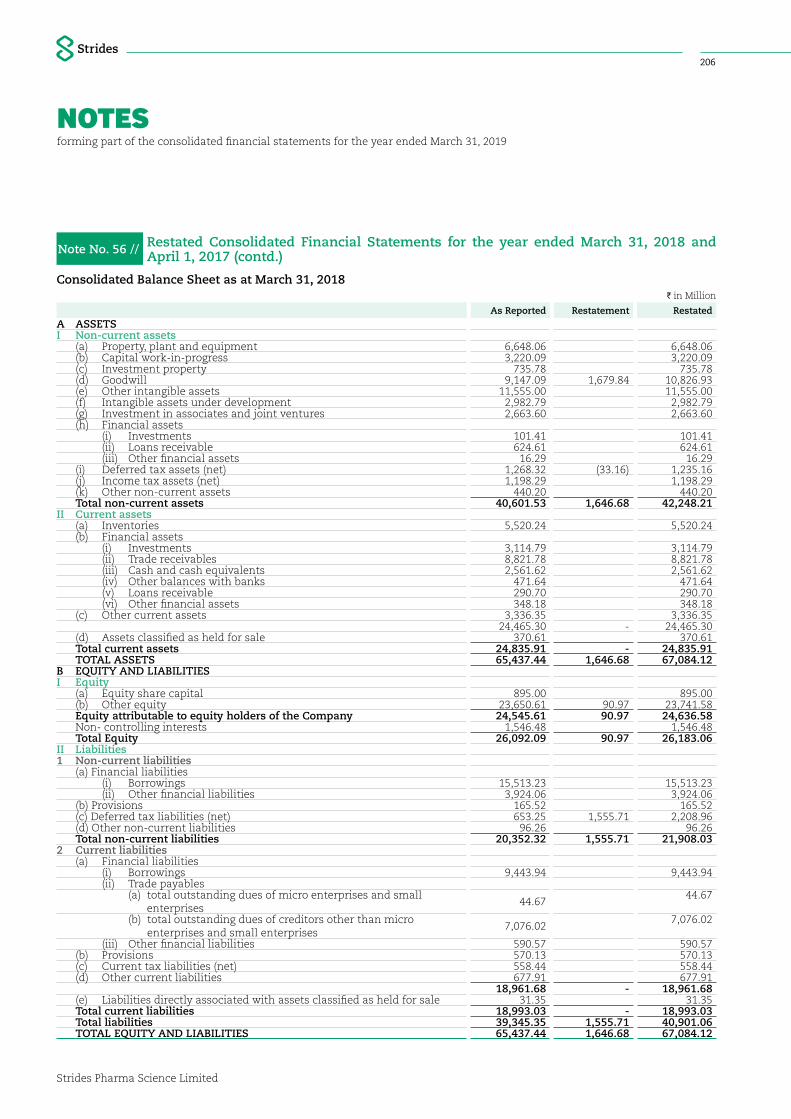
NOTESforming part of the consolidated financial statements for the year ended March 31, 2019
Strides Pharma Science Limited
206
Note No. 56 // Restated Consolidated Financial Statements for the year ended March 31, 2018 and April 1, 2017 (contd.)
Consolidated Balance Sheet as at March 31, 2018I in Million
As Reported Restatement Restated A ASSETSI Non-current assets
(a) Property, plant and equipment 6,648.06 6,648.06 (b) Capital work-in-progress 3,220.09 3,220.09 (c) Investment property 735.78 735.78 (d) Goodwill 9,147.09 1,679.84 10,826.93 (e) Other intangible assets 11,555.00 11,555.00 (f) Intangible assets under development 2,982.79 2,982.79 (g) Investment in associates and joint ventures 2,663.60 2,663.60 (h) Financial assets (i) Investments 101.41 101.41 (ii) Loans receivable 624.61 624.61 (iii) Other financial assets 16.29 16.29 (i) Deferred tax assets (net) 1,268.32 (33.16) 1,235.16 (j) Income tax assets (net) 1,198.29 1,198.29 (k) Other non-current assets 440.20 440.20 Total non-current assets 40,601.53 1,646.68 42,248.21
II Current assets(a) Inventories 5,520.24 5,520.24 (b) Financial assets (i) Investments 3,114.79 3,114.79 (ii) Trade receivables 8,821.78 8,821.78 (iii) Cash and cash equivalents 2,561.62 2,561.62 (iv) Other balances with banks 471.64 471.64 (v) Loans receivable 290.70 290.70 (vi) Other financial assets 348.18 348.18 (c) Other current assets 3,336.35 3,336.35
24,465.30 - 24,465.30 (d) Assets classified as held for sale 370.61 370.61 Total current assets 24,835.91 - 24,835.91 TOTAL ASSETS 65,437.44 1,646.68 67,084.12
B EQUITY AND LIABILITIESI Equity
(a) Equity share capital 895.00 895.00 (b) Other equity 23,650.61 90.97 23,741.58 Equity attributable to equity holders of the Company 24,545.61 90.97 24,636.58 Non- controlling interests 1,546.48 1,546.48 Total Equity 26,092.09 90.97 26,183.06
II Liabilities1 Non-current liabilities
(a) Financial liabilities (i) Borrowings 15,513.23 15,513.23 (ii) Other financial liabilities 3,924.06 3,924.06 (b) Provisions 165.52 165.52 (c) Deferred tax liabilities (net) 653.25 1,555.71 2,208.96 (d) Other non-current liabilities 96.26 96.26 Total non-current liabilities 20,352.32 1,555.71 21,908.03
2 Current liabilities(a) Financial liabilities (i) Borrowings 9,443.94 9,443.94 (ii) Trade payables (a) total outstanding dues of micro enterprises and small
enterprises 44.67
44.67
(b) total outstanding dues of creditors other than micro enterprises and small enterprises
7,076.02 7,076.02
(iii) Other financial liabilities 590.57 590.57 (b) Provisions 570.13 570.13 (c) Current tax liabilities (net) 558.44 558.44 (d) Other current liabilities 677.91 677.91
18,961.68 - 18,961.68 (e) Liabilities directly associated with assets classified as held for sale 31.35 31.35 Total current liabilities 18,993.03 - 18,993.03 Total liabilities 39,345.35 1,555.71 40,901.06 TOTAL EQUITY AND LIABILITIES 65,437.44 1,646.68 67,084.12
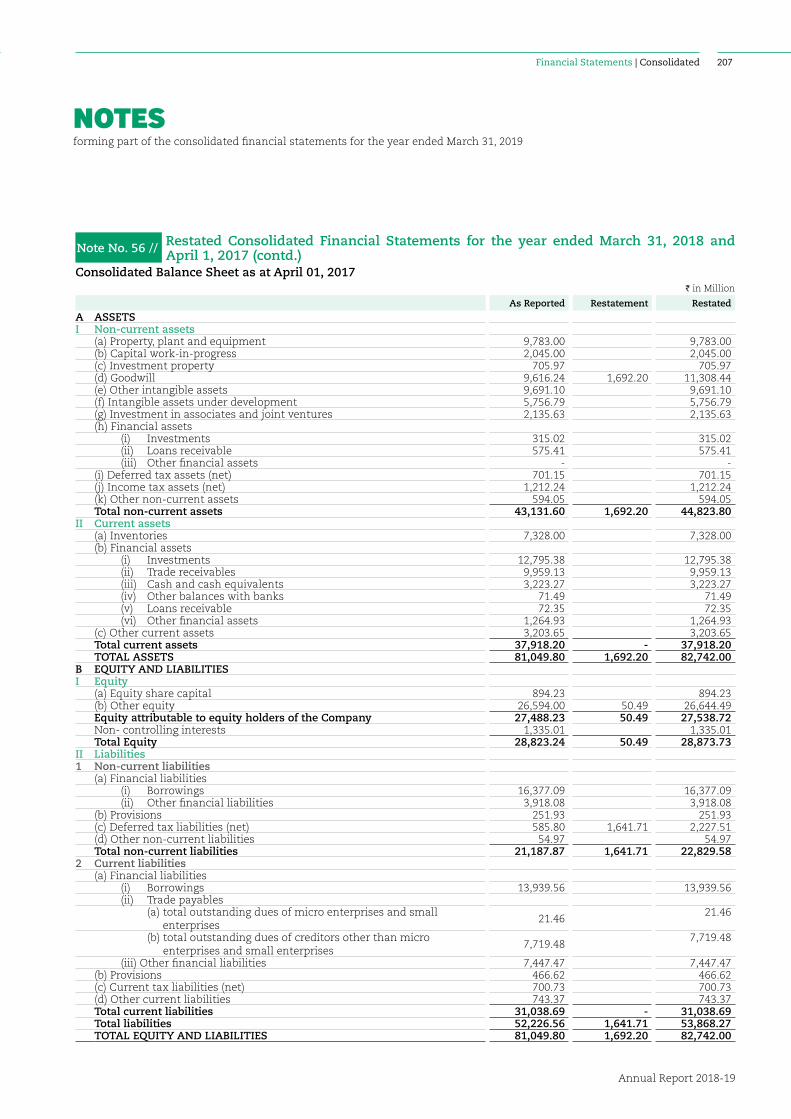
NOTESforming part of the consolidated financial statements for the year ended March 31, 2019
Annual Report 2018-19
207Financial Statements | Consolidated
Note No. 56 // Restated Consolidated Financial Statements for the year ended March 31, 2018 and April 1, 2017 (contd.)
Consolidated Balance Sheet as at April 01, 2017I in Million
As Reported Restatement Restated
A ASSETSI Non-current assets
(a) Property, plant and equipment 9,783.00 9,783.00 (b) Capital work-in-progress 2,045.00 2,045.00 (c) Investment property 705.97 705.97 (d) Goodwill 9,616.24 1,692.20 11,308.44 (e) Other intangible assets 9,691.10 9,691.10 (f) Intangible assets under development 5,756.79 5,756.79 (g) Investment in associates and joint ventures 2,135.63 2,135.63 (h) Financial assets (i) Investments 315.02 315.02 (ii) Loans receivable 575.41 575.41 (iii) Other financial assets - - (i) Deferred tax assets (net) 701.15 701.15 (j) Income tax assets (net) 1,212.24 1,212.24 (k) Other non-current assets 594.05 594.05 Total non-current assets 43,131.60 1,692.20 44,823.80
II Current assets(a) Inventories 7,328.00 7,328.00 (b) Financial assets (i) Investments 12,795.38 12,795.38 (ii) Trade receivables 9,959.13 9,959.13 (iii) Cash and cash equivalents 3,223.27 3,223.27 (iv) Other balances with banks 71.49 71.49 (v) Loans receivable 72.35 72.35 (vi) Other financial assets 1,264.93 1,264.93 (c) Other current assets 3,203.65 3,203.65 Total current assets 37,918.20 - 37,918.20 TOTAL ASSETS 81,049.80 1,692.20 82,742.00
B EQUITY AND LIABILITIESI Equity
(a) Equity share capital 894.23 894.23 (b) Other equity 26,594.00 50.49 26,644.49 Equity attributable to equity holders of the Company 27,488.23 50.49 27,538.72 Non- controlling interests 1,335.01 1,335.01 Total Equity 28,823.24 50.49 28,873.73
II Liabilities1 Non-current liabilities
(a) Financial liabilities (i) Borrowings 16,377.09 16,377.09 (ii) Other financial liabilities 3,918.08 3,918.08 (b) Provisions 251.93 251.93 (c) Deferred tax liabilities (net) 585.80 1,641.71 2,227.51 (d) Other non-current liabilities 54.97 54.97 Total non-current liabilities 21,187.87 1,641.71 22,829.58
2 Current liabilities(a) Financial liabilities (i) Borrowings 13,939.56 13,939.56 (ii) Trade payables (a) total outstanding dues of micro enterprises and small
enterprises 21.46
21.46
(b) total outstanding dues of creditors other than micro enterprises and small enterprises
7,719.48 7,719.48
(iii) Other financial liabilities 7,447.47 7,447.47 (b) Provisions 466.62 466.62 (c) Current tax liabilities (net) 700.73 700.73 (d) Other current liabilities 743.37 743.37 Total current liabilities 31,038.69 - 31,038.69 Total liabilities 52,226.56 1,641.71 53,868.27 TOTAL EQUITY AND LIABILITIES 81,049.80 1,692.20 82,742.00
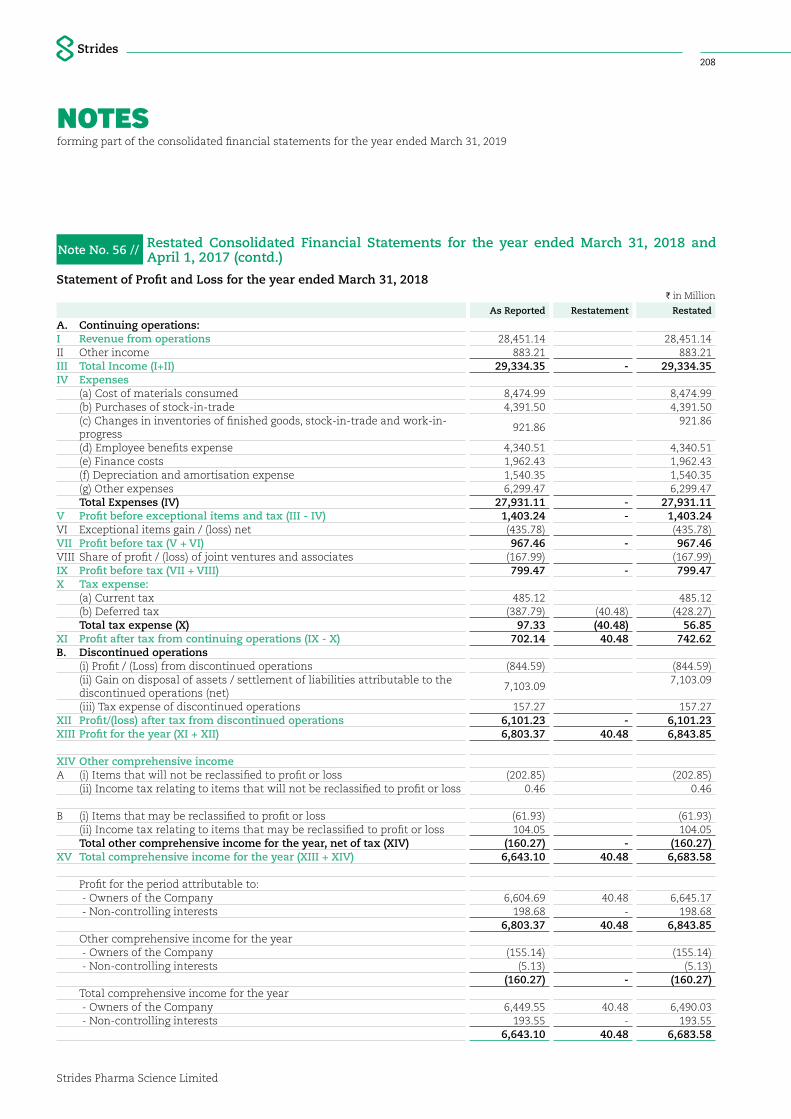
NOTESforming part of the consolidated financial statements for the year ended March 31, 2019
Strides Pharma Science Limited
208
Note No. 56 // Restated Consolidated Financial Statements for the year ended March 31, 2018 and April 1, 2017 (contd.)
Statement of Profit and Loss for the year ended March 31, 2018I in Million
As Reported Restatement Restated
A. Continuing operations:I Revenue from operations 28,451.14 28,451.14 II Other income 883.21 883.21 III Total Income (I+II) 29,334.35 - 29,334.35 IV Expenses
(a) Cost of materials consumed 8,474.99 8,474.99 (b) Purchases of stock-in-trade 4,391.50 4,391.50 (c) Changes in inventories of finished goods, stock-in-trade and work-in-progress
921.86 921.86
(d) Employee benefits expense 4,340.51 4,340.51 (e) Finance costs 1,962.43 1,962.43 (f) Depreciation and amortisation expense 1,540.35 1,540.35 (g) Other expenses 6,299.47 6,299.47 Total Expenses (IV) 27,931.11 - 27,931.11
V Profit before exceptional items and tax (III - IV) 1,403.24 - 1,403.24 VI Exceptional items gain / (loss) net (435.78) (435.78)VII Profit before tax (V + VI) 967.46 - 967.46 VIII Share of profit / (loss) of joint ventures and associates (167.99) (167.99)IX Profit before tax (VII + VIII) 799.47 - 799.47 X Tax expense:
(a) Current tax 485.12 485.12 (b) Deferred tax (387.79) (40.48) (428.27)Total tax expense (X) 97.33 (40.48) 56.85
XI Profit after tax from continuing operations (IX - X) 702.14 40.48 742.62 B. Discontinued operations
(i) Profit / (Loss) from discontinued operations (844.59) (844.59)(ii) Gain on disposal of assets / settlement of liabilities attributable to the discontinued operations (net)
7,103.09 7,103.09
(iii) Tax expense of discontinued operations 157.27 157.27 XII Profit/(loss) after tax from discontinued operations 6,101.23 - 6,101.23 XIII Profit for the year (XI + XII) 6,803.37 40.48 6,843.85
XIV Other comprehensive incomeA (i) Items that will not be reclassified to profit or loss (202.85) (202.85)
(ii) Income tax relating to items that will not be reclassified to profit or loss 0.46 0.46
B (i) Items that may be reclassified to profit or loss (61.93) (61.93)(ii) Income tax relating to items that may be reclassified to profit or loss 104.05 104.05 Total other comprehensive income for the year, net of tax (XIV) (160.27) - (160.27)
XV Total comprehensive income for the year (XIII + XIV) 6,643.10 40.48 6,683.58
Profit for the period attributable to: - Owners of the Company 6,604.69 40.48 6,645.17 - Non-controlling interests 198.68 - 198.68
6,803.37 40.48 6,843.85 Other comprehensive income for the year - Owners of the Company (155.14) (155.14) - Non-controlling interests (5.13) (5.13)
(160.27) - (160.27)Total comprehensive income for the year - Owners of the Company 6,449.55 40.48 6,490.03 - Non-controlling interests 193.55 - 193.55
6,643.10 40.48 6,683.58
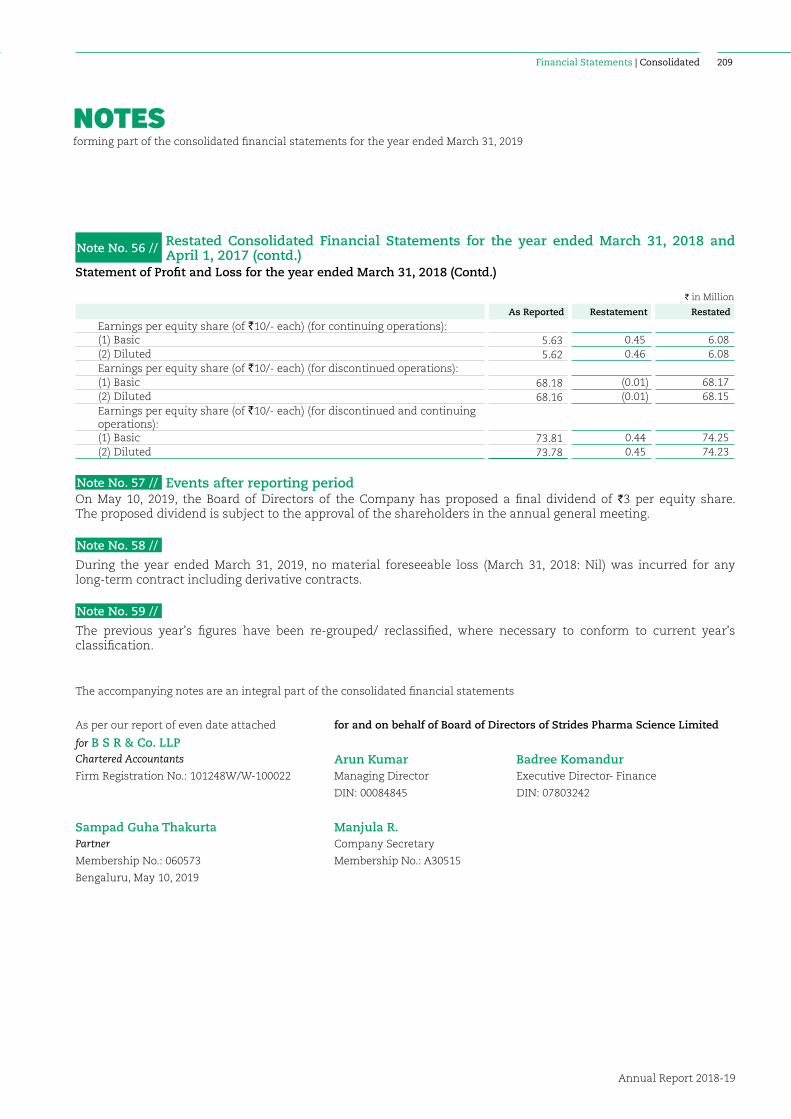
NOTESforming part of the consolidated financial statements for the year ended March 31, 2019
Annual Report 2018-19
209Financial Statements | Consolidated
Note No. 57 // Events after reporting periodOn May 10, 2019, the Board of Directors of the Company has proposed a final dividend of `3 per equity share. The proposed dividend is subject to the approval of the shareholders in the annual general meeting.
Note No. 58 //
During the year ended March 31, 2019, no material foreseeable loss (March 31, 2018: Nil) was incurred for any long-term contract including derivative contracts.
Note No. 59 //
The previous year's figures have been re-grouped/ reclassified, where necessary to conform to current year's classification.
The accompanying notes are an integral part of the consolidated financial statements
As per our report of even date attached for and on behalf of Board of Directors of Strides Pharma Science Limited
for B S R & Co. LLPChartered Accountants Arun Kumar Badree KomandurFirm Registration No.: 101248W/W-100022 Managing Director Executive Director- Finance
DIN: 00084845 DIN: 07803242
Sampad Guha Thakurta Manjula R.Partner Company Secretary
Membership No.: 060573 Membership No.: A30515
Bengaluru, May 10, 2019
I in Million
As Reported Restatement Restated
Earnings per equity share (of `10/- each) (for continuing operations):(1) Basic 5.63 0.45 6.08 (2) Diluted 5.62 0.46 6.08 Earnings per equity share (of `10/- each) (for discontinued operations):(1) Basic 68.18 (0.01) 68.17 (2) Diluted 68.16 (0.01) 68.15 Earnings per equity share (of `10/- each) (for discontinued and continuing operations):(1) Basic 73.81 0.44 74.25 (2) Diluted 73.78 0.45 74.23
Note No. 56 // Restated Consolidated Financial Statements for the year ended March 31, 2018 and April 1, 2017 (contd.)
Statement of Profit and Loss for the year ended March 31, 2018 (Contd.)
Strides Pharma Science Limited
210
INDEPENDENT AUDITOR'S REPORTAs at March 31, 2019
Key Audit Matters
Impact on adoption of new revenue standard [Refer Significant Accounting Policies and note 4 to the Standalone Financial Statements]
The key audit matter How the matter was addressed in our audit
The Company has adopted Ind AS 115: Revenue from Contracts with Customers effective 1 April 2018 using the modified retrospective approach, with the cumulative effect of initially applying the impact of any change being recorded in opening equity as at 1 April 2018.
The core principle of this standard is that the Company shall recognise revenue to depict the transfer of promised goods or services to customers in an amount that reflects the consideration to which the Company expects to be entitled in exchange for those goods or services. Under Ind AS 115, the Company recognises revenue when (or as) a performance obligation is satisfied, i.e. when ‘control’ of the goods or services underlying the particular performance obligation is transferred to the customer which is different from transfer of risk and rewards under the old revenue standard. Additionally, the Company also evaluated its out-licensing arrangements with reference to upfront non-refundable fees received in earlier periods.
With reference to revenue recognition from sale of goods and from licensing income arrangements, we reviewed management’s assessment of key terms of the contract to determine transfer of control of goods, underlying contracts and evaluated the appropriateness of the key judgments and estimates made by management.
We also reviewed management’s assessment whether the rights transferred under these arrangements qualified for revenue recognition and in particular whether the underlying performance obligations meet the criteria of being distinct and hence can be segregated from other obligations under the arrangement.
To the Members of Strides Pharma Science Limited (formerly known as Strides Shasun Limited)
Report on the Audit of the Standalone Financial Statements
Opinion
We have audited the standalone financial statements of Strides Pharma Science Limited (formerly known as Strides Shasun Limited) (“the Company”), which comprise the standalone balance sheet as at 31 March 2019, and the standalone statement of profit and loss (including other comprehensive income), standalone statement of changes in equity and standalone statement of cash flows for the year then ended, and notes to the standalone financial statements, including a summary of the significant accounting policies and other explanatory information (hereinafter referred to as “the standalone financial statements”).
In our opinion and to the best of our information and according to the explanations given to us, the aforesaid standalone financial statements give the information required by the Companies Act, 2013 (“Act”) in the manner so required and give a true and fair view in conformity with the accounting principles generally accepted in India, of the state of affairs of the Company as at 31 March 2019, and profit and other comprehensive income, changes in equity and its cash flows for the year ended on that date.
Basis for Opinion
We conducted our audit in accordance with the Standards on Auditing (SAs) specified under Section 143(10) of the Act. Our responsibilities under those SAs are further described in the Auditor’s Responsibilities for the Audit of the Standalone Financial Statements section of our report. We are independent of the Company in accordance with the Code of Ethics issued by the Institute of Chartered Accountants of India together with the ethical requirements that are relevant to our audit of the standalone financial statements under the provisions of the Act and the Rules thereunder, and we have fulfilled our other ethical responsibilities in accordance with these requirements and the Code of Ethics. We believe that the audit evidence we have obtained is sufficient and appropriate to provide a basis for our opinion.
Key Audit Matters
Key audit matters are those matters that, in our professional judgment, were of most significance in our audit of the standalone financial statements of the current period. These matters were addressed in the context of our audit of the standalone financial statements as a whole, and in forming our opinion thereon, and we do not provide a separate opinion on these matters.
Financial Statements | Standalone
Annual Report 2018-19
211
INDEPENDENT AUDITOR'S REPORTAs at March 31, 2019
Key Audit Matters (Contd.)
Impact on adoption of new revenue standard [Refer Significant Accounting Policies and note 4 to the Standalone Financial Statements]
The key audit matter How the matter was addressed in our audit
With respect to control evaluation and out-licensing arrangements, the risk is to determine timing of transfer of control considering all the terms of the contract, shipping terms, whether all the identified performance obligations meet the criteria of being distinct and consequently its impact on timing and pattern of revenue recognition.
Pursuant to the above, implementation of the new revenue standard requires management to apply judgment in carrying out the above evaluations and hence has been an area of focus for us.
Carrying value of investments in subsidiaries: [Refer Significant Accounting Policies and note 8(i)to the Standalone Financial Statements]
The key audit matter How the matter was addressed in our audit
The carrying amount of investments in subsidiaries accounts for 38% of the total assets of the Company as at 31 March 2019.
Testing operating effectiveness of controls over the review of the impairment analysis.
The annual impairment testing was significant to our audit, because of the financial quantum of the assets it supports as well as the fact that the testing relies on critical judgements, estimates and assumptions.
We evaluated the forecasts by comparing them with the historical growth trends, agreeing the forecast used in prior year models to its actual performance of the business and also agreed to the board of directors / management approved plans
Significant judgment is required in forecasting the future cash flows, together with the rate at which they are discounted.
We involved our internal valuation specialists who review and comment on the reasonability of the methodology and approach used in the valuation carried out by the management for its carrying amount of investments.
We reviewed the sensitivity analysis prepared by the Management to test the reasonably possible change in key assumptions used in the valuation carried out.

Strides Pharma Science Limited
212
INDEPENDENT AUDITOR'S REPORTAs at March 31, 2019
Information Other than the Standalone Financial Statements and Auditor’s Report Thereon
The Company’s Management and Board of Directors are responsible for the other information. The other information comprises of Management Reports such as Board’s Report, Management Discussion and Analysis, Corporate Governance Report and Business Responsibility Report (but does not include the Standalone Ind AS Financial Statements and our Auditor’s Report thereon) which we obtained prior to the date of this Auditor’s Report, and the remaining sections of Annual Report, which are expected to be made available to us after that date.
Our opinion on the standalone financial statements does not cover the other information and we do not express any form of assurance conclusion thereon.
In connection with our audit of the standalone financial statements, our responsibility is to read the other information and, in doing so, consider whether the other information is materially inconsistent with the standalone financial statements or our knowledge obtained in the audit or otherwise appears to be materially misstated.
If, based on the work we have performed on the other information that we obtained prior to the date of this Auditor’s Report, we conclude that there is a material misstatement of this other information, we are required to report that fact. We have nothing to report in this regard.
When we read the other sections of Annual Report (other than those mentioned above), if we conclude that there is a material misstatement therein, we are required to communicate the matter to those charged with governance and take necessary actions, as applicable under the applicable laws and regulations.
Management’s Responsibility for the Standalone Financial Statements
The Company’s Management and Board of Directors are responsible for the matters stated in Section 134(5) of the Act with respect to the preparation of these standalone financial statements that give a true and fair view of the state of affairs, profit/loss and other comprehensive income, changes in equity and cash
flows of the Company in accordance with the accounting principles generally accepted in India, including the Indian Accounting Standards (Ind AS) specified under Section 133 of the Act.
This responsibility also includes maintenance of adequate accounting records in accordance with the provisions of the Act for safeguarding of the assets of the Company and for preventing and detecting frauds and other irregularities; selection and application of appropriate accounting policies; making judgments and estimates that are reasonable and prudent; and design, implementation and maintenance of adequate internal financial controls that were operating effectively for ensuring the accuracy and completeness of the accounting records, relevant to the preparation and presentation of the standalone financial statements that give a true and fair view and are free from material misstatement, whether due to fraud or error.
In preparing the standalone financial statements, Management and Board of Directors are responsible for assessing the Company’s ability to continue as a going concern, disclosing, as applicable, matters related to going concern and using the going concern basis of accounting unless Management either intends to liquidate the Company or to cease operations, or has no realistic alternative but to do so.
Board of Directors is also responsible for overseeing the Company’s financial reporting process.
Auditor’s Responsibilities for the Audit of the Standalone Financial Statements
Our objectives are to obtain reasonable assurance about whether the standalone financial statements as a whole are free from material misstatement, whether due to fraud or error, and to issue an auditor’s report that includes our opinion. Reasonable assurance is a high level of assurance, but is not a guarantee that an audit conducted in accordance with SAs will always detect a material misstatement when it exists. Misstatements can arise from fraud or error and are considered material if, individually or in the aggregate, they could reasonably be expected to influence the economic decisions of users taken on the basis of these standalone financial statements.

Financial Statements | Standalone
Annual Report 2018-19
213
INDEPENDENT AUDITOR'S REPORTAs at March 31, 2019
As part of an audit in accordance with SAs, we exercise professional judgment and maintain professional skepticism throughout the audit. We also:
• Identify and assess the risks of material misstatement of the standalone financial statements, whether due to fraud or error, design and perform audit procedures responsive to those risks, and obtain audit evidence that is sufficient and appropriate to provide a basis for our opinion. The risk of not detecting a material misstatement resulting from fraud is higher than for one resulting from error, as fraud may involve collusion, forgery, intentional omissions, misrepresentations, or the override of internal controls.
• Obtain an understanding of internal controls relevant to the audit in order to design audit procedures that are appropriate in the circumstances. Under Section 143(3)(i) of the Act, we are also responsible for expressing our opinion on whether the Company has adequate internal financial controls with reference to financial statements in place and the operating effectiveness of such controls.
• Evaluate the appropriateness of accounting policies used and the reasonableness of accounting estimates and related disclosures made by Management.
• Conclude on the appropriateness of Management’s use of the going concern basis of accounting and, based on the audit evidence obtained, whether a material uncertainty exists related to events or conditions that may cast significant doubt on the Company’s ability to continue as a going concern. If we conclude that a material uncertainty exists, we are required to draw attention in our auditor’s report to the related disclosures in the standalone financial statements or, if such disclosures are inadequate, to modify our opinion. Our conclusions are based on the audit evidence obtained up to the date of our auditor’s report. However, future events or conditions may cause the Company to cease to continue as a going concern.
• Evaluate the overall presentation, structure and content of the standalone financial statements, including the disclosures, and whether the standalone financial statements represent the underlying transactions and events in a manner that achieves fair presentation.
We communicate with those charged with governance regarding, among other matters, the planned scope and timing of the audit and significant audit findings, including any significant deficiencies in internal controls that we identify during our audit.
We also provide those charged with governance with a statement that we have complied with relevant ethical requirements regarding independence, and to communicate with them all relationships and other matters that may reasonably be thought to bear on our independence, and where applicable, related safeguards.
From the matters communicated with those charged with governance, we determine those matters that were of most significance in the audit of the standalone financial statements of the current period and are therefore the key audit matters. We describe these matters in our auditor’s report unless law or regulation precludes public disclosure about the matter or when, in extremely rare circumstances, we determine that a matter should not be communicated in our report because the adverse consequences of doing so would reasonably be expected to outweigh the public interest benefits of such communication.
Report on Other Legal and Regulatory Requirements
1. As required by the Companies (Auditors’ Report) Order, 2016 (“the Order”) issued by the Central Government in terms of Section 143 (11) of the Act, we give in the “Annexure A” a statement on the matters specified in paragraphs 3 and 4 of the Order, to the extent applicable.
As required by Section 143(3) of the Act, we report that:
a) We have sought and obtained all the information and explanations which to the best of our knowledge and belief were necessary for the purposes of our audit.
b) In our opinion, proper books of account as required by law have been kept by the Company so far as it appears from our examination of those books.
c) The standalone balance sheet, the standalone statement of profit and loss (including other comprehensive income), the standalone statement of changes in equity and the standalone statement of cash flows dealt with by this Report are in agreement with the books of account.
Strides Pharma Science Limited
214
INDEPENDENT AUDITOR'S REPORTAs at March 31, 2019
d) In our opinion, the aforesaid standalone financial statements comply with the Ind AS specified under Section 133 of the Act.
e) On the basis of the written representations received from the directors as on 31 March 2019 taken on record by the Board of Directors, none of the directors are disqualified as on 31 March 2019 from being appointed as a director in terms of Section 164(2) of the Act.
f) With respect to the adequacy of the internal financial controls with reference to financial statements of the Company and the operating effectiveness of such controls, refer to our separate Report in “Annexure B”.
With respect to the other matters to be included in the Auditor’s Report in accordance with Rule 11 of the Companies (Audit and Auditors) Rules, 2014, in our opinion and to the best of our information and according to the explanations given to us:
a) The Company has disclosed the impact of pending litigations as at 31 March 2019 on its financial position in its standalone financial statements - Refer Note 38.1 and 41 to the standalone financial statements;
b) The Company did not have any long-term contracts including derivative contracts for which there were any material foreseeable losses - Refer Note 53 to the standalone financial statements;
c) There has been no delay in transferring amounts, required to be transferred, to the Investor Education and Protection Fund by the Company; and
d) The disclosures in the standalone financial statements regarding holdings as well as dealings in specified bank notes during the period from 8 November 2016 to 30 December 2016 have not been made in these financial statements since they do not pertain to the financial year ended 31 March 2019.
With respect to the matter to be included in the Auditor’s Report under section 197(16):
In our opinion and according to the information and explanations given to us, the remuneration paid by the Company to its directors during the current year is in accordance with the provisions of Section 197 of the Act. The remuneration paid to any director is not in excess of the limit laid down under Section 197 of the Act. The Ministry of Corporate Affairs has not prescribed other details under Section 197(16) which are required to be commented upon by us.
for B S R & Co. LLPChartered Accountants
Firm’s Registration No: 101248W/W-100022
Sampad Guha ThakurtaBengaluru Partner10 May 2019 Membership No.: 060573
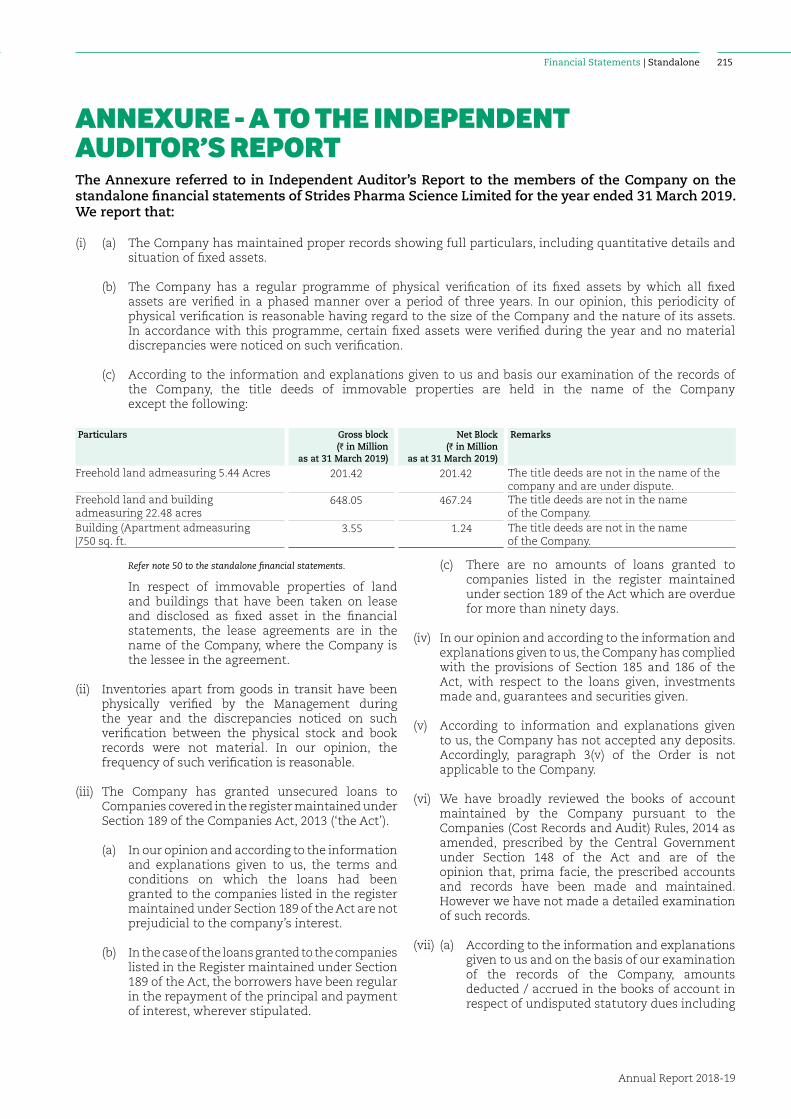
Financial Statements | Standalone
Annual Report 2018-19
215
(i) (a) The Company has maintained proper records showing full particulars, including quantitative details and situation of fixed assets.
(b) The Company has a regular programme of physical verification of its fixed assets by which all fixed assets are verified in a phased manner over a period of three years. In our opinion, this periodicity of physical verification is reasonable having regard to the size of the Company and the nature of its assets. In accordance with this programme, certain fixed assets were verified during the year and no material discrepancies were noticed on such verification.
(c) According to the information and explanations given to us and basis our examination of the records of the Company, the title deeds of immovable properties are held in the name of the Company except the following:
Particulars Gross block(I in Million
as at 31 March 2019)
Net Block(I in Million
as at 31 March 2019)
Remarks
Freehold land admeasuring 5.44 Acres 201.42 201.42 The title deeds are not in the name of the company and are under dispute.
Freehold land and building admeasuring 22.48 acres
648.05 467.24 The title deeds are not in the name of the Company.
Building (Apartment admeasuring |750 sq. ft.
3.55 1.24 The title deeds are not in the name of the Company.
ANNEXURE - A TO THE INDEPENDENT AUDITOR’S REPORTThe Annexure referred to in Independent Auditor’s Report to the members of the Company on the standalone financial statements of Strides Pharma Science Limited for the year ended 31 March 2019. We report that:
Refer note 50 to the standalone financial statements.
In respect of immovable properties of land and buildings that have been taken on lease and disclosed as fixed asset in the financial statements, the lease agreements are in the name of the Company, where the Company is the lessee in the agreement.
(ii) Inventories apart from goods in transit have been physically verified by the Management during the year and the discrepancies noticed on such verification between the physical stock and book records were not material. In our opinion, the frequency of such verification is reasonable.
(iii) The Company has granted unsecured loans to Companies covered in the register maintained under Section 189 of the Companies Act, 2013 (‘the Act’).
(a) In our opinion and according to the information and explanations given to us, the terms and conditions on which the loans had been granted to the companies listed in the register maintained under Section 189 of the Act are not prejudicial to the company’s interest.
(b) In the case of the loans granted to the companies listed in the Register maintained under Section 189 of the Act, the borrowers have been regular in the repayment of the principal and payment of interest, wherever stipulated.
(c) There are no amounts of loans granted to companies listed in the register maintained under section 189 of the Act which are overdue for more than ninety days.
(iv) In our opinion and according to the information and explanations given to us, the Company has complied with the provisions of Section 185 and 186 of the Act, with respect to the loans given, investments made and, guarantees and securities given.
(v) According to information and explanations given to us, the Company has not accepted any deposits. Accordingly, paragraph 3(v) of the Order is not applicable to the Company.
(vi) We have broadly reviewed the books of account maintained by the Company pursuant to the Companies (Cost Records and Audit) Rules, 2014 as amended, prescribed by the Central Government under Section 148 of the Act and are of the opinion that, prima facie, the prescribed accounts and records have been made and maintained. However we have not made a detailed examination of such records.
(vii) (a) According to the information and explanations given to us and on the basis of our examination of the records of the Company, amounts deducted / accrued in the books of account in respect of undisputed statutory dues including
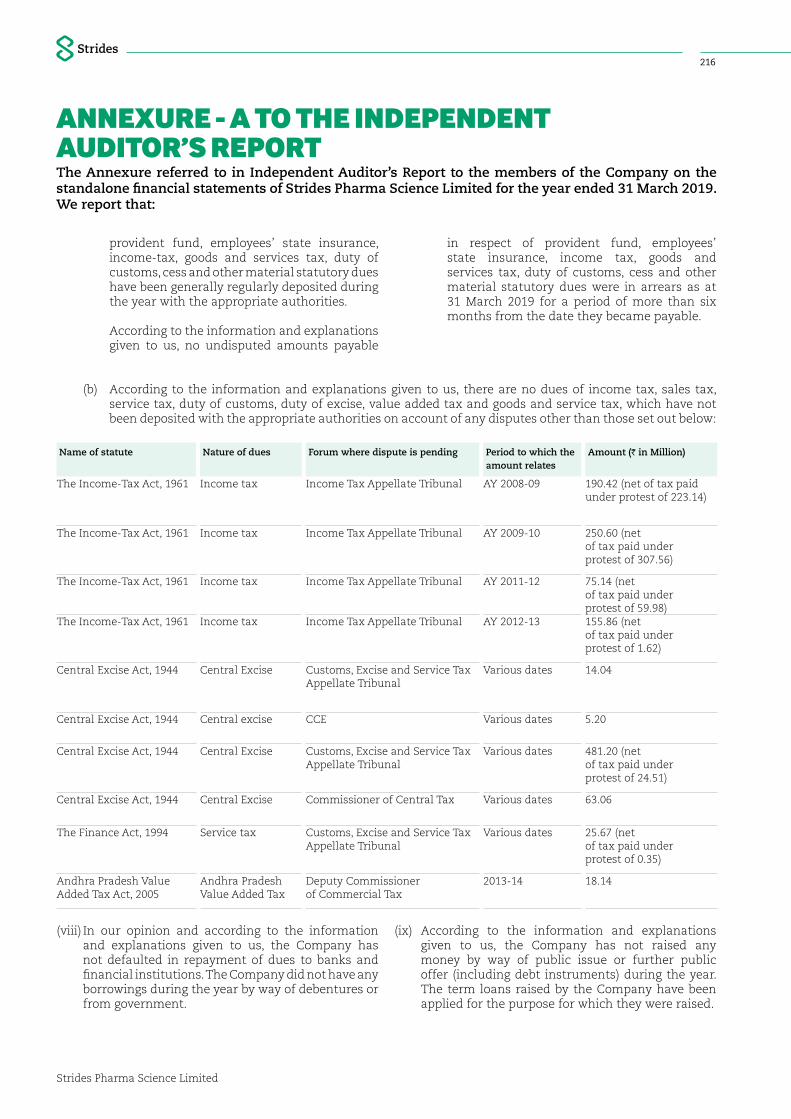
Strides Pharma Science Limited
216
ANNEXURE - A TO THE INDEPENDENT AUDITOR’S REPORTThe Annexure referred to in Independent Auditor’s Report to the members of the Company on the standalone financial statements of Strides Pharma Science Limited for the year ended 31 March 2019. We report that:
provident fund, employees’ state insurance, income-tax, goods and services tax, duty of customs, cess and other material statutory dues have been generally regularly deposited during the year with the appropriate authorities.
According to the information and explanations given to us, no undisputed amounts payable
in respect of provident fund, employees’ state insurance, income tax, goods and services tax, duty of customs, cess and other material statutory dues were in arrears as at 31 March 2019 for a period of more than six months from the date they became payable.
(b) According to the information and explanations given to us, there are no dues of income tax, sales tax, service tax, duty of customs, duty of excise, value added tax and goods and service tax, which have not been deposited with the appropriate authorities on account of any disputes other than those set out below:
Name of statute Nature of dues Forum where dispute is pending Period to which the amount relates
Amount (I in Million)
The Income-Tax Act, 1961 Income tax Income Tax Appellate Tribunal AY 2008-09 190.42 (net of tax paid under protest of 223.14)
The Income-Tax Act, 1961 Income tax Income Tax Appellate Tribunal AY 2009-10 250.60 (net of tax paid underprotest of 307.56)
The Income-Tax Act, 1961 Income tax Income Tax Appellate Tribunal AY 2011-12 75.14 (net of tax paid underprotest of 59.98)
The Income-Tax Act, 1961 Income tax Income Tax Appellate Tribunal AY 2012-13 155.86 (net of tax paid underprotest of 1.62)
Central Excise Act, 1944 Central Excise Customs, Excise and Service Tax Appellate Tribunal
Various dates 14.04
Central Excise Act, 1944 Central excise CCE Various dates 5.20
Central Excise Act, 1944 Central Excise Customs, Excise and Service Tax Appellate Tribunal
Various dates 481.20 (net of tax paid underprotest of 24.51)
Central Excise Act, 1944 Central Excise Commissioner of Central Tax Various dates 63.06
The Finance Act, 1994 Service tax Customs, Excise and Service Tax Appellate Tribunal
Various dates 25.67 (net of tax paid underprotest of 0.35)
Andhra Pradesh Value Added Tax Act, 2005
Andhra Pradesh Value Added Tax
Deputy Commissioner of Commercial Tax
2013-14 18.14
(viii) In our opinion and according to the information and explanations given to us, the Company has not defaulted in repayment of dues to banks and financial institutions. The Company did not have any borrowings during the year by way of debentures or from government.
(ix) According to the information and explanations given to us, the Company has not raised any money by way of public issue or further public offer (including debt instruments) during the year. The term loans raised by the Company have been applied for the purpose for which they were raised.
Financial Statements | Standalone
Annual Report 2018-19
217
(x) According to the information and explanations given to us, no fraud by the Company or any material fraud on the Company by its officers or employees has been noticed or reported during the year.
(xi) According to the information and explanations given to us and based on examination of the records of the Company, the Company has paid/provided managerial remuneration in accordance with the requisite approvals mandated by the provisions of Section 197 read with Schedule V to the Act.
(xii) In our opinion and according to the information and explanations given to us, the Company is not a nidhi company. Accordingly, paragraph 3(xii) of the Order is not applicable.
(xiii) According to the information and explanations given to us and based on our examination of the records of the Company, transactions with the related parties are in compliance with Sections 177 and 188 of the Act, where applicable and details of such transactions have been disclosed in the standalone financial statements, as required by the applicable accounting standards.
(xiv) According to the information and explanations given to us and based on our examination of the records of the Company, the Company has not made any preferential allotment or private placement of shares or fully or partly convertible debentures during the year. Accordingly para 3 (xiv) of the Order is not applicable.
(xv) According to the information and explanations given to us and based on our examination of the records of the Company, the Company has not entered into non-cash transactions with directors or persons connected with him.
(xvi) According to the information and explanations given to us, the Company is not required to be registered under Section 45-IA of the Reserve Bank of India Act, 1934.
for B S R & Co. LLPChartered Accountants
Firm’s Registration No: 101248W/W-100022
Sampad Guha ThakurtaBengaluru Partner10 May 2019 Membership No.: 060573
ANNEXURE - A TO THE INDEPENDENT AUDITOR’S REPORTThe Annexure referred to in Independent Auditor’s Report to the members of the Company on the standalone financial statements of Strides Pharma Science Limited for the year ended 31 March 2019. We report that:

Strides Pharma Science Limited
218
Opinion
We have audited the internal financial controls with reference to financial statements of Strides Pharma Science Limited (“the Company”) as of 31 March 2019 in conjunction with our audit of the standalone financial statements of the Company for the year ended on that date.
In our opinion, the Company has, in all material respects, adequate internal financial controls with reference to financial statements and such internal financial controls were operating effectively as at 31 March 2019, based on the internal financial controls with reference to financial statements criteria established by the Company considering the essential components of internal controls stated in the Guidance Note on Audit of Internal Financial Controls Over Financial Reporting issued by the Institute of Chartered Accountants of India (the “Guidance Note”).
Management’s Responsibility for Internal Financial Controls
The Company’s Management and the Board of Directors are responsible for establishing and maintaining internal financial controls based on the internal financial controls with reference to financial statements criteria established by the Company considering the essential components of internal controls stated in the Guidance Note. These responsibilities include the design, implementation and maintenance of adequate internal
financial controls that were operating effectively for ensuring the orderly and efficient conduct of its business, including adherence to company’s policies, the safeguarding of its assets, the prevention and detection of frauds and errors, the accuracy and completeness of the accounting records, and the timely preparation of reliable financial information, as required under the Companies Act, 2013 (hereinafter referred to as “the Act”).
Auditor’s Responsibility
Our responsibility is to express an opinion on the Company’s internal financial controls with reference to financial statements based on our audit. We conducted our audit in accordance with the Guidance Note and the Standards on Auditing, prescribed under section 143(10) of the Act, to the extent applicable to an audit of internal financial controls with reference to financial statements. Those Standards and the Guidance Note require that we comply with ethical requirements and plan and perform the audit to obtain reasonable assurance about whether adequate internal financial controls with reference to financial statements were established and maintained and whether such controls operated effectively in all material respects.
Our audit involves performing procedures to obtain audit evidence about the adequacy of the internal financial controls with reference to financial statements and their operating effectiveness. Our audit of internal financial controls with reference to financial statements
ANNEXURE B TO THE INDEPENDENT AUDITOR’S REPORT ON THE STANDALONE FINANCIAL STATEMENTS OF STRIDES PHARMA SCIENCE LIMITED (“THE COMPANY”) FOR THE YEAR ENDED 31 MARCH 2019. Report on the internal financial controls with reference to the aforesaid standalone financial statements under Clause (i) of Sub-section 3 of Section 143 of the Companies Act, 2013
(Referred to in paragraph 1 (f) under ‘Report on Other Legal and Regulatory Requirements’ section of our report of even date)
Financial Statements | Standalone
Annual Report 2018-19
219
included obtaining an understanding of such internal financial controls, assessing the risk that a material weakness exists, and testing and evaluating the design and operating effectiveness of internal controls based on the assessed risk. The procedures selected depend on the auditor’s judgement, including the assessment of the risks of material misstatement of the standalone financial statements, whether due to fraud or error.
We believe that the audit evidence we have obtained is sufficient and appropriate to provide a basis for our audit opinion on the Company’s internal financial controls with reference to financial statements.
Meaning of Internal Financial controls with Reference to Financial Statements
A company’s internal financial controls with reference to financial statements is a process designed to provide reasonable assurance regarding the reliability of financial reporting and the preparation of financial statements for external purposes in accordance with generally accepted accounting principles. A company’s internal financial controls with reference to financial statements include those policies and procedures that (1) pertain to the maintenance of records that, in reasonable detail, accurately and fairly reflect the transactions and dispositions of the assets of the company; (2) provide reasonable assurance that transactions are recorded as necessary to permit preparation of financial statements in accordance with generally accepted accounting principles, and that receipts and expenditures of the company are being made only in
accordance with authorisations of management and directors of the company; and (3) provide reasonable assurance regarding prevention or timely detection of unauthorised acquisition, use, or disposition of the company’s assets that could have a material effect on the financial statements.
Inherent Limitations of Internal Financial controls with Reference to Financial Statements
Because of the inherent limitations of internal financial controls with reference to financial statements, including the possibility of collusion or improper management override of controls, material misstatements due to error or fraud may occur and not be detected. Also, projections of any evaluation of the internal financial controls with reference to financial statements to future periods are subject to the risk that the internal financial controls with reference to financial statements may become inadequate because of changes in conditions, or that the degree of compliance with the policies or procedures may deteriorate.
for B S R & Co. LLPChartered Accountants
Firm’s Registration No: 101248W/W-100022
Sampad Guha ThakurtaBengaluru Partner10 May 2019 Membership No.: 060573
ANNEXURE B TO THE INDEPENDENT AUDITOR’S REPORT ON THE STANDALONE FINANCIAL STATEMENTS OF STRIDES PHARMA SCIENCE LIMITED (“THE COMPANY”) FOR THE YEAR ENDED 31 MARCH 2019. Report on the internal financial controls with reference to the aforesaid standalone financial statements under Clause (i) of Sub-section 3 of Section 143 of the Companies Act, 2013
(Referred to in paragraph 1 (f) under ‘Report on Other Legal and Regulatory Requirements’ section of our report of even date)
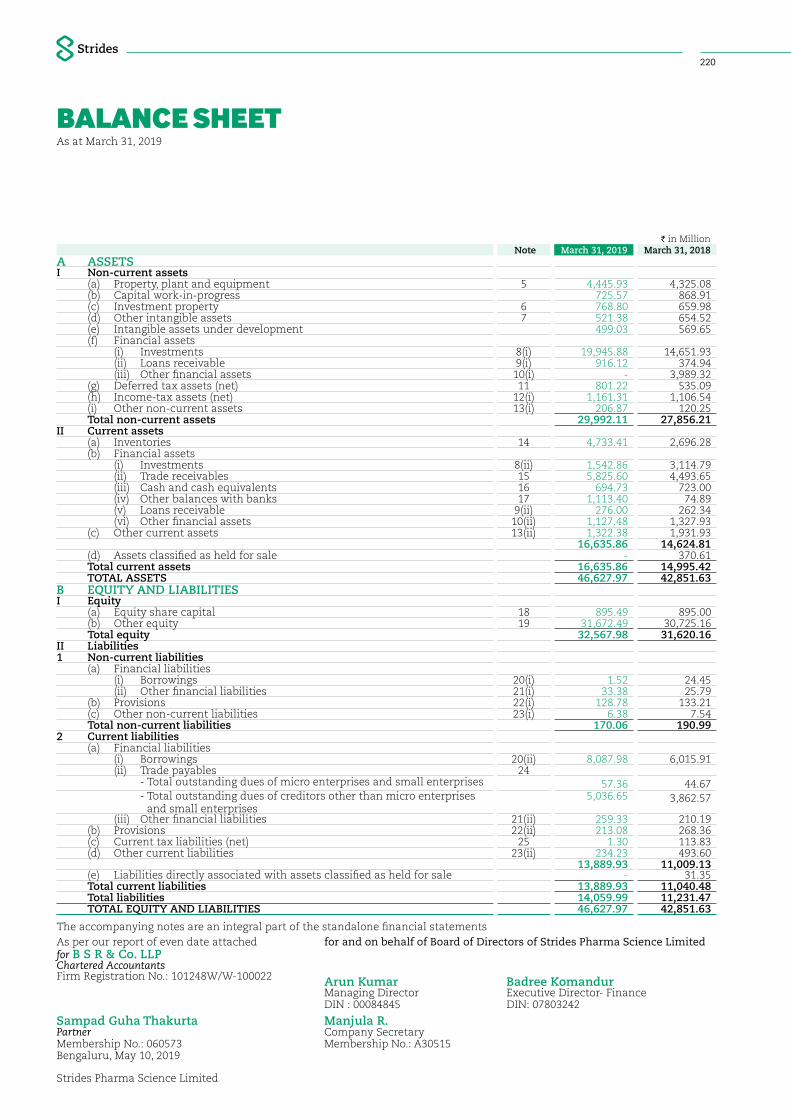
Strides Pharma Science Limited
220
BALANCE SHEETAs at March 31, 2019
The accompanying notes are an integral part of the standalone financial statementsAs per our report of even date attached for and on behalf of Board of Directors of Strides Pharma Science Limitedfor B S R & Co. LLPChartered AccountantsFirm Registration No.: 101248W/W-100022 Arun Kumar Badree Komandur
Managing Director Executive Director- FinanceDIN : 00084845 DIN: 07803242
Sampad Guha Thakurta Manjula R.Partner Company SecretaryMembership No.: 060573 Membership No.: A30515 Bengaluru, May 10, 2019
I in MillionNote March 31, 2019 March 31, 2018
A ASSETSI Non-current assets
(a) Property, plant and equipment 5 4,445.93 4,325.08 (b) Capital work-in-progress 725.57 868.91(c) Investment property 6 768.80 659.98 (d) Other intangible assets 7 521.38 654.52 (e) Intangible assets under development 499.03 569.65(f) Financial assets (i) Investments 8(i) 19,945.88 14,651.93 (ii) Loans receivable 9(i) 916.12 374.94 (iii) Other financial assets 10(i) - 3,989.32 (g) Deferred tax assets (net) 11 801.22 535.09 (h) Income-tax assets (net) 12(i) 1,161.31 1,106.54 (i) Other non-current assets 13(i) 206.87 120.25 Total non-current assets 29,992.11 27,856.21
II Current assets(a) Inventories 14 4,733.41 2,696.28 (b) Financial assets (i) Investments 8(ii) 1,542.86 3,114.79 (ii) Trade receivables 15 5,825.60 4,493.65 (iii) Cash and cash equivalents 16 694.73 723.00 (iv) Other balances with banks 17 1,113.40 74.89 (v) Loans receivable 9(ii) 276.00 262.34 (vi) Other financial assets 10(ii) 1,127.48 1,327.93 (c) Other current assets 13(ii) 1,322.38 1,931.93 16,635.86 14,624.81(d) Assets classified as held for sale - 370.61 Total current assets 16,635.86 14,995.42TOTAL ASSETS 46,627.97 42,851.63
B EQUITY AND LIABILITIESI Equity
(a) Equity share capital 18 895.49 895.00 (b) Other equity 19 31,672.49 30,725.16 Total equity 32,567.98 31,620.16
II Liabilities1 Non-current liabilities
(a) Financial liabilities (i) Borrowings 20(i) 1.52 24.45 (ii) Other financial liabilities 21(i) 33.38 25.79 (b) Provisions 22(i) 128.78 133.21 (c) Other non-current liabilities 23(i) 6.38 7.54 Total non-current liabilities 170.06 190.99
2 Current liabilities(a) Financial liabilities (i) Borrowings 20(ii) 8,087.98 6,015.91 (ii) Trade payables 24 - Total outstanding dues of micro enterprises and small enterprises 57.36 44.67 - Total outstanding dues of creditors other than micro enterprises
and small enterprises 5,036.65 3,862.57
(iii) Other financial liabilities 21(ii) 259.33 210.19 (b) Provisions 22(ii) 213.08 268.36 (c) Current tax liabilities (net) 25 1.30 113.83 (d) Other current liabilities 23(ii) 234.23 493.60 13,889.93 11,009.13(e) Liabilities directly associated with assets classified as held for sale - 31.35 Total current liabilities 13,889.93 11,040.48Total liabilities 14,059.99 11,231.47TOTAL EQUITY AND LIABILITIES 46,627.97 42,851.63
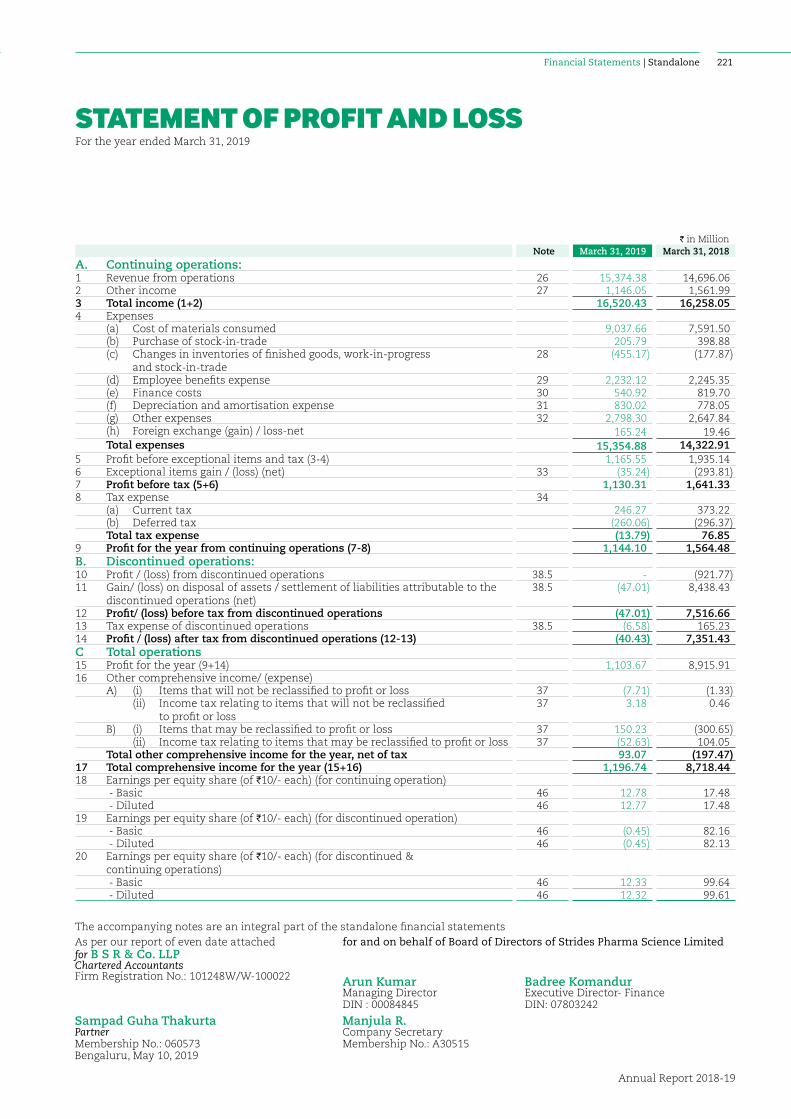
Financial Statements | Standalone
Annual Report 2018-19
221
The accompanying notes are an integral part of the standalone financial statementsAs per our report of even date attached for and on behalf of Board of Directors of Strides Pharma Science Limitedfor B S R & Co. LLPChartered AccountantsFirm Registration No.: 101248W/W-100022 Arun Kumar Badree Komandur
Managing Director Executive Director- FinanceDIN : 00084845 DIN: 07803242
Sampad Guha Thakurta Manjula R.Partner Company SecretaryMembership No.: 060573 Membership No.: A30515 Bengaluru, May 10, 2019
STATEMENT OF PROFIT AND LOSSFor the year ended March 31, 2019
I in MillionNote March 31, 2019 March 31, 2018
A. Continuing operations:1 Revenue from operations 26 15,374.38 14,696.06 2 Other income 27 1,146.05 1,561.99 3 Total income (1+2) 16,520.43 16,258.054 Expenses
(a) Cost of materials consumed 9,037.66 7,591.50(b) Purchase of stock-in-trade 205.79 398.88(c) Changes in inventories of finished goods, work-in-progress
and stock-in-trade28 (455.17) (177.87)
(d) Employee benefits expense 29 2,232.12 2,245.35 (e) Finance costs 30 540.92 819.70 (f) Depreciation and amortisation expense 31 830.02 778.05 (g) Other expenses 32 2,798.30 2,647.84 (h) Foreign exchange (gain) / loss-net 165.24 19.46Total expenses 15,354.88 14,322.91
5 Profit before exceptional items and tax (3-4) 1,165.55 1,935.146 Exceptional items gain / (loss) (net) 33 (35.24) (293.81)7 Profit before tax (5+6) 1,130.31 1,641.338 Tax expense 34
(a) Current tax 246.27 373.22(b) Deferred tax (260.06) (296.37)Total tax expense (13.79) 76.85
9 Profit for the year from continuing operations (7-8) 1,144.10 1,564.48B. Discontinued operations:10 Profit / (loss) from discontinued operations 38.5 - (921.77)11 Gain/ (loss) on disposal of assets / settlement of liabilities attributable to the
discontinued operations (net)38.5 (47.01) 8,438.43
12 Profit/ (loss) before tax from discontinued operations (47.01) 7,516.6613 Tax expense of discontinued operations 38.5 (6.58) 165.23 14 Profit / (loss) after tax from discontinued operations (12-13) (40.43) 7,351.43C Total operations15 Profit for the year (9+14) 1,103.67 8,915.9116 Other comprehensive income/ (expense)
A) (i) Items that will not be reclassified to profit or loss 37 (7.71) (1.33) (ii) Income tax relating to items that will not be reclassified
to profit or loss37 3.18 0.46
B) (i) Items that may be reclassified to profit or loss 37 150.23 (300.65) (ii) Income tax relating to items that may be reclassified to profit or loss 37 (52.63) 104.05 Total other comprehensive income for the year, net of tax 93.07 (197.47)
17 Total comprehensive income for the year (15+16) 1,196.74 8,718.4418 Earnings per equity share (of I10/- each) (for continuing operation)
- Basic 46 12.78 17.48 - Diluted 46 12.77 17.48
19 Earnings per equity share (of I10/- each) (for discontinued operation) - Basic 46 (0.45) 82.16 - Diluted 46 (0.45) 82.13
20 Earnings per equity share (of I10/- each) (for discontinued & continuing operations) - Basic 46 12.33 99.64 - Diluted 46 12.32 99.61
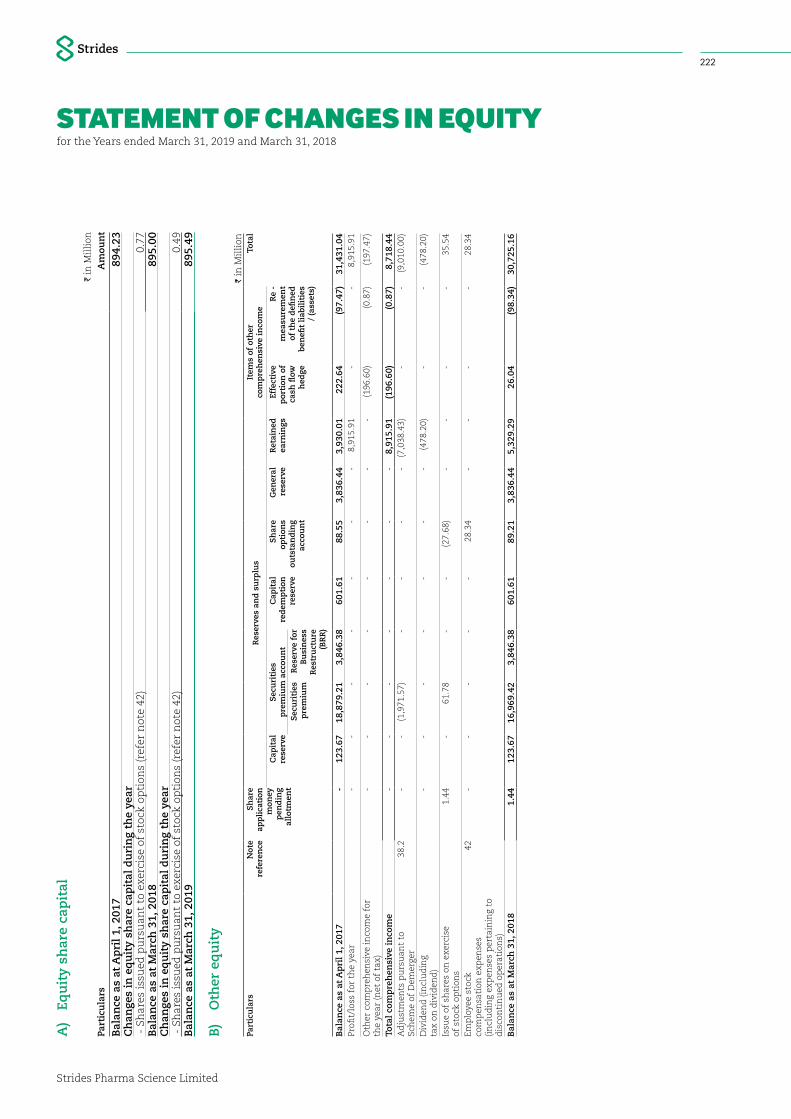
Strides Pharma Science Limited
222
STATEMENT OF CHANGES IN EQUITYfor the Years ended March 31, 2019 and March 31, 2018
A)
Equ
ity
shar
e ca
pit
al
I in
Mil
lion
Part
icu
lars
Am
oun
t
Bal
ance
as
at A
pri
l 1,
201
789
4.23
C
han
ges
in e
qu
ity
shar
e ca
pit
al d
uri
ng
the
year
- S
har
es is
sued
pu
rsu
ant
to e
xerc
ise
of s
tock
op
tion
s (r
efer
not
e 42
)0.
77
Bal
ance
as
at M
arch
31,
201
889
5.00
C
han
ges
in e
qu
ity
shar
e ca
pit
al d
uri
ng
the
year
- S
har
es is
sued
pu
rsu
ant
to e
xerc
ise
of s
tock
op
tion
s (r
efer
not
e 42
)0.
49
Bal
ance
as
at M
arch
31,
201
989
5.49
B)
Oth
er e
qu
ity
I in
Mil
lion
Part
icu
lars
Not
e re
fere
nce
Sh
are
app
lica
tion
m
oney
p
end
ing
allo
tmen
t
Res
erve
s an
d s
urp
lus
Item
s of
oth
er
com
pre
hen
sive
in
com
eTo
tal
Cap
ital
re
serv
eS
ecu
riti
es
pre
miu
m a
ccou
nt
Cap
ital
re
dem
pti
on
rese
rve
Sh
are
opti
ons
outs
tan
din
g ac
cou
nt
Gen
eral
re
serv
eR
etai
ned
ea
rnin
gsEf
fect
ive
por
tion
of
cash
flow
h
edge
Re
-m
easu
rem
ent
of t
he
defi
ned
b
enefi
t li
abil
itie
s /
(ass
ets)
Sec
uri
ties
p
rem
ium
Res
erve
for
B
usi
nes
s R
estr
uct
ure
(B
RR
)
Bal
ance
as
at A
pri
l 1,
201
7 -
1
23.6
7 1
8,87
9.21
3
,846
.38
601
.61
88.
55
3,8
36.4
4 3
,930
.01
222
.64
(97.
47)
31,
431.
04
Profi
t/lo
ss f
or t
he
year
-
-
-
-
-
-
-
8,9
15.9
1 -
-
8
,915
.91
Oth
er c
omp
reh
ensi
ve in
com
e fo
r th
e ye
ar (
net
of
tax)
-
-
-
-
-
-
-
-
(19
6.60
) (
0.87
) (
197.
47)
Tota
l co
mp
reh
ensi
ve i
nco
me
-
-
-
-
-
-
-
8,9
15.9
1 (1
96.6
0) (0
.87)
8,7
18.4
4 A
dju
stm
ents
pu
rsu
ant
to
Sch
eme
of D
emer
ger
38.2
-
-
(1,
971.
57)
-
-
-
-
(7,
038.
43)
-
-
(9,
010.
00)
Div
iden
d (
incl
ud
ing
tax
on d
ivid
end
) -
-
-
-
-
-
-
(
478.
20)
-
-
(47
8.20
)
Issu
e of
sh
ares
on
exe
rcis
e of
sto
ck o
pti
ons
1.4
4 -
61
.78
-
-
(27.
68)
-
-
-
-
35.5
4
Emp
loye
e st
ock
com
pen
sati
on e
xpen
ses
(in
clu
din
g ex
pen
ses
per
tain
ing
to
dis
con
tin
ued
op
erat
ion
s)
42 -
-
-
-
-
2
8.34
-
-
-
-
2
8.34
Bal
ance
as
at M
arch
31,
201
8 1
.44
123
.67
16,
969.
42
3,8
46.3
8 6
01.6
1 8
9.21
3
,836
.44
5,3
29.2
9 2
6.04
(9
8.34
) 3
0,72
5.16

Financial Statements | Standalone
Annual Report 2018-19
223
STATEMENT OF CHANGES IN EQUITY
I in
Mil
lion
Part
icu
lars
Not
e re
fere
nce
Sh
are
app
lica
tion
m
oney
p
end
ing
allo
tmen
t
Res
erve
s an
d s
urp
lus
Item
s of
oth
er
com
pre
hen
sive
in
com
eTo
tal
Cap
ital
re
serv
eS
ecu
riti
es
pre
miu
m a
ccou
nt
Cap
ital
re
dem
pti
on
rese
rve
Sh
are
opti
ons
outs
tan
din
g ac
cou
nt
Gen
eral
re
serv
eR
etai
ned
ea
rnin
gsEf
fect
ive
por
tion
of
cash
flow
h
edge
Re
-m
easu
rem
ent
of t
he
defi
ned
b
enefi
t li
abil
itie
s /
(ass
ets)
Sec
uri
ties
p
rem
ium
Res
erve
for
B
usi
nes
s R
estr
uct
ure
(B
RR
)
Ad
just
men
ts p
urs
uan
t to
ad
opti
on o
f IN
D A
S 11
5, (
net
of
tax)
-
-
-
-
-
-
-
(93
.03)
-
-
(93
.03)
Ad
just
ed b
alan
ce a
s at
Ap
ril
01, 2
018
1.4
4 1
23.6
7 1
6,96
9.42
3
,846
.38
601
.61
89.
21
3,8
36.4
4 5
,236
.26
26.
04
(98.
34)
30,
632.
13
Profi
t/lo
ss f
or t
he
year
-
-
-
-
-
-
-
1,1
03.6
7 -
-
1
,103
.67
Oth
er c
omp
reh
ensi
ve in
com
e fo
r th
e ye
ar (
net
of
tax)
-
-
-
-
-
-
-
-
97.
60
(4.
53)
93.
07
Tota
l co
mp
reh
ensi
ve i
nco
me
-
-
-
-
-
-
-
1,1
03.6
7 9
7.60
(4
.53)
1,1
96.7
4 D
ivid
end
(in
clu
din
g ta
x on
div
iden
d)
-
-
-
-
-
-
-
(17
9.10
) -
-
(
179.
10)
Issu
e of
sh
ares
on
exe
rcis
e of
sto
ck o
pti
ons
(1.
44)
-
31.3
9 -
-
(1
6.43
) -
-
-
-
13
.52
Emp
loye
e st
ock
com
pen
sati
on e
xpen
ses
(in
clu
din
g ex
pen
ses
per
tain
ing
to
dis
con
tin
ued
op
erat
ion
s)
42 -
-
-
-
-
9
.20
-
-
-
-
9.2
0
Tran
sfer
red
to
gen
eral
res
erve
on
st
ock
opti
on l
apse
-
-
-
-
-
(6.
28)
6.2
8 -
-
-
-
Bal
ance
as
at M
arch
31,
201
9 -
1
23.6
7 1
7,00
0.81
3
,846
.38
601
.61
75.
70
3,8
42.7
2 6
,160
.83
123
.64
(102
.87)
31,
672.
49
Th
e ac
com
pan
yin
g n
otes
are
an
inte
gral
par
t of
th
e st
and
alon
e fi
nan
cial
sta
tem
ents
As
per
ou
r re
por
t of
eve
n d
ate
atta
ched
for
and
on
beh
alf
of B
oard
of
Dir
ecto
rs o
f St
rid
es P
har
ma
Scie
nce
Lim
ited
for
B S
R &
Co.
LLP
Cha
rter
ed A
ccou
ntan
tsFi
rm R
egis
trat
ion
No.
: 101
248W
/W-1
0002
2A
run
Ku
mar
Bad
ree
Kom
and
ur
Man
agin
g D
irec
tor
Exec
uti
ve D
irec
tor-
Fin
ance
DIN
: 00
0848
45D
IN: 0
7803
242
Sam
pad
Gu
ha
Th
aku
rta
Man
jula
R.
Part
ner
Com
pan
y Se
cret
ary
Mem
ber
ship
No.
: 060
573
Mem
ber
ship
No.
: A30
515
Ben
galu
ru, M
ay 1
0, 2
019
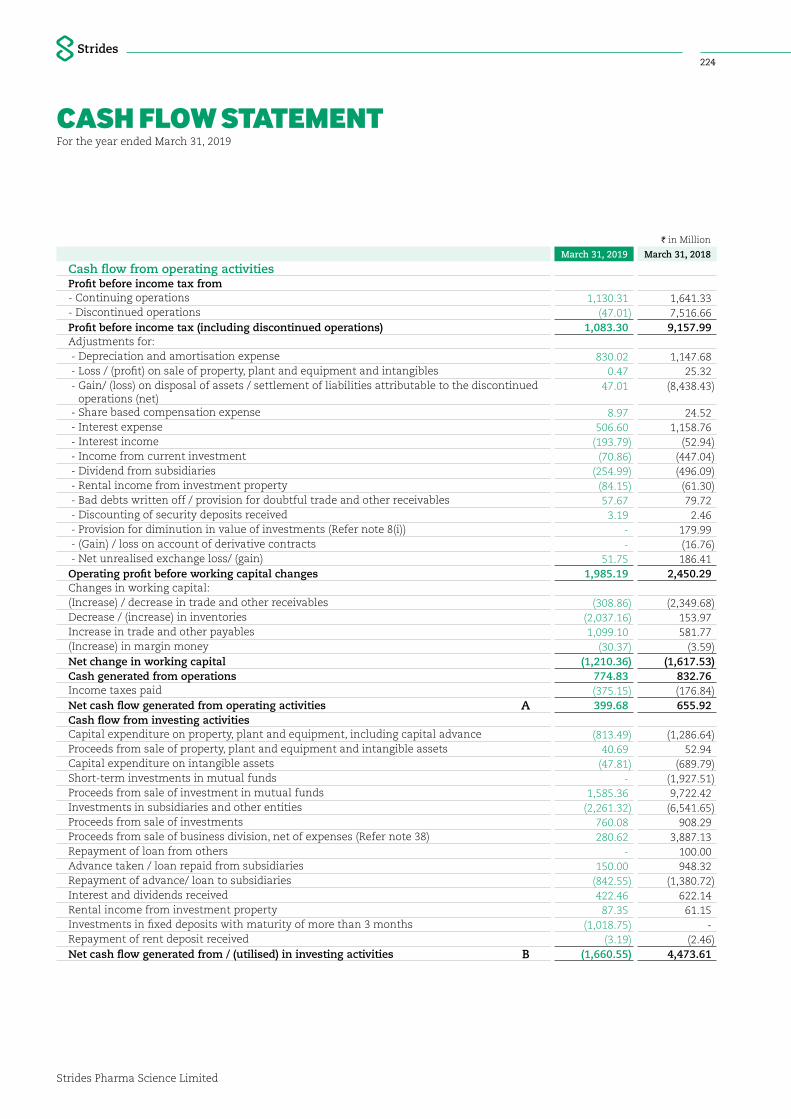
Strides Pharma Science Limited
224
I in Million
March 31, 2019 March 31, 2018
Cash flow from operating activitiesProfit before income tax from- Continuing operations 1,130.31 1,641.33 - Discontinued operations (47.01) 7,516.66 Profit before income tax (including discontinued operations) 1,083.30 9,157.99 Adjustments for: - Depreciation and amortisation expense 830.02 1,147.68 - Loss / (profit) on sale of property, plant and equipment and intangibles 0.47 25.32 - Gain/ (loss) on disposal of assets / settlement of liabilities attributable to the discontinued
operations (net)47.01 (8,438.43)
- Share based compensation expense 8.97 24.52 - Interest expense 506.60 1,158.76 - Interest income (193.79) (52.94) - Income from current investment (70.86) (447.04) - Dividend from subsidiaries (254.99) (496.09) - Rental income from investment property (84.15) (61.30) - Bad debts written off / provision for doubtful trade and other receivables 57.67 79.72 - Discounting of security deposits received 3.19 2.46 - Provision for diminution in value of investments (Refer note 8(i)) - 179.99 - (Gain) / loss on account of derivative contracts - (16.76) - Net unrealised exchange loss/ (gain) 51.75 186.41 Operating profit before working capital changes 1,985.19 2,450.29 Changes in working capital:(Increase) / decrease in trade and other receivables (308.86) (2,349.68)Decrease / (increase) in inventories (2,037.16) 153.97 Increase in trade and other payables 1,099.10 581.77 (Increase) in margin money (30.37) (3.59)Net change in working capital (1,210.36) (1,617.53)Cash generated from operations 774.83 832.76 Income taxes paid (375.15) (176.84)Net cash flow generated from operating activities A 399.68 655.92 Cash flow from investing activitiesCapital expenditure on property, plant and equipment, including capital advance (813.49) (1,286.64)Proceeds from sale of property, plant and equipment and intangible assets 40.69 52.94 Capital expenditure on intangible assets (47.81) (689.79)Short-term investments in mutual funds - (1,927.51)Proceeds from sale of investment in mutual funds 1,585.36 9,722.42 Investments in subsidiaries and other entities (2,261.32) (6,541.65)Proceeds from sale of investments 760.08 908.29 Proceeds from sale of business division, net of expenses (Refer note 38) 280.62 3,887.13 Repayment of loan from others - 100.00 Advance taken / loan repaid from subsidiaries 150.00 948.32 Repayment of advance/ loan to subsidiaries (842.55) (1,380.72)Interest and dividends received 422.46 622.14 Rental income from investment property 87.35 61.15 Investments in fixed deposits with maturity of more than 3 months (1,018.75) - Repayment of rent deposit received (3.19) (2.46)Net cash flow generated from / (utilised) in investing activities B (1,660.55) 4,473.61
CASH FLOW STATEMENT For the year ended March 31, 2019
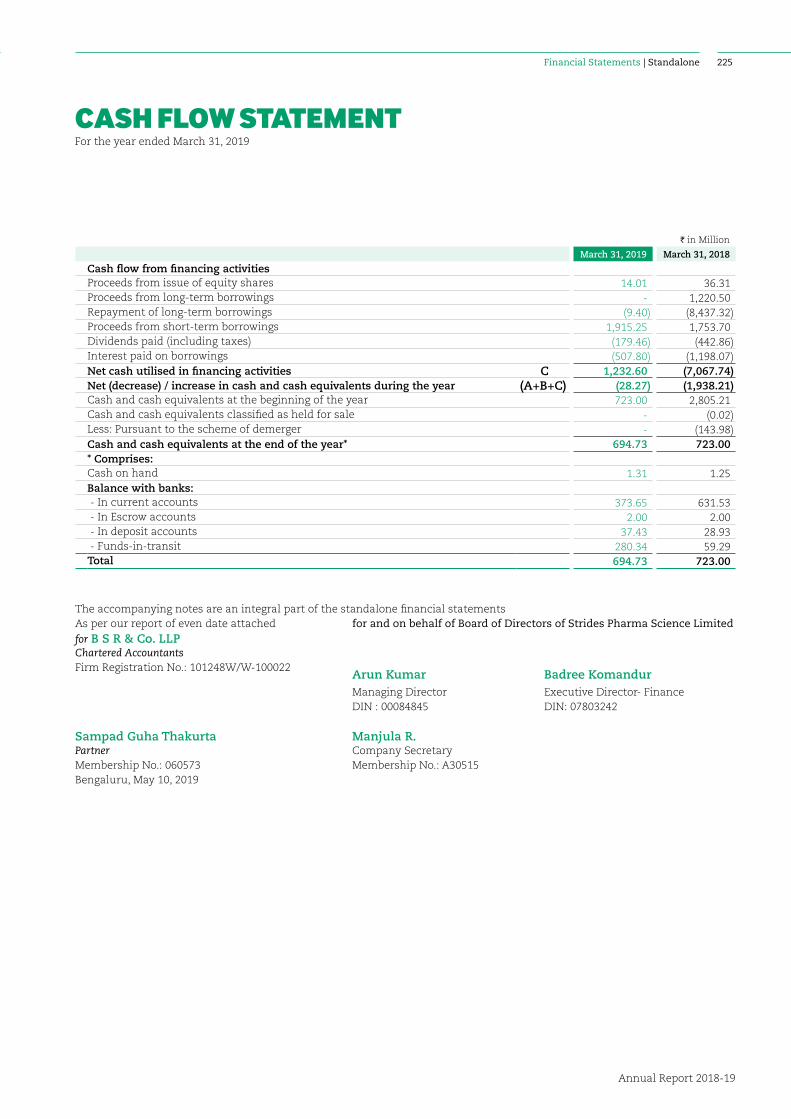
Financial Statements | Standalone
Annual Report 2018-19
225
CASH FLOW STATEMENT For the year ended March 31, 2019
I in Million
March 31, 2019 March 31, 2018
Cash flow from financing activitiesProceeds from issue of equity shares 14.01 36.31 Proceeds from long-term borrowings - 1,220.50 Repayment of long-term borrowings (9.40) (8,437.32)Proceeds from short-term borrowings 1,915.25 1,753.70 Dividends paid (including taxes) (179.46) (442.86)Interest paid on borrowings (507.80) (1,198.07)Net cash utilised in financing activities C 1,232.60 (7,067.74)Net (decrease) / increase in cash and cash equivalents during the year (A+B+C) (28.27) (1,938.21)Cash and cash equivalents at the beginning of the year 723.00 2,805.21 Cash and cash equivalents classified as held for sale - (0.02)Less: Pursuant to the scheme of demerger - (143.98)Cash and cash equivalents at the end of the year* 694.73 723.00 * Comprises:Cash on hand 1.31 1.25 Balance with banks: - In current accounts 373.65 631.53 - In Escrow accounts 2.00 2.00 - In deposit accounts 37.43 28.93 - Funds-in-transit 280.34 59.29 Total 694.73 723.00
The accompanying notes are an integral part of the standalone financial statementsAs per our report of even date attached for and on behalf of Board of Directors of Strides Pharma Science Limitedfor B S R & Co. LLPChartered AccountantsFirm Registration No.: 101248W/W-100022
Arun Kumar Badree KomandurManaging Director Executive Director- FinanceDIN : 00084845 DIN: 07803242
Sampad Guha Thakurta Manjula R.Partner Company SecretaryMembership No.: 060573 Membership No.: A30515 Bengaluru, May 10, 2019
NOTESforming part of the standalone financial statements for the year ended March 31, 2019
Strides Pharma Science Limited
226
Note No. 01 // General Information
Strides Pharma Science Limited (formerly Strides Shasun Limited) (the ‘Company’ or ‘Strides’) is a pharmaceutical company domiciled in India, with its registered office situated at 201, Devavrata, Sector 17, Vashi, Navi Mumbai – 400703 and corporate office in Bengaluru, India. The Company has changed its name from Strides Shasun Limited to Strides Pharma Science Limited with effect from July 18, 2018. The Company has been incorporated under the provisions of Indian Companies Act and its equity shares are listed on the National Stock Exchange (NSE) and Bombay Stock Exchange (BSE) in India. Strides develops and manufactures a wide range of IP-led niche pharmaceutical products.
Note No. 02 // Basis of preparation of financial statements
2.1 Statement of complianceThese standalone financial statements of the Company have been prepared in accordance with Indian Accounting Standards (Ind AS) as per the Companies (Indian Accounting Standards) Rules 2015, as amended, notified under Section 133 of Companies Act, 2013, (the ‘Act’) and other relevant provisions of the Act.
The standalone financial statements were approved by the Board of Directors and authorised for issue on May 10, 2019.
2.2 Functional and presentation currencyThese standalone financial statements are presented in Indian Rupees (I), which is also the Company’s functional currency. All amounts have been rounded-off to two decimal places to the nearest million, unless otherwise indicated.
2.3 Basis of measurementThese standalone financial statements have been prepared on the historical cost basis, except for the following items:
- Certain financial assets and liabilities (including derivative instruments) are measured at fair value;
- Net defined benefit assets/(liability) are measured at fair value of plan assets, less present value of defined benefit obligations; and
- Equity settled share based payments that are measured at fair value.
2.4 Use of estimates and judgementsThe preparation of the financial statements in conformity with Ind AS requires management to make estimates, judgements and assumptions. These estimates, judgements and assumptions affect the application of accounting policies and the reported amounts of assets and liabilities, the disclosures of contingent assets and liabilities at the date of the financial statements and reported amounts of revenues and expenses during the period. Accounting estimates could change from period to period. Actual results could differ from those estimates. Appropriate changes in estimates are made as management becomes aware of changes in circumstances surrounding the estimates. Changes in estimates are reflected in the financial statements in the period in which changes are made and, if material, their effects are disclosed in the notes to the standalone financial statements.
2.4.1 JudgementsInformation about judgements made in applying accounting policies that have the most significant effects on the amounts recognised in the financial statements is included in the following notes:
• Note 2.2 — Assessment of functional currency;
• Note 3.2 — Revenue recognition: whether revenue from sale of product and services is recognised overtime or at a point of time:
• Note 3.15 and 47 — Financial instruments;
• Note 3.09, 3.10 and 3.11— Useful lives of property, plant and equipment, intangible assets and investment property;
• Note 3.3 — Lease classification;
• Note 2.4.2.1 — Impairment of non financial assets:
• Note 43 — Measurement of defined benefit obligation; key actuarial assumptions;
• Note 42 — Share based payments;
• Note 3.8, 11, 38.1 and 41 (b) — Provision for income taxes and related tax contingencies and evaluation of recoverability of deferred tax assets.
2.4.2 Assumption and estimation uncertaintyInformation about assumptions and estimation uncertainties that have a significant risk of resulting in a material adjustment in the year ending March 31, 2019 is included in the following notes.
2.4.2.1 Impairment of non-financial assetsDetermining whether the asset is impaired requires to assess the recoverable amount of the asset or Cash
NOTESforming part of the standalone financial statements for the year ended March 31, 2019
Financial Statements | Standalone
Annual Report 2018-19
227
Generating Unit (CGU) which is compared to the carrying amount of the asset or CGU, as applicable. Recoverable amount is the higher of fair value less costs of disposal and value in use. Where the carrying amount of an asset or CGU exceeds the recoverable amount, the asset is considered impaired and is written down to its recoverable amount.
The value in use calculation requires the management to estimate the future cash flows expected to arise from the cash-generating unit and a suitable discount rate in order to calculate present value. Where the actual future cash flows are less than expected, a material impairment loss may arise.
2.4.2.2 Impairment of financial assetsThe impairment provisions for financial assets are based on assumptions about risk of default and expected cash loss rates. The Company uses judgement in making these assumptions and selecting the inputs to the impairment calculation, based on Company’s past history, existing market conditions as well as forward looking estimates at the end of each reporting period.
2.4.2.3 Employee benefitsThe cost of defined benefit plans are determined using actuarial valuations. The actuarial valuation involves making assumptions about discount rates, future salary increases, attrition rate and mortality rates. Due to the long-term nature of these plans, such estimates are subject to significant uncertainty. (Refer note 43)
2.4.2.4 Share based compensation to employeesThe Company has granted share based payment plans to its employees. Valuation models are used to calculate the expense for such share-based compensation to employees. These models require a number of assumptions to be made as input. These include financial assumptions as well as various assumptions around individual employee behaviour. (Refer note 42)
2.4.2.5 LitigationsAs explained in note 38.1, the Company is a party to certain commercial disputes and has also received notification of claims for significant amounts. There are number of factors that may affect the ultimate outcome in respect of this matter and accordingly, it is difficult to assess the impact of these disputes with accuracy. (Refer note 41)
2.5 Operating cycleAs mentioned in para 1 above under ‘Corporate information’, the Company is into development and manufacture of pharmaceutical products. Based on the normal time between acquisition of assets and their
realisation in cash or cash equivalents, the Company has determined its operating cycle as 3 years to 5 years and 12 months relating to research and development activities and manufacturing of pharmaceutical products respectively. The above basis is used for classifying the assets and liabilities into current and non-current as the case may be.
2.6 Cash flow statementCash flows are reported using indirect method, whereby net profits before tax is adjusted for the effects of transactions of a non-cash nature and any deferrals or accruals of past or future cash receipts or payments and items of income or expenses associated with investing or financing cash flows. The cash flows from regular revenue generating (operating activities), investing and financing activities of the Company are segregated.
Note No. 03 // Significant accounting policies
3.1 Business combinationsAcquisitions of businesses are accounted for using the acquisition method. The consideration transferred in a business combination is measured at fair value, which is calculated as the sum of the acquisition-date fair values of the assets transferred by the Company, liabilities incurred by the Company to the former owners of the acquiree and the equity interests issued by the Company in exchange of control of the acquiree. Acquisition-related costs are generally recognised in statement of profit and loss as incurred.
At the acquisition date, the identifiable assets acquired and the liabilities assumed are recognised at their fair value, except that:
- deferred tax assets or liabilities, and assets or liabilities related to employee benefit arrangements are recognised and measured in accordance with Ind AS 12 Income Taxes and Ind AS 19 Employee Benefits respectively;
- liabilities or equity instruments related to share-based payment arrangements of the acquiree or share-based payment arrangements of the Company entered into to replace share-based payment arrangements of the acquiree are measured in accordance with Ind AS 102 Share-based Payment at the acquisition date (see note 3.7.2); and
- assets (or disposal groups) that are classified as held for sale in accordance with Ind AS 105 Non-current Assets Held for Sale and Discontinued Operations are measured in accordance with that Standard.
NOTESforming part of the standalone financial statements for the year ended March 31, 2019
Strides Pharma Science Limited
228
3.2 Revenue from contracts with customersThe Company recognises revenue to depict the transfer of promised goods or services to customers in an amount that reflects the consideration to which the entity expects to be entitled in exchange for those goods or services. A 5-step approach is used to recognise revenue as below:
Step 1: Identify the contract(s) with a customer
Step 2: Identify the performance obligation in contract
Step 3: Determine the transaction price
Step 4: Allocate the transaction price to the performance obligations in the contract
Step 5: Recognise revenue when (or as) the entity satisfies a performance obligation
3.2.1 Sale of goodsRevenue is recognised when a promise in a customer contract (performance obligation) has been satisfied by transferring control over the promised goods to the customer. Control over a promised good refers to the ability to direct the use of, and obtain substantially all of the remaining benefits from, those goods. Control is usually transferred upon shipment, delivery to, upon receipt of goods by the customer, in accordance with the delivery and acceptance terms agreed with the customers. The amount of revenue to be recognised (transaction price) is based on the consideration expected to be received in exchange for goods, excluding amounts collected on behalf of third parties such as sales tax or other taxes directly linked to sales. If a contract contains more than one performance obligation, the transaction price is allocated to each performance obligation based on their relative stand-alone selling prices. Revenue from product sales are recorded net of allowances for estimated rebates, cash discounts and estimates of product returns, all of which are established at the time of sale.
The consideration received by the Company in exchange for its goods may be fixed or variable. Variable consideration is only recognised when it is considered highly probable that a significant revenue reversal will not occur once the underlying uncertainty related to variable consideration is subsequently resolved.
Profit share revenuesThe Company from time to time enters into marketing arrangements with certain business partners for the sale of its products in certain markets. Under such arrangements, the Company sells its products to the
business partners at a base purchase price agreed upon in the arrangement and is also entitled to a profit share which is over and above the base purchase price. The profit share is typically dependent on the business partner’s ultimate net sale proceeds or net profits, subject to any reductions or adjustments that are required by the terms of the arrangement. Such arrangements typically require the business partner to provide confirmation of units sold and net sales or net profit computations for the products covered under the arrangement.
Revenue in an amount equal to the base purchase price is recognised in these transactions upon delivery of products to the business partners. An additional amount representing the profit share component is recognised as revenue in the period which corresponds to the ultimate sales of the products made by business partners only when the collectability of the profit share becomes probable and a reliable measurement of the profit share is available. Otherwise, recognition is deferred to a subsequent period pending satisfaction of such collectability and measurability requirements. In measuring the amount of profit share revenue to be recognised for each period, the Company uses all available information and evidence, including any confirmations from the business partner of the profit share amount owed to the Company, to the extent made available before the date the Company’s Board of Directors authorises the issuance of its financial statements for the applicable period.
Sale to distributorsThe Company appoints distributors in various territories who purchases the goods from the Company and thereafter sells them in the territory. In case the distributor is acting as an agent, the Company defers revenue recognition till the time goods are sold by the distributor to the end customer. On the other hand, if the distributor is principal, revenue is recognised upon the transfer of control over the goods to the distributor.
Right to reject or return goodsThe Company also sells its products to the customers with a right to return the goods within the specified period of time. If the probability of acceptance by the customer is uncertain, recognition of revenue is deferred till the expiry of right to return or acceptance by the customer whichever is earlier.
Price variations / IncentivesIncentives are accounted based on the assessment of whether the beneficiary (of the incentive) is acting as a principal or an agent. Where the beneficiary is a principal, the incentive is regarded as consideration paid to the customer and is reduced from revenue.
NOTESforming part of the standalone financial statements for the year ended March 31, 2019
Financial Statements | Standalone
Annual Report 2018-19
229
However, where the beneficiary is an agent, the incentive payment is recognised as an expense as the same is in the nature of commission.
Chargebacks / Reptos claims by the wholesalers / distributors and Price Protections
Chargebacks and reptos claims are estimated on the basis of the average trend of the past periods and recognised as reduction to revenue.
3.2.2 Sale of servicesRevenue from services rendered, which primarily relate to contract research, is recognised in the statement of profit and loss as the underlying services are performed. Upfront payments received under these arrangements are deferred and recognised as revenue over the expected period over which the related services are expected to be performed.
3.2.3 Royalty, sale of licenses and Intellectual property rightsThe Company enters into certain dossier sales, royalties, licensing and supply arrangements with various parties. Income from licensing arrangements is generally recognised over the term of the contract. Some of these arrangements include certain performance obligations by the Company. Revenue from such arrangements is recognised in the period in which the Company completes all its performance obligations.
3.2.4 Export incentivesExport incentives are accrued for based on fulfilment of eligibility criteria for availing the incentives and when there is no uncertainty in receiving the same. These incentives include estimated realisable values/benefits from special import licenses and benefits under specified schemes as applicable.
3.2.5 Rental incomeThe Company’s policy for recognition of revenue from operating leases is described in note 3.3.1 below.
3.2.6 Dividend and interest incomeDividend income from investments is recognised when the shareholder’s right to receive payment has been established (provided that it is probable that the economic benefits will flow to the Company and the amount of income can be measured reliably).
Interest income from a financial asset is recognised when it is probable that the economic benefits will flow to the Company and the amount of income can be measured reliably. Interest income is accrued on a time basis, by reference to the principal outstanding and at
the effective interest rate applicable, which is the rate that exactly discounts estimated future cash receipts through the expected life of the financial asset to that asset’s net carrying amount on initial recognition.
3.2.7 TransitionThe Company has adopted IND AS 115 using the cumulative effect method (without practical expedients), with the effect of initially applying this standard recognised at the date of initial application (i.e. April 1, 2018). Accordingly, the information presented for the year ended March 31, 2018 has not been restated – i.e. it is presented, as previously reported, under IND AS 18 and related interpretations.
3.3 LeasesLeases are classified as finance leases whenever the terms of the lease transfer substantially all the risks and rewards of ownership to the lessee. All other leases are classified as operating leases.
3.3.1 The Company as lessorRental income from operating leases is generally recognised on a straight-line basis over the term of the relevant lease. Initial direct costs incurred in negotiating and arranging an operating lease are added to the carrying amount of the leased asset and recognised on a straight-line basis over the lease term.
3.3.2 The Company as lesseeAssets held under finance leases are initially recognised as assets of the Company at their fair value at the inception of the lease or, if lower, at the present value of the minimum lease payments. The corresponding liability to the lessor is included in the standalone balance sheet as a finance lease obligation.
Lease payments are apportioned between finance costs and reduction of the lease obligation so as to achieve a constant rate of interest on the remaining balance of the liability. Finance costs are recognised immediately in statement of profit and loss, unless they are directly attributable to qualifying assets, in which case they are capitalised in accordance with the Company’s general policy on borrowing costs (see note 3.5 below). Contingent rentals are recognised as expenses in the periods in which they are incurred.
Rental expense from operating leases is generally recognised on a straight-line basis over the term of the relevant lease. Where the rentals are structured solely to increase in line with expected general inflation to compensate for the lessor’s expected inflationary cost increases, such increases are recognised in the year in which such benefits accrue. Contingent rentals arising
NOTESforming part of the standalone financial statements for the year ended March 31, 2019
Strides Pharma Science Limited
230
under operating leases are recognised as an expense in the period in which they are incurred.
3.4 Foreign currencies transactions and translationTransactions in foreign currencies are recorded at the exchange rate prevailing on the date of transaction. Monetary assets and liabilities denominated in foreign currencies are translated at the functional currency closing rates of exchange at the reporting date.
Exchange differences arising on settlement or translation of monetary items are recognised in Statement of Profit and Loss except to the extent of exchange differences which are regarded as an adjustment to interest costs on foreign currency borrowings that are directly attributable to the acquisition or construction of qualifying assets, are capitalised as cost of assets.
Non-monetary assets and liabilities that are measured in terms of historical cost in foreign currencies are not retranslated. Income and expense items in foreign currency are translated at the average exchange rates for the period, unless exchange rates fluctuate significantly during that period, in which case the exchange rates at the dates of the transactions are used.
3.5 Borrowing costsBorrowing costs include:
(i) interest expense calculated using the effective interest rate method,
(ii) finance charges in respect of finance leases, and
(iii) exchange differences arising from foreign currency borrowings to the extent that they are regarded as an adjustment to interest costs.
Borrowing costs directly attributable to the acquisition, construction or production of qualifying assets, which are assets that necessarily take a substantial period of time to get ready for their intended use or sale, are added to the cost of those assets, until such time as the assets are substantially ready for their intended use or sale.
Interest income earned on the temporary investment of specific borrowings pending their expenditure on qualifying assets is deducted from the borrowing costs eligible for capitalisation.
All other borrowing costs are recognised in statement of profit and loss in the period in which they are incurred.
3.6 Employee benefits 3.6.1 Short-term employee benefitsAll employee benefits falling due wholly within twelve months of rendering the services are classified as short-term employee benefits, which include benefits like salaries, wages, short-term compensated absences and performance incentives and are recognised as expenses in the period in which the employee renders the related service.
3.6.2 Post-employment benefitsPayments to defined contribution retirement benefit plans are recognised as an expense when employees have rendered service entitling them to the contributions.
For defined benefit retirement plans, the cost of providing benefits is determined using the projected unit credit method, with actuarial valuations being carried out at the end of each annual reporting period. Remeasurement, comprising actuarial gains and losses, the effect of the changes to the asset ceiling (if applicable) and the return on plan assets (excluding net interest), is reflected immediately in the balance sheet with a charge or credit recognised in other comprehensive income in the period in which they occur. Remeasurement recognised in other comprehensive income is reflected immediately in retained earnings and is not reclassified to statement of profit and loss. Past service cost is recognised in statement of profit and loss in the period of a plan amendment. Net interest is calculated by applying the discount rate at the beginning of the period to the net defined benefit liability or asset.
The retirement benefit obligation recognised in the standalone balance sheet represents the actual deficit or surplus in the Company’s defined benefit plans. Any surplus resulting from this calculation is limited to the present value of any economic benefits available in the form of refunds from the plans or reductions in future contributions to the plans.
A liability for a termination benefit is recognised at the earlier of when the entity can no longer withdraw the offer of the termination benefit and when the entity recognises any related restructuring costs.
3.6.3 Compensated absencesThe Company has a policy on compensated absences which are both accumulating and non-accumulating in nature. The expected cost of accumulating compensated absences is determined by actuarial valuation performed by an independent actuary at each balance sheet date using the projected unit credit method on the additional amount expected to be paid/availed as a result of the unused entitlement that has accumulated at the balance sheet date. Expense on non-accumulating
NOTESforming part of the standalone financial statements for the year ended March 31, 2019
Financial Statements | Standalone
Annual Report 2018-19
231
compensated absences is recognised is the period in which the absences occur.
3.7 Share-based payment arrangements 3.7.1 Share-based payment transactions of the Company Equity-settled share-based payments to employees and others providing similar services are measured at the fair value of the equity instruments at the grant date.
The fair value determined at the grant date of the equity-settled share-based payments is expensed on a straight-line basis over the vesting period, based on the Company’s estimate of equity instruments that will eventually vest, with a corresponding increase in equity. At the end of each reporting period, the Company revises its estimate of the number of equity instruments expected to vest. The impact of the revision of the original estimates, if any, is recognised in statement of profit and loss such that the cumulative expense reflects the revised estimate, with a corresponding adjustment to the equity-settled employee benefits reserve.
3.7.2 Share-based payment transactions of the acquiree in a business combination When the share-based payment awards held by the employees of an acquiree (acquiree awards) are replaced by the Company’s share-based payment awards (replacement awards), both the acquiree awards and the replacement awards are measured in accordance with Ind AS 102 (“market-based measure”) at the acquisition date. The portion of the replacement awards that is included in measuring the consideration transferred in a business combination equals the market-based measure of the acquiree awards multiplied by the ratio of the portion of the vesting period completed to the greater of the total vesting period or the original vesting period of the acquiree award. The excess of the market-based measure of the replacement awards over the market-based measure of the acquiree awards included in measuring the consideration transferred is recognised as remuneration cost for post-combination service.
However, when the acquiree awards expire as a consequence of a business combination and the Company replaces those awards when it does not have an obligation to do so, the replacement awards are measured at their market-based measure in accordance with Ind AS 102. All of the market-based measure of the replacement awards is recognised as remuneration cost for post-combination service.
3.8 TaxationIncome tax expense represents the sum of current tax and deferred tax.
3.8.1 Current taxCurrent tax is calculated based on taxable profit for the year. Taxable profit differs from ‘profit before tax’ as reported in the standalone statement of profit and loss because of items of income or expense that are taxable or deductible in other years and items that are never taxable or deductible. The Company’s current tax is calculated using tax rates that have been enacted or substantively enacted by the end of the reporting period.
3.8.2 Deferred taxDeferred tax is recognised on temporary differences between the carrying amounts of assets and liabilities in the standalone financial statements and the corresponding tax bases used in the computation of taxable profit. Deferred tax liabilities are generally recognised for all taxable temporary differences. Deferred tax assets are generally recognised for all deductible temporary differences to the extent that it is probable that taxable profits will be available against which those deductible temporary differences can be utilised. Such deferred tax assets and liabilities are not recognised if the temporary difference arises from the initial recognition (other than in a business combination) of assets and liabilities in a transaction that affects neither the taxable profit nor the accounting profit. In addition, deferred tax liabilities are not recognised if the temporary difference arises from the initial recognition of goodwill.
The carrying amount of deferred tax assets is reviewed at the end of each reporting period and reduced to the extent that it is no longer probable that sufficient taxable profits will be available to allow all or part of the asset to be recovered.
Deferred tax liabilities and assets are measured at the tax rates that are expected to apply in the period in which the liability is settled or the asset realised, based on tax rates (and tax laws) that have been enacted or substantively enacted by the end of the reporting period.
The measurement of deferred tax liabilities and assets reflects the tax consequences that would follow from the manner in which the Company expects, at the end of the reporting period, to recover or settle the carrying amount of its assets and liabilities.
Deferred tax assets include Minimum Alternate Tax (MAT) paid in accordance with the tax laws in India, which is likely to give future economic benefits in the form of availability of set-off against future tax liability. Accordingly, MAT is recognised as deferred tax asset in the Balance sheet when the asset can be measured reliably and it is probable that the future economic benefit associated with the asset will be realised.
NOTESforming part of the standalone financial statements for the year ended March 31, 2019
Strides Pharma Science Limited
232
Current and deferred tax are recognised in statement of profit and loss, except when they relate to items that are recognised in other comprehensive income or directly in equity, in which case, the current and deferred tax are also recognised in other comprehensive income or directly in equity respectively. Where current tax or deferred tax arises from the initial accounting for a business combination, the tax effect is included in the accounting for the business combination.
3.9 Property, plant and equipmentProperty, plant and equipment held for use in the production or supply of goods or services, or for administrative purposes, are stated in the balance sheet at cost less accumulated depreciation and accumulated impairment losses.
Properties in the course of construction for production, supply or administrative purposes are carried at cost, less any recognised impairment loss. Cost includes professional fees and, for qualifying assets, borrowing costs capitalised in accordance with the Company’s accounting policy. Such properties are classified to the appropriate categories of property, plant and equipment when completed and ready for intended use. Subsequent expenditure is capitalised only if it is probable that the future economic benefits associated with the expenditure will flow to the Company. Depreciation of these assets, on the same basis as other property assets, commences when the assets are ready for their intended use.
The non refundable payments made with respect to Land taken on finance lease (where there is an option to purchase the same at the end of the lease period) is classified under Property, plant and Equipment as “Lease hold Land”.
Depreciation is recognised so as to write off the cost of assets (other than freehold land and properties under construction) less their residual values over their useful lives, using the straight-line method. The estimated useful lives, residual values and depreciation method are reviewed at the end of each reporting period, with the effect of any changes in estimate accounted for on a prospective basis.
Assets held under finance leases are depreciated over their expected useful lives on the same basis as owned assets. However, when there is no reasonable certainty that ownership will be obtained by the end of the lease term, assets are depreciated over the shorter of the lease term and their useful lives.
Depreciation on tangible fixed assets has been provided on the straight-line method as per the useful life prescribed in Schedule II to the Companies Act, 2013 except in respect of the following categories of assets, in whose case the life of the assets has been assessed to be different and are as under based on technical advice, taking into account the nature of the asset, the estimated usage of the asset, the operating conditions of the asset, past history of replacement, anticipated technological changes, manufacturers warranties and maintenance support, etc.:
Dies and punches : 4 years Mobile phones : 3 years Certain factory buildings : 18 years
Freehold land is not depreciated.
Assets held under finance leases are depreciated over their expected useful lives on the same basis as owned assets. However, when there is no reasonable certainty that ownership will be obtained by the end of the lease term, assets are depreciated over the shorter of the lease term and their useful lives.
Individual assets costing less than I5,000 are depreciated in full in the year of purchase.
An item of property, plant and equipment is derecognised upon disposal or when no future economic benefits are expected to arise from the continued use of the asset. Any gain or loss arising on the disposal or retirement of an item of property, plant and equipment is determined as the difference between the sales proceeds and the carrying amount of the asset and is recognised in statement of profit and loss.
3.10 Investment propertyProperties that is held for long-term rentals or for capital appreciation or both, and that is not occupied by the Company, is classified as investment property. Investment property is measured initially at its cost, including related transaction costs and where applicable borrowing costs. Subsequent expenditure is capitalised to the asset’s carrying amount only when it is probable that future economic benefits associated with the expenditure will flow to the company and the cost of the item can be measured reliably. All other repairs and maintenance costs are expensed when incurred. When part of the investment property is replaced, the carrying amount of the replaced part is derecognised.
Investment property are depreciated using the straight line method over their estimated useful lives. Investment properties generally have a useful life
NOTESforming part of the standalone financial statements for the year ended March 31, 2019
Financial Statements | Standalone
Annual Report 2018-19
233
of 25-60 years. The useful life has been determined based on technical evaluation performed by the management’s expert.
3.11 Intangible assets3.11.1 Intangible assets acquired separatelyIntangible assets with finite useful lives that are acquired separately are carried at cost less accumulated amortisation and accumulated impairment losses. Amortisation is recognised on a straight-line basis over their estimated useful lives. The estimated useful life and amortisation method are reviewed at the end of each reporting period, with the effect of any changes in estimate being accounted for on a prospective basis. Intangible assets with indefinite useful lives that are acquired separately are carried at cost less accumulated impairment losses.
3.11.2 Internally-generated intangible assets - research and development expenditureExpenditure on research activities is recognised as an expense in the period in which it is incurred.
An internally-generated intangible asset arising from development (or from the development phase of an internal project) is recognised if, and only if, all of the following have been demonstrated:
• the technical feasibility of completing the intangible asset so that it will be available for use or sale;
• the intention to complete the intangible asset and use or sell it;
• the ability to use or sell the intangible asset;
• how the intangible asset will generate probable future economic benefits;
• the availability of adequate technical, financial and other resources to complete the development and to use or sell the intangible asset; and
• the ability to measure reliably the expenditure attributable to the intangible asset during its development.
The amount initially recognised for internally-generated intangible assets is the sum of the expenditure incurred from the date when the intangible asset first meets the recognition criteria listed above. Where no internally-generated intangible asset can be recognised, development expenditure is recognised in statement of profit and loss in the period in which it is incurred.
Subsequent to initial recognition, internally-generated intangible assets are reported at cost less accumulated amortisation and accumulated impairment losses,
on the same basis as intangible assets that are acquired separately.
3.11.3 Intangible assets acquired in a business combinationIntangible assets acquired in a business combination and recognised separately from goodwill are initially recognised at their fair value at the acquisition date (which is regarded as their cost).
Subsequent to initial recognition, intangible assets acquired in a business combination are reported at cost less accumulated amortisation and accumulated impairment losses, on the same basis as intangible assets that are acquired separately.
3.11.4 Derecognition of intangible assets An intangible asset is derecognised on disposal, or when no future economic benefits are expected from use or disposal. Gains or losses arising from derecognition of an intangible asset, measured as the difference between the net disposal proceeds and the carrying amount of the asset, are recognised in statement of profit and loss when the asset is derecognised.
3.11.5 Useful lives of intangible assetsIntangible assets are amortised over their estimated useful life on straight line method as follows: Registration and Brands : 10 years to 25 years Software Licenses : 5 years
3.12 Impairment of assets3.12.1 Impairment of financial assets:The Company assesses at each date of balance sheet, whether a financial asset or a group of financial assets is impaired. Ind AS 109 requires expected credit losses to be measured through a loss allowance. The Company recognises lifetime expected losses for all contract assets and / or all trade receivables that do not constitute a financing transaction. For all other financial assets, expected credit losses are measured at an amount equal to the twelve-month expected credit losses or at an amount equal to the life time expected credit losses if the credit risk on the financial asset has increased significantly, since initial recognition.
3.12.2 Impairment of investment in subsidiaries, associates and joint venturesThe Company reviews its carrying value of investments in subsidiaries at cost, annually, or more frequently when there is an indication for impairment. If the recoverable amount is less than its carrying amount, the impairment loss is accounted for.
NOTESforming part of the standalone financial statements for the year ended March 31, 2019
Strides Pharma Science Limited
234
3.12.3 Impairment of non-financial assets At the end of each reporting period, the Company reviews the carrying amounts of its tangible and intangible assets to determine whether there is any indication that those assets have suffered an impairment loss. If any such indication exists, the recoverable amount of the asset is estimated in order to determine the extent of the impairment loss (if any). When it is not possible to estimate the recoverable amount of an individual asset, the Company estimates the recoverable amount of the cash-generating unit to which the asset belongs. When a reasonable and consistent basis of allocation can be identified, corporate assets are also allocated to individual cash-generating units, or otherwise they are allocated to the smallest group of cash-generating units for which a reasonable and consistent allocation basis can be identified.
Intangible assets with indefinite useful lives and intangible assets not yet available for use are tested for impairment at least annually, and whenever there is an indication that the asset may be impaired.
Recoverable amount is the higher of fair value less costs of disposal and value in use. In assessing value in use, the estimated future cash flows are discounted to their present value using a pre-tax discount rate that reflects current market assessments of the time value of money and the risks specific to the asset for which the estimates of future cash flows have not been adjusted.
If the recoverable amount of an asset (or cash-generating unit) is estimated to be less than its carrying amount, the carrying amount of the asset (or cash-generating unit) is reduced to its recoverable amount. An impairment loss is recognised immediately in statement of profit and loss.
When an impairment loss subsequently reverses, the carrying amount of the asset (or a cash-generating unit) is increased to the revised estimate of its recoverable amount, but so that the increased carrying amount does not exceed the carrying amount that would have been determined had no impairment loss been recognised for the asset (or cash-generating unit) in prior years. A reversal of an impairment loss is recognised immediately in statement of profit and loss.
3.13 InventoriesInventories are valued at the lower of cost and the net realisable value after providing for obsolescence and other losses, where considered necessary. Cost includes all charges in bringing the goods to the point of sale, including octroi and other levies, transit insurance and receiving charges. Cost is determined as follows:
Raw materials, packing materials and stores and spares: weighted average basis
Work-in progress: at material cost and an appropriate share of production overheads
Finished goods: material cost and an appropriate share of production overheads and excise duty, wherever applicable
Stock-in trade: weighted average basis.
Net realisable value is the estimated selling price in the ordinary course of business, less the estimated costs of completion and selling expenses. The net realisable value of work-in-progress is determined with reference to the selling prices of related finished products.
3.14 Provisions Provisions are recognised when the Company has a present obligation (legal or constructive) as a result of a past event, it is probable that the Company will be required to settle the obligation, and a reliable estimate can be made of the amount of the obligation.
The amount recognised as a provision is the best estimate of the consideration required to settle the present obligation at the end of the reporting period, taking into account the risks and uncertainties surrounding the obligation. When a provision is measured using the cash flows estimated to settle the present obligation, its carrying amount is the present value of those cash flows (when the effect of the time value of money is material).
When some or all of the economic benefits required to settle a provision are expected to be recovered from a third party, a receivable is recognised as an asset if it is virtually certain that reimbursement will be received and the amount of the receivable can be measured reliably.
3.14.1 Onerous contractsPresent obligations arising under onerous contracts are recognised and measured as provisions. An onerous contract is considered to exist where the Company has a contract under which the unavoidable costs of meeting the obligations under the contract exceed the economic benefits expected to be received from the contract.
3.14.2 Contingent liabilitiesContingent liabilities are disclosed in notes when there is a possible obligation that arises from past events and whose existence will be confirmed only by the occurrence or non-occurrence of one or more uncertain future events not wholly within the control of the entity.
NOTESforming part of the standalone financial statements for the year ended March 31, 2019
Financial Statements | Standalone
Annual Report 2018-19
235
3.15 Financial instruments 3.15.1 Investment in subsidiaries, associates and joint venturesThe Company has accounted for its investments in subsidiaries, associates and joint ventures at cost less impairment.
3.15.2 Other financial assets and financial liabilitiesOther financial assets and financial liabilities are recognised when Company becomes a party to the contractual provisions of the instruments.
Initial recognition and measurement:Other financial assets and financial liabilities are initially measured at fair value. Transaction costs that are directly attributable to the acquisition or issue of financial assets and financial liabilities (other than financial assets and financial liabilities at fair value through profit or loss) are added to or deducted from the fair value of the financial assets or financial liabilities, as appropriate, on initial recognition. Transaction costs directly attributable to the acquisition of financial assets or financial liabilities at fair value through profit or loss are recognised immediately in statement of profit and loss.
Subsequent measurement:Financial assets at amortised costFinancial assets are subsequently measured at amortised cost if these financial assets are held within a business whose objective is to hold these assets in order to collect contractual cash flows and contractual terms of financial asset give rise on specified dates to cash flows that are solely payments of principal and interest on the principal amount outstanding.
Financial assets at fair value through other comprehensive incomeFinancial assets are measured at fair value through other comprehensive income if these financial assets are held within business whose objective is achieved by both collecting contractual cash flows on specified dates that are solely payments of principal and interest on the principal amount outstanding and selling financial assets.
Financial assets at fair value through profit or lossFinancial assets are measured at fair value through profit or loss unless it measured at amortised cost or fair value through other comprehensive income on initial recognition. The transaction cost directly attributable to the acquisition of financial assets and liabilities at fair value through profit or loss are immediately recognised in the statement of profit and loss.
Financial liabilitiesFinancial liabilities are measured at amortised cost using effective interest rate method. For trade and other payables maturing within one year from the balance sheet date, the carrying amounts approximate fair value due to the short maturity of these instruments.
3.15.3 Equity instrumentsAn equity instrument is a contract that evidences residual interest in the assets of the company after deducting all of its liabilities. Equity instruments recognised by the Company are recognised at the proceeds received net off direct issue cost.
3.15.4 Financial guarantee contractsThe Company enters into financial guarantee contracts with its subsidiaries. At the inception of a financial guarantee contract, a liability is recognised initially at fair value and then subsequently at the higher of the estimated loss and amortised cost, the changes in subsequent measurement being recognised in the Statement of Profit and Loss. Where a guarantee is issued for a consideration, a financial asset of an amount equal to the liability is initially recognised at amortised cost. Where a guarantee is issued for no consideration, the fair value is recognised as additional investment in the entity to which the guarantee relates.
3.15.5 Derivative financial instruments and hedge accountingThe Company uses various derivative financial instruments such as interest rate swaps, currency swaps and forward contracts to mitigate the risk of changes in interest rates and foreign exchange rates. Such derivative financial instruments are initially recognised at fair value on the date on which a derivative contract is entered into and are also subsequently measured at fair value. Derivatives are carried as financial assets when the fair value is positive and as financial liabilities when the fair value is negative.
Any gains or losses arising from changes in the fair value of derivatives are taken directly to the Statement of Profit and Loss, except for the effective portion of cash flow hedges which is recognised in Other Comprehensive Income and later to the Statement of Profit and Loss when the hedged item affects profit or loss or treated as basis adjustment if a hedged forecast transaction subsequently results in the recognition of a non-financial assets or non-financial liability.
Hedges that meet the criteria for hedge accounting are accounted for as follows:
NOTESforming part of the standalone financial statements for the year ended March 31, 2019
Strides Pharma Science Limited
236
a) Cash flow hedgeThe Company designates derivative contracts or non derivative financial assets / liabilities as hedging instruments to mitigate the risk of movement in interest rates and foreign exchange rates for foreign exchange exposure on highly probable future cash flows attributable to a recognised asset or liability or forecast cash transactions. When a derivative is designated as a cash flow hedging instrument, the effective portion of changes in the fair value of the derivative is recognised in the cash flow hedging reserve being part of other comprehensive income. Any ineffective portion of changes in the fair value of the derivative is recognised immediately in the Statement of Profit and Loss. If the hedging relationship no longer meets the criteria for hedge accounting, then hedge accounting is discontinued prospectively. If the hedging instrument expires or is sold, terminated or exercised, the cumulative gain or loss on the hedging instrument recognised in cash flow hedging reserve till the period the hedge was effective remains in cash flow hedging reserve until the underlying transaction occurs. The cumulative gain or loss previously recognised in the cash flow hedging reserve is transferred to the Statement of Profit and Loss upon the occurrence of the underlying transaction. If the forecasted transaction is no longer expected to occur, then the amount accumulated in cash flow hedging reserve is reclassified in the Statement of Profit and Loss.
b) Fair value hedgeThe Company designates derivative contracts or non derivative financial assets / liabilities as hedging instruments to mitigate the risk of change in fair value of hedged item due to movement in interest rates, foreign exchange rates and commodity prices.
Changes in the fair value of hedging instruments and hedged items that are designated and qualify as fair value hedges are recorded in the Statement of Profit and Loss. If the hedging relationship no longer meets the criteria for hedge accounting, the adjustment to the carrying amount of a hedged item for which the effective interest method is used is amortised to Statement of Profit and Loss over the period of maturity.
3.16 Exceptional itemsWhen an item of income or expense within profit or loss from ordinary activity is of such size, nature or incidence that their disclosure is relevant to explain the performance of the Company for the year, the nature and amount of such items is disclosed as exceptional items.
3.17 Cash and cash equivalentsCash and cash equivalents consist of cash at banks and on hand and short-term deposits with an original maturity
of three months or less, highly liquid investments that are readily convertible into known amounts of cash and which are subject to insignificant risk of changes in value. Bank overdrafts that are repayable on demand and form an integral part of our cash management are included as a component of cash and cash equivalents for the purpose of the statement of cash flows.
3.18 Earnings per shareBasic Earnings Per Share (‘EPS’) is computed by dividing the net profit attributable to the equity shareholders by the weighted average number of equity shares outstanding during the year. Diluted earnings per share is computed by dividing the net profit by the weighted average number of equity shares considered for deriving basic earnings per share and also the weighted average number of equity shares that could have been issued upon conversion of all dilutive potential equity shares. Dilutive potential equity shares are deemed converted as of the beginning of the year, unless issued at a later date. In computing diluted earnings per share, only potential equity shares that are dilutive and that either reduces earnings per share or increases loss per share are included. The number of shares and potentially dilutive equity shares are adjusted retrospectively for all periods presented in case of share splits.
3.19 Standards / amendments not yet effectiveInd AS 116- LeasesIn March 2019, the Ministry of Corporate Affairs issued the Companies (Indian Accounting Standards) Amendment Rules, 2019, notifying Ind AS 116 ‘Leases’ (New lease Standard), which replaces Ind AS 17 ‘Leases’, including appendices thereto. Ind AS 116 is effective for annual periods beginning on or after April 01, 2019. Ind AS 116 sets out the principles for the recognition, measurement, presentation and disclosure of leases and requires lessees to account for all leases under a single on-balance sheet model similar to the accounting for finance leases under Ind AS 17. The standard includes two recognition exemptions for lessees – leases of ‘low-value’ assets (e.g., personal computers) and short-term leases (i.e., leases with a lease term of 12 months or less). At the commencement date of a lease, a lessee will recognise a liability to make lease payments (i.e., the lease liability) and an asset representing the right to use the underlying asset during the lease term (i.e., the right-of-use asset). Lessees will be required to separately recognise the interest expense on the lease liability and the depreciation expense on the right-of-use asset.
Lessees will be also required to remeasure the lease liability upon the occurrence of certain events (e.g., a change in the lease term, a change in future lease payments resulting from a change in an index or rate used
NOTESforming part of the standalone financial statements for the year ended March 31, 2019
Financial Statements | Standalone
Annual Report 2018-19
237
to determine those payments). The lessee will generally recognise the amount of the remeasurement of the lease liability as an adjustment to the right-of-use asset.
Lessor accounting under Ind AS 116 is substantially unchanged from existing accounting under Ind AS 17. Lessors will continue to classify all leases using the same classification principle as in Ind AS 17 and distinguish between two types of leases: operating and finance leases. The Company intends to adopt these standards, if applicable, when they become effective. As the Standalone does not have any material leases, therefore the adoption of this standard is not likely to have a material impact in its Standalone Financial Statements.
Ind AS 12 Appendix C, Uncertainty over Income Tax TreatmentsOn March 30, 2019 , the Ministry of Corporate Affairs has notified Ind AS 12 Appendix C, Uncertainty over Income Tax treatments which is to be applied while performing the determination of taxable profit (or loss), tax bases, unused tax credits and tax rates, when there is uncertainty over Income Tax treatments under Ind AS 12. According to the appendix, companies need to determine the probability of the relevant tax authority accepting each tax treatments, or group of tax treatments, that the companies have used or plan to use in their income tax filing which has to be considered to compute the most likely amount or the expected value of the tax treatment when determining taxable profit (or loss), tax base, unused tax losses, unused tax credits and tax rates.
The standard permits two possible method of transition – i) Full retrospective approach- Under this approach, Appendix C will be applied retrospectively to each reporting period presented in accordance with Ind AS 8 – Accounting policies, Changes in Accounting Estimates and Errors, without using hindsight and ii) Retrospectively with cumulative effect of initially applying Appendix C recognised by adjusting equity on initial application, without adjusting comparatives.
The effective date for adoption of Ind AS 12 Appendix C is annual period beginning on or after April 01, 2019. The Company will adopt the standard on April 01, 2019 and has decided to adjust the cumulative effect in equity on initial application i.e. April 01, 2019 without adjusting comparatives.
The effect of adoption of Ind AS 12 Appendix C would be insignificant in the standalone financial statements.
Amendments to Ind AS 12- Income taxes On March 30, 2019 , the Ministry of Corporate Affairs issued amendments to the guidance in Ind AS 12,
‘Income Taxes’, in connection with accounting for dividend distribution taxes.
The amendment clarified that an entity shall recognise the income tax consequences of dividend in profit or loss, other comprehensive income or equity according to where the entity originally recognised those past transactions or events.
Effective date for application of this amendment is annual period beginning on or after April 01, 2019. The Company is currently evaluating the effect of this amendment on the standalone financial statements
Amendment to Ind AS 19- plan amendment, curtailment or settlementOn March 30, 2019, Ministry of Corporate Affairs issued amendments to Ind AS 19, ‘Employee benefits’, in connection with accounting for plan amendments, curtailments and settlements.
The amendment require an entity:
— To use updated assumptions to determine current service cost and net interest for the remainder of the period after a plan amendment, curtailment or settlement; and
— To recognise in profit or loss as part of past of service cost, or a gain or loss on settlement, any reduction in a surplus, even is that surplus was not previously recognised because of the impact of the asset ceiling.
Effective date for application of this amendment is annual period beginning on or after April 01, 2019. The Company does not expect any impact from this amendment.
Ind AS 109 – Prepayment Features with Negative Compensation The amendments relate to the existing requirements in Ind AS 109 regarding termination rights in order to allow measurement at amortised cost (or, depending on the business model, at fair value through other comprehensive income) even in the case of negative compensation payments. The Company does not expect any impact from this amendment.
Ind AS 23 – Borrowing Costs The amendments clarify that if any specific borrowing remains outstanding after the related asset is ready for its intended use or sale, that borrowing becomes part of the funds that an entity borrows generally when calculating the capitalisation rate on general borrowings. The Company does not expect any impact from this amendment.
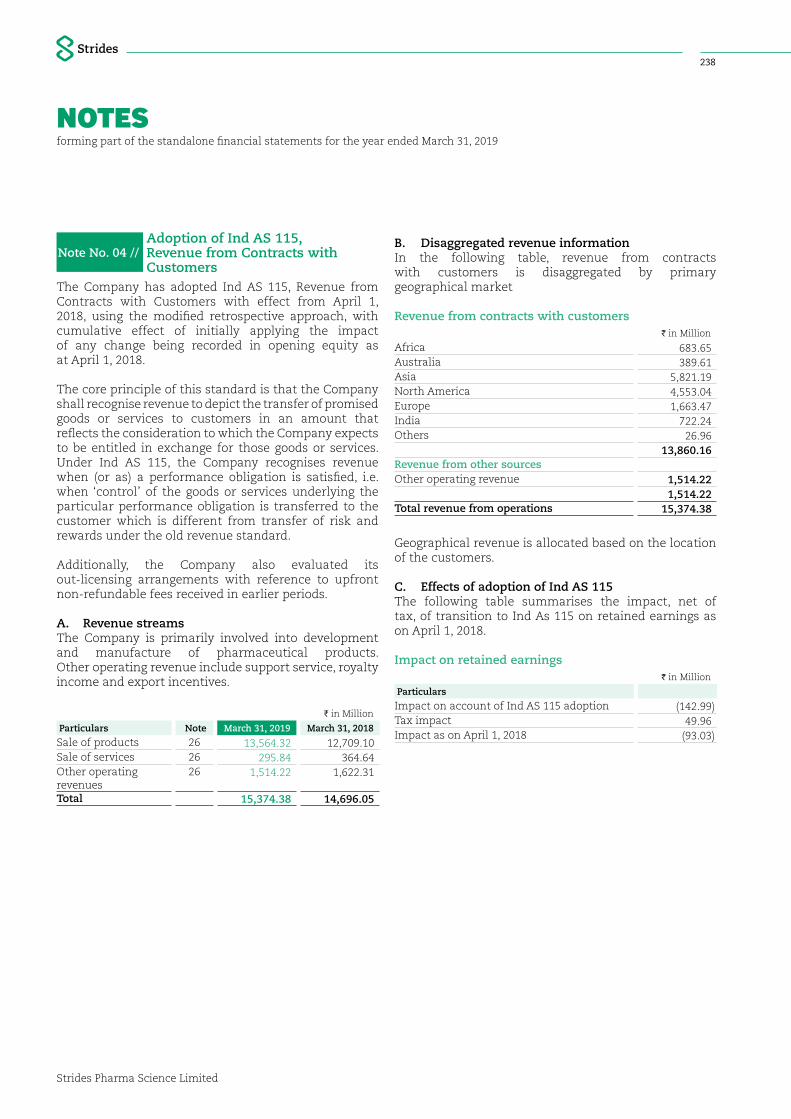
NOTESforming part of the standalone financial statements for the year ended March 31, 2019
Strides Pharma Science Limited
238
Note No. 04 // Adoption of Ind AS 115, Revenue from Contracts with Customers
The Company has adopted Ind AS 115, Revenue from Contracts with Customers with effect from April 1, 2018, using the modified retrospective approach, with cumulative effect of initially applying the impact of any change being recorded in opening equity as at April 1, 2018.
The core principle of this standard is that the Company shall recognise revenue to depict the transfer of promised goods or services to customers in an amount that reflects the consideration to which the Company expects to be entitled in exchange for those goods or services. Under Ind AS 115, the Company recognises revenue when (or as) a performance obligation is satisfied, i.e. when ‘control’ of the goods or services underlying the particular performance obligation is transferred to the customer which is different from transfer of risk and rewards under the old revenue standard.
Additionally, the Company also evaluated its out-licensing arrangements with reference to upfront non-refundable fees received in earlier periods.
A. Revenue streamsThe Company is primarily involved into development and manufacture of pharmaceutical products. Other operating revenue include support service, royalty income and export incentives.
I in Million
Particulars Note March 31, 2019 March 31, 2018
Sale of products 26 13,564.32 12,709.10Sale of services 26 295.84 364.64Other operating revenues
26 1,514.22 1,622.31
Total 15,374.38 14,696.05
B. Disaggregated revenue informationIn the following table, revenue from contracts with customers is disaggregated by primary geographical market
Revenue from contracts with customersI in Million
Africa 683.65Australia 389.61Asia 5,821.19North America 4,553.04Europe 1,663.47India 722.24Others 26.96
13,860.16Revenue from other sourcesOther operating revenue 1,514.22
1,514.22Total revenue from operations 15,374.38
Geographical revenue is allocated based on the location of the customers.
C. Effects of adoption of Ind AS 115 The following table summarises the impact, net of tax, of transition to Ind As 115 on retained earnings as on April 1, 2018.
Impact on retained earningsI in Million
Particulars
Impact on account of Ind AS 115 adoption (142.99)Tax impact 49.96Impact as on April 1, 2018 (93.03)
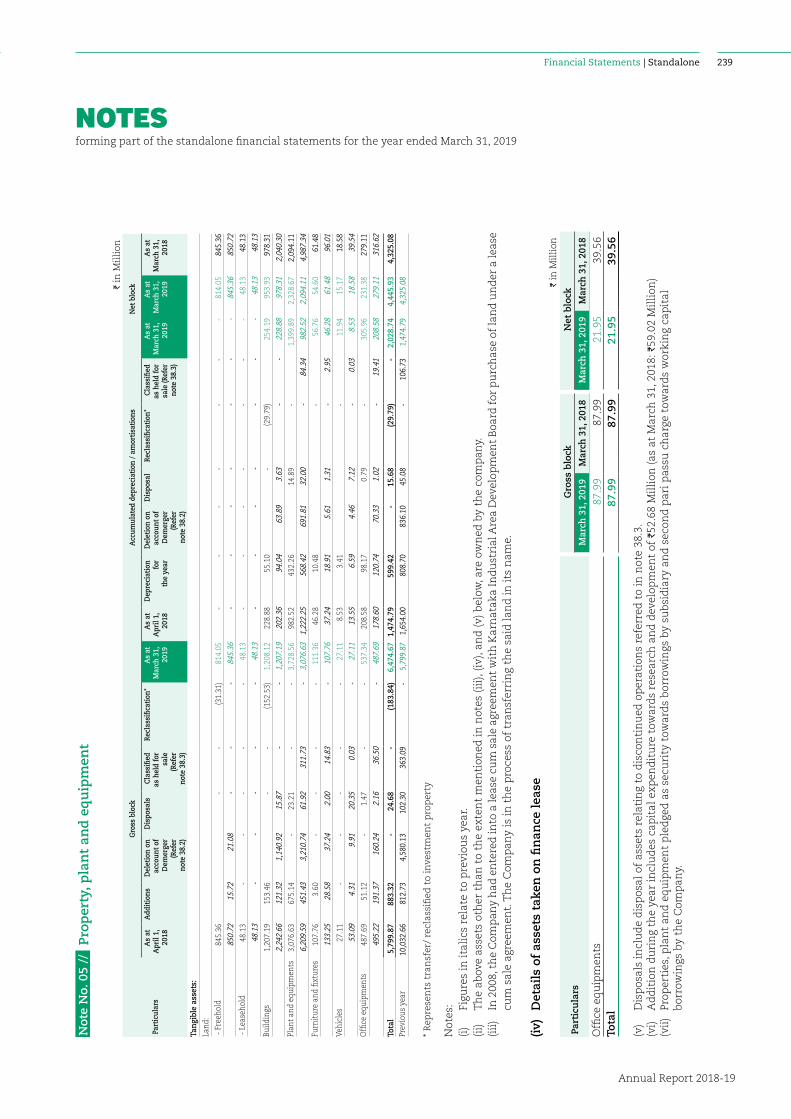
NOTESforming part of the standalone financial statements for the year ended March 31, 2019
Financial Statements | Standalone
Annual Report 2018-19
239
Not
e N
o. 0
5 //
Pro
per
ty, p
lan
t an
d e
qu
ipm
ent
I in
Mil
lion
Part
icul
ars
Gro
ss b
lock
Acc
umul
ated
dep
reci
atio
n / a
mor
tisa
tion
sN
et b
lock
As
atA
pril
1,
2018
Add
itio
nsD
elet
ion
on
acco
unt o
f D
emer
ger
(Ref
er
note
38.
2)
Dis
posa
lsC
lass
ified
as
hel
d fo
r sa
le
(Ref
er
note
38.
3)
Recl
assi
ficat
ion*
As
atM
arch
31,
20
19
As
atA
pril
1,
2018
Dep
reci
atio
n fo
r th
e ye
ar
Del
etio
n on
ac
coun
t of
Dem
erge
r (R
efer
no
te 3
8.2)
Dis
posa
lRe
clas
sific
atio
n*C
lass
ified
as
hel
d fo
r sa
le (R
efer
no
te 3
8.3)
As
atM
arch
31,
20
19
As
atM
arch
31,
20
19
As
atM
arch
31,
20
18
Tang
ible
ass
ets:
Land
:
- F
reeh
old
845
.36
-
-
(31.
31)
814
.05
-
-
-
-
-
-
-
814
.05
845
.36
850
.72
15.
72
21.
08
- -
- 8
45.3
6 -
- -
- -
- -
845
.36
850
.72
- L
ease
hold
48.
13
-
-
-
-
-
48.
13
-
-
-
-
-
-
-
48.
13
48.
13
48.
13
- -
- -
- 4
8.13
-
- -
- -
- -
48.
13
48.
13
Build
ings
1
,207
.19
153
.46
-
-
(152
.53)
1,2
08.1
2 2
28.8
8 5
5.10
-
(2
9.79
) 2
54.1
9 9
53.9
3 9
78.3
1
2,2
42.6
6 1
21.3
2 1
,140
.92
15.
87
- -
1,2
07.1
9 2
02.3
6 9
4.04
6
3.89
3
.63
- -
228
.88
978
.31
2,0
40.3
0 Pl
ant
and
equi
pmen
ts 3
,076
.63
675
.14
-
23.
21
-
-
3,7
28.5
6 9
82.5
2 4
32.2
6 1
4.89
-
1
,399
.89
2,3
28.6
7 2
,094
.11
6,2
09.5
9 4
51.4
3 3
,210
.74
61.
92
311
.73
- 3
,076
.63
1,2
22.2
5 5
68.4
2 6
91.8
1 3
2.00
-
84.
34
982
.52
2,0
94.1
1 4
,987
.34
Furn
itur
e an
d fix
ture
s 1
07.7
6 3
.60
-
-
-
-
111
.36
46.
28
10.
48
-
56.
76
54.
60
61.
48
133
.25
28.
58
37.
24
2.0
0 1
4.83
-
107
.76
37.
24
18.
91
5.6
1 1
.31
- 2
.95
46.
28
61.
48
96.
01
Vehi
cles
2
7.11
-
-
-
-
-
2
7.11
8
.53
3.4
1 -
1
1.94
1
5.17
1
8.58
53.
09
4.3
1 9
.91
20.
35
0.0
3 -
27.
11
13.
55
6.5
9 4
.46
7.1
2 -
0.0
3 8
.53
18.
58
39.
54
Offi
ce e
quip
men
ts 4
87.6
9 5
1.12
-
1
.47
-
-
537
.34
208
.58
98.
17
0.7
9 -
3
05.9
6 2
31.3
8 2
79.1
1
495
.22
191
.37
160
.24
2.1
6 3
6.50
-
487
.69
178
.60
120
.74
70.
33
1.0
2 -
19.
41
208
.58
279
.11
316
.62
Tota
l 5
,799
.87
883
.32
-
24.
68
-
(183
.84)
6,4
74.6
7 1
,474
.79
599
.42
-
15.
68
(29.
79)
-
2,0
28.7
4 4
,445
.93
4,3
25.0
8 Pr
evio
us y
ear
10,
032.
66
812
.73
4,5
80.1
3 1
02.3
0 3
63.0
9 -
5,7
99.8
7 1
,654
.00
808
.70
836
.10
45.
08
- 1
06.7
3 1
,474
.79
4,3
25.0
8
* R
epre
sen
ts t
ran
sfer
/ re
clas
sifi
ed t
o in
vest
men
t p
rop
erty
Not
es:
(i)
Figu
res
in it
alic
s re
late
to
pre
viou
s ye
ar.
(ii)
T
he
abov
e as
sets
oth
er t
han
to
the
exte
nt
men
tion
ed in
not
es (
iii)
, (iv
), an
d (
v) b
elow
, are
ow
ned
by
the
com
pan
y.
(iii
)
In 2
008,
th
e C
omp
any
had
en
tere
d in
to a
leas
e cu
m s
ale
agre
emen
t w
ith
Kar
nat
aka
Ind
ust
rial
Are
a D
evel
opm
ent
Boa
rd f
or p
urc
has
e of
lan
d u
nd
er a
leas
e cu
m s
ale
agre
emen
t. T
he
Com
pan
y is
in t
he
pro
cess
of
tran
sfer
rin
g th
e sa
id l
and
in it
s n
ame.
(iv)
Det
ails
of
asse
ts t
aken
on
fin
ance
lea
seI in
Mil
lion
Part
icu
lars
Gro
ss b
lock
Net
blo
ck
Mar
ch 3
1, 2
019
Mar
ch 3
1, 2
018
Mar
ch 3
1, 2
019
Mar
ch 3
1, 2
018
Offi
ce e
qu
ipm
ents
87.
99
87.
99
21.
95
39.
56
Tota
l 8
7.99
8
7.99
2
1.95
3
9.56
(v)
D
isp
osal
s in
clu
de
dis
pos
al o
f as
sets
rel
atin
g to
dis
con
tin
ued
op
erat
ion
s re
ferr
ed t
o in
not
e 38
.3.
(vi)
A
dd
itio
n d
uri
ng
the
year
incl
ud
es c
apit
al e
xpen
dit
ure
tow
ard
s re
sear
ch a
nd
dev
elop
men
t of
I52
.68
Mil
lion
(as
at
Mar
ch 3
1, 2
018:
I59
.02
Mil
lion
)(v
ii)
Pro
per
ties
, pla
nt
and
eq
uip
men
t p
led
ged
as
secu
rity
tow
ard
s b
orro
win
gs b
y su
bsi
dia
ry a
nd
sec
ond
par
i pas
su c
har
ge t
owar
ds
wor
kin
g ca
pit
al
bor
row
ings
by
the
Com
pan
y.
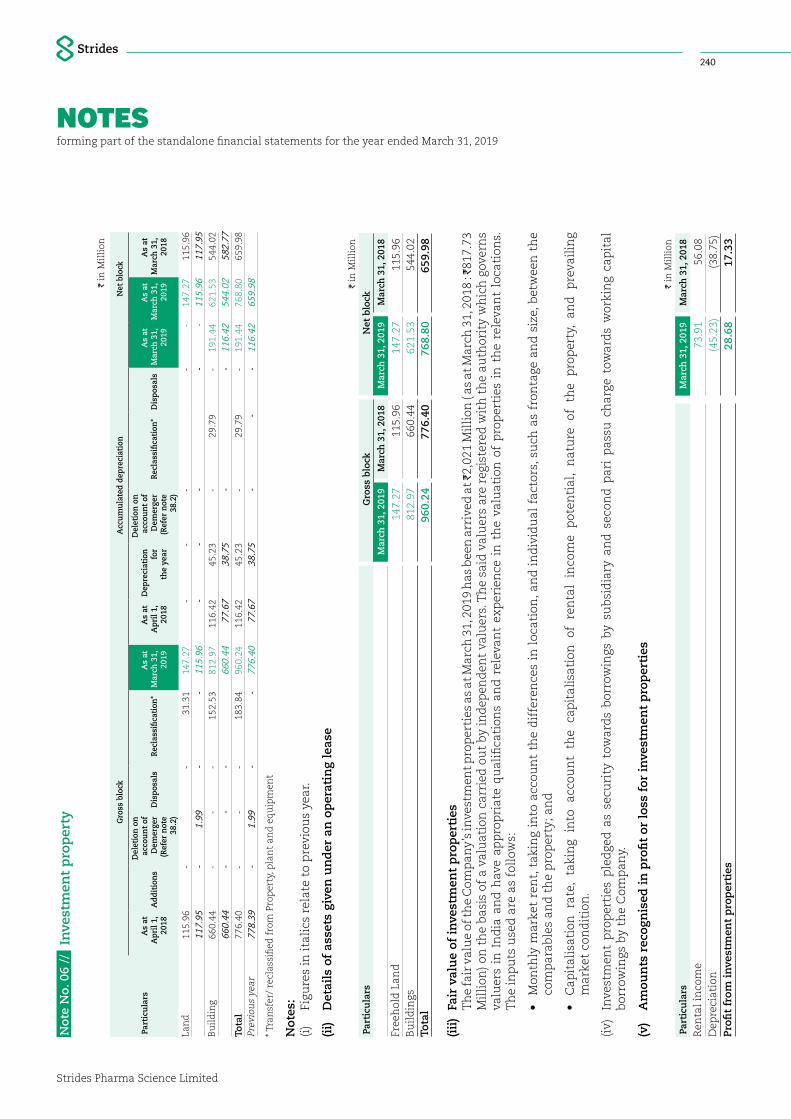
NOTESforming part of the standalone financial statements for the year ended March 31, 2019
Strides Pharma Science Limited
240N
ote
No.
06
// I
nve
stm
ent
pro
per
ty
I in
Mil
lion
Part
icu
lars
Gro
ss b
lock
Acc
um
ula
ted
depr
ecia
tion
N
et b
lock
As
atA
pril
1,
2018
Add
itio
ns
Del
etio
n o
n
acco
un
t of
D
emer
ger
(Ref
er n
ote
38.2
)
Dis
posa
lsR
ecla
ssifi
cati
on*
As
atM
arch
31,
20
19
As
atA
pril
1,
2018
Dep
reci
atio
n
for
th
e ye
ar
Del
etio
n o
n
acco
un
t of
D
emer
ger
(Ref
er n
ote
38.2
)
Rec
lass
ifica
tion
*D
ispo
sals
As
at
Mar
ch 3
1,
2019
As
at
Mar
ch 3
1,
2019
As
at
Mar
ch 3
1,
2018
Lan
d 1
15.9
6 -
-
3
1.31
1
47.2
7 -
-
-
-
-
1
47.2
7 1
15.9
6 1
17.9
5 -
1
.99
-
-
115
.96
-
-
-
-
-
115
.96
117
.95
Bu
ild
ing
660
.44
-
-
-
152
.53
812
.97
116
.42
45.
23
-
29.
79
-
191
.44
621
.53
544
.02
660
.44
-
-
-
660
.44
77.
67
38.
75
-
-
116
.42
544
.02
582
.77
Tota
l 7
76.4
0 -
-
-
1
83.8
4 9
60.2
4 1
16.4
2 4
5.23
-
2
9.79
-
1
91.4
4 7
68.8
0 6
59.9
8 Pr
evio
us
year
7
78.3
9 -
1
.99
-
-
776
.40
77.
67
38.
75
-
-
-
116
.42
659
.98
* Tra
nsf
er/
recl
assi
fied
fro
m P
rop
erty
, pla
nt
and
eq
uip
men
t
Not
es:
(i)
Figu
res
in it
alic
s re
late
to
pre
viou
s ye
ar.
(ii)
D
etai
ls o
f as
sets
giv
en u
nd
er a
n o
per
atin
g le
ase
I in
Mil
lion
Part
icu
lars
Gro
ss b
lock
Net
blo
ck
Mar
ch 3
1, 2
019
Mar
ch 3
1, 2
018
Mar
ch 3
1, 2
019
Mar
ch 3
1, 2
018
Free
hol
d L
and
147
.27
115
.96
147
.27
115
.96
Bu
ild
ings
812
.97
660
.44
621
.53
544
.02
Tota
l 9
60.2
4 7
76.4
0 7
68.8
0 6
59.9
8
(iii
) Fa
ir v
alu
e of
in
vest
men
t p
rop
erti
es
Th
e fa
ir v
alu
e of
the
Com
pan
y’s
inve
stm
ent p
rop
erti
es a
s at
Mar
ch 3
1, 2
019
has
bee
n a
rriv
ed a
t I2,
021
Mil
lion
( as
at M
arch
31,
201
8 : I
817.
73
Mil
lion
) on
th
e b
asis
of
a va
luat
ion
car
ried
ou
t by
ind
epen
den
t va
luer
s. T
he
said
val
uer
s ar
e re
gist
ered
wit
h t
he
auth
orit
y w
hic
h g
over
ns
valu
ers
in I
nd
ia a
nd
hav
e ap
pro
pri
ate
qu
alifi
cati
ons
and
rel
evan
t ex
per
ien
ce i
n t
he
valu
atio
n o
f p
rop
erti
es i
n t
he
rele
van
t lo
cati
ons.
T
he
inp
uts
use
d a
re a
s fo
llow
s:
•
Mon
thly
mar
ket
ren
t, t
akin
g in
to a
ccou
nt
the
dif
fere
nce
s in
loc
atio
n, a
nd
in
div
idu
al f
acto
rs, s
uch
as
fron
tage
an
d s
ize,
bet
wee
n t
he
com
par
able
s an
d t
he
pro
per
ty; a
nd
•
Cap
ital
isat
ion
ra
te,
taki
ng
into
ac
cou
nt
the
cap
ital
isat
ion
of
re
nta
l in
com
e p
oten
tial
, n
atu
re
of
the
pro
per
ty,
and
p
reva
ilin
g m
arke
t co
nd
itio
n.
(iv)
In
vest
men
t p
rop
erti
es p
led
ged
as
secu
rity
tow
ard
s b
orro
win
gs b
y su
bsi
dia
ry a
nd
sec
ond
par
i p
assu
ch
arge
tow
ard
s w
orki
ng
cap
ital
b
orro
win
gs b
y th
e C
omp
any.
(v)
Am
oun
ts r
ecog
nis
ed i
n p
rofi
t or
los
s fo
r in
vest
men
t p
rop
erti
es
I in
Mil
lion
Part
icu
lars
Mar
ch 3
1, 2
019
Mar
ch 3
1, 2
018
Ren
tal
inco
me
73.
91
56.
08
Dep
reci
atio
n (
45.2
3) (
38.7
5)Pr
ofit
from
in
vest
men
t p
rop
erti
es 2
8.68
1
7.33
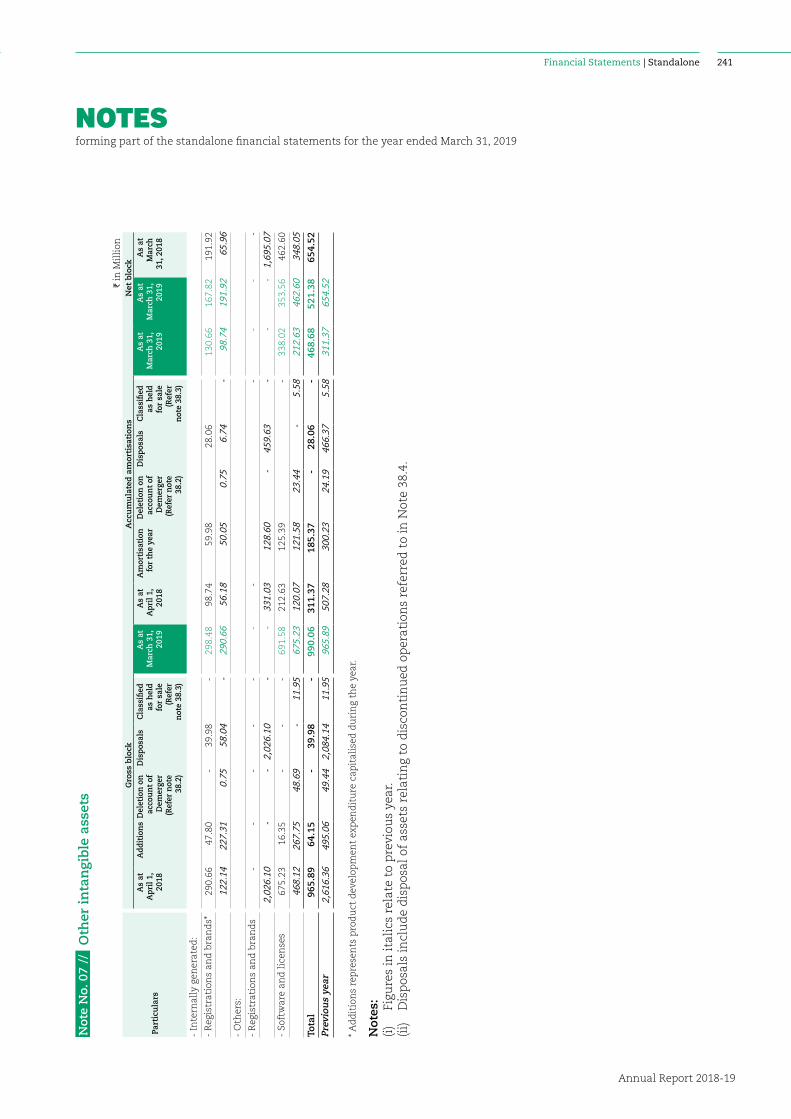
NOTESforming part of the standalone financial statements for the year ended March 31, 2019
Financial Statements | Standalone
Annual Report 2018-19
241
Not
e N
o. 0
7 //
Oth
er i
nta
ngi
ble
ass
ets
I in
Mil
lion
Part
icu
lars
Gro
ss b
lock
Acc
um
ula
ted
am
orti
sati
ons
Net
blo
ckA
s at
Apr
il 1,
20
18
Add
itio
ns
Del
etio
n o
n
acco
un
t of
D
emer
ger
(Ref
er n
ote
38.2
)
Dis
posa
lsC
lass
ified
as
hel
d fo
r sa
le
(Ref
er
not
e 38
.3)
As
atM
arch
31,
20
19
As
atA
pril
1,
2018
Am
orti
sati
on
for
the
year
Del
etio
n o
n
acco
un
t of
D
emer
ger
(Ref
er n
ote
38.2
)
Dis
posa
lsC
lass
ified
as
hel
d fo
r sa
le
(Ref
er
not
e 38
.3)
As
atM
arch
31,
20
19
As
atM
arch
31,
20
19
As
atM
arch
31
, 201
8
- In
tern
ally
gen
erat
ed:
- R
egis
trat
ion
s an
d b
ran
ds*
290
.66
47.
80
-
39.
98
-
298
.48
98.
74
59.
98
28.
06
130
.66
167
.82
191
.92
122
.14
227
.31
0.7
5 5
8.04
-
2
90.6
6 5
6.18
5
0.05
0
.75
6.7
4 -
9
8.74
1
91.9
2 6
5.96
-
Oth
ers:
- R
egis
trat
ion
s an
d b
ran
ds
-
-
-
-
-
-
-
-
-
-
-
2,0
26.1
0 -
-
2
,026
.10
-
-
331
.03
128
.60
-
459
.63
-
-
-
1,6
95.0
7 -
Soft
war
e an
d l
icen
ses
675
.23
16.
35
-
-
-
691
.58
212
.63
125
.39
-
338
.02
353
.56
462
.60
468
.12
267
.75
48.
69
-
11.
95
675
.23
120
.07
121
.58
23.
44
-
5.5
8 2
12.6
3 4
62.6
0 3
48.0
5
Tota
l 9
65.8
9 6
4.15
-
3
9.98
-
9
90.0
6 3
11.3
7 1
85.3
7 -
2
8.06
-
4
68.6
8 5
21.3
8 6
54.5
2 Pr
evio
us
year
2
,616
.36
495
.06
49.
44
2,0
84.1
4 1
1.95
9
65.8
9 5
07.2
8 3
00.2
3 2
4.19
4
66.3
7 5
.58
311
.37
654
.52
* Ad
dit
ion
s re
pre
sen
ts p
rod
uct
dev
elop
men
t ex
pen
dit
ure
cap
ital
ised
du
rin
g th
e ye
ar.
Not
es:
(i)
Figu
res
in it
alic
s re
late
to
pre
viou
s ye
ar.
(ii)
D
isp
osal
s in
clu
de
dis
pos
al o
f as
sets
rel
atin
g to
dis
con
tin
ued
op
erat
ion
s re
ferr
ed t
o in
Not
e 38
.4.
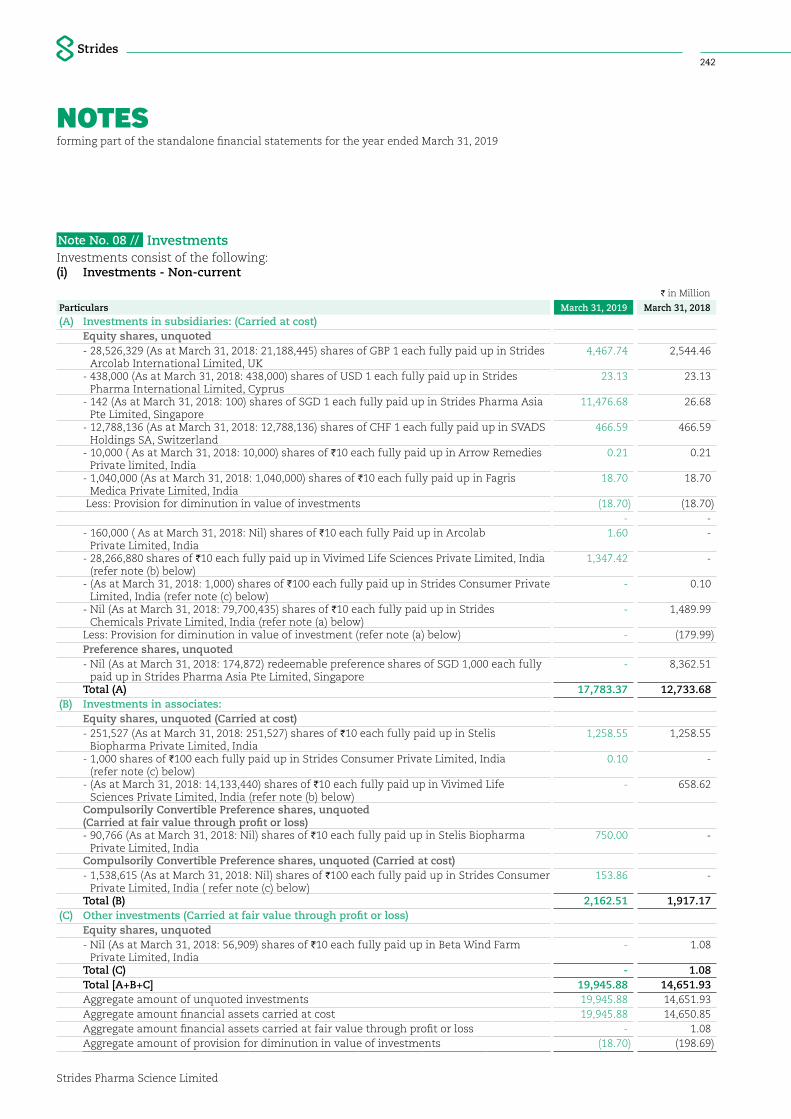
NOTESforming part of the standalone financial statements for the year ended March 31, 2019
Strides Pharma Science Limited
242
Note No. 08 // InvestmentsInvestments consist of the following: (i) Investments - Non-current
I in Million
Particulars March 31, 2019 March 31, 2018
(A) Investments in subsidiaries: (Carried at cost)Equity shares, unquoted- 28,526,329 (As at March 31, 2018: 21,188,445) shares of GBP 1 each fully paid up in Strides
Arcolab International Limited, UK 4,467.74 2,544.46
- 438,000 (As at March 31, 2018: 438,000) shares of USD 1 each fully paid up in Strides Pharma International Limited, Cyprus
23.13 23.13
- 142 (As at March 31, 2018: 100) shares of SGD 1 each fully paid up in Strides Pharma Asia Pte Limited, Singapore
11,476.68 26.68
- 12,788,136 (As at March 31, 2018: 12,788,136) shares of CHF 1 each fully paid up in SVADS Holdings SA, Switzerland
466.59 466.59
- 10,000 ( As at March 31, 2018: 10,000) shares of I10 each fully paid up in Arrow Remedies Private limited, India
0.21 0.21
- 1,040,000 (As at March 31, 2018: 1,040,000) shares of I10 each fully paid up in Fagris Medica Private Limited, India
18.70 18.70
Less: Provision for diminution in value of investments (18.70) (18.70) - -
- 160,000 ( As at March 31, 2018: Nil) shares of I10 each fully Paid up in Arcolab Private Limited, India
1.60 -
- 28,266,880 shares of I10 each fully paid up in Vivimed Life Sciences Private Limited, India (refer note (b) below)
1,347.42 -
- (As at March 31, 2018: 1,000) shares of I100 each fully paid up in Strides Consumer Private Limited, India (refer note (c) below)
- 0.10
- Nil (As at March 31, 2018: 79,700,435) shares of I10 each fully paid up in Strides Chemicals Private Limited, India (refer note (a) below)
- 1,489.99
Less: Provision for diminution in value of investment (refer note (a) below) - (179.99)Preference shares, unquoted- Nil (As at March 31, 2018: 174,872) redeemable preference shares of SGD 1,000 each fully
paid up in Strides Pharma Asia Pte Limited, Singapore - 8,362.51
Total (A) 17,783.37 12,733.68 (B) Investments in associates:
Equity shares, unquoted (Carried at cost)- 251,527 (As at March 31, 2018: 251,527) shares of I10 each fully paid up in Stelis
Biopharma Private Limited, India 1,258.55 1,258.55
- 1,000 shares of I100 each fully paid up in Strides Consumer Private Limited, India (refer note (c) below)
0.10 -
- (As at March 31, 2018: 14,133,440) shares of I10 each fully paid up in Vivimed Life Sciences Private Limited, India (refer note (b) below)
- 658.62
Compulsorily Convertible Preference shares, unquoted (Carried at fair value through profit or loss)- 90,766 (As at March 31, 2018: Nil) shares of I10 each fully paid up in Stelis Biopharma
Private Limited, India 750.00 -
Compulsorily Convertible Preference shares, unquoted (Carried at cost)- 1,538,615 (As at March 31, 2018: Nil) shares of I100 each fully paid up in Strides Consumer
Private Limited, India ( refer note (c) below) 153.86 -
Total (B) 2,162.51 1,917.17 (C) Other investments (Carried at fair value through profit or loss)
Equity shares, unquoted- Nil (As at March 31, 2018: 56,909) shares of I10 each fully paid up in Beta Wind Farm
Private Limited, India - 1.08
Total (C) - 1.08 Total [A+B+C] 19,945.88 14,651.93 Aggregate amount of unquoted investments 19,945.88 14,651.93 Aggregate amount financial assets carried at cost 19,945.88 14,650.85 Aggregate amount financial assets carried at fair value through profit or loss - 1.08 Aggregate amount of provision for diminution in value of investments (18.70) (198.69)
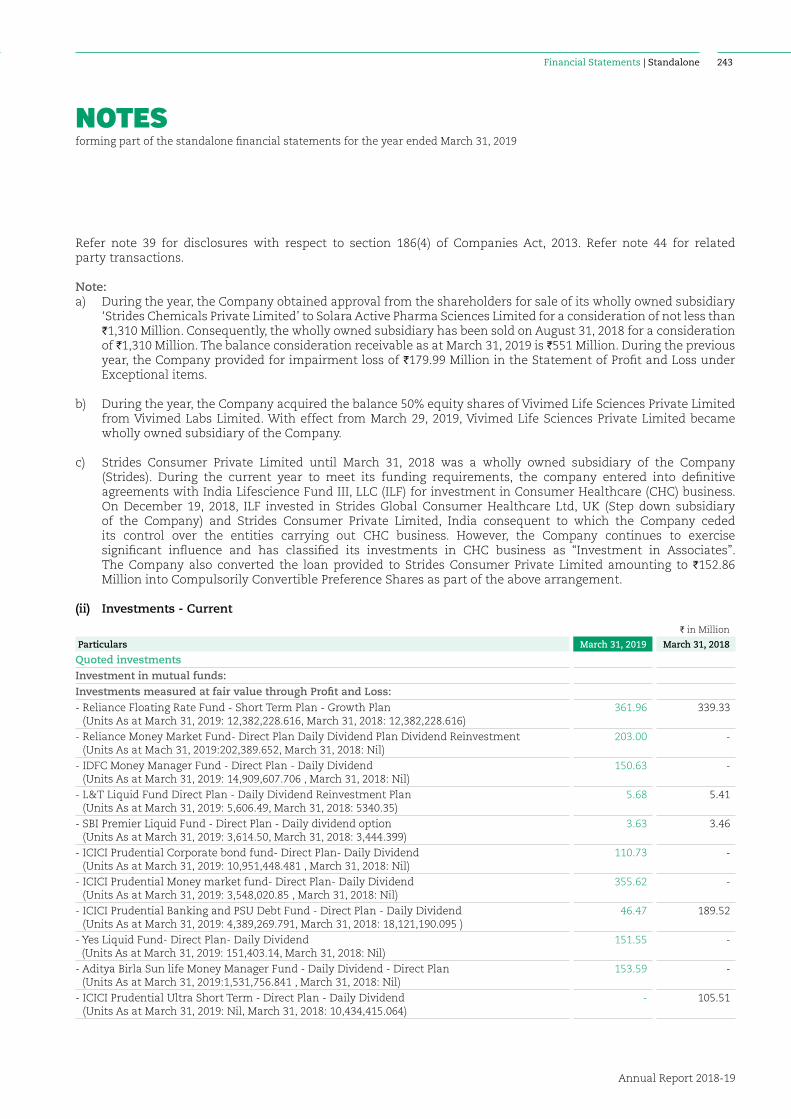
NOTESforming part of the standalone financial statements for the year ended March 31, 2019
Financial Statements | Standalone
Annual Report 2018-19
243
Refer note 39 for disclosures with respect to section 186(4) of Companies Act, 2013. Refer note 44 for related party transactions.
Note:a) During the year, the Company obtained approval from the shareholders for sale of its wholly owned subsidiary
‘Strides Chemicals Private Limited’ to Solara Active Pharma Sciences Limited for a consideration of not less than I1,310 Million. Consequently, the wholly owned subsidiary has been sold on August 31, 2018 for a consideration of I1,310 Million. The balance consideration receivable as at March 31, 2019 is I551 Million. During the previous year, the Company provided for impairment loss of I179.99 Million in the Statement of Profit and Loss under Exceptional items.
b) During the year, the Company acquired the balance 50% equity shares of Vivimed Life Sciences Private Limited from Vivimed Labs Limited. With effect from March 29, 2019, Vivimed Life Sciences Private Limited became wholly owned subsidiary of the Company.
c) Strides Consumer Private Limited until March 31, 2018 was a wholly owned subsidiary of the Company (Strides). During the current year to meet its funding requirements, the company entered into definitive agreements with India Lifescience Fund III, LLC (ILF) for investment in Consumer Healthcare (CHC) business. On December 19, 2018, ILF invested in Strides Global Consumer Healthcare Ltd, UK (Step down subsidiary of the Company) and Strides Consumer Private Limited, India consequent to which the Company ceded its control over the entities carrying out CHC business. However, the Company continues to exercise significant influence and has classified its investments in CHC business as “Investment in Associates”. The Company also converted the loan provided to Strides Consumer Private Limited amounting to I152.86 Million into Compulsorily Convertible Preference Shares as part of the above arrangement.
(ii) Investments - Current
I in Million
Particulars March 31, 2019 March 31, 2018
Quoted investmentsInvestment in mutual funds:Investments measured at fair value through Profit and Loss:- Reliance Floating Rate Fund - Short Term Plan - Growth Plan
(Units As at March 31, 2019: 12,382,228.616, March 31, 2018: 12,382,228.616) 361.96 339.33
- Reliance Money Market Fund- Direct Plan Daily Dividend Plan Dividend Reinvestment (Units As at Mach 31, 2019:202,389.652, March 31, 2018: Nil)
203.00 -
- IDFC Money Manager Fund - Direct Plan - Daily Dividend (Units As at March 31, 2019: 14,909,607.706 , March 31, 2018: Nil)
150.63 -
- L&T Liquid Fund Direct Plan - Daily Dividend Reinvestment Plan (Units As at March 31, 2019: 5,606.49, March 31, 2018: 5340.35)
5.68 5.41
- SBI Premier Liquid Fund - Direct Plan - Daily dividend option (Units As at March 31, 2019: 3,614.50, March 31, 2018: 3,444.399)
3.63 3.46
- ICICI Prudential Corporate bond fund- Direct Plan- Daily Dividend (Units As at March 31, 2019: 10,951,448.481 , March 31, 2018: Nil)
110.73 -
- ICICI Prudential Money market fund- Direct Plan- Daily Dividend (Units As at March 31, 2019: 3,548,020.85 , March 31, 2018: Nil)
355.62 -
- ICICI Prudential Banking and PSU Debt Fund - Direct Plan - Daily Dividend (Units As at March 31, 2019: 4,389,269.791, March 31, 2018: 18,121,190.095 )
46.47 189.52
- Yes Liquid Fund- Direct Plan- Daily Dividend (Units As at March 31, 2019: 151,403.14, March 31, 2018: Nil)
151.55 -
- Aditya Birla Sun life Money Manager Fund - Daily Dividend - Direct Plan (Units As at March 31, 2019:1,531,756.841 , March 31, 2018: Nil)
153.59 -
- ICICI Prudential Ultra Short Term - Direct Plan - Daily Dividend (Units As at March 31, 2019: Nil, March 31, 2018: 10,434,415.064)
- 105.51

NOTESforming part of the standalone financial statements for the year ended March 31, 2019
Strides Pharma Science Limited
244
I in Million
Particulars March 31, 2019 March 31, 2018
- ICICI Prudential Liquid - Direct Plan - Daily Dividend (Units As at March 31, 2019: Nil, March 31, 2018: 40,529.205 )
- 4.06
- Birla Sun Life Fixed Term Plan-Series KW-Growth. Direct - Reinvestment (Units As at March 31, 2019: Nil , March 31, 2018: 12,278.49)
- 1.23
- Reliance Floating Rate Fund - Short Term Plan - Direct Monthly Dividend Plan (Units As at March 31, 2019: Nil , March 31, 2018: 93,906,412.869)
- 1,031.21
- Reliance Banking & PSU Debt Fund - Direct Monthly Dividend Plan (Units As at March 31, 2019: Nil, March 31, 2018: 47,453,064.062 )
- 492.97
- Reliance Floating Rate Fund - Short Term Plan - Direct Daily - Dividend Reinvestment (Units As at March 31, 2019: Nil, March 31, 2018: 91,737,897.163)
- 928.96
- Reliance Liquid Fund - Treasury Plan - Daily dividend option (Units As at March 31, 2019: Nil, March 31, 2018: 8,581.157)
- 13.13
Total 1,542.86 3,114.79 The market value of quoted investments is equal to the carrying value and are highly liquid investments
Note No. 09 // Loans receivableLoans consist of the following:
(i) Long-term loans receivableI in Million
Particulars March 31, 2019 March 31, 2018
Unsecured, Considered good:Security deposits * 138.20 148.53 Loans to: - Related parties (Refer note 44) 777.92 226.41 Total 916.12 374.94
* Includes security deposit given to related parties (Refer note 44)
(ii) Short-term loans receivableI in Million
Particulars March 31, 2019 March 31, 2018
Unsecured, Considered good:Loans to:- Employees 26.00 12.34 - Related parties (Refer note 44) 250.00 - - Other parties - 250.00 Total 276.00 262.34
Note No. 10 // Other financial assetsOther financial assets consist of the following:
(i) Non-current financial assetsI in Million
Particulars March 31, 2019 March 31, 2018
Application money paid towards securities to subsidiaries*- Strides Pharma Asia Pte Limited, Singapore - 2,065.89 - Strides Arcolab International Limited, UK - 1,923.43 Total - 3,989.32
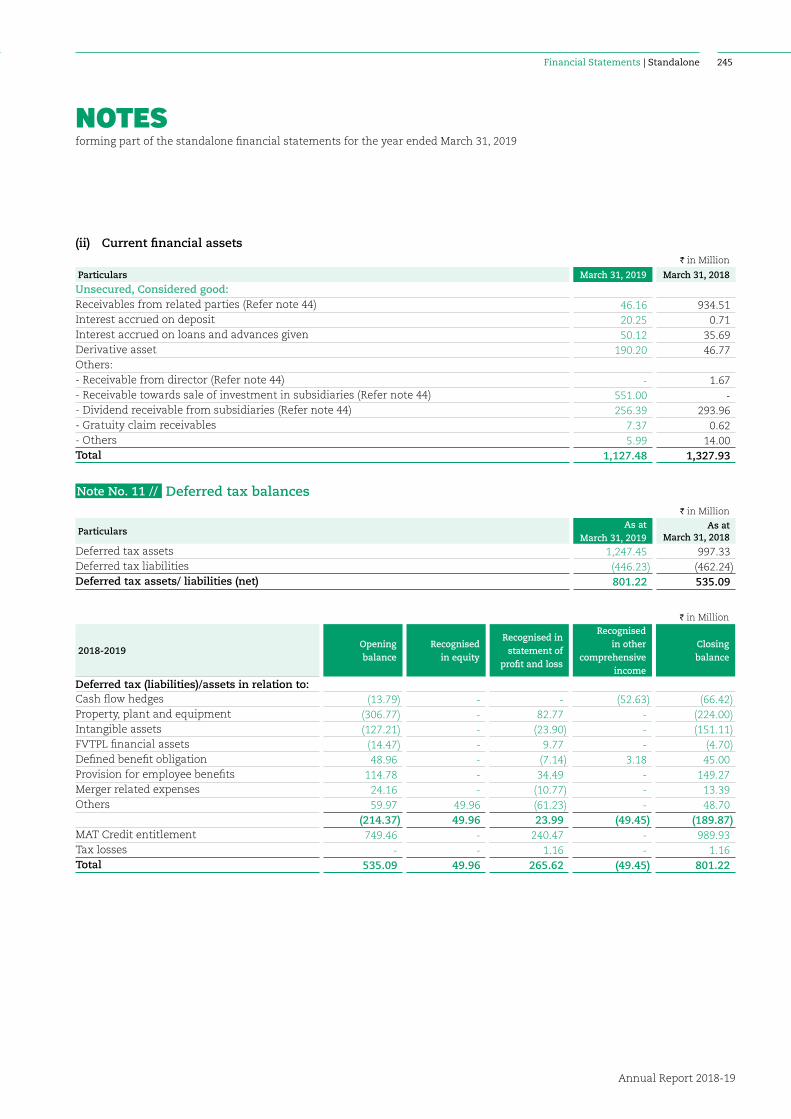
NOTESforming part of the standalone financial statements for the year ended March 31, 2019
Financial Statements | Standalone
Annual Report 2018-19
245
(ii) Current financial assetsI in Million
Particulars March 31, 2019 March 31, 2018
Unsecured, Considered good:Receivables from related parties (Refer note 44) 46.16 934.51 Interest accrued on deposit 20.25 0.71 Interest accrued on loans and advances given 50.12 35.69 Derivative asset 190.20 46.77 Others: - Receivable from director (Refer note 44) - 1.67- Receivable towards sale of investment in subsidiaries (Refer note 44) 551.00 - - Dividend receivable from subsidiaries (Refer note 44) 256.39 293.96 - Gratuity claim receivables 7.37 0.62 - Others 5.99 14.00Total 1,127.48 1,327.93
Note No. 11 // Deferred tax balancesI in Million
Particulars As at
March 31, 2019 As at
March 31, 2018
Deferred tax assets 1,247.45 997.33 Deferred tax liabilities (446.23) (462.24)Deferred tax assets/ liabilities (net) 801.22 535.09
I in Million
2018-2019Opening balance
Recognised in equity
Recognised in statement of
profit and loss
Recognised in other
comprehensive income
Closing balance
Deferred tax (liabilities)/assets in relation to:Cash flow hedges (13.79) - - (52.63) (66.42)Property, plant and equipment (306.77) - 82.77 - (224.00)Intangible assets (127.21) - (23.90) - (151.11)FVTPL financial assets (14.47) - 9.77 - (4.70)Defined benefit obligation 48.96 - (7.14) 3.18 45.00 Provision for employee benefits 114.78 - 34.49 - 149.27 Merger related expenses 24.16 - (10.77) - 13.39 Others 59.97 49.96 (61.23) - 48.70
(214.37) 49.96 23.99 (49.45) (189.87)MAT Credit entitlement 749.46 - 240.47 - 989.93 Tax losses - - 1.16 - 1.16 Total 535.09 49.96 265.62 (49.45) 801.22
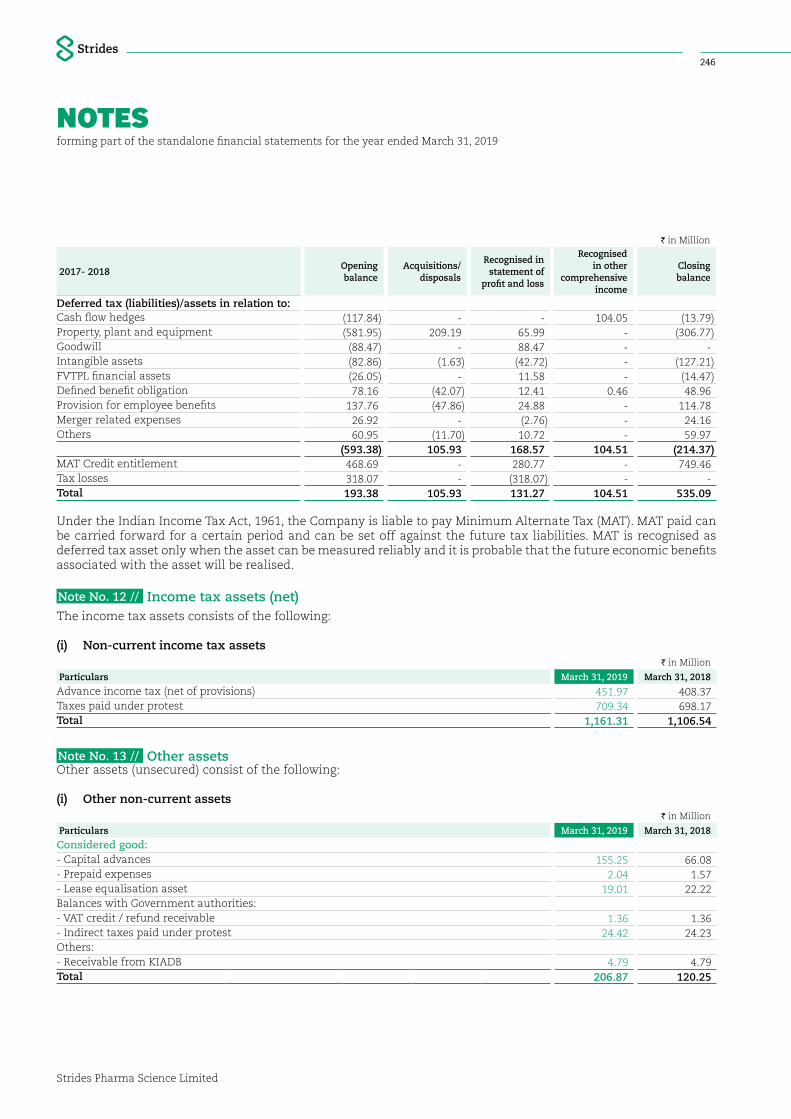
NOTESforming part of the standalone financial statements for the year ended March 31, 2019
Strides Pharma Science Limited
246
I in Million
2017- 2018Opening balance
Acquisitions/ disposals
Recognised in statement of
profit and loss
Recognised in other
comprehensive income
Closing balance
Deferred tax (liabilities)/assets in relation to:Cash flow hedges (117.84) - - 104.05 (13.79)Property, plant and equipment (581.95) 209.19 65.99 - (306.77)Goodwill (88.47) - 88.47 - - Intangible assets (82.86) (1.63) (42.72) - (127.21)FVTPL financial assets (26.05) - 11.58 - (14.47)Defined benefit obligation 78.16 (42.07) 12.41 0.46 48.96 Provision for employee benefits 137.76 (47.86) 24.88 - 114.78 Merger related expenses 26.92 - (2.76) - 24.16 Others 60.95 (11.70) 10.72 - 59.97
(593.38) 105.93 168.57 104.51 (214.37)MAT Credit entitlement 468.69 - 280.77 - 749.46 Tax losses 318.07 - (318.07) - - Total 193.38 105.93 131.27 104.51 535.09
Under the Indian Income Tax Act, 1961, the Company is liable to pay Minimum Alternate Tax (MAT). MAT paid can be carried forward for a certain period and can be set off against the future tax liabilities. MAT is recognised as deferred tax asset only when the asset can be measured reliably and it is probable that the future economic benefits associated with the asset will be realised.
Note No. 12 // Income tax assets (net)The income tax assets consists of the following:
(i) Non-current income tax assetsI in Million
Particulars March 31, 2019 March 31, 2018
Advance income tax (net of provisions) 451.97 408.37 Taxes paid under protest 709.34 698.17 Total 1,161.31 1,106.54
Note No. 13 // Other assetsOther assets (unsecured) consist of the following:
(i) Other non-current assetsI in Million
Particulars March 31, 2019 March 31, 2018
Considered good:- Capital advances 155.25 66.08 - Prepaid expenses 2.04 1.57 - Lease equalisation asset 19.01 22.22 Balances with Government authorities:- VAT credit / refund receivable 1.36 1.36 - Indirect taxes paid under protest 24.42 24.23 Others:- Receivable from KIADB 4.79 4.79 Total 206.87 120.25
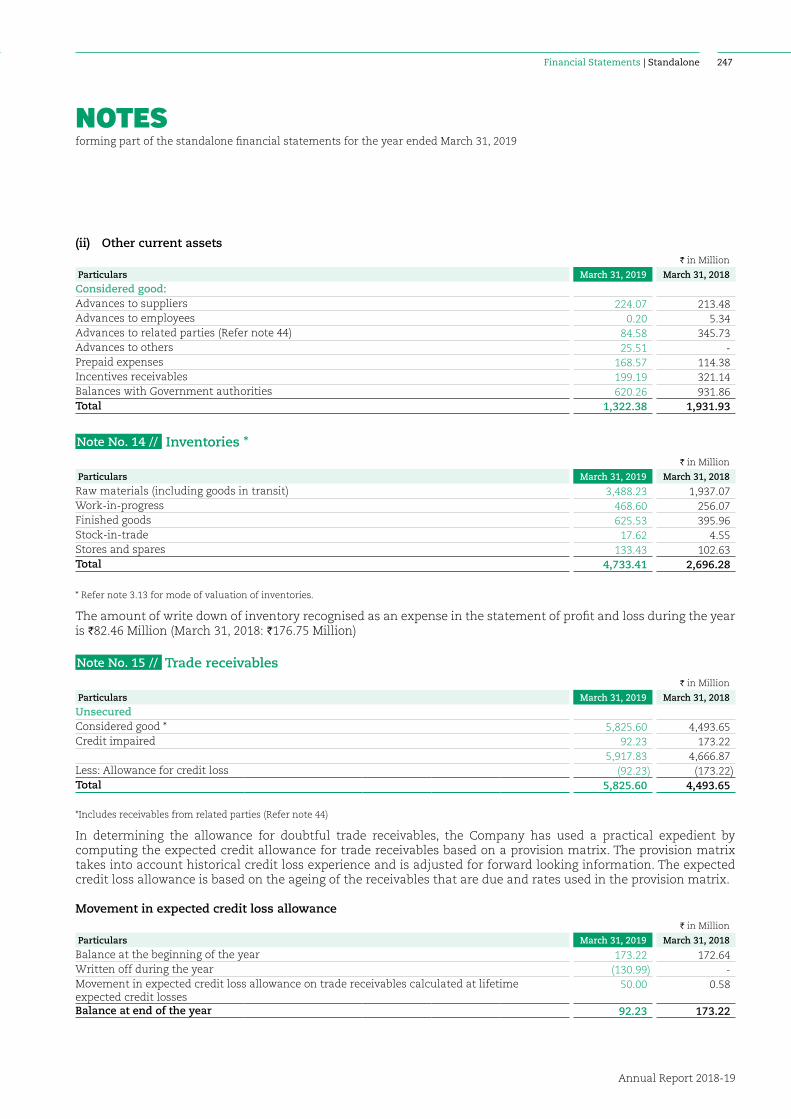
NOTESforming part of the standalone financial statements for the year ended March 31, 2019
Financial Statements | Standalone
Annual Report 2018-19
247
(ii) Other current assetsI in Million
Particulars March 31, 2019 March 31, 2018
Considered good:Advances to suppliers 224.07 213.48 Advances to employees 0.20 5.34 Advances to related parties (Refer note 44) 84.58 345.73 Advances to others 25.51 - Prepaid expenses 168.57 114.38 Incentives receivables 199.19 321.14 Balances with Government authorities 620.26 931.86 Total 1,322.38 1,931.93
Note No. 14 // Inventories *I in Million
Particulars March 31, 2019 March 31, 2018
Raw materials (including goods in transit) 3,488.23 1,937.07 Work-in-progress 468.60 256.07 Finished goods 625.53 395.96 Stock-in-trade 17.62 4.55 Stores and spares 133.43 102.63 Total 4,733.41 2,696.28
* Refer note 3.13 for mode of valuation of inventories.
The amount of write down of inventory recognised as an expense in the statement of profit and loss during the year is I82.46 Million (March 31, 2018: I176.75 Million)
Note No. 15 // Trade receivablesI in Million
Particulars March 31, 2019 March 31, 2018
Unsecured Considered good * 5,825.60 4,493.65 Credit impaired 92.23 173.22
5,917.83 4,666.87 Less: Allowance for credit loss (92.23) (173.22)Total 5,825.60 4,493.65
*Includes receivables from related parties (Refer note 44)
In determining the allowance for doubtful trade receivables, the Company has used a practical expedient by computing the expected credit allowance for trade receivables based on a provision matrix. The provision matrix takes into account historical credit loss experience and is adjusted for forward looking information. The expected credit loss allowance is based on the ageing of the receivables that are due and rates used in the provision matrix.
Movement in expected credit loss allowanceI in Million
Particulars March 31, 2019 March 31, 2018
Balance at the beginning of the year 173.22 172.64 Written off during the year (130.99) - Movement in expected credit loss allowance on trade receivables calculated at lifetime expected credit losses
50.00 0.58
Balance at end of the year 92.23 173.22
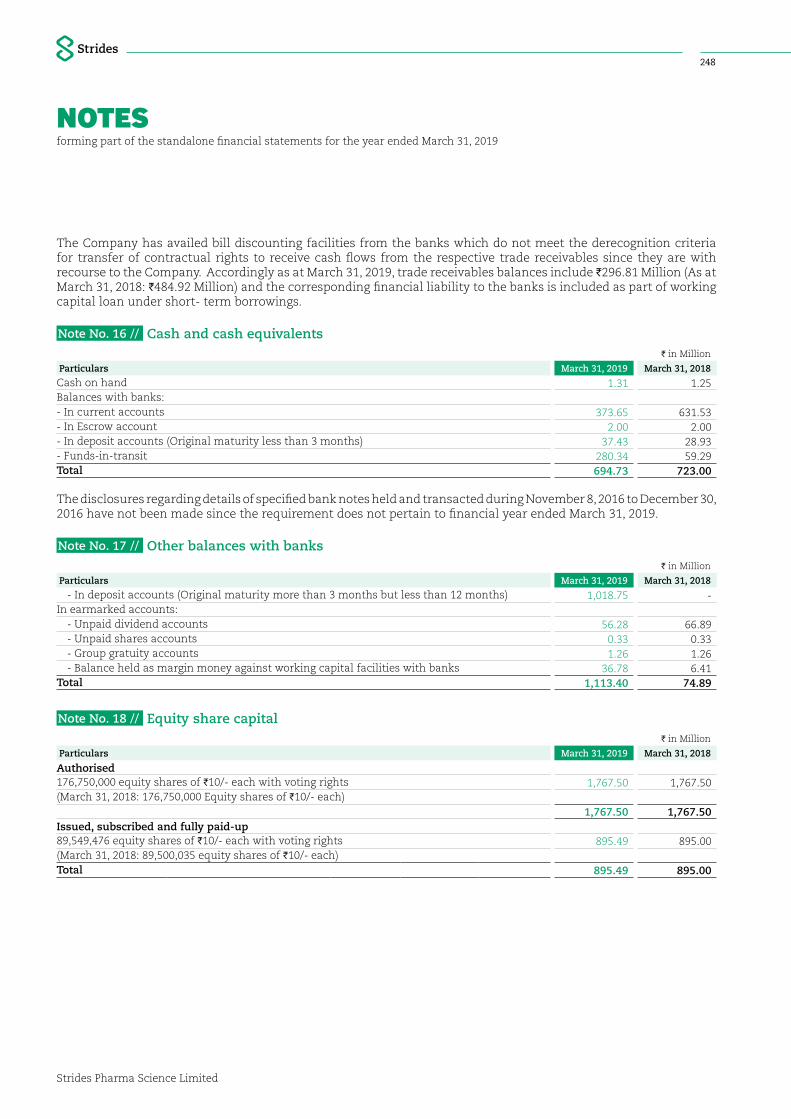
NOTESforming part of the standalone financial statements for the year ended March 31, 2019
Strides Pharma Science Limited
248
The Company has availed bill discounting facilities from the banks which do not meet the derecognition criteria for transfer of contractual rights to receive cash flows from the respective trade receivables since they are with recourse to the Company. Accordingly as at March 31, 2019, trade receivables balances include I296.81 Million (As at March 31, 2018: I484.92 Million) and the corresponding financial liability to the banks is included as part of working capital loan under short- term borrowings.
Note No. 16 // Cash and cash equivalentsI in Million
Particulars March 31, 2019 March 31, 2018
Cash on hand 1.31 1.25 Balances with banks:- In current accounts 373.65 631.53 - In Escrow account 2.00 2.00 - In deposit accounts (Original maturity less than 3 months) 37.43 28.93 - Funds-in-transit 280.34 59.29 Total 694.73 723.00
The disclosures regarding details of specified bank notes held and transacted during November 8, 2016 to December 30, 2016 have not been made since the requirement does not pertain to financial year ended March 31, 2019.
Note No. 17 // Other balances with banksI in Million
Particulars March 31, 2019 March 31, 2018
- In deposit accounts (Original maturity more than 3 months but less than 12 months) 1,018.75 - In earmarked accounts: - Unpaid dividend accounts 56.28 66.89 - Unpaid shares accounts 0.33 0.33 - Group gratuity accounts 1.26 1.26 - Balance held as margin money against working capital facilities with banks 36.78 6.41 Total 1,113.40 74.89
Note No. 18 // Equity share capitalI in Million
Particulars March 31, 2019 March 31, 2018
Authorised176,750,000 equity shares of I10/- each with voting rights 1,767.50 1,767.50 (March 31, 2018: 176,750,000 Equity shares of I10/- each)
1,767.50 1,767.50 Issued, subscribed and fully paid-up89,549,476 equity shares of I10/- each with voting rights 895.49 895.00 (March 31, 2018: 89,500,035 equity shares of I10/- each)Total 895.49 895.00
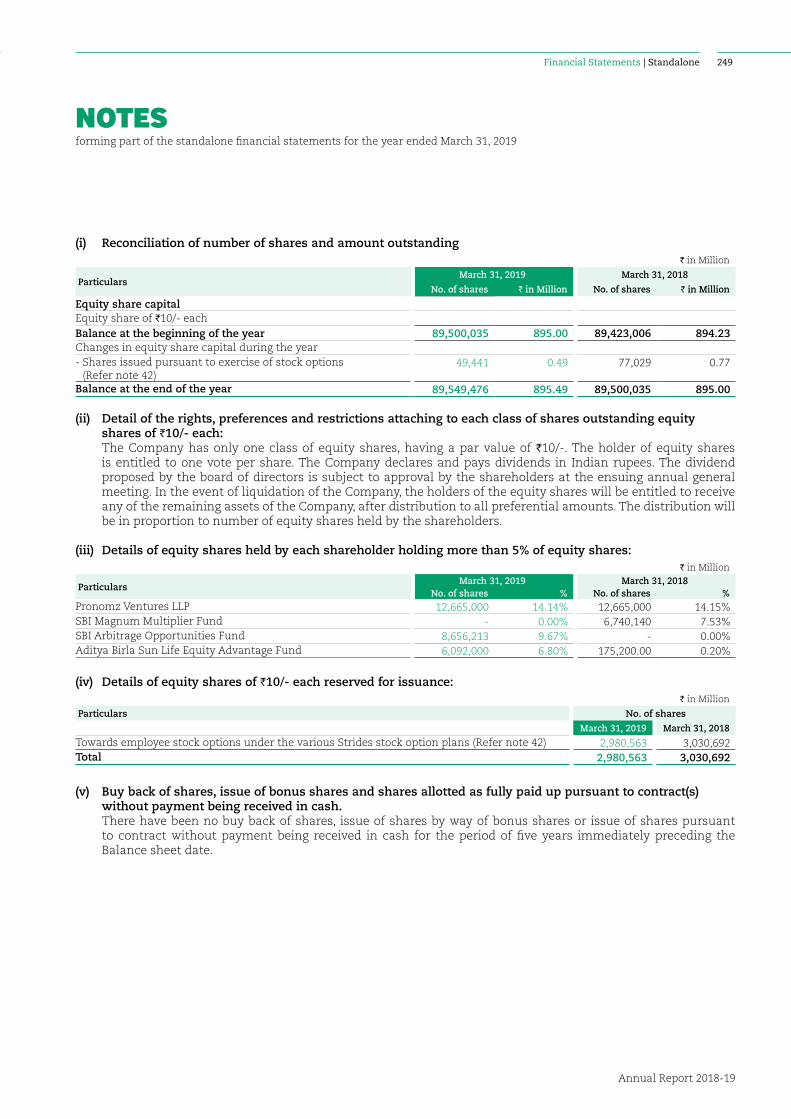
NOTESforming part of the standalone financial statements for the year ended March 31, 2019
Financial Statements | Standalone
Annual Report 2018-19
249
(i) Reconciliation of number of shares and amount outstandingI in Million
ParticularsMarch 31, 2019 March 31, 2018
No. of shares I in Million No. of shares I in Million
Equity share capitalEquity share of I10/- eachBalance at the beginning of the year 89,500,035 895.00 89,423,006 894.23 Changes in equity share capital during the year- Shares issued pursuant to exercise of stock options
(Refer note 42) 49,441 0.49 77,029 0.77
Balance at the end of the year 89,549,476 895.49 89,500,035 895.00
(ii) Detail of the rights, preferences and restrictions attaching to each class of shares outstanding equity shares of I10/- each:
The Company has only one class of equity shares, having a par value of I10/-. The holder of equity shares is entitled to one vote per share. The Company declares and pays dividends in Indian rupees. The dividend proposed by the board of directors is subject to approval by the shareholders at the ensuing annual general meeting. In the event of liquidation of the Company, the holders of the equity shares will be entitled to receive any of the remaining assets of the Company, after distribution to all preferential amounts. The distribution will be in proportion to number of equity shares held by the shareholders.
(iii) Details of equity shares held by each shareholder holding more than 5% of equity shares:I in Million
ParticularsMarch 31, 2019 March 31, 2018
No. of shares % No. of shares % Pronomz Ventures LLP 12,665,000 14.14% 12,665,000 14.15%SBI Magnum Multiplier Fund - 0.00% 6,740,140 7.53%SBI Arbitrage Opportunities Fund 8,656,213 9.67% - 0.00%Aditya Birla Sun Life Equity Advantage Fund 6,092,000 6.80% 175,200.00 0.20%
(iv) Details of equity shares of I10/- each reserved for issuance:I in Million
Particulars No. of shares
March 31, 2019 March 31, 2018
Towards employee stock options under the various Strides stock option plans (Refer note 42) 2,980,563 3,030,692 Total 2,980,563 3,030,692
(v) Buy back of shares, issue of bonus shares and shares allotted as fully paid up pursuant to contract(s) without payment being received in cash.
There have been no buy back of shares, issue of shares by way of bonus shares or issue of shares pursuant to contract without payment being received in cash for the period of five years immediately preceding the Balance sheet date.
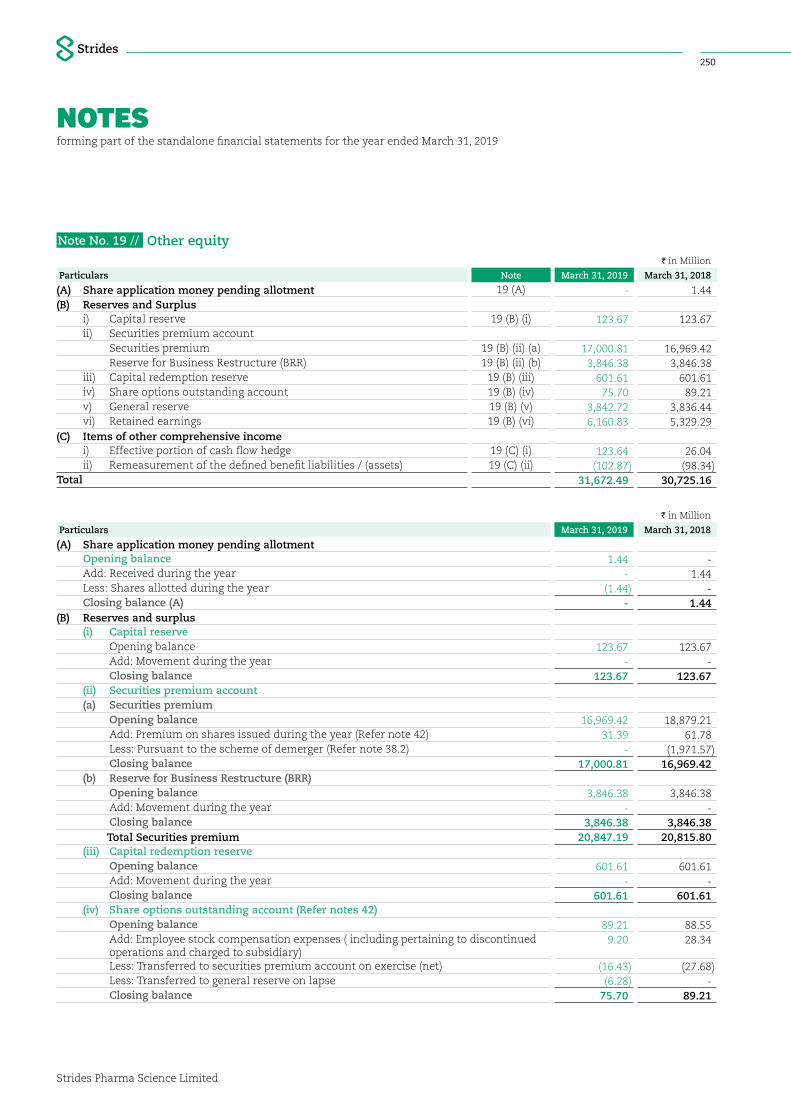
NOTESforming part of the standalone financial statements for the year ended March 31, 2019
Strides Pharma Science Limited
250
Note No. 19 // Other equityI in Million
Particulars Note March 31, 2019 March 31, 2018
(A) Share application money pending allotment 19 (A) - 1.44 (B) Reserves and Surplus i) Capital reserve 19 (B) (i) 123.67 123.67 ii) Securities premium account Securities premium 19 (B) (ii) (a) 17,000.81 16,969.42 Reserve for Business Restructure (BRR) 19 (B) (ii) (b) 3,846.38 3,846.38 iii) Capital redemption reserve 19 (B) (iii) 601.61 601.61 iv) Share options outstanding account 19 (B) (iv) 75.70 89.21 v) General reserve 19 (B) (v) 3,842.72 3,836.44 vi) Retained earnings 19 (B) (vi) 6,160.83 5,329.29 (C) Items of other comprehensive income i) Effective portion of cash flow hedge 19 (C) (i) 123.64 26.04 ii) Remeasurement of the defined benefit liabilities / (assets) 19 (C) (ii) (102.87) (98.34)Total 31,672.49 30,725.16
I in Million
Particulars March 31, 2019 March 31, 2018
(A) Share application money pending allotment Opening balance 1.44 - Add: Received during the year - 1.44 Less: Shares allotted during the year (1.44) - Closing balance (A) - 1.44 (B) Reserves and surplus (i) Capital reserve Opening balance 123.67 123.67 Add: Movement during the year - - Closing balance 123.67 123.67 (ii) Securities premium account (a) Securities premium Opening balance 16,969.42 18,879.21 Add: Premium on shares issued during the year (Refer note 42) 31.39 61.78 Less: Pursuant to the scheme of demerger (Refer note 38.2) - (1,971.57) Closing balance 17,000.81 16,969.42 (b) Re serve for Business Restructure (BRR) Opening balance 3,846.38 3,846.38 Add: Movement during the year - - Closing balance 3,846.38 3,846.38
Total Securities premium 20,847.19 20,815.80 (iii) Capital redemption reserve Opening balance 601.61 601.61 Add: Movement during the year - - Closing balance 601.61 601.61 (iv) Share options outstanding account (Refer notes 42) Opening balance 89.21 88.55 Add: Employee stock compensation expenses ( including pertaining to discontinued
operations and charged to subsidiary) 9.20 28.34
Less: Transferred to securities premium account on exercise (net) (16.43) (27.68) Less: Transferred to general reserve on lapse (6.28) - Closing balance 75.70 89.21
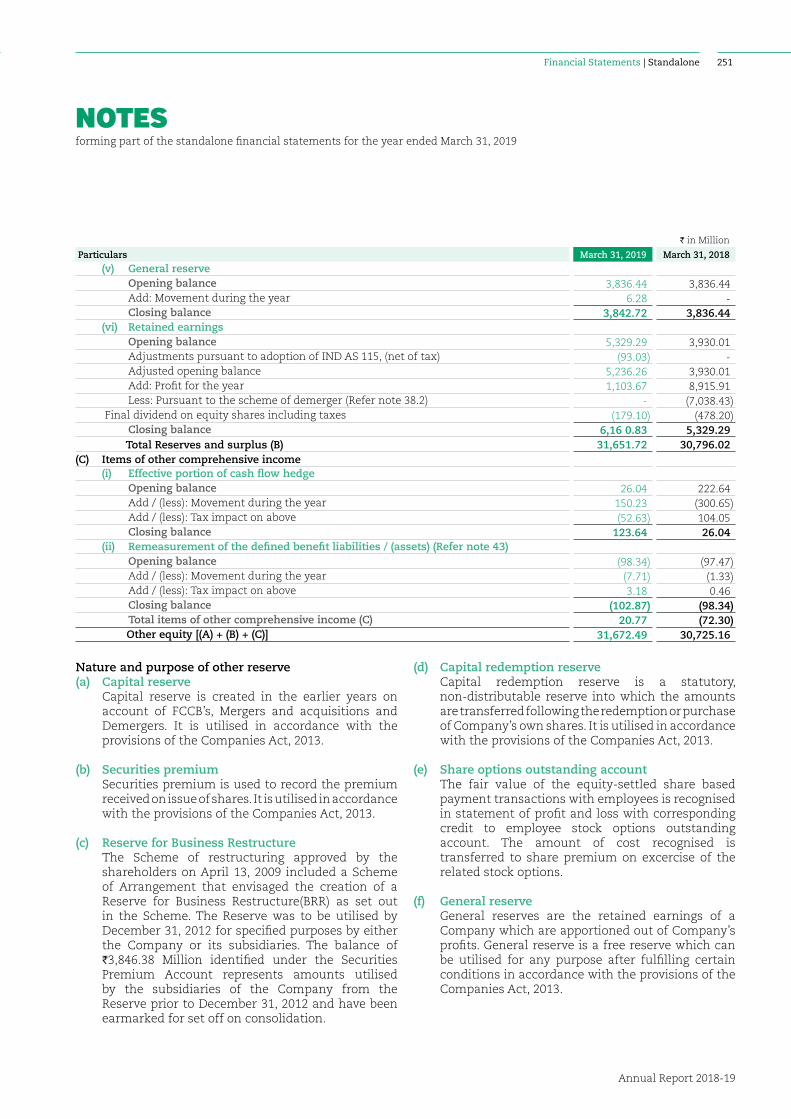
NOTESforming part of the standalone financial statements for the year ended March 31, 2019
Financial Statements | Standalone
Annual Report 2018-19
251
I in Million
Particulars March 31, 2019 March 31, 2018
(v) General reserve Opening balance 3,836.44 3,836.44 Add: Movement during the year 6.28 - Closing balance 3,842.72 3,836.44 (vi) Retained earnings Opening balance 5,329.29 3,930.01 Adjustments pursuant to adoption of IND AS 115, (net of tax) (93.03) - Adjusted opening balance 5,236.26 3,930.01 Add: Profit for the year 1,103.67 8,915.91 Less: Pursuant to the scheme of demerger (Refer note 38.2) - (7,038.43) Final dividend on equity shares including taxes (179.10) (478.20) Closing balance 6,16 0.83 5,329.29 Total Reserves and surplus (B) 31,651.72 30,796.02 (C) Items of other comprehensive income (i) Effective portion of cash flow hedge Opening balance 26.04 222.64 Add / (less): Movement during the year 150.23 (300.65) Add / (less): Tax impact on above (52.63) 104.05 Closing balance 123.64 26.04 (ii) Remeasurement of the defined benefit liabilities / (assets) (Refer note 43) Opening balance (98.34) (97.47) Add / (less): Movement during the year (7.71) (1.33) Add / (less): Tax impact on above 3.18 0.46 Closing balance (102.87) (98.34) Total items of other comprehensive income (C) 20.77 (72.30) Other equity [(A) + (B) + (C)] 31,672.49 30,725.16
Nature and purpose of other reserve(a) Capital reserve Capital reserve is created in the earlier years on
account of FCCB’s, Mergers and acquisitions and Demergers. It is utilised in accordance with the provisions of the Companies Act, 2013.
(b) Securities premium Securities premium is used to record the premium
received on issue of shares. It is utilised in accordance with the provisions of the Companies Act, 2013.
(c) Reserve for Business Restructure The Scheme of restructuring approved by the
shareholders on April 13, 2009 included a Scheme of Arrangement that envisaged the creation of a Reserve for Business Restructure(BRR) as set out in the Scheme. The Reserve was to be utilised by December 31, 2012 for specified purposes by either the Company or its subsidiaries. The balance of I3,846.38 Million identified under the Securities Premium Account represents amounts utilised by the subsidiaries of the Company from the Reserve prior to December 31, 2012 and have been earmarked for set off on consolidation.
(d) Capital redemption reserve Capital redemption reserve is a statutory,
non-distributable reserve into which the amounts are transferred following the redemption or purchase of Company’s own shares. It is utilised in accordance with the provisions of the Companies Act, 2013.
(e) Share options outstanding account The fair value of the equity-settled share based
payment transactions with employees is recognised in statement of profit and loss with corresponding credit to employee stock options outstanding account. The amount of cost recognised is transferred to share premium on excercise of the related stock options.
(f) General reserve General reserves are the retained earnings of a
Company which are apportioned out of Company’s profits. General reserve is a free reserve which can be utilised for any purpose after fulfilling certain conditions in accordance with the provisions of the Companies Act, 2013.
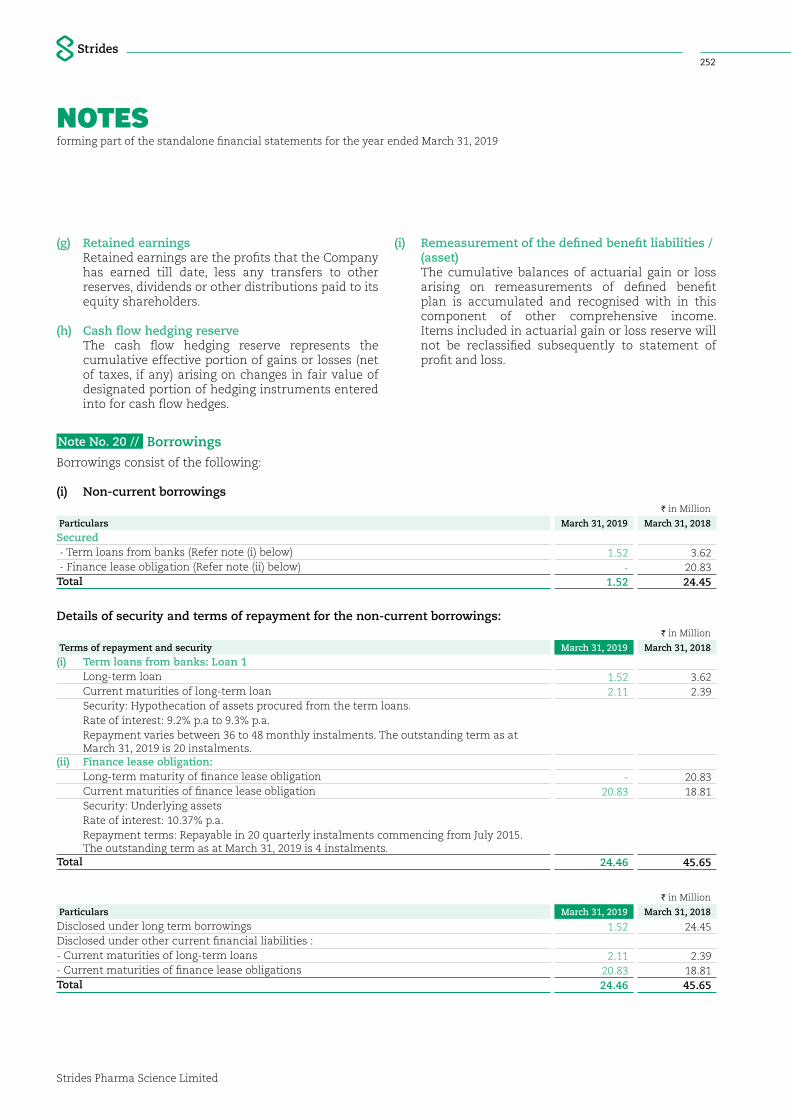
NOTESforming part of the standalone financial statements for the year ended March 31, 2019
Strides Pharma Science Limited
252
Note No. 20 // Borrowings
Borrowings consist of the following:
(i) Non-current borrowingsI in Million
Particulars March 31, 2019 March 31, 2018
Secured - Term loans from banks (Refer note (i) below) 1.52 3.62 - Finance lease obligation (Refer note (ii) below) - 20.83 Total 1.52 24.45
Details of security and terms of repayment for the non-current borrowings:I in Million
Terms of repayment and security March 31, 2019 March 31, 2018
(i) Term loans from banks: Loan 1 Long-term loan 1.52 3.62 Current maturities of long-term loan 2.11 2.39 Security: Hypothecation of assets procured from the term loans. Rate of interest: 9.2% p.a to 9.3% p.a. Repayment varies between 36 to 48 monthly instalments. The outstanding term as at
March 31, 2019 is 20 instalments.(ii) Finance lease obligation: Long-term maturity of finance lease obligation - 20.83 Current maturities of finance lease obligation 20.83 18.81 Security: Underlying assets Rate of interest: 10.37% p.a. Repayment terms: Repayable in 20 quarterly instalments commencing from July 2015.
The outstanding term as at March 31, 2019 is 4 instalments.Total 24.46 45.65
I in Million
Particulars March 31, 2019 March 31, 2018
Disclosed under long term borrowings 1.52 24.45 Disclosed under other current financial liabilities : - Current maturities of long-term loans 2.11 2.39 - Current maturities of finance lease obligations 20.83 18.81 Total 24.46 45.65
(g) Retained earnings Retained earnings are the profits that the Company
has earned till date, less any transfers to other reserves, dividends or other distributions paid to its equity shareholders.
(h) Cash flow hedging reserve The cash flow hedging reserve represents the
cumulative effective portion of gains or losses (net of taxes, if any) arising on changes in fair value of designated portion of hedging instruments entered into for cash flow hedges.
(i) Remeasurement of the defined benefit liabilities / (asset)
The cumulative balances of actuarial gain or loss arising on remeasurements of defined benefit plan is accumulated and recognised with in this component of other comprehensive income. Items included in actuarial gain or loss reserve will not be reclassified subsequently to statement of profit and loss.
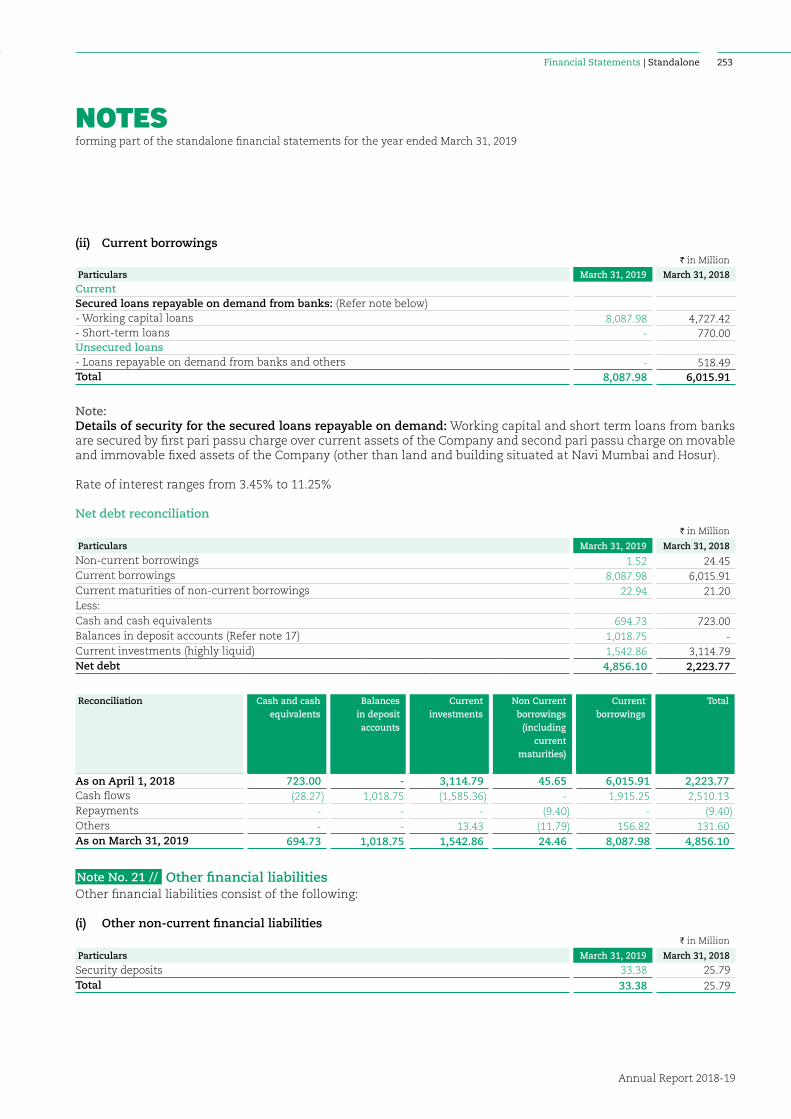
NOTESforming part of the standalone financial statements for the year ended March 31, 2019
Financial Statements | Standalone
Annual Report 2018-19
253
(ii) Current borrowingsI in Million
Particulars March 31, 2019 March 31, 2018
CurrentSecured loans repayable on demand from banks: (Refer note below)- Working capital loans 8,087.98 4,727.42 - Short-term loans - 770.00 Unsecured loans - Loans repayable on demand from banks and others - 518.49 Total 8,087.98 6,015.91
Note:Details of security for the secured loans repayable on demand: Working capital and short term loans from banks are secured by first pari passu charge over current assets of the Company and second pari passu charge on movable and immovable fixed assets of the Company (other than land and building situated at Navi Mumbai and Hosur).
Rate of interest ranges from 3.45% to 11.25%
Net debt reconciliationI in Million
Particulars March 31, 2019 March 31, 2018
Non-current borrowings 1.52 24.45 Current borrowings 8,087.98 6,015.91 Current maturities of non-current borrowings 22.94 21.20 Less:Cash and cash equivalents 694.73 723.00 Balances in deposit accounts (Refer note 17) 1,018.75 - Current investments (highly liquid) 1,542.86 3,114.79 Net debt 4,856.10 2,223.77
Reconciliation Cash and cash equivalents
Balances in deposit accounts
Current investments
Non Current borrowings
(including current
maturities)
Current borrowings
Total
As on April 1, 2018 723.00 - 3,114.79 45.65 6,015.91 2,223.77 Cash flows (28.27) 1,018.75 (1,585.36) - 1,915.25 2,510.13 Repayments - - - (9.40) - (9.40)Others - - 13.43 (11.79) 156.82 131.60 As on March 31, 2019 694.73 1,018.75 1,542.86 24.46 8,087.98 4,856.10
Note No. 21 // Other financial liabilitiesOther financial liabilities consist of the following:
(i) Other non-current financial liabilitiesI in Million
Particulars March 31, 2019 March 31, 2018
Security deposits 33.38 25.79 Total 33.38 25.79

NOTESforming part of the standalone financial statements for the year ended March 31, 2019
Strides Pharma Science Limited
254
(ii) Other current financial liabilitiesI in Million
Particulars March 31, 2019 March 31, 2018
Current maturities of long-term loans from banks (Refer note 20(i) above) 2.11 2.39 Current maturities of finance lease obligations (Refer note 20(i) above) 20.83 18.81 Unclaimed dividends * 56.28 66.89 Mark to market loss on derivative instruments 0.15 6.95 Other payables:- Payables to employees under incentive plan 43.18 20.69 - Payable to subsidiary (Refer note 44) 76.94 - - Payables on purchase of property, plant and equipment and intangible assets 19.00 3.76 - Payables on purchase of investment in subsidiary 40.51 90.00 - Others 0.33 0.70 Total 259.33 210.19
*Investor Education and Protection Fund shall be credited when due.
Note No. 22 // ProvisionsProvisions consist of the following:
(i) Non-current provisionsI in Million
Particulars March 31, 2019 March 31, 2018
Provision for employee benefits:Gratuity (Refer note 43) 128.78 133.21 Total 128.78 133.21
(ii) Current provisionsI in Million
Particulars March 31, 2019 March 31, 2018
Provision for sales return 47.10 90.00 Provision for employee benefits:- Compensated absences 165.98 178.36 Total 213.08 268.36
I in MillionMovement in provisions Gratuity Compensated
absences Sales return
Opening balance 133.21 178.36 90.00 Provision recognised/ (utilised) during the year (4.43) (12.38) (42.90)Closing balance 128.78 165.98 47.10
Note No. 23 // Other liabilitiesOther liabilities consist of the following;
(i) Other non-current liabilitiesI in Million
Particulars March 31, 2019 March 31, 2018
Prepaid rent liability 6.38 6.57 Lease equalisation liability - 0.97 Total 6.38 7.54
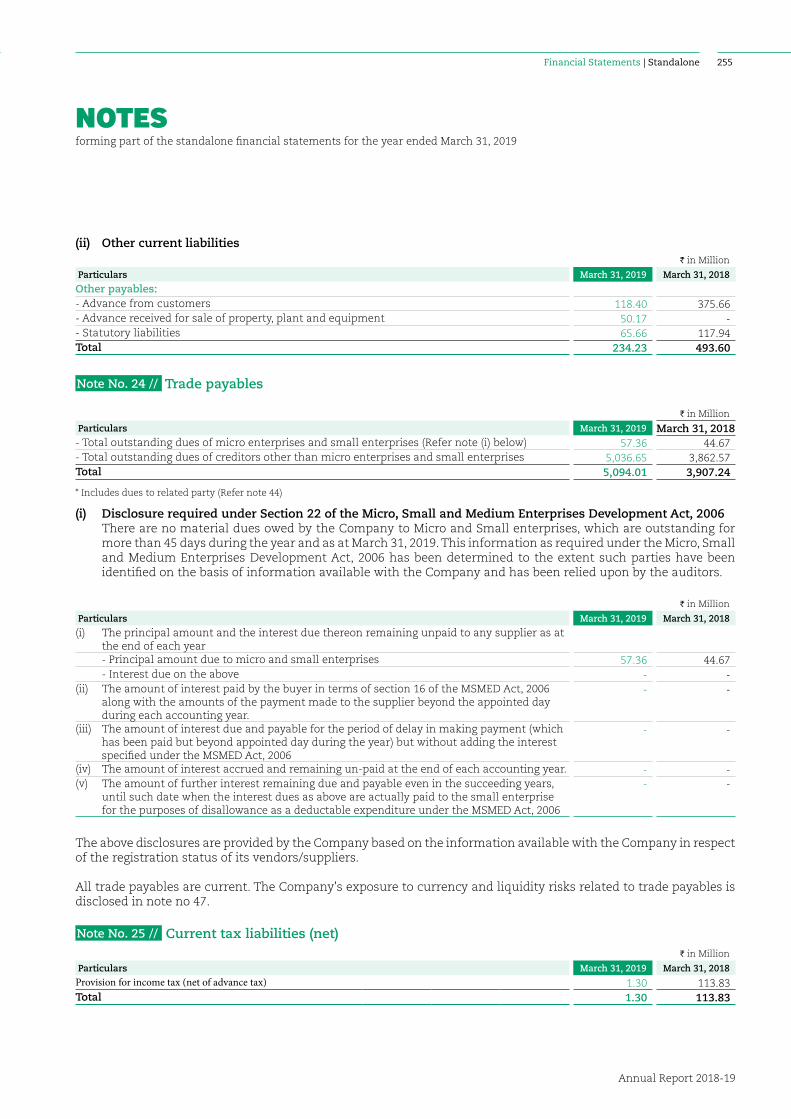
NOTESforming part of the standalone financial statements for the year ended March 31, 2019
Financial Statements | Standalone
Annual Report 2018-19
255
(ii) Other current liabilitiesI in Million
Particulars March 31, 2019 March 31, 2018
Other payables:- Advance from customers 118.40 375.66 - Advance received for sale of property, plant and equipment 50.17 - - Statutory liabilities 65.66 117.94 Total 234.23 493.60
Note No. 24 // Trade payables
I in Million
Particulars March 31, 2019 March 31, 2018- Total outstanding dues of micro enterprises and small enterprises (Refer note (i) below) 57.36 44.67 - Total outstanding dues of creditors other than micro enterprises and small enterprises 5,036.65 3,862.57 Total 5,094.01 3,907.24
* Includes dues to related party (Refer note 44)
(i) Disclosure required under Section 22 of the Micro, Small and Medium Enterprises Development Act, 2006 There are no material dues owed by the Company to Micro and Small enterprises, which are outstanding for
more than 45 days during the year and as at March 31, 2019. This information as required under the Micro, Small and Medium Enterprises Development Act, 2006 has been determined to the extent such parties have been identified on the basis of information available with the Company and has been relied upon by the auditors.
I in Million
Particulars March 31, 2019 March 31, 2018
(i) The principal amount and the interest due thereon remaining unpaid to any supplier as at the end of each year
- Principal amount due to micro and small enterprises 57.36 44.67 - Interest due on the above - - (ii) The amount of interest paid by the buyer in terms of section 16 of the MSMED Act, 2006
along with the amounts of the payment made to the supplier beyond the appointed day during each accounting year.
- -
(iii) The amount of interest due and payable for the period of delay in making payment (which has been paid but beyond appointed day during the year) but without adding the interest specified under the MSMED Act, 2006
- -
(iv) The amount of interest accrued and remaining un-paid at the end of each accounting year. - - (v) The amount of further interest remaining due and payable even in the succeeding years,
until such date when the interest dues as above are actually paid to the small enterprise for the purposes of disallowance as a deductable expenditure under the MSMED Act, 2006
- -
The above disclosures are provided by the Company based on the information available with the Company in respect of the registration status of its vendors/suppliers.
All trade payables are current. The Company's exposure to currency and liquidity risks related to trade payables is disclosed in note no 47.
Note No. 25 // Current tax liabilities (net)I in Million
Particulars March 31, 2019 March 31, 2018
Provision for income tax (net of advance tax) 1.30 113.83 Total 1.30 113.83
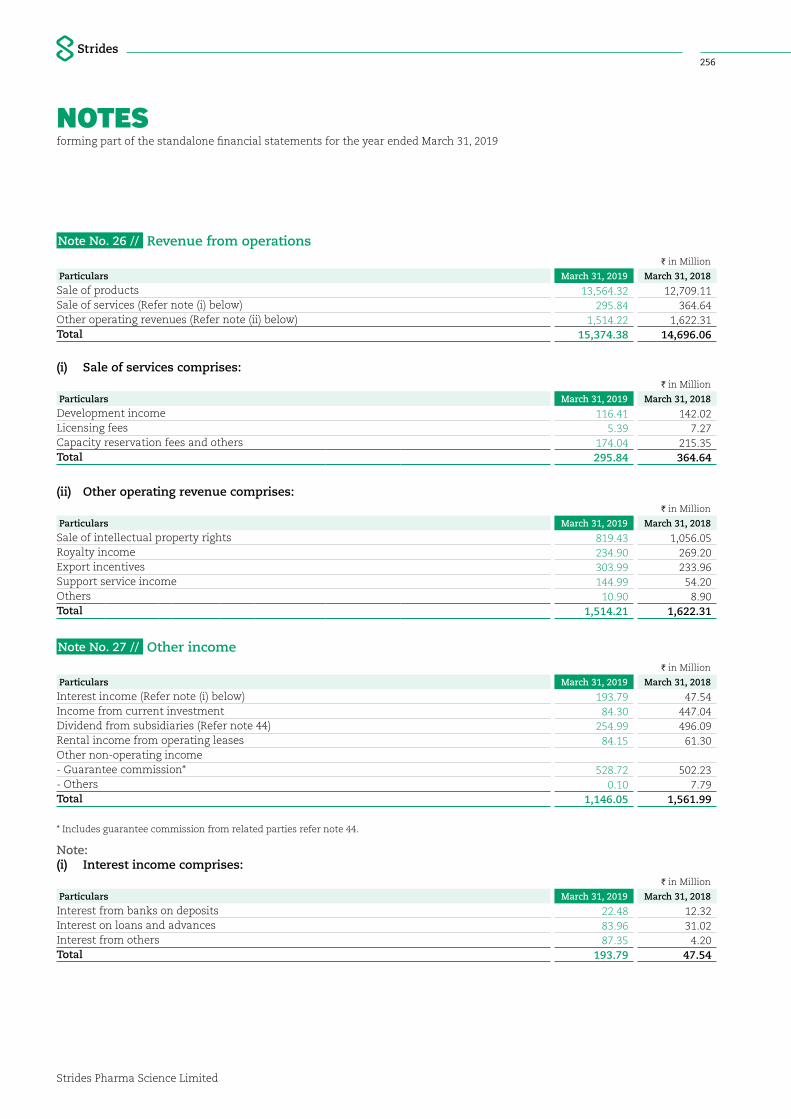
NOTESforming part of the standalone financial statements for the year ended March 31, 2019
Strides Pharma Science Limited
256
Note No. 26 // Revenue from operationsI in Million
Particulars March 31, 2019 March 31, 2018
Sale of products 13,564.32 12,709.11 Sale of services (Refer note (i) below) 295.84 364.64 Other operating revenues (Refer note (ii) below) 1,514.22 1,622.31 Total 15,374.38 14,696.06
(i) Sale of services comprises:I in Million
Particulars March 31, 2019 March 31, 2018
Development income 116.41 142.02 Licensing fees 5.39 7.27 Capacity reservation fees and others 174.04 215.35 Total 295.84 364.64
(ii) Other operating revenue comprises:I in Million
Particulars March 31, 2019 March 31, 2018
Sale of intellectual property rights 819.43 1,056.05 Royalty income 234.90 269.20 Export incentives 303.99 233.96 Support service income 144.99 54.20 Others 10.90 8.90 Total 1,514.21 1,622.31
Note No. 27 // Other incomeI in Million
Particulars March 31, 2019 March 31, 2018
Interest income (Refer note (i) below) 193.79 47.54 Income from current investment 84.30 447.04 Dividend from subsidiaries (Refer note 44) 254.99 496.09 Rental income from operating leases 84.15 61.30 Other non-operating income - Guarantee commission* 528.72 502.23 - Others 0.10 7.79 Total 1,146.05 1,561.99
* Includes guarantee commission from related parties refer note 44.
Note:(i) Interest income comprises:
I in Million
Particulars March 31, 2019 March 31, 2018
Interest from banks on deposits 22.48 12.32 Interest on loans and advances 83.96 31.02Interest from others 87.35 4.20 Total 193.79 47.54
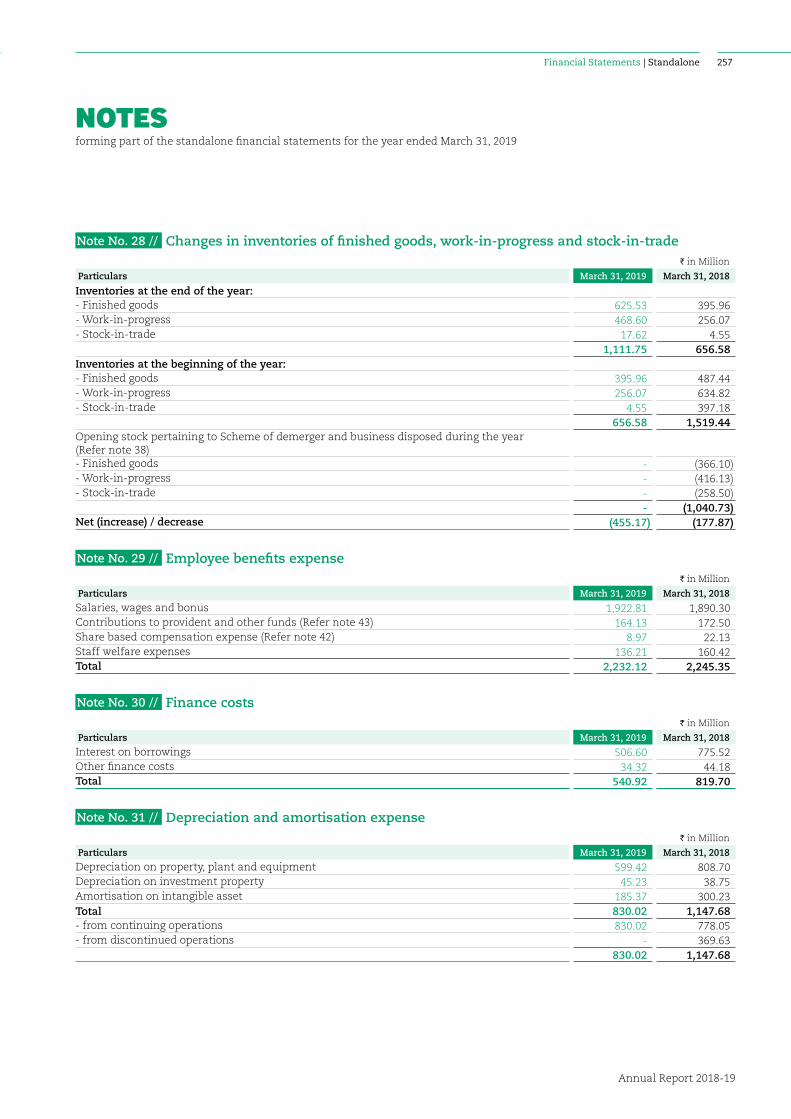
NOTESforming part of the standalone financial statements for the year ended March 31, 2019
Financial Statements | Standalone
Annual Report 2018-19
257
Note No. 28 // Changes in inventories of finished goods, work-in-progress and stock-in-tradeI in Million
Particulars March 31, 2019 March 31, 2018
Inventories at the end of the year:- Finished goods 625.53 395.96 - Work-in-progress 468.60 256.07 - Stock-in-trade 17.62 4.55
1,111.75 656.58 Inventories at the beginning of the year:- Finished goods 395.96 487.44 - Work-in-progress 256.07 634.82 - Stock-in-trade 4.55 397.18
656.58 1,519.44 Opening stock pertaining to Scheme of demerger and business disposed during the year (Refer note 38)- Finished goods - (366.10)- Work-in-progress - (416.13)- Stock-in-trade - (258.50)
- (1,040.73)Net (increase) / decrease (455.17) (177.87)
Note No. 29 // Employee benefits expenseI in Million
Particulars March 31, 2019 March 31, 2018
Salaries, wages and bonus 1,922.81 1,890.30 Contributions to provident and other funds (Refer note 43) 164.13 172.50 Share based compensation expense (Refer note 42) 8.97 22.13 Staff welfare expenses 136.21 160.42 Total 2,232.12 2,245.35
Note No. 30 // Finance costsI in Million
Particulars March 31, 2019 March 31, 2018
Interest on borrowings 506.60 775.52 Other finance costs 34.32 44.18 Total 540.92 819.70
Note No. 31 // Depreciation and amortisation expenseI in Million
Particulars March 31, 2019 March 31, 2018
Depreciation on property, plant and equipment 599.42 808.70 Depreciation on investment property 45.23 38.75 Amortisation on intangible asset 185.37 300.23 Total 830.02 1,147.68 - from continuing operations 830.02 778.05 - from discontinued operations - 369.63
830.02 1,147.68
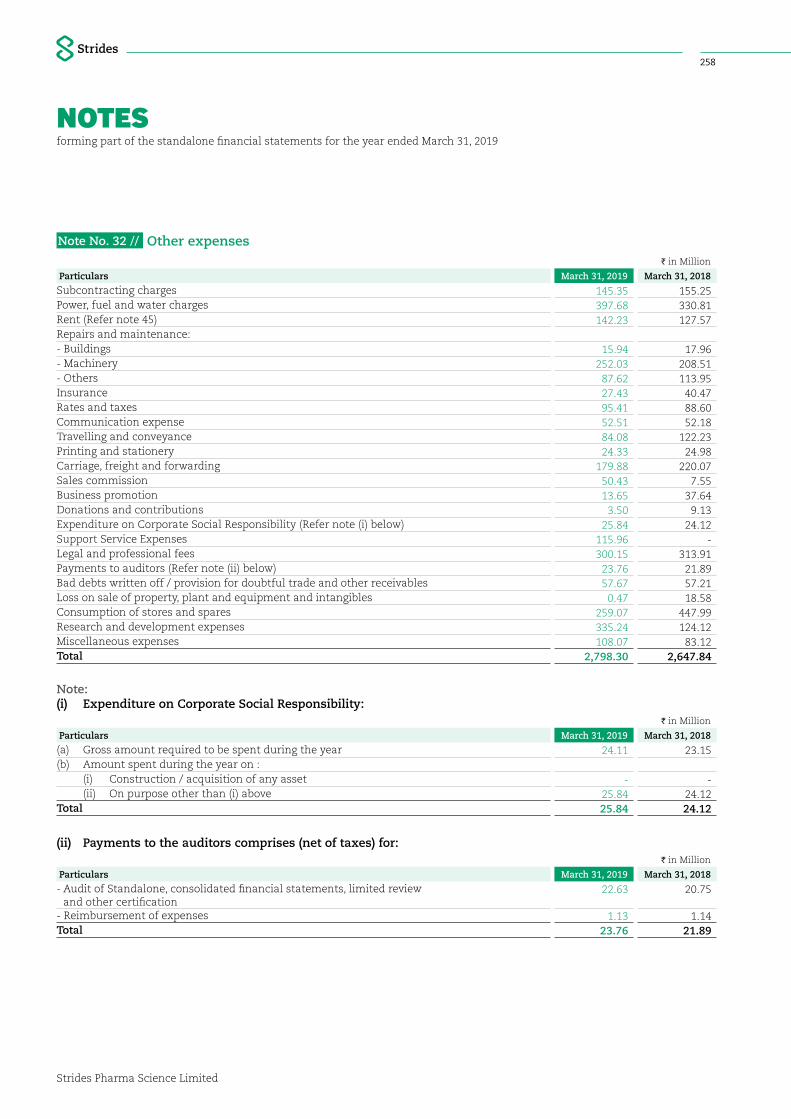
NOTESforming part of the standalone financial statements for the year ended March 31, 2019
Strides Pharma Science Limited
258
Note No. 32 // Other expensesI in Million
Particulars March 31, 2019 March 31, 2018
Subcontracting charges 145.35 155.25 Power, fuel and water charges 397.68 330.81 Rent (Refer note 45) 142.23 127.57 Repairs and maintenance: - Buildings 15.94 17.96 - Machinery 252.03 208.51 - Others 87.62 113.95 Insurance 27.43 40.47 Rates and taxes 95.41 88.60 Communication expense 52.51 52.18 Travelling and conveyance 84.08 122.23 Printing and stationery 24.33 24.98 Carriage, freight and forwarding 179.88 220.07 Sales commission 50.43 7.55 Business promotion 13.65 37.64 Donations and contributions 3.50 9.13 Expenditure on Corporate Social Responsibility (Refer note (i) below) 25.84 24.12 Support Service Expenses 115.96 - Legal and professional fees 300.15 313.91 Payments to auditors (Refer note (ii) below) 23.76 21.89 Bad debts written off / provision for doubtful trade and other receivables 57.67 57.21 Loss on sale of property, plant and equipment and intangibles 0.47 18.58 Consumption of stores and spares 259.07 447.99 Research and development expenses 335.24 124.12 Miscellaneous expenses 108.07 83.12 Total 2,798.30 2,647.84
Note:(i) Expenditure on Corporate Social Responsibility:
I in Million
Particulars March 31, 2019 March 31, 2018
(a) Gross amount required to be spent during the year 24.11 23.15(b) Amount spent during the year on : (i) Construction / acquisition of any asset - - (ii) On purpose other than (i) above 25.84 24.12 Total 25.84 24.12
(ii) Payments to the auditors comprises (net of taxes) for:I in Million
Particulars March 31, 2019 March 31, 2018
- Audit of Standalone, consolidated financial statements, limited review and other certification
22.63 20.75
- Reimbursement of expenses 1.13 1.14 Total 23.76 21.89
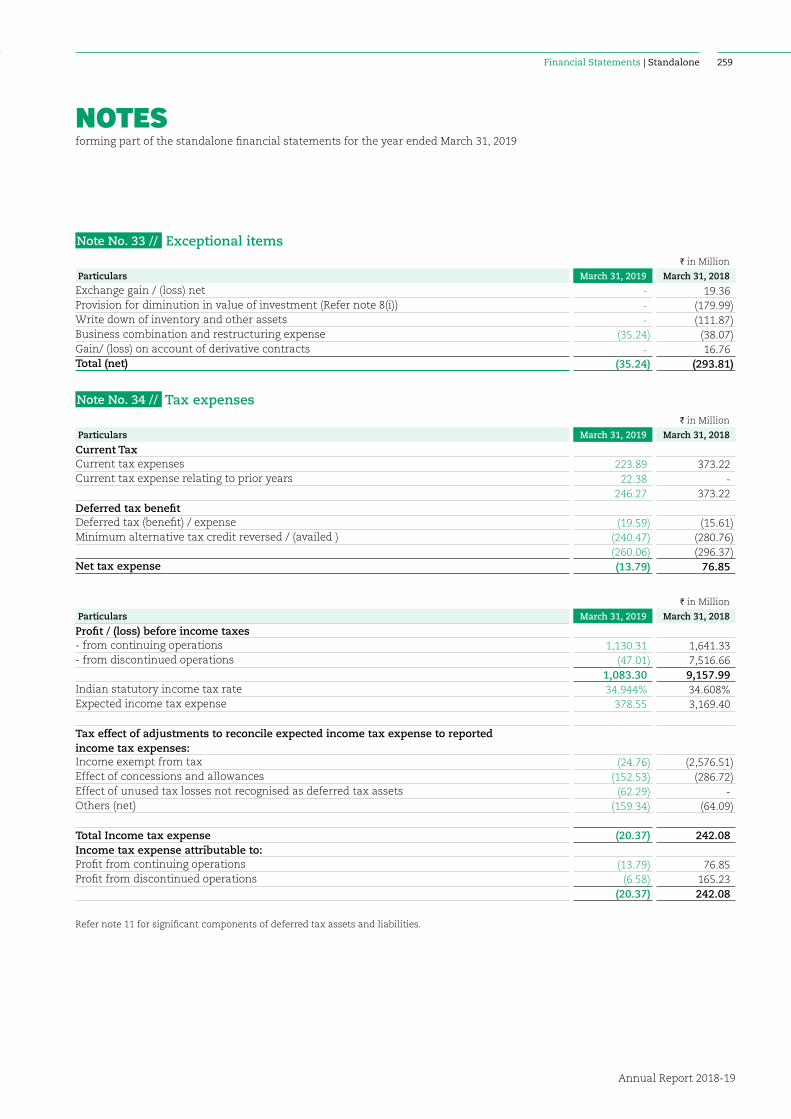
NOTESforming part of the standalone financial statements for the year ended March 31, 2019
Financial Statements | Standalone
Annual Report 2018-19
259
Note No. 33 // Exceptional itemsI in Million
Particulars March 31, 2019 March 31, 2018
Exchange gain / (loss) net - 19.36 Provision for diminution in value of investment (Refer note 8(i)) - (179.99)Write down of inventory and other assets - (111.87)Business combination and restructuring expense (35.24) (38.07)Gain/ (loss) on account of derivative contracts - 16.76 Total (net) (35.24) (293.81)
Note No. 34 // Tax expensesI in Million
Particulars March 31, 2019 March 31, 2018
Current TaxCurrent tax expenses 223.89 373.22 Current tax expense relating to prior years 22.38 -
246.27 373.22 Deferred tax benefitDeferred tax (benefit) / expense (19.59) (15.61)Minimum alternative tax credit reversed / (availed ) (240.47) (280.76)
(260.06) (296.37)Net tax expense (13.79) 76.85
I in Million
Particulars March 31, 2019 March 31, 2018
Profit / (loss) before income taxes - from continuing operations 1,130.31 1,641.33 - from discontinued operations (47.01) 7,516.66
1,083.30 9,157.99 Indian statutory income tax rate 34.944% 34.608%Expected income tax expense 378.55 3,169.40
Tax effect of adjustments to reconcile expected income tax expense to reported income tax expenses:Income exempt from tax (24.76) (2,576.51)Effect of concessions and allowances (152.53) (286.72)Effect of unused tax losses not recognised as deferred tax assets (62.29) - Others (net) (159.34) (64.09)
Total Income tax expense (20.37) 242.08 Income tax expense attributable to:Profit from continuing operations (13.79) 76.85 Profit from discontinued operations (6.58) 165.23
(20.37) 242.08
Refer note 11 for significant components of deferred tax assets and liabilities.
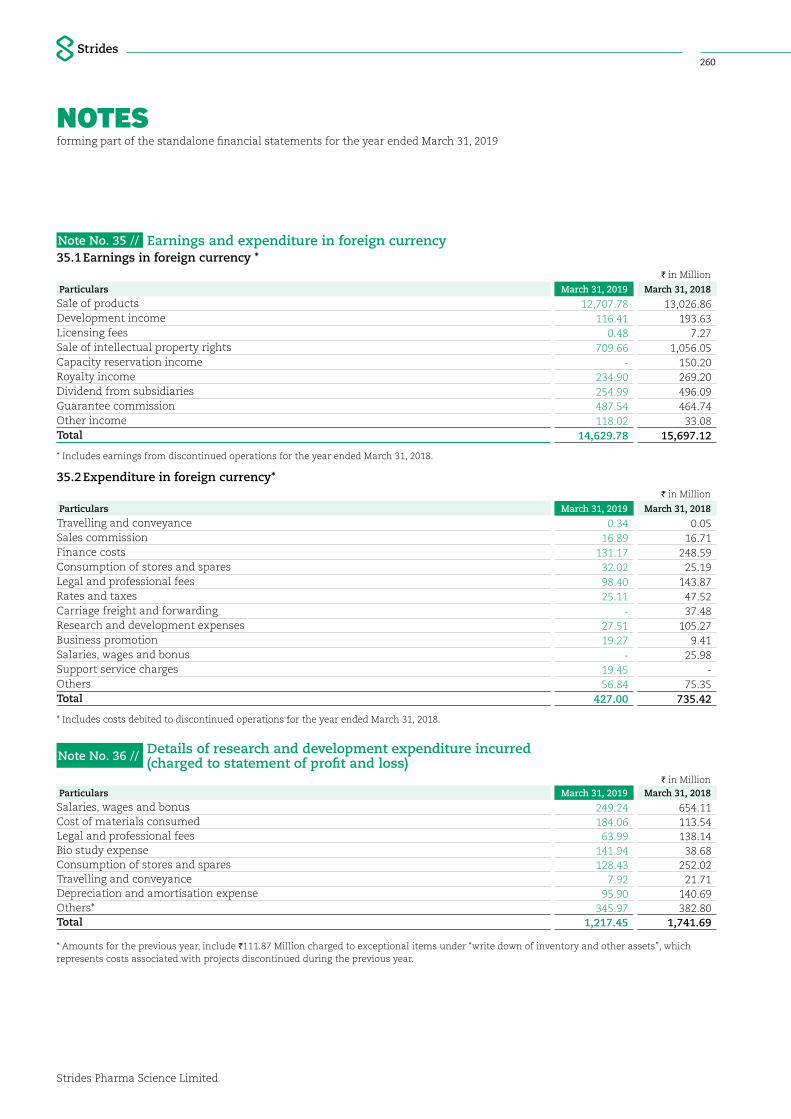
NOTESforming part of the standalone financial statements for the year ended March 31, 2019
Strides Pharma Science Limited
260
Note No. 35 // Earnings and expenditure in foreign currency35.1 Earnings in foreign currency *
I in Million
Particulars March 31, 2019 March 31, 2018
Sale of products 12,707.78 13,026.86 Development income 116.41 193.63 Licensing fees 0.48 7.27 Sale of intellectual property rights 709.66 1,056.05 Capacity reservation income - 150.20 Royalty income 234.90 269.20 Dividend from subsidiaries 254.99 496.09 Guarantee commission 487.54 464.74 Other income 118.02 33.08 Total 14,629.78 15,697.12
* Includes earnings from discontinued operations for the year ended March 31, 2018.
35.2 Expenditure in foreign currency*I in Million
Particulars March 31, 2019 March 31, 2018
Travelling and conveyance 0.34 0.05 Sales commission 16.89 16.71 Finance costs 131.17 248.59 Consumption of stores and spares 32.02 25.19 Legal and professional fees 98.40 143.87 Rates and taxes 25.11 47.52 Carriage freight and forwarding - 37.48 Research and development expenses 27.51 105.27 Business promotion 19.27 9.41 Salaries, wages and bonus - 25.98 Support service charges 19.45 - Others 56.84 75.35 Total 427.00 735.42
* Includes costs debited to discontinued operations for the year ended March 31, 2018.
Note No. 36 // Details of research and development expenditure incurred (charged to statement of profit and loss)
I in MillionParticulars March 31, 2019 March 31, 2018
Salaries, wages and bonus 249.24 654.11Cost of materials consumed 184.06 113.54Legal and professional fees 63.99 138.14Bio study expense 141.94 38.68Consumption of stores and spares 128.43 252.02Travelling and conveyance 7.92 21.71Depreciation and amortisation expense 95.90 140.69Others* 345.97 382.80 Total 1,217.45 1,741.69
* Amounts for the previous year, include I111.87 Million charged to exceptional items under “write down of inventory and other assets”, which represents costs associated with projects discontinued during the previous year.

NOTESforming part of the standalone financial statements for the year ended March 31, 2019
Financial Statements | Standalone
Annual Report 2018-19
261
Note No. 37 // Other comprehensive incomeI in Million
Particulars March 31, 2019 March 31, 2018
A) Items that will not be reclassified to profit or loss Defined benefit obligations (7.71) (1.33) Income tax on defined benefit obligations 3.18 0.46
(4.53) (0.87)B) Items that may be reclassified to profit or loss Movement in cash flow hedge 150.23 (300.65) Income tax on cash flow hedge (52.63) 104.05
97.60 (196.60)Total 93.07 (197.47)From continuing operations 93.07 (188.90)From discontinued operations - (8.57)
Note No. 38 // Disposal of investments / business / assets held for sale accounted as discontinued operations
38.1 Sale of investments in entities manufacturing specialty products
The Company and its wholly owned subsidiary Strides Pharma Asia Pte Limited (“Strides Singapore”) entered into definitive agreements on February 27, 2013 with Mylan Inc. for sale of the Specialty products business. The transactions under the respective agreements were by way of (i) sale of investment held in Agila Specialties Private Limited (“ASPL”, an erstwhile wholly owned subsidiary of the Company), to Mylan Laboratories Limited (“MLL”), a Mylan group company and (ii) the sale of investment held in Agila Specialties Global Pte Limited (“Agila Global”, an erstwhile wholly owned subsidiary of Strides Singapore) to Mylan Institutional Inc., another Mylan group company. MLL and Mylan Institutional Inc. together are referred to below as Mylan.
The sale of shares of ASPL was recorded by the Company in terms of the Sale and Purchase Agreement dated December 4, 2013 (the “India SPA”). The sale of shares of Agila Global was recorded by Strides Singapore in terms of another Sale and Purchase Agreement dated December 4, 2013 (the “Global SPA”).
The Company as part of the sale has provided a corporate guarantee to Mylan Inc. for USD 200 Million (valid up to December 4, 2020) on behalf of Strides Singapore which can be used for discharging specified financial obligations, if any, of Strides Singapore to Mylan, which has been included under contingent liabilities as at March 31, 2019 and March 31, 2018 in Note 41.
Further, in accordance with the terms of the India SPA and the Global SPA (together the “SPA”s), certain amounts were set aside under separate deposit / escrow accounts which were required to be utilised for specified expenses during the specified period. These included separate escrow / deposit of USD 100 Million in respect of potential claims under the SPAs in relation to certain regulatory concerns (“Regulatory escrow”) and USD 100 Million in respect of potential claims in relation to the warranties and indemnities, including in relation to tax, as per the terms of SPAs and other transaction amounts (“General claims escrow”). Further, I850 Million was set aside in separate Escrow for payment to certain specified senior management personnel of ASPL and its subsidiary.
Any unutilised amounts from the deposit / escrow accounts after the specified period were payable to the respective entities of the Group. Given the uncertainties involved and in the absence of a right to receive, the amounts under the deposit / escrow arrangements were not included in the consideration accounted as income by the Company at the time of disposal of the investments. Receipts from these deposit / escrow accounts were recognised subsequently (net of related expenses incurred) in the period in which such amounts were received by the Company.
During the earlier years, the Company received notifications of claims from Mylan under the terms of the SPAs. These included claims against the regulatory escrows, tax claims, warranty and indemnity claims, and third party claims. Under the terms of the SPAs, claims against the Company / Strides Singapore can only be made under specific provisions contained in the SPAs which include

NOTESforming part of the standalone financial statements for the year ended March 31, 2019
Strides Pharma Science Limited
262
the procedures and timelines for submission of notifications of claims and actual claims and commencing arbitration proceedings.
During the earlier years, all claims towards regulatory expenses were settled out of the Regulatory Escrow deposit. The Company’s subsidiary in Singapore and Mylan also agreed on full and final settlement of warranty and indemnity claims which were adjusted against the General Claims escrow.
During the year ended March 31, 2019, favourable outcome was achieved in relation to arbitration porceedings with respect to third party claims. The Company’s subsidiary in Singapore and Mylan have entered into an agreement whereby Mylan has released the pending balance in Escrow account relating to Global SPA. The Company’s subsidiary in Singapore has recorded a net gain of I2,738.74 Million (net off related expenses and outstanding tax claims) under discontinued operations in its consolidated financial statements.
38.2 Demerger of Commodity API business during the previous year
The Board of Directors in their meeting held on March 20, 2017 approved the proposal to demerge the Commodity API Business, into Solara Active Pharma Sciences Limited (“Solara”), a wholly owned subsidiary of the Company.
As part of the Scheme of Arrangement (the ‘Scheme’) of Demerger, the Human API business of SeQuent Scientific Limited (a promoter owned listed company) was also proposed to be carved out into Solara, providing critical size to this business.
The Scheme had an Appointed date of October 1, 2017.
The share entitlement ratio for the Scheme of Demerger is as under:
1) For demerger of Commodity API business: 1 equity share of I10/- each of Solara to be received by the shareholders of the Company for every 6 fully paid up equity shares of I10/- each held in Strides Shasun Limited.
2) For demerger of Human API business: 1 equity share of I10/- each of Solara to be received by the shareholders of the Company for every 25 fully paid up equity shares of I2/- each held in SeQuent Scientific Limited.
Pursuant to the Scheme, duly sanctioned by the National Company Law Tribunal, Mumbai, vide Order dated March 9, 2018, (‘Order’) with effect from the Appointed Date i.e. October 1, 2017, the “Commodity API business” of the Company was transferred to Solara Active Pharma Sciences Limited (Solara). In accordance with Section 230 of Companies Act, 2013, the Company filed the NCLT order with Ministry of Company Affairs (Registrar of Companies) on March 31, 2018. Consequent to the filing, the Scheme became effective from March 31, 2018.
Pursuant to the Scheme, the Company has transferred the assets and liabilities pertaining to the Commodity API business with effect from the Appointed Date to Solara. In line with the accounting prescribed in the Scheme, the net assets transferred amounting to I1,971.57 Million have been derecognised with a corresponding debit to the securities premium.
Details of assets and liabilities pertaining to API business are given below-
I in Million
ParticularsAs at
October 1, 2017Non-current assets 4,498.42 Current assets 4,019.02 Total assets (A) 8,517.44 Non-current liabilities 2,242.24Current liabilities 4,303.63 Total liabilities (B) 6,545.87Net asset debited to securities premium (A-B)
1,971.57
The demerger of this business was accounted for as a
distribution to owners in accordance with Appendix A (‘Distribution of Non-cash Assets to Owners’) to Ind AS 10: Events after the Reporting Period.
In accordance with the above, the Company fair valued the Commodity API business as on the appointed date and the excess of the fair value of the Commodity API business and the net assets transferred has been credited to the statement of profit and loss.
The fair valuation of the Commodity API business was carried out by independent valuers who valued it at I9,010.00 Million.
The excess of the fair value over the net assets amounting to I7,038.43 Million was recognised as a non cash gain in the statement of profit and
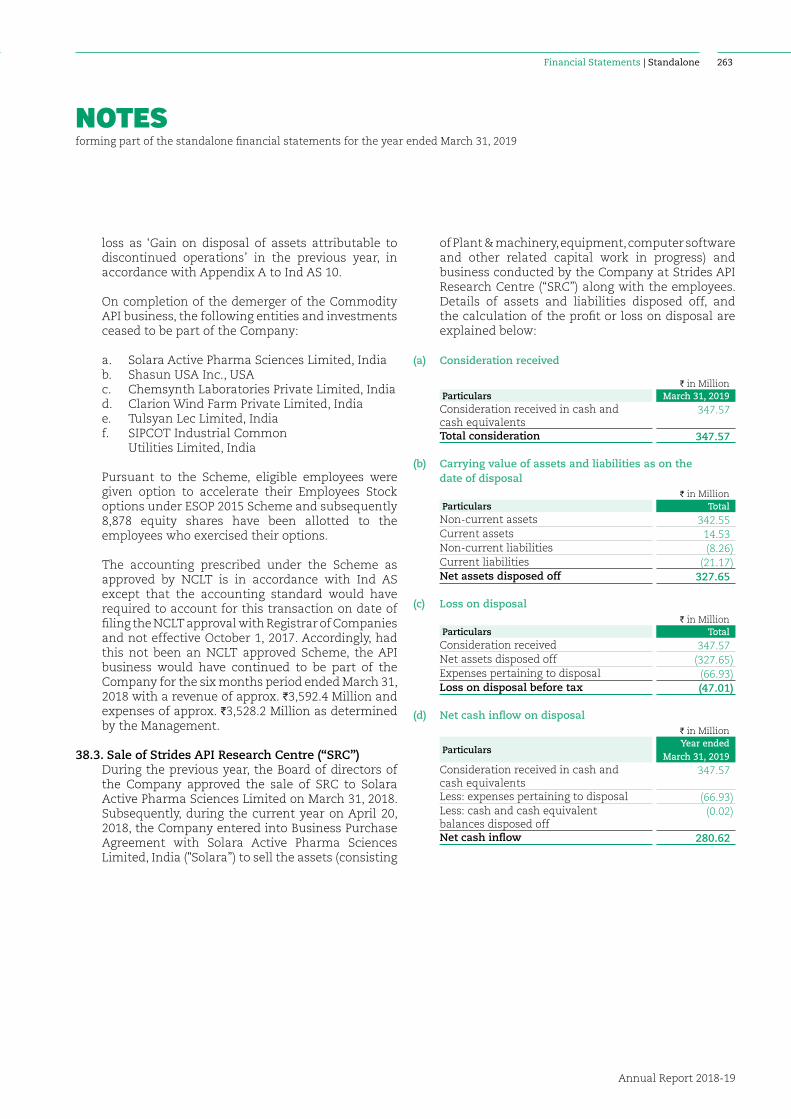
NOTESforming part of the standalone financial statements for the year ended March 31, 2019
Financial Statements | Standalone
Annual Report 2018-19
263
loss as ‘Gain on disposal of assets attributable to discontinued operations’ in the previous year, in accordance with Appendix A to Ind AS 10.
On completion of the demerger of the Commodity API business, the following entities and investments ceased to be part of the Company:
a. Solara Active Pharma Sciences Limited, India b. Shasun USA Inc., USA c. Chemsynth Laboratories Private Limited, India d. Clarion Wind Farm Private Limited, India e. Tulsyan Lec Limited, India f. SIPCOT Industrial Common
Utilities Limited, India
Pursuant to the Scheme, eligible employees were given option to accelerate their Employees Stock options under ESOP 2015 Scheme and subsequently 8,878 equity shares have been allotted to the employees who exercised their options.
The accounting prescribed under the Scheme as approved by NCLT is in accordance with Ind AS except that the accounting standard would have required to account for this transaction on date of filing the NCLT approval with Registrar of Companies and not effective October 1, 2017. Accordingly, had this not been an NCLT approved Scheme, the API business would have continued to be part of the Company for the six months period ended March 31, 2018 with a revenue of approx. I3,592.4 Million and expenses of approx. I3,528.2 Million as determined by the Management.
38.3. Sale of Strides API Research Centre (“SRC”) During the previous year, the Board of directors of
the Company approved the sale of SRC to Solara Active Pharma Sciences Limited on March 31, 2018. Subsequently, during the current year on April 20, 2018, the Company entered into Business Purchase Agreement with Solara Active Pharma Sciences Limited, India ("Solara”) to sell the assets (consisting
of Plant & machinery, equipment, computer software and other related capital work in progress) and business conducted by the Company at Strides API Research Centre (“SRC”) along with the employees. Details of assets and liabilities disposed off, and the calculation of the profit or loss on disposal are explained below:
(a) Consideration received
I in MillionParticulars March 31, 2019Consideration received in cash and cash equivalents
347.57
Total consideration 347.57
(b) Carrying value of assets and liabilities as on the date of disposal
I in MillionParticulars TotalNon-current assets 342.55Current assets 14.53Non-current liabilities (8.26)Current liabilities (21.17)Net assets disposed off 327.65
(c) Loss on disposalI in Million
Particulars TotalConsideration received 347.57Net assets disposed off (327.65)Expenses pertaining to disposal (66.93)Loss on disposal before tax (47.01)
(d) Net cash inflow on disposalI in Million
ParticularsYear ended
March 31, 2019Consideration received in cash and cash equivalents
347.57
Less: expenses pertaining to disposal (66.93)Less: cash and cash equivalent balances disposed off
(0.02)
Net cash inflow 280.62
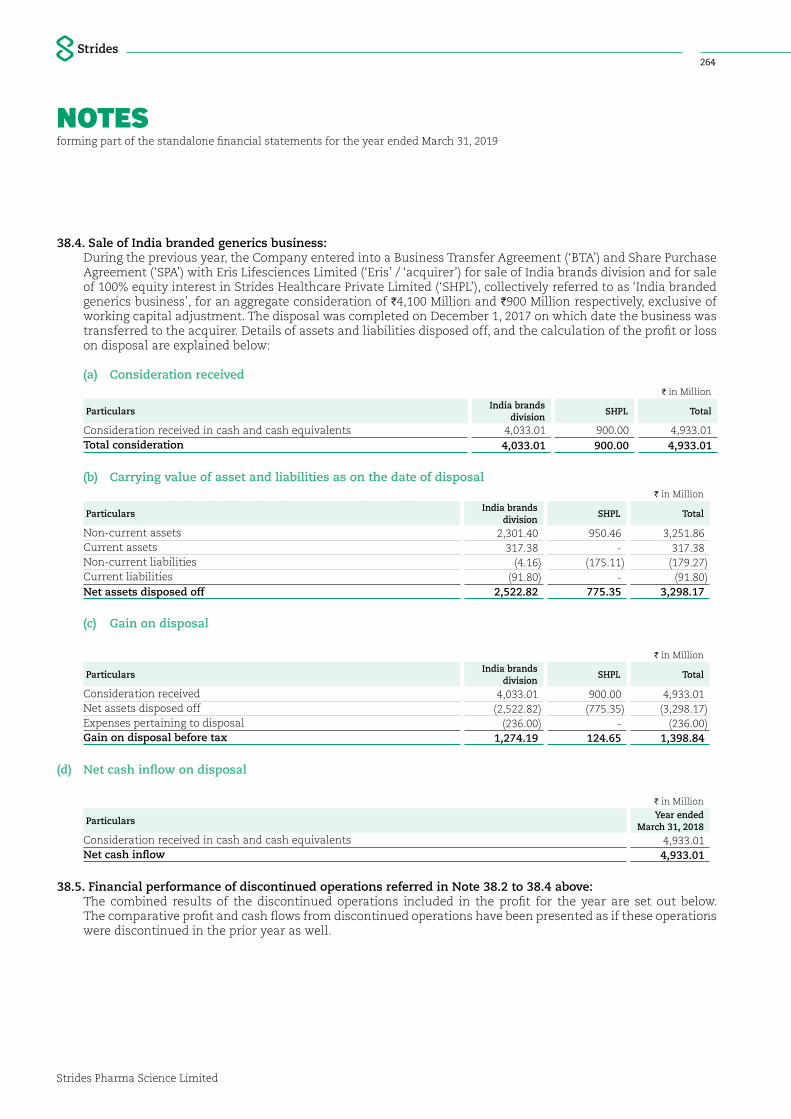
NOTESforming part of the standalone financial statements for the year ended March 31, 2019
Strides Pharma Science Limited
264
38.4. Sale of India branded generics business: During the previous year, the Company entered into a Business Transfer Agreement (‘BTA’) and Share Purchase
Agreement (‘SPA’) with Eris Lifesciences Limited (‘Eris’ / ‘acquirer’) for sale of India brands division and for sale of 100% equity interest in Strides Healthcare Private Limited (‘SHPL’), collectively referred to as ‘India branded generics business’, for an aggregate consideration of I4,100 Million and I900 Million respectively, exclusive of working capital adjustment. The disposal was completed on December 1, 2017 on which date the business was transferred to the acquirer. Details of assets and liabilities disposed off, and the calculation of the profit or loss on disposal are explained below:
(a) Consideration receivedI in Million
ParticularsIndia brands
divisionSHPL Total
Consideration received in cash and cash equivalents 4,033.01 900.00 4,933.01Total consideration 4,033.01 900.00 4,933.01
(b) Carrying value of asset and liabilities as on the date of disposalI in Million
ParticularsIndia brands
divisionSHPL Total
Non-current assets 2,301.40 950.46 3,251.86Current assets 317.38 - 317.38Non-current liabilities (4.16) (175.11) (179.27)Current liabilities (91.80) - (91.80)Net assets disposed off 2,522.82 775.35 3,298.17
(c) Gain on disposal
I in Million
ParticularsIndia brands
divisionSHPL Total
Consideration received 4,033.01 900.00 4,933.01Net assets disposed off (2,522.82) (775.35) (3,298.17)Expenses pertaining to disposal (236.00) - (236.00)Gain on disposal before tax 1,274.19 124.65 1,398.84
(d) Net cash inflow on disposal
I in Million
ParticularsYear ended
March 31, 2018Consideration received in cash and cash equivalents 4,933.01Net cash inflow 4,933.01
38.5. Financial performance of discontinued operations referred in Note 38.2 to 38.4 above: The combined results of the discontinued operations included in the profit for the year are set out below.
The comparative profit and cash flows from discontinued operations have been presented as if these operations were discontinued in the prior year as well.
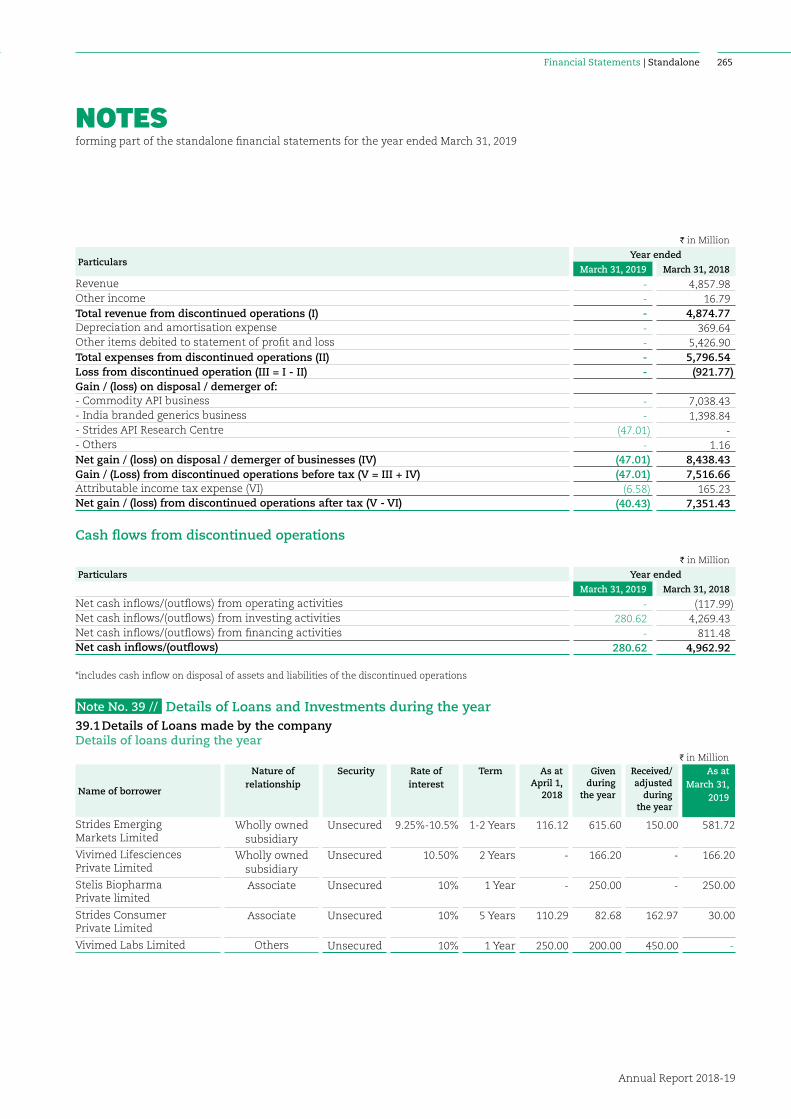
NOTESforming part of the standalone financial statements for the year ended March 31, 2019
Financial Statements | Standalone
Annual Report 2018-19
265
I in Million
ParticularsYear ended
March 31, 2019 March 31, 2018
Revenue - 4,857.98 Other income - 16.79 Total revenue from discontinued operations (I) - 4,874.77 Depreciation and amortisation expense - 369.64 Other items debited to statement of profit and loss - 5,426.90 Total expenses from discontinued operations (II) - 5,796.54 Loss from discontinued operation (III = I - II) - (921.77)Gain / (loss) on disposal / demerger of:- Commodity API business - 7,038.43 - India branded generics business - 1,398.84 - Strides API Research Centre (47.01) - - Others - 1.16 Net gain / (loss) on disposal / demerger of businesses (IV) (47.01) 8,438.43 Gain / (Loss) from discontinued operations before tax (V = III + IV) (47.01) 7,516.66 Attributable income tax expense (VI) (6.58) 165.23 Net gain / (loss) from discontinued operations after tax (V - VI) (40.43) 7,351.43
Cash flows from discontinued operations
I in Million
Particulars Year ended
March 31, 2019 March 31, 2018
Net cash inflows/(outflows) from operating activities - (117.99)Net cash inflows/(outflows) from investing activities 280.62 4,269.43 Net cash inflows/(outflows) from financing activities - 811.48 Net cash inflows/(outflows) 280.62 4,962.92
*includes cash inflow on disposal of assets and liabilities of the discontinued operations
Note No. 39 // Details of Loans and Investments during the year39.1 Details of Loans made by the companyDetails of loans during the year
I in Million
Name of borrower
Nature of relationship
Security Rate of interest
Term As at April 1,
2018
Given during
the year
Received/ adjusted
during the year
As at March 31,
2019
Strides Emerging Markets Limited
Wholly owned subsidiary
Unsecured 9.25%-10.5% 1-2 Years 116.12 615.60 150.00 581.72
Vivimed Lifesciences Private Limited
Wholly owned subsidiary
Unsecured 10.50% 2 Years - 166.20 - 166.20
Stelis Biopharma Private limited
Associate Unsecured 10% 1 Year - 250.00 - 250.00
Strides Consumer Private Limited
Associate Unsecured 10% 5 Years 110.29 82.68 162.97 30.00
Vivimed Labs Limited Others Unsecured 10% 1 Year 250.00 200.00 450.00 -
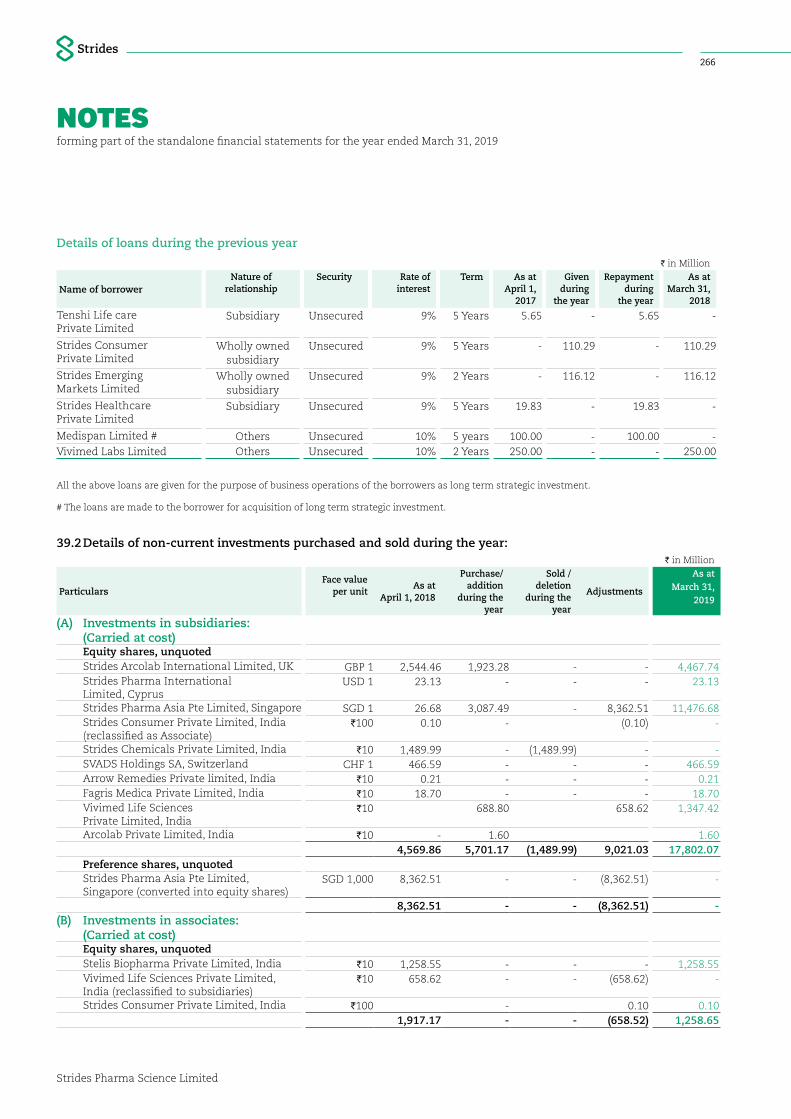
NOTESforming part of the standalone financial statements for the year ended March 31, 2019
Strides Pharma Science Limited
266
Details of loans during the previous year
I in Million
Name of borrowerNature of
relationshipSecurity Rate of
interest Term As at
April 1, 2017
Given during
the year
Repayment during
the year
As at March 31,
2018
Tenshi Life care Private Limited
Subsidiary Unsecured 9% 5 Years 5.65 - 5.65 -
Strides Consumer Private Limited
Wholly owned subsidiary
Unsecured 9% 5 Years - 110.29 - 110.29
Strides Emerging Markets Limited
Wholly owned subsidiary
Unsecured 9% 2 Years - 116.12 - 116.12
Strides Healthcare Private Limited
Subsidiary Unsecured 9% 5 Years 19.83 - 19.83 -
Medispan Limited # Others Unsecured 10% 5 years 100.00 - 100.00 - Vivimed Labs Limited Others Unsecured 10% 2 Years 250.00 - - 250.00
All the above loans are given for the purpose of business operations of the borrowers as long term strategic investment.
# The loans are made to the borrower for acquisition of long term strategic investment.
39.2 Details of non-current investments purchased and sold during the year:I in Million
ParticularsFace value
per unit As at
April 1, 2018
Purchase/ addition
during the year
Sold / deletion
during the year
Adjustments
As at March 31,
2019
(A) Investments in subsidiaries: (Carried at cost)
Equity shares, unquoted Strides Arcolab International Limited, UK GBP 1 2,544.46 1,923.28 - - 4,467.74 Strides Pharma International
Limited, CyprusUSD 1 23.13 - - - 23.13
Strides Pharma Asia Pte Limited, Singapore SGD 1 26.68 3,087.49 - 8,362.51 11,476.68 Strides Consumer Private Limited, India
(reclassified as Associate)I100 0.10 - (0.10) -
Strides Chemicals Private Limited, India I10 1,489.99 - (1,489.99) - - SVADS Holdings SA, Switzerland CHF 1 466.59 - - - 466.59 Arrow Remedies Private limited, India I10 0.21 - - - 0.21 Fagris Medica Private Limited, India I10 18.70 - - - 18.70 Vivimed Life Sciences
Private Limited, IndiaI10 688.80 658.62 1,347.42
Arcolab Private Limited, India I10 - 1.60 1.60 4,569.86 5,701.17 (1,489.99) 9,021.03 17,802.07
Preference shares, unquoted Strides Pharma Asia Pte Limited,
Singapore (converted into equity shares)SGD 1,000 8,362.51 - - (8,362.51) -
8,362.51 - - (8,362.51) - (B) Investments in associates:
(Carried at cost) Equity shares, unquoted Stelis Biopharma Private Limited, India I10 1,258.55 - - - 1,258.55 Vivimed Life Sciences Private Limited,
India (reclassified to subsidiaries)I10 658.62 - - (658.62) -
Strides Consumer Private Limited, India I100 - 0.10 0.10 1,917.17 - - (658.52) 1,258.65
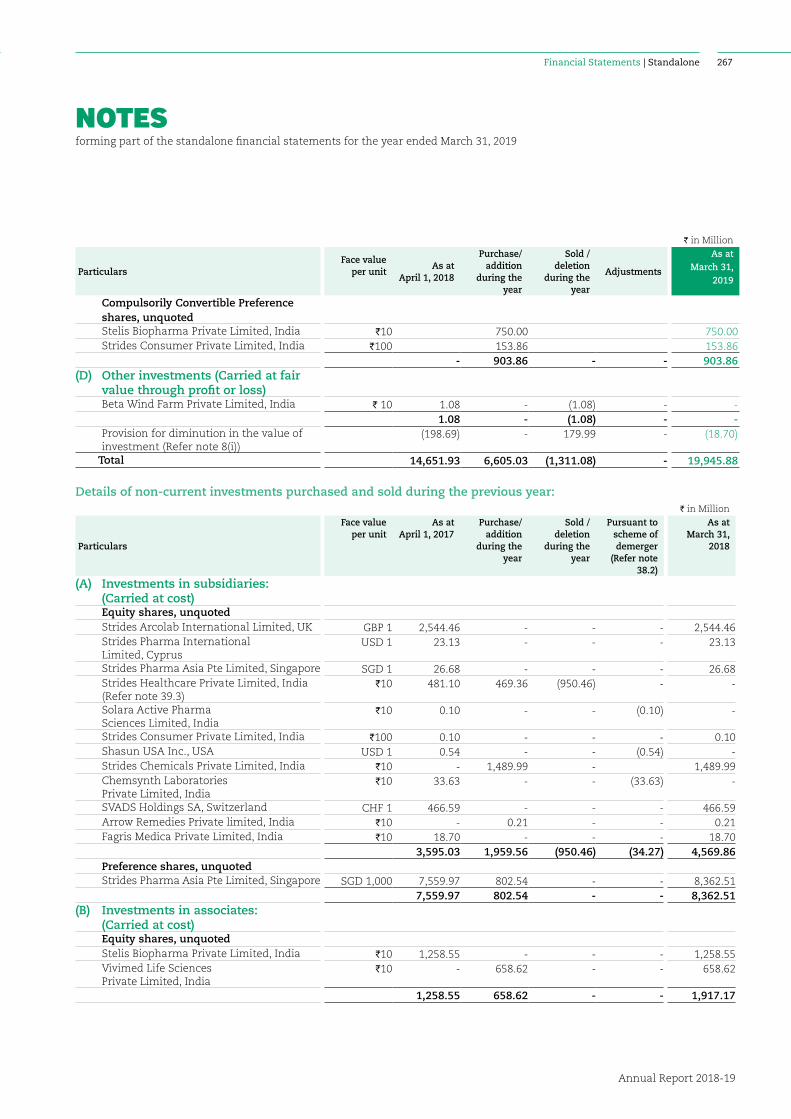
NOTESforming part of the standalone financial statements for the year ended March 31, 2019
Financial Statements | Standalone
Annual Report 2018-19
267
I in Million
ParticularsFace value
per unit As at
April 1, 2018
Purchase/ addition
during the year
Sold / deletion
during the year
Adjustments
As at March 31,
2019
Compulsorily Convertible Preference shares, unquoted
Stelis Biopharma Private Limited, India I10 750.00 750.00 Strides Consumer Private Limited, India I100 153.86 153.86 - 903.86 - - 903.86 (D) Other investments (Carried at fair
value through profit or loss) Beta Wind Farm Private Limited, India I 10 1.08 - (1.08) - -
1.08 - (1.08) - - Provision for diminution in the value of
investment (Refer note 8(i)) (198.69) - 179.99 - (18.70)
Total 14,651.93 6,605.03 (1,311.08) - 19,945.88
Details of non-current investments purchased and sold during the previous year:I in Million
Particulars
Face value per unit
As at April 1, 2017
Purchase/ addition
during the year
Sold / deletion
during the year
Pursuant to scheme of demerger
(Refer note 38.2)
As at March 31,
2018
(A) Investments in subsidiaries: (Carried at cost)
Equity shares, unquoted Strides Arcolab International Limited, UK GBP 1 2,544.46 - - - 2,544.46 Strides Pharma International
Limited, CyprusUSD 1 23.13 - - - 23.13
Strides Pharma Asia Pte Limited, Singapore SGD 1 26.68 - - - 26.68 Strides Healthcare Private Limited, India
(Refer note 39.3)I10 481.10 469.36 (950.46) - -
Solara Active Pharma Sciences Limited, India
I10 0.10 - - (0.10) -
Strides Consumer Private Limited, India I100 0.10 - - - 0.10 Shasun USA Inc., USA USD 1 0.54 - - (0.54) - Strides Chemicals Private Limited, India I10 - 1,489.99 - 1,489.99 Chemsynth Laboratories
Private Limited, IndiaI10 33.63 - - (33.63) -
SVADS Holdings SA, Switzerland CHF 1 466.59 - - - 466.59 Arrow Remedies Private limited, India I10 - 0.21 - - 0.21 Fagris Medica Private Limited, India I10 18.70 - - - 18.70
3,595.03 1,959.56 (950.46) (34.27) 4,569.86 Preference shares, unquoted Strides Pharma Asia Pte Limited, Singapore SGD 1,000 7,559.97 802.54 - - 8,362.51
7,559.97 802.54 - - 8,362.51 (B) Investments in associates:
(Carried at cost) Equity shares, unquoted Stelis Biopharma Private Limited, India I10 1,258.55 - - - 1,258.55 Vivimed Life Sciences
Private Limited, IndiaI10 - 658.62 - - 658.62
1,258.55 658.62 - - 1,917.17
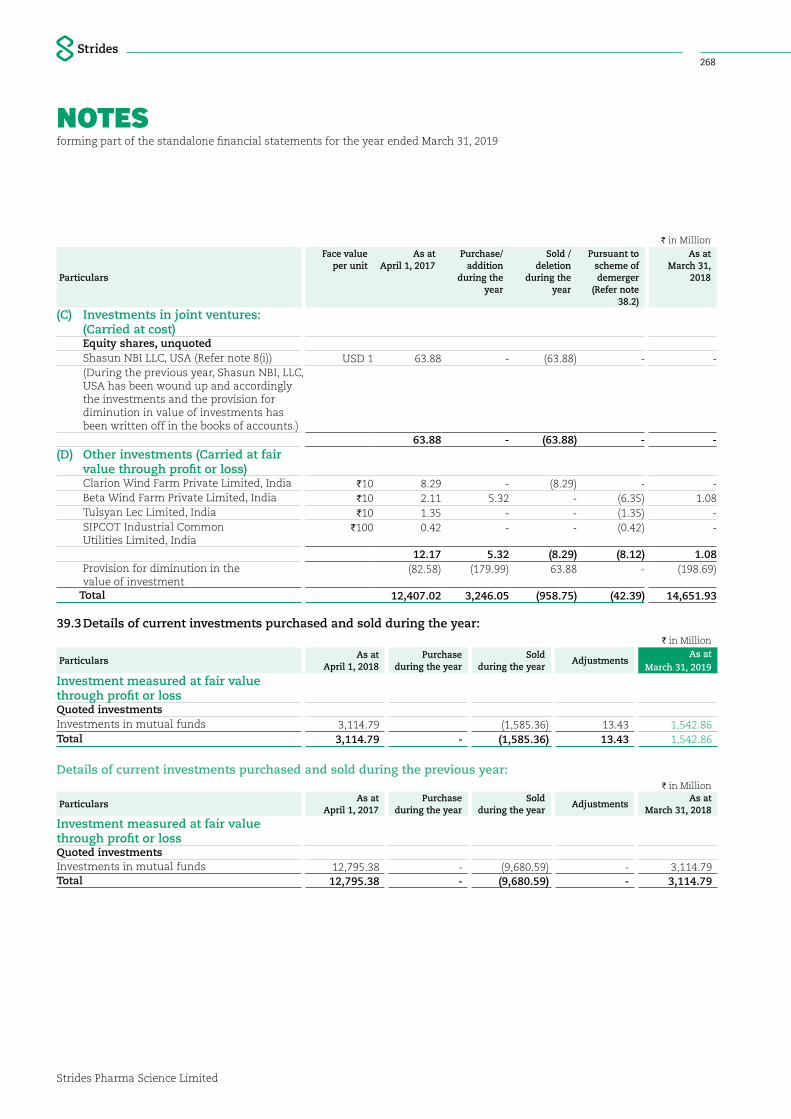
NOTESforming part of the standalone financial statements for the year ended March 31, 2019
Strides Pharma Science Limited
268
I in Million
Particulars
Face value per unit
As at April 1, 2017
Purchase/ addition
during the year
Sold / deletion
during the year
Pursuant to scheme of demerger
(Refer note 38.2)
As at March 31,
2018
(C) Investments in joint ventures: (Carried at cost)
Equity shares, unquoted Shasun NBI LLC, USA (Refer note 8(i)) USD 1 63.88 - (63.88) - - (During the previous year, Shasun NBI, LLC,
USA has been wound up and accordingly the investments and the provision for diminution in value of investments has been written off in the books of accounts.)
63.88 - (63.88) - - (D) Other investments (Carried at fair
value through profit or loss) Clarion Wind Farm Private Limited, India I10 8.29 - (8.29) - - Beta Wind Farm Private Limited, India I10 2.11 5.32 - (6.35) 1.08 Tulsyan Lec Limited, India I10 1.35 - - (1.35) - SIPCOT Industrial Common
Utilities Limited, IndiaI100 0.42 - - (0.42) -
12.17 5.32 (8.29) (8.12) 1.08 Provision for diminution in the
value of investment (82.58) (179.99) 63.88 - (198.69)
Total 12,407.02 3,246.05 (958.75) (42.39) 14,651.93
39.3 Details of current investments purchased and sold during the year:I in Million
ParticularsAs at
April 1, 2018Purchase
during the yearSold
during the yearAdjustments
As at March 31, 2019
Investment measured at fair value through profit or lossQuoted investmentsInvestments in mutual funds 3,114.79 (1,585.36) 13.43 1,542.86 Total 3,114.79 - (1,585.36) 13.43 1,542.86
Details of current investments purchased and sold during the previous year:I in Million
ParticularsAs at
April 1, 2017Purchase
during the yearSold
during the yearAdjustments
As at March 31, 2018
Investment measured at fair value through profit or lossQuoted investmentsInvestments in mutual funds 12,795.38 - (9,680.59) - 3,114.79 Total 12,795.38 - (9,680.59) - 3,114.79
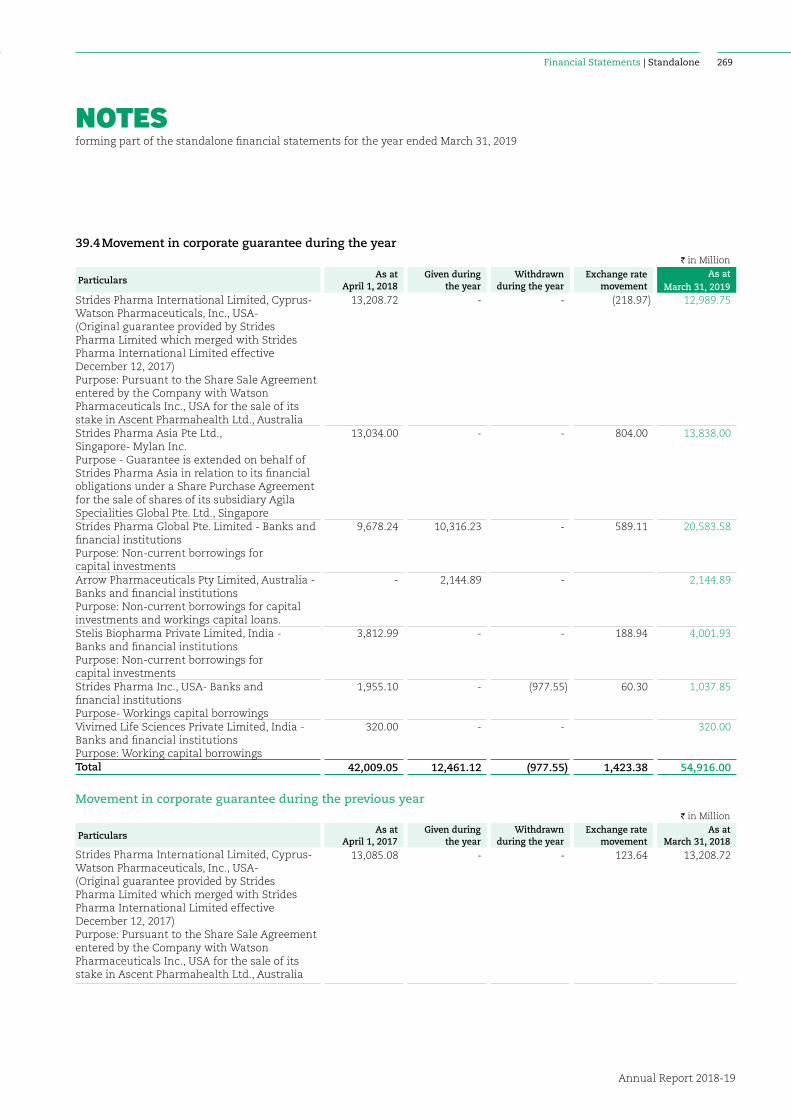
NOTESforming part of the standalone financial statements for the year ended March 31, 2019
Financial Statements | Standalone
Annual Report 2018-19
269
39.4 Movement in corporate guarantee during the yearI in Million
ParticularsAs at
April 1, 2018Given during
the yearWithdrawn
during the yearExchange rate
movementAs at
March 31, 2019Strides Pharma International Limited, Cyprus- Watson Pharmaceuticals, Inc., USA- (Original guarantee provided by Strides Pharma Limited which merged with Strides Pharma International Limited effective December 12, 2017) Purpose: Pursuant to the Share Sale Agreement entered by the Company with Watson Pharmaceuticals Inc., USA for the sale of its stake in Ascent Pharmahealth Ltd., Australia
13,208.72 - - (218.97) 12,989.75
Strides Pharma Asia Pte Ltd., Singapore- Mylan Inc. Purpose - Guarantee is extended on behalf of Strides Pharma Asia in relation to its financial obligations under a Share Purchase Agreement for the sale of shares of its subsidiary Agila Specialities Global Pte. Ltd., Singapore
13,034.00 - - 804.00 13,838.00
Strides Pharma Global Pte. Limited - Banks and financial institutions Purpose: Non-current borrowings for capital investments
9,678.24 10,316.23 - 589.11 20,583.58
Arrow Pharmaceuticals Pty Limited, Australia - Banks and financial institutions Purpose: Non-current borrowings for capital investments and workings capital loans.
- 2,144.89 - 2,144.89
Stelis Biopharma Private Limited, India - Banks and financial institutions Purpose: Non-current borrowings for capital investments
3,812.99 - - 188.94 4,001.93
Strides Pharma Inc., USA- Banks and financial institutions Purpose- Workings capital borrowings
1,955.10 - (977.55) 60.30 1,037.85
Vivimed Life Sciences Private Limited, India - Banks and financial institutions Purpose: Working capital borrowings
320.00 - - 320.00
Total 42,009.05 12,461.12 (977.55) 1,423.38 54,916.00
Movement in corporate guarantee during the previous yearI in Million
ParticularsAs at
April 1, 2017Given during
the yearWithdrawn
during the yearExchange rate
movementAs at
March 31, 2018Strides Pharma International Limited, Cyprus- Watson Pharmaceuticals, Inc., USA- (Original guarantee provided by Strides Pharma Limited which merged with Strides Pharma International Limited effective December 12, 2017) Purpose: Pursuant to the Share Sale Agreement entered by the Company with Watson Pharmaceuticals Inc., USA for the sale of its stake in Ascent Pharmahealth Ltd., Australia
13,085.08 - - 123.64 13,208.72
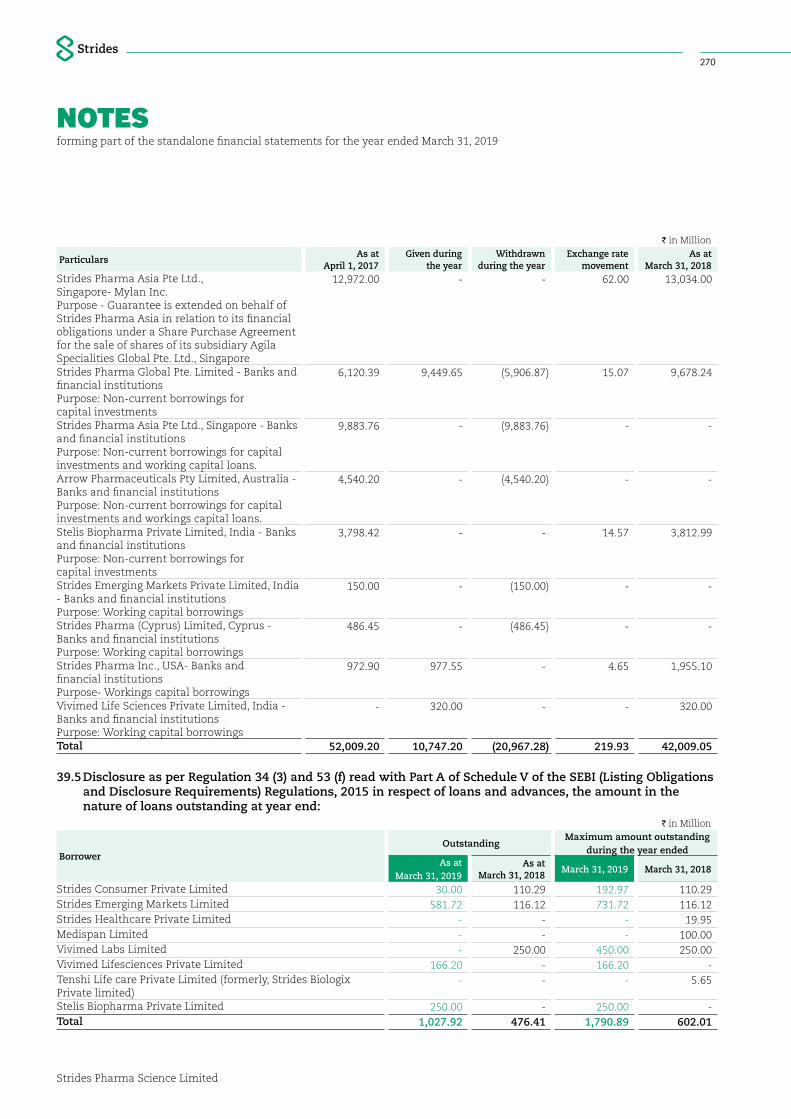
NOTESforming part of the standalone financial statements for the year ended March 31, 2019
Strides Pharma Science Limited
270
I in Million
ParticularsAs at
April 1, 2017Given during
the yearWithdrawn
during the yearExchange rate
movementAs at
March 31, 2018Strides Pharma Asia Pte Ltd., Singapore- Mylan Inc. Purpose - Guarantee is extended on behalf of Strides Pharma Asia in relation to its financial obligations under a Share Purchase Agreement for the sale of shares of its subsidiary Agila Specialities Global Pte. Ltd., Singapore
12,972.00 - - 62.00 13,034.00
Strides Pharma Global Pte. Limited - Banks and financial institutions Purpose: Non-current borrowings for capital investments
6,120.39 9,449.65 (5,906.87) 15.07 9,678.24
Strides Pharma Asia Pte Ltd., Singapore - Banks and financial institutions Purpose: Non-current borrowings for capital investments and working capital loans.
9,883.76 - (9,883.76) - -
Arrow Pharmaceuticals Pty Limited, Australia - Banks and financial institutions Purpose: Non-current borrowings for capital investments and workings capital loans.
4,540.20 - (4,540.20) - -
Stelis Biopharma Private Limited, India - Banks and financial institutions Purpose: Non-current borrowings for capital investments
3,798.42 - - 14.57 3,812.99
Strides Emerging Markets Private Limited, India - Banks and financial institutions Purpose: Working capital borrowings
150.00 - (150.00) - -
Strides Pharma (Cyprus) Limited, Cyprus - Banks and financial institutions Purpose: Working capital borrowings
486.45 - (486.45) - -
Strides Pharma Inc., USA- Banks and financial institutions Purpose- Workings capital borrowings
972.90 977.55 - 4.65 1,955.10
Vivimed Life Sciences Private Limited, India - Banks and financial institutions Purpose: Working capital borrowings
- 320.00 - - 320.00
Total 52,009.20 10,747.20 (20,967.28) 219.93 42,009.05
39.5 Disclosure as per Regulation 34 (3) and 53 (f) read with Part A of Schedule V of the SEBI (Listing Obligations and Disclosure Requirements) Regulations, 2015 in respect of loans and advances, the amount in the nature of loans outstanding at year end:
I in Million
BorrowerOutstanding
Maximum amount outstanding during the year ended
As at March 31, 2019
As at March 31, 2018
March 31, 2019 March 31, 2018
Strides Consumer Private Limited 30.00 110.29 192.97 110.29 Strides Emerging Markets Limited 581.72 116.12 731.72 116.12 Strides Healthcare Private Limited - - - 19.95 Medispan Limited - - - 100.00 Vivimed Labs Limited - 250.00 450.00 250.00 Vivimed Lifesciences Private Limited 166.20 - 166.20 - Tenshi Life care Private Limited (formerly, Strides Biologix Private limited)
- - - 5.65
Stelis Biopharma Private Limited 250.00 - 250.00 - Total 1,027.92 476.41 1,790.89 602.01
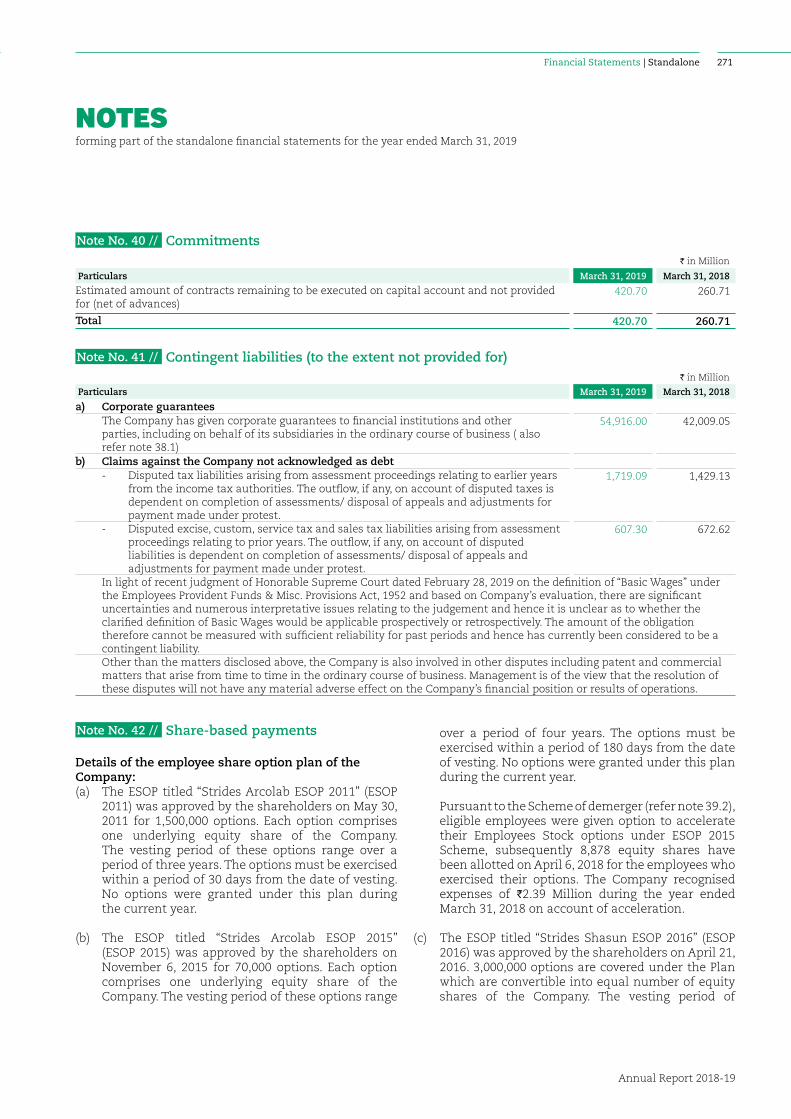
NOTESforming part of the standalone financial statements for the year ended March 31, 2019
Financial Statements | Standalone
Annual Report 2018-19
271
Note No. 40 // CommitmentsI in Million
Particulars March 31, 2019 March 31, 2018
Estimated amount of contracts remaining to be executed on capital account and not provided for (net of advances)
420.70 260.71
Total 420.70 260.71
Note No. 41 // Contingent liabilities (to the extent not provided for)I in Million
Particulars March 31, 2019 March 31, 2018
a) Corporate guarantees The Company has given corporate guarantees to financial institutions and other
parties, including on behalf of its subsidiaries in the ordinary course of business ( also refer note 38.1)
54,916.00 42,009.05
b) Claims against the Company not acknowledged as debt - Disputed tax liabilities arising from assessment proceedings relating to earlier years
from the income tax authorities. The outflow, if any, on account of disputed taxes is dependent on completion of assessments/ disposal of appeals and adjustments for payment made under protest.
1,719.09 1,429.13
- Disputed excise, custom, service tax and sales tax liabilities arising from assessment proceedings relating to prior years. The outflow, if any, on account of disputed liabilities is dependent on completion of assessments/ disposal of appeals and adjustments for payment made under protest.
607.30 672.62
In light of recent judgment of Honorable Supreme Court dated February 28, 2019 on the definition of “Basic Wages” under the Employees Provident Funds & Misc. Provisions Act, 1952 and based on Company’s evaluation, there are significant uncertainties and numerous interpretative issues relating to the judgement and hence it is unclear as to whether the clarified definition of Basic Wages would be applicable prospectively or retrospectively. The amount of the obligation therefore cannot be measured with sufficient reliability for past periods and hence has currently been considered to be a contingent liability.
Other than the matters disclosed above, the Company is also involved in other disputes including patent and commercial matters that arise from time to time in the ordinary course of business. Management is of the view that the resolution of these disputes will not have any material adverse effect on the Company’s financial position or results of operations.
Note No. 42 // Share-based payments
Details of the employee share option plan of the Company:(a) The ESOP titled “Strides Arcolab ESOP 2011” (ESOP
2011) was approved by the shareholders on May 30, 2011 for 1,500,000 options. Each option comprises one underlying equity share of the Company. The vesting period of these options range over a period of three years. The options must be exercised within a period of 30 days from the date of vesting. No options were granted under this plan during the current year.
(b) The ESOP titled “Strides Arcolab ESOP 2015” (ESOP 2015) was approved by the shareholders on November 6, 2015 for 70,000 options. Each option comprises one underlying equity share of the Company. The vesting period of these options range
over a period of four years. The options must be exercised within a period of 180 days from the date of vesting. No options were granted under this plan during the current year.
Pursuant to the Scheme of demerger (refer note 39.2), eligible employees were given option to accelerate their Employees Stock options under ESOP 2015 Scheme, subsequently 8,878 equity shares have been allotted on April 6, 2018 for the employees who exercised their options. The Company recognised expenses of I2.39 Million during the year ended March 31, 2018 on account of acceleration.
(c) The ESOP titled “Strides Shasun ESOP 2016” (ESOP 2016) was approved by the shareholders on April 21, 2016. 3,000,000 options are covered under the Plan which are convertible into equal number of equity shares of the Company. The vesting period of
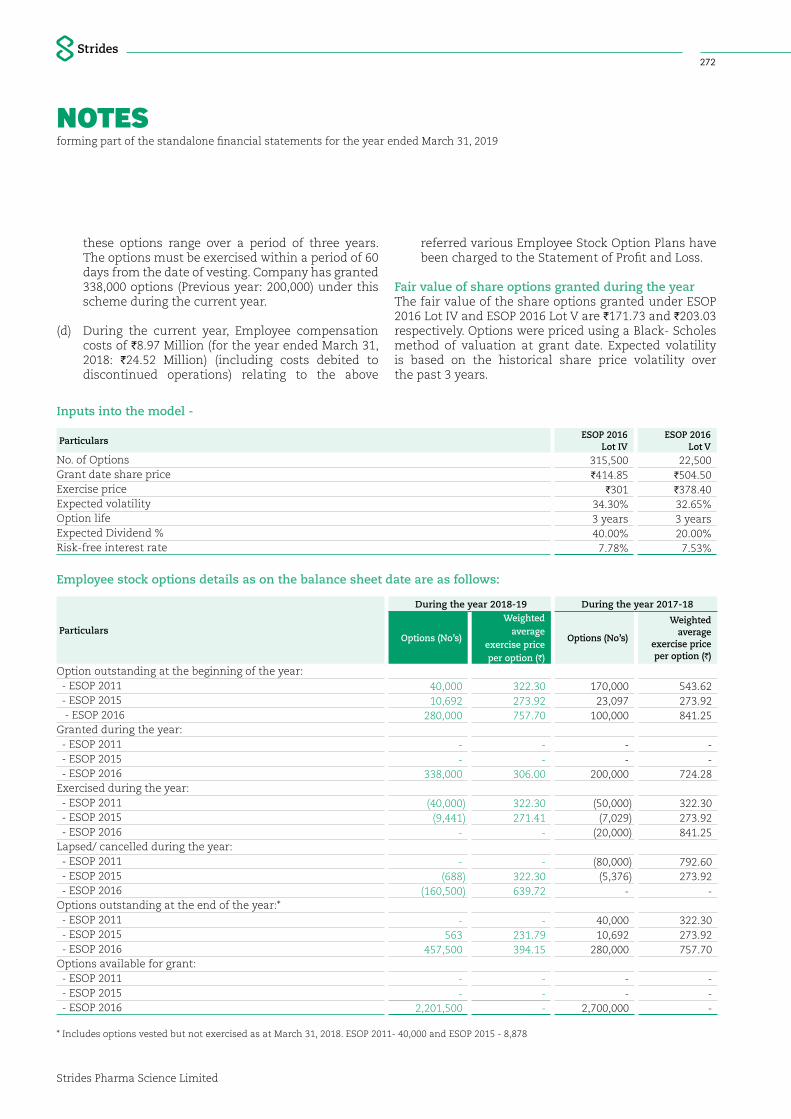
NOTESforming part of the standalone financial statements for the year ended March 31, 2019
Strides Pharma Science Limited
272
these options range over a period of three years. The options must be exercised within a period of 60 days from the date of vesting. Company has granted 338,000 options (Previous year: 200,000) under this scheme during the current year.
(d) During the current year, Employee compensation costs of I8.97 Million (for the year ended March 31, 2018: I24.52 Million) (including costs debited to discontinued operations) relating to the above
referred various Employee Stock Option Plans have been charged to the Statement of Profit and Loss.
Fair value of share options granted during the yearThe fair value of the share options granted under ESOP 2016 Lot IV and ESOP 2016 Lot V are I171.73 and I203.03 respectively. Options were priced using a Black- Scholes method of valuation at grant date. Expected volatility is based on the historical share price volatility over the past 3 years.
Inputs into the model -
ParticularsESOP 2016
Lot IVESOP 2016
Lot VNo. of Options 315,500 22,500 Grant date share price I414.85 I504.50 Exercise price I301 I378.40 Expected volatility 34.30% 32.65%Option life 3 years 3 years Expected Dividend % 40.00% 20.00%Risk-free interest rate 7.78% 7.53%
Employee stock options details as on the balance sheet date are as follows:
Particulars
During the year 2018-19 During the year 2017-18
Options (No’s)
Weighted average
exercise price per option (I)
Options (No’s)
Weighted average
exercise price per option (I)
Option outstanding at the beginning of the year: - ESOP 2011 40,000 322.30 170,000 543.62 - ESOP 2015 10,692 273.92 23,097 273.92 - ESOP 2016 280,000 757.70 100,000 841.25 Granted during the year: - ESOP 2011 - - - - - ESOP 2015 - - - - - ESOP 2016 338,000 306.00 200,000 724.28 Exercised during the year: - ESOP 2011 (40,000) 322.30 (50,000) 322.30 - ESOP 2015 (9,441) 271.41 (7,029) 273.92 - ESOP 2016 - - (20,000) 841.25 Lapsed/ cancelled during the year: - ESOP 2011 - - (80,000) 792.60 - ESOP 2015 (688) 322.30 (5,376) 273.92 - ESOP 2016 (160,500) 639.72 - - Options outstanding at the end of the year:* - ESOP 2011 - - 40,000 322.30 - ESOP 2015 563 231.79 10,692 273.92 - ESOP 2016 457,500 394.15 280,000 757.70 Options available for grant: - ESOP 2011 - - - - - ESOP 2015 - - - - - ESOP 2016 2,201,500 - 2,700,000 -
* Includes options vested but not exercised as at March 31, 2018. ESOP 2011- 40,000 and ESOP 2015 - 8,878
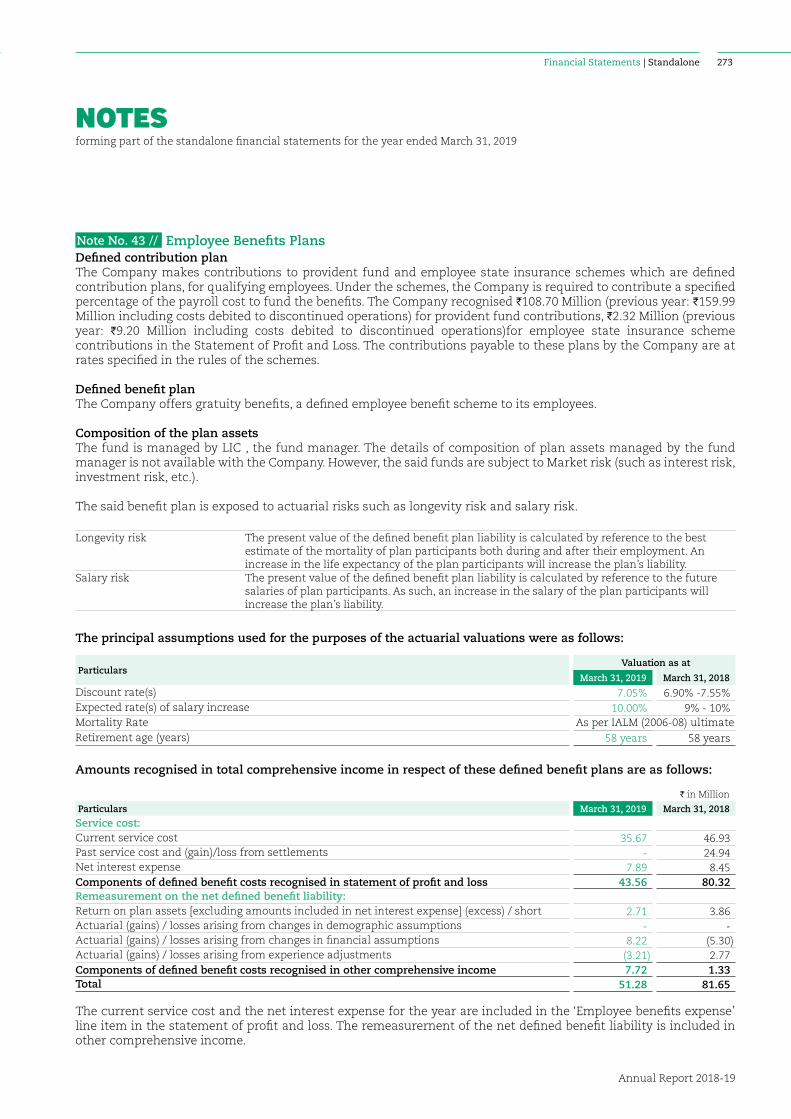
NOTESforming part of the standalone financial statements for the year ended March 31, 2019
Financial Statements | Standalone
Annual Report 2018-19
273
Note No. 43 // Employee Benefits Plans Defined contribution planThe Company makes contributions to provident fund and employee state insurance schemes which are defined contribution plans, for qualifying employees. Under the schemes, the Company is required to contribute a specified percentage of the payroll cost to fund the benefits. The Company recognised I108.70 Million (previous year: I159.99 Million including costs debited to discontinued operations) for provident fund contributions, I2.32 Million (previous year: I9.20 Million including costs debited to discontinued operations)for employee state insurance scheme contributions in the Statement of Profit and Loss. The contributions payable to these plans by the Company are at rates specified in the rules of the schemes.
Defined benefit planThe Company offers gratuity benefits, a defined employee benefit scheme to its employees.
Composition of the plan assets The fund is managed by LIC , the fund manager. The details of composition of plan assets managed by the fund manager is not available with the Company. However, the said funds are subject to Market risk (such as interest risk, investment risk, etc.).
The said benefit plan is exposed to actuarial risks such as longevity risk and salary risk.
Longevity risk The present value of the defined benefit plan liability is calculated by reference to the best estimate of the mortality of plan participants both during and after their employment. An increase in the life expectancy of the plan participants will increase the plan’s liability.
Salary risk The present value of the defined benefit plan liability is calculated by reference to the future salaries of plan participants. As such, an increase in the salary of the plan participants will increase the plan’s liability.
The principal assumptions used for the purposes of the actuarial valuations were as follows:
ParticularsValuation as at
March 31, 2019 March 31, 2018
Discount rate(s) 7.05% 6.90% -7.55% Expected rate(s) of salary increase 10.00% 9% - 10%Mortality Rate As per IALM (2006-08) ultimate Retirement age (years) 58 years 58 years
Amounts recognised in total comprehensive income in respect of these defined benefit plans are as follows:
I in Million
Particulars March 31, 2019 March 31, 2018
Service cost:Current service cost 35.67 46.93 Past service cost and (gain)/loss from settlements - 24.94 Net interest expense 7.89 8.45 Components of defined benefit costs recognised in statement of profit and loss 43.56 80.32 Remeasurement on the net defined benefit liability:Return on plan assets [excluding amounts included in net interest expense] (excess) / short 2.71 3.86 Actuarial (gains) / losses arising from changes in demographic assumptions - - Actuarial (gains) / losses arising from changes in financial assumptions 8.22 (5.30)Actuarial (gains) / losses arising from experience adjustments (3.21) 2.77 Components of defined benefit costs recognised in other comprehensive income 7.72 1.33 Total 51.28 81.65
The current service cost and the net interest expense for the year are included in the ‘Employee benefits expense’ line item in the statement of profit and loss. The remeasurernent of the net defined benefit liability is included in other comprehensive income.
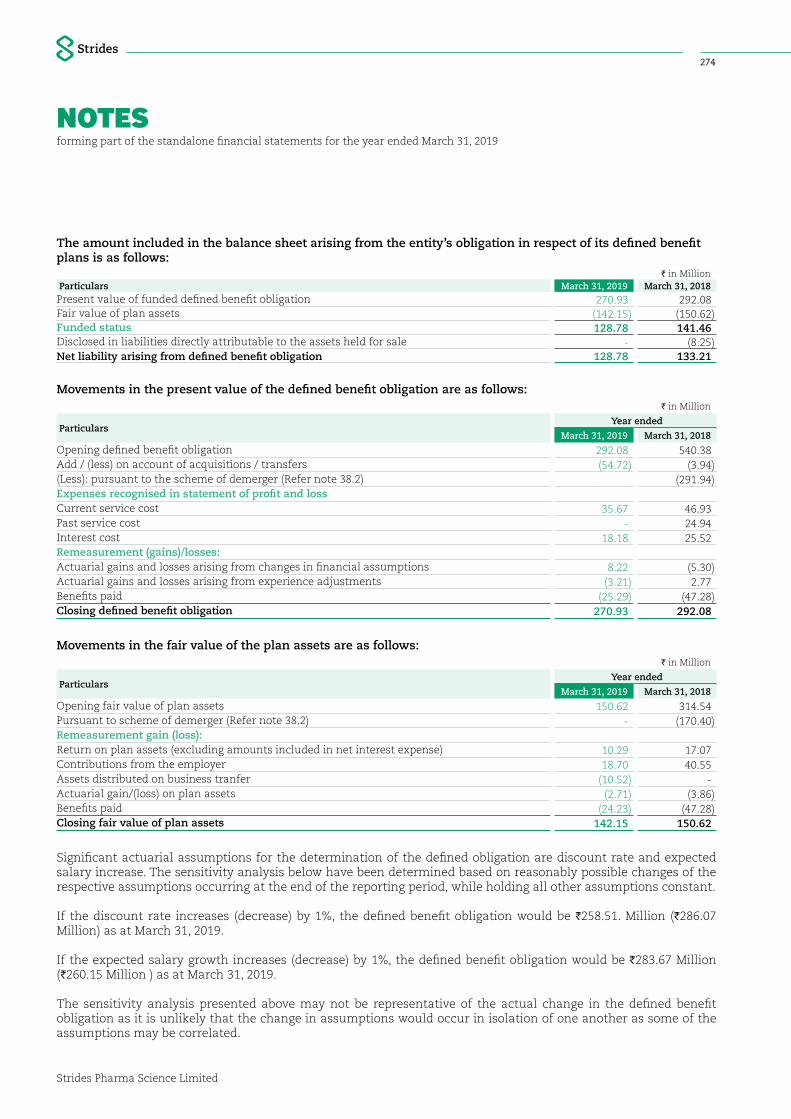
NOTESforming part of the standalone financial statements for the year ended March 31, 2019
Strides Pharma Science Limited
274
The amount included in the balance sheet arising from the entity’s obligation in respect of its defined benefit plans is as follows:
I in MillionParticulars March 31, 2019 March 31, 2018Present value of funded defined benefit obligation 270.93 292.08 Fair value of plan assets (142.15) (150.62)Funded status 128.78 141.46 Disclosed in liabilities directly attributable to the assets held for sale - (8.25)Net liability arising from defined benefit obligation 128.78 133.21
Movements in the present value of the defined benefit obligation are as follows:I in Million
ParticularsYear ended
March 31, 2019 March 31, 2018
Opening defined benefit obligation 292.08 540.38 Add / (less) on account of acquisitions / transfers (54.72) (3.94)(Less): pursuant to the scheme of demerger (Refer note 38.2) (291.94)Expenses recognised in statement of profit and loss Current service cost 35.67 46.93 Past service cost - 24.94 Interest cost 18.18 25.52 Remeasurement (gains)/losses:Actuarial gains and losses arising from changes in financial assumptions 8.22 (5.30)Actuarial gains and losses arising from experience adjustments (3.21) 2.77 Benefits paid (25.29) (47.28)Closing defined benefit obligation 270.93 292.08
Movements in the fair value of the plan assets are as follows:I in Million
ParticularsYear ended
March 31, 2019 March 31, 2018
Opening fair value of plan assets 150.62 314.54 Pursuant to scheme of demerger (Refer note 38.2) - (170.40)Remeasurement gain (loss):Return on plan assets (excluding amounts included in net interest expense) 10.29 17.07 Contributions from the employer 18.70 40.55 Assets distributed on business tranfer (10.52) - Actuarial gain/(loss) on plan assets (2.71) (3.86)Benefits paid (24.23) (47.28)Closing fair value of plan assets 142.15 150.62
Significant actuarial assumptions for the determination of the defined obligation are discount rate and expected salary increase. The sensitivity analysis below have been determined based on reasonably possible changes of the respective assumptions occurring at the end of the reporting period, while holding all other assumptions constant.
If the discount rate increases (decrease) by 1%, the defined benefit obligation would be I258.51. Million (I286.07 Million) as at March 31, 2019.
If the expected salary growth increases (decrease) by 1%, the defined benefit obligation would be I283.67 Million (I260.15 Million ) as at March 31, 2019.
The sensitivity analysis presented above may not be representative of the actual change in the defined benefit obligation as it is unlikely that the change in assumptions would occur in isolation of one another as some of the assumptions may be correlated.
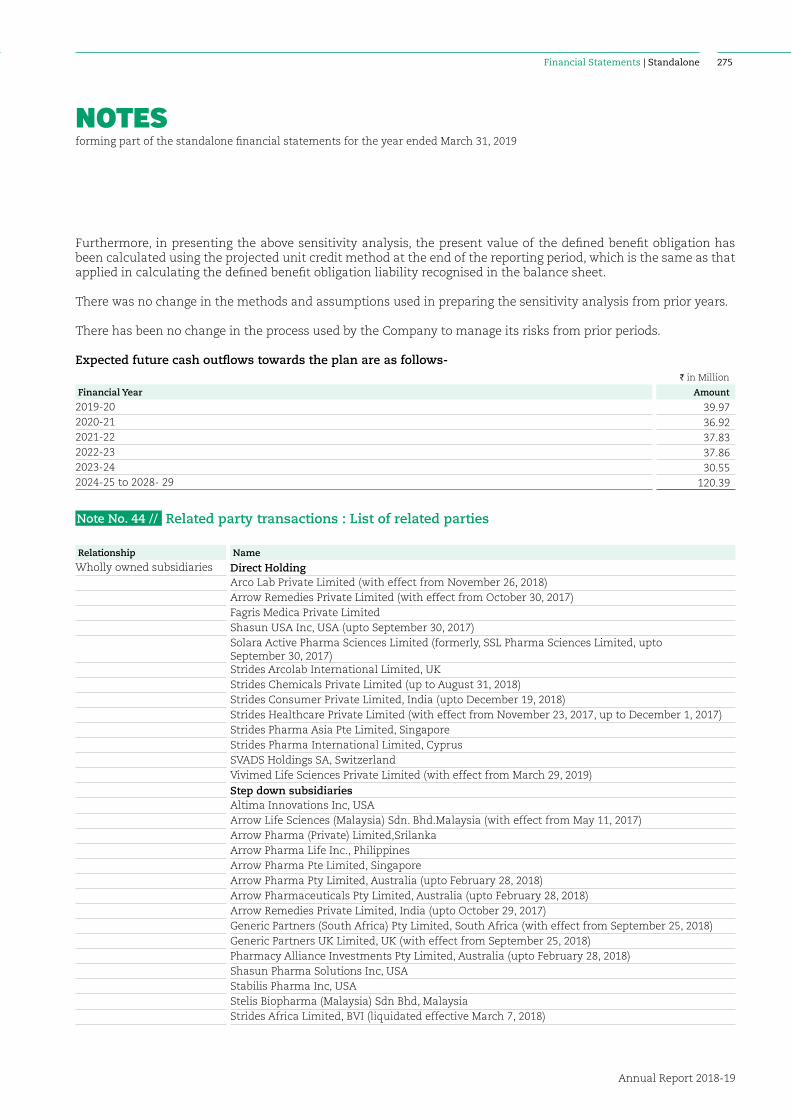
NOTESforming part of the standalone financial statements for the year ended March 31, 2019
Financial Statements | Standalone
Annual Report 2018-19
275
Furthermore, in presenting the above sensitivity analysis, the present value of the defined benefit obligation has been calculated using the projected unit credit method at the end of the reporting period, which is the same as that applied in calculating the defined benefit obligation liability recognised in the balance sheet.
There was no change in the methods and assumptions used in preparing the sensitivity analysis from prior years.
There has been no change in the process used by the Company to manage its risks from prior periods.
Expected future cash outflows towards the plan are as follows-I in Million
Financial Year Amount
2019-20 39.97 2020-21 36.92 2021-22 37.83 2022-23 37.86 2023-24 30.55 2024-25 to 2028- 29 120.39
Note No. 44 // Related party transactions : List of related parties
Relationship Name
Wholly owned subsidiaries Direct HoldingArco Lab Private Limited (with effect from November 26, 2018)Arrow Remedies Private Limited (with effect from October 30, 2017)Fagris Medica Private Limited Shasun USA Inc, USA (upto September 30, 2017)Solara Active Pharma Sciences Limited (formerly, SSL Pharma Sciences Limited, upto September 30, 2017)Strides Arcolab International Limited, UKStrides Chemicals Private Limited (up to August 31, 2018)Strides Consumer Private Limited, India (upto December 19, 2018)Strides Healthcare Private Limited (with effect from November 23, 2017, up to December 1, 2017)Strides Pharma Asia Pte Limited, SingaporeStrides Pharma International Limited, CyprusSVADS Holdings SA, SwitzerlandVivimed Life Sciences Private Limited (with effect from March 29, 2019)
Step down subsidiariesAltima Innovations Inc, USAArrow Life Sciences (Malaysia) Sdn. Bhd.Malaysia (with effect from May 11, 2017)Arrow Pharma (Private) Limited,Srilanka Arrow Pharma Life Inc., Philippines Arrow Pharma Pte Limited, Singapore Arrow Pharma Pty Limited, Australia (upto February 28, 2018)Arrow Pharmaceuticals Pty Limited, Australia (upto February 28, 2018)Arrow Remedies Private Limited, India (upto October 29, 2017)Generic Partners (South Africa) Pty Limited, South Africa (with effect from September 25, 2018)Generic Partners UK Limited, UK (with effect from September 25, 2018)Pharmacy Alliance Investments Pty Limited, Australia (upto February 28, 2018)Shasun Pharma Solutions Inc, USAStabilis Pharma Inc, USAStelis Biopharma (Malaysia) Sdn Bhd, Malaysia Strides Africa Limited, BVI (liquidated effective March 7, 2018)
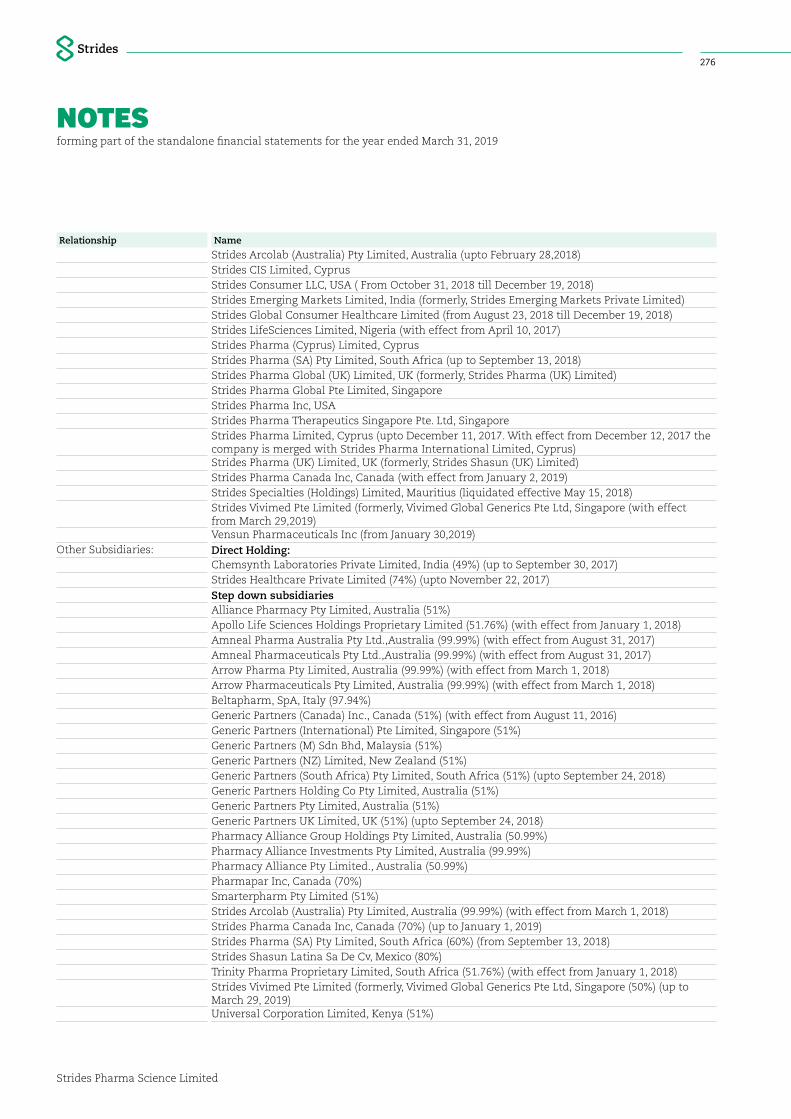
NOTESforming part of the standalone financial statements for the year ended March 31, 2019
Strides Pharma Science Limited
276
Relationship Name
Strides Arcolab (Australia) Pty Limited, Australia (upto February 28,2018)Strides CIS Limited, CyprusStrides Consumer LLC, USA ( From October 31, 2018 till December 19, 2018)Strides Emerging Markets Limited, India (formerly, Strides Emerging Markets Private Limited)Strides Global Consumer Healthcare Limited (from August 23, 2018 till December 19, 2018)Strides LifeSciences Limited, Nigeria (with effect from April 10, 2017)Strides Pharma (Cyprus) Limited, CyprusStrides Pharma (SA) Pty Limited, South Africa (up to September 13, 2018)Strides Pharma Global (UK) Limited, UK (formerly, Strides Pharma (UK) Limited)Strides Pharma Global Pte Limited, SingaporeStrides Pharma Inc, USAStrides Pharma Therapeutics Singapore Pte. Ltd, SingaporeStrides Pharma Limited, Cyprus (upto December 11, 2017. With effect from December 12, 2017 the company is merged with Strides Pharma International Limited, Cyprus)Strides Pharma (UK) Limited, UK (formerly, Strides Shasun (UK) Limited)Strides Pharma Canada Inc, Canada (with effect from January 2, 2019)Strides Specialties (Holdings) Limited, Mauritius (liquidated effective May 15, 2018)Strides Vivimed Pte Limited (formerly, Vivimed Global Generics Pte Ltd, Singapore (with effect from March 29,2019)Vensun Pharmaceuticals Inc (from January 30,2019)
Other Subsidiaries: Direct Holding: Chemsynth Laboratories Private Limited, India (49%) (up to September 30, 2017)Strides Healthcare Private Limited (74%) (upto November 22, 2017)
Step down subsidiariesAlliance Pharmacy Pty Limited, Australia (51%)Apollo Life Sciences Holdings Proprietary Limited (51.76%) (with effect from January 1, 2018) Amneal Pharma Australia Pty Ltd.,Australia (99.99%) (with effect from August 31, 2017) Amneal Pharmaceuticals Pty Ltd.,Australia (99.99%) (with effect from August 31, 2017) Arrow Pharma Pty Limited, Australia (99.99%) (with effect from March 1, 2018) Arrow Pharmaceuticals Pty Limited, Australia (99.99%) (with effect from March 1, 2018) Beltapharm, SpA, Italy (97.94%)Generic Partners (Canada) Inc., Canada (51%) (with effect from August 11, 2016) Generic Partners (International) Pte Limited, Singapore (51%)Generic Partners (M) Sdn Bhd, Malaysia (51%)Generic Partners (NZ) Limited, New Zealand (51%)Generic Partners (South Africa) Pty Limited, South Africa (51%) (upto September 24, 2018)Generic Partners Holding Co Pty Limited, Australia (51%)Generic Partners Pty Limited, Australia (51%)Generic Partners UK Limited, UK (51%) (upto September 24, 2018) Pharmacy Alliance Group Holdings Pty Limited, Australia (50.99%)Pharmacy Alliance Investments Pty Limited, Australia (99.99%)Pharmacy Alliance Pty Limited., Australia (50.99%)Pharmapar Inc, Canada (70%)Smarterpharm Pty Limited (51%)Strides Arcolab (Australia) Pty Limited, Australia (99.99%) (with effect from March 1, 2018) Strides Pharma Canada Inc, Canada (70%) (up to January 1, 2019) Strides Pharma (SA) Pty Limited, South Africa (60%) (from September 13, 2018) Strides Shasun Latina Sa De Cv, Mexico (80%) Trinity Pharma Proprietary Limited, South Africa (51.76%) (with effect from January 1, 2018) Strides Vivimed Pte Limited (formerly, Vivimed Global Generics Pte Ltd, Singapore (50%) (up to March 29, 2019) Universal Corporation Limited, Kenya (51%)
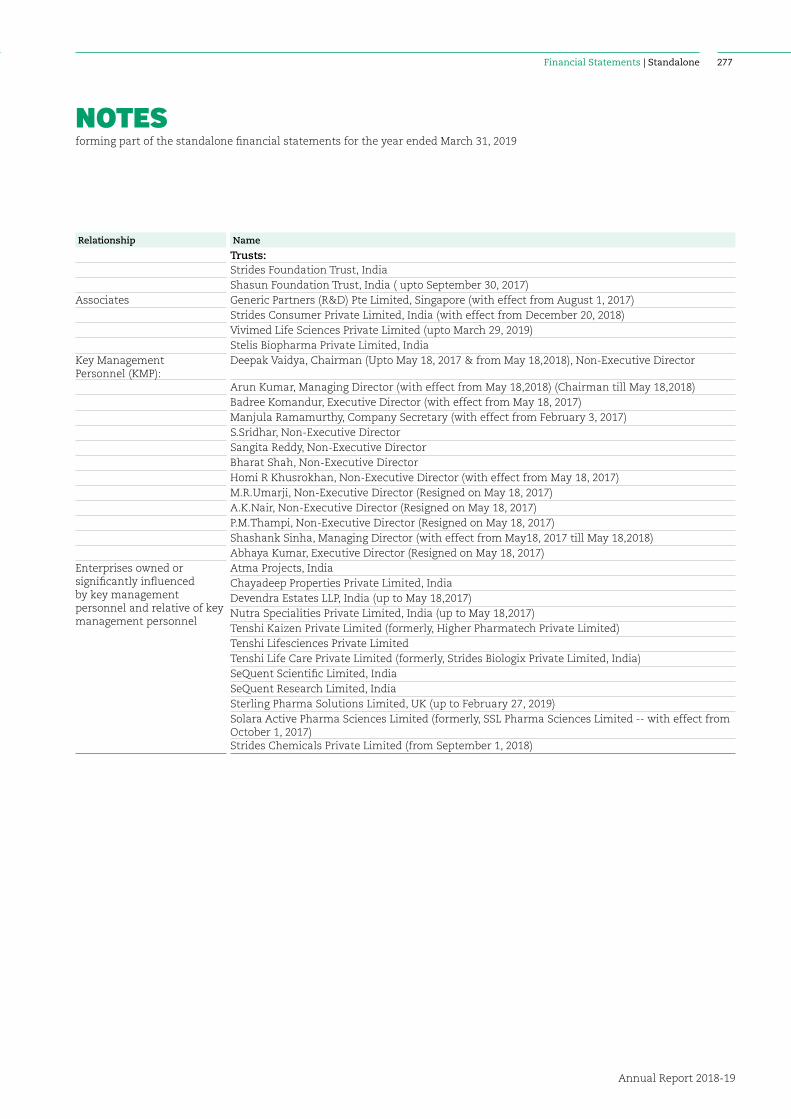
NOTESforming part of the standalone financial statements for the year ended March 31, 2019
Financial Statements | Standalone
Annual Report 2018-19
277
Relationship Name
Trusts:Strides Foundation Trust, IndiaShasun Foundation Trust, India ( upto September 30, 2017)
Associates Generic Partners (R&D) Pte Limited, Singapore (with effect from August 1, 2017)Strides Consumer Private Limited, India (with effect from December 20, 2018)Vivimed Life Sciences Private Limited (upto March 29, 2019)Stelis Biopharma Private Limited, India
Key Management Personnel (KMP):
Deepak Vaidya, Chairman (Upto May 18, 2017 & from May 18,2018), Non-Executive Director
Arun Kumar, Managing Director (with effect from May 18,2018) (Chairman till May 18,2018)Badree Komandur, Executive Director (with effect from May 18, 2017)Manjula Ramamurthy, Company Secretary (with effect from February 3, 2017)S.Sridhar, Non-Executive DirectorSangita Reddy, Non-Executive DirectorBharat Shah, Non-Executive DirectorHomi R Khusrokhan, Non-Executive Director (with effect from May 18, 2017)M.R.Umarji, Non-Executive Director (Resigned on May 18, 2017)A.K.Nair, Non-Executive Director (Resigned on May 18, 2017)P.M.Thampi, Non-Executive Director (Resigned on May 18, 2017)Shashank Sinha, Managing Director (with effect from May18, 2017 till May 18,2018) Abhaya Kumar, Executive Director (Resigned on May 18, 2017)
Enterprises owned or significantly influenced by key management personnel and relative of key management personnel
Atma Projects, IndiaChayadeep Properties Private Limited, IndiaDevendra Estates LLP, India (up to May 18,2017)Nutra Specialities Private Limited, India (up to May 18,2017)Tenshi Kaizen Private Limited (formerly, Higher Pharmatech Private Limited)Tenshi Lifesciences Private LimitedTenshi Life Care Private Limited (formerly, Strides Biologix Private Limited, India)SeQuent Scientific Limited, IndiaSeQuent Research Limited, IndiaSterling Pharma Solutions Limited, UK (up to February 27, 2019)Solara Active Pharma Sciences Limited (formerly, SSL Pharma Sciences Limited -- with effect from October 1, 2017)Strides Chemicals Private Limited (from September 1, 2018)
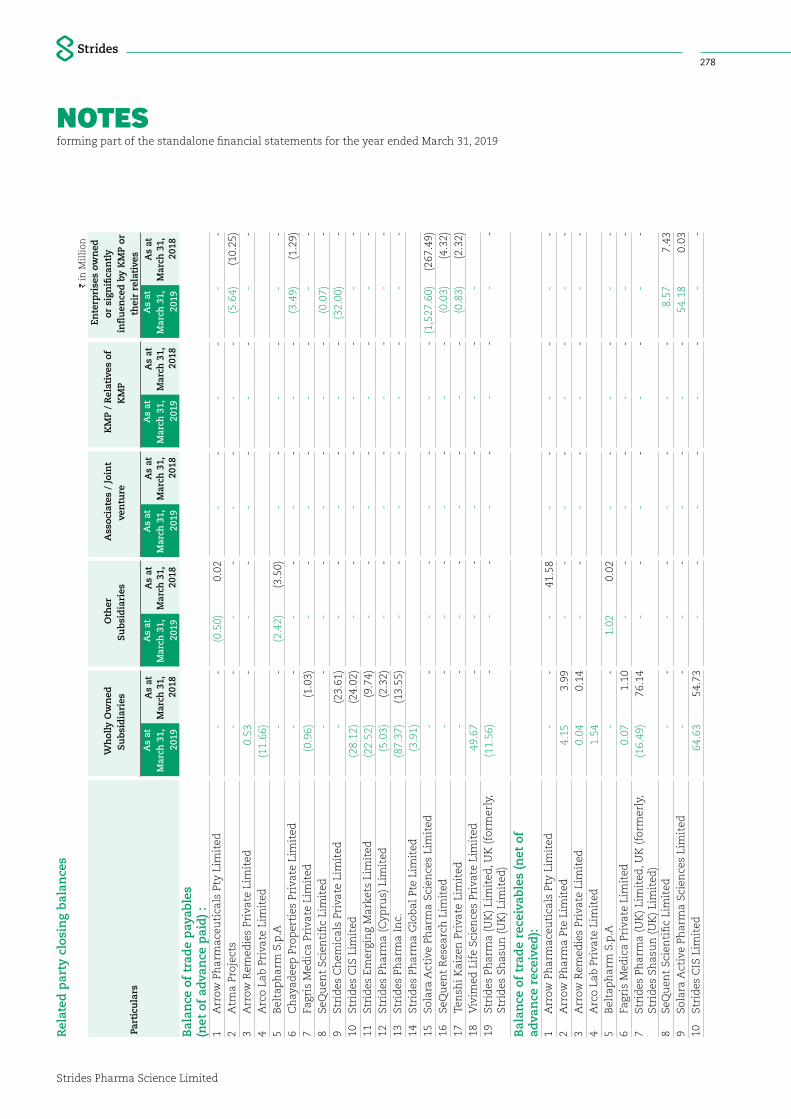
NOTESforming part of the standalone financial statements for the year ended March 31, 2019
Strides Pharma Science Limited
278
I in
Mil
lion
Part
icu
lars
Wh
olly
Ow
ned
S
ub
sid
iari
es
Oth
er
Su
bsi
dia
ries
A
ssoc
iate
s /
Join
t ve
ntu
re
KM
P /
Rel
ativ
es o
f K
MP
En
terp
rise
s ow
ned
or
sig
nifi
can
tly
infl
uen
ced
by
KM
P or
th
eir
rela
tive
s A
s at
M
arch
31,
20
19
As
at
Mar
ch 3
1,
2018
As
at
Mar
ch 3
1,
2019
As
at
Mar
ch 3
1,
2018
As
at
Mar
ch 3
1,
2019
As
at
Mar
ch 3
1,
2018
As
at
Mar
ch 3
1,
2019
As
at
Mar
ch 3
1,
2018
As
at
Mar
ch 3
1,
2019
As
at
Mar
ch 3
1,
2018
Bal
ance
of
trad
e p
ayab
les
(n
et o
f ad
van
ce p
aid
) :1
Arr
ow P
har
mac
euti
cals
Pty
Lim
ited
-
-
(0.
50)
0.0
2 -
-
-
-
-
-
2
Atm
a Pr
ojec
ts -
-
-
-
-
-
-
-
(
5.64
) (
10.2
5)3
Arr
ow R
emed
ies
Priv
ate
Lim
ited
0.5
3 -
-
-
-
-
-
-
-
-
4
Arc
o La
b P
riva
te L
imit
ed (
11.6
6)5
Bel
tap
har
m S
.p.A
-
-
(2.
42)
(3.
50)
-
-
-
-
-
-
6C
hay
adee
p P
rop
erti
es P
riva
te L
imit
ed -
-
-
-
-
-
-
-
(
3.49
) (
1.29
)7
Fagr
is M
edic
a Pr
ivat
e Li
mit
ed (
0.96
) (
1.03
) -
-
-
-
-
-
-
-
8
SeQ
uen
t Sc
ien
tifi
c Li
mit
ed -
-
-
-
-
-
-
-
(
0.07
) -
9
Stri
des
Ch
emic
als
Priv
ate
Lim
ited
-
(23
.61)
-
-
-
-
-
-
(32
.00)
-
10St
rid
es C
IS L
imit
ed (
28.1
2) (
24.0
2) -
-
-
-
-
-
-
-
11
Stri
des
Em
ergi
ng
Mar
kets
Lim
ited
(22
.52)
(9.
74)
-
-
-
-
-
-
-
-
12St
rid
es P
har
ma
(Cyp
rus)
Lim
ited
(5.
03)
(2.
32)
-
-
-
-
-
-
-
-
13St
rid
es P
har
ma
Inc.
(87
.37)
(13
.55)
-
-
-
-
-
-
-
-
14St
rid
es P
har
ma
Glo
bal
Pte
Lim
ited
(3.
91)
15So
lara
Act
ive
Phar
ma
Scie
nce
s Li
mit
ed -
-
-
-
-
-
-
-
(1
,527
.60)
(26
7.49
)16
SeQ
uen
t R
esea
rch
Lim
ited
-
-
-
-
-
-
-
-
(0.
03)
(4.
32)
17Te
nsh
i Kai
zen
Pri
vate
Lim
ited
-
-
-
-
-
-
-
-
(0.
83)
(2.
32)
18V
ivim
ed L
ife
Scie
nce
s Pr
ivat
e Li
mit
ed 4
9.67
-
-
-
-
-
-
-
-
19
Stri
des
Ph
arm
a (U
K)
Lim
ited
, UK
(fo
rmer
ly,
Stri
des
Sh
asu
n (
UK
) Li
mit
ed)
(11
.56)
-
-
-
-
-
-
-
-
-
Bal
ance
of
trad
e re
ceiv
able
s (n
et o
f ad
van
ce r
ecei
ved
):1
Arr
ow P
har
mac
euti
cals
Pty
Lim
ited
-
-
-
41.
58
-
-
-
-
-
-
2A
rrow
Ph
arm
a Pt
e Li
mit
ed 4
.15
3.9
9 -
-
-
-
-
-
-
-
3
Arr
ow R
emed
ies
Priv
ate
Lim
ited
0.0
4 0
.14
-
-
-
-
-
-
-
-
4A
rco
Lab
Pri
vate
Lim
ited
1.5
4 5
Bel
tap
har
m S
.p.A
-
-
1.0
2 0
.02
-
-
-
-
-
-
6Fa
gris
Med
ica
Priv
ate
Lim
ited
0.0
7 1
.10
-
-
-
-
-
-
-
-
7St
rid
es P
har
ma
(UK
) Li
mit
ed, U
K (
form
erly
, St
rid
es S
has
un
(U
K)
Lim
ited
) (
16.4
9) 7
6.14
-
-
-
-
-
-
-
-
8Se
Qu
ent
Scie
nti
fic
Lim
ited
-
-
-
-
-
-
-
-
8.5
7 7
.43
9So
lara
Act
ive
Phar
ma
Scie
nce
s Li
mit
ed -
-
-
-
-
-
-
-
5
4.18
0
.03
10St
rid
es C
IS L
imit
ed 6
4.63
5
4.73
-
-
-
-
-
-
-
-
Rel
ated
par
ty c
losi
ng
bal
ance
s
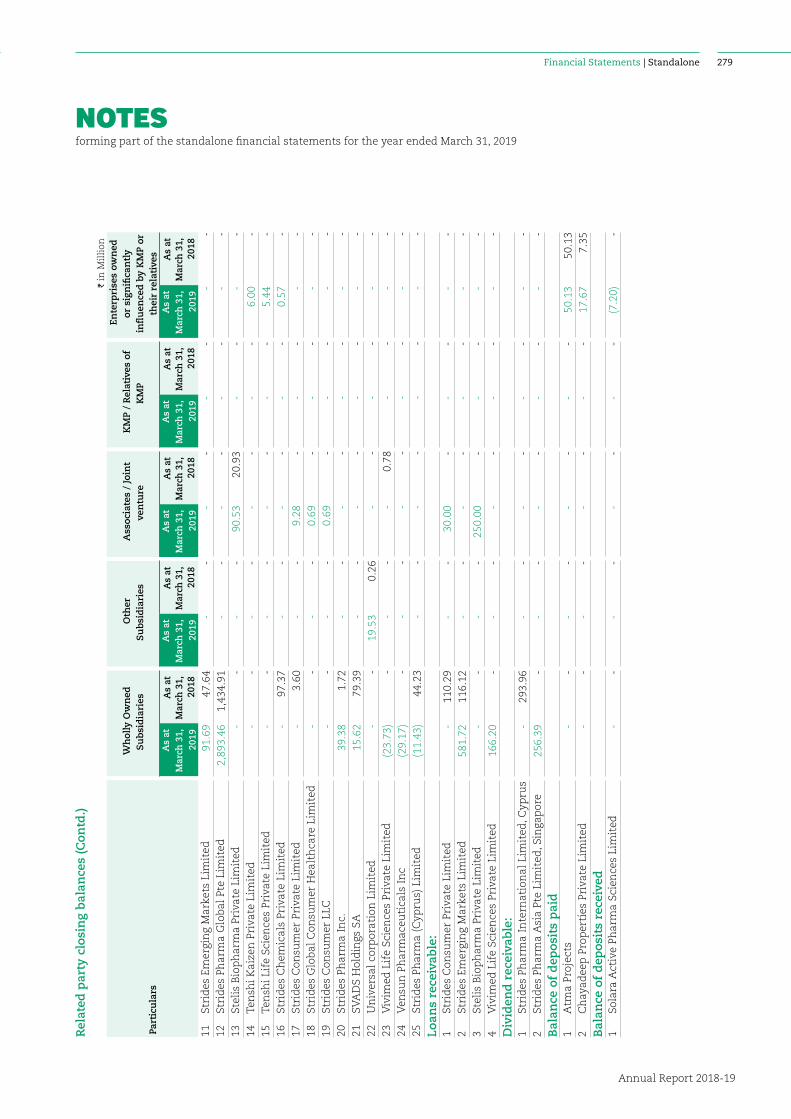
NOTESforming part of the standalone financial statements for the year ended March 31, 2019
Financial Statements | Standalone
Annual Report 2018-19
279
I in
Mil
lion
Part
icu
lars
Wh
olly
Ow
ned
S
ub
sid
iari
es
Oth
er
Su
bsi
dia
ries
A
ssoc
iate
s /
Join
t ve
ntu
re
KM
P /
Rel
ativ
es o
f K
MP
En
terp
rise
s ow
ned
or
sig
nifi
can
tly
infl
uen
ced
by
KM
P or
th
eir
rela
tive
s A
s at
M
arch
31,
20
19
As
at
Mar
ch 3
1,
2018
As
at
Mar
ch 3
1,
2019
As
at
Mar
ch 3
1,
2018
As
at
Mar
ch 3
1,
2019
As
at
Mar
ch 3
1,
2018
As
at
Mar
ch 3
1,
2019
As
at
Mar
ch 3
1,
2018
As
at
Mar
ch 3
1,
2019
As
at
Mar
ch 3
1,
2018
11St
rid
es E
mer
gin
g M
arke
ts L
imit
ed 9
1.69
4
7.64
-
-
-
-
-
-
-
-
12
Stri
des
Ph
arm
a G
lob
al P
te L
imit
ed 2
,893
.46
1,4
34.9
1 -
-
-
-
-
-
-
-
13
Stel
is B
iop
har
ma
Priv
ate
Lim
ited
-
-
-
-
90.
53
20.
93
-
-
-
-
14Te
nsh
i Kai
zen
Pri
vate
Lim
ited
-
-
-
-
-
-
-
-
6.0
0 -
15
Ten
shi L
ife
Scie
nce
s Pr
ivat
e Li
mit
ed
-
-
-
-
-
-
-
-
5.4
4 -
16
Stri
des
Ch
emic
als
Priv
ate
Lim
ited
-
97.
37
-
-
-
-
-
-
0.5
7 -
17
Stri
des
Con
sum
er P
riva
te L
imit
ed -
3
.60
-
-
9.2
8 -
-
-
-
-
18
Stri
des
Glo
bal
Con
sum
er H
ealt
hca
re L
imit
ed -
-
-
-
0
.69
-
-
-
-
-
19St
rid
es C
onsu
mer
LLC
-
-
-
-
0.6
9 -
-
-
-
-
20
Stri
des
Ph
arm
a In
c. 3
9.38
1
.72
-
-
-
-
-
-
-
-
21SV
AD
S H
old
ings
SA
15.
62
79.
39
-
-
-
-
-
-
-
-
22U
niv
ersa
l co
rpor
atio
n L
imit
ed -
-
1
9.53
0
.26
-
-
-
-
-
-
23V
ivim
ed L
ife
Scie
nce
s Pr
ivat
e Li
mit
ed (
23.7
3) -
-
-
-
0
.78
-
-
-
-
24V
ensu
n P
har
mac
euti
cals
In
c (
29.1
7) -
-
-
-
-
-
-
-
-
25
Stri
des
Ph
arm
a (C
ypru
s) L
imit
ed (
11.4
3) 4
4.23
-
-
-
-
-
-
-
-
Lo
ans
rece
ivab
le:
1St
rid
es C
onsu
mer
Pri
vate
Lim
ited
-
110
.29
-
-
30.
00
-
-
-
-
-
2St
rid
es E
mer
gin
g M
arke
ts L
imit
ed 5
81.7
2 1
16.1
2 -
-
-
-
-
-
-
-
3
Stel
is B
iop
har
ma
Priv
ate
Lim
ited
-
-
-
-
250
.00
-
-
-
-
-
4V
ivim
ed L
ife
Scie
nce
s Pr
ivat
e Li
mit
ed 1
66.2
0 -
-
-
-
-
-
-
-
-
D
ivid
end
rec
eiva
ble
:1
Stri
des
Ph
arm
a In
tern
atio
nal
Lim
ited
, Cyp
rus
-
293
.96
-
-
-
-
-
-
-
-
2St
rid
es P
har
ma
Asi
a Pt
e Li
mit
ed, S
inga
por
e 2
56.3
9 -
-
-
-
-
-
-
-
-
B
alan
ce o
f d
epos
its
pai
d1
Atm
a Pr
ojec
ts -
-
-
-
-
-
-
-
5
0.13
5
0.13
2
Ch
ayad
eep
Pro
per
ties
Pri
vate
Lim
ited
-
-
-
-
-
-
-
-
17.
67
7.3
5 B
alan
ce o
f d
epos
its
rece
ived
1So
lara
Act
ive
Phar
ma
Scie
nce
s Li
mit
ed -
-
-
-
-
-
-
-
(
7.20
) -
Rel
ated
par
ty c
losi
ng
bal
ance
s (C
ontd
.)

NOTESforming part of the standalone financial statements for the year ended March 31, 2019
Strides Pharma Science Limited
280
I in
Mil
lion
Part
icu
lars
Wh
olly
Ow
ned
S
ub
sid
iari
es
Oth
er
Su
bsi
dia
ries
A
ssoc
iate
s /
Join
t ve
ntu
re
KM
P /
Rel
ativ
es o
f K
MP
En
terp
rise
s ow
ned
or
sig
nifi
can
tly
infl
uen
ced
by
KM
P or
th
eir
rela
tive
s A
s at
M
arch
31,
20
19
As
at
Mar
ch 3
1,
2018
As
at
Mar
ch 3
1,
2019
As
at
Mar
ch 3
1,
2018
As
at
Mar
ch 3
1,
2019
As
at
Mar
ch 3
1,
2018
As
at
Mar
ch 3
1,
2019
As
at
Mar
ch 3
1,
2018
As
at
Mar
ch 3
1,
2019
As
at
Mar
ch 3
1,
2018
Oth
er fi
nan
cial
ass
ets
(lia
bil
itie
s) a
nd
oth
er
asse
ts (l
iab
ilit
ies)
1A
rrow
Rem
edie
s Pr
ivat
e Li
mit
ed
0.4
1 0
.54
-
-
-
-
-
-
-
-
2A
rrow
Ph
arm
a (P
riva
te)
Lim
ited
, Sri
Lan
ka 0
.08
0.0
8 -
-
-
-
-
-
-
-
3
Arr
ow P
har
mac
euti
cals
Pty
Lim
ited
-
-
5.0
7 4
5.73
-
-
-
-
-
-
4
Arc
o La
b P
riva
te L
imit
ed (
75.8
0)5
Fagr
is M
edic
a Pr
ivat
e Li
mit
ed 1
.22
10.
88
-
-
-
-
-
-
-
-
6So
lara
Act
ive
Phar
ma
Scie
nce
s Li
mit
ed -
-
-
-
-
-
-
-
5
51.0
0 (
250.
00)
7St
elis
Bio
ph
arm
a Pr
ivat
e Li
mit
ed -
-
-
-
1
3.62
2
.40
-
-
-
-
8St
rid
es C
hem
ical
s Pr
ivat
e Li
mit
ed -
0
.19
-
-
-
-
-
-
83.
82
-
9St
rid
es C
onsu
mer
Pri
vate
Lim
ited
-
56.
13
-
-
4.1
0 -
-
-
-
10
Stri
des
Em
ergi
ng
Mar
kets
Lim
ited
20.
62
345
.73
-
-
-
-
-
-
-
-
11St
rid
es P
har
ma
Asi
a Pt
e Li
mit
ed (
1.14
) -
-
-
-
-
-
-
-
-
12
Stri
des
Ph
arm
a (C
ypru
s) L
imit
ed 2
0.62
1
7.26
-
-
-
-
-
-
-
-
13
Stri
des
Ph
arm
a G
lob
al P
te L
imit
ed -
7
66.1
3 -
-
-
-
-
-
-
-
14
Ten
shi L
ife
Car
e Pr
ivat
e Li
mit
ed (
form
erly
, St
rid
es B
iolo
gix
Priv
ate
lim
ited
) -
-
-
-
-
-
-
-
5
.86
2.4
5
15St
rid
es P
har
ma
(UK
) Li
mit
ed, U
K (
form
erly
, St
rid
es S
has
un
(U
K)
Lim
ited
) -
3
0.23
-
-
-
-
-
-
-
-
16U
niv
ersa
l co
rpor
atio
n L
imit
ed -
-
9
.55
2.4
9 -
-
-
-
-
-
17
Ten
shi K
aize
n P
riva
te L
imit
ed (
form
erly
, H
igh
er P
har
mat
ech
Pri
vate
Lim
ited
) -
-
-
-
-
-
-
-
-
(
0.07
)
18V
ivim
ed L
ife
Scie
nce
s Pr
ivat
e Li
mit
ed 2
.06
-
-
-
-
15.
11
-
-
-
-
19M
r. B
adre
e K
oman
du
r -
-
-
-
-
-
(
3.25
) -
-
-
20
Mr.
Shas
han
k Si
nh
a -
-
-
-
-
-
-
1
.67
-
-
21M
r. A
run
Ku
mar
-
-
-
-
-
-
(10
.00)
-
-
-
22M
r. D
eep
ak V
aid
ya -
-
-
-
-
-
(1
.00)
-
-
-
23M
r. S.
Srid
har
-
-
-
-
-
-
(1.0
0) -
-
-
24
Mr.
Hom
i Ru
stam
Kh
usr
okh
an -
-
-
-
-
-
(1
.00)
-
-
-
25M
rs. S
angi
ta R
edd
y -
-
-
-
-
-
(1
.00)
-
-
-
26M
r. B
har
at S
hah
-
-
-
-
-
-
(1.0
0) -
-
-
Rel
ated
par
ty c
losi
ng
bal
ance
s (C
ontd
.)
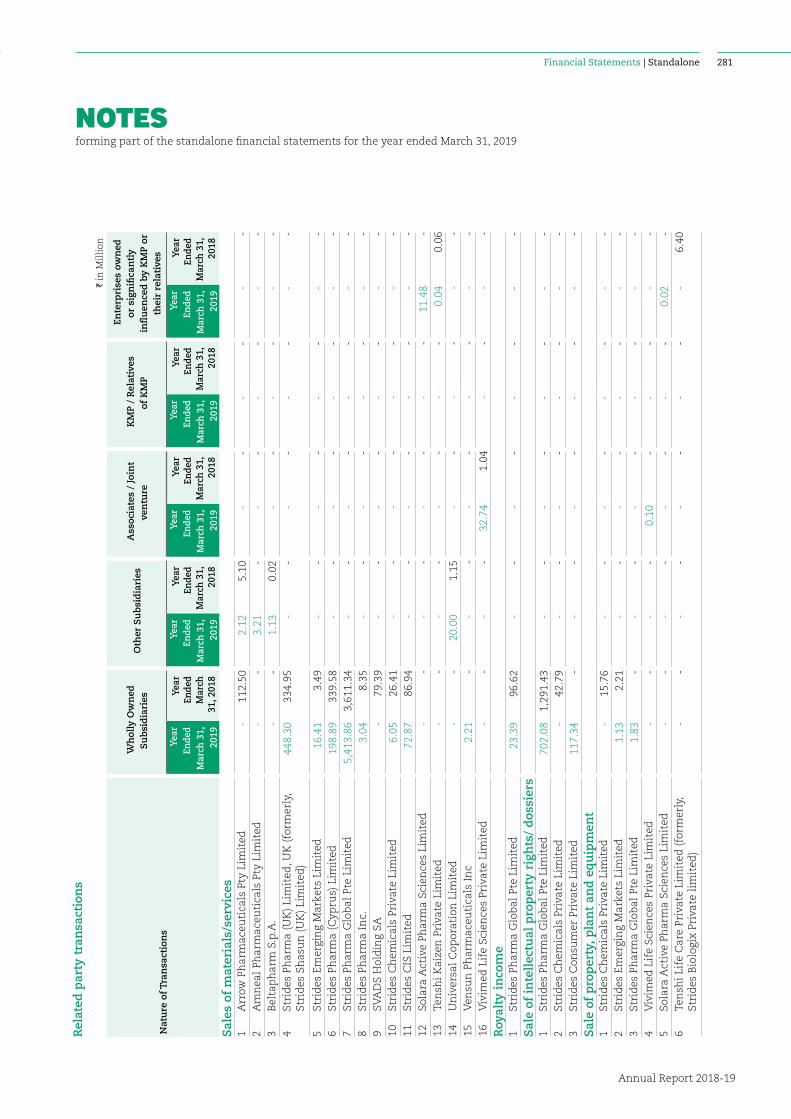
NOTESforming part of the standalone financial statements for the year ended March 31, 2019
Financial Statements | Standalone
Annual Report 2018-19
281
I in
Mil
lion
Nat
ure
of T
ran
sact
ion
s
Wh
olly
Ow
ned
S
ub
sid
iari
es
Oth
er S
ub
sid
iari
es
Ass
ocia
tes
/ Jo
int
ven
ture
K
MP
/ R
elat
ives
of
KM
P
En
terp
rise
s ow
ned
or
sig
nifi
can
tly
infl
uen
ced
by
KM
P or
th
eir
rela
tive
s
Yea
r E
nde
d M
arch
31,
20
19
Yea
r En
ded
Mar
ch
31, 2
018
Yea
r En
ded
Mar
ch 3
1,
2019
Yea
r En
ded
Mar
ch 3
1,
2018
Yea
r En
ded
Mar
ch 3
1,
2019
Yea
r En
ded
Mar
ch 3
1,
2018
Yea
r En
ded
Mar
ch 3
1,
2019
Yea
r En
ded
Mar
ch 3
1,
2018
Yea
r En
ded
Mar
ch 3
1,
2019
Yea
r En
ded
Mar
ch 3
1,
2018
Sal
es o
f m
ater
ials
/ser
vice
s1
Arr
ow P
har
mac
euti
cals
Pty
Lim
ited
-
112
.50
2.1
2 5
.10
-
-
-
-
-
-
2A
mn
eal
Phar
mac
euti
cals
Pty
Lim
ited
-
-
3.2
1 -
-
-
-
-
-
-
3
Bel
tap
har
m S
.p.A
. -
-
1
.13
0.0
2 -
-
-
-
-
-
4
Stri
des
Ph
arm
a (U
K)
Lim
ited
, UK
(fo
rmer
ly,
Stri
des
Sh
asu
n (
UK
) Li
mit
ed)
448
.30
334
.95
-
-
-
-
-
-
-
-
5St
rid
es E
mer
gin
g M
arke
ts L
imit
ed 1
6.41
3
.49
-
-
-
-
-
-
-
-
6St
rid
es P
har
ma
(Cyp
rus)
Lim
ited
198
.89
339
.58
-
-
-
-
-
-
-
-
7St
rid
es P
har
ma
Glo
bal
Pte
Lim
ited
5,4
13.8
6 3
,611
.34
-
-
-
-
-
-
-
-
8St
rid
es P
har
ma
Inc.
3.0
4 8
.35
-
-
-
-
-
-
-
-
9SV
AD
S H
old
ing
SA -
7
9.39
-
-
-
-
-
-
-
-
10
Stri
des
Ch
emic
als
Priv
ate
Lim
ited
6.0
5 2
6.41
-
-
-
-
-
-
-
-
11
Stri
des
CIS
Lim
ited
72.
87
86.
94
-
-
-
-
-
-
-
-
12So
lara
Act
ive
Phar
ma
Scie
nce
s Li
mit
ed -
-
-
-
-
-
-
-
1
1.48
-
13
Ten
shi K
aize
n P
riva
te L
imit
ed -
-
-
-
-
-
-
-
0
.04
0.0
6 14
Un
iver
sal
Cop
orat
ion
Lim
ited
-
-
20.
00
1.1
5 -
-
-
-
-
-
15
Ven
sun
Ph
arm
aceu
tica
ls I
nc
2.2
1 -
-
-
-
-
-
-
-
-
16
Viv
imed
Lif
e Sc
ien
ces
Priv
ate
Lim
ited
-
-
-
-
32.
74
1.0
4 -
-
-
-
R
oyal
ty i
nco
me
1St
rid
es P
har
ma
Glo
bal
Pte
Lim
ited
23.
39
96.
62
-
-
-
-
-
-
-
-
Sal
e of
in
tell
ectu
al p
rop
erty
rig
hts
/ d
ossi
ers
1St
rid
es P
har
ma
Glo
bal
Pte
Lim
ited
702
.08
1,2
91.4
3 -
-
-
-
-
-
-
-
2
Stri
des
Ch
emic
als
Priv
ate
Lim
ited
-
42.
79
-
-
-
-
-
-
-
-
3St
rid
es C
onsu
mer
Pri
vate
Lim
ited
117
.34
-
-
-
-
-
-
-
-
-
Sal
e of
pro
per
ty, p
lan
t an
d e
qu
ipm
ent
1St
rid
es C
hem
ical
s Pr
ivat
e Li
mit
ed -
1
5.76
-
-
-
-
-
-
-
-
2
Stri
des
Em
ergi
ng
Mar
kets
Lim
ited
1.1
3 2
.21
-
-
-
-
-
-
-
-
3St
rid
es P
har
ma
Glo
bal
Pte
Lim
ited
1.8
3 -
-
-
-
-
-
-
-
-
4
Viv
imed
Lif
e Sc
ien
ces
Priv
ate
Lim
ited
-
-
-
-
0.1
0 -
-
-
-
-
5
Sola
ra A
ctiv
e Ph
arm
a Sc
ien
ces
Lim
ited
-
-
-
-
-
-
-
-
0.0
2 -
6
Ten
shi L
ife
Car
e Pr
ivat
e Li
mit
ed (
form
erly
, St
rid
es B
iolo
gix
Priv
ate
lim
ited
) -
-
-
-
-
-
-
-
-
6
.40
Rel
ated
par
ty t
ran
sact
ion
s
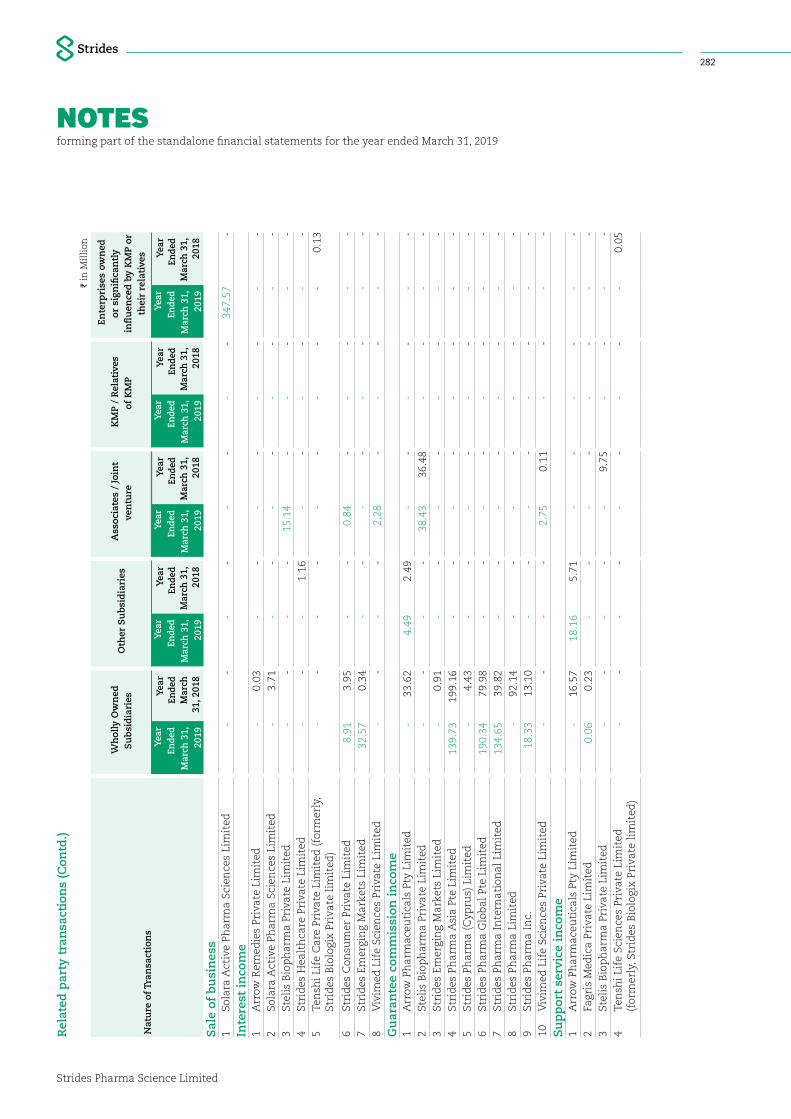
NOTESforming part of the standalone financial statements for the year ended March 31, 2019
Strides Pharma Science Limited
282
I in
Mil
lion
Nat
ure
of T
ran
sact
ion
s
Wh
olly
Ow
ned
S
ub
sid
iari
es
Oth
er S
ub
sid
iari
es
Ass
ocia
tes
/ Jo
int
ven
ture
K
MP
/ R
elat
ives
of
KM
P
En
terp
rise
s ow
ned
or
sig
nifi
can
tly
infl
uen
ced
by
KM
P or
th
eir
rela
tive
s
Yea
r E
nde
d M
arch
31,
20
19
Yea
r En
ded
Mar
ch
31, 2
018
Yea
r En
ded
Mar
ch 3
1,
2019
Yea
r En
ded
Mar
ch 3
1,
2018
Yea
r En
ded
Mar
ch 3
1,
2019
Yea
r En
ded
Mar
ch 3
1,
2018
Yea
r En
ded
Mar
ch 3
1,
2019
Yea
r En
ded
Mar
ch 3
1,
2018
Yea
r En
ded
Mar
ch 3
1,
2019
Yea
r En
ded
Mar
ch 3
1,
2018
Sal
e of
bu
sin
ess
1So
lara
Act
ive
Phar
ma
Scie
nce
s Li
mit
ed -
-
-
-
-
-
-
-
3
47.5
7 -
In
tere
st i
nco
me
1A
rrow
Rem
edie
s Pr
ivat
e Li
mit
ed -
0
.03
-
-
-
-
-
-
-
-
2So
lara
Act
ive
Phar
ma
Scie
nce
s Li
mit
ed -
3
.71
-
-
-
-
-
-
-
-
3St
elis
Bio
ph
arm
a Pr
ivat
e Li
mit
ed -
-
-
-
1
5.14
-
-
-
-
-
4
Stri
des
Hea
lth
care
Pri
vate
Lim
ited
-
-
-
1
.16
-
-
-
-
-
-
5Te
nsh
i Lif
e C
are
Priv
ate
Lim
ited
(fo
rmer
ly,
Stri
des
Bio
logi
x Pr
ivat
e li
mit
ed)
-
-
-
-
-
-
-
-
-
0.1
3
6St
rid
es C
onsu
mer
Pri
vate
Lim
ited
8.9
1 3
.95
-
-
0.8
4 -
-
-
-
-
7
Stri
des
Em
ergi
ng
Mar
kets
Lim
ited
32.
57
0.3
4 -
-
-
-
-
-
-
-
8
Viv
imed
Lif
e Sc
ien
ces
Priv
ate
Lim
ited
-
-
-
-
2.2
8 -
-
-
-
-
G
uar
ante
e co
mm
issi
on i
nco
me
1A
rrow
Ph
arm
aceu
tica
ls P
ty L
imit
ed -
3
3.62
4
.49
2.4
9 -
-
-
-
-
-
2
Stel
is B
iop
har
ma
Priv
ate
Lim
ited
-
-
-
-
3
8.43
3
6.48
-
-
-
-
3
Stri
des
Em
ergi
ng
Mar
kets
Lim
ited
-
0.9
1 -
-
-
-
-
-
-
-
4
Stri
des
Ph
arm
a A
sia
Pte
Lim
ited
139
.73
199
.16
-
-
-
-
-
-
-
-
5St
rid
es P
har
ma
(Cyp
rus)
Lim
ited
-
4.4
3 -
-
-
-
-
-
-
-
6
Stri
des
Ph
arm
a G
lob
al P
te L
imit
ed 1
90.3
4 7
9.98
-
-
-
-
-
-
-
-
7
Stri
des
Ph
arm
a In
tern
atio
nal
Lim
ited
134
.65
39.
82
-
-
-
-
-
-
-
-
8St
rid
es P
har
ma
Lim
ited
-
9
2.14
-
-
-
-
-
-
-
-
9
Stri
des
Ph
arm
a In
c. 1
8.33
1
3.10
-
-
-
-
-
-
-
-
10
Viv
imed
Lif
e Sc
ien
ces
Priv
ate
Lim
ited
-
-
-
-
2.7
5 0
.11
-
-
-
-
Su
pp
ort
serv
ice
inco
me
1A
rrow
Ph
arm
aceu
tica
ls P
ty L
imit
ed -
1
6.57
1
8.16
5
.71
-
-
-
-
-
-
2Fa
gris
Med
ica
Priv
ate
Lim
ited
0.0
6 0
.23
-
-
-
-
-
-
-
-
3St
elis
Bio
ph
arm
a Pr
ivat
e Li
mit
ed
-
-
-
-
-
9.7
5 -
-
-
-
4
Ten
shi L
ife
Scie
nce
s Pr
ivat
e Li
mit
ed
(for
mer
ly, S
trid
es B
iolo
gix
Priv
ate
lim
ited
) -
-
-
-
-
-
-
-
-
0
.05
Rel
ated
par
ty t
ran
sact
ion
s (C
ontd
.)
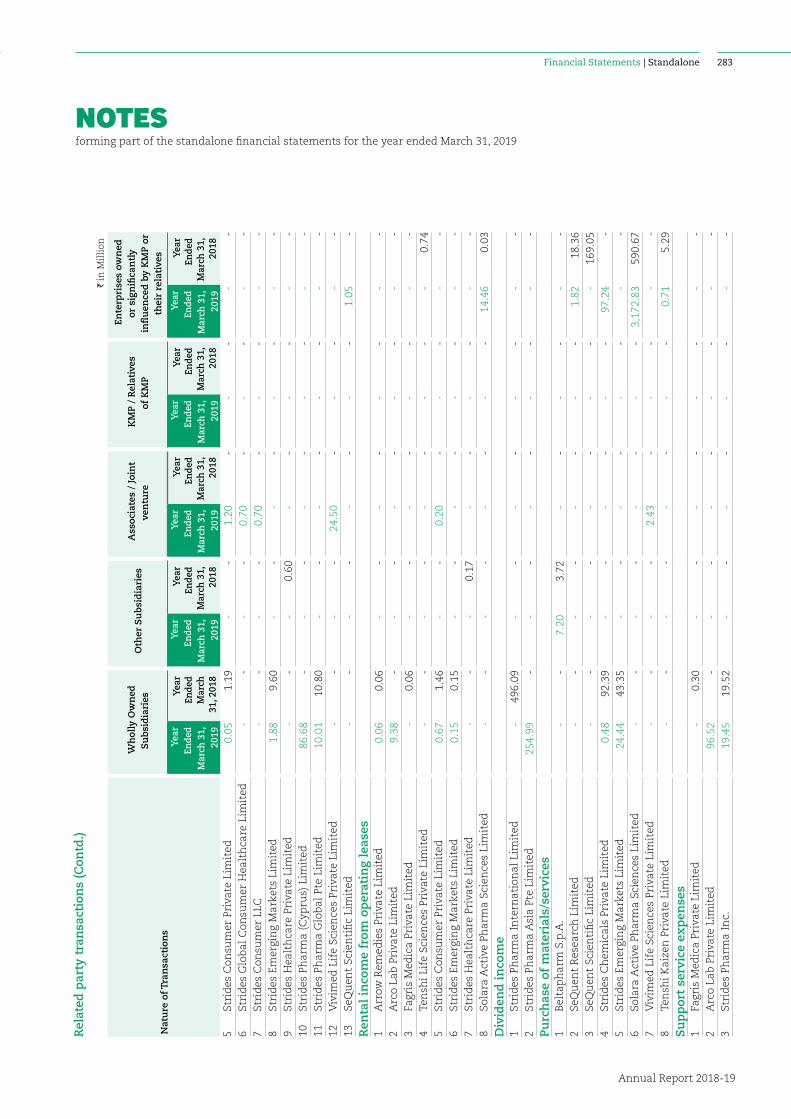
NOTESforming part of the standalone financial statements for the year ended March 31, 2019
Financial Statements | Standalone
Annual Report 2018-19
283
I in
Mil
lion
Nat
ure
of T
ran
sact
ion
s
Wh
olly
Ow
ned
S
ub
sid
iari
es
Oth
er S
ub
sid
iari
es
Ass
ocia
tes
/ Jo
int
ven
ture
K
MP
/ R
elat
ives
of
KM
P
En
terp
rise
s ow
ned
or
sig
nifi
can
tly
infl
uen
ced
by
KM
P or
th
eir
rela
tive
s
Yea
r E
nde
d M
arch
31,
20
19
Yea
r En
ded
Mar
ch
31, 2
018
Yea
r En
ded
Mar
ch 3
1,
2019
Yea
r En
ded
Mar
ch 3
1,
2018
Yea
r En
ded
Mar
ch 3
1,
2019
Yea
r En
ded
Mar
ch 3
1,
2018
Yea
r En
ded
Mar
ch 3
1,
2019
Yea
r En
ded
Mar
ch 3
1,
2018
Yea
r En
ded
Mar
ch 3
1,
2019
Yea
r En
ded
Mar
ch 3
1,
2018
5St
rid
es C
onsu
mer
Pri
vate
Lim
ited
0.0
5 1
.19
-
-
1.2
0 -
-
-
-
-
6
Stri
des
Glo
bal
Con
sum
er H
ealt
hca
re L
imit
ed-
--
- 0
.70
--
--
-7
Stri
des
Con
sum
er L
LC-
--
- 0
.70
--
--
-8
Stri
des
Em
ergi
ng
Mar
kets
Lim
ited
1.8
8 9
.60
-
-
-
-
-
-
-
-
9St
rid
es H
ealt
hca
re P
riva
te L
imit
ed -
-
-
0
.60
-
-
-
-
-
-
10St
rid
es P
har
ma
(Cyp
rus)
Lim
ited
86.
68
-
-
-
-
-
-
-
-
-
11St
rid
es P
har
ma
Glo
bal
Pte
Lim
ited
10.
01
10.
80
-
-
-
-
-
-
-
-
12V
ivim
ed L
ife
Scie
nce
s Pr
ivat
e Li
mit
ed -
-
-
-
2
4.50
-
-
-
-
-
13
SeQ
uen
t Sc
ien
tifi
c Li
mit
ed
-
-
-
-
-
-
-
-
1.0
5 -
R
enta
l in
com
e fr
om o
per
atin
g le
ases
1A
rrow
Rem
edie
s Pr
ivat
e Li
mit
ed 0
.06
0.0
6 -
-
-
-
-
-
-
-
2
Arc
o La
b P
riva
te L
imit
ed 9
.38
-
-
-
-
-
-
-
-
-
3Fa
gris
Med
ica
Priv
ate
Lim
ited
-
0.0
6 -
-
-
-
-
-
-
-
4
Ten
shi L
ife
Scie
nce
s Pr
ivat
e Li
mit
ed
-
-
-
-
-
-
-
-
-
0.7
4 5
Stri
des
Con
sum
er P
riva
te L
imit
ed 0
.67
1.4
6 -
-
0
.20
-
-
-
-
-
6St
rid
es E
mer
gin
g M
arke
ts L
imit
ed 0
.15
0.1
5 -
-
-
-
-
-
-
-
7
Stri
des
Hea
lth
care
Pri
vate
Lim
ited
-
-
-
0.1
7 -
-
-
-
-
-
8
Sola
ra A
ctiv
e Ph
arm
a Sc
ien
ces
Lim
ited
-
-
-
-
-
-
-
-
14.
46
0.0
3 D
ivid
end
in
com
e1
Stri
des
Ph
arm
a In
tern
atio
nal
Lim
ited
-
496
.09
-
-
-
-
-
-
-
-
2St
rid
es P
har
ma
Asi
a Pt
e Li
mit
ed 2
54.9
9 -
-
-
-
-
-
-
-
-
Pu
rch
ase
of m
ater
ials
/ser
vice
s1
Bel
tap
har
m S
.p.A
. -
-
7
.20
3.7
2 -
-
-
-
-
-
2
SeQ
uen
t R
esea
rch
Lim
ited
-
-
-
-
-
-
-
-
1.8
2 1
8.36
3
SeQ
uen
t Sc
ien
tifi
c Li
mit
ed
-
-
-
-
-
-
-
-
-
169
.05
4St
rid
es C
hem
ical
s Pr
ivat
e Li
mit
ed 0
.48
92.
39
-
-
-
-
-
-
97.
24
-
5St
rid
es E
mer
gin
g M
arke
ts L
imit
ed 2
4.44
4
3.35
-
-
-
-
-
-
-
-
6
Sola
ra A
ctiv
e Ph
arm
a Sc
ien
ces
Lim
ited
-
-
-
-
-
-
-
-
3,1
72.8
3 5
90.6
7 7
Viv
imed
Lif
e Sc
ien
ces
Priv
ate
Lim
ited
--
--
2.4
3 -
--
--
8Te
nsh
i Kai
zen
Pri
vate
Lim
ited
-
-
-
-
-
-
-
-
0.7
1 5
.29
Su
pp
ort
serv
ice
exp
ense
s1
Fagr
is M
edic
a Pr
ivat
e Li
mit
ed -
0
.30
-
-
-
-
-
-
-
-
2A
rco
Lab
Pri
vate
Lim
ited
96.
52
-
-
-
-
-
-
-
-
-
3St
rid
es P
har
ma
Inc.
19.
45
19.
52
-
-
-
-
-
-
-
-
Rel
ated
par
ty t
ran
sact
ion
s (C
ontd
.)
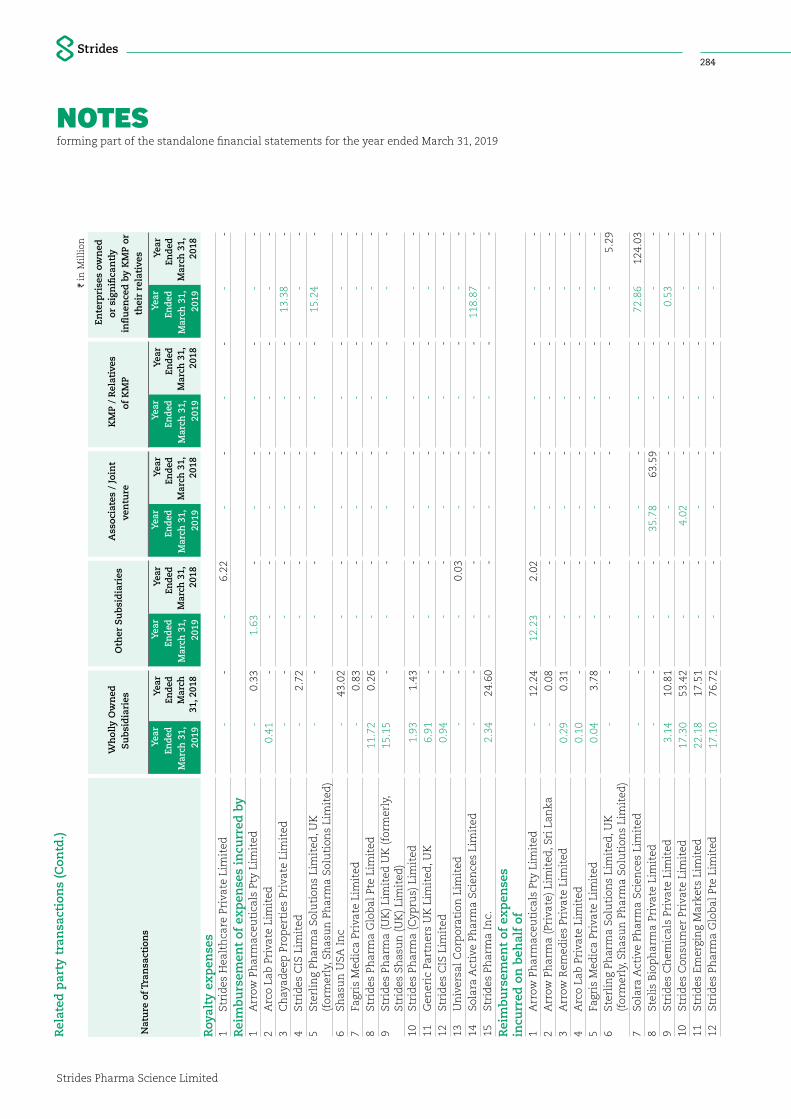
NOTESforming part of the standalone financial statements for the year ended March 31, 2019
Strides Pharma Science Limited
284
I in
Mil
lion
Nat
ure
of T
ran
sact
ion
s
Wh
olly
Ow
ned
S
ub
sid
iari
es
Oth
er S
ub
sid
iari
es
Ass
ocia
tes
/ Jo
int
ven
ture
K
MP
/ R
elat
ives
of
KM
P
En
terp
rise
s ow
ned
or
sig
nifi
can
tly
infl
uen
ced
by
KM
P or
th
eir
rela
tive
s
Yea
r E
nde
d M
arch
31,
20
19
Yea
r En
ded
Mar
ch
31, 2
018
Yea
r En
ded
Mar
ch 3
1,
2019
Yea
r En
ded
Mar
ch 3
1,
2018
Yea
r En
ded
Mar
ch 3
1,
2019
Yea
r En
ded
Mar
ch 3
1,
2018
Yea
r En
ded
Mar
ch 3
1,
2019
Yea
r En
ded
Mar
ch 3
1,
2018
Yea
r En
ded
Mar
ch 3
1,
2019
Yea
r En
ded
Mar
ch 3
1,
2018
Roy
alty
ex
pen
ses
1St
rid
es H
ealt
hca
re P
riva
te L
imit
ed
-
-
-
6.2
2 -
-
-
-
-
-
R
eim
bu
rsem
ent
of e
xp
ense
s in
curr
ed b
y1
Arr
ow P
har
mac
euti
cals
Pty
Lim
ited
-
0.3
3 1
.63
-
-
-
-
-
-
-
2A
rco
Lab
Pri
vate
Lim
ited
0.4
1 -
--
--
--
--
3C
hay
adee
p P
rop
erti
es P
riva
te L
imit
ed -
-
-
-
-
-
-
-
1
3.38
-
4
Stri
des
CIS
Lim
ited
-
2.7
2 -
-
-
-
-
-
-
-
5
Ster
lin
g Ph
arm
a So
luti
ons
Lim
ited
, UK
(f
orm
erly
, Sh
asu
n P
har
ma
Solu
tion
s Li
mit
ed)
-
-
-
-
-
-
-
-
15.
24
-
6Sh
asu
n U
SA I
nc
-
43.
02
-
-
-
-
-
-
-
-
7Fa
gris
Med
ica
Priv
ate
Lim
ited
-
0.8
3 -
-
-
-
-
-
-
-
8
Stri
des
Ph
arm
a G
lob
al P
te L
imit
ed 1
1.72
0
.26
-
-
-
-
-
-
-
-
9St
rid
es P
har
ma
(UK
) Li
mit
ed U
K (
form
erly
, St
rid
es S
has
un
(U
K)
Lim
ited
) 1
5.15
-
-
-
-
-
-
-
-
-
10St
rid
es P
har
ma
(Cyp
rus)
Lim
ited
1.9
3 1
.43
-
-
-
-
-
-
-
-
11G
ener
ic P
artn
ers
UK
Lim
ited
, UK
6.9
1 -
-
-
-
-
-
-
-
-
12
Stri
des
CIS
Lim
ited
0.9
4 -
--
--
--
--
13U
niv
ersa
l C
orp
orat
ion
Lim
ited
-
-
-
0.0
3 -
-
-
-
-
-
14
Sola
ra A
ctiv
e Ph
arm
a Sc
ien
ces
Lim
ited
--
--
--
--
118
.87
-15
Stri
des
Ph
arm
a In
c. 2
.34
24.
60
-
-
-
-
-
-
-
-
Rei
mb
urs
emen
t of
ex
pen
ses
incu
rred
on
beh
alf
of1
Arr
ow P
har
mac
euti
cals
Pty
Lim
ited
-
12.
24
12.
23
2.0
2 -
-
-
-
-
-
2
Arr
ow P
har
ma
(Pri
vate
) Li
mit
ed, S
ri L
anka
-
0.0
8 -
-
-
-
-
-
-
-
3
Arr
ow R
emed
ies
Priv
ate
Lim
ited
0.2
9 0
.31
-
-
-
-
-
-
-
-
4A
rco
Lab
Pri
vate
Lim
ited
0.1
0 -
--
--
--
--
5Fa
gris
Med
ica
Priv
ate
Lim
ited
0.0
4 3
.78
-
-
-
-
-
-
-
-
6St
erli
ng
Phar
ma
Solu
tion
s Li
mit
ed, U
K
(for
mer
ly, S
has
un
Ph
arm
a So
luti
ons
Lim
ited
) -
-
-
-
-
-
-
-
-
5
.29
7So
lara
Act
ive
Phar
ma
Scie
nce
s Li
mit
ed -
-
-
-
-
-
-
-
7
2.86
1
24.0
3 8
Stel
is B
iop
har
ma
Priv
ate
Lim
ited
-
-
-
-
35.
78
63.
59
-
-
-
-
9St
rid
es C
hem
ical
s Pr
ivat
e Li
mit
ed 3
.14
10.
81
-
-
-
-
-
-
0.5
3 -
10
Stri
des
Con
sum
er P
riva
te L
imit
ed 1
7.30
5
3.42
-
-
4
.02
-
-
-
-
-
11St
rid
es E
mer
gin
g M
arke
ts L
imit
ed 2
2.18
1
7.51
-
-
-
-
-
-
-
-
12
Stri
des
Ph
arm
a G
lob
al P
te L
imit
ed 1
7.10
7
6.72
-
-
-
-
-
-
-
-
Rel
ated
par
ty t
ran
sact
ion
s (C
ontd
.)
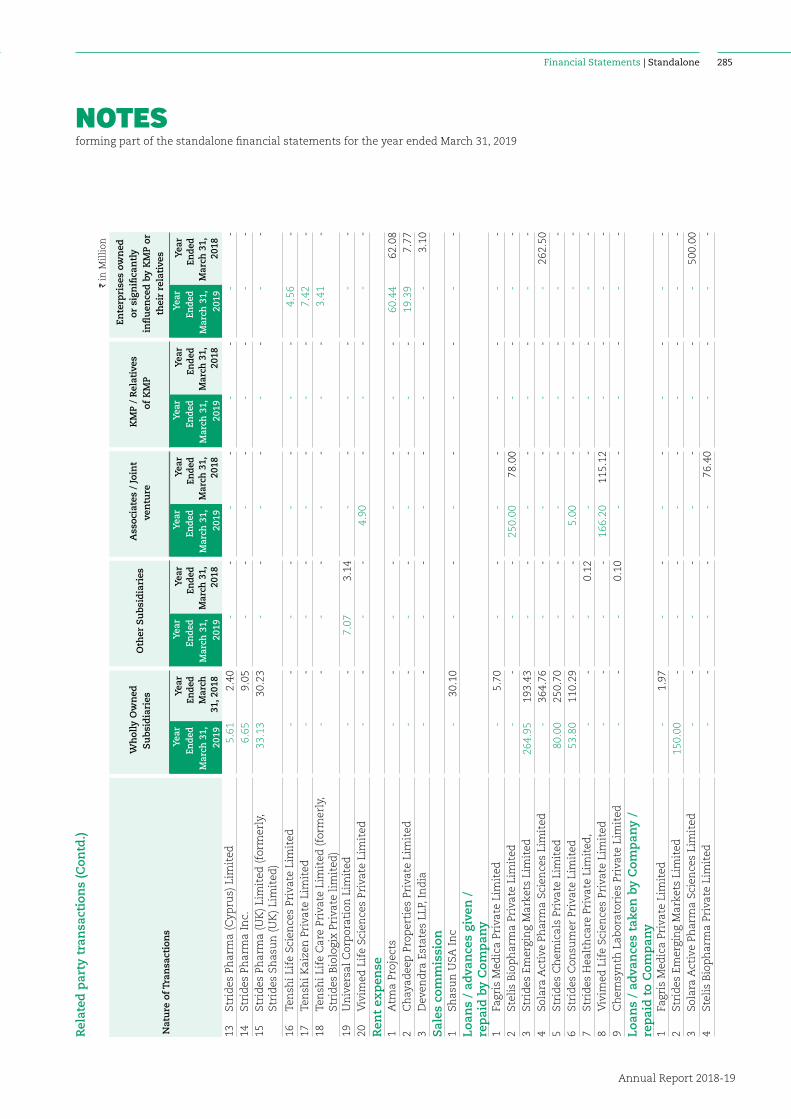
NOTESforming part of the standalone financial statements for the year ended March 31, 2019
Financial Statements | Standalone
Annual Report 2018-19
285
I in
Mil
lion
Nat
ure
of T
ran
sact
ion
s
Wh
olly
Ow
ned
S
ub
sid
iari
es
Oth
er S
ub
sid
iari
es
Ass
ocia
tes
/ Jo
int
ven
ture
K
MP
/ R
elat
ives
of
KM
P
En
terp
rise
s ow
ned
or
sig
nifi
can
tly
infl
uen
ced
by
KM
P or
th
eir
rela
tive
s
Yea
r E
nde
d M
arch
31,
20
19
Yea
r En
ded
Mar
ch
31, 2
018
Yea
r En
ded
Mar
ch 3
1,
2019
Yea
r En
ded
Mar
ch 3
1,
2018
Yea
r En
ded
Mar
ch 3
1,
2019
Yea
r En
ded
Mar
ch 3
1,
2018
Yea
r En
ded
Mar
ch 3
1,
2019
Yea
r En
ded
Mar
ch 3
1,
2018
Yea
r En
ded
Mar
ch 3
1,
2019
Yea
r En
ded
Mar
ch 3
1,
2018
13St
rid
es P
har
ma
(Cyp
rus)
Lim
ited
5.6
1 2
.40
-
-
-
-
-
-
-
-
14St
rid
es P
har
ma
Inc.
6.6
5 9
.05
-
-
-
-
-
-
-
-
15St
rid
es P
har
ma
(UK
) Li
mit
ed (
form
erly
, St
rid
es S
has
un
(U
K)
Lim
ited
) 3
3.13
3
0.23
-
-
-
-
-
-
-
-
16Te
nsh
i Lif
e Sc
ien
ces
Priv
ate
Lim
ited
-
-
-
-
-
-
-
-
4.5
6 -
17
Ten
shi K
aize
n P
riva
te L
imit
ed -
-
-
-
-
-
-
-
7
.42
-
18Te
nsh
i Lif
e C
are
Priv
ate
Lim
ited
(fo
rmer
ly,
Stri
des
Bio
logi
x Pr
ivat
e li
mit
ed)
-
-
-
-
-
-
-
-
3.4
1 -
19U
niv
ersa
l C
orp
orat
ion
Lim
ited
-
-
7.0
7 3
.14
-
-
-
-
-
-
20V
ivim
ed L
ife
Scie
nce
s Pr
ivat
e Li
mit
ed-
--
- 4
.90
--
--
-R
ent
exp
ense
1A
tma
Proj
ects
-
-
-
-
-
-
-
-
60.
44
62.
08
2C
hay
adee
p P
rop
erti
es P
riva
te L
imit
ed -
-
-
-
-
-
-
-
1
9.39
7
.77
3D
even
dra
Est
ates
LLP
, In
dia
-
-
-
-
-
-
-
-
-
3.1
0 S
ales
com
mis
sion
1Sh
asu
n U
SA I
nc
-
30.
10
-
-
-
-
-
-
-
-
Loan
s /
adva
nce
s gi
ven
/
rep
aid
by
Com
pan
y1
Fagr
is M
edic
a Pr
ivat
e Li
mit
ed -
5
.70
-
-
-
-
-
-
-
-
2St
elis
Bio
ph
arm
a Pr
ivat
e Li
mit
ed -
-
-
-
2
50.0
0 7
8.00
-
-
-
-
3
Stri
des
Em
ergi
ng
Mar
kets
Lim
ited
264
.95
193
.43
-
-
-
-
-
-
-
-
4So
lara
Act
ive
Phar
ma
Scie
nce
s Li
mit
ed -
3
64.7
6 -
-
-
-
-
-
-
2
62.5
0 5
Stri
des
Ch
emic
als
Priv
ate
Lim
ited
80.
00
250
.70
-
-
-
-
-
-
-
-
6St
rid
es C
onsu
mer
Pri
vate
Lim
ited
53.
80
110
.29
-
-
5.0
0 -
-
-
-
-
7
Stri
des
Hea
lth
care
Pri
vate
Lim
ited
, -
-
-
0
.12
-
-
-
-
-
-
8V
ivim
ed L
ife
Scie
nce
s Pr
ivat
e Li
mit
ed -
-
-
-
1
66.2
0 1
15.1
2 -
-
-
-
9
Ch
emsy
nth
Lab
orat
orie
s Pr
ivat
e Li
mit
ed -
-
-
0
.10
-
-
-
-
-
-
Loan
s /
adva
nce
s ta
ken
by
Com
pan
y /
rep
aid
to
Com
pan
y1
Fagr
is M
edic
a Pr
ivat
e Li
mit
ed -
1
.97
-
-
-
-
-
-
-
-
2St
rid
es E
mer
gin
g M
arke
ts L
imit
ed 1
50.0
0 -
--
--
--
--
3So
lara
Act
ive
Phar
ma
Scie
nce
s Li
mit
ed -
-
-
-
-
-
-
-
-
5
00.0
0 4
Stel
is B
iop
har
ma
Priv
ate
Lim
ited
-
-
-
-
-
76.
40
-
-
-
-
Rel
ated
par
ty t
ran
sact
ion
s (C
ontd
.)
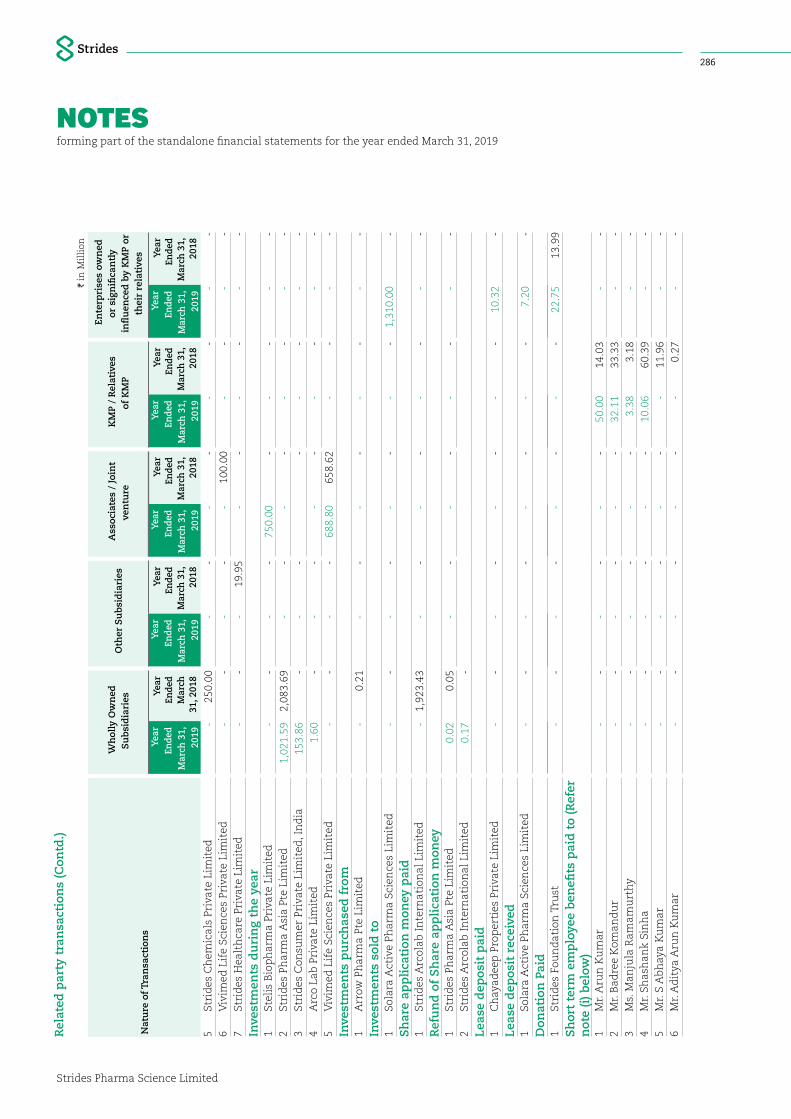
NOTESforming part of the standalone financial statements for the year ended March 31, 2019
Strides Pharma Science Limited
286
I in
Mil
lion
Nat
ure
of T
ran
sact
ion
s
Wh
olly
Ow
ned
S
ub
sid
iari
es
Oth
er S
ub
sid
iari
es
Ass
ocia
tes
/ Jo
int
ven
ture
K
MP
/ R
elat
ives
of
KM
P
En
terp
rise
s ow
ned
or
sig
nifi
can
tly
infl
uen
ced
by
KM
P or
th
eir
rela
tive
s
Yea
r E
nde
d M
arch
31,
20
19
Yea
r En
ded
Mar
ch
31, 2
018
Yea
r En
ded
Mar
ch 3
1,
2019
Yea
r En
ded
Mar
ch 3
1,
2018
Yea
r En
ded
Mar
ch 3
1,
2019
Yea
r En
ded
Mar
ch 3
1,
2018
Yea
r En
ded
Mar
ch 3
1,
2019
Yea
r En
ded
Mar
ch 3
1,
2018
Yea
r En
ded
Mar
ch 3
1,
2019
Yea
r En
ded
Mar
ch 3
1,
2018
5St
rid
es C
hem
ical
s Pr
ivat
e Li
mit
ed -
2
50.0
0 -
-
-
-
-
-
-
-
6
Viv
imed
Lif
e Sc
ien
ces
Priv
ate
Lim
ited
-
-
-
-
-
100
.00
-
-
-
-
7St
rid
es H
ealt
hca
re P
riva
te L
imit
ed -
-
-
1
9.95
-
-
-
-
-
-
In
vest
men
ts d
uri
ng
the
year
1St
elis
Bio
ph
arm
a Pr
ivat
e Li
mit
ed -
-
-
-
7
50.0
0 -
-
-
-
-
2
Stri
des
Ph
arm
a A
sia
Pte
Lim
ited
1,0
21.5
9 2
,083
.69
-
-
-
-
-
-
-
-
3St
rid
es C
onsu
mer
Pri
vate
Lim
ited
, In
dia
153
.86
-
-
-
-
-
-
-
-
4A
rco
Lab
Pri
vate
Lim
ited
1.6
0 -
-
-
-
-
-
-
-
-
5
Viv
imed
Lif
e Sc
ien
ces
Priv
ate
Lim
ited
-
-
-
-
688
.80
658
.62
-
-
-
-
Inve
stm
ents
pu
rch
ased
fro
m1
Arr
ow P
har
ma
Pte
Lim
ited
-
0.2
1 -
-
-
-
-
-
-
-
In
vest
men
ts s
old
to
1So
lara
Act
ive
Phar
ma
Scie
nce
s Li
mit
ed -
-
-
-
-
-
-
-
1
,310
.00
-
Sh
are
app
lica
tion
mon
ey p
aid
1St
rid
es A
rcol
ab I
nte
rnat
ion
al L
imit
ed -
1
,923
.43
-
-
-
-
-
-
-
-
Ref
un
d o
f S
har
e ap
pli
cati
on m
oney
1St
rid
es P
har
ma
Asi
a Pt
e Li
mit
ed 0
.02
0.0
5 -
-
-
-
-
-
-
-
2
Stri
des
Arc
olab
In
tern
atio
nal
Lim
ited
0.1
7 -
Le
ase
dep
osit
pai
d1
Ch
ayad
eep
Pro
per
ties
Pri
vate
Lim
ited
-
-
-
-
-
-
-
-
10.
32
-
Leas
e d
epos
it r
ecei
ved
1So
lara
Act
ive
Phar
ma
Scie
nce
s Li
mit
ed -
-
-
-
-
-
-
-
7
.20
-
Don
atio
n P
aid
1St
rid
es F
oun
dat
ion
Tru
st -
-
-
-
-
-
-
-
2
2.75
1
3.99
S
hor
t te
rm e
mp
loye
e b
enefi
ts p
aid
to
(Ref
er
not
e (i
) bel
ow)
1M
r. A
run
Ku
mar
-
-
-
-
-
-
5
0.00
1
4.03
-
-
2
Mr.
Bad
ree
Kom
and
ur
-
-
-
-
-
-
32.
11
33.
33
-
-
3M
s. M
anju
la R
amam
urt
hy
-
-
-
-
-
-
3.3
8 3
.18
-
-
4M
r. Sh
ash
ank
Sin
ha
-
-
-
-
-
-
10.
06
60.
39
-
-
5M
r. S
Ab
hay
a K
um
ar -
-
-
-
-
-
-
1
1.96
-
-
6
Mr.
Ad
itya
Aru
n K
um
ar -
-
-
-
-
-
-
0
.27
-
-
Rel
ated
par
ty t
ran
sact
ion
s (C
ontd
.)
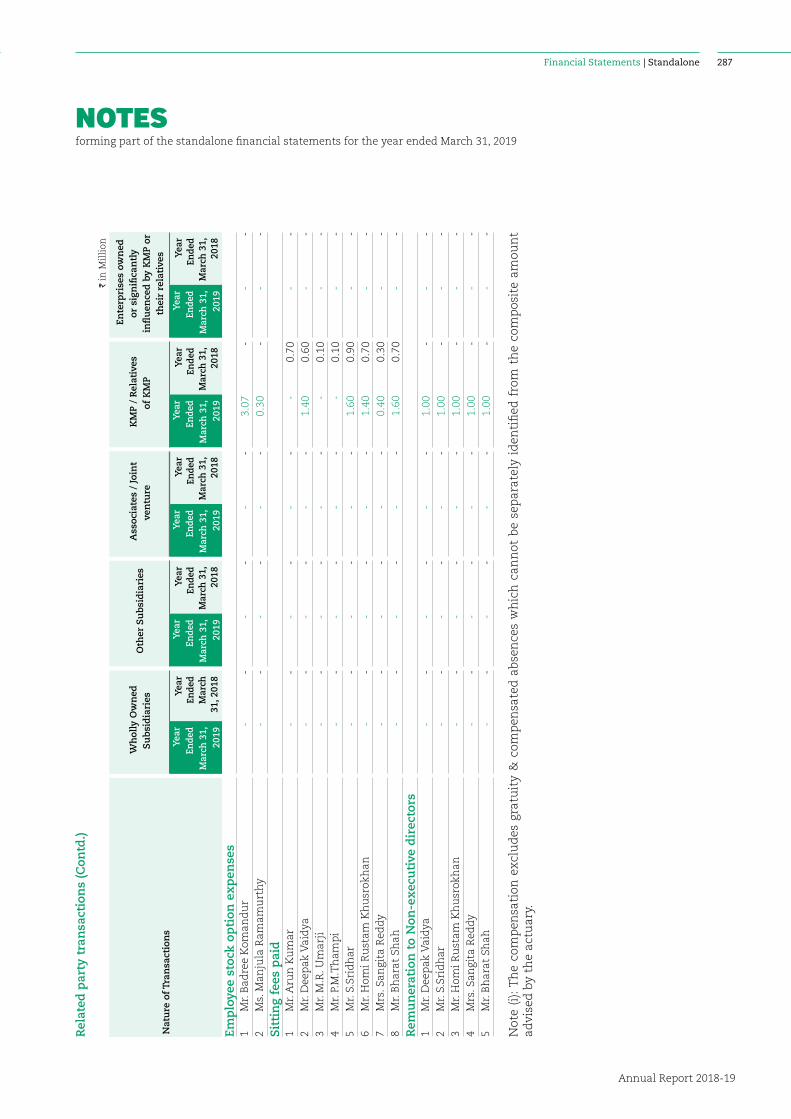
NOTESforming part of the standalone financial statements for the year ended March 31, 2019
Financial Statements | Standalone
Annual Report 2018-19
287
I in
Mil
lion
Nat
ure
of T
ran
sact
ion
s
Wh
olly
Ow
ned
S
ub
sid
iari
es
Oth
er S
ub
sid
iari
es
Ass
ocia
tes
/ Jo
int
ven
ture
K
MP
/ R
elat
ives
of
KM
P
En
terp
rise
s ow
ned
or
sig
nifi
can
tly
infl
uen
ced
by
KM
P or
th
eir
rela
tive
s
Yea
r E
nde
d M
arch
31,
20
19
Yea
r En
ded
Mar
ch
31, 2
018
Yea
r En
ded
Mar
ch 3
1,
2019
Yea
r En
ded
Mar
ch 3
1,
2018
Yea
r En
ded
Mar
ch 3
1,
2019
Yea
r En
ded
Mar
ch 3
1,
2018
Yea
r En
ded
Mar
ch 3
1,
2019
Yea
r En
ded
Mar
ch 3
1,
2018
Yea
r En
ded
Mar
ch 3
1,
2019
Yea
r En
ded
Mar
ch 3
1,
2018
Emp
loye
e st
ock
op
tion
ex
pen
ses
1M
r. B
adre
e K
oman
du
r -
-
-
-
-
-
3.
07-
-
-
2M
s. M
anju
la R
amam
urt
hy
-
-
-
-
-
-
0.30
- -
-
S
itti
ng
fees
pai
d1
Mr.
Aru
n K
um
ar
-
-
-
-
-
-
-
0.7
0 -
-
2
Mr.
Dee
pak
Vai
dya
-
-
-
-
-
-
1.4
0 0
.60
-
-
3M
r. M
.R. U
mar
ji -
-
-
-
-
-
-
0
.10
-
-
4M
r. P.
M.T
ham
pi
-
-
-
-
-
-
-
0.1
0 -
-
5
Mr.
S.Sr
idh
ar -
-
-
-
-
-
1
.60
0.9
0 -
-
6
Mr.
Hom
i Ru
stam
Kh
usr
okh
an -
-
-
-
-
-
1
.40
0.7
0 -
-
7
Mrs
. San
gita
Red
dy
-
-
-
-
-
-
0.4
0 0
.30
-
-
8M
r. B
har
at S
hah
-
-
-
-
-
-
1.6
0 0
.70
-
-
Rem
un
erat
ion
to
Non
-ex
ecu
tive
dir
ecto
rs1
Mr.
Dee
pak
Vai
dya
-
-
-
-
-
-
1.0
0 -
-
-
2
Mr.
S.Sr
idh
ar -
-
-
-
-
-
1
.00
-
-
-
3M
r. H
omi R
ust
am K
hu
srok
han
-
-
-
-
-
-
1.0
0 -
-
-
4
Mrs
. San
gita
Red
dy
-
-
-
-
-
-
1.0
0 -
-
-
5
Mr.
Bh
arat
Sh
ah -
-
-
-
-
-
1
.00
-
-
-
Not
e (i
): T
he
com
pen
sati
on e
xclu
des
gra
tuit
y &
com
pen
sate
d a
bse
nce
s w
hic
h c
ann
ot b
e se
par
atel
y id
enti
fied
fro
m t
he
com
pos
ite
amou
nt
advi
sed
by
the
actu
ary.
Rel
ated
par
ty t
ran
sact
ion
s (C
ontd
.)
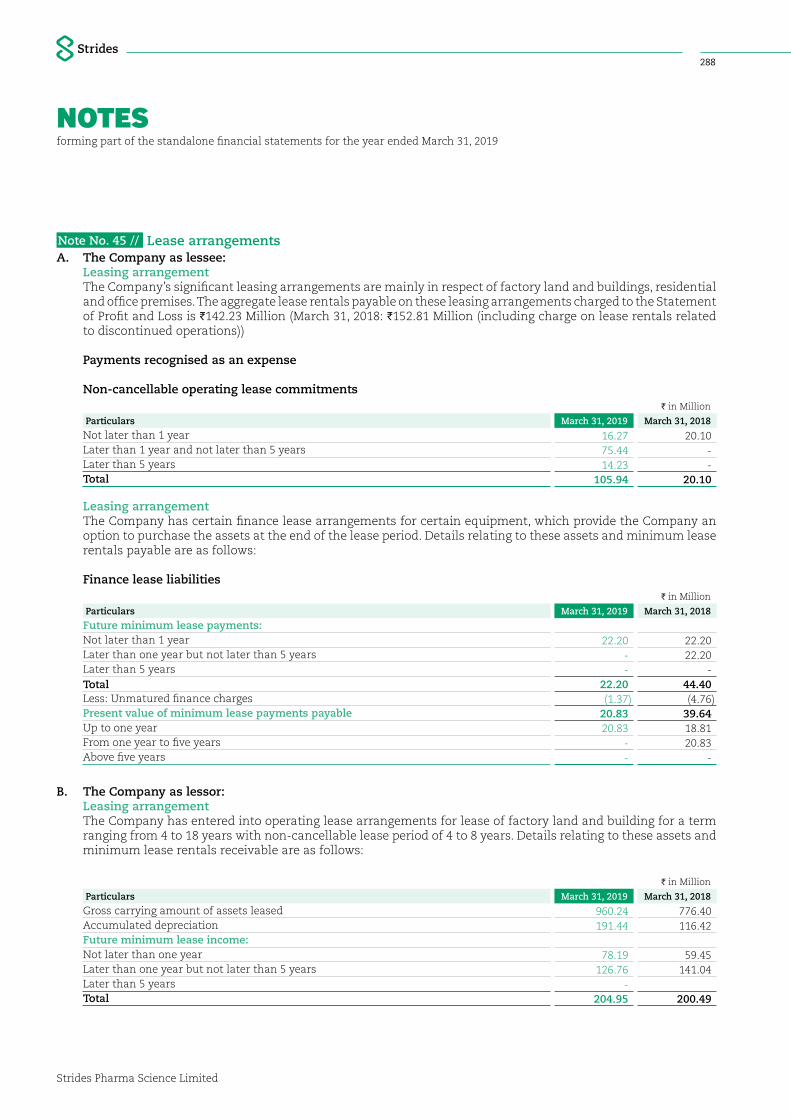
NOTESforming part of the standalone financial statements for the year ended March 31, 2019
Strides Pharma Science Limited
288
Note No. 45 // Lease arrangements A. The Company as lessee: Leasing arrangement The Company’s significant leasing arrangements are mainly in respect of factory land and buildings, residential
and office premises. The aggregate lease rentals payable on these leasing arrangements charged to the Statement of Profit and Loss is I142.23 Million (March 31, 2018: I152.81 Million (including charge on lease rentals related to discontinued operations))
Payments recognised as an expense
Non-cancellable operating lease commitmentsI in Million
Particulars March 31, 2019 March 31, 2018
Not later than 1 year 16.27 20.10 Later than 1 year and not later than 5 years 75.44 - Later than 5 years 14.23 - Total 105.94 20.10
Leasing arrangement The Company has certain finance lease arrangements for certain equipment, which provide the Company an
option to purchase the assets at the end of the lease period. Details relating to these assets and minimum lease rentals payable are as follows:
Finance lease liabilitiesI in Million
Particulars March 31, 2019 March 31, 2018
Future minimum lease payments: Not later than 1 year 22.20 22.20 Later than one year but not later than 5 years - 22.20 Later than 5 years - - Total 22.20 44.40 Less: Unmatured finance charges (1.37) (4.76)Present value of minimum lease payments payable 20.83 39.64 Up to one year 20.83 18.81 From one year to five years - 20.83 Above five years - -
B. The Company as lessor: Leasing arrangement The Company has entered into operating lease arrangements for lease of factory land and building for a term
ranging from 4 to 18 years with non-cancellable lease period of 4 to 8 years. Details relating to these assets and minimum lease rentals receivable are as follows:
I in Million
Particulars March 31, 2019 March 31, 2018
Gross carrying amount of assets leased 960.24 776.40 Accumulated depreciation 191.44 116.42 Future minimum lease income: Not later than one year 78.19 59.45 Later than one year but not later than 5 years 126.76 141.04 Later than 5 years - Total 204.95 200.49
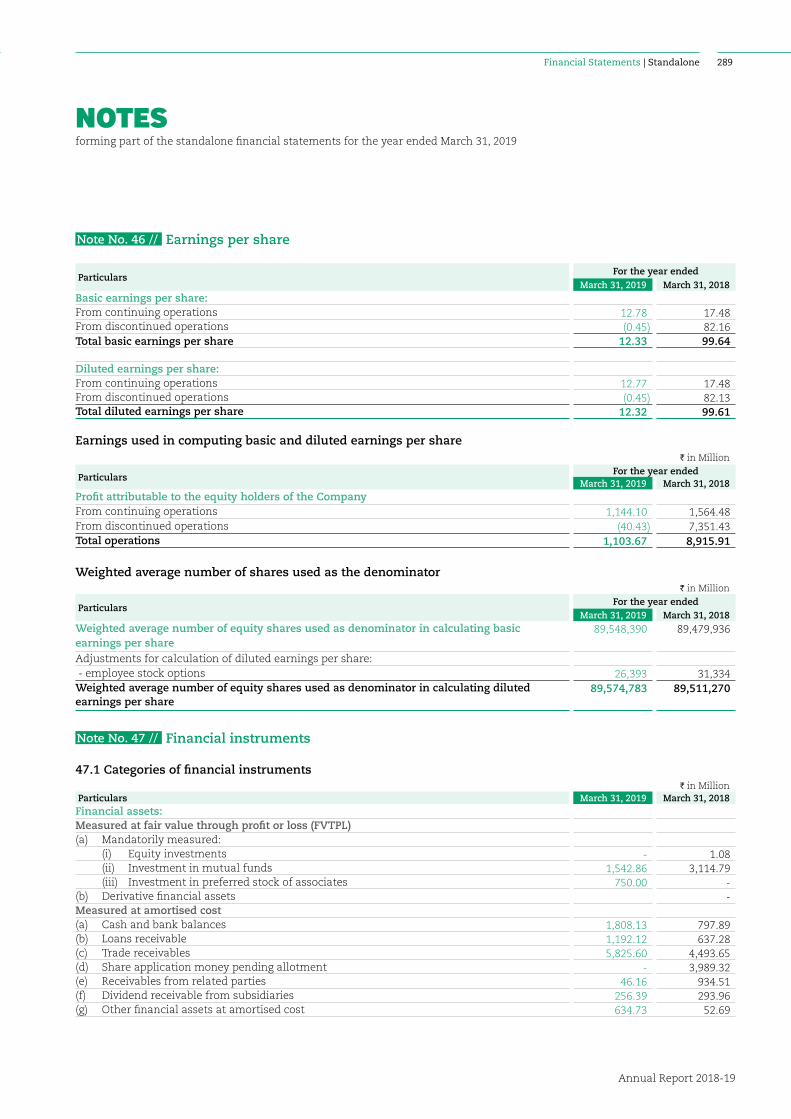
NOTESforming part of the standalone financial statements for the year ended March 31, 2019
Financial Statements | Standalone
Annual Report 2018-19
289
Note No. 46 // Earnings per share
ParticularsFor the year ended
March 31, 2019 March 31, 2018Basic earnings per share:From continuing operations 12.78 17.48 From discontinued operations (0.45) 82.16 Total basic earnings per share 12.33 99.64
Diluted earnings per share:From continuing operations 12.77 17.48 From discontinued operations (0.45) 82.13 Total diluted earnings per share 12.32 99.61
Earnings used in computing basic and diluted earnings per shareI in Million
ParticularsFor the year ended
March 31, 2019 March 31, 2018Profit attributable to the equity holders of the CompanyFrom continuing operations 1,144.10 1,564.48 From discontinued operations (40.43) 7,351.43 Total operations 1,103.67 8,915.91
Weighted average number of shares used as the denominatorI in Million
ParticularsFor the year ended
March 31, 2019 March 31, 2018Weighted average number of equity shares used as denominator in calculating basic earnings per share
89,548,390 89,479,936
Adjustments for calculation of diluted earnings per share: - employee stock options 26,393 31,334 Weighted average number of equity shares used as denominator in calculating diluted earnings per share
89,574,783 89,511,270
Note No. 47 // Financial instruments
47.1 Categories of financial instrumentsI in Million
Particulars March 31, 2019 March 31, 2018Financial assets:Measured at fair value through profit or loss (FVTPL)(a) Mandatorily measured: (i) Equity investments - 1.08 (ii) Investment in mutual funds 1,542.86 3,114.79 (iii) Investment in preferred stock of associates 750.00 -(b) Derivative financial assets - Measured at amortised cost(a) Cash and bank balances 1,808.13 797.89 (b) Loans receivable 1,192.12 637.28 (c) Trade receivables 5,825.60 4,493.65 (d) Share application money pending allotment - 3,989.32 (e) Receivables from related parties 46.16 934.51 (f) Dividend receivable from subsidiaries 256.39 293.96 (g) Other financial assets at amortised cost 634.73 52.69
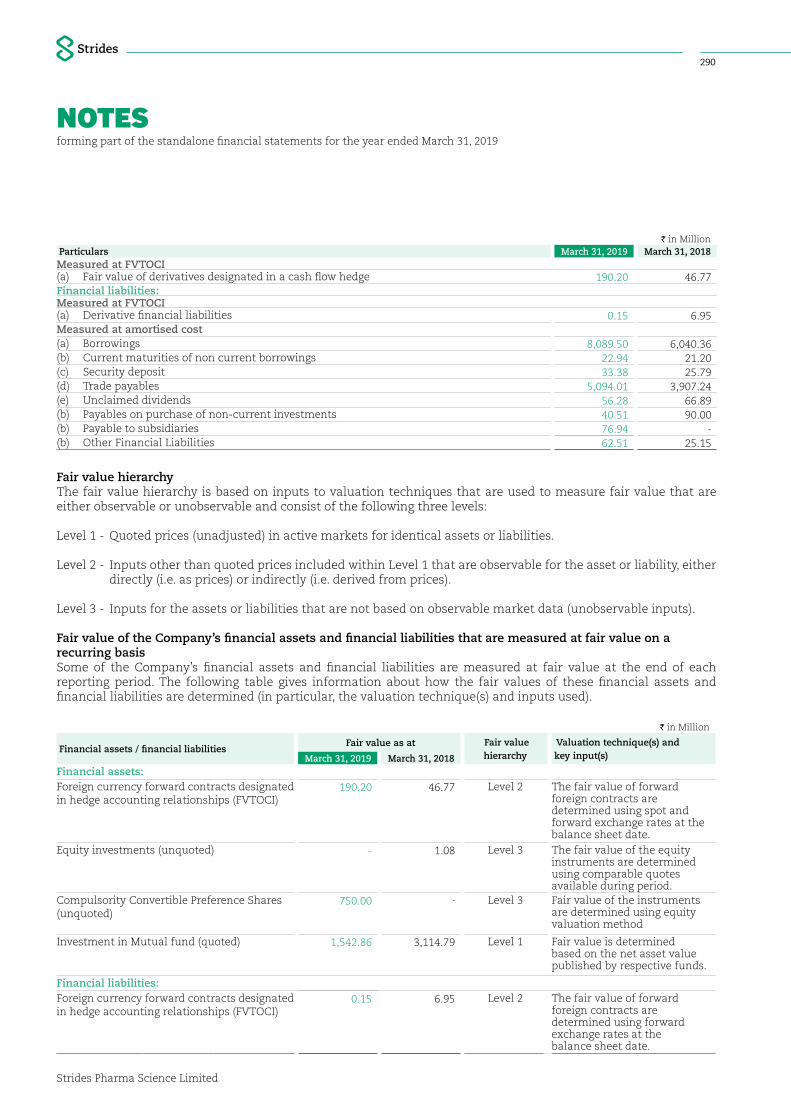
NOTESforming part of the standalone financial statements for the year ended March 31, 2019
Strides Pharma Science Limited
290
I in MillionParticulars March 31, 2019 March 31, 2018Measured at FVTOCI(a) Fair value of derivatives designated in a cash flow hedge 190.20 46.77 Financial liabilities:Measured at FVTOCI(a) Derivative financial liabilities 0.15 6.95 Measured at amortised cost(a) Borrowings 8,089.50 6,040.36 (b) Current maturities of non current borrowings 22.94 21.20 (c) Security deposit 33.38 25.79 (d) Trade payables 5,094.01 3,907.24 (e) Unclaimed dividends 56.28 66.89 (b) Payables on purchase of non-current investments 40.51 90.00 (b) Payable to subsidiaries 76.94 - (b) Other Financial Liabilities 62.51 25.15
Fair value hierarchyThe fair value hierarchy is based on inputs to valuation techniques that are used to measure fair value that are either observable or unobservable and consist of the following three levels:
Level 1 - Quoted prices (unadjusted) in active markets for identical assets or liabilities.
Level 2 - Inputs other than quoted prices included within Level 1 that are observable for the asset or liability, either directly (i.e. as prices) or indirectly (i.e. derived from prices).
Level 3 - Inputs for the assets or liabilities that are not based on observable market data (unobservable inputs).
Fair value of the Company’s financial assets and financial liabilities that are measured at fair value on a recurring basisSome of the Company’s financial assets and financial liabilities are measured at fair value at the end of each reporting period. The following table gives information about how the fair values of these financial assets and financial liabilities are determined (in particular, the valuation technique(s) and inputs used).
I in Million
Financial assets / financial liabilitiesFair value as at Fair value
hierarchy Valuation technique(s) and key input(s) March 31, 2019 March 31, 2018
Financial assets:Foreign currency forward contracts designated in hedge accounting relationships (FVTOCI)
190.20 46.77 Level 2 The fair value of forward foreign contracts are determined using spot and forward exchange rates at the balance sheet date.
Equity investments (unquoted) - 1.08 Level 3 The fair value of the equity instruments are determined using comparable quotes available during period.
Compulsority Convertible Preference Shares (unquoted)
750.00 - Level 3 Fair value of the instruments are determined using equity valuation method
Investment in Mutual fund (quoted) 1,542.86 3,114.79 Level 1 Fair value is determined based on the net asset value published by respective funds.
Financial liabilities:Foreign currency forward contracts designated in hedge accounting relationships (FVTOCI)
0.15 6.95 Level 2 The fair value of forward foreign contracts are determined using forward exchange rates at the balance sheet date.
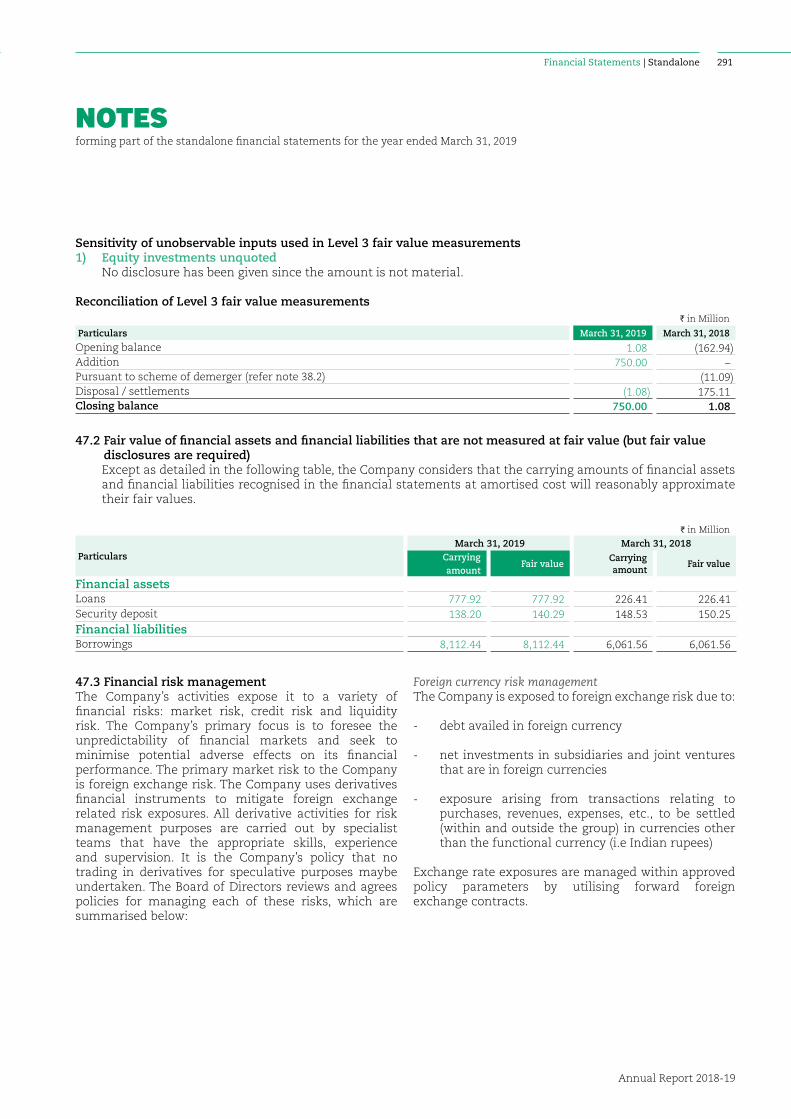
NOTESforming part of the standalone financial statements for the year ended March 31, 2019
Financial Statements | Standalone
Annual Report 2018-19
291
Sensitivity of unobservable inputs used in Level 3 fair value measurements1) Equity investments unquoted No disclosure has been given since the amount is not material.
Reconciliation of Level 3 fair value measurementsI in Million
Particulars March 31, 2019 March 31, 2018
Opening balance 1.08 (162.94)Addition 750.00 –Pursuant to scheme of demerger (refer note 38.2) (11.09) Disposal / settlements (1.08) 175.11 Closing balance 750.00 1.08
47.2 Fair value of financial assets and financial liabilities that are not measured at fair value (but fair value disclosures are required)
Except as detailed in the following table, the Company considers that the carrying amounts of financial assets and financial liabilities recognised in the financial statements at amortised cost will reasonably approximate their fair values.
I in Million
ParticularsMarch 31, 2019 March 31, 2018
Carrying amount
Fair valueCarrying amount
Fair value
Financial assetsLoans 777.92 777.92 226.41 226.41 Security deposit 138.20 140.29 148.53 150.25 Financial liabilitiesBorrowings 8,112.44 8,112.44 6,061.56 6,061.56
47.3 Financial risk managementThe Company’s activities expose it to a variety of financial risks: market risk, credit risk and liquidity risk. The Company’s primary focus is to foresee the unpredictability of financial markets and seek to minimise potential adverse effects on its financial performance. The primary market risk to the Company is foreign exchange risk. The Company uses derivatives financial instruments to mitigate foreign exchange related risk exposures. All derivative activities for risk management purposes are carried out by specialist teams that have the appropriate skills, experience and supervision. It is the Company’s policy that no trading in derivatives for speculative purposes maybe undertaken. The Board of Directors reviews and agrees policies for managing each of these risks, which are summarised below:
Foreign currency risk managementThe Company is exposed to foreign exchange risk due to:
- debt availed in foreign currency
- net investments in subsidiaries and joint ventures that are in foreign currencies
- exposure arising from transactions relating to purchases, revenues, expenses, etc., to be settled (within and outside the group) in currencies other than the functional currency (i.e Indian rupees)
Exchange rate exposures are managed within approved policy parameters by utilising forward foreign exchange contracts.

NOTESforming part of the standalone financial statements for the year ended March 31, 2019
Strides Pharma Science Limited
292
47.3.1 Forward foreign exchange contractsIt is the policy of the Company to enter into forward foreign exchange contracts to cover the following:
a. repayments of specific foreign currency borrowings.
b. forecast sales transactions
The following table details the forward foreign currency contracts outstanding at the end of the reporting period:
Contracts designated in a cash flow hedge
Outstanding contractsUnderlying Exposure
Average exchange rate
(in I)
Foreign currency
(USD in Million)
Nominal amounts
(I in Million)
Fair value assets
(liabilities) (I in Million)
As at March 31, 2019Sell USD
Forecast sales Less than 3 months 71.12 24.00 1,706.78 1,740.22 3 to 6 months 74.78 24.00 1,794.77 1,898.10 6 to 12 months 72.98 28.00 2,043.41 2,096.69 Total 76.00 5,544.96 5,735.01 As at March 31, 2018Sell USD
Forecast sales Less than 3 months 66.59 34.00 2,264.08 2,297.05 3 to 6 months 66.79 26.00 1,736.66 1,750.04 6 to 12 months 66.88 35.00 2,340.92 2,334.39 Total 95.00 6,341.66 6,381.48
The line-items in the balance sheet that include the above hedging instruments are “Other financial assets (Refer note 10(ii))”.
The details of unhedged foreign currency exposure are as follows:
Amounts in Million
Amount receivable/(payable) As at March 31, 2019 As at March 31, 2018
Exposure to the currencyin foreign currency
in Iin foreign currency
in I
USD (7.63) (528.24) (13.36) (872.07)AUD 9.43 462.60 6.25 312.03 EUR 1.83 141.77 (0.97) (78.30)CAD 1.64 84.78 1.29 64.94 GBP 0.71 64.07 1.40 128.08 SGD 0.03 1.60 (0.01) (0.41)JPY (0.38) (0.24) (3.42) (2.09)CHF 0.18 12.81 1.15 78.26
47.3.2 Foreign currency sensitivity analysisFinancial instruments affected by changes in foreign exchange rates include External Commercial Borrowings (ECBs), loans in foreign currencies to subsidiaries and joint ventures. The Company considers US Dollar and the Euro to be principal currencies which require monitoring and risk mitigation. The Company is exposed to volatility in other currencies including the Great Britain Pounds (GBP), United states Dollar (USD), Euro and the Australian
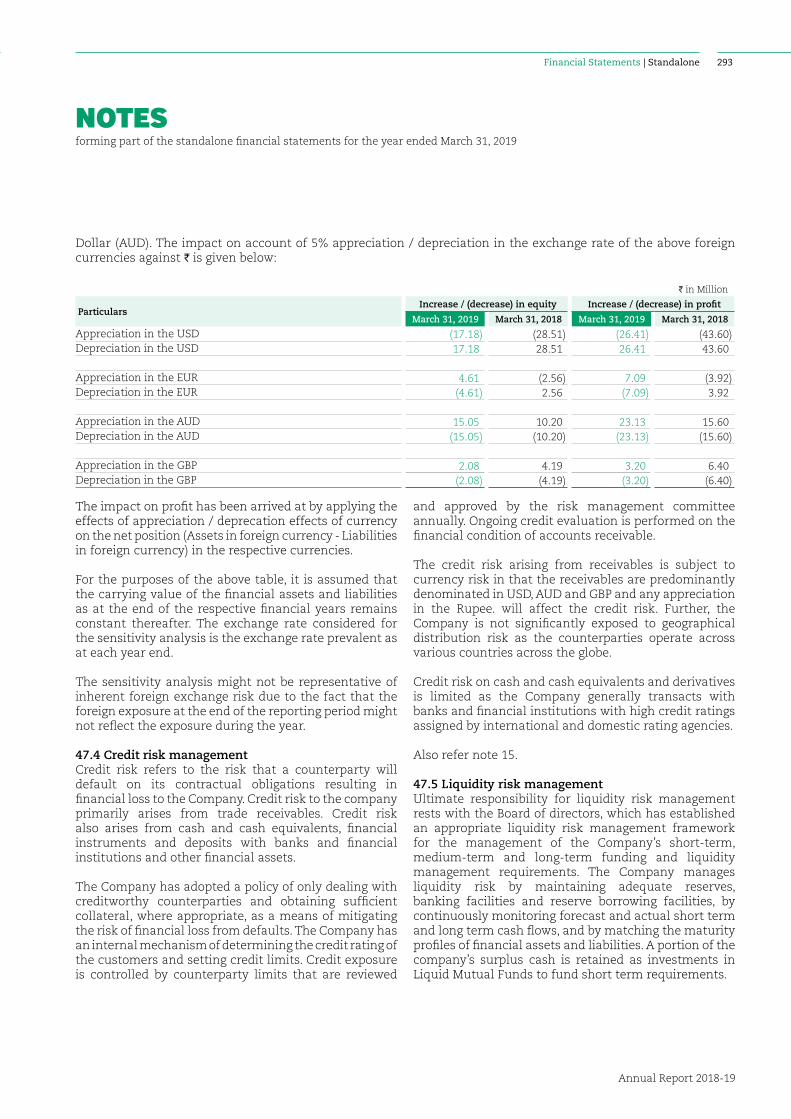
NOTESforming part of the standalone financial statements for the year ended March 31, 2019
Financial Statements | Standalone
Annual Report 2018-19
293
Dollar (AUD). The impact on account of 5% appreciation / depreciation in the exchange rate of the above foreign currencies against I is given below:
I in Million
ParticularsIncrease / (decrease) in equity Increase / (decrease) in profit
March 31, 2019 March 31, 2018 March 31, 2019 March 31, 2018
Appreciation in the USD (17.18) (28.51) (26.41) (43.60)Depreciation in the USD 17.18 28.51 26.41 43.60
Appreciation in the EUR 4.61 (2.56) 7.09 (3.92)Depreciation in the EUR (4.61) 2.56 (7.09) 3.92
Appreciation in the AUD 15.05 10.20 23.13 15.60 Depreciation in the AUD (15.05) (10.20) (23.13) (15.60)
Appreciation in the GBP 2.08 4.19 3.20 6.40 Depreciation in the GBP (2.08) (4.19) (3.20) (6.40)
The impact on profit has been arrived at by applying the effects of appreciation / deprecation effects of currency on the net position (Assets in foreign currency - Liabilities in foreign currency) in the respective currencies.
For the purposes of the above table, it is assumed that the carrying value of the financial assets and liabilities as at the end of the respective financial years remains constant thereafter. The exchange rate considered for the sensitivity analysis is the exchange rate prevalent as at each year end.
The sensitivity analysis might not be representative of inherent foreign exchange risk due to the fact that the foreign exposure at the end of the reporting period might not reflect the exposure during the year.
47.4 Credit risk managementCredit risk refers to the risk that a counterparty will default on its contractual obligations resulting in financial loss to the Company. Credit risk to the company primarily arises from trade receivables. Credit risk also arises from cash and cash equivalents, financial instruments and deposits with banks and financial institutions and other financial assets.
The Company has adopted a policy of only dealing with creditworthy counterparties and obtaining sufficient collateral, where appropriate, as a means of mitigating the risk of financial loss from defaults. The Company has an internal mechanism of determining the credit rating of the customers and setting credit limits. Credit exposure is controlled by counterparty limits that are reviewed
and approved by the risk management committee annually. Ongoing credit evaluation is performed on the financial condition of accounts receivable.
The credit risk arising from receivables is subject to currency risk in that the receivables are predominantly denominated in USD, AUD and GBP and any appreciation in the Rupee. will affect the credit risk. Further, the Company is not significantly exposed to geographical distribution risk as the counterparties operate across various countries across the globe.
Credit risk on cash and cash equivalents and derivatives is limited as the Company generally transacts with banks and financial institutions with high credit ratings assigned by international and domestic rating agencies.
Also refer note 15.
47.5 Liquidity risk managementUltimate responsibility for liquidity risk management rests with the Board of directors, which has established an appropriate liquidity risk management framework for the management of the Company’s short-term, medium-term and long-term funding and liquidity management requirements. The Company manages liquidity risk by maintaining adequate reserves, banking facilities and reserve borrowing facilities, by continuously monitoring forecast and actual short term and long term cash flows, and by matching the maturity profiles of financial assets and liabilities. A portion of the company’s surplus cash is retained as investments in Liquid Mutual Funds to fund short term requirements.
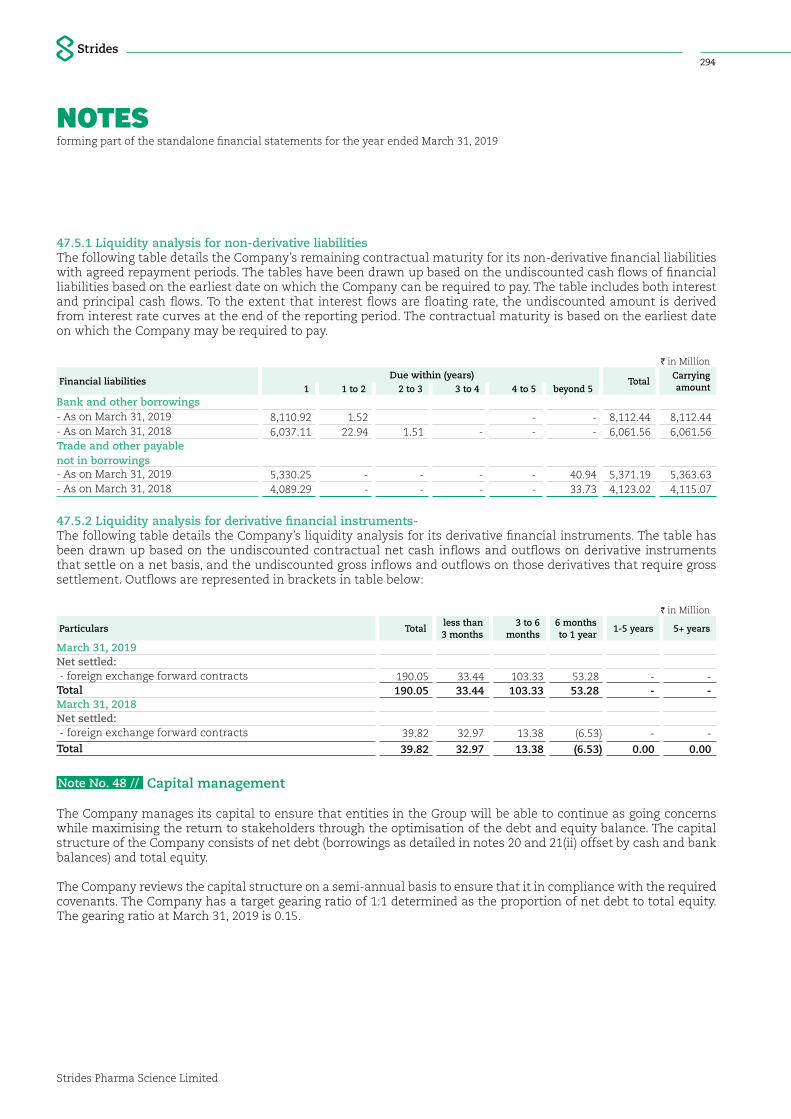
NOTESforming part of the standalone financial statements for the year ended March 31, 2019
Strides Pharma Science Limited
294
47.5.1 Liquidity analysis for non-derivative liabilitiesThe following table details the Company’s remaining contractual maturity for its non-derivative financial liabilities with agreed repayment periods. The tables have been drawn up based on the undiscounted cash flows of financial liabilities based on the earliest date on which the Company can be required to pay. The table includes both interest and principal cash flows. To the extent that interest flows are floating rate, the undiscounted amount is derived from interest rate curves at the end of the reporting period. The contractual maturity is based on the earliest date on which the Company may be required to pay.
I in Million
Financial liabilities Due within (years)
TotalCarrying amount1 1 to 2 2 to 3 3 to 4 4 to 5 beyond 5
Bank and other borrowings- As on March 31, 2019 8,110.92 1.52 - - 8,112.44 8,112.44 - As on March 31, 2018 6,037.11 22.94 1.51 - - - 6,061.56 6,061.56 Trade and other payable not in borrowings- As on March 31, 2019 5,330.25 - - - - 40.94 5,371.19 5,363.63 - As on March 31, 2018 4,089.29 - - - - 33.73 4,123.02 4,115.07
47.5.2 Liquidity analysis for derivative financial instruments-The following table details the Company’s liquidity analysis for its derivative financial instruments. The table has been drawn up based on the undiscounted contractual net cash inflows and outflows on derivative instruments that settle on a net basis, and the undiscounted gross inflows and outflows on those derivatives that require gross settlement. Outflows are represented in brackets in table below:
I in Million
Particulars Totalless than 3 months
3 to 6 months
6 months to 1 year
1-5 years 5+ years
March 31, 2019Net settled: - foreign exchange forward contracts 190.05 33.44 103.33 53.28 - - Total 190.05 33.44 103.33 53.28 - - March 31, 2018Net settled: - foreign exchange forward contracts 39.82 32.97 13.38 (6.53) - - Total 39.82 32.97 13.38 (6.53) 0.00 0.00
Note No. 48 // Capital management
The Company manages its capital to ensure that entities in the Group will be able to continue as going concerns while maximising the return to stakeholders through the optimisation of the debt and equity balance. The capital structure of the Company consists of net debt (borrowings as detailed in notes 20 and 21(ii) offset by cash and bank balances) and total equity.
The Company reviews the capital structure on a semi-annual basis to ensure that it in compliance with the required covenants. The Company has a target gearing ratio of 1:1 determined as the proportion of net debt to total equity. The gearing ratio at March 31, 2019 is 0.15.
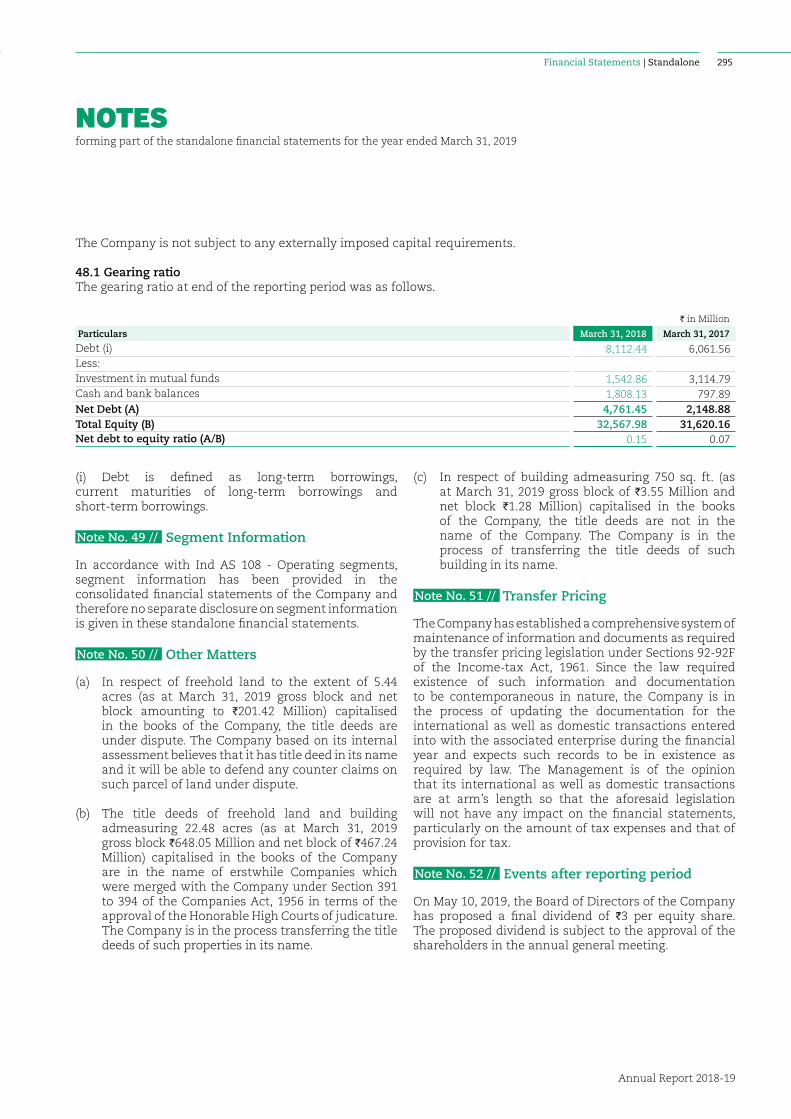
NOTESforming part of the standalone financial statements for the year ended March 31, 2019
Financial Statements | Standalone
Annual Report 2018-19
295
The Company is not subject to any externally imposed capital requirements.
48.1 Gearing ratioThe gearing ratio at end of the reporting period was as follows.
I in Million
Particulars March 31, 2018 March 31, 2017
Debt (i) 8,112.44 6,061.56 Less:Investment in mutual funds 1,542.86 3,114.79 Cash and bank balances 1,808.13 797.89 Net Debt (A) 4,761.45 2,148.88 Total Equity (B) 32,567.98 31,620.16 Net debt to equity ratio (A/B) 0.15 0.07
(i) Debt is defined as long-term borrowings, current maturities of long-term borrowings and short-term borrowings.
Note No. 49 // Segment Information
In accordance with Ind AS 108 - Operating segments, segment information has been provided in the consolidated financial statements of the Company and therefore no separate disclosure on segment information is given in these standalone financial statements.
Note No. 50 // Other Matters
(a) In respect of freehold land to the extent of 5.44 acres (as at March 31, 2019 gross block and net block amounting to I201.42 Million) capitalised in the books of the Company, the title deeds are under dispute. The Company based on its internal assessment believes that it has title deed in its name and it will be able to defend any counter claims on such parcel of land under dispute.
(b) The title deeds of freehold land and building admeasuring 22.48 acres (as at March 31, 2019 gross block I648.05 Million and net block of I467.24 Million) capitalised in the books of the Company are in the name of erstwhile Companies which were merged with the Company under Section 391 to 394 of the Companies Act, 1956 in terms of the approval of the Honorable High Courts of judicature. The Company is in the process transferring the title deeds of such properties in its name.
(c) In respect of building admeasuring 750 sq. ft. (as at March 31, 2019 gross block of I3.55 Million and net block I1.28 Million) capitalised in the books of the Company, the title deeds are not in the name of the Company. The Company is in the process of transferring the title deeds of such building in its name.
Note No. 51 // Transfer Pricing
The Company has established a comprehensive system of maintenance of information and documents as required by the transfer pricing legislation under Sections 92-92F of the Income-tax Act, 1961. Since the law required existence of such information and documentation to be contemporaneous in nature, the Company is in the process of updating the documentation for the international as well as domestic transactions entered into with the associated enterprise during the financial year and expects such records to be in existence as required by law. The Management is of the opinion that its international as well as domestic transactions are at arm’s length so that the aforesaid legislation will not have any impact on the financial statements, particularly on the amount of tax expenses and that of provision for tax.
Note No. 52 // Events after reporting period
On May 10, 2019, the Board of Directors of the Company has proposed a final dividend of I3 per equity share. The proposed dividend is subject to the approval of the shareholders in the annual general meeting.
NOTESforming part of the standalone financial statements for the year ended March 31, 2019
Strides Pharma Science Limited
296
Note No. 53 //
During the year ended March 31, 2019, no material foreseeable loss (March 31, 2018: Nil) was incurred for any long-term contract including derivative contracts.
Note No. 54 //
The previous year’s figures have been re-grouped/ reclassified, where necessary to confirm to current year’s classification.
The accompanying notes are an integral part of the standalone financial statementsAs per our report of even date attached for and on behalf of Board of Directors of Strides Pharma Science Limitedfor B S R & Co. LLPChartered AccountantsFirm Registration No.: 101248W/W-100022 Arun Kumar Badree Komandur
Managing Director Executive Director- FinanceDIN : 00084845 DIN: 07803242
Sampad Guha Thakurta Manjula R.Partner Company SecretaryMembership No.: 060573 Membership No.: A30515 Bengaluru, May 10, 2019
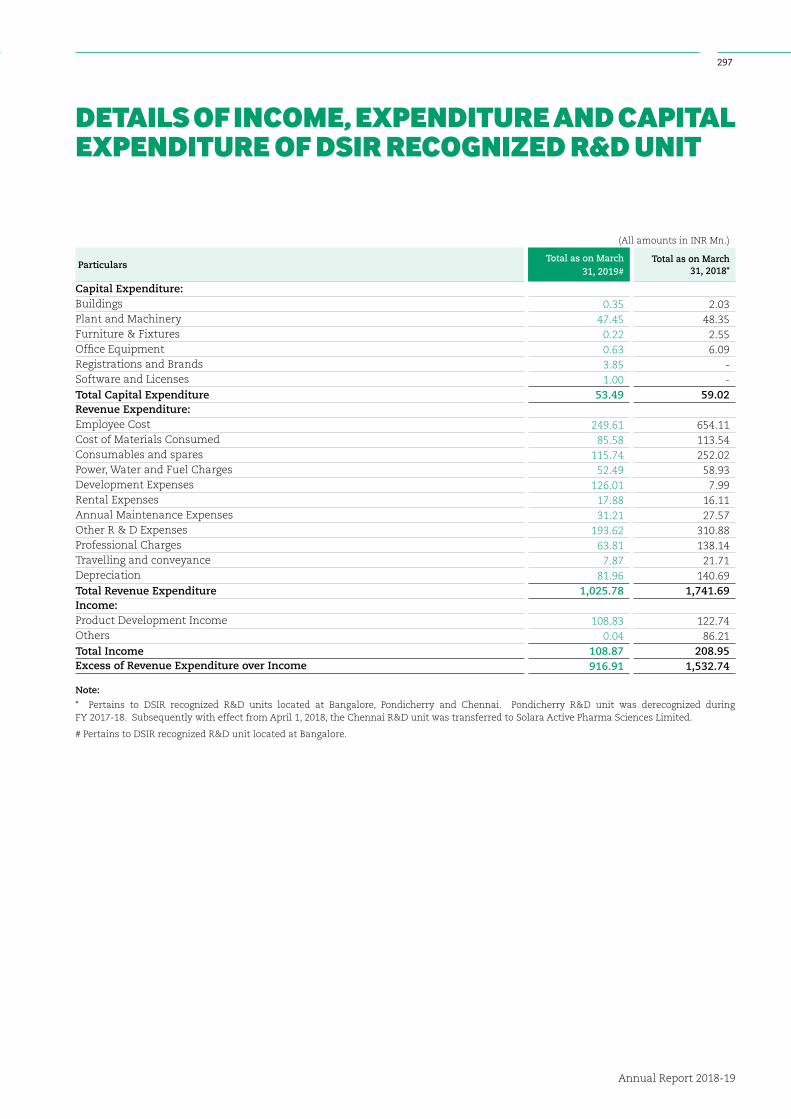
Annual Report 2018-19
297
Note No. 54 //
The previous year’s figures have been re-grouped/ reclassified, where necessary to confirm to current year’s classification.
(All amounts in INR Mn.)
ParticularsTotal as on March
31, 2019#Total as on March
31, 2018*
Capital Expenditure:Buildings 0.35 2.03 Plant and Machinery 47.45 48.35 Furniture & Fixtures 0.22 2.55 Office Equipment 0.63 6.09 Registrations and Brands 3.85 - Software and Licenses 1.00 - Total Capital Expenditure 53.49 59.02 Revenue Expenditure:Employee Cost 249.61 654.11Cost of Materials Consumed 85.58 113.54Consumables and spares 115.74 252.02Power, Water and Fuel Charges 52.49 58.93 Development Expenses 126.01 7.99 Rental Expenses 17.88 16.11 Annual Maintenance Expenses 31.21 27.57 Other R & D Expenses 193.62 310.88 Professional Charges 63.81 138.14 Travelling and conveyance 7.87 21.71 Depreciation 81.96 140.69Total Revenue Expenditure 1,025.78 1,741.69 Income:Product Development Income 108.83 122.74 Others 0.04 86.21 Total Income 108.87 208.95 Excess of Revenue Expenditure over Income 916.91 1,532.74
DETAILS OF INCOME, EXPENDITURE AND CAPITAL EXPENDITURE OF DSIR RECOGNIZED R&D UNIT
Note:
* Pertains to DSIR recognized R&D units located at Bangalore, Pondicherry and Chennai. Pondicherry R&D unit was derecognized during FY 2017-18. Subsequently with effect from April 1, 2018, the Chennai R&D unit was transferred to Solara Active Pharma Sciences Limited.
# Pertains to DSIR recognized R&D unit located at Bangalore.
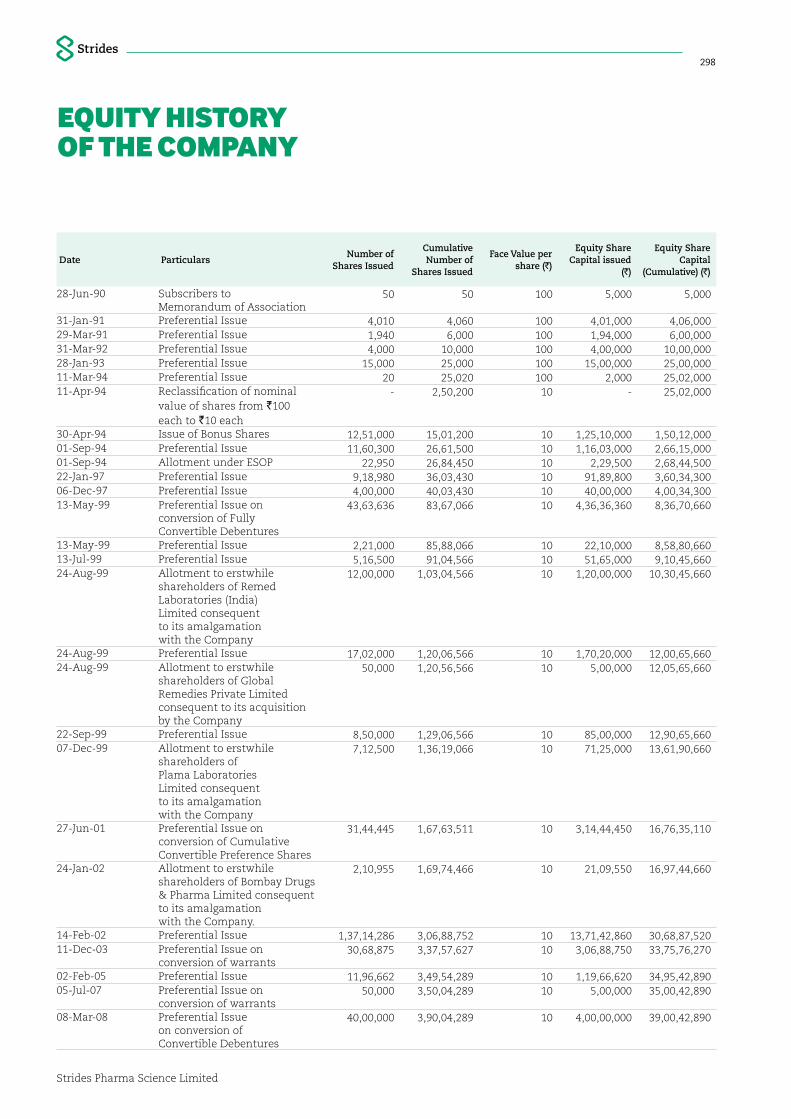
Strides Pharma Science Limited
298
Date Particulars Number of
Shares Issued
Cumulative Number of
Shares Issued
Face Value per share (`)
Equity Share Capital issued
(`)
Equity Share Capital
(Cumulative) (`)
28-Jun-90 Subscribers to Memorandum of Association
50 50 100 5,000 5,000
31-Jan-91 Preferential Issue 4,010 4,060 100 4,01,000 4,06,000 29-Mar-91 Preferential Issue 1,940 6,000 100 1,94,000 6,00,000 31-Mar-92 Preferential Issue 4,000 10,000 100 4,00,000 10,00,000 28-Jan-93 Preferential Issue 15,000 25,000 100 15,00,000 25,00,000 11-Mar-94 Preferential Issue 20 25,020 100 2,000 25,02,000 11-Apr-94 Reclassification of nominal
value of shares from `100 each to `10 each
- 2,50,200 10 - 25,02,000
30-Apr-94 Issue of Bonus Shares 12,51,000 15,01,200 10 1,25,10,000 1,50,12,000 01-Sep-94 Preferential Issue 11,60,300 26,61,500 10 1,16,03,000 2,66,15,000 01-Sep-94 Allotment under ESOP 22,950 26,84,450 10 2,29,500 2,68,44,500 22-Jan-97 Preferential Issue 9,18,980 36,03,430 10 91,89,800 3,60,34,300 06-Dec-97 Preferential Issue 4,00,000 40,03,430 10 40,00,000 4,00,34,300 13-May-99 Preferential Issue on
conversion of Fully Convertible Debentures
43,63,636 83,67,066 10 4,36,36,360 8,36,70,660
13-May-99 Preferential Issue 2,21,000 85,88,066 10 22,10,000 8,58,80,660 13-Jul-99 Preferential Issue 5,16,500 91,04,566 10 51,65,000 9,10,45,660 24-Aug-99 Allotment to erstwhile
shareholders of Remed Laboratories (India) Limited consequent to its amalgamation with the Company
12,00,000 1,03,04,566 10 1,20,00,000 10,30,45,660
24-Aug-99 Preferential Issue 17,02,000 1,20,06,566 10 1,70,20,000 12,00,65,660 24-Aug-99 Allotment to erstwhile
shareholders of Global Remedies Private Limited consequent to its acquisition by the Company
50,000 1,20,56,566 10 5,00,000 12,05,65,660
22-Sep-99 Preferential Issue 8,50,000 1,29,06,566 10 85,00,000 12,90,65,660 07-Dec-99 Allotment to erstwhile
shareholders of Plama Laboratories Limited consequent to its amalgamation with the Company
7,12,500 1,36,19,066 10 71,25,000 13,61,90,660
27-Jun-01 Preferential Issue on conversion of Cumulative Convertible Preference Shares
31,44,445 1,67,63,511 10 3,14,44,450 16,76,35,110
24-Jan-02 Allotment to erstwhile shareholders of Bombay Drugs & Pharma Limited consequent to its amalgamation with the Company.
2,10,955 1,69,74,466 10 21,09,550 16,97,44,660
14-Feb-02 Preferential Issue 1,37,14,286 3,06,88,752 10 13,71,42,860 30,68,87,520 11-Dec-03 Preferential Issue on
conversion of warrants 30,68,875 3,37,57,627 10 3,06,88,750 33,75,76,270
02-Feb-05 Preferential Issue 11,96,662 3,49,54,289 10 1,19,66,620 34,95,42,890 05-Jul-07 Preferential Issue on
conversion of warrants 50,000 3,50,04,289 10 5,00,000 35,00,42,890
08-Mar-08 Preferential Issue on conversion of Convertible Debentures
40,00,000 3,90,04,289 10 4,00,00,000 39,00,42,890
EQUITY HISTORY OF THE COMPANY
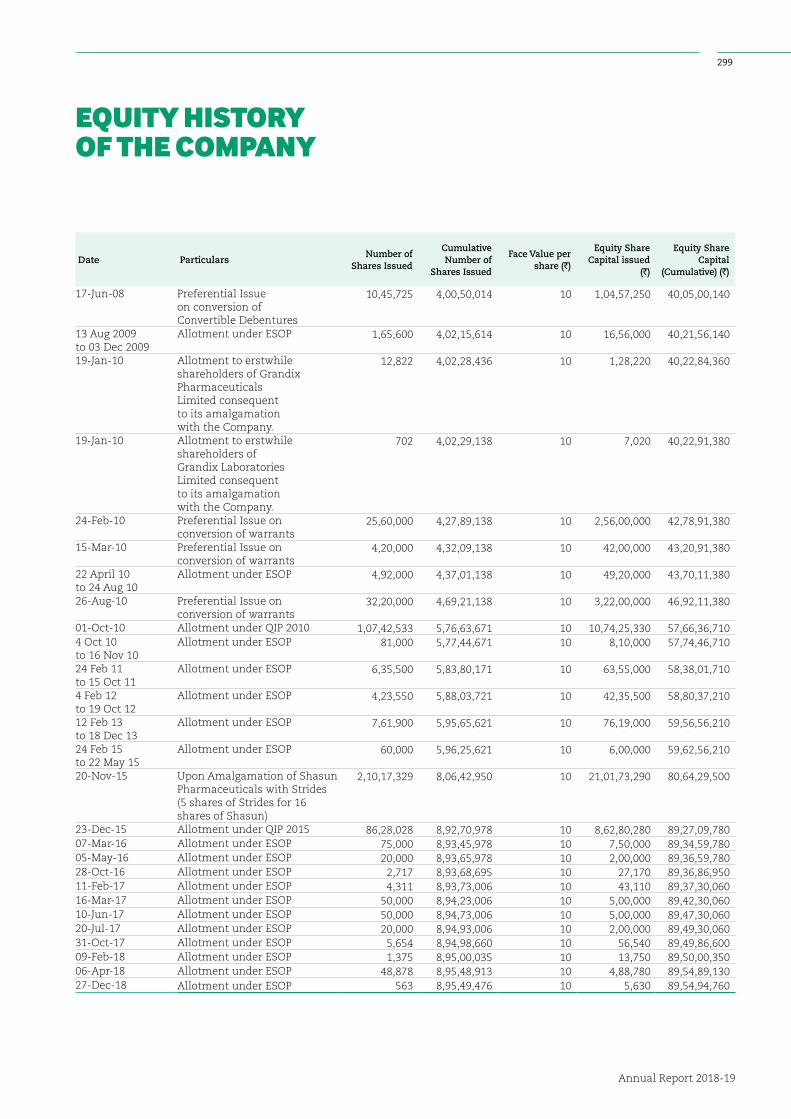
Annual Report 2018-19
299
Date Particulars Number of
Shares Issued
Cumulative Number of
Shares Issued
Face Value per share (`)
Equity Share Capital issued
(`)
Equity Share Capital
(Cumulative) (`)
17-Jun-08 Preferential Issue on conversion of Convertible Debentures
10,45,725 4,00,50,014 10 1,04,57,250 40,05,00,140
13 Aug 2009 to 03 Dec 2009
Allotment under ESOP 1,65,600 4,02,15,614 10 16,56,000 40,21,56,140
19-Jan-10 Allotment to erstwhile shareholders of Grandix Pharmaceuticals Limited consequent to its amalgamation with the Company.
12,822 4,02,28,436 10 1,28,220 40,22,84,360
19-Jan-10 Allotment to erstwhile shareholders of Grandix Laboratories Limited consequent to its amalgamation with the Company.
702 4,02,29,138 10 7,020 40,22,91,380
24-Feb-10 Preferential Issue on conversion of warrants
25,60,000 4,27,89,138 10 2,56,00,000 42,78,91,380
15-Mar-10 Preferential Issue on conversion of warrants
4,20,000 4,32,09,138 10 42,00,000 43,20,91,380
22 April 10 to 24 Aug 10
Allotment under ESOP 4,92,000 4,37,01,138 10 49,20,000 43,70,11,380
26-Aug-10 Preferential Issue on conversion of warrants
32,20,000 4,69,21,138 10 3,22,00,000 46,92,11,380
01-Oct-10 Allotment under QIP 2010 1,07,42,533 5,76,63,671 10 10,74,25,330 57,66,36,710 4 Oct 10 to 16 Nov 10
Allotment under ESOP 81,000 5,77,44,671 10 8,10,000 57,74,46,710
24 Feb 11 to 15 Oct 11
Allotment under ESOP 6,35,500 5,83,80,171 10 63,55,000 58,38,01,710
4 Feb 12 to 19 Oct 12
Allotment under ESOP 4,23,550 5,88,03,721 10 42,35,500 58,80,37,210
12 Feb 13 to 18 Dec 13
Allotment under ESOP 7,61,900 5,95,65,621 10 76,19,000 59,56,56,210
24 Feb 15 to 22 May 15
Allotment under ESOP 60,000 5,96,25,621 10 6,00,000 59,62,56,210
20-Nov-15 Upon Amalgamation of Shasun Pharmaceuticals with Strides (5 shares of Strides for 16 shares of Shasun)
2,10,17,329 8,06,42,950 10 21,01,73,290 80,64,29,500
23-Dec-15 Allotment under QIP 2015 86,28,028 8,92,70,978 10 8,62,80,280 89,27,09,780 07-Mar-16 Allotment under ESOP 75,000 8,93,45,978 10 7,50,000 89,34,59,780 05-May-16 Allotment under ESOP 20,000 8,93,65,978 10 2,00,000 89,36,59,780 28-Oct-16 Allotment under ESOP 2,717 8,93,68,695 10 27,170 89,36,86,950 11-Feb-17 Allotment under ESOP 4,311 8,93,73,006 10 43,110 89,37,30,060 16-Mar-17 Allotment under ESOP 50,000 8,94,23,006 10 5,00,000 89,42,30,060 10-Jun-17 Allotment under ESOP 50,000 8,94,73,006 10 5,00,000 89,47,30,060 20-Jul-17 Allotment under ESOP 20,000 8,94,93,006 10 2,00,000 89,49,30,060 31-Oct-17 Allotment under ESOP 5,654 8,94,98,660 10 56,540 89,49,86,600 09-Feb-18 Allotment under ESOP 1,375 8,95,00,035 10 13,750 89,50,00,350 06-Apr-18 Allotment under ESOP 48,878 8,95,48,913 10 4,88,780 89,54,89,130 27-Dec-18 Allotment under ESOP 563 8,95,49,476 10 5,630 89,54,94,760
EQUITY HISTORY OF THE COMPANY

NOTES
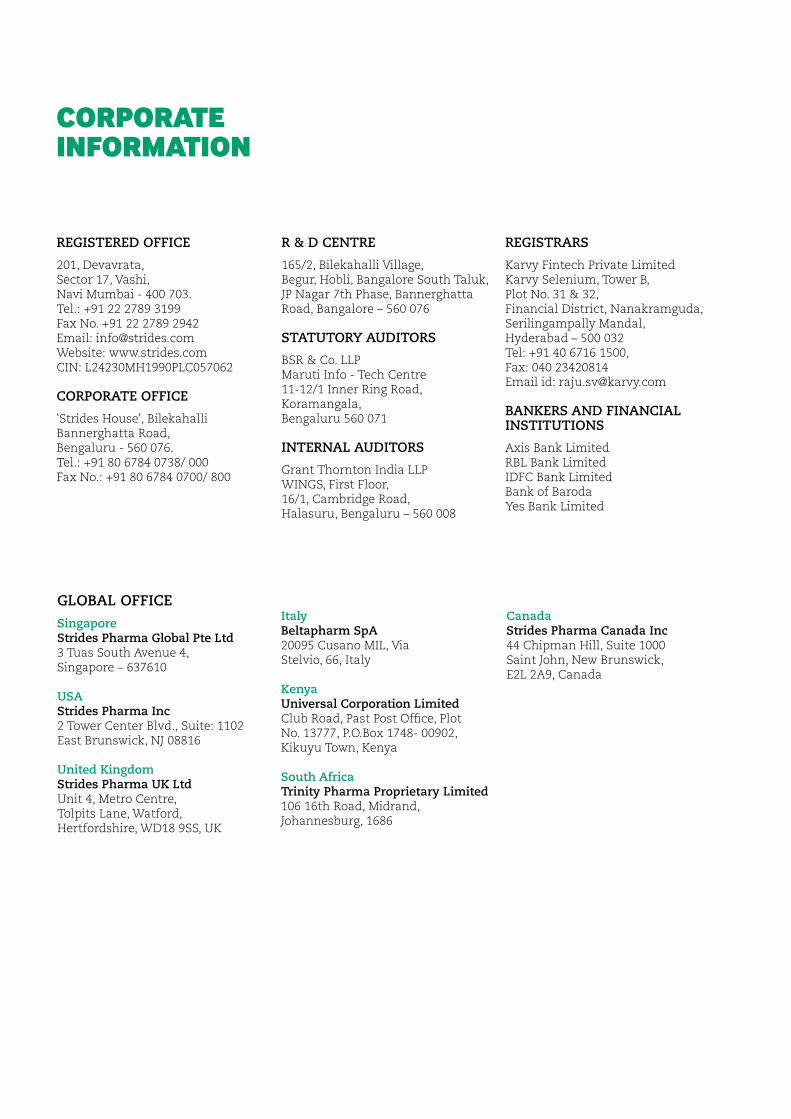
CORPORATE INFORMATION
REGISTERED OFFICE
201, Devavrata,Sector 17, Vashi,Navi Mumbai - 400 703.Tel.: +91 22 2789 3199Fax No. +91 22 2789 2942Email: [email protected]: www.strides.comCIN: L24230MH1990PLC057062
CORPORATE OFFICE
'Strides House', BilekahalliBannerghatta Road,Bengaluru - 560 076.Tel.: +91 80 6784 0738/ 000Fax No.: +91 80 6784 0700/ 800
R & D CENTRE
165/2, Bilekahalli Village,Begur, Hobli, Bangalore South Taluk, JP Nagar 7th Phase, Bannerghatta Road, Bangalore – 560 076
STATUTORY AUDITORS
BSR & Co. LLPMaruti Info - Tech Centre11-12/1 Inner Ring Road,Koramangala, Bengaluru 560 071
INTERNAL AUDITORS
Grant Thornton India LLPWINGS, First Floor,16/1, Cambridge Road,Halasuru, Bengaluru – 560 008
REGISTRARS
Karvy Fintech Private LimitedKarvy Selenium, Tower B,Plot No. 31 & 32,Financial District, Nanakramguda,Serilingampally Mandal,Hyderabad – 500 032Tel: +91 40 6716 1500,Fax: 040 23420814Email id: [email protected]
BANKERS AND FINANCIALINSTITUTIONS
Axis Bank LimitedRBL Bank LimitedIDFC Bank LimitedBank of BarodaYes Bank Limited
GLOBAL OFFICESingaporeStrides Pharma Global Pte Ltd3 Tuas South Avenue 4,Singapore – 637610
USAStrides Pharma Inc2 Tower Center Blvd., Suite: 1102East Brunswick, NJ 08816
United KingdomStrides Pharma UK LtdUnit 4, Metro Centre, Tolpits Lane, Watford, Hertfordshire, WD18 9SS, UK
ItalyBeltapharm SpA20095 Cusano MIL, Via Stelvio, 66, Italy
Kenya Universal Corporation LimitedClub Road, Past Post Office, Plot No. 13777, P.O.Box 1748- 00902, Kikuyu Town, Kenya
South AfricaTrinity Pharma Proprietary Limited106 16th Road, Midrand, Johannesburg, 1686
CanadaStrides Pharma Canada Inc44 Chipman Hill, Suite 1000Saint John, New Brunswick, E2L 2A9, Canada

REGISTERED OFFICE
201, Devavrata,Sector 17, Vashi,Navi Mumbai - 400 703.Tel.: +91 22 2789 3199Fax No. +91 22 2789 2942Email: [email protected]: www.strides.comCIN: L24230MH1990PLC057062
CORPORATE OFFICE
'Strides House', BilekahalliBannerghatta Road,Bengaluru - 560 076.Tel.: +91 80 6784 0738/ 000Fax No.: +91 80 6784 0700/ 800
Strides Pharma Science Limited(Formerly Strides Shasun Limited)CIN: L24230MH1990PLC057062