stress recognition from heterogeneous data
TRANSCRIPT

HAL Id: tel-01737211https://tel.archives-ouvertes.fr/tel-01737211
Submitted on 19 Mar 2018
HAL is a multi-disciplinary open accessarchive for the deposit and dissemination of sci-entific research documents, whether they are pub-lished or not. The documents may come fromteaching and research institutions in France orabroad, or from public or private research centers.
L’archive ouverte pluridisciplinaire HAL, estdestinée au dépôt et à la diffusion de documentsscientifiques de niveau recherche, publiés ou non,émanant des établissements d’enseignement et derecherche français ou étrangers, des laboratoirespublics ou privés.
Stress Recognition from Heterogeneous DataBo Zhang
To cite this version:Bo Zhang. Stress Recognition from Heterogeneous Data. Human-Computer Interaction [cs.HC].Université de Lorraine, 2017. English. �NNT : 2017LORR0113�. �tel-01737211�

AVERTISSEMENT
Ce document est le fruit d'un long travail approuvé par le jury de soutenance et mis à disposition de l'ensemble de la communauté universitaire élargie. Il est soumis à la propriété intellectuelle de l'auteur. Ceci implique une obligation de citation et de référencement lors de l’utilisation de ce document. D'autre part, toute contrefaçon, plagiat, reproduction illicite encourt une poursuite pénale. Contact : [email protected]
LIENS Code de la Propriété Intellectuelle. articles L 122. 4 Code de la Propriété Intellectuelle. articles L 335.2- L 335.10 http://www.cfcopies.com/V2/leg/leg_droi.php http://www.culture.gouv.fr/culture/infos-pratiques/droits/protection.htm

Ecole Doctorale IAEM Lorraine
Reconnaissance de stress à partir de données hétérogènes
Thèse
Présentée et soutenue publiquement le 03 juillet 2017
pour l’obtention du
Doctorat de l’Université de Lorraine
(mention Automatique, Traitement du signal et des images, Génie informatique)
par
Bo ZHANG
Composition du jury
Laboratoire de Conception, Optimisation et Modélisation des Systèmes
Rapporteurs : Christian BERGER-VACHON
Jean-Philippe BLONDÉ
Examinateurs : Edwige PISSALOUX
Guy BOURHIS
Yann MORÈRE
Loïc SIELER
Invités : Jacques FELBLINGER
Benoît BOLMONT

Ecole Doctorale IAEM Lorraine
Stress Recognition from Heterogeneous Data
Thesis
Publicly presented and supported on 03 July 2017
To obtain the
Doctorate of the University of Lorraine
(Automation, Signal and Image Processing, Computer Engineering)
by
Bo ZHANG
Composition of the jury
Laboratory of Design, Optimization and Modeling of Systems
Rapporteurs : Christian BERGER-VACHON
Jean-Philippe BLONDÉ
Reviewers : Edwige PISSALOUX
Guy BOURHIS
Yann MORÈRE
Loïc SIELER
Invited experts: Jacques FELBLINGER
Benoît BOLMONT
Loïc SIELER


Acknowledgements
I would like to acknowledge Mr Guy Bourhis, my thesis director, for giving this opportunity
to work with him and for helping me to learn how to perform the PhD study. Without his
support, I could not carry out the research work of my thesis.
I would like to acknowledge Mr Yann Morère, my thesis co-director, for his support
throughout my work and for his scientific and technical advices.
I would like to acknowledge Mr Loïc Sieler, my thesis co-supervisor, for his support and
encouragement in the study of the embedded system.
I would like to acknowledge Mr Christian Berger-Vachon, Professor at the University of
Lyon 1 and Mr Jean-Philippe Blondé, Associate professor HDR at IUT Louis-Pasteur, for
agreeing to be my reviewers and for evaluating my thesis report.
I would like to acknowledge Mrs Edwige Pissaloux, Professor at the University of Rouen,
for agreeing to be a member of thesis jury and for reviewing the work of my thesis.
I would like to acknowledge Mr Jacques Felblinger, Professor at the University of Lor-
raine, for his presence in my thesis jury and for evaluating my work in the thesis committee.
I would like to acknowledge Mr Benoît Bolmont, Professor at the University of Lorraine,
for his presence in my thesis jury and for his support in the design of the experiments.
I would also like to acknowledge Mrs Cécile Langlet for her support in the study of psy-
chobiological reaction pattern.
I would also like to acknowledge Mr Camel Tanougast for his help understanding the
processing of the embedded system while I studied in his course. I would like to further
acknowledge Mr Dominique Méry, Mr Imed Kacem and Mr Marc Dalaut for all their advices
in my PhD academic study.
I would like to thank Mr Régis Grasse for his support in the design of the experimental
platform for data acquisition and for his help in solving the technical problems faced in the
experiments. I would also like to thank Mr Jean-Philippe Hainaut for discussing the signal
acquisition and signal analysis. I would also like to thank Mrs Wahida Handouzi, Mr Frédéric
Bousefsaf and Mr Lucas Cicero for their helps in introducing the research methodology and
writing codes in Matlab and for their great friendships. I would also like to thank all the
students that participated in our experiments.

2
I would also like to thank my parents for their constant love andfor their support for me in
the hardest times. I would also like to thank my friends, Chaojie Wei, Wen Luo, Hang Chen
and Da Li, for their helps in many matters.
Contents
Contents 3
List of Figures 7
List of Tables 9
1 Introduction 11
2 Background 15
2.1 Stress . . . . . . . . . . . . . . . . . . . . . . . . . . . . . . . . . . . . . .15
2.2 Stressors . . . . . . . . . . . . . . . . . . . . . . . . . . . . . . . . . . . .17
2.3 Modalities for stress recognition . . . . . . . . . . . . . . . . . . . .. . . . 19
2.3.1 Physiological signals . . . . . . . . . . . . . . . . . . . . . . . . . .20
2.3.1.1 Blood volume pulse (BVP) . . . . . . . . . . . . . . . . .20
2.3.1.2 Electrocardiogram (ECG) . . . . . . . . . . . . . . . . . .21
2.3.1.3 Respiration . . . . . . . . . . . . . . . . . . . . . . . . . .22
2.3.1.4 Electromyography (EMG) . . . . . . . . . . . . . . . . . .23
2.3.1.5 Skin temperature . . . . . . . . . . . . . . . . . . . . . . .24
2.3.1.6 Electroencephalography (EEG) . . . . . . . . . . . . . . .25
2.3.1.7 Electrodermal activity (EDA) . . . . . . . . . . . . . . . .26
2.3.1.8 Summary of physiological signals . . . . . . . . . . . . .26
2.3.2 Facial features . . . . . . . . . . . . . . . . . . . . . . . . . . . . .26
2.3.2.1 Facial expressions . . . . . . . . . . . . . . . . . . . . . .27
2.3.2.2 Eye movements . . . . . . . . . . . . . . . . . . . . . . .28
2.3.2.3 Pupil dilation . . . . . . . . . . . . . . . . . . . . . . . . 29
2.3.3 Voice . . . . . . . . . . . . . . . . . . . . . . . . . . . . . . . . . .30
2.3.4 Reaction time . . . . . . . . . . . . . . . . . . . . . . . . . . . . . .32
2.3.5 Additional modalities . . . . . . . . . . . . . . . . . . . . . . . . . .33
2.3.6 Summary of the modalities . . . . . . . . . . . . . . . . . . . . . . .34

4 Contents
2.4 Literature review of the methodologies for stress recognition . . . . . . . . . 34
2.4.1 Stress recognition given physiological signals . . . . . .. . . . . . . 35
2.4.2 Stress recognition given facial features and voice . . . .. . . . . . . 37
2.5 Systems for stress recognition . . . . . . . . . . . . . . . . . . . . . . .. . 39
2.5.1 Embedded systems in the laboratory setting . . . . . . . . . . .. . . 39
2.5.2 Stress monitoring systems in the commercial market . . . .. . . . . 45
2.6 Discussion . . . . . . . . . . . . . . . . . . . . . . . . . . . . . . . . . . . .47
2.7 Summary . . . . . . . . . . . . . . . . . . . . . . . . . . . . . . . . . . . .50
3 Experiments for signal acquisition 51
3.1 First design for signal acquisition . . . . . . . . . . . . . . . . . . .. . . . . 51
3.2 Second design for signal acquisition . . . . . . . . . . . . . . . . . .. . . . 54
3.2.1 Experimental protocol of the experiment using visual stressor . . . . 54
3.2.2 Experimental protocol of the experiment using auditorystressor . . . 57
3.3 BIOPACTM System and acquisition of physiological signals . . . . . . . . .59
3.4 Preprocessing of the physiological signals . . . . . . . . . . . .. . . . . . . 59
3.5 Statistical analysis . . . . . . . . . . . . . . . . . . . . . . . . . . . . . . .. 62
3.5.1 Student’s t-test . . . . . . . . . . . . . . . . . . . . . . . . . . . . .62
3.5.2 Statistical analysis of the first design of the experiment . . . . . . . . 63
3.5.3 Statistical analysis of the second design of the experiment . . . . . . 65
3.5.3.1 The experiment of visual stressor . . . . . . . . . . . . . .65
3.5.3.2 The experiment of auditory stressor . . . . . . . . . . . . .66
3.6 Discussion . . . . . . . . . . . . . . . . . . . . . . . . . . . . . . . . . . . .68
3.7 Summary . . . . . . . . . . . . . . . . . . . . . . . . . . . . . . . . . . . .69
4 Stress recognition 71
4.1 Stress recognition using physiological signals . . . . . . . .. . . . . . . . . 71
4.1.1 Feature extraction . . . . . . . . . . . . . . . . . . . . . . . . . . . .72
4.1.1.1 Sample mean . . . . . . . . . . . . . . . . . . . . . . . .72
4.1.1.2 Standard deviation . . . . . . . . . . . . . . . . . . . . .73
4.1.1.3 First absolute difference . . . . . . . . . . . . . . . . . .73
4.1.1.4 Second absolute difference . . . . . . . . . . . . . . . . .73
4.1.1.5 Normalized first absolute difference . . . . . . . . . . . . .73
4.1.1.6 Normalized second absolute difference . . . . . . . . . . .74
4.1.1.7 Feature normalisation . . . . . . . . . . . . . . . . . . . .74
4.1.2 Classification . . . . . . . . . . . . . . . . . . . . . . . . . . . . . .74
4.1.2.1 Theoretical background of SVM . . . . . . . . . . . . . .75
Contents 5
4.1.2.2 Our implementation of SVM . . . . . . . . . . . . . . . .77
4.2 Stress recognition using RT . . . . . . . . . . . . . . . . . . . . . . . . . .. 78
4.3 Decision fusion . . . . . . . . . . . . . . . . . . . . . . . . . . . . . . . . .79
4.4 Test on a published stress data set . . . . . . . . . . . . . . . . . . . . .. . 82
4.4.1 Description of the stress data set . . . . . . . . . . . . . . . . . . .. 82
4.4.2 Test results . . . . . . . . . . . . . . . . . . . . . . . . . . . . . . .83
4.5 Test on the recordings of the first design of experiment . . . .. . . . . . . . 83
4.6 Test on the recordings of the second design of experiments .. . . . . . . . . 85
4.6.1 The experiment of visual stressor . . . . . . . . . . . . . . . . . . .85
4.6.2 The experiment of auditory stressor . . . . . . . . . . . . . . . . .. 87
4.7 Discussion . . . . . . . . . . . . . . . . . . . . . . . . . . . . . . . . . . . .91
4.8 Summary . . . . . . . . . . . . . . . . . . . . . . . . . . . . . . . . . . . .93
5 Implementation of the signal processing 95
5.1 Implementation on Android OS based mobile device . . . . . . . .. . . . . 96
5.1.1 ECG based HR computation . . . . . . . . . . . . . . . . . . . . . .96
5.1.2 Processing of classification . . . . . . . . . . . . . . . . . . . . . .97
5.1.2.1 Feature extraction . . . . . . . . . . . . . . . . . . . . . .97
5.1.2.2 SVM classification . . . . . . . . . . . . . . . . . . . . .98
5.2 Implementation in FPGA . . . . . . . . . . . . . . . . . . . . . . . . . . . .99
5.2.1 ECG based HR computation . . . . . . . . . . . . . . . . . . . . . .99
5.2.2 Processing of classification . . . . . . . . . . . . . . . . . . . . . .101
5.2.2.1 Feature extraction . . . . . . . . . . . . . . . . . . . . . .101
5.2.2.2 SVM classification . . . . . . . . . . . . . . . . . . . . .101
5.3 Discussion of the feasibility of implementation . . . . . . . .. . . . . . . . 102
5.4 Implementation of QRS complex detection . . . . . . . . . . . . . . .. . . 103
5.4.1 The existing FPGA-based algorithms for QRS complex detection . . 103
5.4.2 Theoretical background . . . . . . . . . . . . . . . . . . . . . . . .104
5.4.2.1 Wavelet transform . . . . . . . . . . . . . . . . . . . . . .104
5.4.2.2 Integer Haar Transform . . . . . . . . . . . . . . . . . . .105
5.4.3 Proposed FPGA-based algorithm for the QRS complex detection . . . 105
5.4.4 Matlab simulation . . . . . . . . . . . . . . . . . . . . . . . . . . .107
5.4.4.1 Comparison between the proposed detection algorithmand
the algorithm proposed by Stojanovic . . . . . . . . . . . 111
5.4.4.2 Comparison in terms of rounding . . . . . . . . . . . . . .111
5.4.4.3 Comparison in terms of sampling frequency reduction .. . 114
5.4.4.4 Conclusion . . . . . . . . . . . . . . . . . . . . . . . . .120

6 Contents
5.4.5 FPGA implementation . . . . . . . . . . . . . . . . . . . . . . . . .122
5.4.5.1 Hardware architecture of FPGA implementation . . . . . .122
5.4.5.2 Simulation result of the proposed system . . . . . . . . . .125
5.4.5.3 Hardware performance . . . . . . . . . . . . . . . . . . .126
5.5 Discussion of the implementation in FPGA . . . . . . . . . . . . . . .. . . 127
5.6 Summary . . . . . . . . . . . . . . . . . . . . . . . . . . . . . . . . . . . .128
6 Conclusions and prospect 131
References 135
A Mathematical functions of the Pan-Tompkins algorithm 149
B Publications related to the thesis 151

List of Figures
1.1 Psypocket Project. . . . . . . . . . . . . . . . . . . . . . . . . . . . . . . .12
2.1 Central nervous system and peripheral nervous system [2]. . . . . . . . . . . 16
2.2 Automatic nervous system [1]. . . . . . . . . . . . . . . . . . . . . . . . . . 17
2.3 An example of the PPG. . . . . . . . . . . . . . . . . . . . . . . . . . . . .20
2.4 A normal electrocardiogram [108]. . . . . . . . . . . . . . . . . . . . . . . . 21
2.5 An example of the respiration signal [53]. . . . . . . . . . . . . . . . . . . . 23
2.6 An example of EMG signal [53]. . . . . . . . . . . . . . . . . . . . . . . . 24
2.7 An example of EDA signal. . . . . . . . . . . . . . . . . . . . . . . . . . . .27
2.8 An example of vision tracking points on subject’s face usedin [60]. . . . . . 28
2.9 Illustration of wireless BAN of intelligent sensors in telemedicine [62]. . . . 41
2.10 Illustration of wireless network architecture for iCalm[40]. . . . . . . . . . 41
2.11 Illustration of ankle worn band [40]. . . . . . . . . . . . . . . . . . . . . . . 42
2.12 Illustration of mobile healthcare system [63]. . . . . . . . . . . . . . . . . . 43
2.13 Wearable ECG and PPG sensors [63]. . . . . . . . . . . . . . . . . . . . . . 43
2.14 Textile structure [86]. . . . . . . . . . . . . . . . . . . . . . . . . . . . . . 44
2.15 Front view (A) and back view (B) of vest [86]. . . . . . . . . . . . . . . . . 44
2.16 Left view (A) and right view (B) of ECGZ2 device [86]. . . . . . . . . . . . 45
2.17 Device of StressEraserTM [3]. . . . . . . . . . . . . . . . . . . . . . . . . . . 46
2.18 Device of emWaveTM [5]. . . . . . . . . . . . . . . . . . . . . . . . . . . . 46
2.19 Device of ThoughtStreamTM system [4]. . . . . . . . . . . . . . . . . . . . . 47
3.1 Display board. . . . . . . . . . . . . . . . . . . . . . . . . . . . . . . . . . .52
3.2 BIOPACTM System. . . . . . . . . . . . . . . . . . . . . . . . . . . . . . . . 53
3.3 Illustration of one RT task in the normal condition. . . . . . .. . . . . . . . 53
3.4 The experimental platform. . . . . . . . . . . . . . . . . . . . . . . . . . .. 55
3.5 Schedule of the visual stressor experiment. . . . . . . . . . . . .. . . . . . 55
3.6 Illustration of RT task. . . . . . . . . . . . . . . . . . . . . . . . . . . . . .56

8 List of Figures
3.7 Stroop test. . . . . . . . . . . . . . . . . . . . . . . . . . . . . . . . . . . .57
3.8 Illustrations of Stroop task. . . . . . . . . . . . . . . . . . . . . . . . .. . . 58
3.9 Schedule of the auditory stressor experiment. . . . . . . . . . .. . . . . . . 58
3.10 The acquisition of EDA. . . . . . . . . . . . . . . . . . . . . . . . . . . . .59
3.11 The acquisition of EMG. . . . . . . . . . . . . . . . . . . . . . . . . . . . .60
3.12 Illustration of the ECG contamination. . . . . . . . . . . . . . . .. . . . . 61
3.13 Illustration of the removal of ECG contamination. . . . . . .. . . . . . . . 61
4.1 Block diagram of the stress recognition using physiological signals. . . . . . 72
4.2 Block diagram of the stress recognition using RT. . . . . . . . .. . . . . . . 79
4.3 Block diagram of decision fusion using three physiological signals and RT. . 80
5.1 Block diagram of the stress recognition. . . . . . . . . . . . . . . .. . . . . 96
5.2 Simplified architecture of the proposed QRS detection algorithm. x(n) is the
original ECG record. Pos_QRS is the location of QRS fiducial in the detail
signal CD4(n) and Pos_R_peak is the location of real R peak in x(n). . . . . .106
5.3 Wavelet decomposition scheme. . . . . . . . . . . . . . . . . . . . . . . .. 106
5.4 QRS detection using wavelet decomposition. x is the original ECG signal. . . 107
5.5 Real R peak location in the original ECG record. x(n) is the original ECG
signal and the detected R peak locations are pointed with the vertical red line.110
5.6 An example of the distortion of the ECG signal with the multiple factors of 10.115
5.7 Zone of R peak. . . . . . . . . . . . . . . . . . . . . . . . . . . . . . . . . .115
5.8 Wavelet decomposition scheme. . . . . . . . . . . . . . . . . . . . . . . .. 119
5.9 Simplified diagram of FPGA implementation. . . . . . . . . . . . . .. . . . 123
5.10 Architecture of the IHT block. . . . . . . . . . . . . . . . . . . . . . . .. . 123
5.11 Architecture of one IHD module. . . . . . . . . . . . . . . . . . . . . . .. 124
5.12 Architecture of the DF block. . . . . . . . . . . . . . . . . . . . . . . . .. . 125
5.13 Architecture of CMAX unit. . . . . . . . . . . . . . . . . . . . . . . . . . .125
5.14 Illustration of the FPGA simulation results. . . . . . . . . . .. . . . . . . . 126
5.15 Illustration of the MATLAB simulation results. . . . . . . . .. . . . . . . . 127
List of Tables
2.1 Waves bands, frequency range and individual characteristic in the EEG [116]. 25
3.1 The p-values of t-test for EDA. . . . . . . . . . . . . . . . . . . . . . . . .. 64
3.2 The p-values of t-test for EMG. . . . . . . . . . . . . . . . . . . . . . . . .. 64
3.3 The p-values of t-test for HRV. . . . . . . . . . . . . . . . . . . . . . . . .. 64
3.4 The p-values of t-test for RT. . . . . . . . . . . . . . . . . . . . . . . . . .. 65
3.5 The p-value of t-test for mean (a) and standard deviation (b) of three physio-
logical signals (experiment of visual stressor). . . . . . . . . . . . . . . . .66
3.6 The p-value of t-test for mean of RT (a) and standard deviation of RT (b)
(experiment of visual stressor ) . . . . . . . . . . . . . . . . . . . . . . . . .67
3.7 The p-value of t-test for mean (a) and standard deviation (b) of three physio-
logical signals (experiment of auditory stressor). . . . . . . . . . . . . . . . .68
3.8 The p-value of t-test for mean of RT (a) and standard deviation of RT (b)
(experiment of auditory stressor) . . . . . . . . . . . . . . . . . . . . . . . .68
4.1 Kernel functions. . . . . . . . . . . . . . . . . . . . . . . . . . . . . . . . .77
4.2 Classification accuracies on the published stress data set. . . . . . . . . . . . 83
4.3 Classification accuracies of SVM for the first design of experiment. . . . . . 84
4.4 Classification accuracies of decision fusion for the first design of experiment. 84
4.5 Classification accuracies of SVM for low stress vs. high stress (experiment of
visual stressor) . . . . . . . . . . . . . . . . . . . . . . . . . . . . . . . . .86
4.6 Classification accuracies of SVM for medium stress vs. highstress (experi-
ment of visual stressor) . . . . . . . . . . . . . . . . . . . . . . . . . . . . .87
4.7 Classification accuracies of decision fusion for low stress vs. high stress (ex-
periment of visual stressor) . . . . . . . . . . . . . . . . . . . . . . . . . . .88
4.8 Classification accuracies of decision fusion for medium stress vs. high stress
(experiment of visual stressor) . . . . . . . . . . . . . . . . . . . . . . . . .88

10 List of Tables
4.9 Classification accuracies of SVM for low stress vs. high stress (experiment of
auditory stressor) . . . . . . . . . . . . . . . . . . . . . . . . . . . . . . . .89
4.10 Classification accuracies of SVM for medium stress vs. high stress (experi-
ment of auditory stressor) . . . . . . . . . . . . . . . . . . . . . . . . . . .90
4.11 Classification accuracies of decision fusion for low stress vs. high stress (ex-
periment of auditory stressor) . . . . . . . . . . . . . . . . . . . . . . . . . .90
4.12 Classification accuracies of decision fusion for medium stress vs. high stress
(experiment of auditory stressor) . . . . . . . . . . . . . . . . . . . . . . . .91
5.1 IBI values computed by our proposed detection algorithm. .. . . . . . . . . 108
5.2 IBI values computed by the algorithm presented in [119]. . . . . . . . . . . 109
5.3 Mean deviations for the computed IBI values. . . . . . . . . . . . .. . . . . 110
5.4 IBI values with the multiple factors of 1000. . . . . . . . . . . . .. . . . . 112
5.5 IBI values with the multiple factors of 100. . . . . . . . . . . . . .. . . . . 113
5.6 Mean deviations for the computed IBI values. . . . . . . . . . . . .. . . . . 114
5.7 IBI values with the sampling frequencies of 1000Hz (QRS fiducial points de-
tected in CD4(n)). . . . . . . . . . . . . . . . . . . . . . . . . . . . . . . .116
5.8 Mean deviations for the computed IBI values with the sampling frequencies
of 1000Hz (QRS fiducial points detected in CD4(n)). . . . . . . . . . . . . . 117
5.9 IBI values with the sampling frequencies of 500Hz (QRS fiducial points de-
tected in CD4(n)). . . . . . . . . . . . . . . . . . . . . . . . . . . . . . . .118
5.10 Number of missed R peaks and correct detection accuracy with the sampling
frequencies of 500Hz (QRS fiducial points detected in CD4(n)). . . . . . . . 119
5.11 IBI values with the sampling frequencies of 500Hz (QRS fiducial points de-
tected in CD3(n)). . . . . . . . . . . . . . . . . . . . . . . . . . . . . . . .121
5.12 Mean deviations for the computed IBI values with the sampling frequencies
of 500Hz (QRS fiducial points detected in CD3(n)). . . . . . . . . . . . . . . 122
5.13 Performance of the modified detection algorithm. . . . . . . .. . . . . . . . 123
5.14 Comparison of hardware performance with the system proposed in [119]. . . 127

Chapter 1
Introduction
In modern society, people face a variety of stress in their everyday life. Historically, stress has
been defined as a reaction from a calm state to an excited state for the purpose of preserving the
integrity of the organism [53]. In the psychobiological aspect, stress is regarded as a series of
complex psychological, cognitive and behavioural reactions controlled by the human Central
Nervous System (CNS) and Peripheral Nervous System (PNS).
We usually distinguish the positive stress and the negative stress [115]. The positive stress
is normally beneficial to the subjects and does not need them to deal with complicated problem
or adapt themselves to the new situation. If the stress is harmful to the subjects and can bring
in negative consequences such as mental and physical problems, this stress is regarded as the
negative stress. Normally, when we mention the “stress”, in general terms, it is the negative
stress.
It has been found that when the stress derived from family or working environment appears
persistently, it has severe impacts on individuals [116]. The researches showed that chronic
stress can lead to various mental and physical problems, such as the cardiovascular disease
and immune deficiencies [26]. In addition, when the stress is quite powerful, for the people
who always face emergency situations (such as fireman or astronaut), it may alter their actions
and put them in danger. Therefore, it is quite meaningful to assess the stress of an individual
and then provide solutions for feedback to regulate this state.
Traditionally, to provide this assessment, people are asked to fill in standardized question-
naire (e.g., Perceived Stress Questionnaire [29]). The questionnaire quantifies and rates the
levels of stress on some predetermined scale. However, this subjective assessment requires an
individual manually interprets behavioural patterns and the related affective states.
Later, the researchers found that the body expressions such as the physiological responses,
facial features (facial expressions, eye gaze and eye blinks) and voice could be the channels
to analyze the affective state of an individual [108]. Therefore, the characteristics of these

12 Introduction
Figure 1.1: Psypocket Project.
body expressions were investigated. The physiological responses were normally analyzed by
measuring the characteristics of the physiological signals of an individual such as Electrocar-
diography (ECG), Electromyography (EMG) and Electrodermal activity (EDA) under differ-
ent affective states [102]. The facial features were normally investigated by measuring the
features such as facial expressions, eye movements and pupil dilation from the facial images
or videos recorded by the sensors like cameras [37]. The voice was analyzed by measuring
the vocal characteristics such as loudness and fundamental frequency from the speech [111].
Meanwhile, the potentials of adopting body expressions for stress recognition were discussed
and some detection strategies have been proposed [129]. However, it has been found that the
use of body expressions like the physiological signals to recognize the stress state of an indi-
vidual is neither an easy nor a direct task. There are no golden rules that have been found and
validated.
In our laboratory, attention has been paid to the study of stress recognition. The researchers
proposed the Psypocket project which is aimed at making a portable system able to analyze ac-
curately the stress state of an individual based on physiological, psychological and behavioural
modifications. It should then offer solutions for feedback to regulate this state. The system
adopts the data from heterogeneous sources, such as physiological signal, cognitive reaction
and behavioural reaction, for stress recognition (see Figure1.1).
The research of this thesis is an essential part of the Psypocket project. We discuss the
feasibility and the interest of stress recognition from heterogeneous data and propose an ap-
proach to achieve the processing of recognition. In this thesis, not only physiological signals,
such as ECG, EMG and EDA, but also reaction time (RT) are adopted to recognize different

13
stress states of an individual. The physiological responses were found to be effective to assess
the stress of the subject [53, 83]. However, although some studies have shown a relationship
between stress and RT [19, 31], little attention has been paid to use reaction time for stress
recognition. The recording reaction time is noninvasive since the subject does not need to be
in physical contact with the adhesive electrodes. Besides, in some cases, we monitor the stress
of an individual when he is performing a keyboard typing task. Therefore, it is quite mean-
ingful to adopt the reaction time to recognize the stress state of an individual. Thus, we adopt
reaction time as another input signal of our recognition system and discuss its feasibility of
stress recognition. Meanwhile, we also discuss the feasibility of stress recognition by merging
the physiological signals and RT and evaluate the performance of the proposed recognition
strategy.
Besides, we discuss the feasibility of embedded system which would realize the complete
data processing. The embedded system adopts three physiological recordings (ECG, EMG
and EDA) and the RT as the input signals. The informative features are extracted from the
input signals and the Support Vector Machine is trained with these features to classify differ-
ent stress levels. All the processing for stress recognition is performed on-board the system.
For the existing commercial stress monitoring systems like StressEraserTM (Helicor) [3] and
ThoughtStreamTM system (Mindplace) [4], the measure of the stress only depends on the anal-
ysis of one type of physiological responses. The study of this thesis can contribute to make a
portable system to recognize the stress of an individual in real time by adopting heterogeneous
data like physiological signals and RT. Such system can be expected to provide a more reliable
recognition of the stress states of an individual.
The following chapters are organized as follows: in the second chapter, we firstly introduce
the conception of the stress and indicate the importance of its assessment for an individual. The
stressors in the real life and the prototypes to arouse the stress of the subjects in the laboratory
settings are presented as well. Then, a variety of modalities of the body expressions, such
as physiological responses, facial expressions and voice, are described and their potentials for
stress recognition presented in the literature are investigated. The methodologies of automated
recognition of stress given body expressions proposed in the literature and the existed stress
recognition systems are discussed as well. In the end, we emphasized that it is meaningful to
discuss the feasibility of stress recognition given reaction time.
In the third chapter, we present two designs of the experiment to acquire the physiological
signals and RT related to the stress. The first design adopts a sound of huge noise (high dB)
to elicit the stress of the subjects. The second design adopts respectively a visual stressor
(Stroop test) and an auditory stressor (acoustic induction) to elicit it. For each design of the
experiment, we describe the experimental protocol, the preprocessing of the physiological

14 Introduction
signals and the statistical analysis of the recorded physiological signals and RT. The statistical
analysis is applied to find out if a statistical significant difference of the subject’s physiological
signals and RT exists when the subject is under different stress levels.
In the fourth chapter, we present our methodology of stress recognition given physiolog-
ical signals and RT. The recognition is achieved by using the Support Vector Machines. Be-
sides, the approach of decision fusion for stress recognition is also described. The proposed
approaches of recognition have been tested on a published stress data set and on the physiolog-
ical signals and RT acquired during our designed experiments. The recognition performance
is discussed and evaluated in the end of this chapter.
In the fifth chapter, we discuss the feasibility of an embedded system which would realize
the complete signal processing of the stress recognition. Two approaches of implementation,
Android OS based mobile device and FPGA are analyzed. The FPGA is found to be more suit-
able to realize the complete recognition processing. Besides, we present the implementation
of the ECG based HR computation in FPGA, which is an important block of our processing
of stress recognition.
In the end, the sixth chapter discusses the conclusion and the prospects of the future work.

Chapter 2
Background
In this chapter, we provide a description of the stress of an individual and present the modal-
ities and methodologies to recognize the stress. In the first section, we introduce the concept
of the stress and indicate the importance of the assessment of the stress of an individual. In
the second section, the stressors in the real life and the prototypes to arouse the stress of the
subjects in the laboratory settings are presented. In the third section, a variety of modalities of
the body expressions, such as physiological responses, facial expressions, voice and reaction
time, are introduced and their potentials for stress recognition presented in the literature are
investigated.
Then, in the fourth section, the existed methodologies of automated recognition of stress
given physiological signals as well as other modalities such as facial features and voice in the
literature are discussed. In the fifth section, we review the prototyping of an embedded system
for stress recognition and the stress monitoring systems in the commercial market.
Finally, in the sixth section, we propose our choice of the modalities for stress recognition
and the studies that are performed in this thesis.
2.1 Stress
Historically, stress has been defined as a reaction from a calm state to an excited state for
the purpose of preserving the integrity of the organism [53]. In the psychobiological aspect,
stress is regarded as a complex reaction pattern that often has psychological, cognitive and
behavioural components [85]. For a human, the Central Nervous System (CNS) controls the
reactions of the body and the Peripheral Nervous System (PNS) carries information between
the body and the CNS (see Figure2.1) [105]. The PNS can be divided by Somatic nervous sys-
tem and Automatic nervous system (ANS) . The Somatic nervous system controls the skeletal
muscles to deal with the voluntary activities such as the body movement and the ANS controls

16 Background
Figure 2.1: Central nervous system and peripheral nervous system [2].
unconscious actions. The ANS of human beings is consisted of the sympathetic nervous sys-
tem (SNS), parasympathetic nervous system and enteric divisions [129]. The ANS controls
smooth muscles, cardiac muscles and the sweat glands and these ANS related organs will be
activated when people deal with the stress and emotional arousal (see Figure2.2). When the
stress is perceived by our brain, the SNS stimulates the hypothalamus and the stress hormones
are secreted to decrease digestion, increase the heart rate and the metabolic rate, and dilate
blood vessel in the heart and muscles which help people to prepare for the stress [7]. Our
body will release large amounts of energy during this physical response to stress. When the
brain perceives that the stress is over, the parasympathetic nervous system works to return the
hormones to the baseline levels so that our body can go back to the resting condition.
In [115], Selye proposed two concepts of the stress: “eustres” which is the positive stress
and “distress” which is the negative stress. If the stress can bring in positive changes and
does not need the subjects to deal with complicated problem or adapt themselves to the new
situation, this stress can be regarded as “eustres”. Eustress is normally beneficial to the sub-
jects and can help them achieve their goals. On the other hand, if the stress is harmful to the
subjects and can bring in negative consequences such as mental and physical problems, this
stress is regarded as “distress”. Normally, when we mention the “stress”, in general terms, it
is the “distress”.

2.2 Stressors 17
Figure 2.2: Automatic nervous system [1].
Besides, in [9], the stress is distinguished with three categories: acute stress, episodic
stress and chronic stress. This discrimination is based on the time of exposure to stressors.
Acute stress is the innate response of an individual when he or she is short lasting exposure
to stressors. Normally, this stress do not bring in negative consequences. Episodic stress is
normally discovered when an individual experiences a very stressful life [17]. This stress
appears when stressful situations occur frequently but cease from time to time. Chronic stress
is the stress which appears persistently. This stress is discovered when an individual faces
stressors derived from family or working environment [30]. Normally, for an individual, the
chronic stress is considered as quite harmful.
It has been found that when the stress is quite powerful, it has severe impacts on indi-
viduals [116]. Continuous stress can lead to various mental and physical problems [26]. In
2007, the research indicated that the stress was the second most common work-related health
problem in the European Union [41]. In addition, for the people who always face emergency
situations (e.g., fireman), stress may alter their actions and put them in danger. Therefore, it is
meaningful to provide the assessment of the stress of an individual.
2.2 Stressors
The stressors act as the stimulus to elicit a complex physiological, psychological and be-
havioural responses of an individual. These responses can lead to various changes in emotion,
cognition and behaviour. For the moment, the categorization of the stressors is still a question
to the researchers. A major problem is to figure out whether the brain deals with stressors

18 Background
categorically. That is to say, we would like to know whether thebrain categorizes stressors
and give back the specific responses according to the category. However, there are no gen-
erally accepted rules which have been found. Normally, categorization proponents generally
suggest that depending on the discrimination of our brain, there are two kinds of stressors
[34]. The first kind are the ones which lead to the actual disturbances of physiological sta-
tus, such as haemorrhage, immune challenge or infection. These stressors are normally called
the physical or systemic stressors. The second kind are the ones which affect the current or
anticipated state of an individual, such as social conflict, noise and unsatisfied environment
stimulus. These stressors are normally called psychological or emotional stressors.
Since chronic stress can lead to various mental and physical problems, a variety of chronic
stressors have been paid attentions. In [58], the surgical stress during general anaesthesia was
studied. The researchers found that the surgical nociceptive stimuli was a stressor which could
bring in the stress responses during the surgery. They are unconscious response to the injury
and trauma, which could lead to autonomic and metabolic changes in heart rate variability and
blood circulation.
In [54], the researchers studied nine call center employees for a week and analyzed their
stress state at work. The stressful work settings was declared as a stressor which could lead
to the chronic stress. This stressor could bring in a negative effect to the employees so that
they could not provide a better experience for customers. The researchers said that to manage
this chronic stress, it was quite important to recognize precisely when and where the stress
appears. This could lead to more timely and reduced-cost interventions and more pleasant
environments, so that the employees could better manage their workload in such stressful
work settings.
In [9], the researcher declared that even in the normal working environment, the stress also
appears which can lead to many health problems and huge economic losses in companies. In
this case, the stressors are not only continuous high mental workloads but also the non-stop
technological development. These stressors bring in constant changes so that the subjects need
for adaptation and their stress are aroused. The researchers said that it is necessary to detect
the stress of work in its early stages. In this way, we may manage the stress before it becomes
chronic and can further prevent personal and economic damages.
In the real life, an increase in driver workload is another important stressor [53, 108].
Ensuring a safe driving experience is an important concern of the drivers. Real-life car driving
requires that a driver should focus all the attentions on road events at all times and make fast
and accurate decisions to deal with these events. However, the investigations have shown that
an increase in driver workload can arouse the stress of the drivers, which lead to the decrease
of the decision making capabilities and the situational awareness [16, 123]. In this way, the

2.3 Modalities for stress recognition 19
driving ability is highly degraded and any form of distractioncan cause the fatalities, for
example, the car crash [106]. The researchers claimed that most of the accidents of car driving
could be avoided if the stress of the drivers could be accurately detected and be appropriately
moderated in its early stages.
Besides, in [19], Bolmont et al. designed a chamber which provided a gradual decompres-
sion from sea level to 8848 m equivalent altitude. The climbers participated in the simulated
climbing experiments in the decompression chamber. They found that the climbers’ stress
states may change when they are exposed to high altitude. This research showed that the
stress may be aroused by the extreme environment as well.
On the other hand, some stressors have been used to arouse the stress of the subjects in the
laboratory settings. The researchers would like to propose the appropriate approaches which
is able to recognize the stress levels of the subjects in an unobtrusive way. Normally, the first
task of their researches is the design of the prototypes which elicit different stress states of the
participating subjects at the pre-determined period in the laboratory settings. By processing
the acquired data related to the different levels of stress with their proposed approaches, the
researchers could evaluate the detection performance in terms of stress recognition.
In [89], Noteboom et al. studied the effect of anxiety and stressor intensity on arousal and
motor performance. In their experiments, the participants received electric shocks to elicit
their stress. In [105], P. Rani et al. discussed the stress detection in real time by monitoring
the heart rate variability of an individual. In their study, they chose playing video games to
generate mental stress. Similarly, in [86], Mohino-Herranz et al. adopted the game “Tetris” to
arouse the stress of an individual. In [129], J. Zhai et al. discussed the stress recognition when
the user was interacting with the computer. They designed a computer-based “Paced Stroop
Test” to elicit the stress. The Stroop test [120] asks the subject to name the font color of the
word when the color and the meaning of the words differ (e.g., the word “yellow” printed in
green ink instead of yellow ink). This test was also used by many other authors like Hainaut
and Bolmont [50] as an effective physiological stressor.
2.3 Modalities for stress recognition
Traditionally, to assess the individual stress state, people are asked to fill in standardized ques-
tionnaires (e.g., Perceived Stress Questionnaire [29]). By analyzing the questionnaire, the
stress levels are rated on some scale, so that the stress levels of an individual is quantified.
However, this subjective assessment strategy requires human intervention, for example man-
ually interpreting behavioural patterns and the related affective states. Thus, it cannot enable
real-time measures of the individual stress state.

20 Background
Figure 2.3: An example of the PPG.
Fortunately, the researchers have found that the body expresses the affective state through
many channels [108]. Therefore, the body expressions have been studied to find outthe reli-
able source for understanding the affective state. The body expressions such as facial expres-
sions, voice and physiological responses are the widely investigated body expressions for the
measures of the affective state, for example the stress [84]. In the following paragraphs, we
will introduce these body expressions respectively and present their characteristics.
2.3.1 Physiological signals
2.3.1.1 Blood volume pulse (BVP)
Blood volume is the amount of blood in a blood tissue during a certain time interval, which
is an indicator of the flow of blood through the human body. After each heart beat, the blood
flows through the blood vessels and leads to their engorgement, which modifies the amount
of light that is reflected by the skin’s surface. BVP measures these changes in light reflec-
tions. This measurement is achieved by using a back-scatter Photoplethysmography (PPG).
The Figure2.3illustrates an example of the PPG.
The PPG emits infra-red or red light on the skin and measures the amount of light that
is reflected by its surface. This amount of light can provide the information of the amount
of blood present in the region of the measurement. The BVP sensor is placed on the surface
of the skin and normally does not need adhesives or gels. It can be placed anywhere on the
subject’s body where the skin capillaries are closed to the skin’s surface. However, in the
practical application, the PPG is most of the time recorded from the skin capillary of a finger.
By analyzing the changes in light reflections recorded by the PPG, we can measure the heart

2.3 Modalities for stress recognition 21
Figure 2.4: A normal electrocardiogram [108].
rate. However, this measurement is subject to many artifacts caused by the placement and
motion. Thus, the measurement of the heart rate with the BVP is less precise to evaluate the
heart rate variability than the measure with the Electrocardiogram presented in2.3.1.2.
The researchers have found the correlation between the BVP and the stress, where the
BVP decreases when the stress of a subject increases. The BVP then increases when the
subject is back to the calm state [107]. This is because when the subject is under stress state,
his heart rate increases as the heart rate accelerates to send more blood to the muscles. The
blood is diverted to the muscles and prepare them for imminent action, such as fight or escape.
This means that the blood flow is reduced at the ends and therefore at the fingers. Due to the
fact that decrease in BVP is correlated with the increases in stress, the BVP has been used to
measure the stress state of an individual [129].
2.3.1.2 Electrocardiogram (ECG)
The ECG records the cardiac electrical voltages on the surface of the skin by placing the metal
electrodes on the body. To ensure the good quality of the ECG records, normally, the skin
should be firstly cleaned by using the alcohol and then the electrodes of the ECG sensor are
attached to the skin. The Figure2.4illustrates an example of the ECG signal.
In the normal case, the ECG is periodic (shown in the Figure2.4). The time interval be-
tween two heart beats is called inter-beat interval (IBI). The IBI can be calculated by observing
the time interval between two consecutive R peaks by detecting the QRS complex, which is
used to measure the heart rate and determine the heart rate variability (HRV) [108]. Compared
with the BVP, the ECG signal can provide a more precise determination of the heart rate by
the detection of the sharp R peaks.

22 Background
The heart rate (HR) is computed with the Formula2.1where the standard unit of heart beat
is beats per minute (bpm). For example, if one heart beat requires 1s (i.e. IBI=1s) then in one
minute there are 60 beats, so that we say HR=60bpm is the heart rate against the time.
HR(bpm) =1
IBI(s)×60 (2.1)
When a person is under stress, the time between each heart-beat is irregular so that heart
rate variability (HRV) provides an important tool to measure this irregularity for stress recog-
nition and medical diagnose [113]. When we analyze the frequency spectrum of the HRV, its
frequency can be divided into three bands [108]:
• very low frequency (VLF), f < 0.04 Hz
• low frequency(LF), 0.04 Hz < f < 0.15 Hz
• high frequency(HF), f > 0.15 Hz
VLF is indicated as an unreliable measure in short-time recordings (≤ 5 min). However the
low frequency band reflects the sympathetic nervous system activity and the high frequency
band is associated with the parasympathetic nervous system activity. That is to say, the energy
ratio of two frequency bands can be regarded as an indicator for autonomic balance. This
energy ratio (Energy RatioECG) can be expressed by the Formula2.2.
Energy RatioECG=total energy in LFtotal energy in HF
(2.2)
High Energy RatioECG indicates the dominance of sympathetic activity, i.e. the person is
under mental stress, while low Energy RatioECG indicates the dominance of parasympathetic
activity, i.e. the person returns to the calm state.
2.3.1.3 Respiration
The respiratory rhythm is defined by the regular alternation of inspiratory and exhalation
movements, where the volume of the rib cage increases with each penetration of the air (i.e.
inspiration) and decreases with each rejection (i.e. expiration).
At each normal breath, 0.5 liters of air enter the lungs. The volume of air during forced
inspiration is 2.5 to 3 liters. If the forced expiration is carried out at the end of the normal
expiration, the person can still expire 1 liter of air. At the end of forced expiration, there is
still 1.5 liters of air in the lungs, so that they can never be emptied completely. The Figure2.5
illustrates an example of the respiration signal. As can be seen, the breath cycle superimposes
on the baseline stretch.

2.3 Modalities for stress recognition 23
Figure 2.5: An example of the respiration signal [53].
Normally, when the person is under the state of rest and relaxation, a slower and more
superficial breathing is carried out. On the other hand, deeper breaths are usually generated
by affective excitement and physical activity. Emotions with negative valency usually cause
irregular breathing. A state of stress may therefore be detectable by frequent breathing, how-
ever, punctual stressors may cause a momentary stoppage of breathing [43]. Thus, to estimate
the levels of stress, the rate and volume of respiration can be used [53]. However, to monitor
the respiration, the subjects are normally required to wear a belt around their chest. In the
real applications, it may restrict the subjects from carrying out their regular activities. What
is more, in [53], the researchers found that compared with other physiological signals, such as
the ECG signal and galvanic skin response, the performance of the determination of a driver’s
relative stress level during real world driving tasks by adopting the rate and volume of respi-
ration was less efficient.
2.3.1.4 Electromyography (EMG)
EMG refers to the muscle activity or electrical tension of a certain muscle. Muscle tissue
conducts electrical potentials and the absolute level of the muscle tension depends on the
muscle where it is measured. Surface EMG is a method of recording the information present
in these muscle action potentials. The Figure2.6illustrates an example of the EMG signal.
It has been shown that muscle activity increases during stress and negative-valent emotions
[24]. In terms of stress detection, the EMG signal was adopted to determine a driver’s relative
stress level during real world driving tasks in conjunction with other physiological measures
[53]. In this study, the electrodes of the EMG sensor have been located in the shoulder of
the subject, which measured the electrical tension of the trapezius muscle. Meanwhile, the

24 Background
Figure 2.6: An example of EMG signal [53].
researchers have found that other physiological signals, such as the ECG signal and galvanic
skin response, have a better recognition performance compared with the EMG signal.
2.3.1.5 Skin temperature
The peripheral temperature, as measured on the surface of the skin, varies according to the
blood supply to the skin. In the real application, the skin temperature can be measured by
placing the sensor on the left thumb [129].
Normally, the variations in the temperature of the skin are related to the vasodilation of
the peripheral blood vessels. This vasodilation is induced by an increase in the activity of the
sympathetic system. This variation depends on the condition of the subject. If the person is
afraid, the blood will be directed to the muscles that control the movement of the body, for
example the leg muscle, so that the subject can prepare the escape. This body reaction causes
low temperatures at the extremities of the body due to the vasoconstriction.
The researchers have found that for an individual, the skin temperature is negatively cor-
related with stress [107]. If the subject is under stress state, the temperature of the extremities
of his body decreases. This is because the blood is directed primarily to the vital organs, such
as the heart, liver, lungs and stomach, for protection. His fingers then tend to be colder. Later,
if the subject is relaxed, the temperature of the fingers increases.

2.3 Modalities for stress recognition 25
Table 2.1: Waves bands, frequency range and individual characteristic in the EEG [116].
2.3.1.6 Electroencephalography (EEG)
It has been known that the neural activity of the brain produces electrical signals. EEG mea-
sures the electrical activity of the brain by recording complex electrical waveforms at the
scalp formed by action electrical potentials [36]. This measurement is achieved by placing the
electrodes on the surface of the head and a full EEG incorporates over 128 electrodes.
The EEG signal is characterised by different frequency components and each component
corresponds to some states of an individual. In [116], the authors summarized the indices,
waves bands, frequency range and individual characteristic in the EEG (see Table2.1). There
are four waves bands which are respectively Beta, Alpha, Theta and Delta waves. When the
person is under conscious states, Beta and Alpha are dominant. When the person is under
unconscious states, Theta and Delta waves are dominant [55].
The investigations have shown the correlation between the brain activity and the mental
stress. Rapid Beta wave frequencies are found to be the main characteristics which indicates
that the person is under stress state [90]. In [36], the EEG signal has been used to recognize the
levels of stress of the computer game players. By appling the decision tree model, different
levels of stress was recognized with the use of the EEG signal. What is more, in [77], the
authors have found that the EEG signal showed differences in relaxation levels. However, the
differences were not found in blood pressure and heart rate. Since the relaxation is opposite
of stress, the authors claimed that the EEG signal may contain more information about levels
of stress than blood pressure and heart rate.
On the other hand, in the ambulatory environment, the interpretation of the EEG signal is
difficult. The normal body activity such as head movement, the opening and closing of the
eyes can usually affect the interpretation of the EEG signal. This disadvantage leads to the
fact that few attentions have been paid to adopt the EEG signal for stress recognition in the
ambulatory environment.

26 Background
2.3.1.7 Electrodermal activity (EDA)
EDA is also known as skin conductance (SKC) or galvanic skin response (GSR). EDA mea-
sures the conductivity of the skin, which increases if the skin is sweaty. This activity is one
of the physiological indices which is most frequently used in a large number of applications,
such as psychology, psychophysiology and cognitive neuroscience. This electrical activity of
the skin varies very significantly in the situations where the subject is involved in different
affective states [66]. The Figure2.7illustrates an example of the EDA signal.
This signal was found to be a good and sensitive indicator of stress. When a person is more
stressed, his skin conductance increases proportionally. This improvement of the conductivity
of the skin is due to the the existence of electrical currents associated with sweating. This
sweating results from the secretion of sweat glands, which have the particularity of responding
to the affective arousal. These glands are located in the palms of the hands and the soles of the
feet [118].
The EDA can be typically characterized by two components: a tonic baseline level and
short-term phasic responses superimposed on the tonic baseline level [88]. The tonic baseline
isan indicator of the general activation of the organism. It may present slow drifts and transient
variations, consecutive or not to stimulation or action of the participant (movements, strong
respiration). The short-term phasic responses is a transient change, occurring one to three
seconds after the onset of an identified cause. The amplitude of the responses reflects the
importance of the phasic response to stimulation of an affective state. Any transient variation
occurring outside this latency window is considered a spontaneous fluctuation. The EDA can
have a stable individual stroke value. This value can be characterized by a high frequency
of the spontaneous fluctuation, which is often associated with a lack of habituation of the
short-term phasic responses in case of repeated stimulations.
2.3.1.8 Summary of physiological signals
The activation of these different physiological indicators varies according to the levels of stress
and the subjects, which induces a pattern of complex body responses making it possible to dis-
tinguish the different levels of stress. The question is whether these variations in physiological
parameters are or are not specific to a given stress state. There are no golden rules that have
been validated, which remains the issue that should be debated.
2.3.2 Facial features
Intuitively, we can observe that when an individual is under different affective states, his facial
features may differ. For example, when an individual is quite disappointed, he or she may

2.3 Modalities for stress recognition 27
Figure 2.7: An example of EDA signal.
reveal this affective state by the facial features. Thus, we have a great chance to observe
the reduced frequency of the movements of facial muscle from this individual. Meanwhile,
different frequencies of head movement and eye movement compare with the normal state
may be observed as well. Normally, once these facial features are observed, as a feedback,
the persons surrounding him will give the related reactions, such as asking what has happened
and encouraging this individual.
In the literature, the facial features such as facial expressions, eye gaze, eye blinks and
pupil dilation are widely investigated. The researchers pay attentions to figure out the charac-
teristics of these facial features when an individual is under stress state.
2.3.2.1 Facial expressions
The human brain is capable to recognize the affective state of the subjects from their facial
expressions. However, the inner modality of this recognition remains to be investigated [116].
To analyze the facial expressions, normally, the researchers focus on some points on the face,
eyes and mouth. By analyzing the coordinates of these points, the researchers can get the facial
informations, for example, the levels of mouth openness (see Figure2.8). Sometimes, the head
movements, such as yaw and roll, are also taken into consideration. The facial expressions
have been used to predict unsafe driving behaviors in [60]. The study showed that for a
driver assistance system, it is quite meaningful to track the driver facial features, for example,
the facial expressions of the drivers. By tracking facial expressions associated with driving

28 Background
Figure 2.8: An example of vision tracking points on subject’s face used in [60].
accidents, the predictive accuracy of driver assistance systems can be significantly improved.
In the study of the emotional responses to the stressors [75], the researchers have found that
facial expressions of emotion signal biological reactivity, such as cortisol and cardiovascular
responses, when the subjects response to the stressors. The analysis showed that if the subjects
had fear of the stressor, the fear facial expressions appeared. If the subjects had more fear
of the stressor, their cardiovascular and cortisol responses to stress augmented. Besides, if
the subjects showed indignation to the same stressor, the facial expressions of indignation
appeared. If the subjects were more indignant to this stressor, their cardiovascular and cortisol
responses decreased.
In [37], the researchers detected the changes of facial expressionswhen people experi-
enced both low stress and high stress performance demands. Their study showed that the
stress of the subject could be revealed by the facial expressions and related stress recognition
strategy was also investigated. In [76], the facial expressions such as facial muscle movement
and head movements were used to infer the stress levels of the subject. The researchers found
that the increase of head and mouth movements was correlated with a higher stress level. The
stress levels recognized by the system were compared with that predicted by psychological
theories and the consistence between them was confirmed.
2.3.2.2 Eye movements
We know that eyes are the mean that provides informations to the subjects. In the social
interaction, we prefer to infer the emotion and mood of the subjects by looking at their eyes

2.3 Modalities for stress recognition 29
and observing their eyes movements like eye gaze and eye blinks.
Eye gaze can provide the information about the concentration of the subject. Normally, if
the subject is focusing on something that he is interested in, a long time eye gaze can be ob-
served. That is to say, the eye gaze enables us to infer the affective state of the subject. In [76],
the eye gaze was adopted as one of the eye movements to infer the stress levels of the subject.
In this study, the participants were asked to use their eyes to focus on a particular object on
a computer screen for a long period of time. During this period, gaze spatial distribution and
percentage of saccadic eye movements were monitored. The researchers found that frequent
focus on the object was correlated with the stress of the subject.
Eye blinks are another important eye movement and its performance when the subject
is under stress state has been investigated [49, 76]. In [76], the participating subjects were
required to solve mathematical tasks which were shown on the computer while the eye blinks
were monitored during the experiment. The researchers have observed that when the subject
was under higher stress state, his speed of eye closure was faster. In [49], the eye blinks
were monitored while the subjects performed the real driving experiments. However, these
two studies gave out opposite results in terms of performance of eye blinks when the subject is
under stressful conditions. In [76], the researchers have found that when the subject was under
higher stress state, the frequency of his eye blinks were lower. In [49], the frequency of the eye
blinks was found to be lower when the stress level of the subject was lower, which indicated
that the higher stress state was correlated with higher frequency of the eye blinks. We can
not make a decision to tell which conclusion is correct. This is because the fact that the two
studies did not use the same prototype to elicit the stress of the subject and thus the analyzed
data were obtain from different experiments settings. Besides, in [76], the participants should
watched the screen of the computer during the task, which may affect the performance of eye
blinks.
2.3.2.3 Pupil dilation
In the real life, the variation of the pupil size can be observed when an individual faces dif-
ferent events or under different emotions. In [97], the variation of the pupil size during and
after auditory emotional stimulation was studied. The researchers designed an experiment
where the subjects listened negative, positive highly arousing and emotionally neutral sounds.
During the experiment, the pupil responses of the subjects were monitored. The results of the
experiments showed that when the participating subject experienced both emotionally nega-
tive and positive stimuli, their pupil size significantly augmented. Besides, further analysis
indicated that the pupil responses of the female subjects were significantly larger than males
during the auditory stimulation. Thus, the researchers claimed that it is possible to use the

30 Background
variation of the pupil size as the input signal for affective computing.
In [100], the researchers tested the hypothesis that the pupil dilation during performance is
partially due to a task related anxiety component. For this purpose, the researchers designed an
experiment where the subjects processed digit strings of various lengths for immediate recall.
During the experiment, the pupil responses of the subjects were measured. By analyzing the
pupillary patterns, the researchers found that if the subject was under stressful condition, the
diameter of his pupil augmented and the frequency of pupil dilation was higher.
In [129], the pupil dilation was adopted to recognize the stress of an individual. A computer-
based “Paced Stroop Test” was designed to elicit emotional stress. During the experiment, the
raw pupil diameter signal was recorded by an eye gaze tracking system at rate of 60 sam-
ples/sec. A technique of interpolation was applied to fill the artifact gaps due to blinking. The
mean value was adopted as the characteristic feature of the pupil diameter. The results of the
experiments showed that when the subject was under stressful condition, the mean value of
his pupil diameter increased.
2.3.3 Voice
The voice of the subject carries a lot of informations, which can be characterized by two
main parts [91]. The first part is the linguistic information where the utterances are made
according to the rules of pronunciation of the language. The second part is the non-linguistic
information, which is also called paralinguistic information. The non-linguistic information
includes intonation, voice quality, prosody, rhythm and pausing of the speech [111]. Similar to
the other non-verbal modalities like facial expressions, eye gaze, eye blinks and pupil dilation,
these non-verbal contents of the speech can always reveal the messages of the subject, for
example, his affective states. However, how to interpret and characterize exactly the affective
states of the subject from these non-verbal contents of the voice is still a question to be solved.
The researchers have made effort to measure the emotional states of the subject in voice.
In [11], the use of prosody to recognize the frustration and annoyance in natural human-
computer dialog was investigated. The researchers found that frustration was detected by
longer speech durations, slower speech and pitch rates. The accuracy of prediction increased
when discriminating only frustration from other utterances. Results showed that a prosodic
model could predict the frustration and annoyance from an utterance. A system based on this
idea was developed for flight telephone booking.
In [114], the researchers recorded and analyzed the speech data whichcontained different
levels of stress. They used an air controller simulation to induce the stress of the subjects. The
speech data were processed with a recurrent neural network. After the training process, the
neural network was used to estimate the amount of stress at a frequency of 25 Hz. The results

2.3 Modalities for stress recognition 31
of estimation were better than accuracy achieved by human assessment.
In [91], a system for classification of emotional state from the utterances of speech was
proposed. Six categories of emotions, which were Anger, Disgust, Fear, Joy, Sadness and
Surprise, were involved for classification. The system adopted short time log frequency power
coefficients (LFPC) to represent the features of the speech signals, where short time LFPC
represents the energy distribution of the signal in different Log frequency bands. Besides,
short time LFPC also provides information on the fundamental frequency of speech. A discrete
hidden Markov model (HMM) was used for classification.
The results of the experiments showed that the proposed system could achieve an average
accuracy of 77.1% and best accuracy was 89% in the classification of six emotions. The results
outperformed the accuracy achieved by human assessment which was only 65.8%. This good
classification performance revealed that short time LFPC was an efficient indicator for the
classification of the emotions.
Voice stress analysis was originated from the concept that when a person is under stress,
especially if a person is exposed to a dangerous environment, his heart rate increases as the
heart rate accelerates to send more blood to the muscles. The blood is diverted to the muscles
and prepare them for fight or escape. This increases the vibrations of the muscle, which is
called micro-muscle tremors (MMT). The muscles that make up the vocal tract can transmit
the vibrations through the speech [56].
As for the recognition of the stress state of the subject, the researchers also concentrated
on the non-verbal content of the voice [52]. The informative features such as fundamental fre-
quency, variation of fundamental frequency, jitter (the perturbation in the vibration of the vocal
chords) and high frequency energy ratio were extracted from the voice for stress recognition
[111].
In [74], the speech was adopted by the researchers to recognize the stress of the subject.
A Bayesian Network was used as the classifier for stress recognition. In [47], the researchers
investigated the correlation between demodulated amplitude and frequency variations of the
voice and the heart rate of a fighter aircraft flight controller. They applied the amplitude mod-
ulation and frequency modulation to the speech. They found that the peak frequencies in the
spectrum of the amplitude envelope followed fundamental frequency. This following phe-
nomenon was regardless of the center frequency of analysis. What is more, when the subject
was under higher stress level, the energy of high frequency voice components augmented. The
results showed that the fundamental frequency could be used as an indicator to measure the
stress of the subject.
In [125], the researchers designed the experiments to investigate when the subject per-
formed unknown emotionally stressful task in the real life, the fluctuations in fundamental

32 Background
frequency of the voice. After relaxing for a short period, the participants went through a nat-
ural obstacle by way of sliding down a rope and then exposed to the fall. Before the task,
the participants were asked to give a standardised speech sample. During this period, the
fundamental frequency of the voice and the heart rate of the participant were recorded. The
participants repeated the task after 30 min and after 3 days. The repetitions of the task were
aimed at finding out whether the repetitions led to a lower emotional load. The results of the
experiments showed that when the subject was under higher stress level, the range and rapid
fluctuations in fundamental frequency increased. Meanwhile, the repetitions of the task did
not lead to significant changes in fundamental frequency.
In [39], the stress of the drivers was analyzed through their speech.The participants were
required to performed mental tasks of variable cognitive load while driving in a car simulator.
The subband decompositions and the Teager energy operator were applied to extract the fea-
tures from the speech of the drivers under stressed conditions. The dynamics of the feature set
within the utterance were found to be correlated with the stress of the participants.
A stress monitoring system based on the analysis of the characteristic changes of the voice
has been developed for the army users [56]. The performance of this system was evaluated by
the Air Force Research Lab in USA. They reported that such stress monitoring system could
efficiently monitor the stress of an individual. Through this non-invasive and less obtrusive
measure, the army could provide solutions to reduce the workload of their staffs and improve
the performance of work, and thus save lives.
2.3.4 Reaction time
Intuitively, we can observe that personal reaction time (RT) may differ when an individual
deals with various situations. Several researches in the literature have discussed the relation
between the performance in RT and the stress of an individual.
Bolmont et al. [19] presented that the climbers’ mood states may change when theyare
exposed to high altitude and their performance in RT differs as well. Eight climbers whose age
range was from twenty-four to thirty-seven years old have participated in the simulated climb-
ing experiments for thirty-one days in a decompression chamber. This chamber provided a
gradual decompression from sea level to 8848 m equivalent altitude. The subjects were asked
to fill in Spielberger State-Trait Anxiety Inventory (STAI). The STAI is a self-evaluated ques-
tionnaire to evaluate state-anxiety responses. During the experiments, the subjects performed
a test of binary visual choice. The test required them to press a button corresponding to the
side of the light that was flashed. The median value in hundredths of a second for 31 re-
sponses was computed and was used to investigate the relationship between the anxiety and
performance changes in reaction time. The statistical calculation of the coefficient correla-

2.3 Modalities for stress recognition 33
tion showed a significant positive correlation between the performance in reaction time and
changes in anxiety for the climbers. This results suggested that anxiety could augment the
reaction time. Since anxiety is a reaction to the stress, this study indicated that the subject’s
reaction time of the relatively simple tasks could be correlated with their stress levels.
Coombes et al. [31] investigated how anxiety alters the balance between attentional control
systems to impact performance of a goal-directed motor task. The task required the subjects
to pinch a force transducer with the thumb and index finger of their right hand while seated
in a chair. A LCD monitor was positioned one meter from the chair. The monitor showed the
emotion-eliciting distractor images to the subjects. Thus, the subjects executed targeted force
contractions with the appearance of emotional and nonemotional distractors and their maximal
voluntary contraction was assessed. For the subjects of high anxiety and low anxiety group,
their reaction time, root mean square error and peak rate of change of force were computed
and their statistical correlation was analyzed. The results showed a significant correlation
between the high anxiety and slower reaction time, which could suggest that high anxiety was
associated with attenuated performance efficiency.
The results of these researches show that there exists a significant correlation between the
reaction time and the stress state. However, we find that in the literature, little attention has
been paid to use reaction time for stress recognition.
2.3.5 Additional modalities
Behavior is also an important body expression. A simple idea to understand the human be-
havior is to consider the human as a device. This device contains a variety of internal mental
states, which can control particular behaviors [101].
Behavioural recognition relies on the technique of computer vision. Normally, to under-
stand and recognize the actions in a visual scene, a series of understandable primitive tasks or
events should be created and are included in a list. A complex behavior is then divided into
many primitive tasks or events. The behavior of the subject is recognized if all these primitive
tasks or events are detected in sequence. In the current studies, the techniques such as hidden
Markov models and Bayesian classifiers are commonly used for behavioural recognition. For
example, in [48, 78], the hidden Markov models were involved for modeling and prediction
of human driver behavior.
In terms of stress recognition, the human behavior is also involved. Behavioral scientists
showed that high stress state may lead to negative thinking, disruption of attention and reduc-
tion of concentration [76]. In [53], the researchers recorded a list of observable actions and
events. The analysis of the drivers’ behaviors recorded on the videos could help the researchers
to assess driver stress levels manually and thus created a continuous stress metric. But we can

34 Background
find that the measure of the stress levels by the human behavior are always performed by the
human specialists. The automated interpretation of the stress levels of the subjects by using
the human behavior remains to be discovered.
Besides, in [53], the gestures of the drivers were also recorded in the videos.The re-
searchers found that the stress stimuli could elicit the specific gestures of the drivers so that
the gestures were used to help the researchers to assess driver stress levels manually. This
showed that it is possible that the gestures of the subjects and the stress stimuli are correlated.
In [76], the user’s interaction activities with the computer was monitored when the user
was under different levels of stress. The recorded interaction activities were the number of
mouse clicks and mouse pressure from fingers. The results of experiments showed that when
the user was under a lower stress level, the mouse pressure from fingers was harder. This
showed that the interaction features can be also an indicator for the stress of the subject.
2.3.6 Summary of the modalities
Based on the contents of the previous paragraphs, we can see that the measures of the stress
from the facial features are achieved by analyzing the features such as facial expressions, eye
movement and pupil dilation from the facial images or videos recorded by the sensors like
cameras [37]. The measures from the voice analyze vocal characteristics such as loudness and
fundamental frequency from the speech [111]. The measures from the physiological responses
analyze the characteristics of the physiological signals of an individual such as Electrocardio-
graphy (ECG), Electromyography (EMG) and Electrodermal activity (EDA) under different
stress states. Besides, the researches [19, 31] show that there exists a significant correlation
between the reaction time and the stress state. However, little attention has been paid to use
reaction time for stress recognition.
2.4 Literature review of the methodologies for stress recog-
nition
In section2.3, we have presented a variety of modalities of the body expressions, such as
physiological responses, facial expressions and voice, and their potentials for stress recog-
nition. However, to achieve the automated measures of the individual stress state, attention
should be paid to figure out the related strategy as well. Thus, in this section, we review the
methodologies of the automated recognition of stress that have been presented in the literature.

2.4 Literature review of the methodologies for stress recognition 35
2.4.1 Stress recognition given physiological signals
To begin with, we recall the methodologies for the automated recognition of stress given
physiological signals.
In 2001, Picard et al. [102] proposed that the ability to recognize the affective state ofan
individual should be an important part of machine intelligence and developed a machine’s abil-
ity to assess human affective state given the physiological signals. The electromyogram, blood
volume pressure and skin conductivity were used for recognition. The physiological signals
were recorded with the sensors which were placed on the subject’s body and the recording
lasted for 20 days.
For each physiological signal, six statistical features, such as mean value, standard devi-
ation and gradient, were computed for the recording of each day. The features were then fed
to the classifier. The k-nearest-neighbor (k-NN) classifier and Maximum a Posteriori (MAP)
classifier were employed. The proposed methodology was tested with the recorded physio-
logical data and achieved 81 percent recognition accuracy. Besides, the authors found that the
features of different affective states on the same day clustered more tightly than the features of
the same affective states on different days. This research opened a new gate to assess the in-
dividual affective state, for example the stress. After that, the researchers began to investigate
the potential of physiological signals for stress recognition.
Rani et al. [105] presented an affect-sensitive architecture for human-robot cooperation,
which was used for online stress detection using physiological signals. In their work, they
chose playing video games to generate mental stress. The video games has different difficulties
so that they can brought the subject under different pressures of performance. The stress
detection was achieved by monitoring the heart rate of the subject in real time.
The ECG signal was recorded in the experiment. Based on the ECG signal, the IBI was
calculated. By processing the IBI with the Fourier Transform and Wavelet Transform, the
standard deviation of sympathetic and parasympathetic frequency bands of the heart rate vari-
ability (HRV) was analyzed. The final decision making was performed using fuzzy logic. The
presented methodology was tested with the data acquired in their experiment and got good
detection performance. The authors said that their work demonstrated that the robot is able to
recognize human stress and give the appropriate response.
Picard and Healey [53] presented a method to determine a driver’s relative stress level by
using the collected physiological signals during real world driving tasks. The physiological
signals such as electrocardiogram, electromyogram of the trapezius muscle, respiration sig-
nal and skin conductance of the left hand and left foot were recorded. Twenty-four drivers
participated in the test and the driving tasks lasted for at least fifty minutes.
The features such as mean value and variance were extracted from five minutes non-

36 Background
overlapping segments of the physiological signals. Each segment represented a period of
low, medium and high stress since the segments were extracted from each of the rest, city
and highway driving periods. These features were then used to train and test the classifica-
tion algorithm, where the classification was achieved by the linear discriminant function. The
test results showed that the proposed method classified three driving stress levels with an ac-
curacy of over 97%. Meanwhile, the authors found that the skin conductivity and heart rate
parameters were the most closely correlated with stress of the drivers.
In the context of human computer interaction, J. Zhai et al. [129] presented their research
of stress recognition using the physiological signals when the user was interacting with a
computer. A computer-based “Paced Stroop Test” was designed to elicit emotional stress. The
physiological signals such as Blood Volume Pulse (BVP), Galvanic Skin Response (GSR) and
Skin Temperature (ST) were recorded and analyzed. The relevant features, for example the
average amplitude of the physiological signals, were extracted. Besides, the pupil dilation
was also recorded by the eye gaze tracking system and the mean value of pupil diameter was
extracted as the characteristic feature of the pupil diameter.
The features were then fed into the learning systems to differentiate the stress state from
the normal state of the user. Three learning algorithms, which are Naïve Bayes Classifier,
Decision Tree Classifier, and Support Vector Machine (SVM) were adopted. The authors
evaluated the recognition performance using 20-fold cross validation method and compared
the recognition accuracy of three learning algorithms. They found that the SVM had the
highest prediction accuracy where the accuracy reached to 90.10%.
Hosseini et al. [57] presented their system for the assessment of stress by using multi-
modal bio-signals. Not only EEG but also the peripheral signals like blood volume pulse,
electrodermal activity and respiration were adopted to assess the stress of the subject. The
EEG signals were acquired in five channels. The pictures derived from International Affective
Picture System database were used for the stress induction. The frequency features were
extracted from the EEG signals by appling the wavelet decomposition. The features like mean
value and variance were extracted from the peripheral signals. These informative features
were the inputs of the classifier. The Support Vector Machine was adopted as the classifier.
The proposed strategy achieved the average classification accuracy of 89.6%.
Bousefsaf et al. [20] presented a framework to detect the stress of the subject by the anal-
ysis of human faces from the video frames. The video frames were acquired from a webcam
which was connected to a computer. By analyzing the light variations of the skin pixels, the
contained PPG information was extracted. Then, the HRV was computed by processing the
PPG. The stress was detected by analyzing high frequency ratio of HRV. In their experiments,
the Stroop test was applied to elicit the mental stress and twelve subjects participated in the

2.4 Literature review of the methodologies for stress recognition 37
experiments. The test results showed a satisfied detection performance.
The results of these researches have shown the feasibility of stress recognition given phys-
iological signals. However, we can find that the use of these signals is neither an easy nor a
direct task. There are no golden rules that have been found and validated.
As can be found, in the researches of stress recognition using physiological signals, nor-
mally, one or several signals were adopted. Meanwhile, the approach of recognition is nor-
mally consisted of the following steps:
1. Choose the suitable stressors to elicit the stress of an individual and record the related
physiological signals with the sensors;
2. Process the signals and extract the characteristic features;
3. Use the learning algorithm, for example, the SVM, to recognize the stress state.
Here, the recorded raw time-series of physiological signals should be transformed into fea-
tures, since standard classification algorithms can not be directly applied to the raw time-series
signals.
2.4.2 Stress recognition given facial features and voice
In this subsection, we review the methodologies that have been presented for the automated
recognition of stress given facial features and voice.
In [37], the researchers studied the changes of facial expressionsin order to detect the
presence of stress. To elicit the stress of the subjects, the participants were required to perform
a workload task, such as the probed recall memory task and the serial addition subtraction task.
Besides, the social feedback was involved to further increase the stress level. That is to say,
the scenarios of higher stress levels contained greater workload, negative social feedback, and
greater time pressure. During the experiments, the participants wore the ECG sensor, filled in
the questionnaires like “State/Trait Anxiety Index” and their saliva was also collected. In this
way, the stress of the participants could be assessed by self-report ratings and heart rate.
When the participants performed both low stress and high stress performance tasks, their
facial expressions were recorded on the videos. The researchers then applied optical computer
recognition algorithm, which tracked robustly the facial features with a three-dimensional
parameterization during head movement. The facial expressions such as the movements of
eyebrows and asymmetries in the mouth were extracted. These facial expressions were used
as the inputs of a Hidden Markov model to distinguish the high stress and low stress states
of the participants. The proposed algorithm could achieve a good detection performance (the

38 Background
detection accuracy of 88%). The experiment results showed that the analysis of the changes of
facial expressions provided an unobtrusive way to detect the presence of high workload stress.
In [76], a real time non-invasive assessment of the subject’s level of stress from different
modalities was presented. An experimental environment was designed by the researchers. In
the experiments, the participants sat in front of a computer screen and performed the tasks
showed on this one. Two types of tasks were designed to elicit the stress of the user. The first
task was an arithmetic task of the addition/subtraction of two two-digit integers. The second
task was an audio task to indicate the alphabetic precedence of two consecutively presented
letters.
During the experiments, the visual sensors monitored the physical signals of the partici-
pants, such as facial expression, eye gaze, eye blinks, and head movements. An emotional
mouse equipped with physical sensors was used to measure the physiological responses and
finger pressure. Meanwhile, the interaction activities with the computer was measured as a
behavioral modality. The features were then extracted from these recorded modalities. Nine
visual features such as eyebrow movement, mouth openness, blinking frequency, average eye
closure speed and percentage of saccadic eye movement were extracted from the videos. The
physiological responses were monitored from the physiological signals which were heart rate,
skin temperature and galvanic skin response. The features of the interaction activities were
the number of mouse clicks and mouse pressure from fingers in a time interval. Besides, the
features of the performance of tasks such as math error rate, math response time and audio
error rate were also extracted.
As a machine learning technique, the Dynamic Bayesian Network (DBN) framework was
adopted for the assessment of the stress level. The DBN framework was trained with the ex-
tracted features for stress modeling and active sensing technologies were involved to select the
most informative evidences related to the stress. After the training process, the DBN frame-
work output the assessed stress levels. The results of the experiments showed that the stress
level of the participant assessed by the proposed strategy was consistent with that predicted by
the psychological theories.
In [39], the researchers investigated the strategy for the classification of the stress of drivers
based on the analysis of their speech. Four subjects drove in a driving simulator which was
installed in the laboratory setting. The speech data used in their research was collected. The
subjects were required to performed mental tasks of variable cognitive load while driving at
variable speeds. The tasks were the math questions of adding up two numbers. The sum of
adding was less than 100 and the number of additions was controlled to vary the difficulty.
The subjects were asked to speak out the answer and the answers were recorded by a head-
mounted microphone. Finally, 598 utterances of speech data were obtained where the length

2.5 Systems for stress recognition 39
of an utterance ranged from 0.5 second to 6.0 seconds. The collected speech data of four
subjects was divided into a training set (80% of the data set) and testing set (20% of the data
set).
To extract the features of the speech, the multiresolution analysis via wavelet transforms
and the Teager energy operator (TEO) were applied. The obtained TEO-based feature set
were used to classify the categories of the stress of drivers. The classification was performed
by adopting dynamic Bayesian network models as well as a model consisting of a mixture of
hidden Markov models (HMM).
The results showed that a good classification performance was obtained with the speaker-
dependent mixture model where the classification accuracy could reach 96.4%. When per-
forming the classification on a separate testing set, the accuracy was only 61.2%. Besides, the
speaker-independent mixture model was also tested. In this case, the classification accuracy
was 80.4% on the training set, and was 51.2% on a separate testing set. Even though the classi-
fication accuracy was degraded compared with the speaker-dependent model, the researchers
claimed that this result was still encouraging.
2.5 Systems for stress recognition
As we have mentioned, in modern society, the stress of an individual has been found to be
a common problem. Since the continuous stress can lead to various mental and physical
problems, there are great demands to provide the assessment of the stress of an individual
in the real life and then offer solutions for feedback to regulate this state. Based on this
conception, the researchers began the design of the embedded system which could be used for
stress recognition in the real life.
2.5.1 Embedded systems in the laboratory setting
To begin with, we introduce the embedded systems that has been presented in the laboratory
setting for stress recognition.
In 2003, E. Jovanov et al. [62] proposed a distributed wireless sensor system, which could
quantify the stress levels based on measures of HRV. The monitor of the system was based on
a wireless body area network (BAN) of intelligent sensors. The distributed wireless system
integrated the individual monitors and synchronized monitoring of a group of subjects. The
sensors were responsible for the acquisition of physiological signals and low-level real-time
signal processing tasks. The Polar chest belt was used as a HRV physiological sensor, which
enabled 1-ms resolution HRV measurements. The core of the wireless intelligent sensors

40 Background
was the microcontroller. The system adopted a low-power TexasInstruments microcontroller
(MPS430F149). The microcontroller contained 60-KB on-chip flash memory, 2-KB RAM and
12-bit A/D converter. Besides, the microcontroller monitored battery voltage and temperature
through the internal analog channels and reported these informations to the upper level in the
system hierarchy.
The BAN can be regarded as a client-server network. There was a single personal server
and the multiple intelligent sensors was the clients of the network. The personal server con-
trolled and communicated with the intelligent sensors by using a custom wireless protocol.
Besides, the personal server was also responsible of the higher-level signal processing. Based
on the results of this processing, the personal server can provide the assessment of the stress
states of the subjects.
To reduce the power consumption of the wireless data transmission between the personal
server and the intelligent sensors, a mobile gateway was used. The mobile gateway was a
PDA-based device and could establish wireless communication with a personal server and
download collected data. The communication between the server and mobile gateway was
established by the standard 900 MHz RF modules. A custom, power-efficient communi-
cation protocol was used to ensure the reduction of the power consumption. Besides, the
mobile gateway could also connect the telemedical workstation on the Internet. Thus, the
recorded physiological signals could be uploaded to the telemedical workstation for further
long-term analysis of physiological data. This connection was implemented using Bluetooth,
IEEE 802.11, IR, or a USB via cradle. The authors declared that this BAN-based architecture
can also be further adapted as an essential part of a telemedical system (see Figure2.9).
Massot et al. [83] also adopted the BAN to acquire the physiological signals like heart rate,
EDA and skin temperature. Based on the BAN, they proposed an ambulatory device called
EmoSense which assessed ANS activity. The system was applied in the evaluation of stress
with the blind.
Fletcher et al. presented the system iCalm [40]. Using a wearable sensor and a network
architecture (see Figure2.10), the iCalm provides a long term monitoring of autonomic ner-
vous system by recording the heart rate and Electrodermal activity (EDA). The rechargeable
batteries provided the electric power to the system. The EDA sensor recorded the conduc-
tance of the skin and the photoplethysmograph (PPG) sensor measured blood volume pulse to
compute the HRV.
The system paid attention to achieve a low-power consumption of the measurement by the
sensor platform. For example, in order to maximize battery life and maintain a stable voltage,
a low-power regulator was added. This regulator reduced the power consumption of the sensor
module to less than 20 µW. Thus, the continuous recording by the sensor platform could last

2.5 Systems for stress recognition 41
Figure 2.9: Illustration of wireless BAN of intelligent sensors in telemedicine [62].
Figure 2.10: Illustration of wireless network architecture for iCalm [40].

42 Background
Figure 2.11: Illustration of ankle worn band [40].
for several days on a single charge. To ensure a wearable confort, the sensor platform was
embedded inside the wearable package, such as wrist worn band or ankle worn band (see
Figure2.11). The recordings were then transferred to the wireless network by a radio module.
The wireless network was able to collect the physiological data and the Web server of the
wireless network enabled the devices such as personal computers and mobile phones to load
these data.
Jung et al. [63] presented a mobile healthcare system using the IP-based wireless sensor
networks (see Figure2.12). By analyzing the HRV in time and frequency domains, the system
estimated if the patient was under the normal or stressed state. The ECG and PPG signals were
recorded by analog signal conditioning circuits to compute the features of HRV (see Figure
2.13). The wearable sensors contained the IP node which was used to collect and transmit
the recorded physiological signals. The IP nodes made a data packet of the recorded data
and then transmitted the data through the IP gateway to the server PC wirelessly. The power
consumption of the wearable sensors and the IP nodes was less than 50 mW with the battery
powered in 3 V, which was in order to achieve a low-power consumption.
The Android OS based Samsung Galaxy smartphone connected to the server PC through
the Internet by the wifi or 3G connection. Thus the smartphone could monitor the physiolog-
ical signals, the IPv6 address of IP node, HRV and stress state and showed them to the user
with a friendly interface. When user was detected to be stressed, an alert warning was shown
on the mobile phone. Besides, the collected health informations could be stored in the server
database for the further analysis.
Mohino-Herranz et al. [86] proposed a system to assess the subject’s stress through the

2.5 Systems for stress recognition 43
Figure 2.12: Illustration of mobile healthcare system [63].
Figure 2.13: Wearable ECG and PPG sensors [63].

44 Background
Figure 2.14: Textile structure [86].
Figure 2.15: Front view (A) and back view (B) of vest [86].
analysis of ECG and thoracic electrical bioimpedance (TEB) signals. The physiological sig-
nals were recorded using customized non-invasive wearable instrumentation. The ECG and
TEB signals were acquired by electrodes constructed with a textile structure (see Figure2.14).
Its surface was 60 × 40 mm and the whole structure was included in a vest (see Figure2.15).
The user wore the vest and then the physiological signals were recorded by the device ECGZ2
(see Figure2.16). This device was connected to the electrodes through wires included inside
the vest. The sampling frequency was 250 Hz for the ECG signal and 100Hz for the TEB
signal.
Then, the ECGZ2 sent data to the smartphone via Bluetooth to the Samsung Galaxy smart-
phone. The smartphone processed the received data and extracted the characteristic features
from the ECG and TEB signals. The classification was achieved by a multilayer perceptron
(MLP) classifier with 10 neurons. The system was tested in a scenario to distinguish different
stress levels. The probability error of classification was 32.3%.

2.5 Systems for stress recognition 45
Figure 2.16: Left view (A) and right view (B) of ECGZ2 device [86].
As can be seen, these embedded systems for stress recognition contain several modules.
The module of sensor network collects the signals, such as the EDA and ECG of the subjects.
The researchers design and use the wearable instrumentation for signal acquisition. Then
recorded data are sent to the core recognition system with power-efficient communication
protocol via the transmission module. In the core recognition system, the data are processed
and are used to recognize the stress state of the subject. The recognition is achieved by a
classifier. The recognition results are sent to the indicator module which indicates directly the
subject’s stress states. In some case, the recognition results as well as the recorded data will be
sent to the server station. This last one stores the data which can be used for further analysis.
Normally, the systems pay attention to achieve a low-power consumption of the measurement.
2.5.2 Stress monitoring systems in the commercial market
In the commercial market, some stress monitoring devices have been provided. The Helicor
StressEraserTM [3] is a such commercial biofeedback device, which aims at helping the users
to deal with the stress efficiently and training them to transform feelings when they are under
stress, anger or anxiety. This device measures pulse intervals from the index finger with a PPG
sensor (see Figure2.17). The heart rate variability is then assessed from the consecutive blood
pulses to monitor the stress of the subject. This one is then suggested to respire in certain
patterns to reduce stress and balance emotions.
The same idea is adopted by the emWaveTM (see Figure2.18) [5], which is a noninvasive
biofeedback device for stress monitoring. This device also monitors the heart rate variability
with a PPG sensor to measure the stress of the subject. Once the stress is detected, the user
is suggested to change the depth and frequency of the breath as a feedback to moderate the
stress.
The ThoughtStreamTM system (Mindplace) [4] is a biofeedback system for stress monitor-
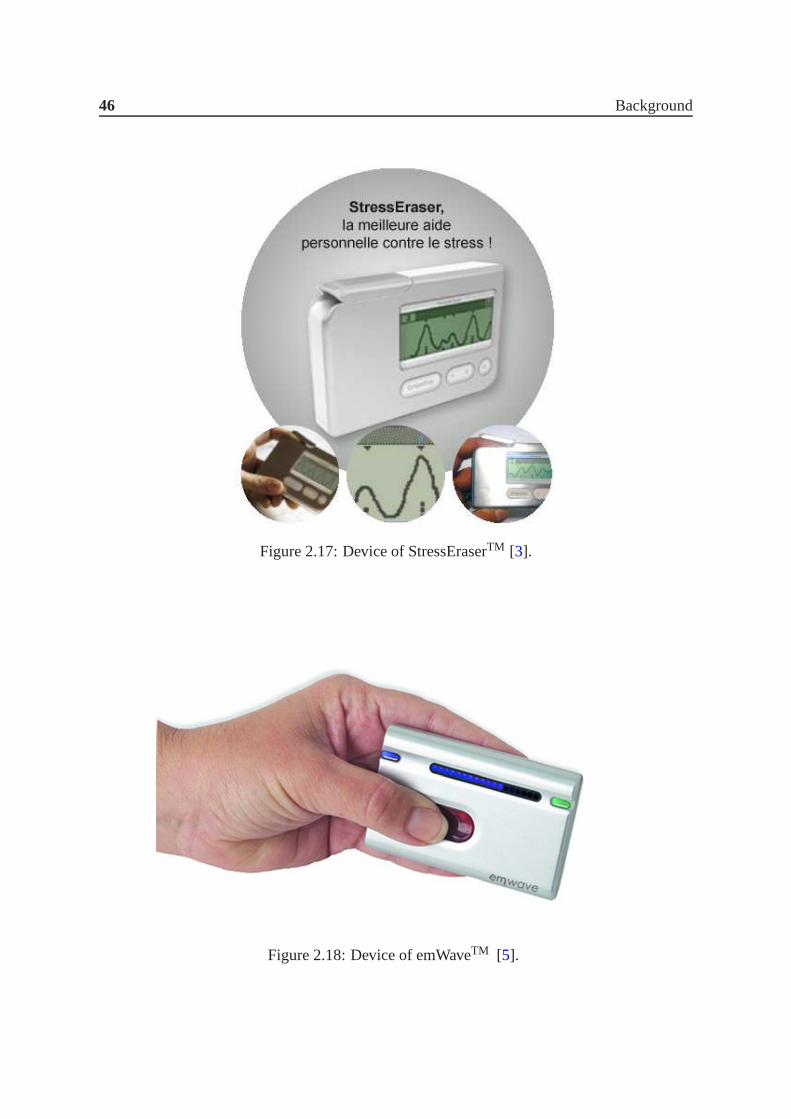
46 Background
Figure 2.17: Device of StressEraserTM [3].
Figure 2.18: Device of emWaveTM [5].

2.6 Discussion 47
Figure 2.19: Device of ThoughtStreamTM system [4].
ing that is commercially marketed. The design of stress monitoring is based on the conception
that the skin electrical conductance increases when the stress level of the subject increases.
Therefore, the system measures the skin electrical conductance with the included hand sensor
to assess stress (see Figure2.19). The user wears the sensor and waits a few seconds for the
startup of the system. The system firstly calibrates to the current affective state of the user and
then begins to monitor his stress level. If the stress of the user is detected, a visual feedback
is provided at first where the front panel display turns red. To decrease the stress levels, the
user listens to music with the included headphones. The tone of the music is controlled by the
user’s skin conductance readings and the user learns to reduce the pitch of the music. When
the user is back to the normal state, the front panel display turns green.
As can be seen, these commercial devices firstly measure the stress of the subjects and
then offer solutions for feedback to regulate the stress, which help the subjects to manage the
stress state. However, for these devices, the measure of the stress only depends on the analysis
of one physiological responses. Their scientific validations were not sufficiently discussed.
We can not ensure its efficiency of stress detection.
2.6 Discussion
As an essential part of the research of the Psypocket project, the study of this thesis is the
discussion of the feasibility and the interest of stress recognition from heterogeneous data and
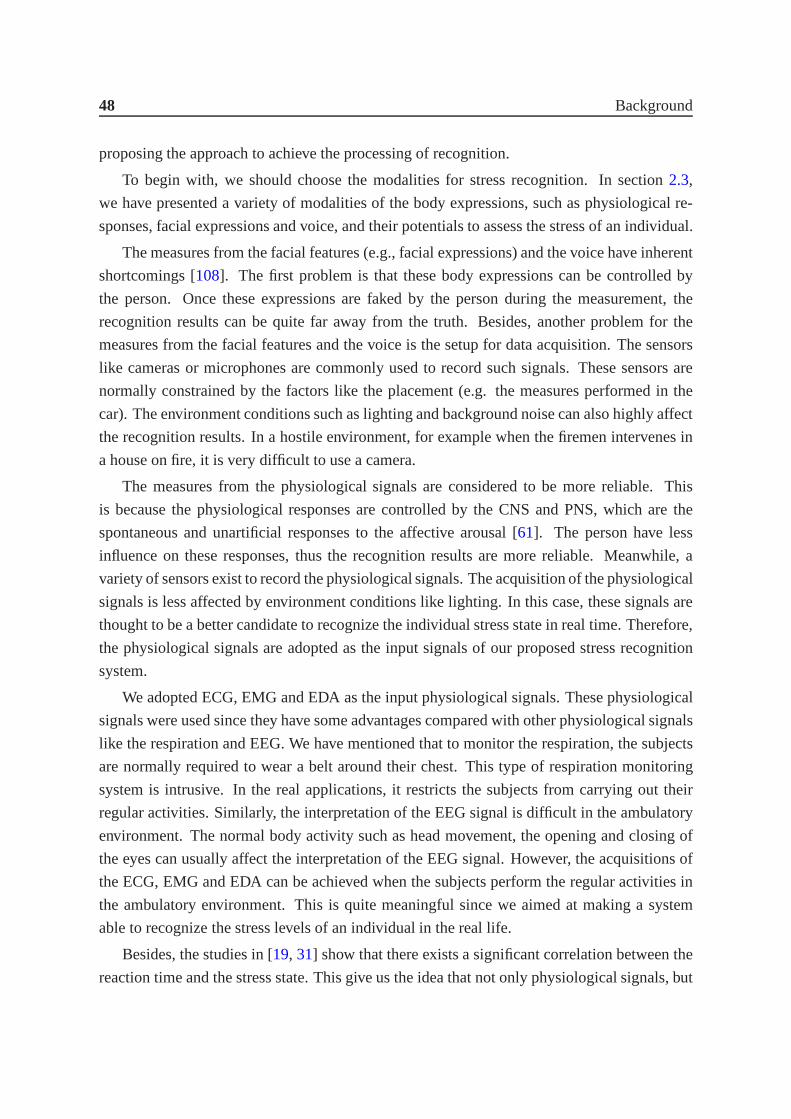
48 Background
proposing the approach to achieve the processing of recognition.
To begin with, we should choose the modalities for stress recognition. In section2.3,
we have presented a variety of modalities of the body expressions, such as physiological re-
sponses, facial expressions and voice, and their potentials to assess the stress of an individual.
The measures from the facial features (e.g., facial expressions) and the voice have inherent
shortcomings [108]. The first problem is that these body expressions can be controlled by
the person. Once these expressions are faked by the person during the measurement, the
recognition results can be quite far away from the truth. Besides, another problem for the
measures from the facial features and the voice is the setup for data acquisition. The sensors
like cameras or microphones are commonly used to record such signals. These sensors are
normally constrained by the factors like the placement (e.g. the measures performed in the
car). The environment conditions such as lighting and background noise can also highly affect
the recognition results. In a hostile environment, for example when the firemen intervenes in
a house on fire, it is very difficult to use a camera.
The measures from the physiological signals are considered to be more reliable. This
is because the physiological responses are controlled by the CNS and PNS, which are the
spontaneous and unartificial responses to the affective arousal [61]. The person have less
influence on these responses, thus the recognition results are more reliable. Meanwhile, a
variety of sensors exist to record the physiological signals. The acquisition of the physiological
signals is less affected by environment conditions like lighting. In this case, these signals are
thought to be a better candidate to recognize the individual stress state in real time. Therefore,
the physiological signals are adopted as the input signals of our proposed stress recognition
system.
We adopted ECG, EMG and EDA as the input physiological signals. These physiological
signals were used since they have some advantages compared with other physiological signals
like the respiration and EEG. We have mentioned that to monitor the respiration, the subjects
are normally required to wear a belt around their chest. This type of respiration monitoring
system is intrusive. In the real applications, it restricts the subjects from carrying out their
regular activities. Similarly, the interpretation of the EEG signal is difficult in the ambulatory
environment. The normal body activity such as head movement, the opening and closing of
the eyes can usually affect the interpretation of the EEG signal. However, the acquisitions of
the ECG, EMG and EDA can be achieved when the subjects perform the regular activities in
the ambulatory environment. This is quite meaningful since we aimed at making a system
able to recognize the stress levels of an individual in the real life.
Besides, the studies in [19, 31] show that there exists a significant correlation between the
reaction time and the stress state. This give us the idea that not only physiological signals, but

2.6 Discussion 49
also reaction time is possible to be adopted to recognize if an individual is under stress state.
Moreover, we know that for the stress recognition from physiological signals, the subject have
to be in physical contact with the electrodes of the biosensors to record the physiological
signals. However, recording reaction time is noninvasive since the subject does not need to be
in physical contact with the adhesive electrodes. This noninvasive recording is quite beneficial
for the practical Human–computer interaction (HCI) application. In some cases, we monitor
the stress of an individual when he is performing the HCI task and his reaction time can
be directly measured. For example, when an individual is typing on a keyboard to note the
speeches of other people, his reaction time of loading a letter can be measured by the speed
of typing. Therefore, it is quite meaningful to adopt the reaction time to recognize the stress
state of an individual. However, little attention has been paid to use reaction time for stress
recognition. Thus, in this thesis, we also adopt reaction time as another input signal of our
recognition system and discuss its feasibility of stress recognition.
Then, we need to design the experiment to acquire the physiological signals and RT related
to the stress. The experimental protocol is aimed at eliciting different stress states of the
participating subject at the pre-determined period. In the subsection2.4.1, we have reviewed
the researches of stress recognition given physiological signals in the literature. We generally
found that only one stressor was used to elicit the stress and thus the presented recognition
performance was only related to this stressor. However, in reality, there exists various stressors
[33]. Since Psypocket system aims to be used in the real life, it is designed to provide good
recognition performance when facing different stressors. Thus, we design the experiments
using different stressors to elicit the stress of an individual.
In section2.4, we have mentioned that to achieve automated stress recognition, a classifier,
for example the SVM, should be involved. This classifier is firstly trained by the signals related
to different levels of stress. Then, the trained classifier model can be used to predict the stress
level given the input signals. Thus, another important work of this thesis is to evaluate the
performances of a selected classifier from a literature study, which can be used to realize the
stress recognition given physiological signals and RT. Moreover, since standard classification
algorithms can not be directly applied to the raw time-series signals, we need to extract the
informative features from the signals. These informative features are used as the inputs of
the classifier. The details of our proposed stress recognition methodology are presented in the
following chapters.
Moreover, in this thesis, we will discuss the feasibility of embedded system which would
realize the complete data processing for stress recognition. By the analysis of the existing
embedded systems such as Android OS based mobile device and FPGA, we would like to find
out the suitable approach to implement our proposed recognition processing. This work can
50 Background
contribute to make an embedded system to recognize the stress of an individual.
2.7 Summary
In this chapter, we introduced the concept of the stress and indicate that people face a variety
of stressors in everyday life. We emphasized that the stress may be harmful to the subjects
and can bring in negative consequences such as mental and physical problems. Therefore, it
is meaningful to provide the assessment of the stress of an individual.
The body expressions of an individual such as the physiological responses, facial features
(facial expressions, eye gaze, eye blinks and pupil dilation) and voice were investigated and
their potentials for stress recognition were discussed. We found that compared with the body
expressions like facial features and voice, the responses of the physiological signals were
considered to be more reliable to recognize the stress state of an individual. Except of the
physiological signals, we presented that it is quite meaningful to adopt reaction time for stress
recognition.
We reviewed the methodologies presented in the literature for the automated recognition
of stress given body expressions. We found that these methodologies adopted the technique of
machine learning which normally involved in the steps of feature extraction from the acquired
signals and the classification with a trained classifier. Besides, we also presented the stress
recognition systems proposed in the laboratory settings and in the commercial market.
In the end, we introduced the works performed in this thesis and presented that the study of
this thesis can contribute to make an embedded system to recognize the stress of an individual.
Chapter 3
Experiments for signal acquisition
In this chapter, we provide a description of the designed experiments to acquire the physio-
logical signals and reaction time (RT) related to the stress. This part of the study was done in
collaboration with physiological specialists (“emotion-action” group of the LCOMS labora-
tory). The experimental protocol is aimed at eliciting different stress states of the participating
subject at pre-determined periods. In the previous chapter, we have reviewed the researches
of stress recognition given physiological signals in the literature. We found that in most of the
researches [53, 105, 129], only one stressor was used to elicit the stress and thus the presented
recognition performance was only related to this stressor. However, in reality, there exists
various stressors [33]. Since Psypocket system aims to be used in the real life, it is designed
to provide good recognition performance when facing different stressors. Thus, we designed
the experiments using different stressors to elicit the stress of an individual.
In the first section, we introduce our first design for the signal acquisition which adopts
a huge noisy sound (high dB) to elicit the stress of the subjects. In the second section, the
second design for the signal acquisition is introduced. In this design, we propose two new
experiments which adopt respectively a visual stressor (Stroop test) and an auditory stressor
(acoustic induction). For each design, we describe the experimental protocol, the prepro-
cessing of the physiological signals and the statistical analysis of the recorded physiological
signals and RT. This analysis is achieved by the Student’s t-test and is aimed at figuring out if
a statistical difference of the subject’s physiological signals and RT exists when this subject is
under different stress levels.
3.1 First design for signal acquisition
For this experiment, an experimental platform was designed for data acquisition. It was con-
stituted of a display board (see Figure3.1), two joysticks, a computer and the BIOPACTM

52 Experiments for signal acquisition
Figure 3.1: Display board.
System (system for the acquisition of physiological signals, see Figure3.2). The details of the
BIOPACTM System and the acquisition of physiological signals are introduced in section3.3.
There were two screens on the display board. They were placed in parallel and each screen
could show a flashing arrow which was constituted of a set of LEDs. The flashing arrow
pointed either left or right. The joysticks were connected with the computer and a button was
implemented on their top.
Twelve subjects participated in this experiment. During this one, the participants sat in
front of the display board, wore a headset and held one joystick in each hand. Besides, they
wore the physiological sensors of the BIOPACTM System to collect the physiological signals
(EDA, ECG and EMG).
The experiment was constituted of the successive reaction time (RT) tasks. The tasks
required the participant to respond the direction of the flashing arrow appeared on the screens
by pressing the button of the joystick and his RT was recorded. The participants performed RT
tasks in two different conditions: normal condition and stressful condition. We adopted a huge
noisy sound (80 dB) to elicit the stress of the participants. A higher dB was not adopted since
80 dB is the threshold above which there is a risk for auditory sense. Each time, a set of four
consecutive RT tasks appeared. They were either all performed in the normal condition or all
performed in the stressful condition. After one set of RT tasks was finished, the participants
waited for forty seconds until a new set of RT tasks appeared.
One RT task (almost 8 seconds) began with a sound of click to indicate the start of the RT
task (see Figure3.3). Then after almost 5 seconds, the flashing arrow appeared on the screens
of the display board. For each RT task, the flashing arrow appeared on one of the screen
and pointed either left or right. That is to say, the flashing arrow pointed right might appear

3.1 First design for signal acquisition 53
Figure 3.2: BIOPACTM System.
Figure 3.3: Illustration of one RT task in the normal condition.
on the left screen (see Figure3.1). When the flashing arrow appeared, the participants were
required to press the button of the joystick. If the flashing arrow pointed left, the participant
should press the button of the joystick in the left hand. If the flashing arrow pointed right, the
participant should press the button of the joystick in the right hand. The RT of the participant
was recorded. Here, the RT was the time interval from the appearance of the flashing arrow
to the moment when the button of the joystick was pressed by the participant. In the normal
condition, a sound of click appeared at the end of the RT task. In the stressful condition, a
huge noisy sound appeared randomly during the RT task. That is to say, the huge noisy sound
might appear before the appearance of the flashing arrow.

54 Experiments for signal acquisition
3.2 Second design for signal acquisition
For this second design, we proposed two new experiments which adopted respectively a visual
stressor (Stroop test) and an auditory stressor (acoustic induction) to elicit the stress of the
subjects.
The first experiment used a visual stressor (Stroop test) to elicit the stress. The Stroop test
[120] asks the subject to name the font color of the word when the color and the meaning of
the words differ (e.g., the word “yellow” printed in green ink instead of yellow ink). This test
has been used as an effective physiological stressor for stress recognition by many authors
like Hainaut and Bolmont [50]. The second experiment used an auditory stressor (acoustic
induction) to elicit the stress. Music was found to be effective to arouse positive and negative
emotion in the research of Kim and André [68]. They observed the physiological changes
in music listening. In [97], the acoustic induction was a stress stimulus in the controlled
laboratory environment. The details of these two experiments are explained in the following
paragraphs.
Twenty-two students (ages between twenty to twenty-two years old) from University of
Lorraine participated in our experiments and they were divided into two groups. The first
group of ten male students participated in the experiment of visual stressor and the second
group of twelve female students participated in the experiment of auditory stressor.
3.2.1 Experimental protocol of the experiment using visual stressor
A new experimental platform was designed for data acquisition (see Figure3.4). A screen was
placed in front of the subject for the Stroop test and a joystick was placed between them. The
joystick can be manipulated by the subject to point in four directions and a button is installed
on the top of the joystick. Two LEDs were put below the screen for RT test. During the
experiment, the subject sat in the chair, wore a headset and held the joystick. The physiological
signals of the subject (EDA, ECG and EMG) were recorded by the physiological sensors of
the BIOPACTM System.
The experiment of visual stressor consists of three sections (Figure3.5). It begins with
Section 1 composed of 100 consecutive RT tasks. In one RT task, when the LEDs (originally
turned off) are lighted up, the subject has to press the button on the top of the joystick to
respond (see Figure3.6). The RT, time interval between the LEDs lighting up and the subject’s
click on the button, is calculated and recorded.
Section 2 and Section 3 are the sections for Stroop test and each section is constituted of
300 consecutive Stroop tasks. We designed a computer-based interacting environment for the
Stroop test. In one Stroop task, a graphic user interface is shown on the screen. A word is

3.2 Second design for signal acquisition 55
Figure 3.4: The experimental platform.
Figure 3.5: Schedule of the visual stressor experiment.

56 Experiments for signal acquisition
Figure 3.6: Illustration of RT task.
written in the center of the interface with four buttons surrounding it (Figure3.7). The word
is the name of a color in French and the buttons are also labeled with different colors’ names
in French. The subject has to choose the button with the label that matched the font color of
that word. The choice of the button is realized by using the joystick. When the joystick is
manipulated to point in one direction, its corresponding button is chosen. For example, when
the joystick is pushed to point forward, the button above the word is chosen. If the answer is
not right, the subject will hear a buzz in the headset. Moreover, if the subject does not respond
in 2.5 seconds, the screen will change to the next task automatically.
The Stroop tasks of Section 2 are the tasks without interference, which means that the
word is printed in the color denoted by its name (e.g., word “rouge” (red) printed in red ink,
see Figure3.8 (a)). The Stroop tasks of Section 3 are the tasks with interference, where the
word is printed in the color not denoted by its name (e.g., word “noir” (black) printed in
yellow ink instead of black ink, see Figure3.8 (b)). Besides, RT tasks appear randomly in
Section 2 and Section 3. Following these patterns, both of sections 2 and 3 are composed of
100 RT tasks. The duration of Section 1 is four minutes. Section 2 lasts for nine minutes and
Section 3 lasts for thirteen minutes. Section 3 lasts longer as section 2 since the Stroop task
with interference is much more complicated than the Stroop task without interference and the

3.2 Second design for signal acquisition 57
Figure 3.7: Stroop test.
subjects need more time to give the response.
As can be seen, the RT task is a quite simple task compared with the Stroop task. Besides,
the Stroop task with interference is much more complicated than the task without interference
and thus elicits a higher stress to the subject [129]. Therefore, the subject is assumed to be in
higher stress state in Section 3 than in Section 2, and also in higher stress state in Section 2
than in Section 1. When one section is finished, the subject is asked to relax for one minute
before pursuing the next section.
3.2.2 Experimental protocol of the experiment using auditory stressor
The experiment of auditory stressor also consists of three sections (Figure3.9) and each sec-
tion is constituted of 100 consecutive RT tasks. The experiment begins with Section 1. During
this section, there is no sound in the headset. In Section 2, the subject hears positive ambient
sounds in the headset, such as agreeable music and applause, and in Section 3, the subject
hears negative ambient sounds, for example horrible shrieking. The sounds are derived from
International Affective Digitized Sound system (IADS) [21]. The duration of each section is
four minutes. Since the negative ambient sounds elicit a higher stress to the subject [68], the
subject is assumed to be in higher stress state in Section 3 than in Section 2 and also in higher
stress state in Section 2 than in Section 1. In this experiment, the subject is also asked to relax
for one minute when one section is finished.
For convenience, in the experiment of visual stressor and the experiment of auditory stres-
sor, we call the three levels of stress: high stress (Section 3), medium stress (Section 2) and
low stress (Section 1).

58 Experiments for signal acquisition
(a) task without interference. (b) task with interference.
Figure 3.8: Illustrations of Stroop task.
Figure 3.9: Schedule of the auditory stressor experiment.

3.3 BIOPACTM System and acquisition of physiological signals 59
Figure 3.10: The acquisition of EDA.
3.3 BIOPACTM System and acquisition of physiological sig-
nals
The BIOPACTM System was constituted of the physiological sensors and amplifiers. The
recorded physiological signals could be displayed on the screen of the computer for real time
monitoring.
For each experiment, three physiological sensors were used, EDA, ECG and EMG. The
electrodes of the EDA sensor were attached to the index and middle finger of the left hand (see
Figure3.10). The three-lead ECG signal was recorded with the ECG sensor onthe chest. The
EMG sensor was placed on the trapezius muscle (shoulder, see Figure3.11). The BIOPACTM
System collected all three physiological signals and digitized them at a common sampling rate
of 2000 Hz.
3.4 Preprocessing of the physiological signals
For each experiment, once the physiological signals were recorded, at first, they have been
filtered to avoid artifacts. The EMG signal was firstly filtered with a notch filter of 50Hz to
filter out power line noise and then a low-pass filter with the cutoff frequency of 500Hz was
applied. Besides, it has been found that the EMG recordings of trapezius muscle are often
contaminated by the ECG signal [81]. This is due to the proximity of the trapezius muscle to
the heart. In this case, it is difficult to distinguish between low-level muscle activity and a fully
resting muscle in the EMG signal. This ECG contamination can lead to an over-estimation of
the amplitude and frequency of the upper trapezius muscle during the low-level muscle con-

60 Experiments for signal acquisition
Figure 3.11: The acquisition of EMG.
tractions and the rest of the muscle. In Figure3.12, we illustrate the ECG contamination on
the trapezius muscle. Here, we plot the synchronized EMG signal of this muscle (top of the
figure) and the ECG signal (bottom of the figure) recorded in our experiment. In Figure3.12,
the duration of the recording is five seconds. We can clearly see the periodic positive and neg-
ative peaks in the EMG signal of the trapezius muscle. By comparing the synchronized ECG
signal, we find that when these peaks appear, the appearance of the periodic QRS complex of
the ECG signal can be also detected.
To remove the ECG contamination on the trapezius muscle, we adopted the method men-
tioned in [81]. This method applied a 30 Hz high-pass filter to the EMG signal of the trapezius
muscle for the removal of ECG contamination. It has been suggested as the most efficient
method for the removal of ECG contamination and has been widely applied in the practice
[38]. In our implementation, we passed the EMG signal through a 4thorder high-pass But-
terworth filter with the cutoff frequency of 30 Hz (zero-phase shift) recommended in [81]. In
Figure3.13, we illustrate the effect of the removal of ECG contamination on the previously
mentioned five seconds’ recording of the EMG signal. The original EMG signal of the trapez-
ius muscle is illustrated on the top of the figure and the filtered EMG signal is illustrated on the
bottom of the figure. As can be seen, after filtering with a 30 Hz high-pass filter, the periodic
positive and negative peaks in the EMG signal has been removed.
It should be mentioned that the ECG signal requires addition preprocessing, since we need
to obtain HRV time series from continuous ECG signal [68]. The HRV time series will be used
to generate informative features for classification. To obtain these time series, Pan-Tompkins
algorithm [93] was used. This algorithm was firstly proposed by Pan and Tompkins in 1985 to
detect the QRS complex of the ECG signal in real time. The algorithm has been widely used
in the real applications of the QRS complex detection from recorded ECG signal [98].

3.4 Preprocessing of the physiological signals 61
Figure 3.12: Illustration of the ECG contamination.
Figure 3.13: Illustration of the removal of ECG contamination.

62 Experiments for signal acquisition
The Pan-Tompkins algorithm detect the QRS complex by analyzing its characteristics such
as amplitude and slope. Firstly, the authors designed a bandpass filter with a passband of 5-
12 Hz to remove the artifacts and interferences that may be present in the ECG signal. The
bandpass filter is constituted of cascaded low-pass and high-pass filtering with integer filters.
Then the ECG signal was processed with the following processing: differentiation, squaring
and time average of the filtered signal. Finally, a strategy of thresholds comparison is applied
to determine the locations of the QRS complex, where the thresholds can be automatically
adjusted by the algorithm. The mathematical functions of the algorithm are detailed in first
appendix. The algorithm was tested by Pan and Tompkins on the 24 h MIT/BIH arrhythmia
database and achieved a correct detection accuracy of 99.3 percent.
Once the QRS complex of the ECG signal were detected, we could determine the locations
of the R peaks. Then, the heart rate can be obtained by the calculation of the time interval
between two consecutive R peaks. By appling a linear interpolation [104], we finally obtained
aninterpolated HRV time series with a re-sampling frequency of 8Hz.
3.5 Statistical analysis
For each experiment, after the preprocessing of the physiological signals, we analyzed sta-
tistically the recordings of physiological signals and RT to find out if the difference of the
physiological responses and RT exists when the subject was under different stress levels. For
this purpose, the Student’s t-test was used.
3.5.1 Student’s t-test
Student’s t-test is a statistic test which is commonly used to determine if two sets of data are
significantly different from each other. The data sets should follow a normal distribution. The
two-sample t-test firstly proposes the null hypothesis that the data in two sets comes from
independent random samples from normal distributions with equal means. This hypothesis is
verified by a calculated p-value which is in the range [0,1]. If the p-value is below the signifi-
cance level chosen for statistical significance (usually the 0.05 level), then the null hypothesis
is rejected and thus we can say two sets of data are statistical significantly different from each
other.
Therefore, by using the Student’s t-test, we could figure out if a statistical difference ex-
ists when the subject was under different stress levels in terms of the subject’s physiological
responses as well as RT. In our study, the significance level of 0.05 was chosen.

3.5 Statistical analysis 63
3.5.2 Statistical analysis of the first design of the experiment
In the first design of the experiment, the participants performed RT tasks in two different
conditions: normal condition and stressful condition. Besides, for each RT task, the flashing
arrow may appear on left or right screen on the display board and pointed either left or right.
Thus, firstly, we distinguished eight modes for the RT tasks:
• mode nGG: the flashing arrow appeared on left screen on the display board and pointed
left and the participant performed RT task in normal condition.
• mode nDD: the flashing arrow appeared on right screen on the display board and pointed
right and the participant performed RT task in normal condition.
• mode nGD: the flashing arrow appeared on left screen on the display board and pointed
right and the participant performed RT task in normal condition.
• mode nDG: the flashing arrow appeared on right screen on the display board and pointed
left and the participant performed RT task in normal condition.
• mode sGG: the flashing arrow appeared on left screen on the display board and pointed
left and the participant performed RT task in stressful condition.
• mode sDD: the flashing arrow appeared on right screen on the display board and pointed
right and the participant performed RT task in stressful condition.
• mode sGD: the flashing arrow appeared on left screen on the display board and pointed
right and the participant performed RT task in stressful condition.
• mode sDG: the flashing arrow appeared on right screen on the display board and pointed
left and the participant performed RT task in stressful condition.
We designed different modes in order to figure out if the non-coherence (modes nGD, sGD,
nDG and sDG) can affect the performance of RT.
Then, for each subject, we extracted the subject’s three physiological signals (EDA, EMG
and HRV) and RTs during one session of RT task. The extractions were performed for all the
RT tasks of the experiment. After that, for each mode of the RT tasks, we computed the mean,
the median and the standard deviation of the extracted physiological signals and RTs of all the
RT tasks belonging to this mode.
Since twelve subjects participated in this experiment, for each mode of the RT tasks, we
obtained a set of means (contained twelve means), a set of medians (contained twelve medians)
and a set of standard deviations (contained twelve standard deviations).

64 Experiments for signal acquisition
Modes Set of comparison
mean median standard deviationnGG vs sGG 0.91 0.84 0.48nDD vs sDD 0.96 0.84 0.84nGD vs sGD 0.93 0.99 0.28nDG vs sDG 0.85 0.95 0.46
Table 3.1: The p-values of t-test for EDA.
Modes Set of comparison
mean median standard deviationnGG vs sGG 1.00 0.81 0.81nDD vs sDD 0.96 0.96 0.49nGD vs sGD 0.56 0.87 0.27nDG vs sDG 0.98 0.76 0.78
Table 3.2: The p-values of t-test for EMG.
Each set was examined to verifier if it follows a normal distribution. We found that all the
sets follow a normal distribution. Thus, in the end, the sets belonging to the normal condition
and the sets belonging to the stressful condition were compared by performing the Student’s
t-test.
For example, in the case of an flashing arrow appearing on left screen on the display board
and pointed left, to test the statistical difference between the normal condition and the stressful
condition in terms of the mean of RT, we took twelve subjects’ means of RT of the mode nGG
and the mode sGG. These two sets of means were used to calculate the p-value of t-test.
Table3.1, 3.2 and3.3 list the computed p-values of t-test for the physiological signals.
Table3.4lists the computed p-values of t-test for the RT.
We find that the p-values of t-test for three physiological signals and RT are all greater
than 0.05 (significance level). This means that neither physiological response nor RT shows
statistical significant difference between the normal condition and the stressful condition.
Modes Set of comparison
mean median standard deviationnGG vs sGG 0.81 0.82 0.84nDD vs sDD 0.94 0.99 0.90nGD vs sGD 0.84 0.88 0.57nDG vs sDG 0.97 0.91 0.56
Table 3.3: The p-values of t-test for HRV.

3.5 Statistical analysis 65
Modes Set of comparison
mean median standard deviationnGG vs sGG 0.88 0.98 0.39nDD vs sDD 0.54 0.64 0.56nGD vs sGD 0.76 0.84 0.44nDG vs sDG 0.86 0.79 0.51
Table 3.4: The p-values of t-test for RT.
3.5.3 Statistical analysis of the second design of the experiment
3.5.3.1 The experiment of visual stressor
To begin with, we performed the Student’s t-test to the physiological signals to figure out if a
statistical difference between different sections of the experiment of visual stressor exists in
terms of ten subjects’ means and standard deviations of the physiological signals.
To achieve this goal, firstly, for each subject, we computed the mean value and the standard
deviation of the physiological signals in each section of the experiment. We examined and
verified that all the sets of means and standard deviations follow a normal distribution.
Then the Student’s t-test was performed by adopting the sets of the subjects’ means and
standard deviations of the physiological signals of each two different sections. For example,
to test the statistical difference between the Section 1 and Section 2 in terms of the mean of
the EDA signal, we take ten subjects’ means of the EDA signal of Section 1 and Section 2.
These two sets of means are used to calculate the p-value of Student’s t-test.
Table3.5lists the calculated p-values for the set of means and the set ofstandard deviations
of three physiological signals. For the EDA signal, the means and standard deviations of the
subject 7 were not taken into consideration since his EDA signal of the Section 1 was not
recorded by the BIOPACTM System during the experiment. We find that the set of means and
the set of standard deviations show significant difference between the Section 1 (low stress)
and Section 3 (high stress) and between the Section 2 (medium stress) and Section 3 (high
stress).
For the EMG signal, we find that the set of means and the set of standard deviations show
significant difference between the Section 1 (low stress) and Section 3 (high stress). For
HRV, the means and standard deviations of the subject 3 were not taken into consideration
since his ECG signal of the Section 1 was not recorded by the BIOPACTM System during the
experiment. We find that the set of means and the set of standard deviations show significant
difference between the Section 1 (low stress) and Section 3 (high stress) and between the
Section 2 (medium stress) and Section 3 (high stress).

66 Experiments for signal acquisition
Table 3.5: The p-value of t-test for mean (a) and standard deviation (b) of three physiologicalsignals (experiment of visual stressor).
(a) meanEDA EMG HRV
Section 1 vs 3 0.0031 0.0249 0.0161Section 2 vs 3 0.0319 0.0619 0.0387Section 1 vs 2 0.3414 0.2420 0.4954
(b) standard deviationEDA EMG HRV
Section 1 vs 3 0.0084 0.0308 0.0326Section 2 vs 3 0.0341 0.2651 0.0446Section 1 vs 2 0.3361 0.3085 0.4516
Then, we performed the Student’s t-test to figure out if a statistical difference between
different sections of the experiment of visual stressor exists in terms of ten subjects’ means
and standard deviations of RT.
Firstly, for each subject, we computed the mean and the standard deviation of the RTs of
one hundred RT tasks in each section of the experiment. We examined and verified that all the
sets of means and standard deviations follow a normal distribution.
Then the Student’s t-test was performed by adopting the sets of the subjects’ means and
standard deviations of RT of each two different sections. For example, to test the statistical
difference between the Section 1 and Section 2 in terms of the mean of RT, we take ten sub-
jects’ means of RT of Section 1 and Section 2. These two sets of means are used to calculate
the p-value of Student’s t-test.
Table3.6 (a) lists the calculated p-values for the set of means and Table3.6 (b) lists the
calculated p-values for the set of standard deviations. We find that the set of means of RT
shows no statistical significant difference between each two sections, since the three p-values
are greater than 0.05 (significance level). However, the set of standard deviations of RT shows
statistical significant difference between the Section 1 (low stress) and Section 3 (high stress),
since the calculated p-value is 0.0117.
3.5.3.2 The experiment of auditory stressor
For the experiment using the auditory stressor, to begin with, we also performed the Student’s
t-test to the physiological signals to figure out if a statistical difference between different
sections of the experiment exists in terms of twelve subjects’ means and standard deviations
of the physiological signals.

3.5 Statistical analysis 67
Table 3.6: The p-value of t-test for mean of RT (a) and standard deviation of RT (b) (experi-ment of visual stressor )
(a) meanp-value
Section 1 vs 3 0.2054Section 2 vs 3 0.7806Section 1 vs 2 0.2999
(b) standard deviationp-value
Section 1 vs 3 0.0117Section 2 vs 3 0.4855Section 1 vs 2 0.0628
Similar to the experiment of visual stressor, firstly, for eachsubject, we computed the mean
value and the standard deviation of the physiological signals in each section of the experiment.
We examined and verified that all the sets of means and standard deviations follow a normal
distribution. Then the Student’s t-test was performed by adopting the sets of the subjects’
means and standard deviations of the physiological signals of each two different sections.
Table3.7lists the calculated p-values for the set of means and the set ofstandard deviations
of three physiological signals. For the EDA signal, We find that the set of means as well as the
set of standard deviations show significant difference between the Section 1 (low stress) and
Section 3 (high stress) and between the Section 2 (medium stress) and Section 3 (high stress).
For the EMG signal, we find that the set of means and the set of standard deviations show
significant difference between the Section 1 (low stress) and Section 3 (high stress). For HRV,
the means and standard deviations of the subject 10 were not taken into consideration since her
ECG signal recorded by the BIOPACTM System was severely contaminated by the noise and
thus typical QRS complex could not be observed and located. We find that the set of means
show significant difference between the Section 1 (low stress) and Section 3 (high stress)
and between the Section 2 (medium stress) and Section 3 (high stress). The set of standard
deviations show significant difference between the Section 1 (low stress) and Section 3 (high
stress).
Then, we performed the Student’s t-test to figure out if the statistical difference between
different sections of the experiment exists in terms of twelve subjects’ means and standard
deviations of RT. Firstly, for each subject, we computed the mean and the standard deviation
of the RTs of one hundred RT tasks in each section of the experiment. We examined and
verified that all the sets of means and standard deviations follow a normal distribution. Then
the Student’s t-test was performed by adopting the sets of the subjects’ means and standard
deviations of RT of each two different sections.
Table3.8 (a) lists the calculated p-values for the set of means and Table3.8 (b) lists the
calculated p-values for the set of standard deviations. We find that the set of means of RT
shows statistical significant difference between the Section 1 (low stress) and Section 3 (high

68 Experiments for signal acquisition
Table 3.7: The p-value of t-test for mean (a) and standard deviation (b) of three physiologicalsignals (experiment of auditory stressor).
(a) meanEDA EMG HRV
Section 1 vs 3 0.0030 0.0343 0.0153Section 2 vs 3 0.0387 0.0937 0.0483Section 1 vs 2 0.3894 0.4336 0.5210
(b) standard deviationEDA EMG HRV
Section 1 vs 3 0.0069 0.0426 0.0437Section 2 vs 3 0.0426 0.2658 0.0895Section 1 vs 2 0.3165 0.3124 0.3663
Table 3.8: The p-value of t-test for mean of RT (a) and standard deviation of RT (b) (experi-ment of auditory stressor)
(a) meanp-value
Section 1 vs 3 0.0112Section 2 vs 3 0.0664Section 1 vs 2 0.2351
(b) standard deviationp-value
Section 1 vs 3 0.0005Section 2 vs 3 0.0459Section 1 vs 2 0.1813
stress), since the calculated p-value is 0.0112. The set of standard deviations of RT also shows
statistical significant difference between the Section 1 and Section 3, since the calculated p-
value is 0.0005. Besides, for the set of standard deviations, the calculated p-value between
the Section 2 (medium stress) and Section 3 (high stress) is 0.0459. This means statistical
significant difference between medium stress level and high stress level also exists in terms of
the subjects’ standard deviations of RT.
3.6 Discussion
For our first design of the experiments, neither physiological response nor RT shows statistical
significant difference between the normal condition and the stressful condition. A possible
explanation is that the noise is probably not strong enough to induce significant stress.
For our second design of the experiments, the results of the Student’s t-test show that
not only physiological signals but also RT shows statistical significant differences when the
subject is under different stress levels. The differences are found in the experiment using
visual stressor and in the experiment using auditory stressor. Moreover, the p-values of the

3.7 Summary 69
Student’s t-test for the distinction between the low stress and high stress level are always
lower than the distinction between the medium stress and high stress level. However, in either
the experiment using visual stressor or the experiment using auditory stressor, the statistical
significant difference is not found between the low stress and medium stress level.
Besides, we observe that in the experiment using visual stressor, RT shows statistical sig-
nificant difference in terms of the standard deviations between the low stress and high stress
level. In the experiment using auditory stressor, RT shows statistical significant difference in
terms of means and standard deviations between the low stress and high stress level and shows
statistical significant difference in terms of standard deviations between the medium stress and
high stress level. This shows that RT is more effective indicator when the stress is elicited by
the auditory stressor.
3.7 Summary
In order to discuss the feasibility of stress recognition from the heterogeneous data such as the
physiological signals and RT, we should acquire the physiological signals and RT related to the
stress. For this purpose, we firstly designed the experiment which adopted a huge noisy sound
to elicit the stress of the subjects. After the preprocessing of the physiological signals, we
analyzed statistically the recordings to find out if the difference of the physiological responses
or RT exists when the subject was in stressful condition (appearance of the huge noisy sound)
and normal condition (without appearance of the huge noisy sound). However, the results
of the Student’s t-test showed that neither physiological responses nor RT showed statistical
significant difference between the normal condition and the stressful condition.
For our second design of the experiments, we proposed two new experiments which adopted
respectively a visual stressor (Stroop test) and an auditory stressor (acoustic induction) to elicit
the stress of the subjects. These stressors have been used as the effective physiological stress
stimulus in the controlled laboratory environment. After the preprocessing of the physiolog-
ical signals, we also analyzed statistically the physiological signals and RTs recorded in the
experiments when the subject is under different stress levels. The results of the Student’s t-test
show that not only physiological signals but also RT shows statistical significant difference
when the subjects is under different stress levels. These results reinforce our belief that it is
feasible to adopt the reaction time to recognize the stress state of an individual.


Chapter 4
Stress recognition
In the previous chapter, we have presented our designed experiment for signal acquisition.
The acquired physiological signals and RT related to the stress have been recorded. In this
chapter, we present our methodology of stress recognition from these heterogeneous data.
The physiological signals, such as ECG, EMG and EDA, and reaction time (RT) are adopted
to recognize different stress states of an individual.
In the first section, we present our approach of stress recognition given physiological
signals. Different processing steps such as feature extraction and Support Vector Machines
(SVM) classification are introduced. In the second section, the approach of stress recognition
given RT is presented. In the third section, we present the approach of decision fusion for
recognition, which has been found to improve the recognition performance.
Then, we test the proposed approach of stress recognition given physiological signals on
a published stress data set and the results of test are presented in the fourth section. In the
fifth section, the performances of the approach of stress recognition by using physiological
signals and RT as well as the approach of decision fusion are tested. The tests are performed
on the physiological signals and RT acquired in our experiment using visual stressor and in our
experiment using auditory stressor. The evaluation and discussion of the proposed approaches
are described in the sixth section.
4.1 Stress recognition using physiological signals
The overall structure of stress recognition given physiological signals is illustrated in Figure
4.1. The preprocessing of the physiological signals has been presented in the previous chapter.
After this step, the raw time-series of physiological signals were transformed into features.
Then these informative features were used as the classifier’s inputs to perform the classification
and compute the outputs : the stress levels.

72 Stress recognition
Figure 4.1: Block diagram of the stress recognition using physiological signals.
4.1.1 Feature extraction
The informative features were generated from the filtered EMG, EDA and HRV signals. These
signals were divided into the segments with predefined size (called sliding windows) and in-
formative features were generated for each sliding window. In our study, the physiological sig-
nals of each section were divided and processed into one minute 50% overlapping segments.
Thus, for the experiment of visual stressor, we obtained seven sliding windows for Section 1,
seventeen sliding windows for Section 2 and twenty-five sliding windows for Section 3. For
the experiment of auditory stressor, we obtained seven sliding windows for each section. Each
of these sliding windows was designed to represent a period of low stress (Section 1), medium
stress (Section 2) and high stress (Section 3).
Informative features are the statistical features which are originally used to analyze affec-
tive physiological state [102] and they can be computed in an online way which is an advantage
for real-time recognition. These statistical features have been widely used as the input features
of a classifier for stress recognition as well. For example, to achieve detection and recogni-
tion of human affect based on physiological signals, Rani et al. [105] made use of the mean
and the standard deviation of the EMG signal. Rigas et al. [109] calculated the first absolute
difference of the EDA signal to measure the skin conductance response in the research for
detecting drivers’ stress and fatigue and predicting driving performance. These features were
also adopted by the researchers in our laboratory for the studies of emotion recognition [6]
and short-term anxiety recognition [51].
Let the physiological signal be designated by x and xn represent the value of the n-th
sample of the signal in the window, wheren= 1, . . . ,N. We now list the informative features
used in our research in the next paragraphs.
4.1.1.1 Sample mean
The sample meanµx represents the mean of the raw signal within the sliding window and is
given by the following equation :
µx =1N
N
∑n=1
xn, (4.1)

4.1 Stress recognition using physiological signals 73
4.1.1.2 Standard deviation
The standard deviationσx means the deviation of the raw signals around the sample mean
within the sliding window.
σX = (1
N−1
N
∑n=1
(xn−µx)2)
12 , (4.2)
4.1.1.3 First absolute difference
The first absolute differenceδx represents the mean of the absolute value of the first difference
of the raw signal, which can be considered as an approximation of the gradient.
δx =1
N−1
N−1
∑n=1
|xn+1−xn|, (4.3)
4.1.1.4 Second absolute difference
The second absolute differenceγx represents the mean of the absolute value of the second
difference of the raw signal.
γx =1
N−2
N−2
∑n=1
|xn+2−xn|, (4.4)
4.1.1.5 Normalized first absolute difference
Since we have defined the sample meanµx and the standard deviationσx, we can introduce
the normalized signalXn (zero mean, unit variance), where
xn =xn−µx
σX(4.5)
In this case, we have the feature of normalized first absolute differenceδx, which represents
the mean of the absolute value of the first difference of the normalized signal.
δx =1
N−1
N−1
∑n=1
|xn+1− xn|, (4.6)

74 Stress recognition
4.1.1.6 Normalized second absolute difference
The normalized second absolute differenceγx represents the mean of the absolute value of the
second difference of the normalized signal.
γx =1
N−2
N−2
∑n=1
|xn+2− xn| (4.7)
These two absolute differences are introduced to approximate the gradient of the normalized
signal.
4.1.1.7 Feature normalisation
Then, once the informative features of all the sliding windows were computed, they were
max-min normalized to the range of [0, 1], as shown in equation4.8,
y=y−min(y)
max(y)−min(y)(4.8)
wherey denotes one informative feature, andmax(y) andmin(y) are the maximum and mini-
mum ofy of all the sliding windows. The max-min normalization was performed to eliminate
the initial level fluctuation due to the individual differences.
4.1.2 Classification
Once the informative features have been extracted, we need to use a classifier to perform the
classification of the stress levels. In [105], the researchers presented the strategy of stress
detection when the subjects were playing video games. The stress detection was achieved by
recording the ECG signal and monitoring the heart rate variability of a human in real time.
The researchers adopted the fuzzy logic as the classifier to perform the final decision making.
In [53], the researchers monitored the physiological changes of thedrivers when they were
under different stress levels. The physiological signals, for example, the skin conductance
were recorded by the biosensors and the informative features such as mean value and variance
of the physiological signals were extracted. The linear discriminant function was adopted as
the classifier which used the previously mentioned informative features for the classification
of the stress levels. In [37], the researchers detected the stress of the subjects by analyzing
the modifications of the facial expressions. The facial features such as eyes movements and
the levels of mouth openness were extracted. These facial features were adopted as the inputs
of a Hidden Markov classifier for the discrimination between the low stress state and high
stress state of the subjects. In [76], the researchers assessed the subject’s level of stress when

4.1 Stress recognition using physiological signals 75
they performed a workload task, for example, the serial addition subtraction task. During
the experiments, the physiological responses and the facial features of the participants were
monitored. The features like eyebrow movement were extracted. The researchers adopted the
Dynamic Bayesian Network as the classifier to assess the subject’s level of stress. In [73], Lee
et al. proposed their work of stress recognition and classification by the analysis of acoustic
data. The authors adopted Support Vector Machines as the classifier. The accuracy of stress
detection reached to 96.2%.
In our research, we chose Support Vector Machines (SVM) to perform the classification.
SVM [121] is a supervised classification algorithm. It is widely used tosolve the problem
of pattern recognition, such as sound recognition [110], human activity recognition [13], etc.
In [129], Zhai et al. presented their research of stress recognition using four physiological
signals when the user was interacting with the computer. A computer-based “Paced Stroop
Test” was designed to elicit emotional stress and three classification algorithms (Naïve Bayes
Classifier, Decision Tree Classifier, and SVM) were applied for stress recognition. The authors
compared classification accuracies of these algorithms and they found that SVM brought in
the highest classification accuracy than the other algorithms. In [116], Sharma et al. presented
a survey of machine learning techniques which were adopted for stress recognition. They
provided a rank of different machine learning techniques in terms of the reported classification
accuracy for stress recognition and the SVM was ranked first. Therefore, SVM was used as
the classification algorithm for stress recognition in our study.
4.1.2.1 Theoretical background of SVM
The SVM considers that every data is a point in its feature space and it is possible to find a
discriminant function in high dimensional feature space to separate the data points that related
to the different classes.
Supposing that there exists a set of data{xi}mi=1, and each dataxi is labeled with one
corresponding classyi , in the SVM classification, we try to find a classification functionΦ :
X →Y, wherexi ∈ X ⊆ ℜl andyi ∈Y = {−1,+1}.
The discriminant function can be linear or nonlinear. In the case that the discriminant
function is nonlinear, the input spaceX will be mapped into another higher dimensional fea-
ture spaceZ ⊆ ℜL, with L ≫ l , by the mapping functionϕ: xi → ϕ(xi). Thus,ϕ(xi) is the
corresponding point in the feature space and a hyperplane will be found to separate the points
in this space.
The formula of functionΦ is:
Φ(x) = ωϕ(x)+b (4.9)

76 Stress recognition
whereω is the normal vector to the hyperplane andb‖ω‖ determines the offset of the hy-
perplane from the origin along the normal vector.
The functionΦ corresponds to a hyperplane and the SVM searches the hyperplane which
has the maximum-margin. The maximum-margin means the distance between the hyperplane
and the nearest points (called support vectors) from either class group is maximal. Besides, to
maximize the margin, the SVM allows that some error points exist where the error point is the
point that not be correctly classified. In this case, a loss function is introduced to penalize the
cardinality of the errors.
Thus, we get a constrained optimization problem, which aims at finding
minω,b
12‖ω‖2+C
m
∑i=1
ξi
(4.10)
subject to
yi (ω·ϕ(xi)+b)≥ 1−ξi , ∀i = 1, ...,m. (4.11)
This is usually called the primal problem. The first term of the function (4.10) leads to
the maximum-margin of the hyperplane and the second term is the mentioned loss function to
penalize the errors. The trade-off between two terms is set by the constantC.
To solve the primal problem, it is usually rewritten in dual form with the use of the La-
grange multiplier:
minα12
m
∑i, j=1
αiα jyiy jϕ(xi) ·ϕ(x j)−m
∑i=1
αi (4.12)
subject to
m
∑i=1
αiyi = 0, and0≤ αi ≤C (4.13)
where
ω =
m
∑i=1
αiyiϕ(x) (4.14)

4.1 Stress recognition using physiological signals 77
Table 4.1: Kernel functions.
Kernel Function Formula
linear kernel k(xi,x j) = xi ·x j
Gaussian kernel k(xi,x j) = exp(− ‖ xi −x j ‖2 /2δ 2)polynomial kernel k(xi,x j) = (1+xi ·x j)
p
and since a support vector{xi ,yi} holds the equality:
yi (ω·ϕ(xi)+b) = 1 (4.15)
b can be found by using this equality. Moreover, we introduce the kernel functionsk which
satisfies
k(xi,x j) = ϕ(xi) ·ϕ(x j) (4.16)
The advantages of using kernel functions is that the nonlinear mappings can be calculated
by the inner product between two points in the feature space and we do not need to know the
explicit expression of the functionϕ. Several common kernel functions are listed in Table4.1.
Thus, the above optimization problem can be rewritten as
minα12
m
∑i, j=1
αiα jyiy jk(xi ,x j)−m
∑i=1
αi (4.17)
m
∑i=1
αiyi = 0, and0≤ αi ≤C (4.18)
and the problem can be solved by using the algorithm proposed in [103].
4.1.2.2 Our implementation of SVM
In our study, we used the SVM with Gaussian kernel [27] for classification. Since the Gaus-
sian kernel brought in the cost parameterC and the kernel parameterγ to be determined in
the training process, a parameter sweep was used to find the optimizedC andγ [110]. C and
γ were evaluated in the range from 2−2 to 22. We trained the SVM with sequential minimal
optimization algorithm [103] and the parameter set(C,γ) that could bring in the highest clas-
sification accuracy was conserved. Thus, with the optimized parameter set(C,γ), the trained
SVM model could be used to predict the stress level given the input features of the sliding

78 Stress recognition
window. The Gaussian kernel was adopted since it was shown to bring in a similar or better
performance than linear or polynomial kernels when the parameter set(C,γ) was well selected
[32].
The inputs of SVM were the max-min normalized informative features of one sliding win-
dow. The output of SVM was one classified stress level and this sliding window was labeled
with this stress level. This was performed to all the sliding windows and then we computed the
classification accuracies. The classification accuracy of SVM was evaluated using the 5-fold
cross validation method [27].
Besides, since the Psypocket is aimed at analyzing the stress state of an individual based
on his physiological, cognitive and behavioural modifications, the subject-dependent SVM
classifier [22] was used in our study. It means that the SVM is trained and evaluated by using
the data collected from the same subject. This subject-dependent model was applied in the
assessment of stress in real-world environments by Wijsman [124]. The author found that
the subject-dependent model can bring in a generally better recognition performance than the
subject-independent model.
4.2 Stress recognition using RT
We have indicated that several researches in the literature have presented that there exists a
significant correlation between the reaction time and the stress state. Here, we analyze the
recorded RT to find out if the difference of RT exists when the subject is under different stress
states. To achieve this goal, we proposed the method for stress recognition given RT and the
overall structure is illustrated in Figure4.2.
The RT trials appeared in the sliding window are recorded and the informative features of
RT are generated for each window. In our study, the RTs of each section are processed in the
one minute 50% overlapping sliding window. Informative features are the mean and standard
deviation (std) of the RTs recorded in the sliding window. For example, supposing that the
length of one sliding window is one minute, there are thirty RT trials appearing during this
one minute. Thus, the mean and standard deviation of the RTs of these thirty RT trials are
computed as the features of RT for this sliding window. Then, once the features of all the
sliding windows were computed, they were also max-min normalized to the range of [0, 1]
(see Formula4.8). The max-min normalized features of the sliding window were used as the
inputs of SVM classifier for classification and the output of SVM is one classified stress level
for this sliding window.

4.3 Decision fusion 79
Figure 4.2: Block diagram of the stress recognition using RT.
4.3 Decision fusion
In [94], Pantic et al. proposed that, in the noisy environment, the multimodal approach can lead
to not only better but also more robust recognition performance. In [28], Chen et al. presented
their research of emotion recognition by using both facial expressions and emotional speech.
The rule-based decision fusion combined the video and audio information to recognize the
emotions such as angry, dislike, fear, happy, sad and surprise. The researchers found that
compared with adopting facial expressions or emotional speech alone, the multimodal method
could bring in a better classification accuracy. Similarly, in [35], De Silva et al. presented an
audio-visual system for emotion recognition based on merging decisions with rules. For the
audio data, they used the characteristics of the prosody as the informative features. For the
video data, the informative features were the maximum distances of six characteristic points.
They found that the recognition performance of the system increased when the two modalities
were used together.
In [127], Yoshitomi et al. proposed a multimodal system for emotion recognition by con-
sidering voice, visual information and thermal image of face acquired by an infrared camera.
The visual information was extracted from the face images. The thermal image contained the
information of thermal distribution. The researchers integrated these three modalities with the
approach of decision fusion for recognition. A database recorded from a female reader related
to five emotions was adopted to evaluate the performance of recognition. They found that the
multimodal approach yielded better results than any of unimodal approach.
In [57], Hosseini et al. proposed a system for the assessment of stress by using multi-modal
bio-signals. The stress assessment was achieved by the fusion of the EEG and the peripheral
signals like blood volume pulse, electrodermal activity and respiration. The pictures derived
from International Affective Picture System database were used for the stress induction. The
proposed strategy achieved the average classification accuracy of 89.6%.
These studies gave us the idea that it is meaningful to discuss the feasibility of stress
recognition by merging the physiological signals and RT. Based on this idea, we proposed
the approach of decision fusion for stress recognition using three physiological signals as
well as RT. The overall structure of this approach is illustrated in Figure4.3. The sliding

80 Stress recognition
Figure 4.3: Block diagram of decision fusion using three physiological signals and RT.
windows recorded the synchronized physiological signals (ECG, EMG and EDA) and the RTs
of RT trials. We suppose that the length of one sliding window is one minute. Thus, the
first sliding window records the physiological signals of the first minute’s experiment and the
RTs of the RT trials appearing in this one minute. Then, physiological signals and RT in this
sliding window were processed. Each physiological signal gave out its output classification
result (one labeled stress level) by using the method presented in Figure4.1 and RT gave
out its output classification result by using the method presented in Figure4.2. Finally, these
classification results were processed with the strategy of decision fusion to give out the final
classification result and this sliding window was marked with the classified stress level.
In our research, the decision fusion is realized by the voting method [82]. Since its prin-
ciple is easy to implement, this method is widely used as a fusion approach. For example,
Katenka et al. [65] adopted the voting method to deal with the problem of target detection by
a wireless sensor network. By applying the vote decision fusion, the local sensor corrected its
decision using decisions of neighboring sensors and thus a significantly higher target detec-
tion rate was achieved. In the research of affective sensing, Zeng et al. [128] used the voting
method to combine the classification results of brow movement in face, pitch and energy in
prosody. The result showed 7.5% improvement of classification accuracy compared with the
best unimodal performance. Wu et al. [126] adopted the voting method to solve the problem
of vanishing-point detection. The vanishing-point was detected with high accuracy by the

4.3 Decision fusion 81
analysis of the road images. The authors claimed that the proposed strategy could be applied
for the navigation of automate mobile robots in the real time.
Besides, in [71], Lam et al. analyzed the behavior and performance of the voting method
to pattern recognition and proposed that this method was as effective as more complicated
schemes in improving the recognition results. Thus, we adopted the voting method for deci-
sion fusion.
The principle of the voting method is as follows. Supposing that there aremsources andk
classes. Each class is associated with the indicator function of one source:
I ji =
1 i f Sj(x) = i
0 else(4.19)
whereSj(x)= i indicates that based on the classification result of the sourceSj , the observation
x is assigned to the classCi . Then we write the indicator function of the combination of
sources:
IGi (x) =
m
∑j=1
I ji (x) (4.20)
Finally, the class that is voted most is declared as the final class label. In the case thatm is
even andm2 sources vote for classCi1 and the otherm2 sources vote for classCi2, we will add
an uncertain class. The observationx is marked as this uncertain class.
Meanwhile, to evaluate the contribution of RT in the step of decision fusion, we also
computed the classification accuracies of the fusion of three physiological signals for stress
recognition. In this case, the branch of SVM classification using RT shown in Figure4.3was
canceled and the decision fusion was processed by adopting the output classification results
of three physiological signals. Besides, we know that to record the EMG signal of trapezius
muscle, the electrodes of the sensor should be attached to shoulder of the subject. Similarly,
to record the ECG signal, the electrodes should be attached to the chest. However, in reality,
it is not always available to attach the electrodes of the sensors to the body of the subject.
Since our system is aimed to be used in the real life, we considered also the situation where
the EDA signal is the only available physiological source that could be used. The EDA signal
is commonly available in the real application as the electrodes of the EDA sensor are attached
to the subject’s finger. Based on this idea, we analyzed the performance of stress recognition
by the fusion of the EDA signal and RT. In this case, we conserved the branch of SVM clas-
sification using RT and the branch of SVM classification using EDA shown in Figure4.3and

82 Stress recognition
the decision fusion was processed by adopting the output classification results of these two
branches. The sliding window was marked as the high stress level if both two branches voted
it as high stress level. The classification accuracies of the proposed decision fusion approaches
were evaluated using the 5-fold cross validation method as well.
4.4 Test on a published stress data set
To begin with, we tested the proposed approach of stress recognition given physiological sig-
nals on a published stress data set.
4.4.1 Description of the stress data set
The data set is provided by Healey in his study of the assessment of a driver’s relative stress
level given physiological signals [53]. In this study, the subjects were required to follow
the predetermined driving protocol and participate in real world driving tasks. At first, a
fifteen-minute rest period occurred at the beginning of the drive. During this period, the driver
sat in the garage with eyes closed. The rest period was designed to let the subjects calm
down and thus created a low stress situation. After the rest period, the subjects drove on
the prescribed route including city streets and highways. All drives were conducted in mid-
morning or mid-afternoon and the duration of drive was about an hour and a half, depending
on traffic conditions. During this period, since the subjects drove in the real world, they
should paid high attentions to the surroundings cars and cyclists. Besides, the subjects may
also face a variety of unexpected hazards such as jaywalking pedestrians. Such real world
driving experiences were designed to create a much higher stress situation compared with the
rest period. After the real world drive on the route, the subjects drove back to the starting point
and took another fifteen-minute rest period in the garage. After the experiments, the subjects
were required to fill out the subjective ratings questionnaires.
During the experiments, the subjects wore the physiological sensors and the physiological
signals, for example the skin conductance (EDA) of the left hand and left foot, were recorded.
Thus, the data set which contained a collection of the physiological recordings related to
the different stress levels of the subjects was obtained. It should be mentioned that the data
acquired from the experiments in [53] lacks the informations of the durations of the rest period
and the driving period for all the drives. However, we found that in [8], the same durations
of ten drives (i.e. Drive 05, 06, 07, 08, 09, 10, 11, 12, 15 and 16) were mentioned. Thus, the
physiological recordings of these ten drives are used for our following discussions.

4.5 Test on the recordings of the first design of experiment 83
Drive No. Classification accuracy
Drive05 97.4%Drive06 94.9%Drive07 92.3%Drive08 100%Drive09 100%Drive10 88.5%Drive11 100%Drive12 96.2%Drive15 94.9%Drive16 100%
Table 4.2: Classification accuracies on the published stress data set.
4.4.2 Test results
We chose the skin conductance of the left hand as the processed physiological signal for our
test. By adopting our proposed stress recognition approach, six informative features presented
in subsection4.1.1were extracted from the skin conductance of the period of low stress (rest
period after the real world drive) and the period of high stress (real world drive on the route).
Then these features were used as the inputs of the SVM for the classification between the low
stress and high stress levels. Table4.2showed the classification accuracies.
As can be seen, for the discrimination between the period of low stress and the period of
high stress, the classification accuracies are more than 88.5% for the ten drives. Especially
for the Drive08, Drive09, Drive11 and Drive16, the classification accuracies reach to 100%.
These encouraging classification accuracies showed that a good performance to recognize the
stress levels of the subjects can be achieved by our proposed recognition approach.
4.5 Test on the recordings of the first design of experiment
In this section, we present the performance of stress recognition using physiological signals
and RT. The tests are performed on the physiological signals and RT acquired in our first
design of experiment. The approach of stress recognition by using physiological signals and
RT respectively as well as the approach of decision fusion are discussed. For each subject, the
classification was performed between the sets belonging to the normal condition and the sets
belonging to the stressful condition.
To begin with, we analyzed the performance of SVM classifier for stress recognition given
one physiological signal or RT recorded in the experiment. Table4.3 lists the classification
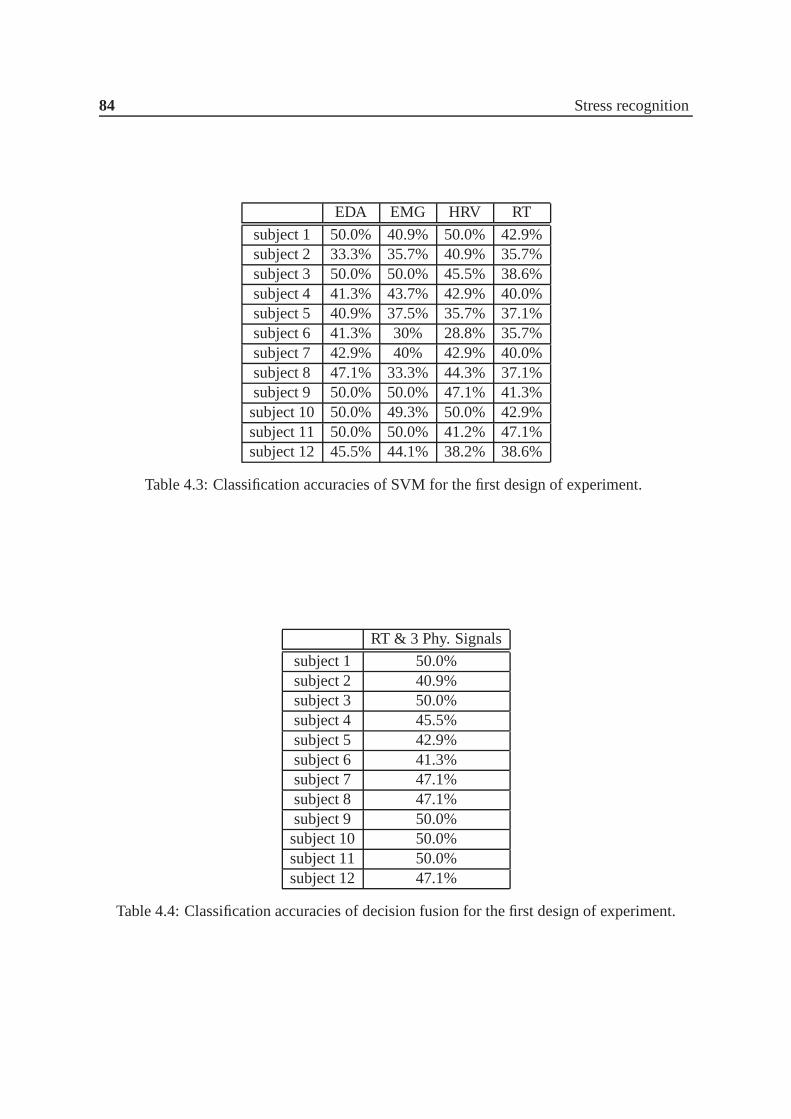
84 Stress recognition
EDA EMG HRV RT
subject 1 50.0% 40.9% 50.0% 42.9%subject 2 33.3% 35.7% 40.9% 35.7%subject 3 50.0% 50.0% 45.5% 38.6%subject 4 41.3% 43.7% 42.9% 40.0%subject 5 40.9% 37.5% 35.7% 37.1%subject 6 41.3% 30% 28.8% 35.7%subject 7 42.9% 40% 42.9% 40.0%subject 8 47.1% 33.3% 44.3% 37.1%subject 9 50.0% 50.0% 47.1% 41.3%subject 10 50.0% 49.3% 50.0% 42.9%subject 11 50.0% 50.0% 41.2% 47.1%subject 12 45.5% 44.1% 38.2% 38.6%
Table 4.3: Classification accuracies of SVM for the first designof experiment.
RT & 3 Phy. Signals
subject 1 50.0%subject 2 40.9%subject 3 50.0%subject 4 45.5%subject 5 42.9%subject 6 41.3%subject 7 47.1%subject 8 47.1%subject 9 50.0%subject 10 50.0%subject 11 50.0%subject 12 47.1%
Table 4.4: Classification accuracies of decision fusion for the first design of experiment.
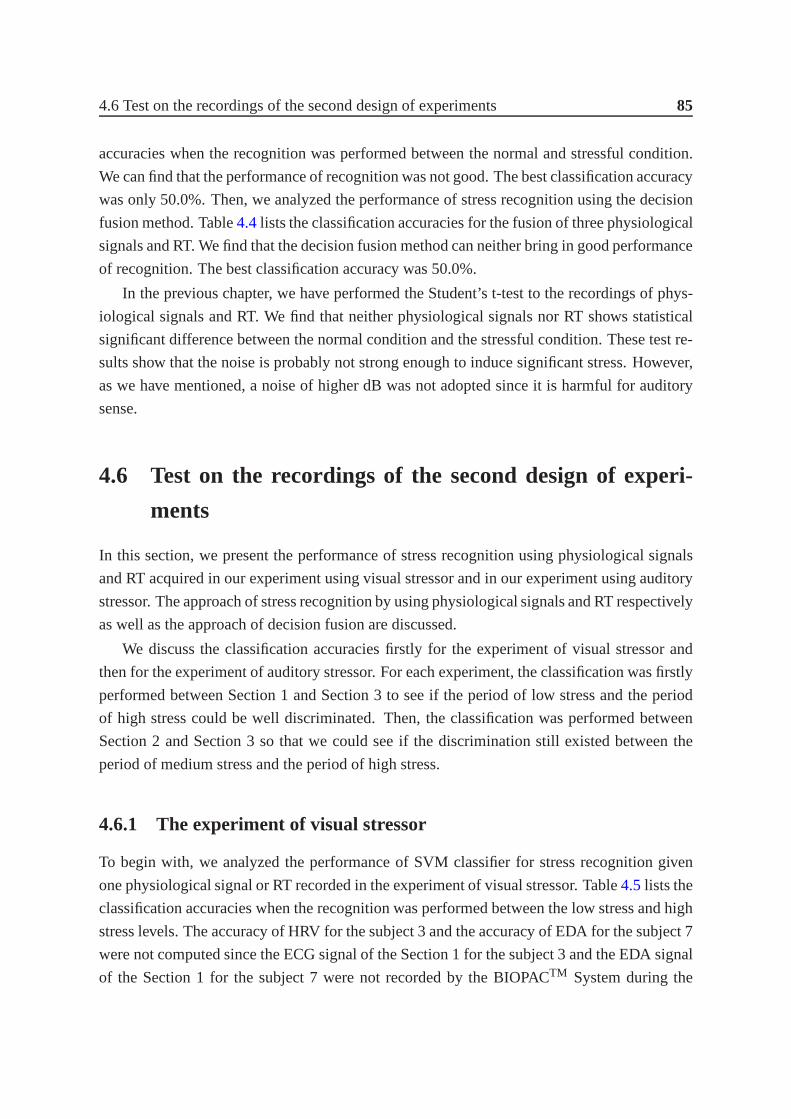
4.6 Test on the recordings of the second design of experiments 85
accuracies when the recognition was performed between the normal and stressful condition.
We can find that the performance of recognition was not good. The best classification accuracy
was only 50.0%. Then, we analyzed the performance of stress recognition using the decision
fusion method. Table4.4lists the classification accuracies for the fusion of three physiological
signals and RT. We find that the decision fusion method can neither bring in good performance
of recognition. The best classification accuracy was 50.0%.
In the previous chapter, we have performed the Student’s t-test to the recordings of phys-
iological signals and RT. We find that neither physiological signals nor RT shows statistical
significant difference between the normal condition and the stressful condition. These test re-
sults show that the noise is probably not strong enough to induce significant stress. However,
as we have mentioned, a noise of higher dB was not adopted since it is harmful for auditory
sense.
4.6 Test on the recordings of the second design of experi-
ments
In this section, we present the performance of stress recognition using physiological signals
and RT acquired in our experiment using visual stressor and in our experiment using auditory
stressor. The approach of stress recognition by using physiological signals and RT respectively
as well as the approach of decision fusion are discussed.
We discuss the classification accuracies firstly for the experiment of visual stressor and
then for the experiment of auditory stressor. For each experiment, the classification was firstly
performed between Section 1 and Section 3 to see if the period of low stress and the period
of high stress could be well discriminated. Then, the classification was performed between
Section 2 and Section 3 so that we could see if the discrimination still existed between the
period of medium stress and the period of high stress.
4.6.1 The experiment of visual stressor
To begin with, we analyzed the performance of SVM classifier for stress recognition given
one physiological signal or RT recorded in the experiment of visual stressor. Table4.5lists the
classification accuracies when the recognition was performed between the low stress and high
stress levels. The accuracy of HRV for the subject 3 and the accuracy of EDA for the subject 7
were not computed since the ECG signal of the Section 1 for the subject 3 and the EDA signal
of the Section 1 for the subject 7 were not recorded by the BIOPACTM System during the

86 Stress recognition
Table 4.5: Classification accuracies of SVM for low stress vs. high stress (experiment ofvisual stressor)
EDA EMG HRV RT
subject 1 92.8% 92.8% 85.7% 92.8%subject 2 78.5% 100.0% 85.7% 100.0%subject 3 85.7% 78.5% no 78.6%subject 4 85.7% 85.7% 85.7% 100.0%subject 5 85.7% 85.7% 78.5% 100.0%subject 6 100.0% 78.5% 85.7% 71.4%subject 7 no 92.8% 80.0% 78.6%subject 8 100.0% 78.5% 100.0% 92.8%subject 9 92.8% 100.0% 100.0% 100.0%subject 10 100.0% 100.0% 92.8% 71.4%
experiment. Similarly, Table4.6lists the classification accuracies for the recognition between
the medium stress and high stress levels.
Based on the accuracies listed in Table4.5 and Table4.6, we can find that the proposed
SVM classifier is efficient for the stress recognition given physiological signals. For example,
in the case that the SVM classifier was trained with the informative features of the EDA signal,
the classification accuracies for the recognition between the low stress and high stress levels
are more than 85.7% for eight subjects. Meanwhile, we observed that a better performance
is obtained for the discrimination between the period of low stress and the period of high
stress. Besides, when SVM classifier was trained with the means and standard deviation of
RT, the classification accuracies are more than 92.8% for six subjects. However, when the
classification is performed between the period of medium stress and the period of high stress,
the SVM classifier given RT does not brings in the satisfied classification accuracies.
Then, we analyzed the performance of stress recognition using the decision fusion method.
Three fusion patterns, which are the fusion of three physiological signals, the fusion of three
physiological signals and RT and the fusion of EDA signal and RT, were analyzed. The recog-
nition between the low stress and high stress level is firstly discussed. Table4.7 lists the
classification accuracies of three fusion patterns. The accuracy of the fusion of EDA signal
and RT for the subject 7 was not computed since his EDA signal of the Section 1 was not
recorded by the BIOPACTM System in the experiment. We observed that the classification
accuracies for the fusion of three physiological signals are more than 85.7% for all the sub-
jects. Besides, compared with the fusion of three physiological signals, the fusion of three
physiological signals and RT brought in a higher classification accuracy for six subjects and
obtained the same accuracy for other three subjects. Meanwhile, the accuracy of the fusion

4.6 Test on the recordings of the second design of experiments 87
Table 4.6: Classification accuracies of SVM for medium stress vs. high stress (experiment ofvisual stressor)
EDA EMG HRV RT
subject 1 85.3% 79.4% 97.0% 76.5%subject 2 76.5% 97.1% 85.3% 76.5%subject 3 79.4% 97.0% 100.0% 64.7%subject 4 79.4% 82.4% 91.1% 85.3%subject 5 85.3% 100.0% 79.4% 64.7%subject 6 86.6% 83.3% 83.3% 80.0%subject 7 91.2% 91.2% 85.7% 58.8%subject 8 94.7% 89.5% 100.0% 71.1%subject 9 71.1% 76.3% 97.3% 68.4%subject 10 100.0% 94.1% 97.1% 52.9%
of EDA signal and RT was compared with the case where only the EDAsignal was used for
recognition (see Table4.5). The fusion of RT brought in a higher classification accuracy for
four subjects and obtained the same accuracy for two subjects.
Similarly, the recognition between the medium stress and high stress level using the deci-
sion fusion was discussed as well. Table4.8 lists the classification accuracies of three fusion
patterns. For the fusion of three physiological signals, the classification accuracies are more
than 83.3% for all the subjects. Besides, compared with the fusion of three physiological
signals, the fusion of three physiological signals and RT brought in a higher classification
accuracy for one subject and the accuracies are identical for the other subjects. When compar-
ing the fusion of EDA signal and RT with the case where only the EDA signal was used for
recognition (see Table4.6), we observed that the fusion of RT brings in a higher classification
accuracy for three subjects.
4.6.2 The experiment of auditory stressor
At first, we analyzed the performance of SVM classifier given one physiological signal or RT
recorded in the experiment of auditory stressor. Table4.9 lists the classification accuracies
when the recognition was performed between the low stress and high stress levels. The ac-
curacy of HRV for the subject 10 was not computed since her ECG signal recorded by the
BIOPACTM System was severely contaminated by the noise and thus typical QRS complex
could not be observed and located. Similarly, Table4.10lists the classification accuracies for
the recognition between the medium stress and high stress levels.
As can be seen, the accuracies of the SVM classification given physiological signals listed
in Table4.9 and Table4.10 are generally not bad. For example, in the case that the SVM

88 Stress recognition
Table 4.7: Classification accuracies of decision fusion for low stress vs. high stress (experi-ment of visual stressor)
3 Phy. Signals RT & 3 Phy. Signals RT & EDA
subject 1 85.7% 100.0% 92.8%subject 2 92.8% 100.0% 92.8%subject 3 85.7% 85.7% 85.7%subject 4 85.7% 92.8% 100.0%subject 5 85.7% 92.8% 92.8%subject 6 85.7% 85.7% 85.7%subject 7 90.0% 90.0% nosubject 8 92.8% 100.0% 92.8%subject 9 92.8% 100.0% 100.0%subject 10 100.0% 92.8% 85.7%
Table 4.8: Classification accuracies of decision fusion for medium stress vs. high stress (ex-periment of visual stressor)
3 Phy. Signals RT & 3 Phy. Signals RT & EDA
subject 1 88.2% 88.2% 85.3%subject 2 88.2% 88.2% 85.3%subject 3 94.1% 94.1% 76.5%subject 4 88.2% 91.2% 85.3%subject 5 91.2% 91.2% 79.4%subject 6 83.3% 83.3% 83.3%subject 7 91.2% 91.2% 85.3%subject 8 94.7% 94.7% 89.4%subject 9 89.5% 89.5% 73.7%subject 10 94.1% 94.1% 82.3%

4.6 Test on the recordings of the second design of experiments 89
Table 4.9: Classification accuracies of SVM for low stress vs. high stress (experiment ofauditory stressor)
EDA EMG HRV RT
subject 1 85.7% 85.7% 92.8% 100.0%subject 2 85.7% 100.0% 83.3% 78.5%subject 3 100.0% 92.8% 85.7% 78.5%subject 4 85.7% 71.4% 78.5% 92.8%subject 5 64.2% 78.5% 100.0% 78.5%subject 6 78.5% 78.5% 78.5% 78.5%subject 7 71.4% 100.0% 85.7% 100.0%subject 8 64.3% 71.4% 92.8% 85.7%subject 9 71.4% 100.0% 90.0% 78.5%subject 10 90.0% 80.0% no 90.0%subject 11 78.6% 78.6% 64.3% 100.0%subject 12 64.3% 92.8% 92.8% 100.0%
classifier was trained with the informative features of the EMGsignal, the classification accu-
racies for the recognition between the low stress and high stress levels are more than 80.0%
for seven subjects. The accuracies of the SVM classification given RT are more than 90.0%
for six subjects when the recognition is performed between low stress and high stress levels
and are more than 85.7% for six subjects between medium stress and high stress levels. This
shows that RT is an efficient source for stress recognition when the stress is elicited by acoustic
induction.
Then, we analyzed the performance of stress recognition using the decision fusion method.
The same three fusion patterns mentioned in the discussion of the experiment of visual stressor
were analyzed. We firstly discussed the recognition between the low stress and high stress
level. Table4.11lists the classification accuracies of three fusion patterns.We observed that
the classification accuracies for the fusion of three physiological signals are more than 78.5%
for all the subjects. Besides, compared with the fusion of three physiological signals, the
fusion of three physiological signals and RT brought in a higher classification accuracy for
seven subjects and the accuracies are identical for the other subjects. Then, the accuracies of
the fusion of EDA signal and RT were compared with the case where only the EDA signal was
used for recognition (see Table4.9). We observed that the fusion of RT brought in a higher
classification accuracy for nine subjects and obtained the same accuracy for two subjects.
Similarly, the recognition between the medium stress and high stress level using the deci-
sion fusion was discussed as well. Table4.12listed the classification accuracies of three fusion
patterns. For the fusion of three physiological signals, except for the subject 6 (classification
accuracy of 71.4%), the classification accuracies are more than 78.5%. Besides, compared

90 Stress recognition
Table 4.10: Classification accuracies of SVM for medium stressvs. high stress (experimentof auditory stressor)
EDA EMG HRV RT
subject 1 85.7% 71.4% 78.5% 85.7%subject 2 71.4% 100.0% 100.0% 78.5%subject 3 100.0% 92.8% 85.7% 71.4%subject 4 85.7% 100.0% 85.7% 92.8%subject 5 78.5% 92.8% 78.5% 71.4%subject 6 71.4% 78.5% 57.1% 64.3%subject 7 57.0% 100.0% 90.0% 92.8%subject 8 71.4% 71.4% 71.4% 78.5%subject 9 85.7% 85.7% 90.0% 78.5%subject 10 92.8% 78.5% no 85.7%subject 11 57.1% 85.7% 85.7% 100.0%subject 12 57.1% 78.5% 85.7% 92.8%
Table 4.11: Classification accuracies of decision fusion for low stress vs. high stress (experi-ment of auditory stressor)
3 Phy. Signals RT & 3 Phy. Signals RT & EDA
subject 1 92.8% 100.0% 100.0%subject 2 92.8% 92.8% 85.7%subject 3 92.8% 92.8% 92.8%subject 4 85.7% 92.8% 92.8%subject 5 85.7% 85.7% 78.5%subject 6 78.5% 85.7% 85.7%subject 7 85.7% 100.0% 85.7%subject 8 78.5% 92.8% 78.5%subject 9 90.0% 90.0% 80.0%subject 10 90.0% 90.0% 90.0%subject 11 78.5% 85.7% 85.7%subject 12 92.8% 100.0% 85.7%

4.7 Discussion 91
Table 4.12: Classification accuracies of decision fusion for medium stress vs. high stress(experiment of auditory stressor)
3 Phy. Signals RT & 3 Phy. Signals RT & EDA
subject 1 85.7% 92.8% 92.8%subject 2 92.8% 92.8% 78.5%subject 3 92.8% 92.8% 92.8%subject 4 85.7% 92.8% 92.8%subject 5 85.7% 85.7% 71.4%subject 6 71.4% 71.4% 71.4%subject 7 85.7% 92.8% 85.7%subject 8 78.5% 78.5% 78.5%subject 9 90.0% 90.0% 90.0%subject 10 85.7% 85.7% 85.7%subject 11 85.7% 92.8% 78.5%subject 12 85.7% 92.8% 85.7%
with the fusion of three physiological signals, the fusion of three physiological signals and RT
brought in a higher classification accuracy for five subjects and the accuracies are identical for
the other subjects. When comparing the fusion of EDA signal and RT with the case where
only the EDA signal was used for recognition (see Table4.10), we observed that the fusion of
RT brought in a higher classification accuracy for eight subjects.
4.7 Discussion
Based on the results presented in section4.6, we found that the proposed SVM classifier
achieved encouraging classification accuracies. Not only the physiological signals, but also
the RT was found to be efficient to recognize the stress state of an individual. Therefore,
we can say that the stress recognition from heterogeneous data is feasible. Moreover, we
know that to record the physiological signals, the subject have to be in physical contact with
the electrodes of the biosensors. This can lead to several issues. Firstly, the subjects may
feel uncomfortable when they are attached with the electrodes of the sensors. Secondly, the
recording by the electrodes are normally subject to motion artifacts, which were also observed
in our recorded signals. However, recording RT is noninvasive since the subject does not
need to be in physical contact with the adhesive electrodes. This noninvasive recording is
quite beneficial for the practical Human–computer interaction (HCI) application. Based on
these facts, we think that, for the stress recognition system, it is quite meaningful to adopt the
subject’s RT for recognition.

92 Stress recognition
Compared with the recognition given one physiological signalor RT, the recognition per-
formance can be improved by the approach of decision fusion. We found that the fusion of
three physiological signals led to better recognition performance than only one of them was
adopted as the input for recognition. Moreover, when we fused the three physiological sig-
nals with RT for recognition, a further improvement of classification accuracies was observed.
Thus, we think that to ensure good recognition performance, it is beneficial to fuse the data
from heterogeneous sources. Besides, as we have mentioned, we considered the situation
where the EDA signal is the only available physiological source that could be used. By ana-
lyzing the case that recognition was performed by the fusion of the EDA signal and RT, we
observed that classification accuracies in this case are still higher than 80.0% for the majority
of the subjects. This shows that when facing the situation that not all three presented phys-
iological signals are available to be acquired, the proposed approach of decision fusion can
bring in satisfied recognition performance as well.
In this study, the decision fusion was realized by the voting method. Since the principle
of voting is not complicated, it does not require huge computation costs in the processing
stage. Considering that the practical recognition system is normally equipped with limited
computation sources, this is an advantage when the recognition processing is implemented
and performed on-board the system.
We designed two experiments which used different tasks to elicit the stress of an indi-
vidual. In both two experiments, we found that compared with the recognition between the
medium stress and high stress levels, a generally better recognition performance can be ob-
served when the recognition is performed between the low stress and high stress levels. For
the recognition given RT, in the experiment of auditory stressor, for most of the subjects, a
good recognition performance was achieved for the recognition either between the low stress
and high stress level or between the medium stress and high stress level. In the experiment of
visual stressor, RT is also efficient for the recognition between the low stress and high stress
levels. These results also showed that RT brings in better recognition performance when the
stress is elicited by the auditory stressor. However, for the discrimination between the period
of medium stress and the period of high stress, the SVM classifier given only RT inputs does
not bring in satisfied classification accuracies. This unsatisfied recognition performance can
be highly improved once RT is fused with the physiological signals. This reinforces the belief
that the recognition with the strategy of decision fusion can contribute to a better recognition
performance.

4.8 Summary 93
4.8 Summary
In this chapter, we discussed the feasibility of stress recognition from heterogeneous data.
Not only physiological signals (ECG, EMG and EDA), but also reaction time is adopted to
recognize different stress states. The approaches of stress recognition given physiological
signals and RT was presented.
Then, we tested the proposed approach of stress recognition given physiological signals
on the published stress data set. The data set contains physiological signals like the EDA
signal related to a driver’s different levels of stress. The results of test showed that for the
discrimination between the period of low stress and the period of high stress, the classification
accuracies of the proposed approach were more than 88.5% for all ten drives. Especially for
four drives, the classification accuracies reached to 100%. These encouraging classification
accuracies showed that a good performance to recognize the stress levels of the subjects can
be achieved by our proposed recognition approach.
Besides, the tests were also performed on the physiological signals and RT acquired in our
two designs of experiments. For our first design of experiment, a good recognition perfor-
mance was not achieved. The results showed that the noise is probably not strong enough to
induce significant stress. For our second design of experiments, by analyzing the classifica-
tion accuracies, we found that a generally good recognition performance was obtained by the
proposed SVM classifier given physiological signals and RT in the experiment using visual
stressor and in our experiment using auditory stressor.
Besides, we proposed the approach of decision fusion for stress recognition using three
physiological signals as well as RT. The decision fusion was achieved by fusing the classifica-
tion results of the physiological signals and RT. We found that the approach of decision fusion
can further improve the recognition performance. The results of our research reinforce the
belief that it is feasible to adopt the data from heterogeneous sources for stress recognition.


Chapter 5
Implementation of the signal processing
In the previous chapters, we have presented the approach of stress recognition based on a
Support Vector Machine (SVM) classifier. As we have mentioned, Psypocket project is aimed
at making a portable system able to analyze accurately the stress state of an individual from
heterogeneous data. Thus, the complete signal processing of the stress recognition has to be
implemented on-board the embedded system.
In this chapter, we discuss the feasibility of embedded system which would realize the
complete processing of recognition. We propose two approaches of implementation: An-
droid OS (operating system) based mobile device and FPGA (field-programmable gate array).
Android is an open-source Linux-based operating system for mobile devices developed by
Google. It is widely used on the mobile devices such as smartphones and tablet computers.
The developers of Android write the applications ("apps") that extend the functionality of the
mobile devices and the apps can be downloaded from Google Play which is the app store run
by Google. Nowadays, due to its high speed of development, it is possible to conduct the com-
plicated computation task on the mobile devices with Android OS. FPGA is a programmable
logic component which is designed to be configured by a designer after manufacturing. It is
commonly used by the electronic engineer in applications like digital signal processing and
medical imaging. FPGA contains a matrix of reprogrammable logic blocks. The logic blocks
are linked to each other by an interconnection network and can be controlled to be config-
ured so that the FPGA can perform complex combinational functions [87]. The user of FPGA
should have good knowledge of electronic circuit to verify correct setup time and hold time of
the logic blocks in his design. Generally, a hardware description language (HDL) is used for
the FPGA configuration.
The signal processing of the stress recognition is illustrated in Figure5.1. EMG is pre-
processed for filtering. The heart rate is computed from the ECG signal. The processing of
classification is composed of feature extraction, SVM classification and decision fusion. The

96 Implementation of the signal processing
Figure 5.1: Block diagram of the stress recognition.
ECG based Heart Rate (HR) computation and processing of classification are the two impor-
tant blocks for recognition processing. Their involved computations are the most complicated,
so their on-board computation performances like computation time should be well analyzed.
Thus, in the following paragraphs, we discuss the implementation feasibility of these two
blocks in Android OS based mobile device and FPGA. Besides, since the decision fusion is
achieved by the voting method which is quite simple to be implemented (using a counter), the
discussion of the processing of classification is mainly focused on the feature extraction and
SVM classification.
5.1 Implementation on Android OS based mobile device
5.1.1 ECG based HR computation
We adopt the Pan-Tompkins real time QRS detection algorithm [93] for the HR computa-
tion based on the ECG signal. The complete process is composed of cascaded low-pass and
high-pass filtering with integer filters, following with the differentiation, squaring, and time
averaging of the ECG signal. In some ECG analysis systems, this algorithm has been used
and implemented on Android platform for the HR computation.
Patel et al. [98] proposed a system for the arrhythmia detection using the ECG signal on
the Android Platform. The proposed system was made up of 3 parts: Sensor part, Mobile part
and Server part. In the Sensor part, a three-lead ECG sensor was used to record the ECG signal
of the patients. Recorded data was transferred to the mobile phone wirelessly via Bluetooth.
The ECG signal processing was realized in the Mobile part. For the Arrhythmia detection, the
Pan-Tompkins algorithm was implemented to measure different physical parameters such as
R Peak, RR Interval and QRS complex from the ECG signal. Server part used FTP to transmit
the ECG records to server. At server, the records of all the patients were stored and can be
sent to the doctors either through SMS or MMS or Email.

5.1 Implementation on Android OS based mobile device 97
Oster Julien et al. [92] presented an open source Java-based Android application offering
advanced Electrocardiogram (ECG) processing techniques aimed at screening Atrial Fibrilla-
tion (AF). The application was developed on the Android 4.2 platform in Java. A wireless
ECG recording device [23] was used to record the two-lead ECG signal at a sampling fre-
quency of 256 Hz. The phone was connected with the ECG recording device via Bluetooth
and the signal processing was performed on the phone. To detect the AF, firstly, a R-peak
detector, based on Pan-Tompkins algorithm, was applied to compute the HR. Then an AF de-
tection algorithm, based on HR regularity was applied. The peaks detection was evaluated on
the MIT-BIH arrhythmia database with a positive predictive accuracy of 98.7%.
P.N. Gawale et al. [44] proposed an Android application for ambulant ECG monitoring.
The application can basically be divided into three modules: Bluetooth communication, data
processing, and File Transfer Protocol (FTP). The three-lead ECG data were acquired by an
ECG acquisition device and were then sent to the mobile phone via Bluetooth communica-
tion. The application calculated heart rate and plotted it on the phone. It also sent the text
file of ECG data to a FTP server. To compute the heart rate, the Pan-Tompkins algorithm
was implemented, which used filtering, differentiation, signal squaring and time averaging to
detect the QRS complexes of the ECG signal. The application was tested in real-time by col-
lecting the ECG from the patient in stationary and moving conditions and showed a good HR
computation efficiency.
Based on the results of these researches, we can see that the Pan-Tompkins algorithm
can be implemented on Android OS. By processing the ECG signal, the implemented Pan-
Tompkins algorithm can detect the QRS complex and then measure the R-R interval time, so
that the HR is determined. Therefore, the ECG based HR computation can be realized on
Android based smartphone and then the HR data can be used to generate informative features
for the classification.
Meanwhile, we should notice that the developers have to write their own codes to im-
plement in Java the mathematical functions of the algorithm (e.g. filtering). Some existing
mathematical libraries, for example the Apache Commons Mathematics Library, can be used.
However, these libraries cannot provide all the desired mathematical functions.
5.1.2 Processing of classification
5.1.2.1 Feature extraction
For the classification, the raw time-series physiological signals should be transformed into
features. The physiological signals are commonly segmented into the windows with the pre-
defined size and the features are generated from these windows. For our recognition system,

98 Implementation of the signal processing
we used statistical features, such as mean value, standard deviation and absolute differences.
These features are commonly used as the informative features for recognition.
In [46, 69, 70, 117], we can see that the mean value and standard deviation were used as
the informative features for human activity recognition on Android OS based smartphones.
During the recognition process, they were computed on the smartphones. In [70], the abso-
lute difference was also adopted and implemented as the informative features for recognition.
Therefore, we can find that the informative features that we adopted can be implemented on
the Android based mobile devices.
5.1.2.2 SVM classification
We adopted Support Vector Machines (SVM) to classify different stress levels based on the
informative features derived from the physiological signals. SVM is widely used as the super-
vised classification algorithm in pattern recognition. J. Frank et al. [42] presented a human
physical activity and gait recognition system running on Android based smartphone. The sys-
tem can identify the activity that the participant is performing. The gait recognition learnt the
participant’s style of walking, and the phone can be trained to recognize the participant by
his gait. SVM was used as the classifier for recognition. Unfortunately, the article did not
include recognition rates: thus, the evaluation of the system is difficult. However, the software
is open-source and the smartphone application is available from Android Market. M. Alzantot
and al. [10] presented a system for ubiquitous pedestrian tracking whichwas implemented on
Android-based smartphones. Based on the step size, the user’s gait can be classified into one
of three different types: walking, jogging, or running. A multi-class SVM was used as the
classifier and the system achieved an accuracy of 97.74%.
In [110], M. Rossi and al. presented a real-time ambient sound recognition system running
on an Android smartphone. The sound was acquired from a smartphone’s microphone with a
sampling frequency of 16kHz at 16bit. 24 frequency features were extracted from the sound
every second by using FFT algorithm and were normalized to be within [0,1] as the input
of the classifier. SVM with a Gaussian kernel was used to classify the ambient sound into 23
classes using one-against-one strategy. The system can work in two modes: autonomous mode
and server mode. In autonomous mode, the whole signal processing was performed on the
smartphone. In server mode, the sound capturing and feature extraction were performed on the
smartphone. Then the features were sent to a server by Wi-Fi or 3G. The SVM classification
was done in the server and finally the result of classification was sent back and displayed on the
phone. The system was implemented as an Android application in Java SE 7. The recognition
accuracy was evaluated by a six-fold cross-validation method and the accuracy reached to
58.45% for both modes. However, the hardware performance of SVM model training like its

5.2 Implementation in FPGA 99
processing time was not presented and evaluated in this article.
N. K. Verma and al. [122] presented an Android application to recognize the fault state of
an industrial air compressor in real time by distinguishing its acoustic pattern. The acoustic
pattern recognition was performed on the registered acoustic data. These data were firstly
processed to extract the features such as absolute mean, root mean square, variance and DSP.
Then the feature selection was applied and a set of 23 features were selected by Principal
Component Analysis (PCA) algorithm as the inputs of the classifier. SVM was used to clas-
sify the data into 3 classes. The application was implemented on Android OS v2.3. All the
evaluation experiments were performed on a smartphone with 830MHz ARMv6 processor and
290MB RAM. Using 5 fold cross-validation, the application achieved an average accuracy of
93.73 %. The authors declared that this result was identical to the cross validation accuracy
on MATLAB. Besides, the processing time for model training was evaluated. For each class,
500 audio samples were used to train the classifier. It took 471s to process the PCA feature
selection. SVM was implemented using the LIBSVM library [27] in its java version and was
trained to find the best cost and gamma parameters by cross-validation method. The two SVM
parameters were searched in the range between -4 and +4. The processing time for this search
was 10851s. We can find that the processing time for SVM training is quite long.
As can be seen, the smartphone is burdened when the training phase of SVM is performed
on the phone, especially for a smartphone with low processing capability. An alternative
option will be performing the training phase in the server. For this purpose, the informative
features are sent to the server. In the server, the SVM classification model is trained and the
trained model is sent back to be stored on the phone for the further real time recognition. In this
case, the burden of the smartphone for SVM training can be released. However, our Psypocket
system is aimed at performing the complete recognition processing on-board, which including
the SVM model training. Thus, considering the SVM classification is the most important
block of the recognition processing and its training phase should also be implemented and
performed on-board the system, the Android OS based mobile device is not the most suitable
embedded system to realize the complete recognition processing.
5.2 Implementation in FPGA
5.2.1 ECG based HR computation
The QRS complex is the most significant segment in the ECG signal. By detecting its position,
we can compute the HR of a human. In the literature, the Pan-Tompkins algorithm [93] is the
most widely used algorithm to detect the QRS complex from the ECG signal. However, this

100 Implementation of the signal processing
algorithm was commonly implemented in the software (e.g. Matlab) on the personal computer.
Pavlatos et al. [99] presented a hardware implementation of the Pan-Tompkins QRSdetec-
tion algorithm. The ECG signal is firstly pre-processed. The pre-processing is composed of
low-pass and high-pass filtering, the differentiation, squaring, and time integration. Then the
stage of decision making takes place to locate the QRS complex. The architecture of the im-
plementation is composed of one control unit, six computation modules and one memory unit.
The control unit generates the control signals. Five computation modules are responsible for
the different stages of pre-processing and the last one is responsible for the stage of decision
making. A computation module works with the following sequence: read the data from the
memory, perform the computations and send back the computed values to the memory. The
implementation is described in Verilog HDL (Hardware Design Language) and is tested on a
Xilinx FPGA board using the European ST-T database. Similarly, in [64], the Pan-Tompkins
algorithm is embedded in the FPGA-Based embedded system for the QRS complex detection
as a processing stage of the automated ECG analysis system. In [14], the authors proposed an
FPGA-based cardiac arrhythmia recognition system for the wearable cardiac monitoring. The
system adopts Pan-Tompkins algorithm to extract the QRS complex from the ECG signal for
further processing and is implemented on a Xilinx FPGA board.
Stojanovic et al. [119] presented a FPGA system for QRS complex detection based on in-
teger wavelet transform. In their research, Haar wavelet is adopted for the wavelet transform.
Even though the Haar wavelet is the simplest wavelet, it is still complicated for FPGA imple-
mentation since it involves floating point computation. To overcome this limitation, an Integer
Haar Transform (IHT) is proposed where the coefficient of the wavelet expression becomes
integer. In this way, the approximation decomposition is calculated by an adder and shifter and
the detail decomposition by a subtractor, so that the floating point multipliers are excluded.
Based on this transform, the ECG signal is firstly processed with the wavelet decomposition
scheme up to the 4th level, since the authors consider that most energies of a typical QRS
complex are at scales of 3th and 4th level. Then the processing of zero crossing and modulus
thresholding are applied to detect the QRS complex. The system is implemented in FPGA
Cyclone EP1C12Q240 chip and is described in VHDL (Very High Speed Integrated Circuit
Hardware Description Language). Its on-chip QRS detection performance is encouraging
since a detection accuracy of about 95% is obtained. In the terms of hardware performance,
around 11% silicon resources of the Cyclone chip is occupied for QRS detection. Similarly, in
[67], the authors presented an FPGA based telemonitoring system to detect cardiac Arrhyth-
mia for high risk cardiac patients. The system adopts Integer Wavelet Decomposition to detect
the QRS complex from the ECG signal for further processing.
Therefore, we can see that, by applying the suitable strategy, we can compute the HR based

5.2 Implementation in FPGA 101
on the ECG signal in FPGA with high accuracy.
5.2.2 Processing of classification
5.2.2.1 Feature extraction
The computations of feature extraction require arithmetic operations such as addition, sub-
traction, multiplication, division and square root. The addition and subtraction can be easily
implemented in FPGA. However, for the other operations, e.g. division, their implementa-
tions are more difficult because they are computationally slow and area-consuming. Fortu-
nately, since nowadays FPGA are frequently used for complex on-chip data processing, the
researchers have proposed fast and area efficient implementation of the arithmetic operations
like division and square root in FPGA.
In [18], Beuchat et al. presented small multiplier-based integer multiplication and division
operators for Virtex-II FPGAs. The operators were designed based on small 18× 18 bits
multiplier blocks and configurable logic blocks (CLBs) available in Virtex-II FPGAs. The
trade-offs such as computation decomposition and radix were explored. Their operators lead
to an up to 18% speed improvement for multiplication and 40% for division compared with
the standard CLBs based solutions. In [72], Lee et al. presented the design of the fixed-point
integer multiplication, squaring and division units. The units were targeted at Virtex-II FPGAs
and were based on small 18×18 bits multiplier blocks. By exploiting the low level primitives,
the area and delay reductions were achieved for multiplication, squaring and division. In [15],
Aslan et al. presented the fixed iteration division, square root and inverse square root analysis
and design in FPGA. They implemented an unified division, square root and inverse square
root block to realize the QR factorization. By adopting this unified architecture, the area and
power requirements for QR factorization were reduced and the overall speed was improved.
Thus, we can find that all the operations required for feature extraction can be implemented
in FPGA with the speed and area efficiency requirements.
5.2.2.2 SVM classification
In [59], Irick et al. presented a hardware efficient Gaussian Radial Basis SVM architecture
for FPGA. The implementation was adopted for gender classification from grayscale frontal
face images and achieved 88.6% detection accuracy. This accuracy was to the same degree
of accuracy of software implementations using the same classification mechanism. In [80],
Manikandan et al. proposed a FPGA implementation of multi-class SVM classification for
isolated digit recognition. The implementation achieved 100% recognition accuracy for the
speaker dependent TI46 database. In [96], a scalable FPGA architecture was proposed for

102 Implementation of the signal processing
SVM classification. The implementation results showed that compared to the CPU implemen-
tation, the proposed architecture can present a speed-up factor up to 2-3 orders of magnitude
of classification. Thus, we can see that the FPGA implementation of SVM can achieve good
classification performance. Compared with the software implementation, a speed-up of clas-
sification can be achieved and its classification accuracy is not decreased.
Meanwhile, as we have mentioned, the hardware performance of SVM training phase
should be taken into consideration as well. In [12], Anguita et al. proposed a FPGA-based
implementation for SVM learning. The learning phase is composed of two parts: a recurrent
network which was exploited for finding the parameters of the SVM and a bisection process
which was exploited for computing the threshold. The implementation was tested on a chan-
nel equalization problem where the sonar dataset was adopted for SVM learning. The sonar
data set is composed of 208 samples of 60 features each, and was subdivided in 104 training
patterns and 104 test patterns. A Xilinx Virtex–II FPGA was used as the target device and
the testing results showed that with a clock frequency of 21.06 MHz, each learning phase
terminates after 140 000 cycles. The authors also verified that after 90 000 clock cycles, the
obtained performances were quite stable around the value obtained at the termination of the
learning. In [95], Papadonikolakis et al. proposed a scalable FPGA architecture for the SVM
training based on Gilbert’s Algorithm. Their FPGA implementation results showed that a
speed-up factor up to three orders of magnitude of training was achieved compared to the al-
gorithm’s software implementation. Thus, we can find that FPGA implementation can achieve
good hardware performance of SVM training. Compared with the software implementation,
the SVM training can be further accelerated.
5.3 Discussion of the feasibility of implementation
In the two previous sections, we have discussed the feasibility of two approaches of imple-
mentation: Android OS based mobile device and FPGA. The ECG based HR computation and
feature extraction can be realized either on Android based mobile device or in FPGA. How-
ever, the Android smartphone is burdened when the training phase of SVM is performed on
the phone. The processing time for SVM training is quite long, especially for the smartphone
with low processing capability.
An alternative option will be performing the training phase in the server. For this purpose,
the informative features are sent to the server. In the server, the SVM classification model is
trained and the trained model will be sent back to be stored on the phone for the further real
time recognition. In this case, the burden of the smartphone for SVM training can be released.
However, our Psypocket system is aimed at performing the complete recognition processing

5.4 Implementation of QRS complex detection 103
on-board, which including the SVM model training.
FPGA implementation can achieve good hardware performance of SVM classification.
Compared with the software implementation on the personal computer, the SVM classifica-
tion phase can be further accelerated and its classification accuracy is not decreased. Mean-
while, FPGA implementation can present a good hardware performance of SVM training. A
speed-up of training phase can be also achieved compared with the software implementation.
Therefore, compared with the Android OS based mobile device, we should choose the FPGA
as the embedded system to realize the complete recognition processing.
5.4 Implementation of QRS complex detection
By discussing the feasibility of implementation, we find that FPGA is the most suitable em-
bedded system to realize the complete signal processing of the stress recognition. Since the
previously mentionned researches [59, 80, 96] have shown that the SVM classifier can be well
implemented in FPGA, we can adopt the approaches proposed in their researches to imple-
ment the SVM in FPGA for the classification of the stress levels. However, we found that
there are few articles about implementing the ECG based HR computation in FPGA. Thus,
we focused on the implementation of the ECG based HR computation block in FPGA. We
know that the QRS complex is the most significant segment in the ECG signal. By detecting
its position, we can compute the HR of a human. Thus, in this section, we discuss the FPGA
implementation of the ECG based QRS complex detection and present our implementation
strategy.
5.4.1 The existing FPGA-based algorithms for QRS complex detection
In subsection5.2.1, the existing FPGA-based algorithms for QRS complex detection in the
literature have been introduced. In [99], Pavlatos et al. presented a hardware implementation
of the Pan-Tompkins QRS detection algorithm. However, it can be found that the design of the
proposed approach is quite complex. This is because the Pan-Tompkins algorithm employs
complex filtering calculations and complex state-machine blocks.
In [119], Stojanovic et al. presented a FPGA system for QRS complex detection based on
integer wavelet transform. We found that compared with [99], the approach of ECG signal
fil tering proposed in [119] consumes less silicon resources and its design is less complex. The
integer nature of IHT avoid the floating point computation in FPGA. Besides, as presented in
[119], even though the Haar wavelet is the simplest wavelet, a greatimmunity to the noise and
motion artifacts in the ECG signal can be achieved.
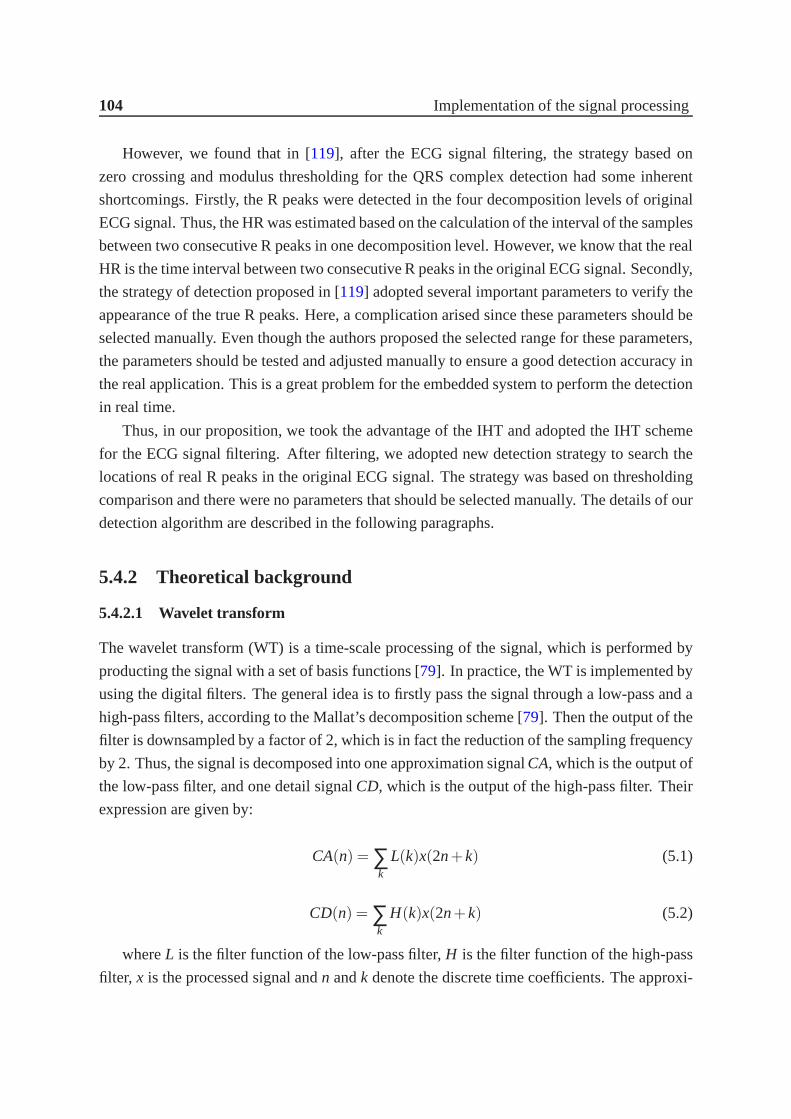
104 Implementation of the signal processing
However, we found that in [119], after the ECG signal filtering, the strategy based on
zero crossing and modulus thresholding for the QRS complex detection had some inherent
shortcomings. Firstly, the R peaks were detected in the four decomposition levels of original
ECG signal. Thus, the HR was estimated based on the calculation of the interval of the samples
between two consecutive R peaks in one decomposition level. However, we know that the real
HR is the time interval between two consecutive R peaks in the original ECG signal. Secondly,
the strategy of detection proposed in [119] adopted several important parameters to verify the
appearance of the true R peaks. Here, a complication arised since these parameters should be
selected manually. Even though the authors proposed the selected range for these parameters,
the parameters should be tested and adjusted manually to ensure a good detection accuracy in
the real application. This is a great problem for the embedded system to perform the detection
in real time.
Thus, in our proposition, we took the advantage of the IHT and adopted the IHT scheme
for the ECG signal filtering. After filtering, we adopted new detection strategy to search the
locations of real R peaks in the original ECG signal. The strategy was based on thresholding
comparison and there were no parameters that should be selected manually. The details of our
detection algorithm are described in the following paragraphs.
5.4.2 Theoretical background
5.4.2.1 Wavelet transform
The wavelet transform (WT) is a time-scale processing of the signal, which is performed by
producting the signal with a set of basis functions [79]. In practice, the WT is implemented by
using the digital filters. The general idea is to firstly pass the signal through a low-pass and a
high-pass filters, according to the Mallat’s decomposition scheme [79]. Then the output of the
fil ter is downsampled by a factor of 2, which is in fact the reduction of the sampling frequency
by 2. Thus, the signal is decomposed into one approximation signalCA, which is the output of
the low-pass filter, and one detail signalCD, which is the output of the high-pass filter. Their
expression are given by:
CA(n) = ∑k
L(k)x(2n+k) (5.1)
CD(n) = ∑k
H(k)x(2n+k) (5.2)
whereL is the filter function of the low-pass filter,H is the filter function of the high-pass
filter, x is the processed signal andn andk denote the discrete time coefficients. The approxi-

5.4 Implementation of QRS complex detection 105
mation signalCA can be further decomposed into a detail signal and an approximation signal
by passingCA through the same two filters and downsampling. By repeating this procedure,
the signalx can be decomposed into a number of detail signals and an approximation signal.
5.4.2.2 Integer Haar Transform
The Haar wavelet is the simplest wavelet. TheCAandCD of the Haar transform is given by:
CA(n) =1√2
x(2n)+1√2
x(2n+1) (5.3)
CD(n) =1√2
x(2n)− 1√2
x(2n+1) (5.4)
In [119], the authors discussed the advantages of Haar transform compared with other
wavelet transform. In terms of the implementation, its advantages are less computation load
and memory efficiency, since its computation does not need to involve the temporary array.
However, even though the Haar transform is quite simple in principle, it is still complicated
for hardware implementation. This is because its computations involve in the floating point
calculations.
To avoid the floating point calculations, we adopted the IHT. TheCA andCD of IHT is
given by [25]:
CA(n) = ⌊12
x(2n)+12
x(2n+1)⌋ (5.5)
CD(n) = x(2n)−x(2n+1) (5.6)
where⌊⌋denotes rounding operation.
We know that in the digital logic, for a binary number, the operation of the division with
2 and rounding in equation (5.5) can be easily implemented by right shifting for one position.
Thus, in the term of hardware implementation, theCA is computed by an adder and shifter and
theCD is computed by a subtractor. As can be seen, due to its integer nature, the IHT avoids
the floating point calculations and thus can be easily implemented in the digital logic system
like the FPGA.
5.4.3 Proposed FPGA-based algorithm for the QRS complex detection
The simplified architecture of our proposed QRS complex detection algorithm is illustrated in
Figure5.2.

106 Implementation of the signal processing
Figure 5.2: Simplified architecture of the proposed QRS detection algorithm. x(n) is theoriginal ECG record. Pos_QRS is the location of QRS fiducial in the detail signal CD4(n) andPos_R_peak is the location of real R peak in x(n).
Figure 5.3: Wavelet decomposition scheme.
Firstly, the ECG signal x(n) is decomposed using the IHT. The decomposition of x(n) is
up to 4th level. Figure5.3illustrates the wavelet decomposition scheme.
For ith decomposition level, supposing the input signal of this level is a(n), a(n) is splitted
into one detail signal CDi(n) and one approximation signal CAi(n). Its integer transform form
is known as [112]
CAi(n) = (a(2n)+a(2n+1))>> 1 (5.7)
CDi(n) = a(2n)−a(2n+1) (5.8)
where>> 1 represents the right shifting for one position. We can find that for one IHT
cell, the sampling rate of its output signal is reduced by 2 compared with its input signal.
Therefore, CD4(n) has 1/16 the number of samples of the original ECG record x(n).
Secondly, we find the QRS fiducial points in the detail signal CD4(n). For this purpose,
an adaptive amplitude threshold of 0.5¹ has been used.¹ is the absolute maximum sample
amplitude in the detection window and is successively updated by scanning ECG records.
The detection window registers the latest former ECG records with pre-determined size. In
our case, the length of the detection window is 1600ms. Therefore, in CD4(n), successive
windows of 1600ms are scanned to update¹ by detecting the absolute maxima within the
detection window. The points whose values are higher than 0.5¹ are marked as the QRS
fiducial points. Besides, once the first QRS fiducial point is detected, the QRS fiducial points
appearing in the following 300ms are skipped. Thus, we can avoid detecting more than one
QRS fiducial from the same QRS complex.

5.4 Implementation of QRS complex detection 107
Figure 5.4: QRS detection using wavelet decomposition. x is the original ECG signal.
Thirdly, we find the real R peak location in the original ECG record x(n). For this purpose,
x(n) is scanned at all detected QRS fiducials points. A window of 70ms is applied on either
side of the detected QRS fiducial location to detect the maximum sample amplitude. The
location of this maximum amplitude is marked as the real R peak location.
5.4.4 Matlab simulation
Before the FPGA implementation, the proposed algorithm was firstly tested in Matlab to eval-
uate its detection performance. For this purpose, nine segments of the ECG signal registered
in our experiments were used. The segments were derived from 9 subjects (one segment for
each subject) and the sampling frequency of the ECG signal was 2000Hz. Here we illustrate
the simulation results for a two seconds’ ECG data of one segment. Figure5.4 illustrates the
detail signals of IHT for four levels, and we can find that in the detail signals CD3(n) and
CD4(n), the QRS complex waves are well separated from the P and T waves. Hence, the ab-
solute maximum points detected in CD4(n) belongs to the QRS complex waves rather than P
and T waves. In figure5.5, we illustrate the R peak location result for the three R peaks of this
two seconds’ ECG data. As can be seen, the real R peak locations in the original ECG record
x(n) are well detected by using the proposed detection algorithm.

108Im
plem
entatio
no
fthe
sign
alpro
cessing
ECG Segment IBI (ms)1 2 3 4 5 6 7 8 9 10 11 12 13 14 15
Segment 1 630.0 628.0 630.0 648.0 661.0 661.0 663.0 658.0 638.0 627.0 619.0 609.0 604.0 605.0 609.0Segment 2 625.0 625.0 618.0 616.0 602.0 604.0 588.0 583.0 572.0 576.0 583.0 602.0 626.0 656.0 702.0Segment 3 745.0 740.0 762.0 744.0 713.0 718.0 728.0 706.0 683.0 670.0 659.0 641.0 636.0Segment 4 757.0 825.0 785.0 793.0 852.0 864.0 809.0 784.0 780.0 711.0 701.0 729.0Segment 5 698.0 701.0 723.0 783.0 737.0 781.0 853.0 864.0 782.0 696.0 745.0 786.0Segment 6 788.0 847.0 833.0 739.0 712.0 783.0 795.0 726.0 776.0 788.0 718.0 731.0Segment 7 787.0 748.0 791.0 814.0 758.0 765.0 820.0 799.0 775.0 811.0 794.0 734.0Segment 8 788.0 742.0 749.0 734.0 755.0 750.0 740.0 768.0 752.0 722.0 736.0 763.0Segment 9 701.0 691.0 693.0 705.0 738.0 728.0 710.0 725.0 710.0 685.0 691.0 704.0 703.0
Table
5.1
:IB
Ivalues
com
pu
tedb
yo
ur
pro
po
sedd
etection
algor ith
m.

5.4
Imp
lemen
tation
ofQ
RS
com
plex
detectio
n109
ECG Segment IBI (ms)1 2 3 4 5 6 7 8 9 10 11 12 13 14 15
Segment 1 632.0 628.0 628.0 648.0 660.0 660.0 664.0 656.0 640.0 628.0 616.0 612.0 604.0 604.0 608.0Segment 2 624.0 624.0 620.0 612.0 604.0 604.0 588.0 580.0 572.0 576.0 584.0 600.0 628.0 656.0 700.0Segment 3 748.0 740.0 760.0 744.0 712.0 720.0 728.0 704.0 684.0 672.0 656.0 640.0 636.0Segment 4 756.0 828.0 784.0 792.0 852.0 864.0 808.0 784.0 780.0 712.0 700.0 728.0Segment 5 700.0 700.0 724.0 780.0 736.0 784.0 852.0 864.0 780.0 696.0 744.0 788.0Segment 6 788.0 844.0 836.0 736.0 712.0 784.0 792.0 728.0 776.0 788.0 716.0 732.0Segment 7 788.0 748.0 792.0 812.0 756.0 768.0 820.0 796.0 776.0 812.0 792.0 736.0Segment 8 788.0 744.0 748.0 732.0 756.0 752.0 740.0 764.0 752.0 724.0 736.0 760.0Segment 9 700.0 692.0 692.0 704.0 736.0 728.0 712.0 724.0 712.0 684.0 692.0 704.0 700.0
Table
5.2
:IB
Ivalues
com
pu
tedb
yth
ealg
orith
mp
resented
in[
11
9].

110 Implementation of the signal processing
Figure 5.5: Real R peak location in the original ECG record. x(n) is the original ECG signaland the detected R peak locations are pointed with the vertical red line.
ECG segment Mean deviation (ms)
Segment 1 1.33Segment 2 1.33Segment 3 1.31Segment 4 0.83Segment 5 1.41Segment 6 1.50Segment 7 1.50Segment 8 1.42Segment 9 1.23
Table 5.3: Mean deviations for the computed IBI values.

5.4 Implementation of QRS complex detection 111
5.4.4.1 Comparison between the proposed detection algorithmand the algorithm pro-
posed by Stojanovic
For these nine ECG segments, the QRS complex detection performance of the proposed de-
tection algorithm are compared with the algorithm proposed in [119] by Stojanovic. For this
purpose, we compute the Inter-beat Interval (IBI) of the nine segments where IBI is the time
interval of two consecutive R peaks. Table5.1 and Table5.2 list the consecutive IBI values
of the first ten seconds’ ECG records of each segment computed by our proposed detection
algorithm and by the algorithm presented in [119]. Table5.3 list the mean deviations of the
two computed IBI values. We can find that for the nine segments, the computed IBI values
range from 572ms to 864ms. The deviations of two corresponding IBI values computed by
the two algorithms are within 5ms and the mean deviations are less than 1.5ms. This result
shows that the performance of the proposed detection algorithm is as good as that presented
in [119] in terms of the QRS complex detection.
5.4.4.2 Comparison in terms of rounding
As we have mentioned, the traditional QRS complex detection methods, for example Pan-
Tompkins algorithm [93], were implemented in the software on a personal computer. The
ECG data with floating representation were used for calculation. However, only the number
with integer representation is supported by the FPGA. Thus, we tested in Matlab the QRS
detection performance of our proposed algorithm where the samples of the ECG data were in
integer representation.
Since the ECG data was originally recorded by double-precision decimal, they should
be firstly transferred to integers before the processing of QRS detection. This transform was
realized by firstly multiplying each sample of the ECG data by a factor 10n, wheren= 1,2, . . .,
and then rounding it to an integer. The transform is tested with the multiple factors of 1000,
100 and 10 in Matlab. Then, the ECG data with the integer representation were processed by
our detection algorithm to detect the R peak location of the QRS complex. We computed the
Inter-Beat Interval (IBI) of the ECG data where IBI is the time interval of two consecutive R
peaks.
Table5.4and Table5.5 list the computed consecutive IBI values with the multiple factors
of 1000 and 100 for the first ten seconds’ ECG records of each segment. Since one segment
was derived from one subject and the heart rate of each subject is different, segment 1 and
segment 2 contain fifteen IBI values (sixteen R peaks), segment 3 and segment 9 contain
thirteen IBI values and the other segments contain twelve IBI values.
These IBI values are compared with the initially computed IBI values (without round-

112Im
plem
entatio
no
fthe
sign
alpro
cessing
ECG Segment IBI (ms)1 2 3 4 5 6 7 8 9 10 11 12 13 14 15
Segment 1 630.0 627.5 629.5 648.0 660.5 660.5 662.5 658.0 638.0 627.0 619.0 609.0 604.0 605.0 608.5Segment 2 625.0 624.5 617.5 615.5 601.5 603.5 588.0 583.0 572.0 575.5 583.0 601.5 625.5 656.0 701.5Segment 3 745.0 740.0 762.0 744.0 713.0 718.0 728.0 706.0 683.0 669.5 658.5 641.0 635.5Segment 4 757.0 825.0 784.5 793.0 852.0 864.0 808.5 783.5 780.0 710.5 700.5 729.0Segment 5 697.5 701.0 723.0 782.5 737.0 780.5 852.5 864.0 781.5 696.0 745.0 785.5Segment 6 787.5 846.5 833.0 738.5 711.5 782.5 794.5 725.5 775.5 787.5 717.5 731.0Segment 7 787.0 748.0 791.0 813.5 758.0 765.0 819.5 799.0 774.5 811.0 794.0 733.5Segment 8 787.5 742.0 749.0 734.0 754.5 750.0 740.0 767.5 751.5 722.0 736.0 762.5Segment 9 699.5 691.5 692.5 705.0 737.5 728.0 710.0 725.0 710.0 685.0 691.0 703.5 703.0
Table
5.4
:IB
Ivalues
with
the
mu
ltiple
factors
of1
00
0.

5.4
Imp
lemen
tation
ofQ
RS
com
plex
detectio
n113
ECG Segment IBI (ms)1 2 3 4 5 6 7 8 9 10 11 12 13 14 15
Segment 1 630.0 627.5 629.5 648.5 659.5 661.5 662.0 658.0 638.0 627.0 619.5 608.5 604.5 604.5 608.5Segment 2 625.0 624.5 618.0 615.0 602.0 603.0 588.0 583.0 572.5 575.0 583.0 602.0 625.5 656.0 701.0Segment 3 745.5 740.0 761.5 744.0 713.0 718.5 727.5 706.0 683.0 669.5 658.5 641.0 635.5Segment 4 756.5 825.0 785.0 792.5 852.0 864.0 808.5 784.0 779.5 710.5 700.5 729.0Segment 5 698.0 700.5 723.0 783.0 736.5 780.5 853.0 863.5 781.5 696.0 745.0 785.5Segment 6 787.0 846.5 833.5 738.5 711.5 782.5 794.5 725.5 775.0 788.0 717.5 730.5Segment 7 787.0 748.0 791.5 813.0 758.0 765.5 819.5 799.0 774.0 811.5 793.5 733.5Segment 8 787.5 742.0 749.0 734.0 754.0 750.0 740.5 767.0 751.5 722.0 736.5 762.5Segment 9 700.0 691.0 692.5 705.5 737.5 727.5 710.5 724.5 710.0 685.0 691.0 703.5 703.0
Table
5.5
:IB
Ivalues
with
the
mu
ltiple
factors
of1
00
.
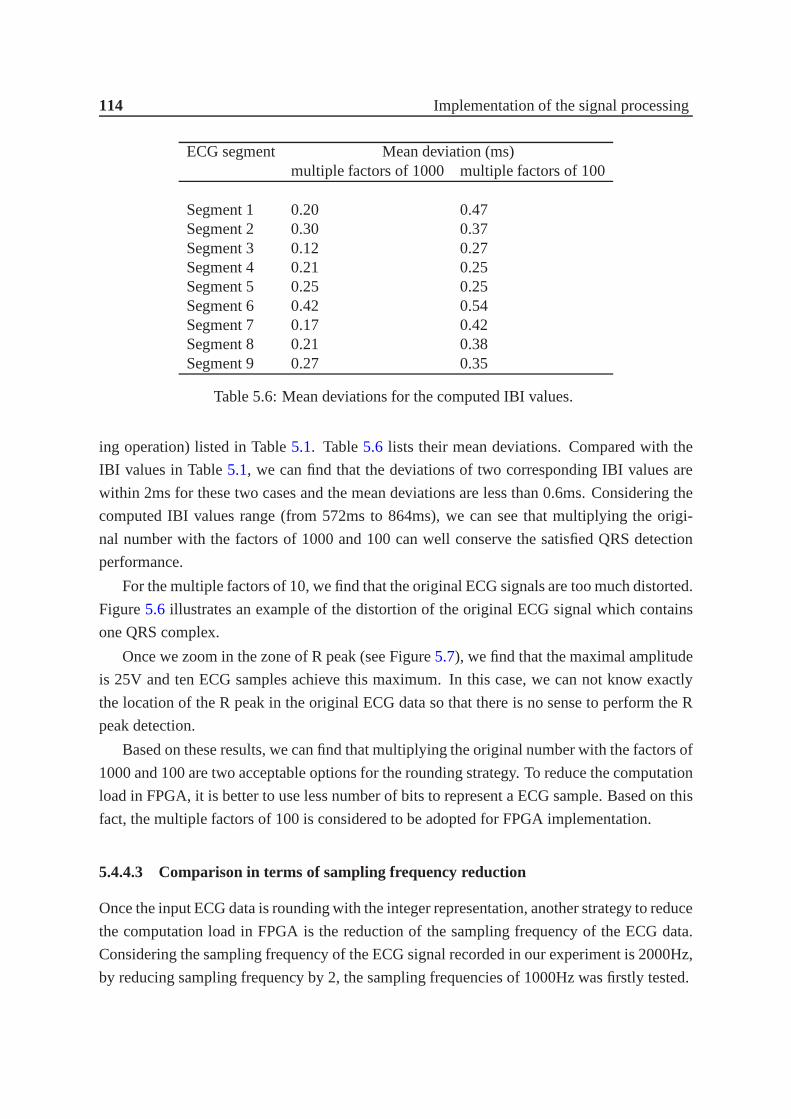
114 Implementation of the signal processing
ECG segment Mean deviation (ms)multiple factors of 1000 multiple factors of 100
Segment 1 0.20 0.47Segment 2 0.30 0.37Segment 3 0.12 0.27Segment 4 0.21 0.25Segment 5 0.25 0.25Segment 6 0.42 0.54Segment 7 0.17 0.42Segment 8 0.21 0.38Segment 9 0.27 0.35
Table 5.6: Mean deviations for the computed IBI values.
ing operation) listed in Table5.1. Table5.6 lists their mean deviations. Compared with the
IBI values in Table5.1, we can find that the deviations of two corresponding IBI valuesare
within 2ms for these two cases and the mean deviations are less than 0.6ms. Considering the
computed IBI values range (from 572ms to 864ms), we can see that multiplying the origi-
nal number with the factors of 1000 and 100 can well conserve the satisfied QRS detection
performance.
For the multiple factors of 10, we find that the original ECG signals are too much distorted.
Figure5.6 illustrates an example of the distortion of the original ECG signal which contains
one QRS complex.
Once we zoom in the zone of R peak (see Figure5.7), we find that the maximal amplitude
is 25V and ten ECG samples achieve this maximum. In this case, we can not know exactly
the location of the R peak in the original ECG data so that there is no sense to perform the R
peak detection.
Based on these results, we can find that multiplying the original number with the factors of
1000 and 100 are two acceptable options for the rounding strategy. To reduce the computation
load in FPGA, it is better to use less number of bits to represent a ECG sample. Based on this
fact, the multiple factors of 100 is considered to be adopted for FPGA implementation.
5.4.4.3 Comparison in terms of sampling frequency reduction
Once the input ECG data is rounding with the integer representation, another strategy to reduce
the computation load in FPGA is the reduction of the sampling frequency of the ECG data.
Considering the sampling frequency of the ECG signal recorded in our experiment is 2000Hz,
by reducing sampling frequency by 2, the sampling frequencies of 1000Hz was firstly tested.

5.4 Implementation of QRS complex detection 115
Figure 5.6: An example of the distortion of the ECG signal with the multiple factors of 10.
Figure 5.7: Zone of R peak.

116Im
plem
entatio
no
fthe
sign
alpro
cessing
ECG Segment IBI (ms)1 2 3 4 5 6 7 8 9 10 11 12 13 14 15
Segment 1 630.0 627.0 630.0 648.0 660.0 661.0 662.0 658.0 638.0 627.0 620.0 608.0 605.0 604.0 609.0Segment 2 625.0 625.0 618.0 615.0 601.0 604.0 588.0 583.0 572.0 575.0 583.0 602.0 625.0 657.0 701.0Segment 3 745.0 740.0 762.0 744.0 713.0 718.0 728.0 706.0 683.0 669.0 659.0 641.0 635.0Segment 4 757.0 825.0 785.0 792.0 852.0 864.0 809.0 784.0 779.0 711.0 700.0 729.0Segment 5 698.0 700.0 723.0 783.0 737.0 780.0 853.0 864.0 781.0 696.0 745.0 786.0Segment 6 787.0 847.0 833.0 739.0 711.0 782.0 795.0 726.0 775.0 787.0 718.0 731.0Segment 7 787.0 748.0 792.0 813.0 758.0 765.0 820.0 799.0 774.0 811.0 794.0 733.0Segment 8 788.0 742.0 749.0 734.0 754.0 750.0 741.0 767.0 751.0 722.0 736.0 763.0Segment 9 700.0 691.0 692.0 705.0 738.0 728.0 710.0 725.0 710.0 685.0 691.0 703.0 703.0
Table
5.7
:IB
Ivalues
with
the
samp
ling
frequ
encies
of1
00
0H
z( Q
RS
fidu
cialpo
ints
detected
inC
D4 (n
)).

5.4 Implementation of QRS complex detection 117
ECG segment Mean deviation (ms)
Segment 1 0.47Segment 2 0.40Segment 3 0.15Segment 4 0.25Segment 5 0.25Segment 6 0.41Segment 7 0.33Segment 8 0.33Segment 9 0.23
Table 5.8: Mean deviations for the computed IBI values with thesampling frequencies of1000Hz (QRS fiducial points detected in CD4(n)).
Table 5.7 lists the computed consecutive IBI values with the sampling frequencies of
1000Hz for the first ten seconds’ ECG records of each segment. These IBI values are com-
pared with the initially computed IBI values listed in Table5.1. Table5.8 lists their mean
deviations. Compared with the IBI values in Table5.1, we can find that the deviations of
two corresponding IBI values are within 2ms for these two cases and the mean deviations are
less than 0.5ms. Considering the computed IBI values range (from 572ms to 864ms), we can
see that reducing the sampling frequencies to 1000Hz can well conserve the satisfied QRS
detection performance.
Then, to verify if the sampling frequency can be further reduced, the same test was done
for the sampling frequencies of 500Hz (reduction of initial sampling frequency by 4). Table
5.9 lists the computed consecutive IBI values for the first ten seconds’ ECG records of each
segment. We find that except the segment 3, some of real R peaks are not detected. The
number of missed R peaks and correct detection accuracy are listed in Table5.10. These test
results show that a satisfied detection performance is not achieved for the sampling frequency
of 500Hz.
To solve this problem, we figure out an alternative for the QRS complex detection. Since
most energies of the QRS complex are at scales of 3th and 4th level of the wavelet decom-
position, the detail signal CD3(n) is also a possible option to locate the QRS fiducial points.
Based on this idea, we slightly modified our detection algorithm (see Figure5.8). The IHT
decomposition of the ECG signal is up to 3th level and the QRS fiducial points are found in
the detail signal CD3(n) instead of CD4(n). We held the sampling frequencies as 500Hz and
tested the detection performance of this modification in Matlab.
Table5.11lists the computed consecutive IBI values for the first ten seconds’ ECG records

118Im
plem
entatio
no
fthe
sign
alpro
cessing
ECG Segment IBI (ms)1 2 3 4 5 6 7 8 9 10 11 12 13
Segment 1 630.0 1256.0 1310.0 1322.0 658.0 638.0 1246.0 610.0 604.0 1212.0Segment 2 626.0 1242.0 616.0 600.0 1192.0 582.0 572.0 576.0 584.0 602.0 1280.0Segment 3 746.0 740.0 762.0 744.0 712.0 718.0 728.0 708.0 682.0 670.0 658.0 640.0 636.0Segment 4 1582.0 784.0 1646.0 864.0 1592.0 780.0 710.0 700.0 730.0Segment 5 700.0 724.0 782.0 738.0 780.0 852.0 864.0 782.0 1140.0 786.0Segment 6 846.0 834.0 738.0 712.0 782.0 796.0 724.0 776.0 1506.0 730.0Segment 7 1540.0 812.0 760.0 764.0 820.0 798.0 774.0 1606.0 734.0Segment 8 1530.0 750.0 734.0 1504.0 740.0 766.0 1474.0 736.0 762.0Segment 9 700.0 690.0 692.0 706.0 736.0 728.0 710.0 1436.0 686.0 690.0 704.0 702.0
Table
5.9
:IB
Ivalu
esw
ithth
esam
plin
gfreq
uen
cieso
f5
00
Hz
(Q
RS
fidu
cialpo
ints
detected
inC
D4 (n
)).

5.4 Implementation of QRS complex detection 119
ECG segment number of missed R peaks correct detection accuracy (%)
Segment 1 5 56Segment 2 4 63Segment 3 0 100Segment 4 3 77Segment 5 2 84Segment 6 2 84Segment 7 3 77Segment 8 3 77Segment 9 1 93
Table 5.10: Number of missed R peaks and correct detection accuracy with the samplingfrequencies of 500Hz (QRS fiducial points detected in CD4(n)).
Figure 5.8: Wavelet decomposition scheme.

120 Implementation of the signal processing
of each segment by using the modified detection algorithm. We find that except the 14th real R
peak of the segment 1, all the other R peaks are detected. The correctly detected IBI values are
compared with the initially computed IBI values listed in Table5.1. Table5.12lists their mean
deviations (for the segment 1, the mean deviation was computed by the comparison between
the fourteen correctly detected IBI values and the real IBI values).
Compared with the IBI values in Table5.1, we can find that the deviations of two corre-
sponding IBI values are within 2ms for these two cases and the mean deviations are less than
0.9ms. Considering the computed IBI values range (from 572ms to 864ms), we can see that
by detecting the QRS fiducial points in CD3(n), reducing the sampling frequencies to 500Hz
can also well conserve the satisfied QRS detection performance. Since the common sampling
frequency of ECG signal is around 500Hz, for example, in [119], the sampling frequency of
the ECG signal is 400Hz, we choose to reduce the sampling frequencies to 500Hz.
Thus, based on these discussions, the step of the QRS fiducial points detection of the
previously proposed QRS complex detection algorithm is modified. In our final detection
strategy, the QRS fiducial points are detected in CD3(n) instead of CD4(n). Meanwhile, for
the FPGA implementation, the ECG data (originally recorded by double-precision decimal
with the sampling frequencies of 2000Hz) were transfered with the following strategy:
• multiplying each sample of the ECG data by a factor 100, and then rounding it to an
integer.
• reduction of sampling frequency by 4, thus final sampling frequency was 500Hz.
5.4.4.4 Conclusion
To verify the general feasibility of the modified detection algorithm, we finally tested its de-
tection performance by using nine segments of the ECG signal registered in our experiments.
For this purpose, firstly, we multiply each sample of the ECG data by the factor of 100 and
then rounded it to an integer. Secondly, the ECG signal was downsampled to 500Hz, since
the initial sampling frequency of the ECG signal was 2000Hz. Thirdly, the R peak locations
computed by our modified detection algorithm (QRS fiducial points detected in CD3(n)) were
registered. The correct detection rate CDR was defined as:
CDR[%] = (1− NFP+NFNTN
)∗100% (5.9)
where are: NFP- number of False Positive, NFN- number of False Negative and TN- total
number of R peaks in the ECG records. Here, False Positive means a peak reported as QRS
candidate, while it is non and False Negative means a missed peak, when there is in fact a real
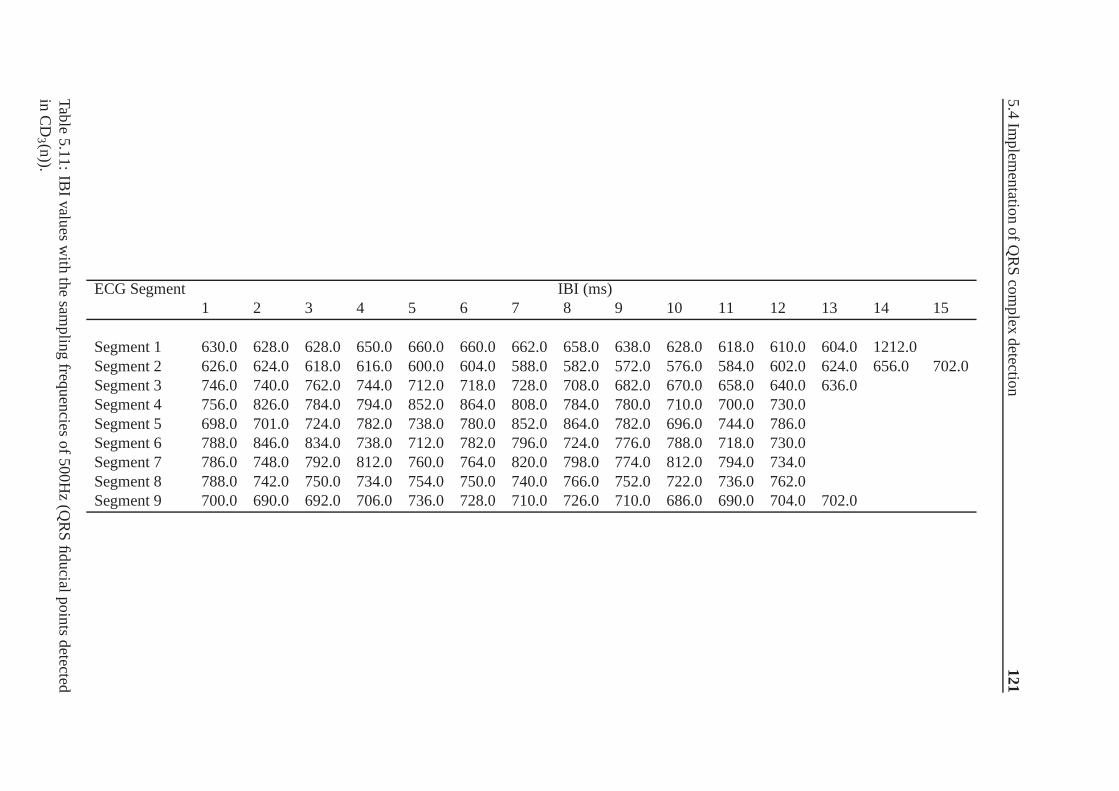
5.4
Imp
lemen
tation
ofQ
RS
com
plex
detectio
n121
ECG Segment IBI (ms)1 2 3 4 5 6 7 8 9 10 11 12 13 14 15
Segment 1 630.0 628.0 628.0 650.0 660.0 660.0 662.0 658.0 638.0 628.0 618.0 610.0 604.0 1212.0Segment 2 626.0 624.0 618.0 616.0 600.0 604.0 588.0 582.0 572.0 576.0 584.0 602.0 624.0 656.0 702.0Segment 3 746.0 740.0 762.0 744.0 712.0 718.0 728.0 708.0 682.0 670.0 658.0 640.0 636.0Segment 4 756.0 826.0 784.0 794.0 852.0 864.0 808.0 784.0 780.0 710.0 700.0 730.0Segment 5 698.0 701.0 724.0 782.0 738.0 780.0 852.0 864.0 782.0 696.0 744.0 786.0Segment 6 788.0 846.0 834.0 738.0 712.0 782.0 796.0 724.0 776.0 788.0 718.0 730.0Segment 7 786.0 748.0 792.0 812.0 760.0 764.0 820.0 798.0 774.0 812.0 794.0 734.0Segment 8 788.0 742.0 750.0 734.0 754.0 750.0 740.0 766.0 752.0 722.0 736.0 762.0Segment 9 700.0 690.0 692.0 706.0 736.0 728.0 710.0 726.0 710.0 686.0 690.0 704.0 702.0
Table
5.1
1:
IBIvalu
esw
ithth
esam
plin
gfreq
uen
cieso
f50
0H
z( Q
RS
fidu
cialpo
ints
detected
inC
D3 (n
)).

122 Implementation of the signal processing
ECG segment Mean deviation (ms)
Segment 1 0.47Segment 2 0.40Segment 3 0.15Segment 4 0.25Segment 5 0.25Segment 6 0.41Segment 7 0.33Segment 8 0.33Segment 9 0.23
Table 5.12: Mean deviations for the computed IBI values with the sampling frequencies of500Hz (QRS fiducial points detected in CD3(n)).
QRS complex. Table5.13summarizes the performance of the modified detection algorithm.
As showed in Table5.13, the total accuracy exceeds 98%. The test results show that a satisfied
detection performance can be achieved by using our modified detection algorithm while the
sampling frequencies of the ECG signal is 500Hz. Therefore, for our FPGA implementation,
the sampling frequency of the ECG data is reduced to 500Hz while using the detail signal
CD3(n) for the QRS fiducial points detection.
5.4.5 FPGA implementation
5.4.5.1 Hardware architecture of FPGA implementation
The QRS complex detection algorithm was finally implemented in FPGA. Its simplified dia-
gram is presented in Figure5.9, which is composed of three major blocks: an IHT block, a
detection of QRS fiducial (DF) block and a detection of R peak (DR) block. The input of the
system is the vector of ECG dataX and the output is the R peak location (addr_R_peak) in
X. The system is driven in by the system clockclock_IHT .
The IHT block is designed for the Integer Haar decomposition up to 3th level. The de-
composition is realized by three pipelined IHD module (see Figure5.10). The architecture of
one IHD module is shown in Figure5.11. REG_1 andREG_2 are driven by the input clock
clk and registered two successive input data samplesX(n) andX(n+1). Cal_1 andCal_2
compute(X(n)+X(n+1))>> 1 andX(n)−X(n+1) for each sample.clk is downsampled
by 2 so that theclk_out = clk/2. REG_3 andREG_4 are driven by the downsampled clock
and store the values of(X(2n)+X(2n+1))>> 1 andX(2n)−X(2n+1). Thus, we obtain the
detail signalCD and the approximation signalCA for one decomposition level. The obtained

5.4 Implementation of QRS complex detection 123
ECG segment TN NFP NFN CDR (%)
Segment 1 953 0 38 96.01Segment 2 563 2 13 97.34Segment 3 546 0 1 99.82Segment 4 343 0 0 100.00Segment 5 726 1 3 99.45Segment 6 646 3 3 99.07Segment 7 627 2 18 96.81Segment 8 635 0 16 97.48Segment 9 326 1 0 99.69Total 5365 9 92 98.41
Table 5.13: Performance of the modified detection algorithm.
Figure 5.9: Simplified diagram of FPGA implementation.
Figure 5.10: Architecture of the IHT block.

124 Implementation of the signal processing
Figure 5.11: Architecture of one IHD module.
CA is the inputdata_in of the IHD module of next decomposition level. Theclk_out is the
input clockclk of the next IHD module. By using the three IHD modules, we finally obtain
the outputs of the IHT block:CLK3 andCD_3_IHT .
The DF block detects the QRS fiducials in the detail signalCD_3_IHT . Figure 5.12
illustrates its architecture. TheTh module searches the absolute maximum sample amplitude
Max_absof the inputCD_3_IHT . This maximum amplitude is updated for each 800 input
samples. TheQRS_ f module takesMax_absto define a threshold, which is half of the value of
Max_abs. By using this threshold, theQRS_ f module searches locations of the QRS fiducials
(sample values higher than the threshold) inCD_3_IHT . To avoid detecting more than one
QRS fiducial from the same QRS complex, once the first QRS fiducial point is detected, the
QRS fiducials appearing in the following 10 samples are skipped. The locations of the selected
QRS fiducials are multiplied by 8 to obtain theaddr_max_s, which are the locations of the
selected QRS fiducials inX. TheTh module and theQRS_ f module are driven by the clock
CLK3.
The DR block is driven by the clockclock_IHT (see Figure5.9). The block compares the
values of the 35 samples on either side of each selected QRS fiducial location inX to search
the maximum of these 71 samples. The locations of the maximums are the R peak locations
in X. They are registered and are the outputs of the systemaddr_R_peak.
The core unit of the DF and DR block is the CMAX unit, which is used to search the
maximum of the input samples. As shown in Figure5.13, the CMAX unit is composed of one
comparator and one register. The comparator compares the value of two input samples and

5.4 Implementation of QRS complex detection 125
Figure 5.12: Architecture of the DF block.
Figure 5.13: Architecture of CMAX unit.
outputs the maximum of the two samples. This maximum is registered by the register for the
next comparison. Thus, we can obtain the maximum of the input samples.
5.4.5.2 Simulation result of the proposed system
We designed the system in Altera’s Quartus II 13.1 development environment. FPGA Cy-
clone EP3C5F256C6 was used as the target chip. All the components of the system were
implemented in VHSIC Hardware Description Language (VHDL).
The simulation is performed by processing the real ECG signal with the proposed system.
For this purpose, a simulation generator is designed and embedded in FPGA. The simulation
generator contains a counter which is used to address the ROM in incremental order and the
FPGA’s ROM is involved in to store the ECG data. The sampling frequency of the ECG signal
is 500 Hz. The ECG data is stored in the FPGA’s ROM as 13 bits integers, which is initialized

126 Implementation of the signal processing
Figure 5.14: Illustration of the FPGA simulation results.
by creating the memory initialization file (*.mif). Thus, the ROM is an array of the test ECG
samplesX(n), X(n+1), . . .. The counter is driven by a clock. The frequency of this block
is 10 MHz, which is much higher than the sampling frequency of the ECG signal. After the
simulation, this generator can be removed.
Figure5.14illustrates the simulation results for the detection of the R peaks of two seconds
ECG signal. Since the sampling frequency of the ECG signal is 500 Hz, 1000 ECG samples
were processed. As can be seen, the output of the systemaddr_R_peakdetected three loca-
tions of the R peaks: 185, 578 and 952. This means that the FPGA system found that for the
two seconds ECG signal, the R peaks were located at the 185th, 578th and 952th samples of
the signal.
Previously, we performed the proposed QRS complex detector to process the same two
seconds ECG signal in Matlab. We have mentioned that for the FPGA implementation, each
sample of the ECG data was multiplied by a factor of 100 and then was rounded to an integer.
The sampling frequency of the ECG signal was reduced to 500Hz. Thus, for the two seconds
ECG signal that was used for simulation, we also performed this processing of transform in
Matlab. In this way, we can ensure that the same ECG samples are processed in FPGA and in
Matlab.
The detection result in Matlab is illustrated in Figure5.15. As can be seen, the two seconds
ECG signal contained 1000 ECG samples. Three R peaks were detected and their locations
were at the 185th, 578th and 952th samples of the signal. Thus, we can see that the locations
of the R peaks detected in Matlab match the locations detected in FPGA system.
5.4.5.3 Hardware performance
To evaluate the hardware performance, the silicon consumption and operation speed are the
most important parameters. The proposed system occupies around 8% silicon resources of
the target chip where the target chip has a total of 5136 LCs (logic cells). As can be seen,
the proposed system has good design efficiency in term of silicon consumption. Besides, the
maximum operation frequency of the system clock is 183.65 MHz. This frequency is much
more than the requirements of the ECG signal processing, since the sampling frequency of the

5.5 Discussion of the implementation in FPGA 127
Figure 5.15: Illustration of the MATLAB simulation results.
Table 5.14: Comparison of hardware performance with the system proposed in [119].
Parameter Our system System in [119]
Silicon consumption of the target chip 8% (5136 logic cells) 11% (5980 logic cells)Maximum operation frequency 183.65 MHz 27.23 MHz
ECG signal is 500 Hz.
The testing results of our FPGA system is compared with the QRS detection system pro-
posed in [119]. Their system was implemented in FPGA Cyclone EP1C12Q240, which has
a total of 5980 LCs. This target chip and the chip used in our testing are both the chips of
Altera’s Cyclone family. As can be seen from Table5.14, in terms of hardware performance,
our system consumes less silicon resources of the target chip and has a much higher maximum
operation frequency.
5.5 Discussion of the implementation in FPGA
In section5.4, we present the implementation of the ECG based QRS complex detection in
FPGA. The implementation adopts the IHT scheme for ECG signal filtering and a maximum
finding strategy to detect the location of R peak of the QRS complex. The ECG data were
originally recorded by double-precision decimal with the sampling frequencies of 2000Hz.
For the FPGA implementation, they were transferred to integers with rounding operation. We
performed the comparison in Matlab and found that the best multiplying factor for rounding
was 100. Besides, to reduce the computation load in FPGA, the feasibility of the reduction of
the sampling frequency was tested in Matlab and the sampling frequency was finally reduced

128 Implementation of the signal processing
to 500Hz. Meanwhile, to ensure detection accuracy, the QRS fiducial points are detected in
CD3(n) instead of CD4(n).
As can be found, our implementation of QRS complex detection overcomes the shortcom-
ings of the strategy proposed in [119]. We can ensure that the real HR was obtained by comput-
ing the time interval between two consecutive R peaks in the original ECG signal. Meanwhile,
in the processing of the thresholding comparison, the thresholding was updated automatically
using a maximum finding strategy so that there were no parameters which should be selected
manually. Moreover, compared with [119], our approach involves in less computation load
aswell. Firstly, the IHT was performed up to the 3th level instead of 4th level. Thus, we did
not need to calculate the 4th decomposition level. Secondly, in [119], the processing of QRS
detection was applied in all four decompositions levels of original ECG signal, where one HR
value was obtained for each decomposition level. After that, a comparison strategy was ap-
plied to decide the final HR value. However, in our approach, the processing of QRS detection
was only applied to the 3th decomposition level.
The testing results show that the proposed FPGA architecture can achieve not only a high
detection accuracy, but also good design efficiency in terms of silicon consumption and op-
eration speed. As we have mentioned, our research aimed at making a FPGA system for the
stress recognition given heterogeneous data. The proposed FPGA architecture will be adopted
to construct the HR computation block. The next processings of recognition to be imple-
mented on board are the preprocessing of EMG (filtering) and the processing of classification
that is composed of feature extraction, SVM classification and decision fusion.
The computations of filtering and features extraction require arithmetic operations such as
addition, subtraction, multiplication, division and square root. We have find that these oper-
ations can be implemented in FPGA with a fast and area efficient approach. The previously
mentioned researches [59, 80, 96] have shown that the SVM classifier can be well imple-
mented in FPGA. The decision fusion with the voting method can be implemented by using a
counter. Since the proposed QRS detection system occupies only 8% silicon resources of the
target chip, there are still enough silicon resources to implement the following processings of
recognition in the target chip. Once the complete processings of recognition are implemented
in FPGA, an embedded system for the stress recognition can be achieved.
5.6 Summary
In this chapter, we discuss the feasibility of embedded system which would realize the com-
plete signal processing of the stress recognition. The recognition processing is composed of
the preprocessing of EMG and EDA, ECG based HR computation and processing of clas-

5.6 Summary 129
sification (feature extraction, SVM classification and decision fusion). Two approaches of
implementation, Android OS based mobile device and FPGA are analyzed. The analyzing
results show that compared with the Android OS based mobile device, FPGA is more suitable
to realize the complete recognition processing.
Besides, we implemented the ECG based HR computation block in FPGA. The imple-
mentation adopted the IHT scheme for ECG signal filtering and a maximum finding strategy
to detect the location of R peak of the QRS complex. The testing results show that the proposed
FPGA architecture can achieve a high detection accuracy. In terms of hardware performance,
the proposed system only occupies 8% silicon resources of the target chip and the maximum
operation frequency of the system clock is 183.65 MHz.


Chapter 6
Conclusions and prospect
This thesis discussed the feasibility and the interest of stress recognition from heterogeneous
data and proposed an approach to achieve the processing of recognition. Not only physio-
logical signals, such as ECG, EMG and EDA, but also reaction time (RT) were adopted to
recognize different stress states of an individual. What is more, we discussed the feasibility of
an embedded system which would realize the complete data processing.
To acquire the physiological signals and RT related to the stress, we firstly designed an
experiment which adopted a sound of huge noise (high dB) to elicit the stress of the sub-
jects. The experimental protocol is aimed at eliciting different stress states of the participating
subject at pre-determined periods. After the preprocessing of the physiological signals, we
analyzed statistically the recordings. However, the results of the Student’s t-test showed that
neither physiological response nor RT showed statistical significant difference between the
normal condition (without the sound of huge noise) and the stressful condition (appearance of
the sound of huge noise).
Therefore, we proposed a new design of the experiments for signal acquisition. The exper-
iments adopted respectively a visual stressor (Stroop test) and an auditory stressor (acoustic
induction) to elicit the stress of the subjects. These stressors have been presented and used as
effective physiological stress stimulus in the literature. However, previous studies in the liter-
ature did not take the RT into consideration for stress recognition. To find out if the difference
of RT exists when the subject is under different stress levels, we analyzed statistically the RTs
recorded in the experiment using visual stressor and in the experiment using auditory stressor.
The results of the Student’s t-test showed that the RTs showed statistical significant differ-
ence between low stress level and high stress level in terms of their mean value and standard
deviation. Moreover, in the experiment using auditory stressor, when the discrimination was
performed between medium stress level and high stress level, the RTs also showed statistical
significant difference in terms of their standard deviation.

132 Conclusions and prospect
Our approaches of stress recognition given physiological signals and RT consist of prepro-
cessing of the physiological signals, feature extraction and Support Vector Machines (SVM)
classification. The physiological signals were firstly filtered to avoid artifacts. Besides, the
ECG signal requires addition preprocessing, since we need to generate informative features
from HRV time series for classification. To obtain HRV time series from continuous ECG
signal, Pan-Tompkins algorithm was used. Then, the informative features such as the mean
value, the standard deviation and absolute differences were extracted and were used as the
inputs of the SVM classifier. Finally, the SVM classifier performed the classification and its
outputs were the stress levels.
The proposed recognition approach was firstly tested on a published stress data set. We
adopted the skin conductance of the left hand as the processed physiological signal for our
test. The test results showed that for all ten drives, the classification accuracies were more
than 88.5% for the discrimination between the period of low stress and the period of high
stress. Especially for four drives, the classification accuracies were 100%.
Then, we tested the proposed recognition approach on the physiological signals and RT ac-
quired in our designed experiment (using visual and auditory stressors). By analyzing the clas-
sification accuracies, we found that a generally good recognition performance was obtained
by the proposed SVM classifier given physiological signals and RT in both two experiments.
Not only the physiological signals, but also the RT was found to be efficient to recognize the
stress of an individual. The test results reinforce the belief that it is feasible to adopt the data
from heterogeneous sources for stress recognition. Moreover, we know that compared with
the recording of the physiological signals, recording RT is noninvasive since the subject does
not need to be in physical contact with the adhesive electrodes of the biosensors. This is quite
beneficial for the practical Human–computer interaction application. Thus, we think that for
the stress recognition system, it is quite meaningful to adopt the subject’s RT for recognition.
Besides, we proposed the approach of decision fusion for stress recognition. It was achieved
by the voting method and we fused the classification results of the physiological signals and
RT. We found that compared with the recognition given one physiological signal or RT, the
recognition performance can be improved by the approach of decision fusion. Therefore, we
think that to ensure good recognition performance, it is beneficial to fuse the data from het-
erogeneous sources.
We also considered the situation where the EDA signal is the only available physiological
source that could be used. In reality, it is not always achievable to attach the electrodes of the
sensors to the body of the subject. The EDA signal is commonly available in the real appli-
cation as the electrodes of the EDA sensor are attached to the subject’s finger. By analyzing
the case that recognition was performed by the fusion of the EDA signal and RT, we observed

133
that classification accuracies were still higher than 80.0% for the majority of the subjects.
This shows that when facing the situation that not all three presented physiological signals are
available to be acquired, the proposed approach of decision fusion can still bring in satisfied
recognition performance.
Since we aim at analyzing accurately the stress state of an individual in the real life, we
discussed the feasibility of embedded system which would realize the complete signal process-
ing of the stress recognition. Two approaches of implementation, Android OS based mobile
device and FPGA were analyzed. The analyzing results show that compared with the Android
OS based mobile device, FPGA is more suitable to implement the complete recognition pro-
cessing. Then, we presented the implementation of the ECG based HR computation in FPGA,
which is an important block of our processing of stress recognition. The implementation
adopted the IHT scheme for ECG signal filtering and a maximum finding strategy to detect
the location of R peak of the QRS complex. The testing results showed that the proposed
FPGA architecture achieved good hardware performance. The maximum operation frequency
of the system clock is 183.65 MHz. This frequency is much more than the requirements of
the ECG signal processing, since the sampling frequency of the ECG signal is 500 Hz. The
proposed implementation occupies only 8% silicon resources of the target chip, there are still
enough silicon resources to implement the following processings for recognition (feature ex-
traction, SVM classification and decision fusion) in the target chip.
Since the Psypocket project aims at making a portable system able to analyze accurately
the stress state of an individual in the real life by analyzing his physiological, psychologi-
cal and behavioural reactions, based on the researches of this thesis, our future work can be
segmented into several directions.
The short-term prospect is to complete the implementation of the whole recognition pro-
cessing. In this thesis, we implemented the ECG based HR computation block in FPGA.
Thus, it remains the processings of feature extraction, SVM classification and decision fusion
to be implemented. Once the implementation of the whole recognition processing is achieved,
we can evaluate if the classification accuracy of the hardware implementation is as good as
the software implementation. Meanwhile, we can figure out if a good hardware performance
can be achieved while performing this complicated recognition processing. All these efforts
contribute to make a core recognition system for stress assessment. By connecting it with a
sensor network for signal acquisition, a module for signal transmission and an indicator mod-
ule to display directly the stress levels, the portable stress recognition system proposed by the
Psypocket project can be envisaged.
The medium-term prospect will focus on the use of psypocket in real-life situations. The
system was initially designed to analyze stress of the subjects in emergency situations (such

134 Conclusions and prospect
as firefighting, parachute jump, etc.). Some of these situations will be evaluated. To achieve
this goal, we can involve in the stressors in reality and propose new tests. In this way, we can
figure out if our proposed stress recognition strategy can achieve a generally good recognition
performance when facing a variety of stressors.
Besides, we know that when an individual is typing on a keyboard, his reaction time can
be simply measured. It is also the case for many other situations, for example when a person
with severe motor disability controls an assisted communication device with an adapted switch
[45]. Therefore, we can design new experiments to acquire the reaction time of the individual
when he is performing such Human–computer interaction tasks and discuss their feasibility
and efficiency for stress recognition.
Meanwhile, the study of adopting other available data as the inputs of Psypocket system
for stress recognition can be involved in our future work as well. For example, as the be-
havioural reaction, the postural signal is a possible candidate. By analyzing their recognition
performance, we can build a psychophysiological expertise for stress recognition, i.e. among
the various stressor, finding out which signal is the best indicator to recognize the stress state
of an individual and the most efficient characteristic features of this signal related to the stress.

References
[1] Medical Terms, Genericlook, Available: http://medicalterms.info/.
[2] Medical Encyclopedia, American Accreditation HealthCare Commission, Available:
https://medlineplus.gov/.
[3] Western Cape Direct, StressEraser, 2010, Available: http://stresseraser.com/.
[4] Mindplace, ThoughtStream, 2012, Available: http://www.mindplace.com.
[5] HeartMath Australasia, emWave, 2010, Available: http://www.emwave.com.au/.
[6] Faiza Abdat, Choubeila Maaoui, and Alain Pruski. Bimodal system for emotion recog-
nition from facial expressions and physiological signals using feature-level fusion. In
Computer Modeling and Simulation (EMS), 2011 Fifth UKSim European Symposium
on, pages 24–29. IEEE, 2011.
[7] Mobyen Uddin Ahmed, Shahina Begum, and Mohd Siblee Islam. Heart rate and inter-
beat interval computation to diagnose stress using ecg sensor signal.MRTC Report,
2010.
[8] Ahmet Akbas. Evaluation of the physiological data indicating the dynamic stress level
of drivers.Scientific research and essays, 6(2):430–439, 2011.
[9] Ane Alberdi, Asier Aztiria, and Adrian Basarab. Towards an automatic early stress
recognition system for office environments based on multimodal measurements: A re-
view. Journal of biomedical informatics, 59:49–75, 2016.
[10] Moustafa Alzantot and Moustafa Youssef. Uptime: Ubiquitous pedestrian tracking
using mobile phones. In2012 IEEE Wireless Communications and Networking Con-
ference (WCNC), pages 3204–3209. IEEE, 2012.

136 References
[11] Jeremy Ang, Rajdip Dhillon, Ashley Krupski, Elizabeth Shriberg, and Andreas Stolcke.
Prosody-based automatic detection of annoyance and frustration in human-computer
dialog. InINTERSPEECH. Citeseer, 2002.
[12] Davide Anguita, Andrea Boni, and Sandro Ridella. A digital architecture for support
vector machines: theory, algorithm, and fpga implementation.IEEE Transactions on
Neural Networks, 14(5):993–1009, 2003.
[13] Davide Anguita, Alessandro Ghio, Luca Oneto, Xavier Parra, and Jorge L Reyes-Ortiz.
Human activity recognition on smartphones using a multiclass hardware-friendly sup-
port vector machine. InInternational Workshop on Ambient Assisted Living, pages
216–223. Springer, 2012.
[14] Antonio Armato, Elena Nardini, Antonio Lanata, Gaetano Valenza, C Mancuso,
Enzo Pasquale Scilingo, and Danilo De Rossi. An fpga based arrhythmia recognition
system for wearable applications. In2009 Ninth International Conference on Intelligent
Systems Design and Applications, pages 660–664. IEEE, 2009.
[15] Semih Aslan, Erdal Oruklu, and Jafar Saniie. Realization of area efficient qr factoriza-
tion using unified division, square root, and inverse square root hardware. In2009 IEEE
International Conference on Electro/Information Technology, pages 245–250. IEEE,
2009.
[16] Alan D Baddeley. Selective attention and performance in dangerous environments.
British journal of psychology, 63(4):537–546, 1972.
[17] Jorn Bakker, Mykola Pechenizkiy, and Natalia Sidorova. What’s your current stress
level? detection of stress patterns from gsr sensor data. InData Mining Workshops
(ICDMW), 2011 IEEE 11th International Conference on, pages 573–580. IEEE, 2011.
[18] Jean-Luc Beuchat and Arnaud Tisserand. Small multiplier-based multiplication and
division operators for virtex-ii devices. InInternational Conference on Field Pro-
grammable Logic and Applications, pages 513–522. Springer, 2002.
[19] Benoit Bolmont, Francine Thullier, and Jacques H Abraini. Relationships between
mood states and performances in reaction time, psychomotor ability, and mental effi-
ciency during a 31-day gradual decompression in a hypobaric chamber from sea level
to 8848 m equivalent altitude.Physiology & behavior, 71(5):469–476, 2000.
[20] Frédéric Bousefsaf, Choubeila Maaoui, and Alain Pruski. Remote assessment of the
heart rate variability to detect mental stress. InPervasive Computing Technologies for

References 137
Healthcare (PervasiveHealth), 2013 7th International Conference on, pages 348–351.
IEEE, 2013.
[21] Margaret Bradley and Peter J Lang.The International affective digitized sounds
(IADS)[: stimuli, instruction manual and affective ratings. NIMH Center for the Study
of Emotion and Attention, 1999.
[22] Majdi Bsoul, Hlaing Minn, and Lakshman Tamil. Apnea medassist: real-time sleep
apnea monitor using single-lead ecg.IEEE Transactions on Information Technology in
Biomedicine, 15(3):416–427, 2011.
[23] Adrian Burns, Barry R Greene, Michael J McGrath, Terrance J O’Shea, Benjamin
Kuris, Steven M Ayer, Florin Stroiescu, and Victor Cionca. Shimmer–a wireless sen-
sor platform for noninvasive biomedical research.IEEE Sensors Journal, 10(9):1527–
1534, 2010.
[24] John T Cacioppo and Louis G Tassinary. Inferring psychological significance from
physiological signals.American Psychologist, 45(1):16, 1990.
[25] AR Calderbank, Ingrid Daubechies, Wim Sweldens, and Boon-Lock Yeo. Wavelet
transforms that map integers to integers.Applied and computational harmonic analysis,
5(3):332–369, 1998.
[26] Tarani Chandola, Eric Brunner, and Michael Marmot. Chronic stress at work and the
metabolic syndrome: prospective study.Bmj, 332(7540):521–525, 2006.
[27] Chih-Chung Chang and Chih-Jen Lin. Libsvm: a library for support vector machines.
ACM Transactions on Intelligent Systems and Technology (TIST), 2(3):27, 2011.
[28] Lawrence S Chen, Thomas S Huang, Tsutomu Miyasato, and Ryohei Nakatsu. Multi-
modal human emotion/expression recognition. InAutomatic Face and Gesture Recog-
nition, 1998. Proceedings. Third IEEE International Conference on, pages 366–371.
IEEE, 1998.
[29] Sheldon Cohen, Tom Kamarck, and Robin Mermelstein. A global measure of perceived
stress.Journal of health and social behavior, pages 385–396, 1983.
[30] Thomas W Colligan and Eileen M Higgins. Workplace stress: Etiology and conse-
quences.Journal of workplace behavioral health, 21(2):89–97, 2006.

138 References
[31] Stephen A Coombes, Torrie Higgins, Kelly M Gamble, James HCauraugh, and Christo-
pher M Janelle. Attentional control theory: Anxiety, emotion, and motor planning.
Journal of Anxiety Disorders, 23(8):1072–1079, 2009.
[32] Corinna Cortes and Vladimir Vapnik. Support-vector networks.Machine learning, 20
(3):273–297, 1995.
[33] Caitlin Mullan Crain, Kristy Kroeker, and Benjamin S Halpern. Interactive and cumu-
lative effects of multiple human stressors in marine systems.Ecology letters, 11(12):
1304–1315, 2008.
[34] Christopher V Dayas, Kathryn M Buller, James W Crane, Yan Xu, and Terry A Day.
Stressor categorization: acute physical and psychological stressors elicit distinctive re-
cruitment patterns in the amygdala and in medullary noradrenergic cell groups.Euro-
pean Journal of Neuroscience, 14(7):1143–1152, 2001.
[35] Liyanage C De Silva and Pei Chi Ng. Bimodal emotion recognition. InAutomatic Face
and Gesture Recognition, 2000. Proceedings. Fourth IEEE International Conference
on, pages 332–335. IEEE, 2000.
[36] Zulfikar Dharmawan and LJM Rothkrantz. Analysis of computer games player stress
level using eeg data.Master of Science Thesis Report, Faculty of Electrical Engineer-
ing, Mathematics and Computer Science, Delft University of Technology, Netherlands,
2007.
[37] David F Dinges, Robert L Rider, Jillian Dorrian, Eleanor L McGlinchey, Naomi L
Rogers, Ziga Cizman, Siome K Goldenstein, Christian Vogler, Sundara Venkataraman,
and Dimitris N Metaxas. Optical computer recognition of facial expressions associ-
ated with stress induced by performance demands.Aviation, space, and environmental
medicine, 76(6):B172–B182, 2005.
[38] Janessa DM Drake and Jack P Callaghan. Elimination of electrocardiogram contamina-
tion from electromyogram signals: an evaluation of currently used removal techniques.
Journal of electromyography and kinesiology, 16(2):175–187, 2006.
[39] Raul Fernandez and Rosalind W Picard. Modeling drivers speech under stress.Speech
communication, 40(1):145–159, 2003.
[40] Richard Ribon Fletcher, Kelly Dobson, Matthew S Goodwin, Hoda Eydgahi, Oliver
Wilder-Smith, David Fernholz, Yuta Kuboyama, Elliott Bruce Hedman, Ming-Zher

References 139
Poh, and Rosalind W Picard. icalm: Wearable sensor and networkarchitecture for
wirelessly communicating and logging autonomic activity.Information Technology in
Biomedicine, IEEE Transactions on, 14(2):215–223, 2010.
[41] European Foundation for the Improvement of Living.Fourth European working con-
ditions survey, volume 11. European Foundation for the Improvement of Living and
Working Conditions, 2007.
[42] Jordan Frank, Shie Mannor, and Doina Precup. Activity recognition with mobile
phones. InJoint European Conference on Machine Learning and Knowledge Discovery
in Databases, pages 630–633. Springer, 2011.
[43] Nico H Frijda. The emotions: Studies in emotion and social interaction.Edition de la,
1986.
[44] Prerana N Gawale, AN Cheeran, and Nidhi G Sharma. Android application for am-
bulant ecg monitoring.International Journal of Advanced Research in Computer and
Communication Engineering, 3(5):6465–6468, 2014.
[45] Souhir Ghedira, Pierre Pino, and Guy Bourhis. Conception and experimentation of a
communication device with adaptive scanning.ACM Transactions on Accessible Com-
puting (TACCESS), 1(3):14, 2009.
[46] Joao B’rtolo Gomes, Shonali Krishnaswamy, Mohamed Medhat Gaber, Pedro AC
Sousa, and Ernestina Menasalvas. Mars: a personalised mobile activity recognition
system. In2012 IEEE 13th International Conference on Mobile Data Management,
pages 316–319. IEEE, 2012.
[47] Kaliappan Gopalan. On the effect of stress on certain modulation parameters of speech.
In Acoustics, Speech, and Signal Processing, 2001. Proceedings.(ICASSP’01). 2001
IEEE International Conference on, volume 1, pages 101–104. IEEE, 2001.
[48] R Grasse, Y Morère, and A Pruski. Aided navigation for disabled people: route recog-
nition with augmented hmms. In8th Conf. for the Advancement of Assistive Technology,
AAATE, 2005.
[49] Martijn Haak, Steven Bos, Sacha Panic, and LJM Rothkrantz. Detecting stress using
eye blinks and brain activity from eeg signals.Proceeding of the 1st driver car interac-
tion and interface (DCII 2008), pages 35–60, 2009.

140 References
[50] JP Hainaut and B Bolmont. Effects of mood states and anxiety as induced by the video-
recorded stroop color-word interference test in simple response time tasks on reaction
time and movement time.Perceptual and motor skills, 101(3):721–729, 2005.
[51] Wahida Handouzi, Choubeila Maaoui, Alain Pruski, and Abdelhak Moussaoui. Ob-
jective model assessment for short-term anxiety recognition from blood volume pulse
signal.Biomedical Signal Processing and Control, 14:217–227, 2014.
[52] John HL Hansen and Sanjay Patil. Speech under stress: Analysis, modeling and recog-
nition. In Speaker classification I, pages 108–137. Springer, 2007.
[53] Jennifer A Healey and Rosalind W Picard. Detecting stress during real-world driving
tasks using physiological sensors.Intelligent Transportation Systems, IEEE Transac-
tions on, 6(2):156–166, 2005.
[54] Javier Hernandez, Rob R Morris, and Rosalind W Picard. Call center stress recognition
with person-specific models. InInternational Conference on Affective Computing and
Intelligent Interaction, pages 125–134. Springer, 2011.
[55] Erik Hoffmann. Brain training against stress: Theory, methods and results from an
outcome study.Stress Report, 4(2):1–24, 2005.
[56] Clifford S Hopkins, Roy J Ratley, Daniel S Benincasa, and John J Grieco. Evaluation
of voice stress analysis technology. InSystem Sciences, 2005. HICSS’05. Proceedings
of the 38th Annual Hawaii International Conference on, pages 20b–20b. IEEE, 2005.
[57] Seyyed Abed Hosseini, Mohammad Ali Khalilzadeh, Mohammad Bagher Naghibi-
Sistani, and Seyyed Mehran Homam. Emotional stress recognition using a new fusion
link between electroencephalogram and peripheral signals.Iranian journal of neurol-
ogy, 14(3):142, 2015.
[58] M Huiku, K Uutela, M Van Gils, I Korhonen, M Kymäläinen, P Meriläinen, M Palo-
heimo, M Rantanen, P Takala, H Viertiö-Oja, et al. Assessment of surgical stress during
general anaesthesia.British journal of anaesthesia, 98(4):447–455, 2007.
[59] Kevin Irick, Michael DeBole, Vijaykrishnan Narayanan, and Aman Gayasen. A hard-
ware efficient support vector machine architecture for fpga. InField-Programmable
Custom Computing Machines, 2008. FCCM’08. 16th International Symposium on,
pages 304–305. IEEE, 2008.

References 141
[60] Maria Jabon, Jeremy Bailenson, Emmanuel Pontikakis, Leila Takayama, and Clifford
Nass. Facial expression analysis for predicting unsafe driving behavior.IEEE Pervasive
Computing, 10(4):84–95, 2011.
[61] E Jang, B Park, S Kim, C Huh, Y Eum, and J Sohn. Emotion recognition through
ans responses evoked by negative emotions. InThe Fifth International Conference on
Advances in Computer-Human Interactions (ACHI), pages 218–223, 2012.
[62] Emil Jovanov, Amanda O’Donnell Lords, Dejan Raskovic, Paul G Cox, Reza Adhami,
and Frank Andrasik. Stress monitoring using a distributed wireless intelligent sensor
system.Engineering in Medicine and Biology Magazine, IEEE, 22(3):49–55, 2003.
[63] Sang-Joong Jung and Wan-Young Chung. Wide and high accessible mobile healthcare
system in ip-based wireless sensor networks. InSENSORS, 2013 IEEE, pages 1–4.
IEEE, 2013.
[64] Mohammed Karim et al. Novel simple decision stage of pan & tompkins qrs detector
and its fpga-based implementation. InInnovative Computing Technology (INTECH),
2012 Second International Conference on, pages 331–336. IEEE, 2012.
[65] Natallia Katenka, Elizaveta Levina, and George Michailidis. Local vote decision fu-
sion for target detection in wireless sensor networks.IEEE Transactions on Signal
Processing, 56(1):329–338, 2008.
[66] Nikolaos S Katertsidis, Christos D Katsis, and Dimitrios I Fotiadis. Intrepid, a
biosignal-based system for the monitoring of patients with anxiety disorders. InIn-
formation Technology and Applications in Biomedicine, 2009. ITAB 2009. 9th Interna-
tional Conference on, pages 1–6. IEEE, 2009.
[67] G Kavya and V Thulasibai. Vlsi implementation of telemonitoring system for high risk
cardiac patients.Indian Journal of Science and Technology, 7(5):571, 2014.
[68] Jonghwa Kim and Elisabeth André. Emotion recognition based on physiological
changes in music listening.Pattern Analysis and Machine Intelligence, IEEE Trans-
actions on, 30(12):2067–2083, 2008.
[69] Mustafa Kose, Ozlem Durmaz Incel, and Cem Ersoy. Online human activity recognition
on smart phones. InWorkshop on Mobile Sensing: From Smartphones and Wearables
to Big Data, pages 11–15, 2012.

142 References
[70] Jennifer R Kwapisz, Gary M Weiss, and Samuel A Moore. Activity recognition using
cell phone accelerometers.ACM SigKDD Explorations Newsletter, 12(2):74–82, 2011.
[71] Louisa Lam and SY Suen. Application of majority voting to pattern recognition: an
analysis of its behavior and performance.IEEE Transactions on Systems, Man, and
Cybernetics-Part A: Systems and Humans, 27(5):553–568, 1997.
[72] BR Lee and Neil Burgess. Improved small multiplier based multiplication, squaring and
division. In Field-Programmable Custom Computing Machines, 2003. FCCM 2003.
11th Annual IEEE Symposium on, pages 91–97. IEEE, 2003.
[73] Jonguk Lee, Byeongjoon Noh, Suin Jang, Daihee Park, Yongwha Chung, and Hong-
Hee Chang. Stress detection and classification of laying hens by sound analysis.Asian-
Australasian journal of animal sciences, 28(4):592–598, 2015.
[74] Iulia Lefter, Gertjan J Burghouts, and Léon JM Rothkrantz. Recognizing stress using
semantics and modulation of speech and gestures.IEEE Transactions on Affective
Computing, 7(2):162–175, 2016.
[75] Jennifer S Lerner, Ronald E Dahl, Ahmad R Hariri, and Shelley E Taylor. Facial expres-
sions of emotion reveal neuroendocrine and cardiovascular stress responses.Biological
psychiatry, 61(2):253–260, 2007.
[76] Wenhui Liao, Weihong Zhang, Zhiwei Zhu, and Qiang Ji. A real-time human stress
monitoring system using dynamic bayesian network. InComputer Vision and Pattern
Recognition-Workshops, 2005. CVPR Workshops. IEEE Computer Society Conference
on, pages 70–70. IEEE, 2005.
[77] TA Lin and LR John. Quantifying mental relaxation with eeg for use in computer
games. InInternational conference on internet computing, pages 409–415. Citeseer,
2006.
[78] Andrew Liu and Dario Salvucci. Modeling and prediction of human driver behavior. In
Intl. Conference on HCI, 2001.
[79] Stephane G Mallat. A theory for multiresolution signal decomposition: the wavelet
representation.IEEE transactions on pattern analysis and machine intelligence, 11(7):
674–693, 1989.
[80] J Manikandan, B Venkataramani, and V Avanthi. Fpga implementation of support
vector machine based isolated digit recognition system. In2009 22nd International
Conference on VLSI Design, pages 347–352. IEEE, 2009.

References 143
[81] Ryan J Marker and Katrina S Maluf. Effects of electrocardiography contamination and
comparison of ecg removal methods on upper trapezius electromyography recordings.
Journal of Electromyography and Kinesiology, 24(6):902–909, 2014.
[82] Arnaud Martin. Fusion de classifieurs pour la classification d’images sonar.arXiv
preprint arXiv:0806.2006, 2008.
[83] Bertrand Massot, Nicolas Baltenneck, Claudine Gehin, André Dittmar, and Eric
McAdams. Emosense: An ambulatory device for the assessment of ans activity ap-
plication in the objective evaluation of stress with the blind.IEEE Sensors Journal, 12
(3):543–551, 2012.
[84] Iris B Mauss and Michael D Robinson. Measures of emotion: A review.Cognition and
emotion, 23(2):209–237, 2009.
[85] Feuerstein Michael, Elise E Labbé, and Andrzej R Kuczmierczyk.Health psychology:
A psychobiological perspective. Springer Science & Business Media, 2013.
[86] Inma Mohino-Herranz, Roberto Gil-Pita, Javier Ferreira, Manuel Rosa-Zurera, and Fer-
nando Seoane. Assessment of mental, emotional and physical stress through analysis
of physiological signals using smartphones.Sensors, 15(10):25607–25627, 2015.
[87] Eric Monmasson and Marcian N Cirstea. Fpga design methodology for industrial con-
trol systems: A review.IEEE transactions on industrial electronics, 54(4):1824–1842,
2007.
[88] J Naveteur. Douleur chronique et activité électrodermale.Douleur et Analgésie, 21(2):
81–85, 2008.
[89] J Timothy Noteboom, Kerry R Barnholt, and Roger M Enoka. Activation of the arousal
response and impairment of performance increase with anxiety and stressor intensity.
Journal of applied physiology, 91(5):2093–2101, 2001.
[90] Daniel Novák, Lenka Lhotská, Vladimír Eck, and Milan Sorf. Eeg and vep signal
processing.Cybernetics, Faculty of Electrical Eng, pages 50–53, 2004.
[91] Tin Lay Nwe, Say Wei Foo, and Liyanage C De Silva. Speech emotion recognition
using hidden markov models.Speech communication, 41(4):603–623, 2003.
[92] Julien Oster, Joachim Behar, Roberta Colloca, Qichen Li, Qiao Li, and Gari D Clifford.
Open source java-based ecg analysis software and android app for atrial fibrillation
screening. InComputing in Cardiology 2013, pages 731–734. IEEE, 2013.

144 References
[93] Jiapu Pan and Willis J Tompkins. A real-time qrs detectionalgorithm. Biomedical
Engineering, IEEE Transactions on, (3):230–236, 1985.
[94] Maja Pantic and Leon JM Rothkrantz. Toward an affect-sensitive multimodal human-
computer interaction.Proceedings of the IEEE, 91(9):1370–1390, 2003.
[95] Markos Papadonikolakis and Christos-Savvas Bouganis. A scalable fpga architecture
for non-linear svm training. InICECE Technology, 2008. FPT 2008. International
Conference on, pages 337–340. IEEE, 2008.
[96] Markos Papadonikolakis and Christos-Savvas Bouganis. A novel fpga-based svm clas-
sifier. In Field-Programmable Technology (FPT), 2010 International Conference on,
pages 283–286. IEEE, 2010.
[97] Timo Partala and Veikko Surakka. Pupil size variation as an indication of affective
processing.International journal of human-computer studies, 59(1):185–198, 2003.
[98] Abhilasha M Patel, Pankaj K Gakare, and AN Cheeran. Real time ecg feature extraction
and arrhythmia detection on a mobile platform.Int. J. Comput. Appl, 44(23):40–45,
2012.
[99] Christos Pavlatos, Alexandros Dimopoulos, G Manis, and G Papakonstantinou. Hard-
ware implementation of pan & tompkins qrs detection algorithm. InProceedings of the
EMBEC05 Conference. Citeseer, 2005.
[100] W Scott Peavler. Pupil size, information overload, and performance differences.Psy-
chophysiology, 11(5):559–566, 1974.
[101] Alex Pentland and Andrew Liu. Modeling and prediction of human behavior.Neural
computation, 11(1):229–242, 1999.
[102] Rosalind W Picard, Elias Vyzas, and Jennifer Healey. Toward machine emotional in-
telligence: Analysis of affective physiological state.Pattern Analysis and Machine
Intelligence, IEEE Transactions on, 23(10):1175–1191, 2001.
[103] John C Platt. 12 fast training of support vector machines using sequential minimal
optimization.Advances in kernel methods, pages 185–208, 1999.
[104] Jeromie Rand, Adam Hoover, Stephanie Fishel, Jason Moss, Jennifer Pappas, and Eric
Muth. Real-time correction of heart interbeat intervals.IEEE transactions on biomedi-
cal engineering, 54(5):946–950, 2007.

References 145
[105] Pramila Rani, Jared Sims, Robert Brackin, and Nilanjan Sarkar. Online stress detection
using psychophysiological signals for implicit human-robot cooperation.Robotica, 20
(06):673–685, 2002.
[106] Thomas A Ranney, Elizabeth Mazzae, Riley Garrott, and Michael J Goodman. Nhtsa
driver distraction research: Past, present, and future. InDriver distraction internet
forum, volume 2000, 2000.
[107] Stanley Reisman. Measurement of physiological stress. InBioengineering Conference,
1997., Proceedings of the IEEE 1997 23rd Northeast, pages 21–23. IEEE, 1997.
[108] Andreas Riener, Alois Ferscha, and Mohamed Aly. Heart on the road: Hrv analysis for
monitoring a driver’s affective state. InProceedings of the 1st International Conference
on Automotive User Interfaces and Interactive Vehicular Applications, pages 99–106.
ACM, 2009.
[109] George Rigas, Yorgos Goletsis, Panagiota Bougia, and Dimitrios I Fotiadis. Towards
driver’s state recognition on real driving conditions.International Journal of Vehicular
Technology, 2011, 2011.
[110] Mirco Rossi, Sebastian Feese, Oliver Amft, Nils Braune, Sandro Martis, and Gerhard
Tröster. Ambientsense: A real-time ambient sound recognition system for smartphones.
In Pervasive Computing and Communications Workshops (PERCOM Workshops), 2013
IEEE International Conference on, pages 230–235. IEEE, 2013.
[111] Leon JM Rothkrantz, Pascal Wiggers, Jan-Willem A van Wees, and Robert J van Vark.
Voice stress analysis. InInternational conference on text, speech and dialogue, pages
449–456. Springer, 2004.
[112] Amir Said and William A Pearlman. An image multiresolution representation for loss-
less and lossy compression.IEEE Transactions on image processing, 5(9):1303–1310,
1996.
[113] Lizawati Salahuddin and Desok Kim. Detection of acute stress by heart rate variability
(hrv) using a prototype mobile ecg sensor. InInternational Conference on Hybrid
Information Technology (ICHiT/06), pages 453–459, 2006.
[114] Stefan Scherer, Hansjörg Hofmann, Malte Lampmann, Martin Pfeil, Steffen Rhinow,
Friedhelm Schwenker, and Günther Palm. Emotion recognition from speech: Stress
experiment. InLREC, 2008.

146 References
[115] H SELYE. The stress of life. New York: McGraw-Hill, 1956.
[116] Nandita Sharma and Tom Gedeon. Objective measures, sensors and computational
techniques for stress recognition and classification: A survey.Computer methods and
programs in biomedicine, 108(3):1287–1301, 2012.
[117] Pekka Siirtola and Juha Röning. Recognizing human activities user-independently on
smartphones based on accelerometer data.IJIMAI, 1(5):38–45, 2012.
[118] Gerhard Stemmler, Marcus Heldmann, Cornelia A Pauls, and Thomas Scherer. Con-
straints for emotion specificity in fear and anger: The context counts.Psychophysiol-
ogy, 38(02):275–291, 2001.
[119] R Stojanovic, D Karadaglic, M Mirkovic, and D Miloševic. A fpga system for qrs
complex detection based on integer wavelet transform.Measurement Science Review,
11(4):131–138, 2011.
[120] J Ridley Stroop. Studies of interference in serial verbal reactions.Journal of experi-
mental psychology, 18(6):643, 1935.
[121] Vladimir Naumovich Vapnik and Vlamimir Vapnik.Statistical learning theory, vol-
ume 1. Wiley New York, 1998.
[122] Nishchal K Verma, Sumanik Singh, Jayesh K Gupta, Rahul K Sevakula, Sonal Dixit,
and Al Salour. Smartphone application for fault recognition. InSensing Technology
(ICST), 2012 Sixth International Conference on, pages 1–6. IEEE, 2012.
[123] Michael A Vidulich, Michael Stratton, Mark Crabtree, and Glenn Wilson. Performance-
based and physiological measures of situational awareness.Aviation, Space, and Envi-
ronmental Medicine, 1994.
[124] Jacqueline Louise Petronella Wijsman.Sensing stress: stress detection from physiolog-
ical variables in controlled and uncontrolled conditions. PhD thesis, Twente University
Press, 2014.
[125] Peter Wittels, Bernd Johannes, Robert Enne, Karl Kirsch, and Hanns-Christian Gunga.
Voice monitoring to measure emotional load during short-term stress.European journal
of applied physiology, 87(3):278–282, 2002.
[126] Zongsheng Wu, Weiping Fu, Ru Xue, and Wen Wang. A novel line space voting method
for vanishing-point detection of general road images.Sensors, 16(7):948, 2016.

References 147
[127] Yasunari Yoshitomi, Sung-Ill Kim, Takako Kawano, and T Kilazoe. Effect of sensor
fusion for recognition of emotional states using voice, face image and thermal image
of face. InRobot and Human Interactive Communication, 2000. RO-MAN 2000. Pro-
ceedings. 9th IEEE International Workshop on, pages 178–183. IEEE, 2000.
[128] Zhihong Zeng, Jilin Tu, Ming Liu, Thomas S Huang, Brian Pianfetti, Dan Roth, and
Stephen Levinson. Audio-visual affect recognition.IEEE Transactions on multimedia,
9(2):424–428, 2007.
[129] Jing Zhai and Armando Barreto. Stress recognition using non-invasive technology. In
FLAIRS Conference, pages 395–401, 2006.


Appendix A
Mathematical functions of the
Pan-Tompkins algorithm
In this appendix, we detail the mathematical functions of the Pan-Tompkins algorithm.
• Low-Pass Filter
The difference equation of the low-pass filter is
y(nT) = 2y(nT−T)−y(nT−2T)+x(nT)−2x(nT−6T)+x(nT−12T) (A.1)
Here,T is the sampling period,x(nT) represent the n-th sample of the input andy(nT) is
the n-th sample of the output. The cutoff frequency of the filter is 12 Hz.
• High-Pass Filter
The difference equation of the high-pass filter is
y(nT) = 32x(nT−16T)− [y(nT−T)+x(nT)−x(nT−32T)] (A.2)
The cutoff frequency of the filter is 5 Hz.
• Derivative
The difference equation of derivation is
y(nT) = (1/8T)[−x(nT−2T)−2x(nT−T)+2x(nT+T)+x(nT+2T)] (A.3)

150 Mathematical functions of the Pan-Tompkins algorithm
• Squaring Function
The difference equation of squaring function is
y(nT) = [x(nT)]2 (A.4)
• Moving-Window Integration
The difference equation of integration is
y(nT) = (1/N)[x(nT− (N−1)T)+x(nT− (N−2)T)+ · · ·+x(nT)] (A.5)
Here,N is the number of samples in the integration window. In our implementation,N is
300.
• Adjusting the Thresholds
The thresholds are determined as follows:
SPKI= 0.125PEAKI+0.875SPKI (A.6)
NPKI = 0.125PEAKI+0.875NPKI (A.7)
THRESHOLD I1= NPKI+0.25(SPKI−NPKI) (A.8)
THRESHOLD I2= 0.5THRESHOLD I1 (A.9)
Here, PEAKI is the overall peak,SPKI is the running estimate of the signal peak and
NPKI is the running estimate of the noise peak.THRESHOLD I1 andTHRESHOLD I2 are
the thresholds and the higher of the two thresholds is applied as the threshold. The location of
the QRS complex is thus located by detecting of local maximum.

Appendix B
Publications related to the thesis
• International journals
1. B. Zhang, Y. Morere, L. Sieler, C. Langlet, B. Bolmont and G. Bourhis, “Stress recogni-
tion from heterogeneous data”, Journal of Image and Graphics, Vol. 4, No. 2, December
2016, p116-121.
2. B. Zhang, Y. Morere, L. Sieler, C. Langlet, B. Bolmont and G. Bourhis, (in press), "Re-
action Time and Physiological Signals for Stress Recognition", Journal of Biomedical
Signal Processing and Control (Elsevier), accepted for publication on May 1, 2017.
• International conferences
1. B. Zhang, Y. Morere, L. Sieler, C. Langlet, B. Bolmont and G. Bourhis, “Stress Recog-
nition from Heterogeneous Data,” International Conference on Biomedical Signal and
Image Processing (ICBIP), 2016.
2. B. Zhang, L. Sieler, Y. Morere, B. Bolmont and G. Bourhis, (in press), “Dedicated
wavelet QRS complex detection for FPGA implementation”, International Conference
on Advanced Technologies for Signal& Image Processing (ATSIP), 2017.

Résumé long de la thèse
• 1. Introduction
Dans la société moderne, le stress s’avère un problème omniprésent. Un stress permanent peut
entraîner divers problèmes mentaux et physiques notamment pour des personnes confrontées
à des situations d’urgence comme par exemple des pompiers en intervention: il peut modifier
leurs actions et les mettre en danger. Par conséquent, dans ce contexte, il est pertinent de
chercher à évaluer le stress de la personne. Sur la base de cette idée, a été proposé le pro-
jet Psypocket qui vise à concevoir un système portable capable d’analyser précisément l’état
de stress d’une personne en fonction de ses modifications physiologiques, psychologiques et
comportementales, puis de proposer des solutions de rétroaction pour réguler cet état. Cette
thèse s’inscrit dans le cadre de ce projet Psypocket. Nous y discutons de la faisabilité et de
l’intérêt de la reconnaissance du stress à partir de données hétérogènes.
• 2. Etat de l’art
Pour commencer, nous devons choisir les modalités de la reconnaissance de stress. Nous
avons analysé diverses expressions corporelles, telles que les réponses physiologiques, les
expressions faciales et la voix, et leurs potentiels pour évaluer le stress d’un individu.
Les mesures par les caractéristiques faciales (par exemple, les expressions faciales) et la
voix présentent des défauts inhérents. Le premier problème est que ces expressions peuvent
être contrôlées et si elles sont falsifiées par la personne pendant la mesure, les résultats de la
reconnaissance peuvent être assez éloignés de la vérité. Un autre problème est l’acquisition de
données. Les capteurs comme les caméras ou les microphones sont couramment utilisés pour
enregistrer de tels signaux. Ces capteurs sont normalement contraints par leur positionnement
et par des facteurs environnementaux. L’éclairage et le bruit de fond peuvent par exemple avoir
une incidence importante sur le résultat de reconnaissance. Dans un environnement hostile,
par exemple lorsque les pompiers interviennent dans une maison en feu, il est très difficile
d’utiliser une caméra.
Les mesures par des signaux physiologiques sont considérées comme plus fiables: les
réponses physiologiques, contrôlées par le système nerveux, sont spontanées. La personne

2
a moins d’influence sur ces réponses, de sorte que les résultatsde reconnaissance sont plus
fiables. De plus, il existe une variété de capteurs pour enregistrer les signaux physiologiques.
L’acquisition des signaux physiologiques est moins affectée par les conditions environnemen-
tales comme l’éclairage. Dans ce cas, ces signaux sont considérés comme un meilleur candidat
pour reconnaître l’état de stress individuel en temps réel. Par conséquent, les signaux physi-
ologiques sont adoptés comme signaux d’entrée de notre système de reconnaissance.
Nous avons choisi l’électrocardiographie (ECG), l’électromyographie (EMG) et l’activité
électrodermale (AED) comme signaux d’entrée. Ils présentent en effet certains avantages par
rapport à d’autres signaux comme la respiration et l’électroencéphalographie (EEG). Pour
surveiller la respiration, les sujets sont normalement obligés de porter une ceinture autour de
leur poitrine. Dans les applications réelles, ceci les contraint dans leurs activités régulières.
De même, l’interprétation du signal EEG est difficile dans l’environnement ambulatoire. Elle
est en effet affectée par les activités corporelles normales comme les mouvements de la tête
ou l’ouverture et la fermeture des yeux. Ceci est tout à fait important puisque nous visons à
un système capable de reconnaître les niveaux de stress dans la vie réelle. Les acquisitions de
l’ECG, de l’EMG et de l’AED doivent donc pouvoir être réalisées lorsque les sujets effectuent
des activités régulières en ambulatoire.
D’autre part, les études dans la littérature montrent qu’il existe une corrélation significative
entre le temps de réaction (TR) et l’état de stress. Ceci conduit à l’idée que non seulement les
signaux physiologiques, mais aussi le temps de réaction peuvent être utilisés pour reconnaître
le stress d’un individu. De plus, nous savons que pour les mesures à partir de signaux phys-
iologiques, le sujet doit être en contact avec les électrodes des capteurs pour enregistrer des
signaux. Par contre, l’enregistrement du temps de réaction n’est pas invasif puisque le sujet n’a
pas besoin d’être en contact physique permanent avec des capteurs. Cet enregistrement peut
être particulièrement intéressant dans le cadre d’une interaction homme-machine (IHM). Dans
certains cas, nous surveillons le stress d’un individu lorsqu’il effectue la tâche d’IHM et son
temps de réaction peut être directement mesuré. Par exemple, lorsqu’une personne tape sur un
clavier, son temps de réaction peut être directement déduit de la vitesse dactylographique. Par
conséquent, il paraît pertinent d’adopter le temps de réaction pour reconnaître l’état de stress
d’un individu. Cependant, peu d’attention a été accordée à l’utilisation du temps de réaction
pour la reconnaissance du stress. Ainsi, dans cette thèse, nous adoptons également le temps
de réaction comme signal d’entrée de notre système de reconnaissance.
• 3. Expérimentations pour l’acquisition des signaux
Ensuite, nous devons concevoir des expérimentations pour acquérir les signaux physiologiques
et le temps de réaction liés à l’état de stress. Le protocole expérimental vise à susciter dif-
férents états de stress du sujet à des périodes prédéterminées. Nous avons étudié les recherches

3
sur la reconnaissance de stress par des signaux physiologiques dans la littérature. Nous avons
constaté que généralement les performances de reconnaissance présentées sont liées à un seul
stresseur. Cependant, en réalité, il existe différents stresseurs. Étant donné que le système
Psypocket vise à être utilisé dans la vie réelle, il doit être conçu pour fournir de bonnes per-
formances de reconnaissance face à différents stresseurs.
Nous avons donc tout d’abord suscité le stress d’un individu à l’aide d’un bruit important.
Après le prétraitement des signaux physiologiques, nous avons analysé statistiquement les en-
registrements pour savoir si une différence significative de réponses physiologiques ou de TR
existe lorsque le sujet est soumis à un stress (émission du bruit) par rapport à l’état normal
(pas de bruit). Cependant, les résultats du test de Student ont montré que ni les réponses phys-
iologiques ni le TR ne présentaient de différence statistique significative entre l’état normal et
l’état stressant.
Pour notre deuxième dispositif expérimental, nous avons proposé deux nouvelles expéri-
mentations qui ont utilisé respectivement un stresseur visuel (test de Stroop) et un stresseur
auditif (induction acoustique). Ces facteurs de stress ont été utilisés comme stimulus de
stress physiologique dans un environnement de laboratoire contrôlé. Après le prétraitement
des signaux physiologiques, nous avons également analysé statistiquement les signaux phys-
iologiques et les TRs enregistrés lorsque le sujet est sous 3 différents niveaux de stress. Les
résultats du test de Student montrent que non seulement les signaux physiologiques, mais
aussi le TR présentent une différence statistique significative lorsque les sujets sont soumis
aux différents niveaux de stress.
• 4. Reconnaissance de stress
Ensuite, nous discutons de la faisabilité de la reconnaissance de stress à partir de données
hétérogènes. Non seulement les signaux physiologiques (ECG, EMG et AED), mais aussi
le temps de réaction sont adoptés pour reconnaître différents états de stress. Pour cela nous
proposons une approche basée sur un classifieur SVM (Machine à Vecteurs de Support).
Nous avons tout d’abord testé cette approche sur une base de données publiée. Elle con-
tient des signaux physiologiques comme le signal AED liés aux différents niveaux de stress
d’un conducteur. Les résultats du test ont montré que pour la discrimination entre la période de
stress faible et la période de stress élevée, les précisions de classification étaient supérieures à
88,5% pour dix conducteurs. De plus pour quatre conducteurs, les précisions de classification
ont atteint 100%. Ces précisions encourageantes ont montré qu’une bonne performance pour
reconnaître le niveau de stress peut être obtenue en utilisant notre approche.
Ensuite, les tests ont également été effectués sur les signaux physiologiques et le TR acquis
dans nos deux dispositifs expérimentaux pour la détection de stress. Pour le premier disposi-
tif, une bonne performance de reconnaissance n’a pas été atteinte. Les résultats ont montré

4
que le bruit n’est probablement pas assez fort pour induire un stress significatif. Pour le deux-
ième dispositif expérimental, en analysant les précisions de classification, nous avons constaté
qu’une performance de reconnaissance généralement bonne a été obtenue par le classifieur
SVM proposé.
Puis, nous avons proposé une approche de la fusion de décision pour la reconnaissance
de stress. Elle a été réalisée en fusionnant les résultats de classification des signaux physi-
ologiques et du TR. Nous avons constaté que la fusion de trois signaux physiologiques con-
duit à une meilleure performance que si seul un d’entre-eux est adopté pour la reconnaissance
de stress. De plus, la fusion de trois signaux physiologiques avec le TR conduit à une autre
amélioration de la précision de la classification. Ainsi, nous pensons que pour assurer une
bonne performance de reconnaissance, il est bénéfique de fusionner les données à partir de
sources hétérogènes.
En outre, nous avons considéré la situation où le signal AED est la seule source phys-
iologique disponible qui pourrait être utilisée. En analysant le cas où la reconnaissance a
été réalisée par la fusion du signal AED et du TR, nous avons observé que dans ce cas, les
précisions de classification sont encore supérieures à 80,0% pour la plupart des sujets. Cela
montre que dans la situation où les trois signaux physiologiques ne sont pas tous disponibles,
l’approche de la fusion de décision peut tout de même apporter des performances de reconnais-
sance satisfaisantes. Ces résultats de test renforcent la conviction qu’il est possible d’adopter
les données provenant de sources hétérogènes pour la reconnaissance de stress.
• 5. Implémentation du traitement de signal
Enfin, nous avons discuté de la faisabilité du système embarqué pour réaliser la chaîne glob-
ale de traitement des signaux. Le traitement de la reconnaissance de stress est composé du
prétraitement de l’EMG, du calcul du rythme cardiaque basé sur l’ECG et du traitement de la
classification (extraction de caractéristiques, classification SVM et fusion de décision). Deux
approches d’implémentation, un appareil mobile Android et un circuit FPGA sont analysés.
Les résultats de l’analyse montrent que, par rapport à l’appareil mobile Android, le FPGA est
plus adapté pour réaliser la chaîne globale de traitement.
En outre, nous avons implémenté le bloc de calcul HR basé sur l’ECG dans le FPGA.
L’implémentation a adopté le schéma de Transformée en ondelettes de Haar en nombres en-
tiers (IHT) pour le filtrage des signaux ECG et une stratégie de recherche maximale pour
détecter l’emplacement du pic R du complexe QRS. Les résultats des tests montrent que
l’architecture FPGA proposée peut atteindre une précision de détection élevée. En termes
de performance matérielle, le système occupe seulement 8% de ressources de silicium et la
fréquence de fonctionnement maximale (l’horloge système) est de 183,65 MHz. Ainsi, il

5
existe encore suffisamment de ressources de silicium pour implémenter les processus de re-
connaissance suivants dans la puce cible.
Les calculs du filtrage et de l’extraction des caractéristiques nécessitent des opérations
arithmétiques telles que l’addition, la soustraction, la multiplication, la division et la racine
carrée. Ces opérations peuvent être implémentées dans le FPGA avec une approche rapide
et efficace. Les recherches dans la littérature ont montré que le SVM peut être implémenté
dans un FPGA. La fusion de la décision avec la méthode de vote peut être mise en œuvre en
utilisant un compteur. Une fois que la chaîne globale de traitement est implémentée dans le
FPGA, un système embarqué pour la reconnaissance de stress peut être finalisé.
• 6. Conclusion et perspectives
Cette thèse contribue donc à la conception d’un système portable de reconnaissance du stress
d’une personne en temps réel en adoptant des données hétérogènes, en l’occurence les signaux
physiologiques et le temps de réaction.
Notre travail futur peut être segmenté en plusieurs directions. La perspective à court terme
consiste à compléter l’implémentation de la chaîne globale de traitement de reconnaissance.
Une fois que l’implémentation sera atteinte, nous pourrons évaluer si la précision de classi-
fication de l’implémentation matérielle est aussi bonne que celle de l’implémentation logi-
cielle. De plus, nous pourrons déterminer si une bonne performance matérielle peut être
obtenue. Tous ces efforts contribuent à constituer un système central de reconnaissance pour
l’évaluation du stress. En le connectant à un réseau de capteurs pour l’acquisition du signal,
un module pour la transmission du signal et un module indicateur pour afficher directement
les niveaux de stress, le système portable de reconnaissance de stress proposé par le projet
Psypocket peut être envisagé.
La perspective à moyen terme est l’utilisation de psypocket dans des situations réelles. Le
système a d’abord été conçu pour analyser le stress des sujets dans des situations d’urgence.
Certaines de ces situations seront évaluées. Pour atteindre cet objectif, nous pouvons utiliser
les stresseurs dans la réalité et proposer de nouveaux tests. De cette façon, nous pourrons
déterminer si notre stratégie de la reconnaissance de stress peut atteindre une performance
généralement bonne face à des stresseurs divers.

Résumé de la thèse
Dans la société moderne, le stress s’avère un problème omniprésent. Un stress permanent peut
entraîner divers problèmes mentaux et physiques notamment pour des personnes confrontées
à des situations d’urgence comme par exemple des pompiers en intervention: il peut modifier
leurs actions et les mettre en danger. Par conséquent, dans ce contexte, il est pertinent de
chercher à évaluer le stress de la personne. Sur la base de cette idée, a été proposé le pro-
jet Psypocket qui vise à concevoir un système portable capable d’analyser précisément l’état
de stress d’une personne en fonction de ses modifications physiologiques, psychologiques et
comportementales, puis de proposer des solutions de rétroaction pour réguler cet état.
Cette thèse s’inscrit dans le cadre du projet Psypocket. Nous y discutons de la faisabilité
et de l’intérêt de la reconnaissance du stress à partir de données hétérogènes. Non seulement
les signaux physiologiques, tels que l’électrocardiographie (ECG), l’activité électrodermale
(EDA) et l’électromyographie (EMG), mais aussi le temps de réaction (RT) sont adoptés pour
discriminer différents états de stress d’une personne. Pour cela nous proposons une approche
basée sur un classifieur SVM (Machine à Vecteurs de Support). Les résultats obtenus montrent
que le temps de réaction peut-être un moyen d’estimation du niveau de stress de l’individu en
complément ou non des signaux physiologiques. En outre, nous discutons de la faisabilité
d’un système embarqué à même de réaliser la chaîne globale de traitement des signaux. Cette
thèse contribue donc à la conception d’un système portable de reconnaissance du stress d’une
personne en temps réel en adoptant des données hétérogènes, en l’occurence les signaux phys-
iologiques et le temps de réaction.

Summary of thesis
In modern society, the stress of an individual has been found to be a common problem. Con-
tinuous stress can lead to various mental and physical problems and especially for the people
who always face emergency situations (e.g., fireman): it may alter their actions and put them
in danger. Therefore, it is meaningful to provide the assessment of the stress of an individual.
Based on this idea, the Psypocket project is proposed which is aimed at making a portable
system able to analyze accurately the stress state of an individual based on his physiological,
psychological and behavioural modifications. It should then offer solutions for feedback to
regulate this state.
The research of this thesis is an essential part of the Psypocket project. In this thesis,
we discuss the feasibility and the interest of stress recognition from heterogeneous data. Not
only physiological signals, such as Electrocardiography (ECG), Electromyography (EMG)
and Electrodermal activity (EDA), but also reaction time (RT) are adopted to recognize differ-
ent stress states of an individual. For the stress recognition, we propose an approach based on
a SVM classifier (Support Vector Machine). The results obtained show that the reaction time
can be used to estimate the level of stress of an individual in addition or not to the physiologi-
cal signals. Besides, we discuss the feasibility of an embedded system which would realize the
complete data processing. Therefore, the study of this thesis can contribute to make a portable
system to recognize the stress of an individual in real time by adopting heterogeneous data
like physiological signals and RT.