strengthening the value chain for … · 5/12/2010 · strengthening the value chain for...
TRANSCRIPT

STRENGTHENING THE VALUE CHAIN FOR SUSTAINABLE COFFEE
IN CENTRAL AMERICA AND SOUTHERN MEXICO
IMPACT ASSESSMENT REPORT
NESPRESSO PROGRAM IN GUATEMALA AND MEXICO
PROJECT COMPONENT I: IMPROVING SUSTAINABLE PRACTICES
MARIA VERONICA GOTTRET, CATIE
WITH CONTRIBUTIONS FROM MARIO BARBOZA
5 December 2010

1
1. EXECUTIVE SUMMARY The project “Strengthening the value chain for sustainable coffee in Central America and Southern Mexico” has been in its implementation phase since March 2007, through a partnership among the International Finance Corporation (IFC) Office for Advisory Services in Latin America and the Caribbean, ECOM Agroindustrial Corp. Ltd., Nestlé, Rainforest Alliance, and CIRAD. This project contributed to the Nespresso value chain by improving access to information and knowledge on coffee production, quality management and traceability, as well as for complying with the Nespresso Sustainable Quality Program™ social and environmental standards. This has been done via training workshops, farm visits, and producer exchange visits, contributing to the improvement of human resources. In addition, the project contributed to improved access to financial resources by lending money to ECOM, which in turn lends money to coffee producers in order to facilitate de adoption of improved cropping practices, as well as quality, environmental and social practices to comply with the Nespresso Program requirements. As such, the project was expected to benefit coffee producers by improving their human and financial resources. By doing this, it aimed that coffee producers will improve their productivity, at the same time that they will comply with the Nespresso Program requirements, benefiting with the price premium offered by the program. This report presents the impact assessment findings for the Nespresso Program in the clusters of Huehuetenango, Guatemala, and Ixhuatlán del Café, Mexico. Impact was assessed based on baseline data collected and analyzed for the 2007-2008 coffee cropping cycle and data collected and analyzed for the 2009-2010 coffee cropping cycle. The sample included 87 participating and 122 non-participating coffee producers of the Nespresso cluster of Guatemala, and 156 participating and 126 non-participating coffee producers of the Nespresso cluster of Mexico. Thus, this report evaluates the economic impacts, and to the extent that it is feasible, the social and environmental impacts of the project for the Nespresso – ECOM value chain from a total sample of 491 coffee producers that were surveyed in both clusters during 2008 and 2010. Significant differences were found in the demographic characteristics of coffee producers who participate in the Nespresso Program with respect to non-participants. However, this is not a sample or design problem, but also a result of the evaluation. In average, producers who participate in the program have a better access to resources such as land and larger coffee plantations. This in part is related to the intentional selection made by ECOM of larger producers with more resources to participate in the program, as it is easier for them to comply with the Nespresso Program requirements and pass the verification process. The finding around the five hypotheses established for the assessment follows:

2
HYPOTHESIS 1
Net benefits (price differential, productivity increases, cost reduction) received by coffee producers that participate in the Nespresso AAA – ECOM value chain is greater than the investment required to access this value chain.
Following world coffee price trends, coffee prices in the Nespresso clusters of Guatemala and Mexico have significantly increase (α=0.0006 and α=0.0000, respectively) since 2006-07 for participating and non-participating producers at an annual average rate of 8.5% and 21.2%, respectively.
Producers who participate in the Nespresso Program in Guatemala received a price differential that result in a significantly higher price (α=0.0000) for participating producers. However, this price differential at the farmer level has been decreasing from US$ +6.6/qq to US$ +4.8/qq, in average.
Participating producers in Mexico only started to receive a positive and significant price differential during the 2009-10 and it was relatively low (+ US$ 2) and the four-year price differential average (2006-2010) was only +US$ 0.08, at the same time that coffee prices have been increasing over time for both groups at an annual average rate of 21.2%.
The upward global trends in coffee prices, and to a lesser extent, the Nespresso price differentials, have compensated extra costs and investments required for participating in the Program.
However, net benefits of producers who participate in the Nespresso Program are not significantly different than those of non-participating producers, as productivity has not (yet) improved. Productivity may be expected to improve, given the investments that producers are doing for re-planting and renewing their coffee plantations, as well as in their maintenance.
As a result, given the actual productivity levels and the low improvements in it, price incentives are not enough for the sustainability of the Nespresso Program, and an extra effort needs to be placed in improving productivity, and therefore producers‟ net income.
Conclusion on Hypothesis 1 Given the above cost-benefit analysis between producers who participate in the Nespresso Program and those who do not participate, we reject hypothesis 1, as net benefits that result from the price differential received by coffee producers only compensates for the investment required to access this value chain. Therefore, net benefits received by coffee producers that participate in the Nespresso AAA – ECOM value chain are not greater, but equal to the investment required to access this value chain. This may change in the future as investment in re-planting and renewing coffee plantations, as well as in the better maintenance of coffee plantations, will probably result in productivity improvements in the next two years as those changes take time.

3
HYPOTHESIS 2
Farmers with better access to resources (human, social, economic/financial, natural, physical) will benefit the most from participating in the Nespresso AAA – ECOM value chain.
Access to natural resources that influence coffee productivity, such as soil fertility, water availability and coffee plantation shadow, influence the level of net benefits of producers who participate in the Nespresso Program.
In addition, access to human resources, assessed by the number of family members who work on coffee-related activities, years of formal education and age of coffee plantation, as well as access to technical assistance have had a significant and positive influence on net coffee income.
Both resources are mainly influencing the possibility to benefit from participating in the Nespresso Program by influencing net income via its effect on coffee productivity.
Conclusion on Hypothesis 2 Based on the analysis on how access to human, social, economic/financial, natural and physical resources influences the possibility of coffee producers to benefit from their participation in the Nespresso value chain, we partially accept hypothesis 2, as access to natural and human resources improves the possibilities of coffee producers of benefiting from participating in this value chain. This reinforces the importance of improving productivity for benefiting from participating in the Nespresso Program as it is highly related with knowledge and experience on coffee production, as well as with the endowment of natural resources.
HYPOTHESIS 3
The Nespresso AAA – ECOM value chain contributes to quality employment generation in its territories of influence
Coffee producers who participate in the Nespresso Program are contributing to employment generation in their territory of influence, mainly temporal employment, as well as more jobs for women and youth, as coffee producers who participate in the program are hiring more external labor than those who do not participate in the program.
Employment of children is very low among participating and non-participating producers, and the tendency among both groups of producers is to maintain this unchanged.
In addition to hired labor, coffee-related activities are providing employment for family labor (two to three family members per producer), but there is no difference

4
between participating and non-participating producers in the number of family members employed in coffee-related activities.
The Nespresso Program is also contributing to employment quality as a higher percentage of producers who participate in the Program offer basic non-wage benefits to workers, such as access to potable water, sanitary facilities, proper housing, and basic health services.
However, initial positive wage differences among producers who participate in the Nespresso Program, compared with those paid by producers who do not participate in the program during the 2007-08 production cycle, disappeared in the 2009-10 production cycle.
Conclusion on Hypothesis 3 Based on the analysis on employment generation, day-wages paid, and basic non-wage benefits offered by coffee producers, we partially accept hypothesis 3, as coffee producers who participate in the Nespresso value chain are generating more employment than non-participants, at the same time that a higher percentage of participating producers are offering basic non-wage benefits than non-participants. However, initial positive wage differences offered by participating producers disappeared in the 2009-10 production cycle, most probably as a response to the pressure to reduce costs.
HYPOTHESIS 4: ENVIRONMENTAL IMPACT
The Nespresso AAA - ECOM value chain contributes to improved environmental management in its territories of influence.
The adoption of natural resource conservation practices (water, soil and forest conservation practices) has been significantly higher in the Guatemala than in the Mexico cluster.
However, in both clusters, the Nespresso Program is motivating the adoption of these practices as there is a higher percentage of coffee producers who participate in the Nespresso Program in Guatemala and Mexico that apply soil (+17.7% and +8.4%, respectively) and forest conservation practices (+7.9% and +10%, respectively).
In the case of Guatemala, there is also a higher percentage of participating producers who apply water conservation and management practices (+31.2%), and who treat residual waters (+21.4%). It is also important to note that in the case of Mexico, almost none of the producers treat residual waters from milling activities as they do not wet mill their coffee in the farm, but sells their coffee as cherry.

5
In addition, the percentage of producers in both clusters who apply natural resource conservation practices have been increasing over the analyzed period, with the exception of the application of forest conservation practices.
Conclusion on Hypothesis 4 Based on the analysis on the adoption of soil, water and forest conservation practices, we accept hypothesis 4, as a higher percentage of coffee producers who participate in the Nespresso value chain are applying these natural resource conservation practices, and therefore, are contributing to an improved environmental management in their territories of influence. The project contributed to this impact by supporting producers to comply with the environmental standards of the Nespresso Program.
HYPOTHESIS 5: TYPE OF RELATIONS AMONG VALUE CHAIN ACTORS
Relations among actors who participate in the Nespresso AAA - ECOM value chain are more transparent and power is more balanced than relations among actors who participate in the Conventional-ECOM supply chain, resulting on positive benefits for coffee producers from these relations.
The percentage of coffee producers who participate in the Nespresso Program that interact with Atlantic (ECOM exporter companies that collect and export coffee for the 4C value chain) is significantly larger than among those who do not participate in the program.
Producers, who relate with Export Café and AMSA, whether or not they participate in the Nespresso Program, do so for the main purpose of commercializing their produce. However, as producers who participate in the Nespresso Program also receive other complementary services, results show that there are a significant larger percentage of coffee producers who participate in the program that also relate with the exporter company to access other services that are crucial to obtain the required verification to participate in the program.
In the case of the Guatemala cluster, the percentage of coffee producers who participate in the Nespresso Program that interact with coffee producer organizations is also significantly larger than among those who do not participate in the program (50.6% vs. 23.4%), as most coffee producers who participate in the Nespresso Program does that via their producer organizations and not individually. Only larger non-organized producers relate directly with Export Café (ECOM in Guatemala.
Coffee producers perceive that they have better governance in the Nespresso value chain than in the conventional coffee supply chain as relations are longer-term and more stable. In addition, a higher percentage of coffee producers feel that power is

6
more balanced as they perceive that they have at least a medium-level of negotiation power with Export Café or AMSA (ECOM).
As a result of the above, a significantly higher percentage of coffee producers who participate in the Nespresso Program consider that they have benefited from relating with Export Café or AMSA (ECOM), although the percentage who agree with this is lower in the Nespresso cluster of Mexico.
Conclusion on Hypothesis 5 Given the above analysis on the relations among actors who participate in the Nespresso value chain, we accept hypothesis 5, as a higher percentage of coffee producers who participate in the Nespresso value chain perceive that they have a longer-term and more stable relation with ECOM, they have at least a medium level of negotiation power in the relation, and that they have benefited from this relation. This is also the case in Guatemala with respect to producer organizations that intermediate the relation between ECOM and coffee producers. Thus, the project contributed to a better governance of coffee producers in the value chain by strengthening their capabilities to effectively participate in the value chain.

7
2. BACKGROUND Nestlé Nespresso launched the Nespresso Sustainable Quality Program™ (also called AAA) to help producers improve their practices; achieving better quality and sustainable coffee, using a tool called TASQ™. The program was designed to reassure Nespresso consumers that the highest agricultural and social standards and practices are being followed in origin countries and to increase farmers‟ loyalty to Nespresso through transparent trading conditions. As part of the program, Nespresso pays a premium for purchased coffee. The project “Strengthening the value chain for sustainable coffee in Central America and Southern Mexico” has been in its implementation phase since March 2007, through a partnership among the International Finance Corporation (IFC) Office for Advisory Services in Latin America and the Caribbean, ECOM Agroindustrial Corp. Ltd., Nestlé, Rainforest Alliance, and CIRAD. Via the project, Rainforest Alliance and ECOM worked with four producer „clusters‟ in Mexico, Guatemala and Costa Rica (two). The clusters were introduced to the TASQ™ Self Assessment tool, and provided with technical assistance through workshops and farm visits. Annually, farms are inspected by ECOM and then verified by Rainforest Alliance. Producers are graded on four levels; deficient, basic, emerging and advanced. This feeds into an overall rating for the cluster, which then is used to determine the technical assistance needs for the following year. Specific interventions include:
Development of annual action plans, aimed at deficient practices indentified during verification;
Execution of workshops, events and farm visits in accordance with the action plan. Topics include maintaining quality, basics of cupping, waste management, handling and use of agrochemicals, erosion prevention, cost registration, elaboration of compost, organizing of storage rooms, and coffee renovation;
Annual Rainforest Alliance verification;
Producer exchange visits (Mexican producers visited Guatemala);
Development of materials for farmers – posters, flyers, booklets, etc. on the importance of sustainable best practices.
Thus, the project contributed to the Nespresso value chain by improving access to information and knowledge on coffee production, quality management and traceability, as well as for complying with the Nespresso Sustainable Quality Program™ social and environmental standards. This has been done via training workshops, farm visits, and producer exchange visits, contributing to the improvement of human resources. In addition, the project contributed to improved access to financial resources by lending money to ECOM, which in turn lends money to coffee producers in order to facilitate de adoption of improved cropping practices, as well as quality, environmental and social practices to comply with the Nespresso Program requirements. As such, the project was expected to benefit coffee producers by improving their human and financial resources. By doing this, it aimed
8
that coffee producers will improve their productivity, at the same time that they will comply with the Nespresso Program requirements, benefiting with the price premium offered by the program. This document presents the impact assessment report for the Nespresso Program in the clusters of Huehuetenango, Guatemala, and Ixhuatlán del Café, Mexico. This report is based on baseline data collected and analyzed for the 2007-2008 coffee cropping cycle from a sample of participating and non-participating coffee producers, and data collected and analyzed for the 2009-2010 coffee cropping cycle. This report evaluates the economic impacts, and to the extent that it is feasible, the social and environmental impacts of the project for the Nespresso – ECOM value chain. The main question to be answered by the analysis is:
What is the rate of return to the investment that coffee producers have to incur for entering the Nespresso AAA – ECOM value chains, and the non-monetary benefits
that they received by accessing these value chains? This report presents the main findings on the impact assessment of the Nespresso Program in Guatemala and Mexico, following the five hypotheses stated in the M&E Design Document.
2.1 Analytical Framework
Given that the objective of the project “Strengthening the value chain for sustainable coffee in Central America and Southern Mexico” was to increase the income (shared value) of coffee farmers in Central America and Southern Mexico, included in the Nespresso AAA – ECOM, the Project M&E System designed and established through this consultancy considered in particular the direct economic impact to farmers. Thus, the M&E System aimed to assess impact at two levels:
(1) Among participating and non-participating farmers in two selected Nespresso clusters in the region: Ixhuatlan del Café in Mexico; and Huehuetenango in Guatemala.
(2) Along the value chain, differentiated by business model (Nespresso AAA - ECOM value chain and Conventional-ECOM supply chain), as the hypothesis is that the business model influences how chain actors relate, and therefore, how profits are distributed among them, as well as the overall competitiveness of the chain.
Therefore, the evaluation proposed aimed to assess impacts between participating and non-participation farmers in the selected clusters, and along the supply/value chain, where products, resources and information flow. Although the supply/value chain is rooted in the territory, as we move along it, the number of market chain actors involved as well as the product value increases. In addition, those actors that shape the chain governance and institutions, as well as public and private policies that provide an enabling (or disabling) environment for the development of the value chain, influence how value chain profits are distributed along the different market chain actors.

9
2.1.1 Farmer and local level impact
Monitoring and evaluation in the selected Nespresso clusters focused on assessing the costs and benefits of adopting prescribed sustainable practices or subscribing to the AAA Nespresso Sustainability Program on participating vs non-participating coffee producers, such as changes in farm management practices, market access, and farm income, among the most important. However, as the AAA Nespresso Sustainability Program establishes social and environmental standards aimed to have impact in the territories where participating producers develop their activities; the proposed M&E system also assessed those impacts. Moreover, the M&E system will also analyzed the extent that ex-ante access to human, social, physical, economic/financial and natural resources influences the capacity of coffee farmers to participate in the Nespresso Program and their net benefits, affecting at the same time ex-post access to these resources. For comparison purposes, costs and benefits will also be estimated of a sample of producers that commercialize their coffee through ECOM but in mainstream coffee markets, but have their plantations in the same territories as participating farmers (with the same agro ecological potential) and with similar access to resources.
2.1.2 Chain impact
Impact along the value chain was assessed by analyzing chain governance as the hypothesis was that this influences chain competitiveness, commercial sustainability, and its contribution to local economic growth. For this purpose, chain governance was defined as “the authority and power relationships that influence decision-making among chain actors and determine the manner in which financial, economic and human resources flow and are localized among chain actors.” Chain governance matters because lead market-chain actors govern market access, set product standards, and develop suppliers‟ capabilities, and this has implications on the distribution of profits among the different chain actors. To evaluate the Nespresso AAA value chains governance, the established M&E System compared this value chain with the conventional coffee supply chain, rooted in the same territory. To assess chain governance, coffee producer relations with key value chain actors was assessed by looking at whether they interact directly with these key value chain actors, the purpose of this relation, the type of relation (specified by whether this is a sporadic, short or long-term and stable relation), the perceived negotiation power of coffee producers in relation with these key value chain actors, as well as the perceived benefits of this relation. Coffee farmers‟ power is defined as their capacity to influence decision-making among chain actors and determine the manner in which financial, economic and human resources flow and are localized among chain actors.
2.2 Sampling Procedure for the Nespresso AAA Program Assessment
A sample of coffee producers participating in the Nespresso AAA Sustainable Quality Program in Ixhuatlán, Veracruz, Mexico; and Huehuetenango, Guatemala was taken. This sample was compared with a sample of coffee producers, who are ECOM clients, have their coffee plantation in the same region as those producers who participate in the Nespresso AAA Sustainable Quality Program and with similar agro-ecological conditions for producing

10
high quality coffee, but who do not participate in the Program. In addition, participating producers were differentiated according with the year that they entered the program. Thus, coffee producers were classified in four groups defined as follows:
Group 1: Includes coffee producers who are ECOM clients in Mexico (AMSA) and Guatemala (Export Café), and participate in the Nespresso AAA Sustainable Quality Program since the coffee harvest 2006-2007.
Group 2: Includes coffee producers who are ECOM clients in Mexico (AMSA) and Guatemala (Export Café), and participate in the Nespresso AAA Sustainable Quality Program since the coffee harvest 2007-2008.
Group 3: Includes coffee producers who are ECOM clients in Mexico (AMSA) and Guatemala (Export Café), and participate in the Nespresso AAA Sustainable Quality Program since the coffee harvest 2008-2009.
Group 4: Coffee producers, who are ECOM clients in Mexico (AMSA) and Guatemala (Export Café), have their coffee plantation in the same region as those producers who participate in the Nespresso AAA Sustainable Quality Program and with similar agro-ecological conditions for producing high quality coffee, but who do not participate in the Program (Control Group).
2.2.1 Sampling in the Nespresso Cluster of Guatemala
Table 1 presents the population size per municipality and group for the Nespresso cluster of Huehuetenango, Guatemala, as well as the sample size taken for the baseline data collection conducted for the 2007-08 cropping cycle, with a 95% confidence level, and a margin error
of 5%, based on the variance of coffee productivity on the population of participating farmers. Discontinuous variables were estimated with a 95% confidence level, and a smaller
margin error of 3% under the conservative assumption of maximum possible variance in the categorical variables estimate. The total sample size was estimated using a random sample, which was then allocated to each group and municipality proportionally to its population size. For the ex-post survey conducted at the end of the 2009-10 cropping cycle the same producers were interviewed. However, in the case of the Nespresso cluster of Guatemala some of the participating producers in 2007-08 cropping cycle decided to quit de program and some of those that planned to participate since the 2008-09 cropping cycle did not participate. As such, a column has been added to Table 1 with the distribution of the sample among the groups and municipalities. Thus, the final sample included 122 producers who do not participate in the Nespresso Program (control group) and 87 who do participate, for a total of 209 surveyed producers. As information about the control group of non-participating farmers was not available, an equal number of non-participating producers as of participating producers were interviewed.

11
Table 1 Stratification design and sample size used to evaluate the impact of participating in the
Nespresso AAA – ECOM value chain Huehuetenango, Guatemala
Strata Municipality Population
Size
Baseline Sample
Size
Ex-post Sample
Size
Group 1: Coffee producers, who are clients of ECOM in Guatemala (Export Café), and participate in the Nespresso AAA Sustainable Quality Program since the coffee harvest 2006-2007
Cuilco 8 2 2
La Democracia & La Libertad 22 7 5
San Antonio Huista 26 1 1
San Pedro Nectá 15 3 3
Santiago Chimaltenango 25 8 0
Unión Cantinil 36 11 11
Total Group 1 132 32 22
Group 2: Coffee producers, who are clients of ECOM in Guatemala (Export Café), and participate in the Nespresso AAA Sustainable Quality Program since the coffee harvest 2007-2008
Cuilco 31 8 7
La Democracia & La Libertad 32 11 11
San Antonio Huista 3 1 1
San Pedro Nectá 3 1 1
Santiago Chimaltenango 20 4 0
Unión Cantinil 64 12 12
Total Group 2 153 37 32
Group 3: Coffee producers, who are clients of ECOM in Guatemala (Export Café), and will participate in the Nespresso AAA Sustainable Quality Program since the coffee harvest 2008-2009
Cuilco 43 10 10
La Democracia & La Libertad 53 13 13
San Antonio Huista 0 1 1
San Pedro Nectá 44 9 8
Santiago Chimaltenango 0 1 0
Unión Cantinil 4 1 1
Total Group 3 144 35 33
Group 4: Coffee producers, who are ECOM clients in Guatemala (Export Café), have their coffee plantation in the same region as those producers who participate in the Nespresso AAA Sustainable Quality Program and with similar agro-ecological conditions for producing high quality coffee, but who do not participate in the Program (Control Group)
Cuilco
16 17
La Democracia & La Libertad 31 33
San Antonio Huista 2 2
San Pedro Nectá 13 14
Santiago Chimaltenango 15 28
Unión Cantinil 28 28
Total Group 4 NA a 105 122
Total NA 209 209
a NA = not available
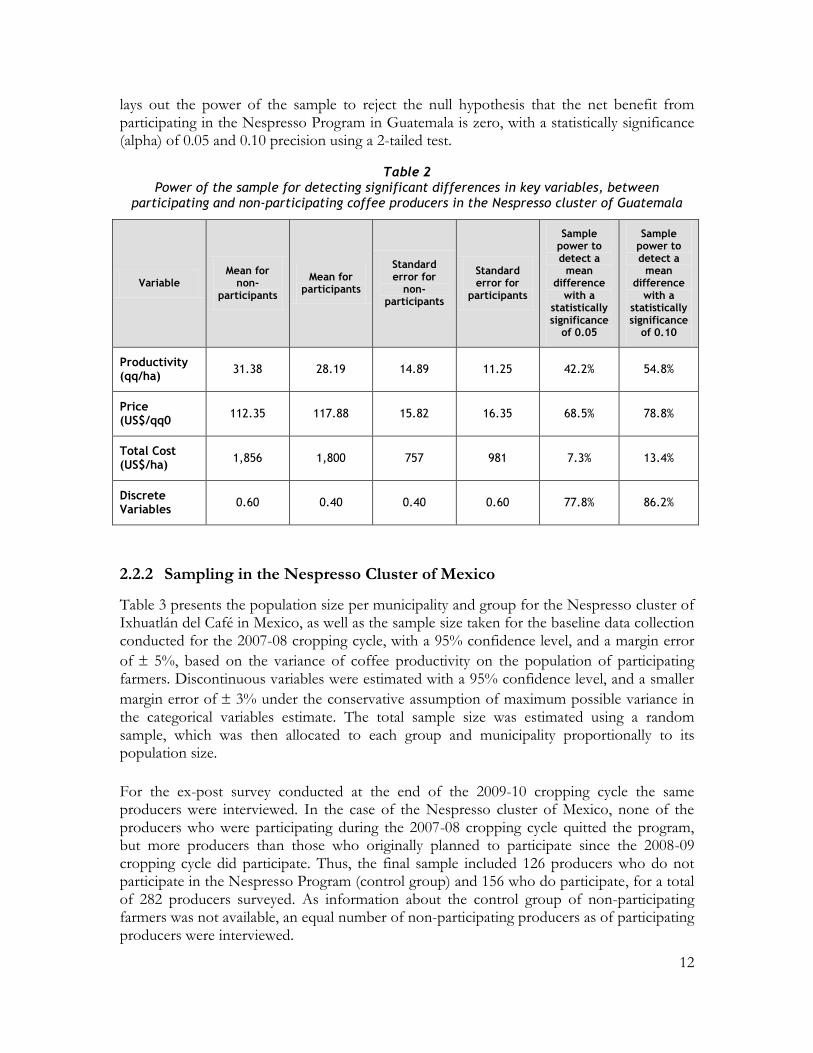
Given the estimated within-group means and the standard deviations for the three key continuous variables (productivity, total costs and price) and the actual sample sizes, Table 2
12
lays out the power of the sample to reject the null hypothesis that the net benefit from participating in the Nespresso Program in Guatemala is zero, with a statistically significance (alpha) of 0.05 and 0.10 precision using a 2-tailed test.
Table 2
Power of the sample for detecting significant differences in key variables, between participating and non-participating coffee producers in the Nespresso cluster of Guatemala
Variable Mean for
non-participants
Mean for participants
Standard error for
non-participants
Standard error for
participants
Sample power to detect a
mean difference
with a statistically significance
of 0.05
Sample power to detect a
mean difference
with a statistically significance
of 0.10
Productivity (qq/ha)
31.38 28.19 14.89 11.25 42.2% 54.8%
Price (US$/qq0
112.35 117.88 15.82 16.35 68.5% 78.8%
Total Cost (US$/ha)
1,856 1,800 757 981 7.3% 13.4%
Discrete Variables
0.60 0.40 0.40 0.60 77.8% 86.2%
2.2.2 Sampling in the Nespresso Cluster of Mexico
Table 3 presents the population size per municipality and group for the Nespresso cluster of Ixhuatlán del Café in Mexico, as well as the sample size taken for the baseline data collection conducted for the 2007-08 cropping cycle, with a 95% confidence level, and a margin error
of 5%, based on the variance of coffee productivity on the population of participating farmers. Discontinuous variables were estimated with a 95% confidence level, and a smaller
margin error of 3% under the conservative assumption of maximum possible variance in the categorical variables estimate. The total sample size was estimated using a random sample, which was then allocated to each group and municipality proportionally to its population size.
For the ex-post survey conducted at the end of the 2009-10 cropping cycle the same producers were interviewed. In the case of the Nespresso cluster of Mexico, none of the producers who were participating during the 2007-08 cropping cycle quitted the program, but more producers than those who originally planned to participate since the 2008-09 cropping cycle did participate. Thus, the final sample included 126 producers who do not participate in the Nespresso Program (control group) and 156 who do participate, for a total of 282 producers surveyed. As information about the control group of non-participating farmers was not available, an equal number of non-participating producers as of participating producers were interviewed.

13
Table 3 Stratification design and sample size to evaluate the impact of participating in the Nespresso
AAA – ECOM value chain in Ixhuatlán del Café, Mexico
Strata Region Population
Size
Baseline Sample
Size
Ex-post Sample
Size
Group 1: Coffee producers, who are clients of ECOM in Mexico (AMSA), and participate in the Nespresso AAA Sustainable Quality Program since the coffee harvest 2006-2007
Cordoba 81 25 25
Coscumatepec 0 0 0
Fortin 4 2 2
Ixhuatlán del Café 66 24 24
Tepatlaxco 0 1 1
Tomatlán 5 7 7
Total Group 1 156 59 59
Group 2: Coffee producers, who are clients of ECOM in Mexico (AMSA) and participate in the Nespresso AAA Sustainable Quality Program since the coffee harvest 2007-2008
Cordoba 277 12 12
Coscumatepec 0 0 0
Fortin 181 9 9
Ixhuatlán del Café 559 25 25
Tepatlaxco 106 5 5
Tomatlán 122 3 3
Total Group 2 1,245 54 54
Group 3: Coffee producers, who are clients of ECOM in Mexico (AMSA) and will participate in the Nespresso AAA Sustainable Quality Program since the coffee harvest 2008-2009
Cordoba 85 6 15
Coscumatepec 14 4 4
Fortin 0 0 7
Ixhuatlán del Café 196 6 6
Tepatlaxco 159 9 7
Tomatlán 61 3 4
Total Group 3 515 28 43
Group 4: Coffee producers, who are ECOM clients in Mexico (AMSA), have their coffee plantation in the same region as those producers who participate in the Nespresso AAA Sustainable Quality Program and with similar agro-ecological conditions for producing high quality coffee, but who do not participate in the Program (Control Group)
Cordoba
41 32
Coscumatepec 4 4
Fortin 11 4
Ixhuatlán del Café 60 60
Tepatlaxco 11 13
Tomatlán 14 13
Total Group 4 NA a 141 126
Total 1,916 282 282
a NA = not available
Given the estimated within-group means and the standard deviations for the three key continuous variables (productivity, total costs and price) and the actual sample sizes, Table 4

14
lays out the power of the sample to reject the null hypothesis that the net benefit from participating in the Nespresso Program in Mexico is zero, with a statistically significance (alpha) of 0.05 and 0.10 precision using a 2-tailed test.
Table 4 Power of the sample for detecting significant differences in key variables, between
participating and non-participating coffee producers in the Nespresso cluster of Mexico
Variable Mean for
non-participants
Mean for participants
Standard error for
non-participants
Standard error for
participants
Sample power to detect a
mean difference
with a statistically significance
of 0.05
Sample power to detect a
mean difference
with a statistically significance
of 0.10
Productivity (qq/ha)
10.73 11.80 7.12 7.93 22.2% 32.8%
Price (US$/qq0
94.88 96.10 15.18 15.93 10.1% 17.2%
Total Cost (us$/ha)
1,025 1,102 584 602 19.2% 29.1%
Discrete Variables
0.60 0.40 0.40 0.60 90.1% 94.6%
As non-sampling error is difficult to predict and has no simple relationship to sample design, but adequate training, supervision and follow-up of contracted enumerators was given by CATIE and ECOM personnel in each working region to minimize this error. Anyhow, small samples were preferred to large ones, to the extent that this was possible, since once the sample size rises into the hundreds it is likely that efforts toward more thorough training and supervision of enumerators will have a better pay off than equivalent expenditures to enlarge the sample.
3. CLUSTER CHARACTERIZATION
3.1 Basic Demographic Characteristics
To assess differences among non-participant and participant coffee producers in the Nespresso clusters of Guatemala and Mexico, Tables 5 and 6 summarizes basic demographic characteristics of both groups. By demographic variables we mean variables that are not expected to be influenced by participation in the Nespresso Program, at least in the short-term.
3.1.1 Demographic characteristics of the Nespresso Cluster of Guatemala
Producers who participate in the Nespresso cluster of Guatemala have a larger farm size (+1 ha) and a larger area of the farm under natural forest (+0.23 ha), although it is more

15
common that both type of producers do not have farm area under natural forest, and a larger percentage of them have a natural water source in the coffee plantation. On the other hand, the farms of participant producers are more distant from the place where they normally sell their coffee, as in average they have to travel an extra 30 minutes from their plantation to the coffee collection center. There are no significant differences on the number of family members who are involved in coffee-related activities (usually 2), and neither on the age and years of experience of coffee plantation owner. However, coffee producers who participate in the Nespresso Program have one more year of formal education than those who do not participate, and a higher percentage of them are members of producer organizations.
Table 5 Demographic Characteristics of Coffee Producers in the Nespresso Cluster of Guatemala
Indicator Non-Participant
(Ni=1=122)
Participant
(Ni=0=87)
Total
(N=208)
Farm size (ha) 2.41
(1.31) a
5.48*** (2.38)***
3.67
Area with natural forest (ha) 0.07 (0.0)
0.30** (0.0)
0.17
% with a source of water in the coffee plantation 67.2 77.0** 71.3
Number of family members working in coffee-related activities
2.1 (2)
1.9 (1)
2.0
Age of coffee plantation owner 48.6 (47)
46.8 (47)
47.9
Average years of formal education of coffee plantation owner
2.9 (2)
4.1*** (3)***
3.4
Average years of experience with coffee of plantation owner
23.8 (20)
22.7 (20)
23.4
Time required to take coffee to the collection center (minutes)
29.7 (0.0)
69.3*** (32.5)***
46.2
% of producers who are members of a producer organizations
23.4 50.6*** 34.7
*** α ≤ 0.01; ** α > 0.01 - ≤ 0.05; * α > 0.05 - ≤ 0.10
a The median, instead of the average, is presented in parentheses as the variable sample distribution is not normal.
3.1.2 Demographic characteristics of the Nespresso Cluster of Mexico
As in the case of the Nespresso cluster of Guatemala, producers who participate in the Mexican cluster have a larger farm size (+1 ha) and a larger area of the farm under natural forest (+0.29 ha), although it is more common that both type of producers do not have farm area under natural forest. On the other hand, the farms of participant producers are less distant from the place where they normally sell their coffee, as in average they have to travel 5 minutes less from their plantation to the coffee collection center, but the most common situation is that there is no difference in travel time. As in the case of the Nespresso cluster in Guatemala, there are no significant differences on the number of family members who are involved in coffee-related activities (usually 2-3). However, opposite to the case of Guatemala, producers who participate in the Nespresso

16
cluster of Mexico are older (+3.5 years) and have more experience with coffee production (usually +7.5 years), while there is no significant difference on the years of formal education. Coffee plantation owners in the Mexico cluster have in average smaller farms (-0.85 ha) but a larger area under natural forest (+0.11 ha), than those in the Guatemala cluster, and a smaller percentage of them have a natural water source in their coffee plantation (+47.7%). They are also older (+5.5 years), have more years of experience as coffee growers (+4.8), and in average have one more year of formal education. On the other hand, while almost none producers in the cluster of Mexico are members of producer organizations (2.5%), one third of coffee producers in the cluster of Guatemala are members of producer organizations (34.7).
Table 6
Demographic Characteristics of Coffee Producers in the Nespresso Cluster of Mexico
Indicator Non-Participant
(Ni=1=126)
Participant
(Ni=0=156)
Total
(N=282)
Farm size (ha) 2.01 (1.5)a
3.47*** (2.5)***
2.82
Area with natural forest (ha) 0.12 (0.0)
0.41*** (0.0)
0.28
% with a source of water in the coffee plantation 27.0* 20.8 23.6
Number of family members working in coffee-related activities
2.9 (2)
3.0 (3)
3.0
Age of coffee plantation owner 51.5
(52.5) 55.0***
(56.0)*** 53.4
Average years of formal education of coffee plantation owner
4.1 (3.0)
4.5 (3.0)
4.3
Average years of experience with coffee of plantation owner
26.2 (22.5)
29.8*** (30.0)***
28.2
Time required to take coffee to the collection center (minutes)
31.7*** (30)
25.7 (25)
28.4
% of producers who are members of a producer organizations
3.2 (0.0)
1.9 (0.0)
2.5
*** α ≤ 0.01; ** α > 0.01 - ≤ 0.05; * α > 0.05 - ≤ 0.10
a The median, instead of the average, is presented in parentheses as the variable sample distribution is not normal.
3.2 Coffee Plantation Characteristics
Tables 7 and 8 characterize coffee plantations in the Nespresso clusters in Guatemala and Mexico, respectively, and assess differences among producers who participate in the Nespresso Program and those who do not participate in the program, as well as changes between the two analyzed cropping cycles (2007-08 and 2009-10).
3.2.1 Coffee plantation characteristics in the Nespresso cluster of Guatemala
In the Nespresso cluster of Guatemala, producers who participate in the program have a significant larger area established with coffee than non-participants; however, there has been no significant change in coffee area over time, and the importance of coffee in the farm, expressed as the percentage of total farm size with coffee, is the same among both groups.

17
In addition, participant coffee plantations are slightly younger and with a higher planting density; however, both groups are re-planting and therefore have increased their planting density between the two cropping cycles. Caturra is the most widely spread coffee variety in both groups, and more producers have replanted with var. Caturra during the last two cropping cycles as well as with var. Tipica. The second most important established variety is Bourbon, and the percentage of producers who have this variety is significant higher among those who participate in the Nespresso Program, but there has been no significant change on the producers who have this variety over time.
Table 7 Characterization of coffee plantations in the Nespresso Cluster of Guatemala
(2007-08 and 2009-10 cropping cycles)
Indicator Non-Participant
(Ni=1=122)
Participant
(Ni=1=87)
Change over Cropping Cycles
Non-Participants Participants
Coffee area (ha) 2.09
(1.09)a 4.77***
(1.75)*** -0.04
(+0.06) -0.31
(-0.21)
% of total farm size with coffee 86.0
(94.7) 85.9
(94.6) +0.74 (-0.78)
+2.63 (+0.51)
Plantation age (years) 16.2* (15)*
15.0 (15)
+0.3 (0.0)
+1.9 (+5)***
Planting density 4,804
(4,570) 4,951* (5,084)
+383.2*** (+354)
+290.1*** (+343)
% who established var. Caturra 74.2 77.0 +12.3** +16.1***
% who established var. Bourbon 47.1 66.1*** +9.0 +5.7
% who established var. Típica 35.2 31.0 +9.8* +13.8**
*** α ≤ 0.01; ** α > 0.01 - ≤ 0.05; * α > 0.05 - ≤ 0.10
a The median is presented in parentheses as the variables sample distribution is not normal.
3.2.2 Coffee plantation characteristics in the Nespresso cluster of Mexico
As in the Guatemala cluster, producers who participate in the Nespresso Program in Mexico have a significant larger area established with coffee than non-participants, but there has been no significant change in coffee area over time, and the importance of coffee in the farm, expressed as the percentage of total farm size with coffee, is the same among both groups. In both groups, most of coffee plantations have been established eighteen years ago, but plantations of producers who participate in the Nespresso Program have a higher planting density and have been increasing their planting density in the last two cropping cycles by replanting mainly var. Tipica and Garnica. Bourbon is the most widely spread coffee variety in both groups, but the percentage of producers who established var. Bourbon among participating producers is larger. The second most important established variety is Típica, and the percentage of producers who have this variety has been significantly increasing over the last two cropping cycles. Coffee plantations, in average, are larger in Guatemala than in Mexico, but the importance of coffee, expressed as the percentage of farm area established with coffee, is similar (> 80%). Plantations in Guatemala are younger and have almost double the planting density than

18
those in Mexico. The latter may be related in part to the var. most widely established: var. Caturra in Guatemala, opposite to var. Bourbon and Tipica in Mexico.
Table 8
Characterization of coffee plantations in the Nespresso Cluster of Mexico (2007-08 and 2009-10 cropping cycles)
Indicator Non-Participant
(Ni=1=126)
Participant
(Ni=1=156)
Change over Cropping Cycles
Non-Participants Participants
Coffee area (ha) 1.44 (1.0)a
2.41*** (2.0)***
+0.03 (+0.18)
-0.01 (0.00)
% of total farm size with coffee 84.5
(100.0) 81.6
(100.0) -3.4 (0.0)
-5.8* (0.0)
Plantation age (years) 19.2
(18.0) 19.8
(18.0) +0.02 (+5.0)
-1.4 (-3.0)
Planting density 1,810
(2,000) 2,002*** (2,000)
+100.06 (+175)
+134.87* (0.0)
% who established var. Bourbon 67.9 83.7*** +0.8 +0.6
% who established var. Típica 67.5 66.3 +14.3*** +9.6*
% who established var. Garnica 38.5 40.4 +10.3* +12.8**
% who established var. Caturra 32.1 33.3 -5.6 -7.7
*** α ≤ 0.01; ** α > 0.01 - ≤ 0.05; * α > 0.05 - ≤ 0.10
a The median is presented in parentheses as the variables sample distribution is not normal.
Table 9 highlights the major differences among participating and non-participating producers in the Nespresso clusters of Guatemala and Mexico. In both clusters participating producers have a larger farm size, as well as a larger area with natural forest and established with coffee; however, the difference is greater in Guatemala than in Mexico. In addition, while producers who participate in the Nespresso cluster in Guatemala have their coffee plantations farer from the coffee collection center, participating producers in the Nespresso cluster in Mexico have their coffee plantations nearer the coffee collection center.
Differences in Demographic Characteristics among Participating and non-Participants The above results highlight that participating producers have some significant differences in their demographic characteristics with respect to non-participants. However, this is not a sample or design problem, but also a result of the evaluation. In average, producers who participate in the program have a better access to resources such as land and larger coffee plantations. This in part is related to the intentional selection made by ECOM of larger producers with more resources to participate in the program, as it is easier for them to comply with the Nespresso Program requirements and pass the verification process.

19
Table 9 Major differences among participating and non-participating producers in the Nespresso
Clusters of Guatemala and Mexico
Indicator
Nespresso Cluster in Guatemala Nespresso Cluster in Mexico
Non-Participant
(Ni=1=122)
Difference among Participants
(Ni=1=87)
Non-Participant
(Ni=1=126)
Difference among Participants
(Ni=1=156)
Farm size (ha) 2.41
(1.31) a
+6.71***
(+1.1)***
2.01
(1.5)a
+1.47***
(+1.0)***
Area with natural forest (ha) 0.07
(0.0) +0.73**
0.12
(0.0) +0.29***
Coffee area (ha) 2.09
(1.09)
+5.83***
(+0.76)***
1.44
(1.0)a
+0.96***
(+1.0)***
Time required to take coffee to the collection center (minutes)
29.7
(0.0) +39.5***
31.7 (30)
-6.2***
*** α ≤ 0.01; ** α > 0.01 - ≤ 0.05; * α > 0.05 - ≤ 0.10
a The median is presented in parentheses as the variables sample distribution is not normal.
4. NET BENEFITS FROM PARTICIPATING IN THE NESPRESSO PROGRAM
HYPOTHESIS 1
Net benefits (price differential, productivity increases, cost reduction) received by coffee producers that participate in the Nespresso AAA – ECOM value chain is greater than the investment required to access this value chain.
4.1 Productivity Analysis in the Nespresso Cluster of Guatemala
Figure 1 shows coffee productivity evolution in the Nespresso cluster of Guatemala among producers who participate in the program, and those who do not participate in the program, over the last four cropping cycles (2007-2010). This graph shows that productivity is increasing through time (α=0.0323) for both groups of producers: participating and non-participating. In average, the productivity level of producers who participate in the Nespresso cluster is lower (α =0.0172), but the difference with respect to those who do not participate in the program is decreasing. A higher percentage of participating producers with var. Bourbon, compared with those who do not participate, can explain in part this productivity difference (see Table 7). An important aspect to highlight is that producers who participate in the Nespresso program have a higher productivity in low production years, and variance through production cycles is lower, showing that their plantations are less affected by the bi-annual variations in productivity that characterizes coffee production.

20
Figure 1 Coffee productivity in the Nespresso Cluster of Guatemala
The numbers on top of the bars report the difference between producers who participate in the Nespresso Program and does who do not participate, and the number of stars the probability of error when concluding that this difference is ≠ 0. *** α ≤ 0.01; ** α > 0.01 - ≤ 0.05; * α > 0.05 - ≤ 0.10
Table 10 reports coffee productivity, use of recommended cropping practices, and input application in the Nespresso cluster of Guatemala for the 2007-08 and 2009-10 cropping cycles.
Table 10 Productivity, production practices and input application in the Nespresso Cluster of Guatemala
(2007-08 and 2009-10 cropping cycles)
Indicator Non-
Participant
(Ni=1=122)
Participant
(Ni=1=87)
Change over Cropping Cycles
Non-Participants Participants
Productivity (qq/ha) 31.4*** (27.8)a
27.9 (26.7)
-3.0* (-2.6)
-2.4 (-1.3)
Coffee Cropping Practices
% who have replanted old or lost plants 31.1 48.3*** -14.8*** -27.6***
Total number of plants replanted 182 477*** -111* -416***
% who have renew their coffee plantation 2.0 3.4 -0.8 0.0
Renewed area among those who renew (ha) 0.38 0.89 +0.35 -0.13
% who have replanted with grafted coffee plants 0.8 3.4** 0.0 -4.6*
% who have replanted with hybrid coffee 0.0 0.0 0.0 0.0
% who regulates plantation shade 91.8 99.4*** +1.6 -1.1
% who prune their coffee plantation 93.0 96.0 +0.8 +3.4
% who prune coffee sprouts 82.4 90.8** +2.5 +4.6
% who apply IPM practices 3.7 2.3 -4.1 -2.3
% who use artisanal traps for broca control 2.0 4.6 -2.4 0.0
% who use brocap traps for broca control 0.0 0.6 0.0 +0.6
21
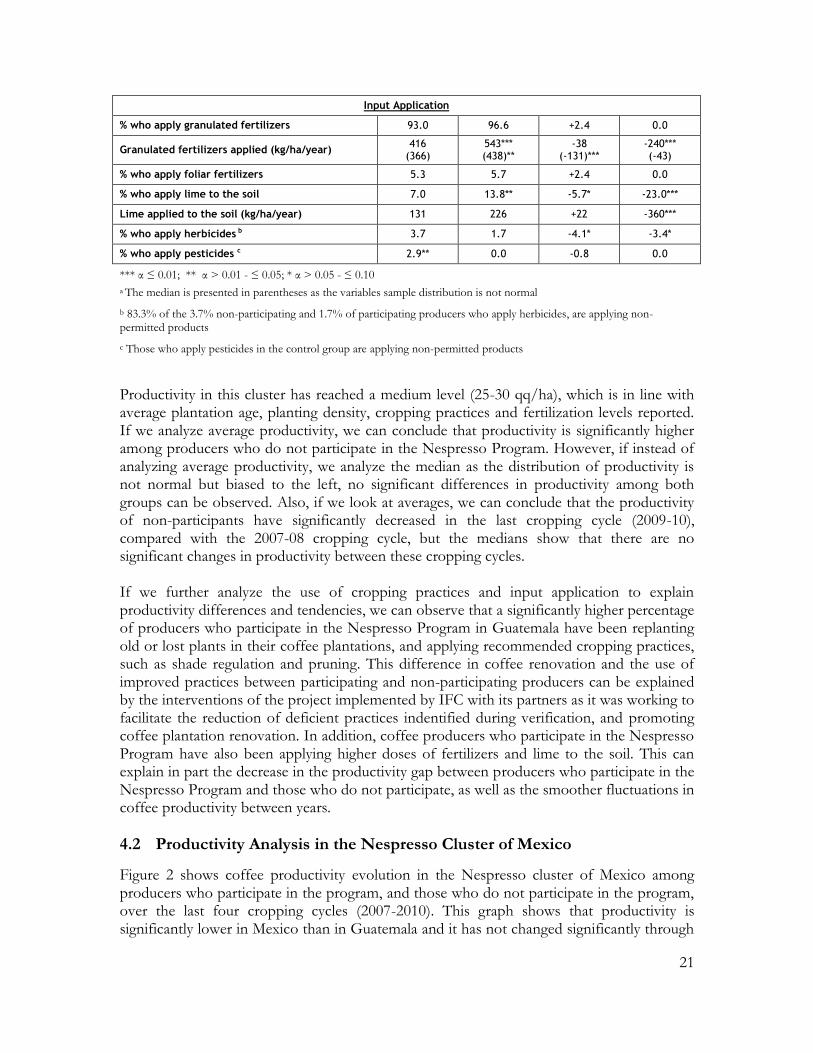
Input Application
% who apply granulated fertilizers 93.0 96.6 +2.4 0.0
Granulated fertilizers applied (kg/ha/year) 416
(366) 543*** (438)**
-38 (-131)***
-240*** (-43)
% who apply foliar fertilizers 5.3 5.7 +2.4 0.0
% who apply lime to the soil 7.0 13.8** -5.7* -23.0***
Lime applied to the soil (kg/ha/year) 131 226 +22 -360***
% who apply herbicides b 3.7 1.7 -4.1* -3.4*
% who apply pesticides c 2.9** 0.0 -0.8 0.0
*** α ≤ 0.01; ** α > 0.01 - ≤ 0.05; * α > 0.05 - ≤ 0.10
a The median is presented in parentheses as the variables sample distribution is not normal
b 83.3% of the 3.7% non-participating and 1.7% of participating producers who apply herbicides, are applying non-permitted products
c Those who apply pesticides in the control group are applying non-permitted products
Productivity in this cluster has reached a medium level (25-30 qq/ha), which is in line with average plantation age, planting density, cropping practices and fertilization levels reported. If we analyze average productivity, we can conclude that productivity is significantly higher among producers who do not participate in the Nespresso Program. However, if instead of analyzing average productivity, we analyze the median as the distribution of productivity is not normal but biased to the left, no significant differences in productivity among both groups can be observed. Also, if we look at averages, we can conclude that the productivity of non-participants have significantly decreased in the last cropping cycle (2009-10), compared with the 2007-08 cropping cycle, but the medians show that there are no significant changes in productivity between these cropping cycles. If we further analyze the use of cropping practices and input application to explain productivity differences and tendencies, we can observe that a significantly higher percentage of producers who participate in the Nespresso Program in Guatemala have been replanting old or lost plants in their coffee plantations, and applying recommended cropping practices, such as shade regulation and pruning. This difference in coffee renovation and the use of improved practices between participating and non-participating producers can be explained by the interventions of the project implemented by IFC with its partners as it was working to facilitate the reduction of deficient practices indentified during verification, and promoting coffee plantation renovation. In addition, coffee producers who participate in the Nespresso Program have also been applying higher doses of fertilizers and lime to the soil. This can explain in part the decrease in the productivity gap between producers who participate in the Nespresso Program and those who do not participate, as well as the smoother fluctuations in coffee productivity between years.
4.2 Productivity Analysis in the Nespresso Cluster of Mexico
Figure 2 shows coffee productivity evolution in the Nespresso cluster of Mexico among producers who participate in the program, and those who do not participate in the program, over the last four cropping cycles (2007-2010). This graph shows that productivity is significantly lower in Mexico than in Guatemala and it has not changed significantly through

22
time (α=0.6541) for participating or non-participating producers. In addition, producers who participate in the Nespresso cluster have a higher productivity than those who do not participate (α=0.0915), but the difference is decreasing.
Figure 2
Coffee productivity in the Nespresso Cluster of Mexico
The numbers on top of the bars report the difference between producers who participate in the Nespresso Program and does who do not participate, and the number of stars the probability of error when concluding that this difference is ≠ 0. *** α ≤ 0.01; ** α > 0.01 - ≤ 0.05; * α > 0.05 - ≤ 0.10
Table 11 reports coffee productivity, use of recommended cropping practices, and input application in the Nespresso cluster of Mexico for the 2007-08 and 2009-10 cropping cycles. If we analyze average productivity, we can conclude that productivity is significantly higher among producers who participate in the Nespresso Program; however, if we analyze the medians as the distribution of productivity is not normal, no significant differences in productivity among both groups can be observed. In addition, there are no significant changes in productivity between these cropping cycles in any of the groups.

23
Table 11 Productivity, production practices and input application in the Nespresso Cluster of Mexico
(2007-08 and 2009-10 cropping cycles)
Indicator Non-
Participant
(Ni=1=126)
Participant
(Ni=1=156)
Change over Cropping Cycles
Non-Participants Participants
Productivity (qq/ha) 10.7 (9.2)a
11.8* (9.7)
+0.7 (-0.9)
-1.1 (-0.6)
Coffee Cropping Practices
% who have replanted old or lost plants 46.0 72.1*** -4.8 +7.1
Number of plants replanted 162 376*** -55 -77
% who have renew their coffee plantation 4.8 10.9*** -6.3** -2.6
Renewed area among those who renew (ha) 0.52 0.41 +0.42 +0.13
% who have replanted with grafted coffee plants 9.9 14.1 +19.8*** +28.2***
% who have replanted with hybrid coffee 9.9 14.4* -19.8*** -28.8***
% who regulates plantation shade 59.5 70.8*** +11.1* +18.6***
% who prune their coffee plantation 79.4 85.6* +15.9*** +1.9
% who prune coffee sprouts 54.4 67.6*** +13.5** +5.7
% who apply IPM practices 33.3 42.0** -14.3** -13.5**
% who use artisanal traps for broca control 43.3 78.9 -7.1 +26.9
% who use brocap traps for broca control 1.6 0.6 0.0 +1.3
Input Application
% who apply granulated fertilizers 52.8 62.5** +21.4*** +14.7***
Granulated fertilizers applied (kg/ha/year) 289 268 -94 -103
% who apply foliar fertilizers 0.8 3.5** 0.0 -1.9
% who apply lime to the soil 2.4 7.4*** 0.0 -3.2
Lime applied to the soil (kg/ha/year) 123 263 -120 -189
% who apply herbicides 5.6 7.1 -3.2 -7.7***
% who apply pesticides 7.1 6.4 +4.8 +3.8
*** α ≤ 0.01; ** α > 0.01 - ≤ 0.05; * α > 0.05 - ≤ 0.10
a The median is presented in parentheses as the variables sample distribution is not normal
If we further analyze the use of cropping practices and input application to explain productivity differences and tendencies, we can observed that a significant higher percentage of producers who participate in the Nespresso Program in Mexico have been replanting old or lost plants in their coffee plantations, renewing their coffee plantations and applying other recommended cropping practices such as shadow regulation, pruning and integrated pest management practices. A higher percentage has also been applying granulated and foliar fertilizers, as well as lime to the soil. The adoption of these improved cropping practices, as well as input use, is an important factor for explaining productivity differences among participating and non-participating producers, and at the same time could be directly linked to the project interventions. In addition, a tendency to significantly eliminate herbicide use, especially of non-permitted products, among producers who participate in the program can be observed. .
24
On the other hand, the percentage of producers who do not participate in the Nespresso Program that are renewing their plantations, using recommended cropping practices, and applying fertilizers has been increasing. This can explain in part the decrease in the productivity gap between producers who participate in the Nespresso Program and those who do not participate. No significant improvements can be observed in productivity neither in the Guatemala or the Mexico Nespresso cluster over time, or between participant and non-participant producers. Productivity in Mexico is very low and can be explained by the age of coffee plantations (usually 18 years), and the low planting density (2,000 plants per ha) that is related with the predominantly established varieties: Bourbon and Tipica. However, coffee producers (especially participant producers) are replanting and renewing their coffee plantations, at the same time that are applying improved cropping practices (shadow regulation, pruning, soil fertility management and integrated pest management). A productivity analysis will be required in the next cropping cycles to evaluate whether or not the renovation and replanting of coffee plantations, together with the use of improved cropping practices, results in significant productivity improvements.
4.3 Cost Analysis in the Nespresso Cluster of Guatemala
4.3.1 Production costs
Figure 3 shows coffee production costs in the Nespresso cluster of Guatemala, differentiated by whether producers participate or not in the program. Replanting and fertilization costs are visualized as they are expected to have an important influence in productivity. Total production costs have been decreasing through time (α=0.0046) for participating and non-participating producers; however, total production costs have been decreasing more and significantly only among producers who participate in the Nespresso Program. As shown in Table 8 this may have been as a result on the reduction of replanting activities and in the application of lime. However, producers who participate in the Nespresso Program are still investing more in replanting and fertilization activities that can be attributed to their better access to financial resources as a result of the project, which will probably generate productivity impacts in the next cropping cycles, as discussed early.
4.3.2 Unit production costs
Table 12 analyzes further the differences in production costs, productivity and unit production costs between the two groups of coffee producers (participants and non-participants), and the changes in the last two cropping cycles, in the Nespresso cluster of Guatemala. In line with the information shown in Figure 3, total production costs do not differ between groups but have decreased in the last cropping cycle, especially among producers who participate in the Nespresso Program, as they have decreased significantly their investment in replanting activities but not in fertilization costs. A small reduction in total production costs, together with no significant changes in productivity has resulted in a small but not significant reduction in unit production costs.

25
Figure 3 Coffee production costs in the Nespresso Cluster of Guatemala
The numbers on top of the bars report the difference between producers who participate in the Nespresso Program and does who do not participate, and the number of stars the probability of error when concluding that this difference is ≠ 0. *** α ≤ 0.01; ** α > 0.01 - ≤ 0.05; * α > 0.05 - ≤ 0.10
Table 12 Coffee production costs in the Nespresso Cluster of Guatemala
(2007-08 and 2009-10 cropping cycles)
Indicator Non-Participant
(Ni=1=122)
Participant
(Ni=1=87)
Change over Cropping Cycles
Non-Participants Participants
Total production costs (US$/ha) 1,856
(1,771)a 1,814
(1,667) -152
(-125) -366** (-45)
Fertilization costs (US$/ha) 572
(532) 606
(571) -13
(+22) +22
(+168)***
Replanting costs (US$/ha) 52
(0.0) 128*** (0.0)***
-43*** (0.0)***
-152** (-35)***
Productivity (qq/ha) 31.4*** (27.8)a
27.9 (26.7)
-3.0* (-2.6)
-2.4 (-1.3)
Unit production costs (US$/qq) 65.40
(60.85) 71.85** (63.44)
+2.81 (+2.40)
-4.78 (-2.32)
*** α ≤ 0.01; ** α > 0.01 - ≤ 0.05; * α > 0.05 - ≤ 0.10
a The median is presented in parentheses as the variables sample distribution is not normal.
Figure 4 graphs unit production cost in the Nespresso cluster of Guatemala differentiated by whether producers participate or not in the Nespresso program. Unit coffee production costs increased among non-participating producers, but decreased between cropping cycles among producers who participate in the Nespresso Program. As such, unit production costs

26
were higher among producers who participate in the Nespresso Program in 2007-08, but in 2009-10 there were was no significant difference between both groups.
Figure 4 Unit production costs in the Nespresso Cluster of Guatemala
The numbers on top of the bars report the difference between producers who participate in the Nespresso Program and does who do not participate, and the number of stars the probability of error when concluding that this difference is ≠ 0. *** α ≤ 0.01; ** α > 0.01 - ≤ 0.05; * α > 0.05 - ≤ 0.10
4.4 Cost Analysis in the Nespresso Cluster of Mexico
4.4.1 Production costs
Figure 5 shows coffee production costs in the Nespresso cluster of Mexico, differentiated by whether producers participate or not in the program. In line with productivity differences between the Guatemala and Mexico clusters, coffee producers in Mexico are investing significantly less in their coffee plantation than those in Guatemala. Total production costs are slightly higher among producers who participate in the Nespresso Program, however the difference is not significant (α=0.1251). In addition, total production costs did not change significantly through time (α=0.7981) for participating or non-participating producers, but producers who participate in the Nespresso Program are investing more in replanting older or damage coffee plants, and therefore, are probably giving a better maintenance to their plantations as promoted by the project.
4.4.2 Unit production costs
Table 13 analyzes further the differences in production costs, productivity and unit production costs between the two groups of coffee producers (participants and non-participants), and the changes in the last two cropping cycles, in the Nespresso cluster of

27
Mexico. In line with the information shown in Figure 4, total production costs do not differ between groups and have not changed over time. However, producers who participate in the Nespresso Program have been investing more in replanting old or lost plants, and in fertilization. No significant changes in total production costs among participating producers, together with a small but no significant decrease in productivity, has resulted in a significant increase in unit production costs.
Figure 5 Coffee production costs in the Nespresso Cluster of Mexico
The numbers on top of the bars report the difference between producers who participate in the Nespresso Program and does who do not participate, and the number of stars the probability of error when concluding that this difference is ≠ 0. *** α ≤ 0.01; ** α > 0.01 - ≤ 0.05; * α > 0.05 - ≤ 0.10
Table 13
Coffee production costs in the Nespresso Cluster of Mexico (2007-08 and 2009-10 cropping cycles)
Indicator Non-Participant
(Ni=1=126)
Participant
(Ni=1=156)
Change over Cropping Cycles
Non-Participants Participants
Total production costs (US$/ha) 1,025 (886)a
1,102 (939)
+39 (-12)
-8 (+30)
Fertilization costs (US$/ha) 95
(36) 101
(75)** +20
(-69)*** -8
(+25.5)**
Replanting costs (US$/ha) 78 (0)
119*** (67)***
-24 (0)
-34* (+8)
Productivity (qq/ha) 10.7 (9.2)a
11.8* (9.7)
+0.7 (-0.9)
-1.1 (-0.6)
Unit production costs (US$/qq) 111.2
(100.2) 107.6 (95.4)
+2.0 (+2.1)
+9.5* (+13.4)***
*** α ≤ 0.01; ** α > 0.01 - ≤ 0.05; * α > 0.05 - ≤ 0.10
a The median is presented in parentheses as the variables sample distribution is not normal.

28
Figure 6 graphs unit production cost in the Nespresso cluster of Mexico, differentiated by whether producers participate or not in the Nespresso program. Unit production cost increased among producers who participate in the Nespresso Program (α=0.1038), but did not change among producers who do not participate in the program (α=0.7607). Therefore, unit production cost where significantly lower among producers who participate in the Nespresso Program in 2007-08, but in 2009-10 there were was no significant difference between both groups.
Figure 6 Unit production costs in the Nespresso Cluster of Mexico
The numbers on top of the bars report the difference between producers who participate in the Nespresso Program and does who do not participate, and the number of stars the probability of error when concluding that this difference is ≠ 0. *** α ≤ 0.01; ** α > 0.01 - ≤ 0.05; * α > 0.05 - ≤ 0.10
4.5 Coffee-related investments
4.5.1 Coffee-related investments in the Nespresso Cluster of Guatemala
Investments include all the equipment, infrastructure or goods with a useful life of more than one year, and therefore, are not included in production costs. Figure 7 shows how coffee-related investments have evolved during the 2006-2010 period in the Nespresso cluster in Guatemala. Between 2006 and 2008, coffee-related investments among producers who participate in the Nespresso Program have been significantly higher than among those producers who do not participate in the Program; however, the investment level of producers who participate in the Nespresso Program have decreased substantially after 2008, probably because coffee producers made the initial investment required to participate in the program during the first two years, and afterwards, they reduced their investment level.

29
Figure 7 Coffee-related investments in the Nespresso Cluster of Guatemala
The numbers on top of the bars report the difference between producers who participate in the Nespresso Program and does who do not participate, and the number of stars the probability of error when concluding that this difference is ≠ 0. *** α ≤ 0.01; ** α > 0.01 - ≤ 0.05; * α > 0.05 - ≤ 0.10
Table 14 analyzes further the type of investments made by coffee producers in the Nespresso cluster of Guatemala during the 2006-2010 period, and differentiates them between those who participate in the Nespresso Program and those who do not. Besides showing that producers who participate in the program have made significantly larger investments (total and by category), this table shows that most of the investment went for quality and commercialization improvements, followed by social investment, investments to increase productivity, and to a lesser extent for environmental management investments. Therefore, coffee producers in the cluster have been made investments mainly to comply with the Nespresso AAA Sustainable Program standards, and to a lesser extent to improve productivity, but these investments have been decreasing over time. This is an important finding that requires to be consider in the implementation of the Nespresso Program, as sustainability has at least three dimensions: economic, social and environmental, and if no increase in productivity is achieved, sustainability can be seriously and negatively affected.
Table 14 Coffee-related investments in the Nespresso Cluster of Guatemala (2006-2010)
Indicator
Non-Participant
(Ni=1=122)
Participant
(Ni=1=87)
Change over cropping Cycles
Non-Participants
Participants
Total Investment in the period (US$) 10,130 (75)a
37,083*** (4,700)***
-18.8 -97.9*

30
Indicator
Non-Participant
(Ni=1=122)
Participant
(Ni=1=87)
Change over cropping Cycles
Non-Participants
Participants
Investment for quality and commercialization during the period (US$)
3,408 (0.0)
18,800*** (200)***
+32.9 -186.9*
Social investment during the period (US$) 5,277 (0.0)
9,150 (950)***
-75.4 -77.1
Investment to increase productivity during the period (US$)
1,322 (0.0)
7,490*** (900)***
+2.4 -71.8*
Environmental management investment during the period (US$)
123 (0.0)
1,643*** (200)***
+10.5 -45.9
*** α ≤ 0.01; ** α > 0.01 - ≤ 0.05; * α > 0.05 - ≤ 0.10
a The median is presented in parentheses as the variables sample distribution is not normal.
4.5.2 Coffee-related investments in the Nespresso Cluster of Mexico
Coffee-related investments in the Mexico Nespresso cluster are significantly lower than those in cluster of Guatemala. Figure 8 shows how coffee-related investments have evolved during the 2006-2010 period in the Nespresso cluster in Mexico. From 2006-2009, coffee-related investments among producers who participate in the Nespresso Program have been significantly higher than among those producers who do not participate in the program. However, the investments of producers who participate in the Nespresso Program have decreased since 2009.
Figure 8 Coffee-related investments in the Nespresso Cluster of Mexico
The numbers on top of the bars report the difference between producers who participate in the Nespresso Program and does who do not participate, and the number of stars the probability of error when concluding that this difference is ≠ 0. *** α ≤ 0.01; ** α > 0.01 - ≤ 0.05; * α > 0.05 - ≤ 0.10

31
Table 15 analyzes further the type of investments made by coffee producers in the Nespresso cluster of Mexico during the 2006-2010 period, and differentiates them between those who participate in the Nespresso Program and those who do not. Producers who participate in the program have made significantly larger investments (total and by category) than producers who do not participate in the program, with the exception of investments to improve environmental management that are very low and do not differ between participants and non-participants. As low productivity seems to be the most constraining factor for sustainable coffee production in the case of Mexico (see Table 13), most of the investment went for productivity improvement, followed by quality and commercialization improvement and social investments. Therefore, coffee producers in the cluster have been making investments mainly to improve productivity, and to a lesser extent to comply with the Nespresso AAA Sustainable Program quality and social standards, but investments to increase productivity have been decreasing, while those to comply with social standards have been increasing over time.
Table 15 Coffee-related investments in the Nespresso Cluster of Mexico (2006-2010)
Indicator
Non-Participant
(Ni=1=126)
Participant
(Ni=1=156)
Change over cropping Cycles
Non-Participants
Participants
Total Investment in the period (US$) 2,134 (375)a
5,396*** (1,538)***
+7.3 -19.5
Investment for quality and commercialization during the period (US$)
82 (0)
1,093* (0)***
+27.0 +15.0
Social investment during the period (US$) 427 (0)
816** (300)**
+70.6* +41.3***
Investment to increase productivity during the period (US$)
1,532 (0)
3,456* (505)**
-2.9 -36.6***
Environmental management investment during the period (US$)
93 (0)
31 (0)
-75.4*** -16.5
*** α ≤ 0.01; ** α > 0.01 - ≤ 0.05; * α > 0.05 - ≤ 0.10
a The median is presented in parentheses as the variables sample distribution is not normal.
4.6 Price and Unit Margin Analysis
4.6.1 Price and unit margin analysis in the Nespresso Cluster of Guatemala
Figure 9 shows coffee prices paid to the producer in the Nespresso cluster of Guatemala, and differentiates them by whether the producer participates or not in the Nespresso program. As can be observed in the graph, coffee prices have significantly (α=0.0006) increased since 2006-07 for participating and non-participating producers, but producers who participate in the Nespresso Program received a price differential that result in a significantly higher price (α=0.0000) for participating producers. However, this price differential at the farmer level has been decreasing from US$ +6.6/qq to US$ +4.8/qq, in average, at the same time that has followed conventional coffee price fluctuations.

32
Figure 9 Coffee Prices in the Nespresso Cluster of Guatemala (2006-2010)
The numbers on top of the bars report the difference between producers who participate in the Nespresso Program and does who do not participate, and the number of stars the probability of error when concluding that this difference is ≠ 0. *** α ≤ 0.01; ** α > 0.01 - ≤ 0.05; * α > 0.05 - ≤ 0.10
Figure 10 further analyzes net unit income in the Nespresso cluster of Guatemala by subtracting unit costs (US$/qq) from coffee prices. Net unit income has increased (α=0.0000) over time among all producers, mainly as a result of price increases. However, net unit income among producers who participate in the Nespresso Program have increased more as a result of unit cost reduction, but it is still not significantly higher from non-participating producers.
4.6.2 Price and unit margin analysis in the Nespresso Cluster of Mexico
Figure 11 shows coffee prices paid to the producer in the Nespresso cluster of Mexico, and differentiates them by whether the producer participates or not in the Nespresso program. Although there are a higher percentage of coffee producers in Mexico that produce var. Bourbon and var. Tipica, coffee varieties that have special cup quality characteristics, they are receiving significantly lower prices than producers in the Nespresso cluster of Guatemala (a US$ -19.5 four-year average differential) which is mainly due to the lower price differential of Mexico in the world market (+4.5 the NYSE price) than the differential of Guatemala (+25.5 the NYSE price). Although to make this comparison, prices have been converted to their dry parchment equivalent, it is important to note that producers in Mexico do not wet mill the coffee in their farms, but sell it as cherry coffee, while producers in the Guatemala cluster do the wet milling and sell their coffee as dry parchment coffee. This explains, partially, the lower total production costs in Mexico as well as lower prices.

33
Figure 10 Net Unit Income (US$/qq) in the Nespresso Cluster of Guatemala (2007-08 and 2009-10
cropping cycles)
The numbers on top of the bars report the difference between producers who participate in the Nespresso Program and does who do not participate, and the number of stars the probability of error when concluding that this difference is ≠ 0. *** α ≤ 0.01; ** α > 0.01 - ≤ 0.05; * α > 0.05 - ≤ 0.10
Figure 11
Coffee Prices in the Nespresso Cluster of Mexico (2006-2010)
The numbers on top of the bars report the difference between producers who participate in the Nespresso Program and does who do not participate, and the number of stars the probability of error when concluding that this difference is ≠ 0. *** α ≤ 0.01; ** α > 0.01 - ≤ 0.05; * α > 0.05 - ≤ 0.10

34
As has been the case in the Nespresso cluster of Guatemala, and following world coffee price trends, coffee prices in the Nespresso cluster of Mexico have also increased significantly (α=0.0000) since 2006-07 for participating and non-participating producers. However, producers who participate in the Nespresso cluster have been receiving a price differential that results in a significantly higher price (α=0.0044) for these producers only during the last cropping cycle (2009-10). Price differentials during the 2007-08 and 2008-09 were not significantly different from zero, and during the 2006-07 cropping cycle were even negative and significantly different from zero. Following the same analysis, Figure 12 shows net unit income in the Nespresso cluster of Mexico. Opposite to the case of Guatemala, net unit income in Mexico, after valuing family labor is negative, as coffee productivity in the Nespresso cluster of Mexico is significantly lower than in the cluster in Guatemala, but also positive price differentials for producers who participate in the Nespresso Program, only started to be observed during the 2009-10 cropping cycle. As a result, negative net unit income has been reversing over time as net unit income has been increasing (α=0.0001) among all producers, mainly as a result of price increases. In addition, net unit income among producers who participate in the Nespresso Program is not significantly higher from non-participating producers, as productivity has not increased, and unit costs have not decreased.
Figure 12 Net Unit Income (US$/qq) in the Nespresso Cluster of Mexico (2007-08 and 2009-10 cropping
cycles)
The numbers on top of the bars report the difference between producers who participate in the Nespresso Program and does who do not participate, and the number of stars the probability of error when concluding
that this difference is ≠ 0. *** α ≤ 0.01; ** α > 0.01 - ≤ 0.05; * α > 0.05 - ≤ 0.10

35
4.7 Total and Net Income Analysis
4.7.1 Total and net income analysis in the Nespresso Cluster of Guatemala
Table 16 presents the results of the cost-benefit analysis for the Nespresso cluster in Guatemala, estimated in US$ per hectare. Participating producers in Guatemala received a higher price (a four-year price differential average of +US$ 5.6), but since their productivity has been significantly lower, this price differential was not enough to compensate for the low level of productivity. As a result, no significant differences in total income per ha are observed when we look at the median. Moreover, when we look at average total income per ha, producers who participate in the Nespresso program had a significantly lower total income per ha. In addition, total income remained unchanged over the two analyzed cropping cycles (2007-08 and 2009-10) for participating producers.
Table 16
Cost-benefit analysis per hectare in the Nespresso Cluster of Guatemala (2007-08 and 2009-10 cropping cycles)
Indicator
Non-Participant
(Ni=1=122)
Participant
(Ni=1=87)
Change over cropping cycles
Non-Participants
Participants
Total Income (US$/ha) 3,527*
(3,167) a 3,281
(3,107) +303
(+385)* +218
(+265)
Total Costs (US$/ha) 1,856
(1,771) 1,814
(1,667) -152
(-125) -366** (-45)
Net Income (US$/ha) 1,664
(1,378) 1,467
(1,478) +459**
(+493)*** +551*** (+350)
Investment (US$/ha) b 431 (0)
1,223 (83)***
-289 (0)
-2,068 (+2.5)
Average annual interest rates on loans (%) 25.24 (20)
21.75 (20)
-4.4 (-1.5)
+6.0 (+4.0)***
Estimated financial costs (US$/ha) 86 (0)
245 (17)***
-58 (0)
-413 (0)
Net Income after financial costs (US$/ha) 1,577* (1,339)
1,222 (1,371)
+518*** (+441)***
+965** (+585)**
*** α ≤ 0.01; ** α > 0.01 - ≤ 0.05; * α > 0.05 - ≤ 0.10
a The median is presented in parentheses as the variables sample distribution is not normal.
b Investment in the current and previous year have been added
Given that there is no significant difference in total income and in total production costs among producers who participate in the Nespresso Program and those who do not participate, as discussed early, no significant differences in net income can be observed among both groups. However, producers in both groups have significantly increased their net income over the two cropping cycles as a result of better coffee prices in the 2009-10 cropping cycle, compared to those in the 2007-08 cropping cycle. In addition, participating producers have decreased their production cost over the same time period.
If we also consider the higher investments made by coffee producers to increase future productivity, but also to comply with the quality, social and environmental standards of the

36
Nespresso AAA Sustainable Program, and subtract estimated financial costs at the median annual interest rate of 20%; average net income after deducting financial costs for participating producers is significantly lower than that of non-participants. However, when we analyze the medians instead of averages, there is no significant difference in net income per ha, even after deducting financial costs. Therefore, during the first four years of the project, it did not have a negative or positive effect in net producer income. However, as coffee producers who participate in the Nespresso Program have already made the necessary investments to participate in the program during the first two cropping cycles (2006-2008), and reduced their investments during the last two cropping cycles (2008-2010), their net income after financial costs has increased significantly in 2009-10, with respect to the 2007-08 cropping cycle.
Table 17 presents the results of the cost-benefit analysis for the Nespresso cluster in Guatemala, estimated in US$ per qq. Participating producers in Guatemala received a higher price (a four-year price differential average of +US$ 5.6), at the same time that coffee prices have been increasing over time for both groups at an annual average rate of 8.5%. However, the price received by participating producers only increased at an average annual rate of 1.9%, resulting in a decreased price differential with respect to the price received by non-participants, over the two analyzed cropping cycles.
Table 17 Cost-benefit analysis per qq of coffee produced in the Nespresso Cluster of Guatemala
(2007-08 and 2009-10 cropping cycles)
Indicator
Non-Participant
(Ni=1=122)
Participant
(Ni=1=87)
Change over cropping cycles
Non-Participants
Participants
Price (US$/qq) 112.35
(114.21) 117.88***
(122.18)*** +20.30***
(+18.46)*** +18,76***
(+15.35)***
Total unit production costs (US$/qq) 65.40
(60.85) 71.85** (63.44)
+2.81 (+2.40)
-4.78 (-2.32)
Net Income (US$/qq) 46.92
(50.42) 46.02
(55.63)* +17.33***
(+23.77)*** -23.54***
(+19.06)***
Investment (US$/qq) b 16.03 (0.00)
33.32 (2.62)***
-4.16 (0.00)
-51.57 (+0.29)
Average annual interest rates on loans (%) 25.24 (20)
21.75 (20)
-4.4 (-1.5)
+6.0 (+4.0)***
Estimated financial costs (US$/qq) 3.20
(0.00) 6.66
(0.52)*** -0.83 (0.00)
-10.3 (-0.06)
Net Income after financial costs (US$/qq) 43.73
(48.81) 39.36
(53.34) +18.28***
(+24.16)*** +33.86***
(+26.28)***
*** α ≤ 0.01; ** α > 0.01 - ≤ 0.05; * α > 0.05 - ≤ 0.10
a The median is presented in parentheses as the variables sample distribution is not normal.
b Investment in the current and previous year have been added
Given that there is no difference in total production costs among producers who participate in the Nespresso Program and those who do not participate, as presented in Table 16, and that productivity among non-participants is significantly higher (see Table 12), unit production costs (US$/qq) among participating producers are significantly higher that

37
among non-participating producers. Moreover, no significant difference in net unit margin (US$/qq) can be observed between participating and non-participating producers as the price differential only compensated the higher unit cost of participating producers, given their lower productivity.
4.7.2 Total and net income analysis in the Nespresso Cluster of Mexico
Table 18 presents results of the cost-benefit analysis for the Nespresso cluster in Mexico, estimated in US$ per hectare. Participating producers in Mexico only started to receive a positive and significant price differential during the 2009-10 and it was relatively low (+ US$ 2) and the four-year price differential average (2006-2010) was only +US$ 0.08. On the other hand, average productivity among participating producers has been significantly higher but the difference is small, and no significant differences in productivity can be observed when looking at the medians. Therefore, no significant differences can be observed in total income among producers who participate in the Nespresso Program and those who do not participate. However, total income has increased in the last cropping cycle (2009-10), mainly a as result of higher coffee prices.
Table 18 Cost-benefit analysis per hectare in the Nespresso Cluster of Mexico
(2007-08 and 2009-10 cropping cycles)
Indicator
Non-Participant
(Ni=1=126)
Participant
(Ni=1=156)
Change over cropping cycles
Non-Participants
Participants
Total Income (US$/ha) 1,027 (858) a
1,134 (915)
+307*** (+167)**
+190** (+196)*
Total Costs (US$/ha) 1,025 (886)a
1,102 (939)
+39 (-12)
-8 (+30)
Net Income (US$/ha) 2.5
(-24.7) 37.8
(23.5) +268***
(+178)*** +198*** (+85)
Investment (US$/ha) b 69 (0)
94 (1.4)***
+28 (+17)***
+36 (+31)***
Average annual interest rates on loans (%) 22.9
(15.0)*** 15.5 (6.0)
-16.8** (-10.0)**
-15.6* (0.0)
Estimated financial costs (US$/ha) 10.4* (0.0)
5.7 (0.1)***
+4.2 (+2.6)
+2.1 (+1.8)
Net Income after financial costs (US$/ha) -7.9
(-33.4) 26.1
(17.6) +264***
(+173.2)*** +126*** (+81.2)
*** α ≤ 0.01; ** α > 0.01 - ≤ 0.05; * α > 0.05 - ≤ 0.10
a The median is presented in parentheses as the variables sample distribution is not normal.
b Investment in the current and previous year have been added
Given that there is no significant difference in total production costs, neither on the prices received, among producers who participate in the Nespresso Program and those who do not participate, as discussed early, no significant differences in net income can be observed among both groups. However, producers in both groups have increased their net income significantly over the two analyzed cropping cycles, mainly as a result of better coffee prices in the 2009-10 cropping cycle, as coffee prices received by participating and non-
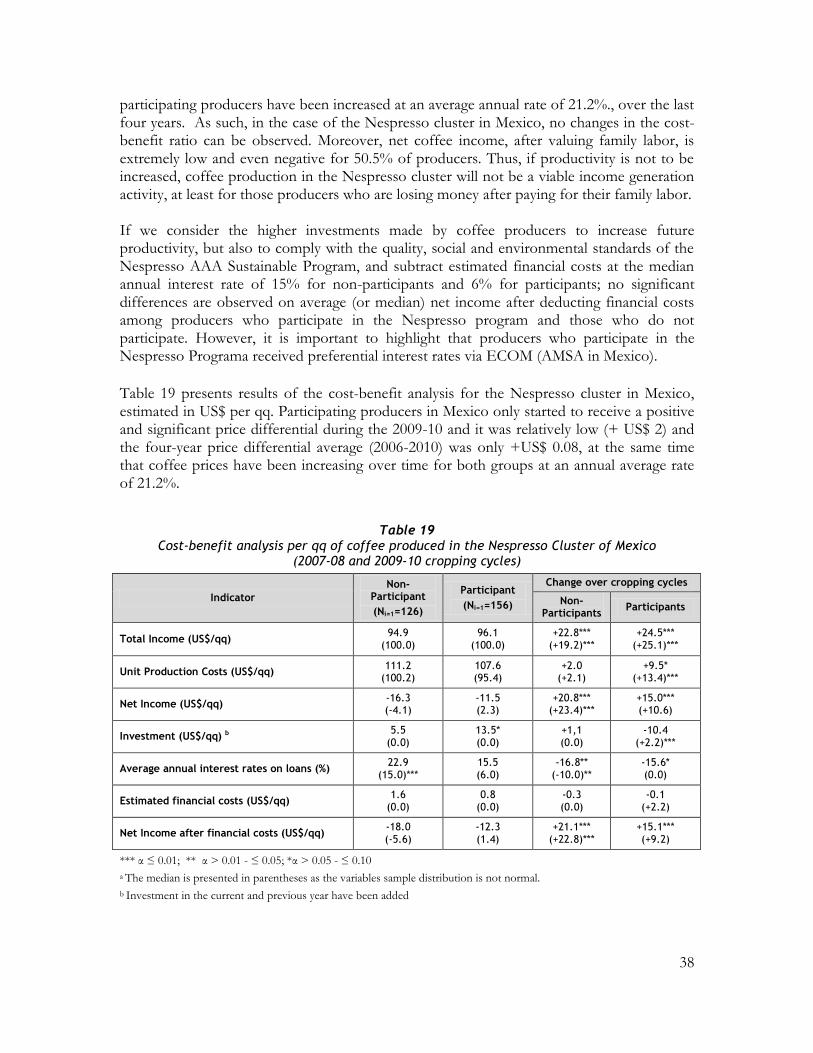
38
participating producers have been increased at an average annual rate of 21.2%., over the last four years. As such, in the case of the Nespresso cluster in Mexico, no changes in the cost-benefit ratio can be observed. Moreover, net coffee income, after valuing family labor, is extremely low and even negative for 50.5% of producers. Thus, if productivity is not to be increased, coffee production in the Nespresso cluster will not be a viable income generation activity, at least for those producers who are losing money after paying for their family labor. If we consider the higher investments made by coffee producers to increase future productivity, but also to comply with the quality, social and environmental standards of the Nespresso AAA Sustainable Program, and subtract estimated financial costs at the median annual interest rate of 15% for non-participants and 6% for participants; no significant differences are observed on average (or median) net income after deducting financial costs among producers who participate in the Nespresso program and those who do not participate. However, it is important to highlight that producers who participate in the Nespresso Programa received preferential interest rates via ECOM (AMSA in Mexico).
Table 19 presents results of the cost-benefit analysis for the Nespresso cluster in Mexico, estimated in US$ per qq. Participating producers in Mexico only started to receive a positive and significant price differential during the 2009-10 and it was relatively low (+ US$ 2) and the four-year price differential average (2006-2010) was only +US$ 0.08, at the same time that coffee prices have been increasing over time for both groups at an annual average rate of 21.2%.
Table 19 Cost-benefit analysis per qq of coffee produced in the Nespresso Cluster of Mexico
(2007-08 and 2009-10 cropping cycles)
Indicator
Non-Participant
(Ni=1=126)
Participant
(Ni=1=156)
Change over cropping cycles
Non-Participants
Participants
Total Income (US$/qq) 94.9
(100.0) 96.1
(100.0) +22.8***
(+19.2)*** +24.5***
(+25.1)***
Unit Production Costs (US$/qq) 111.2
(100.2) 107.6 (95.4)
+2.0 (+2.1)
+9.5* (+13.4)***
Net Income (US$/qq) -16.3 (-4.1)
-11.5 (2.3)
+20.8*** (+23.4)***
+15.0*** (+10.6)
Investment (US$/qq) b 5.5 (0.0)
13.5* (0.0)
+1,1 (0.0)
-10.4 (+2.2)***
Average annual interest rates on loans (%) 22.9
(15.0)*** 15.5 (6.0)
-16.8** (-10.0)**
-15.6* (0.0)
Estimated financial costs (US$/qq) 1.6
(0.0) 0.8
(0.0) -0.3 (0.0)
-0.1 (+2.2)
Net Income after financial costs (US$/qq) -18.0 (-5.6)
-12.3 (1.4)
+21.1*** (+22.8)***
+15.1*** (+9.2)
*** α ≤ 0.01; ** α > 0.01 - ≤ 0.05; *α > 0.05 - ≤ 0.10
a The median is presented in parentheses as the variables sample distribution is not normal.
b Investment in the current and previous year have been added

39
Given that there is no difference in total production costs among producers who participate in the Nespresso Program and those who do not participate (see Table 18), and average productivity among participating producers is significantly higher but the difference is small, or no significant differences in productivity can be observed when looking at the medians (see Table 13); no difference in unit production costs (US$/qq) among participating and non-participating producers can be observed. Given that there are no significant difference in prices and unit production costs, also no significant difference in net unit margin (US$/qq) can be observed between participating and non-participating producers.
Conclusion on Hypothesis 1 Given the above cost-benefit analysis between producers who participate in the Nespresso Program and those who do not participate, we reject hypothesis 1, as net benefits that result from the price differential received by coffee producers only compensates for the investment required to access this value chain. Therefore, net benefits received by coffee producers that participate in the Nespresso AAA – ECOM value chain are not greater, but equal to the investment required to access this value chain. This may change in the future as investment in re-planting and renewing coffee plantations, as well as in the better maintenance of coffee plantations, will probably result in productivity improvements in the next two years as those changes take time.
5. ACCESS TO LIVELIHOOD RESOURCES
HYPOTHESIS 2
Farmers with better access to resources (human, social, economic/financial, natural, physical) will benefit the most from participating in the Nespresso AAA – ECOM value chain.
5.1 Access to Resources in the Nespresso Cluster of Guatemala
Table 20 complements Table 4 with data on access to the five crucial resources for accessing specialty coffee markets (natural, human, social, physical and financial) in the Nespresso cluster of Guatemala, and compares this access between producers who participate in the Nespresso Program and those who do not participate in the program, as well as changes over the two cropping cycles (2007-08 and 2009-10). Resources included in Table 20, opposite to the ones presented before, are those that their access may be affected by participation in the Nespresso Program. A higher percentage of producer who participate in the Nespresso Program have a storage warehouse and a wet milling plant, and the percentage that has them, has been increasing over time. On the other hand, around thirty percent of coffee producers, whether they participate or not in the Nespresso Program, have warehouses for housing temporal

40
workers, and only ten percent have build appropriate housing facilities for temporal workers. The percentages of coffee producers who have these facilities have not increased over the two analyzed cropping cycles. Therefore, producers that were selected to participate in the program already had a better access to physical resources, which make easier for them to comply with the social standards of the program as it is to have a place to store farm inputs separate from the areas use for housing the family and farm workers. Most coffee producers who participate in the Nespresso Program in the Guatemala cluster relate with ECOM (Export Café in Guatemala) via their producer organizations, therefore, a higher percentage of participant coffee producers relate with ECOM and their producer organizations, while those who do not participate in the program relate mainly with local market agents. However, it is important to note that over the two analyzed cropping cycles, participant producers who relates directly with ECOM has increased, while those who relate with ECOM via their organizations, have decreased. Thus, producers who participate in the program are developing a direct relation with ECOM, which may be positive, but at the same time may weaken producer organizations.
Table 20 Access to livelihood resources among participating and non-participating producers in the
Nespresso Program in Guatemala (2007-08 and 2009-10 cropping cycles)
Indicator
Non-Participant
(Ni=1=122)
Participant
(Ni=1=87)
Change over Cropping Cycles
Non-Participants
Participants
Access to natural resources
% with arable land depth of more than 25 cm 48.8 54.0
% with arable land depth of more than 50 cm 8.2 8.6
Average area with planted forest (ha) 0.00 0.02 0.00 -0.03
% with timber trees in the coffee plantation 35.7 58.0*** +15.6** +10.3
% with non-timber trees in their coffee plantation 89.3 95.4** +1.6 +4.6
% with fruit trees 73.4 85.6*** +10.7** -3.4
% with plantain or banana in their plantation 29.5 39.1 +8.2 0.0
Access to human resources
% of plantation owners who live in the farm 58.2 66.1* +29.5*** +17.2**
% of owners whose principal activity is coffee 87.3 89.7 +2.5 +2.3
% who receive technical assistance and/or training for coffee-related activities
14.8 71.3*** +1.6 +4.6
Average number of technical assistance visits per year
0.3 1.7*** 0.0 +0.6**
% who pay for technical or entrepreneurial services
0.0 1.7** 0.0 +3.4*
Access to physical resources
% who have housing for workers 11.9 10.3 +0.8 0.0
% who have warehouses for housing temporal workers
24.6 29.3 +6.6 +5.7
% who have a storage warehouse 40.6 64.4*** +13.9** +6.9
% who have a wet milling plant 73.4 81.6** +12.3** +20.7***

41
Indicator
Non-Participant
(Ni=1=122)
Participant
(Ni=1=87)
Change over Cropping Cycles
Non-Participants
Participants
Access to social resources
% who relates with coffee producer organizations 23.4 50.6*** -7.4 -20.7***
% who relates with ECOM group exporters 11.1 56.3*** -7.4* +23.0***
% who relates with local market agents 74.6*** 29.9 0.0 -4.6
% who relates with other exporters 0.0 0.0 0.0 0.0
Access to financial resources
% who have access to financial services 32.4 45.4*** -36.9*** -56.3***
% who received credit 18.9 36.2*** -16.4*** -44.8***
% who received short-term credit 17.6 32.8*** -15.6*** -42.5***
% who received long-term credit 1.2 2.3 -0.8 -4.6**
*** α ≤ 0.01; ** α > 0.01 - ≤ 0.05; * α > 0.05 - ≤ 0.10
A higher percentage of coffee producers who participate in the Nespresso Program have access to financial services than those who do not participate, and more of them are receiving short-term credit, while both groups have no access to long-term credit, as the project via ECOM is facilitating access to financial services. However, given the recent financial crisis, the capacity of ECOM, as well as of other coffee traders, lend money to producers was reduced; thus, access to financial services and the use of them has decreased substantially over the two analyzed cropping cycles among participating and non-participating producers. This is important as may be explaining the significant decrease in coffee-related investments since the 2008-09 cropping cycle (see Figure 7 and Table 14).
5.2 Access to Resources in the Nespresso Cluster of Mexico
Table 21 complements Table 5 with data on access to the five crucial resources for accessing specialty coffee markets (natural, human, social, physical and financial) in the Nespresso cluster of Mexico, and compares this access between producers who participate in the Nespresso Program and those who do not participate in the program, as well as changes over the two cropping cycles (2007-08 and 2009-10). Resources included in Table 21, opposite to the ones presented before, are those that their access may be affected by participation in the Nespresso Program. With respect to access to the three crucial natural resources for agriculture (soil, water, and forest resources), we have seen previously that producers who participate in the Nespresso Program have a larger farm size than those who do not participate in the program, and a large area with natural forest. However, in the Mexico cluster, different from the case in Guatemala, there are a lower percentage of producers who participate in the Nespresso Program that have an arable land depth of more than 50 cm, and that have a water source in their coffee plantation. On the other hand, a significant larger number of producers who participate in the program have banana and plantain in their coffee plantation, but there is no significance difference on the percentage of producers that have timber, non-timber and fruit trees in their plantation; however, the percentage of producers that have fruit trees in

42
their plantation has increased over the two analyzed cropping cycles, among participating producers.
Table 21
Access to livelihood resources among participating and non-participating producers in the Nespresso Program in Mexico
(2007-08 and 2009-10 cropping cycles)
Indicator
Non-Participant
(Ni=1=126)
Participant
(Ni=1=156)
Change over Cropping Cycles
Non-Participants
Participants
Access to natural resources
% with arable land depth of more than 25 cm 64.3 61.2 +4.8 +0.6
% with arable land depth of more than 50 cm 23.0* 16.7 +4.8 +3.8
Average area with planted forest (ha) 0.01 0.01 -0.01 -0.01
% with timber trees in the coffee plantation 30.9 34.6 +7.9 +6.9
% with non-timber trees in their coffee plantation 98.0 98.4 -0.9 -0.6
% with fruit trees 88.1 90.7 +4.8 +12.2***
% with plantain or banana in their plantation 40.9 56.4*** -10.3* -9.0
Access to human resources
% of plantation owners who live in the farm 5.1 10.3** -0.8 +1.3
% of owners whose principal activity is coffee 56.3 60.3 -20.6*** -21.8***
% who receive technical assistance and/or training for coffee-related activities
13.9 62.5*** +0.8 +54.5***
Average number of technical assistance visits per year
0.3 1.5*** +0.1 +1.7***
% who pay for technical or entrepreneurial services
0.0 0.0 0.0 0.0
Access to physical resources
% who have housing for workers 0.4 1.6 +0.8 -0.6
% who have warehouses for housing temporal workers
0.0 3.5*** 0.0 +1.9
% who have a storage warehouse 0.8 6.1*** +1.6 +3.2
% who have a wet milling plant 0.0 0.3 0.0 +0.6
Access to social resources
% who relates with coffee producer organizations 3.2 1.9 -1.6 -1.3
% who relates with ECOM group exporters 86.1 97.8*** -13.5*** -0.6
% who relates with local market agents 34.5*** 16.3 -8.7 -1.9
% who relates with other exporters 0.0 0.0 0.0 0.0
Access to financial resources
% who have access to financial services 43.3 73.7*** -2.4 +24.4***
% who received credit 21.0 27.6* -0.8 +10.3**
% who received short-term credit 20.6 26.9* 0.0 +11.5**
% who received long-term credit 0.4 0.6 -0.8 -1.3
*** α ≤ 0.01; ** α > 0.01 - ≤ 0.05; * α > 0.05 - ≤ 0.10

43
Number of years of experience with coffee production and commercialization of the plantation owner, facilitates participation in the Nespresso Program (see Table 5), but also a higher percentage of participating producers live in the farm. In addition, a higher percentage of producers who participate in the program not only receive technical assistance and training (informal education), but are also receiving more visits of technical assistance per year, and this has increased over the two analyzed cropping cycles. It is also important to highlight that the percentage of producers whose principal economic activity is coffee, among both groups, have been decreasing over time. This shows that coffee producers in the Mexico cluster are diversifying their economic activities away from coffee production and commercialization, as coffee production, given actual productivity levels, is not a profitable activity as has been showed in Section 4. Opposite to the situation in Guatemala, producers who participate in the Nespresso Program in Mexico are nearer from the coffee collecting centers than those who do not participate (see Table 5), have warehouses to house temporal workers and storage warehouses, but the percentage that have these facilities is low and have only been increasing slightly over the two analyzed cropping cycles. In addition, as producers in Mexico sell their coffee in cherry, almost none of them own wet milling plants. There is almost none participation in producer organizations among producers in the Nespresso cluster of Mexico, and therefore, coffee producers relate mainly with ECOM (AMSA in the case of Mexico) and local market agents. However, there is a higher percentage of participant coffee producers who relate with ECOM, while those who do not participate in the program relate mainly with local market agents and the percentage who relate with ECOM, among non-participants, has been decreasing over the two analyzed cropping cycles. A higher percentage of coffee producers who participate in the Nespresso Program have access to financial services than those who do not participate in the program, and more of them are receiving short-term credit, while both groups have no access to long-term credit. On the other hand, it is important to highlight that access to financial services and the use of credit has increased significantly over the two analyzed cropping cycles among participating producers. This may explain the higher and significant investment levels of producers who participate in the Nespresso Program, compared to those who do not participate in the program, especially for making the required investments to meet with the social requirements of the AAA Sustainability Program.
5.3 Influence of access to resources on the net benefits of producers who participate in the Nespresso Program
To analyze how access to resources influence the net benefits received by producers who participate in the Nespresso Program, the following ordinary least squares (OLS) regression model was analyzed:

44
where: netincomei=1 = net coffee income for the 2009-10 cropping cycle (US$/ha/year) of
producers who participate in the Nespresso Program
n = access to natural resources
h = access to human resources
s = access to social resources
p = access to physical resources
f = access to financial resources
This model was run using a stepwise regression to simplify the model keeping only the variables that better explain differences in net income (P ≤ |0.10|). A stepwise regression drops first the predictor with the highest t probability, re-estimates the model, and then decides whether to drop another further until all the variables included have the desired level of confidence, in this case P ≤ |0.10|. Through this process of backward elimination we were seeking a more parsimonious model; one that is simpler but fits almost equally well. Results are presented in Table 22.
Table 22
Stepwise regression results on the influence of access to resource on net benefits perceived by producers who participate in the Nespresso Program in Guatemala (2009-10 cropping cycle)
The first set of variables that influence the level of net benefits of producers who participate in the Nespresso Program are those related with access to natural resources. As such, producers with a more fertile soil (arable land depth of more than 50 cm), and with a natural source of water and timber trees in their coffee plantation, have perceived a higher net benefit per ha, while the establishment of plantain and bananas in the coffee plantation affects net income negatively. Natural resources (soil fertility, water availability, and coffee plantation shadow) influence coffee productivity, and therefore, are influencing producers‟ net income from coffee production. On the other hand, the establishment of plantain and bananas in coffee plantations may be reducing space for coffee plants, reducing planting density, and therefore, coffee productivity; however, this may be contributing to income diversification but in this impact assessment only coffee income was assessed.
_cons 277.2432 274.6897 1.01 0.316 -269.5129 823.9994 acceso0 2.373189 1.407092 1.69 0.096 -.4275587 5.173936 exper0 16.35013 8.674099 1.88 0.063 -.9152342 33.61549 educa0 113.4285 27.00982 4.20 0.000 59.66683 167.1902 madera0 444.3074 216.9003 2.05 0.044 12.57801 876.0367 musacea0 -520.881 221.9189 -2.35 0.021 -962.5996 -79.16238 fuenteagua0 547.2367 236.2059 2.32 0.023 77.08059 1017.393 arable501 1083.561 447.9641 2.42 0.018 191.9112 1975.212 netincome1 Coef. Std. Err. t P>|t| [95% Conf. Interval]
Total 141834354 86 1649236.68 Root MSE = 919.97 Adj R-squared = 0.4868 Residual 66860936.4 79 846340.968 R-squared = 0.5286 Model 74973417.9 7 10710488.3 Prob > F = 0.0000 F( 7, 79) = 12.66 Source SS df MS Number of obs = 87

45
The time required to take coffee to the collection center in minutes, a proxy to assess access to road infrastructure (physical resources), influences producers‟ net income from coffee production and commercialization activities. This may be because plantations that are further from urban areas have a better access to natural resources, especially as it relates to having a source of water in the plantation, influencing positively productivity, and therefore, the possibility to benefit from participating in the Nespresso Program, as explained before in Section 4. Two variables that assess access to human resources have also had a significant and positive influence on coffee net income: years of formal education and years of experience with coffee of the plantation owner. This shows that access to human resources is crucial to benefit from the Nespresso Program. To analyze further how access to resources influence the net benefits received by producers who participate in the Nespresso Program, the same model run for the Guatemala cluster war run for the Mexico one. Results are presented in Table 23.
Table 23
Stepwise regression results on the influence of access to resource on net benefits perceived by producers who participate in the Nespresso Program in Mexico (2009-10 cropping cycle)
The first set of variables that influence the level of net benefits of producers who participate in the Nespresso Program are those related with access to natural resources. As such, producers with a natural source of water and non-timber trees in their coffee plantation have perceived a higher net benefit per ha. This reinforces the results found for producers who participate in the Nespresso Program in Guatemala, as access to natural resources (soil fertility, water availability, and coffee plantation shadow) influence coffee productivity, and therefore, are influencing producers‟ net income from coffee production. Access to human resources, assessed by the number of family members who work on coffee-related activities, years of formal education and age of coffee plantation, among producers who participate in the Nespresso Program in Mexico, as is also the case in Guatemala, have had a significant and positive influence on net coffee income. In addition, access to technical assistance has also had a positive effect. Again these resources may have also been influencing net income via its effect on coffee productivity.
_cons -726.4331 256.4221 -2.83 0.005 -1231.233 -221.6335 nomadera0 387.361 222.9629 1.74 0.083 -51.56998 826.2921 asist0 237.9577 60.43373 3.94 0.000 118.9862 356.9292 educa0 16.64706 7.557579 2.20 0.028 1.769 31.52512 edad0 3.419741 1.990624 1.72 0.087 -.4990569 7.338538 fuenteagua0 126.1504 60.22294 2.09 0.037 7.59385 244.707 nmiembros0 46.29665 17.35183 2.67 0.008 12.13734 80.45595 netnetinco~1 Coef. Std. Err. t P>|t| [95% Conf. Interval]
Total 59873150.3 281 213071.709 Root MSE = 438.57 Adj R-squared = 0.0973 Residual 52894482.2 275 192343.572 R-squared = 0.1166 Model 6978668.14 6 1163111.36 Prob > F = 0.0000 F( 6, 275) = 6.05 Source SS df MS Number of obs = 282
46
Conclusion on Hypothesis 2 Given the above analysis on how access to human, social, economic/financial, natural and physical resources influences the possibility of coffee producers to benefit from their participation in the Nespresso value chain, we partially accept hypothesis 2, as access to natural and human resources improves the possibilities of coffee producers of benefiting from participating in this value chain. This reinforces the importance of improving productivity for benefiting from participating in the Nespresso Program as it is highly related with knowledge and experience on coffee production, as well as with the endowment of natural resources.
6. SOCIAL IMPACT OF THE NESPRESSO PROGRAM
HYPOTHESIS 3
The Nespresso AAA – ECOM value chain contributes to quality employment generation in its territories of influence
6.1 Employment in the Nespresso Cluster of Guatemala
Table 24 provides information on employment generated by coffee producers in the Nespresso cluster of Guatemala, differentiated by type of contract and gender, as well as wages and non-wage benefits that employees receive. This analysis also compares employment generation between producers who participate in the Nespresso Program and those who do not participate in the program, as changes over the cropping cycles 2007-08 and 2009-10 for both groups of producers. Most coffee producers in the Nespresso cluster of Guatemala hire labor for coffee-related activities1; however, producers who participate in the Nespresso Program generate more temporal jobs and more jobs for women. Employment of children is very low in both groups, and the tendency among producers who participate in the Nespresso Program has been to significantly reduce any children employment. In addition, coffee-related activities are providing temporal employment for an average of 2.5 family members, implying imputed remuneration for the family, and there is no difference between both groups. Labor productivity, estimated by the number of qq of dry parchment coffee produced by temporal worker (family members plus hired labor), is significantly higher among producers who participate in the Nespresso Program, but it did not changed over the two analyzed cropping cycles. On the other hand, producers who participate in the program pay slightly higher wages for pre-harvest coffee plantation maintenance, but wages paid for all activities
1 Coffee-related activities includes all those activities required to secure the necessary inputs for coffee production, maintain coffee plantations, harvest coffee beans, process the beans in the farm, and to negotiate and commercialize the coffee production, which are perform or sub-contracted by coffee producers.

47
among producers who participate in the program have been decreasing over the two analyzed cropping cycles.
Table 24 Employment generation for coffee-related activities among participating and non-
participating producers in the Nespresso Cluster of Guatemala (2007-08 and 2009-10 cropping cycles)
Indicator
Non-Participant
(Ni=1=122)
Participant
(Ni=1=87)
Change over Cropping Cycles
Non-Participants
Participants
Number of jobs generated by source of labor, type of contract and gender
% who hire labor for coffee-related activities 95.5 97.6 +5.7** +2.3
Permanent personnel hire during the whole year 0.17 0.11 -0.02 +0.04
Temporal jobs generated during the cropping cycle
10.7 17.5*** -0.11 +8.6
Family members employed during the cropping cycle
2.5 2.4 +0.5** +0.5
Women employed 4.4 6.8*** +0.7 +4.5
Youth (15-18 years old) employed 1.4 1.6 +0.2 -0.8
Children (<15 years old) employed 0.4 0.4 -0.2 -1.5*
Labor productivity (qq/worker) 4.1 6.3*** -1.0 -1.1
Wages paid by type of work
Average day-wage for pre-harvest maintenance activities (US$)
5.80 5.97* +0.16 -0.48***
Average wage for harvesting (US$) 5.46 5.43 -0.42*** -0.85***
Average day-wage for coffee wet milling (US$) 5.87 6.05 +0.13 -0.68***
Non-wage benefits
Workers who receive additional benefits to their wage (%)
66.4 83.3*** +18.0*** +8.0
% with potable water for workers 85.2 93.9** +16.7*** +5.0
% with proper housing for workers 33.3 30.4 -14.3* +8.1
% with sanitary services for workers 69.1 88.5*** +41.2*** +13.8***
% who receive health services 16.7 28.4** +16.8*** +17.9**
*** α ≤ 0.01; ** α > 0.01 - ≤ 0.05; * α > 0.05 - ≤ 0.10
A higher percentage of producers who participate in the Nespresso Program offer non-wage benefits to workers; however, the percentage of non-participating producers who offer non-wage benefits has increased more over time, than the percentage of participating producers who offer these benefits. This may be an indirect effect of the program in the territory, given the competition for labor for coffee-related activities in the region. Figure 13 graphs the percentage of coffee producers in the Nespresso cluster of Guatemala who have access to basic services such as proper housing, potable water, sanitary services

48
and basic health care (for themselves and their family members), at the same time that provide those services to farm laborers while working in the farm. These non-wage benefits are differentiated by type, as well by whether or not the producer participates or not in the Nespresso Program. This graph shows that a higher percentage of producers among those who participate in the Nespresso Program, offer non-wage benefits to workers, and the non-wage benefits that they provide, in order of importance, are access to potable water, sanitary facilities, proper housing, and basic health services.
Figure 13 Coffee producers who offer non-wage benefits to workers in the Nespresso Cluster of
Guatemala (2007-08 and 2009-10 cropping cycles)
The numbers on top of the bars report the difference between producers who participate in the Nespresso Program and does who do not participate, and the number of stars the probability of error when concluding that this difference is ≠ 0. *** α ≤ 0.01; ** α > 0.01 - ≤ 0.05; * α > 0.05 - ≤ 0.10
6.2 Employment in the Nespresso Cluster of Mexico
Table 25 provides information on employment generated by coffee producers in the Nespresso cluster of Mexico, differentiated by type of contract and gender, as well as wages and non-wage benefits that employees receive. This analysis also compares employment generation between producers who participate in the Nespresso Program and those who do not participate in the program, as changes over the cropping cycles 2007-08 and 2009-10 for both groups of producers. As in Guatemala, a large percentage of coffee producers in the Nespresso cluster of Mexico hire labor for coffee-related activities, although the percentage is slightly lower, and addition, the percentage of producers who hire labor is significantly larger among producers who participate in the Nespresso Program. However, the percentage of producers who hire labor for coffee-related activities, among both groups of producers, have decreased significantly

49
over the two analyzed cropping cycles. Producers who participate in the Nespresso Program generate more temporal jobs, as well as more jobs for women and youth. Employment of children is very low in both groups, and the tendency among both groups of producers is to maintain this unchanged. In addition, coffee-related activities are providing temporal employment for an average of three family members, implying imputed remuneration for the family, and there is no difference between both groups.
Table 25
Employment generation for coffee-related activities among participating and non-participating producers in the Nespresso Cluster of Mexico (2007-08 and 2009-10 cropping
cycles)
Indicator
Non-Participant
(Ni=1=126)
Participant
(Ni=1=156)
Change over Cropping Cycles
Non-Participants
Participants
Number of jobs generated by source of labor, type of contract and gender
% who hire labor for coffee-related activities 72.2 86.2*** -14.3** -9.6**
Permanent personnel hire during the whole year 0.02 0.07 -0.03 +0.02
Temporal jobs generated during the cropping cycle
3.8 6.3*** -0.5 -0.5
Family members employed during the cropping cycle
2.8 2.9 +0.5** +0.5**
Women employed 3.1 4.5*** +0.1 0.0
Youth (15-18 years old) employed 0.3 0.7*** -0.1 +0.1
Children (<15 years old) employed 0.2 0.2 0.0 -0.1
Labor productivity (qq/worker) 3.8 9.7*** +0.3 +0.5
Wages paid by type of work
Average day-wage for pre-harvest maintenance activities (US$)
7.7 8.8 -0.1 -0.7
Average wage for harvesting (US$/can of 5 gallons of cherry coffee)
7.7 7.8 +1.0*** +0.9***
Average day-wage for coffee wet milling (US$) a - - - -
Non-wage benefits
Workers who receive additional benefits to their wage (%)
11.1 18.6** -14.3*** -6.4
% with potable water for workers 6.3 8.7 -9.5*** -4.5
% with proper housing for workers 6.3 7.3 -9.5*** -7.0**
% with sanitary services for workers 5.2 6.7 -8.7*** -9.6***
% who receive health services 9.1 10.6 -15.1*** -16.0***
*** α ≤ 0.01; ** α > 0.01 - ≤ 0.05; * α > 0.05 - ≤ 0.10
a Coffee producers of Inxhuatlan del Café in Mexico do not wet mill their coffee but sell it as cherry, therefore, they do not pay wages for wet milling.
Labor productivity in the Nespresso cluster in Mexico, estimated by the number of qq of dry parchment coffee produced by temporal worker (family members plus hired labor), is significantly higher among producers who participate in the Nespresso Program, but it did

50
not changed over the two analyzed cropping cycles. Wages paid by coffee producers in the Mexico Nespresso cluster are higher than those paid by producers in the Guatemala cluster, but do not differ between producers who participate in the Nespresso Program and those who do not participate, and harvest wages have been increased over the two analyzed cropping cycles by both groups. A higher percentage of producers who participate in the Nespresso Program offer basic non-wage benefits to workers; however, the percentages of non-participating and participating producers who offer non-wage benefits have been decreasing over time. This trend is the opposite as the one in the Guatemala Nespresso cluster and may be related to increased wages in Mexico that are forcing coffee producers to reduce their costs in other areas. Figure 14 graphs the percentage of coffee producers in the Nespresso cluster of Mexico who have access to basic services such as proper housing, potable water, sanitary services and basic health care (for themselves and their family members), at the same time that provide those services to farm laborers while working in the farm. These non-wage benefits are differentiated by type, as well by whether or not the producer participates or not in the Nespresso Program, and shows that a higher percentage of producers, among those who participate in the Nespresso Program, offer non-wage benefits to workers, but this percentage is significantly lower in Mexico than in Guatemala. Producers who provide non-wage benefits to workers offer, in order of importance, access to basic health services, sanitary facilities, potable water, and proper housing.
Figure 14 Coffee producers who offer non-wage benefits to workers in the Nespresso Cluster of Mexico
(2007-08 and 2009-10 cropping cycles)
The numbers on top of the bars report the difference between producers who participate in the Nespresso Program and does who do not participate, and the number of stars the probability of error when concluding that this difference is ≠ 0. *** α ≤ 0.01; ** α > 0.01 - ≤ 0.05; * α > 0.05 - ≤ 0.10

51
Conclusion on Hypothesis 3 Given the above analysis on employment generation, day-wages paid, and basic non-wage benefits offered by coffee producers, we partially accept hypothesis 3, as coffee producers who participate in the Nespresso value chain are generating more employment than non-participants, at the same time that a higher percentage of participating producers are offering basic non-wage benefits than non-participants. However, initial positive wage differences offered by participating producers disappeared in the 2009-10 production cycle, most probably as a response to the pressure to reduce costs.
7. ENVIRONMENTAL IMPACT OF THE NESPRESSO PROGRAM
HYPOTHESIS 4: ENVIRONMENTAL IMPACT
The Nespresso AAA - ECOM value chain contributes to improved environmental management in its territories of influence.
7.1 Natural Resource Management in the Nespresso Cluster of Guatemala
To evaluate how the Nespresso Program influences the adoption of water, soil and forest conservation practices, and therefore contributes to improved environmental management, Table 26 compares the extent that in the 2007-08 and 2009-10 cropping cycles coffee producers in the Nespresso cluster of Guatemala were applying these practices, and the differences between producers who participate in the Nespresso Program and those who do not participate in the program, as well as between both cropping cycles. Results show that there are a significant higher percentage of coffee producers who participate in the Nespresso Program in Guatemala that apply water, soil and forest conservation practices, and that these percentages, with the exception of forest conservation practices, have been increasing over the analyzed period. As these practices are required to comply with the Nespresso Program standards, this finding shows a direct contribution of the project to improved natural resources management. However, during the analyzed cropping cycles, the percentage of producers who do not participate in the Program that are applying these practices has been increasing.

52
Table 26 Adoption of soil, water and forest conservation practices in Nespresso Cluster of Guatemala
(2007-08 and 2009-10 cropping cycles)
Indicator
Non-Participant
(Ni=1=122)
Participant
(Ni=1=87)
Change over cropping cycles
Non-Participants
Participants
% of producers who apply water conservation practices
32.0 63.2*** +21.3*** +2.3
% of producers who treat residual waters 14.8 36.2*** +13.1*** +5.7
% of producers who apply soil conservation practices
22.5 40.2*** +10.7** +9.2
% of producers who apply forest conservation practices
18.0 25.9** 0.0 -14.9**
*** α ≤ 0.01; ** α > 0.01 - ≤ 0.05; * α > 0.05 - ≤ 0.10
7.2 Natural Resource Management in the Nespresso Cluster of Mexico
Table 27 compares the extent that in the 2007-08 and 2009-10 cropping cycles coffee producers in the Nespresso cluster of Mexico were applying water, soil and forest conservation practices, and the differences between producers who participate in the Nespresso Program and those who do not participate in the program, as well as between both cropping cycles. These results show that there are a significant higher percentage of coffee producers who participate in the Nespresso Program in Mexico that apply soil and forest conservation practices, but there is no difference on the percentages who apply water conservation practices.
Table 27 Adoption of soil, water and forest conservation practices in Nespresso Cluster of Mexico
(2007-08 and 2009-10 cropping cycles)
Indicator
Non-Participant
(Ni=1=126)
Participant
(Ni=1=156)
Change over cropping cycles
Non-Participants
Participants
% of producers who apply water conservation practices
19.0 16.0 -7.9* -1.3
% of producers who treat residual waters 0.4 0.6 -0.8 0.0
% of producers who apply soil conservation practices
11.5 19.9*** +2.4 +11.5***
% of producers who apply forest conservation practices
9.9 19.9*** -4.0 -3.8
*** α ≤ 0.01; ** α > 0.01 - ≤ 0.05; * α > 0.05 - ≤ 0.10
It is also important to note that almost none of the producers treat residual waters from milling activities as they do not wet mill their coffee in the farm, but sell their coffee as cherry. No significant changes in the application of these practices and be observed over the analyzed period with the exception of a significant reduction in the percentage of non-participants who apply water conservation practices, and a significant increase in the percentage of participants who apply soil conservation practices.

53
Figure 15 graphs the adoption of water, soil and forest resource conservation practices, and compares these figures between producers who participate in the Nespresso Program and those who do not participate in the program, as well as between the Guatemala and the Mexico Nespresso clusters. As stated before, the adoption of natural resource conservation practices has been higher among producers who participate in the Nespresso Program in both clusters (Guatemala and Mexico); however, the adoption of these practices has been significantly higher in the Guatemala cluster.
Figure 15
Comparison on natural resources conservation practices adoption in the Nespresso Clusters of Guatemala and Mexico (2007-08 and 2009-10 cropping cycles)
The numbers on top of the bars report the difference between producers who participate in the Nespresso Program and does who do not participate, and the number of stars the probability of error when concluding that this difference is ≠ 0. *** α ≤ 0.01; ** α > 0.01 - ≤ 0.05; * α > 0.05 - ≤ 0.10
Conclusion on Hypothesis 4 Given the above analysis on the adoption of soil, water and forest conservation practices, we can accept hypothesis 4, as a higher percentage of coffee producers who participate in the Nespresso value chain are applying these natural resource conservation practices, and therefore, are contributing to an improved environmental management in their territories of influence. The project contributed to this impact by supporting producers to comply with the environmental standards of the Nespresso Program.

54
8. ANALYSIS OF RELATIONS AMONG VALUE CHAIN ACTORS
HYPOTHESIS 5: TYPE OF RELATIONS AMONG VALUE CHAIN ACTORS
Relations among actors who participate in the Nespresso AAA - ECOM value chain are more transparent and power is more balanced than relations among actors who participate in the Conventional-ECOM supply chain, resulting on positive benefits for coffee producers from these relations. To conduct this analysis, data was generated by asking coffee producers with whom they relate to develop their different coffee production and commercialization activities. For each chain actor with whom the producer has a relationship, specific questions were asked about this relationship, including the purpose of the relation, the type of relation, the negotiation power that producers perceives that they have when they relate to this chain actor, and the benefits from this relation. As an important percentage of coffee producers responded that they interact with ECOM and other local market agents, and these relations are of interest to the project, these relations are analyzed in detail. In addition, in the case of the Nespresso cluster of Guatemala, the percentage of coffee producers that interact with producer organizations is significantly larger than the percentage that does that in the Nespresso cluster in Mexico. An important reason for this is that in the case of Huehuetenango (Guatemala), Export Café (ECOM) relates to a large percentage of their Nespresso value chain suppliers via producer organizations, while in the case of Ixhuatlán del Café (Mexico), AMSA (ECOM) relates directly with their coffee suppliers.
8.1 Analysis of Value Chain Actors Relations in the Nespresso Cluster of Guatemala
Table 28 presents the analysis of the relations in the Nespresso cluster of Guatemala between coffee producers and their organizations, and differentiates them by whether or not the producer participates in the Nespresso Program. In addition, an analysis on how these relations changed from the 2007-08 to the 2009-10 cropping cycle is included for two key variables: the percentage of producers who relate with producer organizations and the percentage who consider that they benefited from this relation. The percentage of coffee producers who participate in the Nespresso Program that interact with coffee producer organizations is significantly larger than among those who do not participate in the program (50.6% vs. 23.4%). This is an expected results as most coffee producers who participate in the Nespresso Program does that via their producer organizations and not individually. Only larger non-organized producers relate directly with Export Café (ECOM in Guatemala. In addition, smaller-scale organized coffee producers who participate in the program, not only have a commercial relation with producer organizations, but they also access through them financial services, training, and technical assistance. Thus, this relation is crucial for small-scale producers, not only to comply with the required verification to participate in the program, but to be able to have access to the program.

55
Table 28 Analysis of the relation between coffee producers and their organizations in the Nespresso
cluster of Guatemala (2007-08 and 2009-10 cropping cycles)
Indicator
Non-Participant
(Ni=1=122)
Participant
(Ni=1=87)
Change over Cropping Cycles
Non-Participants
Participants
% of producers who relate with producer organizations
23.4 50.6*** -7.4 -20.7***
Purpose of the relation (% of respondents)
For commercialization purposes 91.2 85.2
For accessing financial resources 21.0 27.3
For receiving technical assistance 8.8 28.4***
For training purposes 7.0 30.7***
Type of relation (% of respondents)
Sporadic relation 28.1** 12.5
Short-term relation 42.1 39.8
Stable and long-term relation 28.1 30.7
Perceived producer negotiation power (% of respondents)
High 7.0 22.7**
Medium high 26.3 19.3
Medium 36.8 40.9
Medium low 5.3 9.1
Low 14.0* 5.7
% who consider that they benefited from this relation
85.9 100.0*** +24.2*** 0.0
*** α ≤ 0.01; ** α > 0.01 - ≤ 0.05; * α > 0.05 - ≤ 0.10
Table 29 presents the same analysis on the relations between coffee producers and Export Café (ECOM), and the same trends can be observed in the relations between coffee producers and Export Café. The percentage of coffee producers who participate in the Nespresso Program that interact with Export Café is significant larger than among those who do not participate in the program (56.3% vs. 11.1%). Producers, who relate with Export Café, whether or not they participate in the Nespresso Program, do so for the main purpose of commercializing their produce. However, as producers who participate in the Nespresso Program also receive other complementary services, results show that there are a significant larger percentage of coffee producers who participate in the program that not only have a commercial relation with Export Café (ECOM), but they also relate with the exporter company to access other services. These services include financial, technical and entrepreneurial services, and training, all crucial to obtain the required verification to participate in the program. The Nespresso Program in Guatemala relates under a differentiated scheme with small and medium-scale producers than with larger-scale producers. With the former, it relates via their producer organizations, and with the latter, it does so directly. This is an important strategy to reduce the transaction costs of relating with many small and medium-scale producers, at the same time that permits supplying from them, given the quality of their coffee, at the
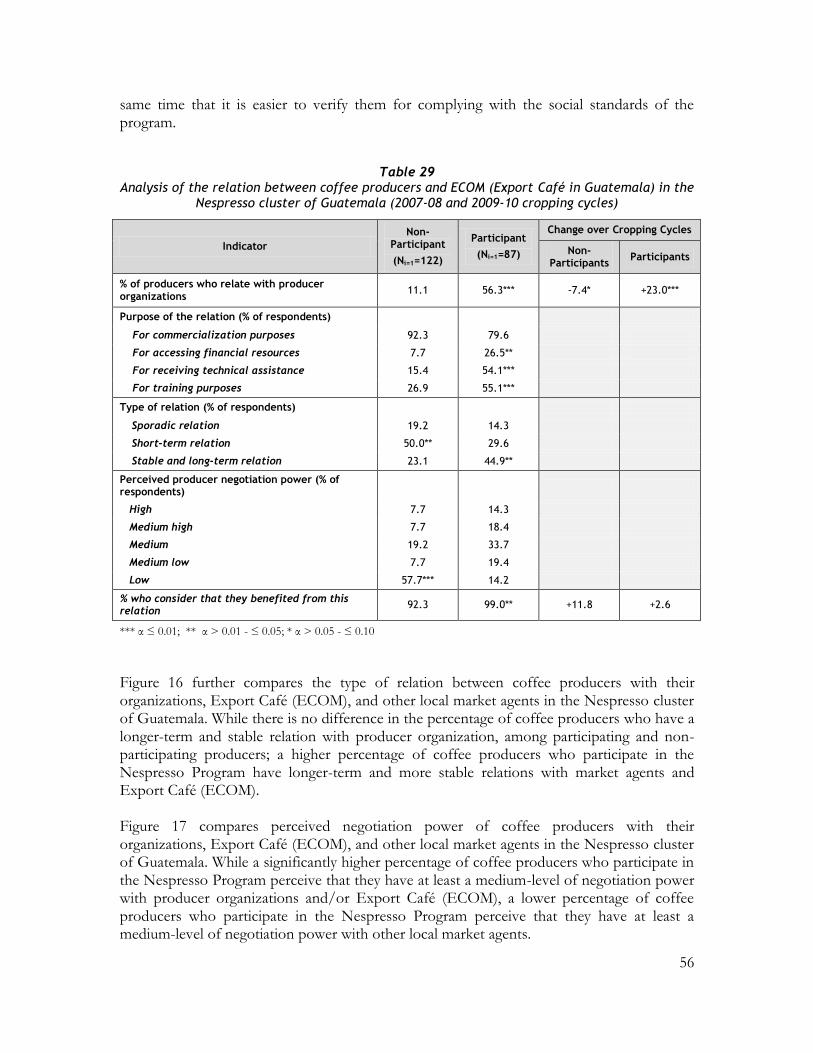
56
same time that it is easier to verify them for complying with the social standards of the program.
Table 29
Analysis of the relation between coffee producers and ECOM (Export Café in Guatemala) in the Nespresso cluster of Guatemala (2007-08 and 2009-10 cropping cycles)
Indicator
Non-Participant
(Ni=1=122)
Participant
(Ni=1=87)
Change over Cropping Cycles
Non-Participants
Participants
% of producers who relate with producer organizations
11.1 56.3*** -7.4* +23.0***
Purpose of the relation (% of respondents)
For commercialization purposes 92.3 79.6
For accessing financial resources 7.7 26.5**
For receiving technical assistance 15.4 54.1***
For training purposes 26.9 55.1***
Type of relation (% of respondents)
Sporadic relation 19.2 14.3
Short-term relation 50.0** 29.6
Stable and long-term relation 23.1 44.9**
Perceived producer negotiation power (% of respondents)
High 7.7 14.3
Medium high 7.7 18.4
Medium 19.2 33.7
Medium low 7.7 19.4
Low 57.7*** 14.2
% who consider that they benefited from this relation
92.3 99.0** +11.8 +2.6
*** α ≤ 0.01; ** α > 0.01 - ≤ 0.05; * α > 0.05 - ≤ 0.10
Figure 16 further compares the type of relation between coffee producers with their organizations, Export Café (ECOM), and other local market agents in the Nespresso cluster of Guatemala. While there is no difference in the percentage of coffee producers who have a longer-term and stable relation with producer organization, among participating and non-participating producers; a higher percentage of coffee producers who participate in the Nespresso Program have longer-term and more stable relations with market agents and Export Café (ECOM). Figure 17 compares perceived negotiation power of coffee producers with their organizations, Export Café (ECOM), and other local market agents in the Nespresso cluster of Guatemala. While a significantly higher percentage of coffee producers who participate in the Nespresso Program perceive that they have at least a medium-level of negotiation power with producer organizations and/or Export Café (ECOM), a lower percentage of coffee producers who participate in the Nespresso Program perceive that they have at least a medium-level of negotiation power with other local market agents.
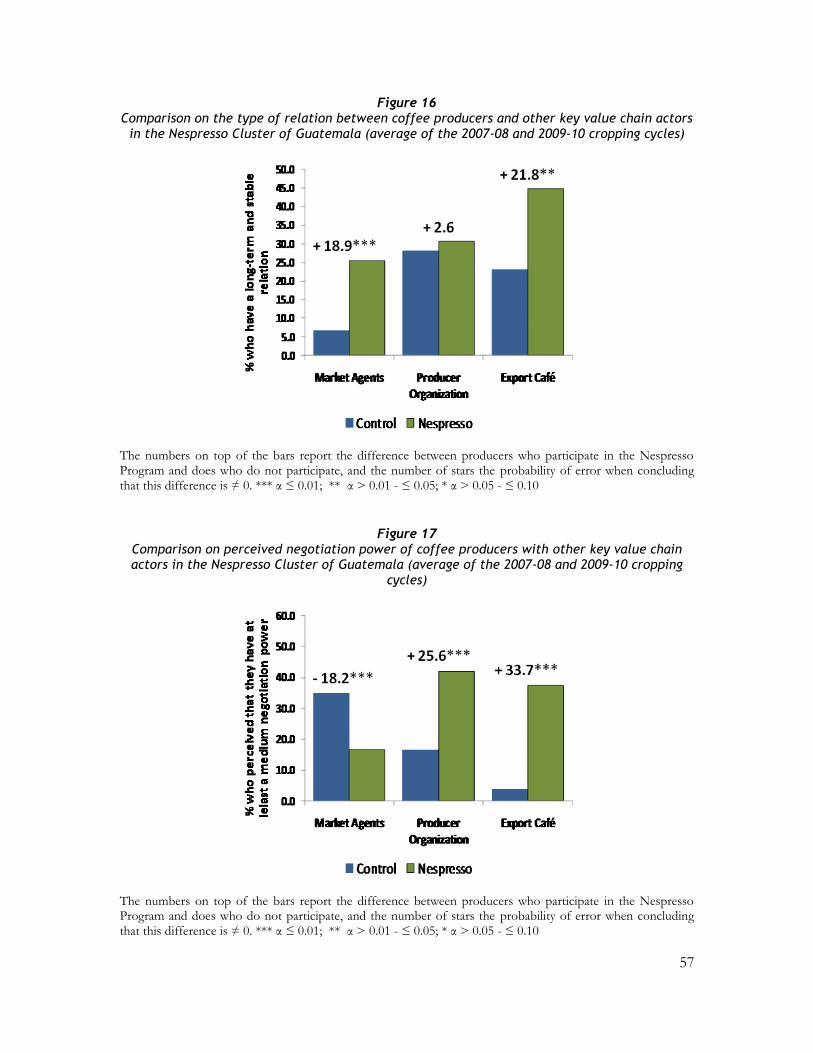
57
Figure 16 Comparison on the type of relation between coffee producers and other key value chain actors
in the Nespresso Cluster of Guatemala (average of the 2007-08 and 2009-10 cropping cycles)
The numbers on top of the bars report the difference between producers who participate in the Nespresso Program and does who do not participate, and the number of stars the probability of error when concluding that this difference is ≠ 0. *** α ≤ 0.01; ** α > 0.01 - ≤ 0.05; * α > 0.05 - ≤ 0.10
Figure 17
Comparison on perceived negotiation power of coffee producers with other key value chain actors in the Nespresso Cluster of Guatemala (average of the 2007-08 and 2009-10 cropping
cycles)
The numbers on top of the bars report the difference between producers who participate in the Nespresso Program and does who do not participate, and the number of stars the probability of error when concluding that this difference is ≠ 0. *** α ≤ 0.01; ** α > 0.01 - ≤ 0.05; * α > 0.05 - ≤ 0.10

58
To assess the bottom line on whether coffee producers have benefited or not from their relations with other value chain actors, Figure 18 compares responses on whether coffee producers perceived that they benefited from their relationship with their organizations, Export Café (ECOM), and other local market agents in the Nespresso cluster of Guatemala. A significantly higher percentage of coffee producers who participate in the Nespresso Program consider that they have benefited from relating with Export Café (ECOM) directly or via their producer organizations.
Figure 18
Comparison on the percentage of coffee producers who agree that they have benefited as a result of their relation with other key value chain actors in the Nespresso Cluster of
Guatemala (average of the 2007-08 and 2009-10 cropping cycles)
The numbers on top of the bars report the difference between producers who participate in the Nespresso Program and does who do not participate, and the number of stars the probability of error when concluding that this difference is ≠ 0. *** α ≤ 0.01; ** α > 0.01 - ≤ 0.05; * α > 0.05 - ≤ 0.10
On the other hand, there are a higher percentage of non-participant producers who consider that they have benefited from their relations with other local market agents. Usually, producers who have established a long-term relation with local market agents have a lower interest to participate in producer organizations, or to relate with exporters, as they perceive that their commercialization has been resolved and are not willing to invest on the interaction costs of participating in the producer organizations, or of establishing a new commercial relation.
8.2 Analysis of Value Chain Actors Relations in the Nespresso Cluster of Mexico
Table 30 presents the analysis of the relations in the Nespresso cluster of Mexico between coffee producers and AMSA (ECOM), and differentiates them by whether or not the producer participates in the Nespresso Program. In addition, an analysis on how these

59
relations changed from the 2007-08 to the 2009-10 cropping cycle is included for two key variables: the percentage of producers who relate with AMSA (ECOM) and the percentage who consider that they benefited from this relation. The percentage of coffee producers who participate in the Nespresso Program that interact with AMSA (ECOM) is significant larger than among those who do not participate in the program (97.8% vs. 86.1%); however, it is high for both group of producers, showing that coffee producers in the Nespresso cluster of Mexico do not have many alternatives to commercialize their coffee. Moreover, the presence of coffee producer organizations in this cluster is minimal. Coffee producers who participate in the program, not only have a commercial relation with AMSA (ECOM), but they also access through them financial services, training, and technical assistance. Also, this relation is crucial for the required verification to participate in the program.
Table 30
Analysis of the relation between coffee producers and ECOM (AMSA in Mexico) in the Nespresso cluster of Mexico (2007-08 and 2009-10 cropping cycles)
Indicator
Non-Participant
(Ni=1=122)
Participant
(Ni=1=87)
Change over Cropping Cycles
Non-Participants
Participants
% of producers who relate with producer organizations
86.1 97.8*** -13.5*** -0.6
Purpose of the relation (% of respondents)
For commercialization purposes 97.2*** 85.5
For accessing financial resources 0.5 9.2***
For receiving technical assistance 3.3 25.7***
For training purposes 4.6 38.5***
Type of relation (% of respondents)
Sporadic relation 63.0*** 30.9
Short-term relation 23.6 27.0
Stable and long-term relation 9.3 16.4**
Perceived producer negotiation power (% of respondents)
High 1.9 4.3
Medium high 3.7 14.1***
Medium 19.4 32.2***
Medium low 13.0 10.2
Low 32.9*** 20.7
% who consider that they benefited from this relation
47.2 74.3*** -14.4** +35.2***
*** α ≤ 0.01; ** α > 0.01 - ≤ 0.05; * α > 0.05 - ≤ 0.10
Figure 19 further compares the type of relation between coffee producers with AMSA (ECOM) and other local market agents in the Nespresso cluster of Mexico. In general, the relations of producers in the Mexico cluster with formal and informal market agents (AMSA and others) are sporadic and short-term relations, while relations in the Guatemala cluster are developing into more long-term and stable relations. Despite this, a higher percentage of
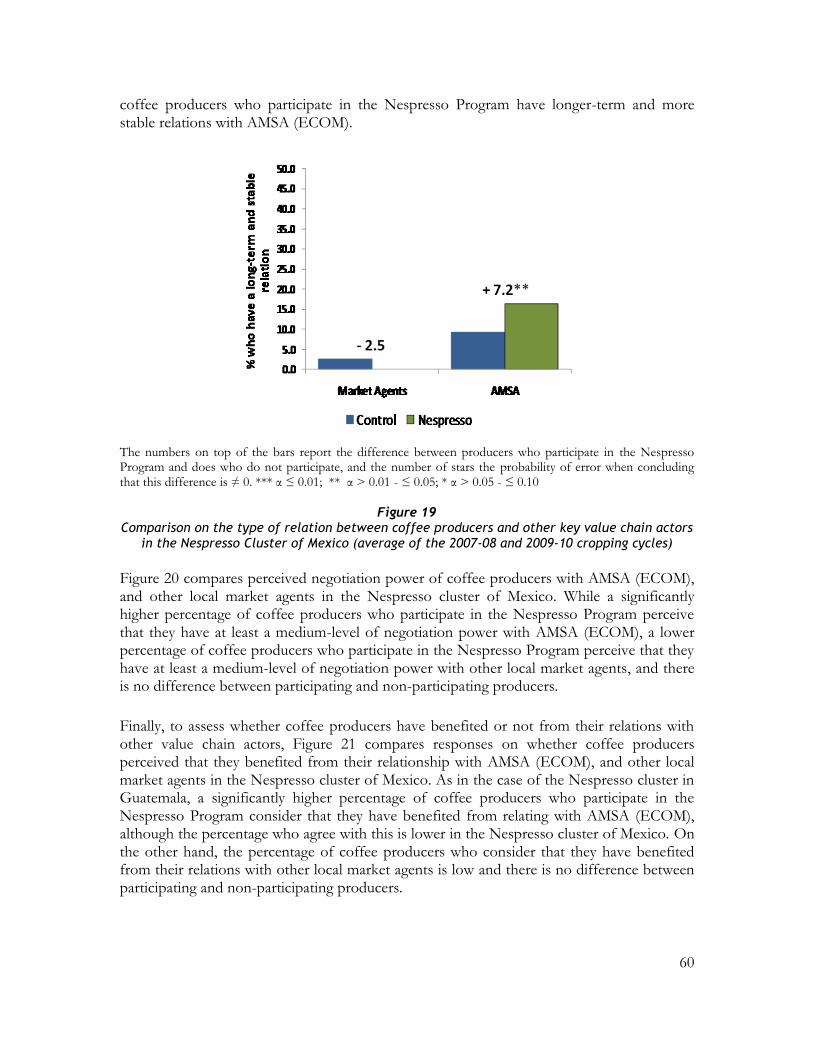
60
coffee producers who participate in the Nespresso Program have longer-term and more stable relations with AMSA (ECOM).
The numbers on top of the bars report the difference between producers who participate in the Nespresso Program and does who do not participate, and the number of stars the probability of error when concluding that this difference is ≠ 0. *** α ≤ 0.01; ** α > 0.01 - ≤ 0.05; * α > 0.05 - ≤ 0.10
Figure 19
Comparison on the type of relation between coffee producers and other key value chain actors in the Nespresso Cluster of Mexico (average of the 2007-08 and 2009-10 cropping cycles)
Figure 20 compares perceived negotiation power of coffee producers with AMSA (ECOM), and other local market agents in the Nespresso cluster of Mexico. While a significantly higher percentage of coffee producers who participate in the Nespresso Program perceive that they have at least a medium-level of negotiation power with AMSA (ECOM), a lower percentage of coffee producers who participate in the Nespresso Program perceive that they have at least a medium-level of negotiation power with other local market agents, and there is no difference between participating and non-participating producers.
Finally, to assess whether coffee producers have benefited or not from their relations with other value chain actors, Figure 21 compares responses on whether coffee producers perceived that they benefited from their relationship with AMSA (ECOM), and other local market agents in the Nespresso cluster of Mexico. As in the case of the Nespresso cluster in Guatemala, a significantly higher percentage of coffee producers who participate in the Nespresso Program consider that they have benefited from relating with AMSA (ECOM), although the percentage who agree with this is lower in the Nespresso cluster of Mexico. On the other hand, the percentage of coffee producers who consider that they have benefited from their relations with other local market agents is low and there is no difference between participating and non-participating producers.

61
The numbers on top of the bars report the difference between producers who participate in the Nespresso Program and does who do not participate, and the number of stars the probability of error when concluding that this difference is ≠ 0. *** α ≤ 0.01; ** α > 0.01 - ≤ 0.05; * α > 0.05 - ≤ 0.10
Figure 20
Comparison on perceived negotiation power of coffee producers with other key value chain actors in the Nespresso Cluster of Mexico (average of the 2007-08 and 2009-10 cropping cycles)
The numbers on top of the bars report the difference between producers who participate in the Nespresso Program and does who do not participate, and the number of stars the probability of error when concluding that this difference is ≠ 0. *** α ≤ 0.01; ** α > 0.01 - ≤ 0.05; * α > 0.05 - ≤ 0.10
Figure 21
Comparison on the percentage of coffee producers who agree that they have benefited as a result of their relation with other key value chain actors in the Nespresso Cluster of Mexico
(average of the 2007-08 and 2009-10 cropping cycles)

62
Conclusion on Hypothesis 5 Given the above analysis on the relations among actors who participate in the Nespresso value chain, we accept hypothesis 5, as a higher percentage of coffee producers who participate in the Nespresso value chain perceive that they have a longer-term and more stable relation with ECOM, they have at least a medium level of negotiation power in the relation, and that they have benefited from this relation. This is also the case in Guatemala with respect to producer organizations that intermediate the relation between ECOM and coffee producers. Thus, the project contributed to a better governance of coffee producers in the value chain by strengthening their capabilities to effectively participate in the value chain.
9. CONCLUSIONS
Related with demographic characteristics As presented above in Table 9 of Section 3 of this report, coffee plantation owners in the Mexico cluster have in average smaller farms (-0.85 ha), but a larger area under natural forest (+0.11 ha), than those in Guatemala cluster. In addition, a smaller percentage of them have a natural water source in their coffee plantation (+47.7%). When we differentiate among producers who participate in the Nespresso Program and those who do not, we can conclude that producers who participate in the Nespresso Program in the Guatemala and Mexico clusters have a larger farm size (+1 ha in both cases) and a larger area of the farm under natural forest (+0.23 and +0.29 ha, respectively). On the other hand, while a higher percentage of participant producers have a natural water source in the coffee plantation in Guatemala, a lower percentage does that in Mexico. An important difference between the Mexico and Guatemala clusters is that producers in Guatemala process coffee beans into dry parchment coffee (with different levels of humidity), while producers in Mexico do not process coffee beans and sells them as cherry coffee. Thus, AMSA collects the cherry coffee beans and does the wet milling in its own plant in Ixhuatlan del Café. As such, the collection center in Mexico is near from the farms that in the case of Guatemala, therefore, producers who participate in the Nespresso Program in Mexico only have to travel less than half an hour (an average of 26 minutes) to bring their harvest to the collection center, while participant producers in Guatemala have to travel over an hour (an average of 69 minutes). In both clusters there are no significant differences on the number of family members who are involved in coffee-related activities, but coffee producers in Mexico have more access to family labor than those in Guatemala (2 vs. 3, respectively). Coffee producers in the Mexico cluster are also older (+5.5 years), have more years of experience as coffee growers (+4.8), and in average have one more years of formal education, than those in Guatemala, and therefore, could benefit more from the participation in the Nespresso Program. On the

63
other hand, while almost none producers in the cluster of Mexico are members of producer organizations (2.5%), one third of coffee producers in the cluster of Guatemala are members of producer organizations (34.7).
Related with coffee plantation characteristics Coffee plantations, in average, are larger (4.5 vs. 2 ha) and younger (15.7 vs. 19.5 years) in Guatemala than in Mexico, but the importance of coffee, expressed as the percentage of farm area established with coffee, is similar (> 80%). Plantations in Guatemala are younger and have almost double the planting density than those in Mexico. The latter may be related in part to the most widely established variety: var. Caturra in Guatemala, opposite to var. Bourbon and Tipica in Mexico. However, younger and denser plantations that are better maintained in Guatemala, are important determinants for a better performance of the Guatemala cluster with respect to the Mexico one. In both clusters, producers who participate in the program have a significant larger area established with coffee than non-participants (+2.7 and +1.0, respectively); however, there has been no significant change in coffee area over time, and the importance of coffee in the farm, expressed as the percentage of total farm size with coffee, is the same among both groups. In addition, plantations of participating coffee producers have higher planting densities than those of producers who do not participate in the Program, and its planting density has been increasing as they have been replanting and renewing them. This result can be linked to the project as it has been facilitating access to training, technical assistance and financial services that are essential for supporting coffee producers for re-planting and renewing the coffee plantations.
Related with hypothesis 1: cost benefit analysis The upward global trends in coffee prices, and to a lesser extent, the Nespresso price differentials, have compensated extra costs and investments required for participating in the Program. However, net benefits of producers who participate in the Nespresso Program are not significantly different than those of non-participating producers, as productivity has not (yet) improved. Productivity may be expected to improve in the following cropping cycles, given the investments that producers are doing for re-planting and renewing their coffee plantations, as well as in their maintenance. As a result, given, the actual productivity levels and improvements, price incentives are not enough for the sustainability of the Nespresso Program, and an extra effort needs to be placed in improving productivity, and therefore producers‟ net income.
Total production costs
Total production costs have been decreasing through time (α=0.0046) for participating and non-participating producers; however, total production costs have been decreasing more and significantly only among producers who participate in the Nespresso Program. This may have been because of the reduction of replanting activities and in the application of lime. However, producers who participate in the Nespresso Program are still investing more in

64
replanting and fertilization activities that can be attributed to their better access to financial resources as a result of the project, which will probably generate productivity impacts in the next cropping cycles, as discussed early. In line with productivity differences between the Guatemala and Mexico clusters, coffee producers in Mexico are investing significantly less in their coffee plantation than those in Guatemala (an average of US$ 1,833/ha/year in Guatemala vs. US$ 1,067/ha/year in Mexico). However, in the case of Mexico, total production costs are slightly higher among producers who participate in the Nespresso Program, however the difference is not significant (α=0.1251). In addition, total production costs did not change significantly through time (α=0.7981) for participating or non-participating producers, but producers who participate in the Nespresso Program are investing more in replanting older or damage coffee plants, and therefore, are probably giving a better maintenance to their plantations as promoted by the project.
Productivity
No significant improvements can be observed in productivity neither in the Guatemala or the Mexico Nespresso cluster over time, or between participant and non-participant producers. However, coffee producers (especially participant producers) are replanting and renewing their coffee plantations, at the same time that are applying improved cropping practices (shadow regulation, pruning, soil fertility management and integrated pest management). A productivity analysis will be required in the next cropping cycles to evaluate whether or not the renovation and replanting of coffee plantations, together with the use of improved cropping practices and fertilization, results in significant productivity improvements. In both clusters, but especially in the Mexico cluster, planting density of coffee plantations is below the optimum, and therefore, replanting will most probably have positive results in terms of coffee production per hectare.
Unit production costs
In the case of the Guatemala cluster, a small reduction in total production costs, together with no significant changes in productivity, has resulted in a small but not significant reduction in unit production costs. On the other hand, in the case of the Mexico cluster, no significant changes in total production costs with a small but no significant decrease in productivity, has resulted in a significant increase in unit production costs. This shows that productivity has a more significant effect in unit production costs than total production cost reduction efforts.
Price
Although there is a higher percentage of coffee producers in Mexico that produce var. Bourbon and var. Tipica, coffee varieties that have special cup quality characteristics, they are receiving significantly lower prices than producers in the Nespresso cluster of Guatemala (a US$ -19.5 four-year average differential), which is mainly due to the lower price differential of Mexico in the world market (+4.5 the NYSE price) than the differential of Guatemala (+25.5 the NYSE price). Although to make this comparison, prices have been converted to their dry parchment equivalent, it is important to note that producers in Mexico do not wet mill the coffee in their farms, but sell it as cherry coffee, while producers

65
in the Guatemala cluster do the wet milling and sell their coffee as dry parchment coffee. This explains, partially, the lower total production costs in Mexico as well as lower prices. Following world coffee price trends, coffee prices in the Nespresso clusters of Guatemala and Mexico have significantly increase (α=0.0006 and α=0.0000, respectively) since 2006-07 for participating and non-participating producers. Producers who participate in the Nespresso Program in Guatemala received a price differential that result in a significantly higher price (α=0.0000) for participating producers. However, this price differential at the farmer level has been decreasing from US$ +6.6/qq to US$ +4.8/qq, in average, at the same time that has followed conventional coffee price fluctuations, growing at an annual average rate of 8.5%. Participating producers in Mexico only started to receive a positive and significant price differential during the 2009-10 and it was relatively low (+ US$ 2) and the four-year price differential average (2006-2010) was only +US$ 0.08, at the same time that coffee prices have been increasing over time for both groups at an annual average rate of 21.2%.
Unit margin
As a result of price increases, net unit income has increased (α=0.0000) over time among all producers in the Guatemala and Mexico clusters, mainly as a result of price increases; however, no significant differences can be observed among producers who participate in the Nespresso Program and those who do not participate in the program, as productivity has not increased, and unit costs have not decreased, significantly. Opposite to the case of Guatemala, net unit income in Mexico, after valuing family labor is negative, as coffee productivity in the Nespresso cluster of Mexico is significantly lower than in the cluster in Guatemala, but also positive price differentials for producers who participate in the Nespresso Program, only started to be observed during the 2009-10 cropping cycle. As a result, negative net unit income has been reversing over time as net unit income has been increasing (α=0.0001) among all producers, mainly as a result of price increases. In addition, net unit income among producers who participate in the Nespresso Program is not significantly higher from non-participating producers, as productivity has not increased, and unit costs have not decreased.
Net income
Total net income in the Guatemala and Mexico Nespresso clusters has increased in the last cropping cycle (2009-10), mainly a as result of higher coffee prices, a global trend that has not been influenced by the Nespresso Program. Participating producers in Guatemala received a higher price (a four-year price differential average of +US$ 5.6), but since their productivity has been significantly lower, no significant differences in total income per ha can be observed with respect to non-participating producers, as the positive price differential is only compensating the net productivity differential. On the other hand, participating producers in Mexico only started to received a positive and significant price differential during the 2009-10 and it was relatively low (+ US$ 2), but with no significant differences in productivity, also no significant differences in total income can be observed among producers who participate in the Nespresso Program and those who do not participate.

66
Given that there is no difference in total production costs among producers who participate in the Nespresso Program and those who do not participate in both clusters, and that no significant differences can be observed in productivity, no significant difference in net unit margin (US$/qq) can be observed between participating and non-participating producers as the price differential only compensated the higher unit cost of participating producers, given their lower productivity.
Investments
Besides the production costs that producers have to incur every year for coffee production, coffee producers in the Nespresso clusters are also making investments related with their coffee production and commercialization activities. These investments include all the equipment, infrastructure or goods with a useful life of more than one year, and therefore, are not included in production costs. Coffee-related investments among producers who participate in the Nespresso Program in Guatemala and Mexico have been significantly higher than among those producers who do not participate in the Program; however, the investment level of producers who participate in the Nespresso Program have decreased substantially in both clusters, after 2008 in Guatemala and after 2009 in Mexico. When the purpose of these investments is further analyzed, we can conclude that coffee producers in the Guatemala cluster have been making investments mainly to comply with the Nespresso AAA Sustainable Program standards, and to a lesser extent to improve productivity, while producers in the Mexico cluster have been making investments mainly to improve productivity, and to a lesser extent to comply with the Nespresso AAA Sustainable Program quality and social standards. This can be explained by the fact that the major constraint in Mexico for the economic sustainability and overall competitiveness of coffee production is lower productivity, and therefore, available financial resources are invested primary to improve it.
Net income after financial costs
If we consider the higher investments made by coffee producers to increase future productivity, but also to comply with the quality, social and environmental standards of the Nespresso AAA Sustainable Program, and subtract estimated financial costs at the median annual interest rate of 20% in Guatemala, and 15% for non-participants and 6% for participants in Mexico; no significant differences are observed on median (and average in the case of Guatemala) net income per hectare after deducting financial costs, among producers who participate in the Nespresso program and those who do not participate. As participating producers in Guatemala reduced their investments during the last two cropping cycles, their net income after financial costs has increased significantly in the 2009-10 cropping cycle, with respect to the 2007-08 cropping cycle.
Related with hypothesis 2: access to resources Access to natural resources that influence coffee productivity, such as soil fertility, water availability and coffee plantation shadow, influence the level of net benefits of producers who participate in the Nespresso Program. In addition, access to human resources, assessed by the number of family members who work on coffee-related activities, years of formal
67
education and age of coffee plantation, as well as access to technical assistance have had a significant and positive influence on net coffee income. Again these resources may have also been influencing net income via its effect on coffee productivity.
Related with hypothesis 3: social impact The Nespresso Program is contributing to employment generation in their territory of influence, mainly temporal employment, as well as more jobs for women and youth, as coffee producers who participate in the program are hiring more external labor than those who do not participate in the program. Employment of children is very low among participating and non-participating producers, and the tendency among both groups of producers is to maintain this unchanged. In addition to hired labor, coffee-related activities are providing employment for family labor (two to three family members per producer), but there is no difference between participating and non-participating producers in the number of family members employed in coffee-related activities. The Nespresso Program is also contributing to employment quality as a higher percentage of producers who participate in the Program offer basic non-wage benefits to workers, such as access to potable water, sanitary facilities, proper housing, and basic health services. However, initial positive wage differences among producers who participate in the Nespresso Program, compared with those paid by producers who do not participate in the program during the 2007-08 production cycle, disappeared in the 2009-10 production cycle.
Related with hypothesis 4: environmental impact The adoption of natural resource conservation practices (water, soil and forest conservation practices) has been significantly higher in the Guatemala than in the Mexico cluster. However, in both clusters, the Nespresso Program is motivating the adoption of these practices as there is a higher percentage of coffee producers who participate in the Nespresso Program in Guatemala and Mexico that apply soil (+17.7% and +8.4%, respectively) and forest conservation practices (+7.9% and +10%, respectively). In the case of Guatemala, there is a higher percentage of participating producers who apply water conservation and management practices (+31.2%), and who treat residual waters (+21.4%). It is also important to note that in the case of Mexico, almost none of the producers treat residual waters from milling activities as they do not wet mill their coffee in the farm, but sells their coffee as cherry. In addition, the percentage of producers in both clusters who apply natural resource conservation practices have been increasing over the analyzed period, with the exception of the application of forest conservation practices.
Related with hypothesis 5: supply chain governance The percentage of coffee producers who participate in the Nespresso Program that interact with Export Café and AMSA (ECOM exporter companies that collect and export coffee for the Nespresso value chain) is significantly larger than among those who do not participate in the program. Producers, who relate with Export Café and AMSA, whether or not they participate in the Nespresso Program, do so for the main purpose of commercializing their

68
produce. However, as producers who participate in the Nespresso Program also receive other complementary services, results show that there are a significant larger percentage of coffee producers who participate in the program that not only have a commercial relation with Export Café (ECOM), but they also relate with the exporter company to access other services. These services include financial, technical and entrepreneurial services, and training, all crucial to obtain the required verification to participate in the program. In the case of the Guatemala cluster, the percentage of coffee producers who participate in the Nespresso Program that interact with coffee producer organizations is also significantly larger than among those who do not participate in the program (50.6% vs. 23.4%). This is an expected results as most coffee producers who participate in the Nespresso Program does that via their producer organizations and not individually. Only larger non-organized producers relate directly with Export Café (ECOM in Guatemala. In addition, smaller-scale organized coffee producers who participate in the program, not only have a commercial relation with producer organizations, but they also access through them financial services, training, and technical assistance. Thus, this relation is crucial for small-scale producers, not only to comply with the required verification to participate in the program, but to be able to have access to the program. Coffee producers perceive that they have better governance in the Nespresso value chain than in the conventional coffee supply chain as relations are longer-term and more stable. In addition, a higher percentage of coffee producers feel that power is more balanced as they perceive that they have at least a medium-level of negotiation power with Export Café or AMSA (ECOM), while a lower percentage of coffee producers who participate in the Nespresso Program perceive that they have at least a medium-level of negotiation power with other local market agents.
As a result of the above, a significantly higher percentage of coffee producers who participate in the Nespresso Program consider that they have benefited from relating with Export Café or AMSA (ECOM), although the percentage who agree with this is lower in the Nespresso cluster of Mexico. On the other hand, the percentage of coffee producers who consider that they have benefited from their relations with other local market agents is low and there is no difference between participating and non-participating producers.