strengthening of rc continuous beam using frp...
TRANSCRIPT

STRENGTHENING OF RC CONTINUOUS BEAM USING FRP
SHEET
A THESIS SUBMITTED IN PARTIAL FULFILMENT
OF THE REQUIREMENTS FOR THE DEGREE OF
MASTER OF TECHNOLOGY
IN
CIVIL ENGINEERING
(STRUCTURAL ENGINEERING)
BY
SOUMYA SUBHASHREE Roll. No. 210CE2032
DEPARTMENT OF CIVIL ENGINEERING
NATIONAL INSTITUTE OF TECHNOLOGY ROURKELA
ROURKELA-769008, ODISHA, INDIA
MAY 2012

STRENGTHENING OF RC CONTINUOUS BEAM USING FRP
SHEET
A THESIS SUBMITTED IN PARTIAL FULFILMENT
OF THE REQUIREMENTS FOR THE DEGREE OF
MASTER OF TECHNOLOGY
IN
CIVIL ENGINEERING
(STRUCTURAL ENGINEERING)
BY
SOUMYA SUBHASHREE Roll. No. 210CE2032
UNDER THE GUIDANCE OF
Prof. K. C. Biswal
DEPARTMENT OF CIVIL ENGINEERING
NATIONAL INSTITUTE OF TECHNOLOGY ROURKELA
ROURKELA-769008, ODISHA, INDIA
MAY 2012

CERTIFICATE
This is to certify that the thesis entitled, “STRENGTHENING OF RC CONTINUOUS
BEAMS USING FRP SHEET” submitted by SOUMYA SUBHASHREE bearing roll no.
210ce2032 in partial fulfillment of the requirements for the award of Master of
Technology degree in Civil Engineering with specialization in “Structural Engineering”
during 2010-2012 session at the National Institute of Technology, Rourkela is an
authentic work carried out by her under my supervision and guidance.
To the best of my knowledge, the matter embodied in the thesis has not been submitted to any
other University / Institute for the award of any Degree or Diploma.
Date: 25.05.12 Prof. K. C. Biswal
Place: Rourkela Department of civil Engineering
National Institute of technology
Rourkela, Odisha-769008
DEPARTMENT OF CIVIL ENGINEERING NATIONAL INSTITUTE OF TECHNOLOGY ROURKELA, ODISHA-769008

i
ACKNOWLEDGEMENT
It gives me a great pleasure to express my deep sense of gratitude and indebtedness to
my guide Prof. K. C. Biswal, for his valuable support and encouraging mentality throughout
the project. I am highly obliged to him for providing me the opportunity to carry out the ideas
and work during my project and helping me to gain successful completion of the project.
My sincere thanks to Prof N. Roy, The Head of the Civil Engineering Department,
and all the professors of National Institute of Technology Rourkela, for their advice and
timely encouragement which always kept my moral level very high.
I am very thankful towards Prof. P. Sarkar, my faculty adviser and all faculty
members of Civil Engineering Department for their help and encouragement during the
project.
I am also thankful to Mr. S. K. Sethi, Mr. R. Lugun and Mr. Sushil and
administrative staff of this department for their help without which the project might not be
successful one.
I also thank all my friends who have directly or indirectly helped me in my
project work from beginning till date and I highly regard their valuable and timely
suggestions which is just a blessing in disguise.
Last but not least I would like to thank my parents, who taught me the value of hard
work by their own example. I would like to share this moment of happiness with my father
and mother. They rendered me enormous support during the whole tenure of my stay in NIT.
Soumya Subhashree
M. Tech (Structural Engineering) Department of Civil Engineering National Institute of Technology
Rourkela-769008

ii
ABSTRACT
Strengthening structures via external bonding of advanced fibre reinforced polymer
(FRP) composite is becoming very popular worldwide during the past decade because it
provides a more economical and technically superior alternative to the traditional techniques
in many situations as it offers high strength, low weight, corrosion resistance, high fatigue
resistance, easy and rapid installation and minimal change in structural geometry. Although
many in-situ RC beams are continuous in construction, there has been very limited research
work in the area of FRP strengthening of continuous beams.
In the present study an experimental investigation is carried out to study the behavior
of continuous RC beams under static loading. The beams are strengthened with externally
bonded glass fibre reinforced polymer (GFRP) sheets. Different scheme of strengthening
have been employed. The program consists of fourteen continuous (two-span) beams with
overall dimensions equal to (150×200×2300) mm. The beams are grouped into two series
labeled S1 and S2 and each series have different percentage of steel reinforcement. One
beam from each series (S1 and S2) was not strengthened and was considered as a control
beam, whereas all other beams from both the series were strengthened in various patterns
with externally bonded GFRP sheets. The present study examines the responses of RC
continuous beams, in terms of failure modes, enhancement of load capacity and load
deflection analysis. The results indicate that the flexural strength of RC beams can be
significantly increased by gluing GFRP sheets to the tension face. In addition, the epoxy
bonded sheets improved the cracking behaviour of the beams by delaying the formation of
visible cracks and reducing crack widths at higher load levels. The experimental results were
validated by using finite element method.
KEYWORDS: continuous beam; flexural strengthening; GFRP; premature failure;
debonding failure.

iii
TABLE OF CONTENTS
Title Page No.
ACKNOWLEDGEMENTS .......................................................................................... i
ABSTRACT ................................................................................................................. ii
TABLES OF CONTENTS ......................................................................................... iii
LIST OF TABLES ..................................................................................................... vii
LIST OF FIGURES ................................................................................................ . viii
ABBREVIATIONS ................................................................................................... xii
NOTATIONS ............................................................................................................ xiii
CHAPTER 1 INTRODUCTION
1.1 General ..............................................................................................................2
1.2 Flexural strenghtening of beams .......................................................................4
1.3 Advantages of FRP ...........................................................................................4
1.4 Suitability of FRP for uses in structural engineering ........................................6
1.5 Applications of FRP composites in construction ..............................................7
1.6 Current research on FRP ...................................................................................7
1.7 Design considerations .......................................................................................8
1.8 Disadvantages of FRP .......................................................................................8

iv
CHAPTER 2 REVIEW OF LITERATURE
2.1 Brief Review ...................................................................................................10
2.1.1 Simply Supported Beam .................................................................................10
2.1.2 Continuous Beam ............................................................................................12
2.2 Objective and scope of present work ..............................................................17
CHAPTER 3 EXPERIMENTAL STUDY
3.1 Casting of Specimen .......................................................................................19
3.1.1 Materials for Casting .......................................................................................20
3.1.1.1 Cement ............................................................................................................20
3.1.1.2 Fine Aggregate ................................................................................................20
3.1.1.3 Coarse Aggregate ............................................................................................21
3.1.1.4 Water ...............................................................................................................21
3.1.1.5 Reinforcing Steel ............................................................................................21
3.1.2 Detailing of Reinforcement .............................................................................22
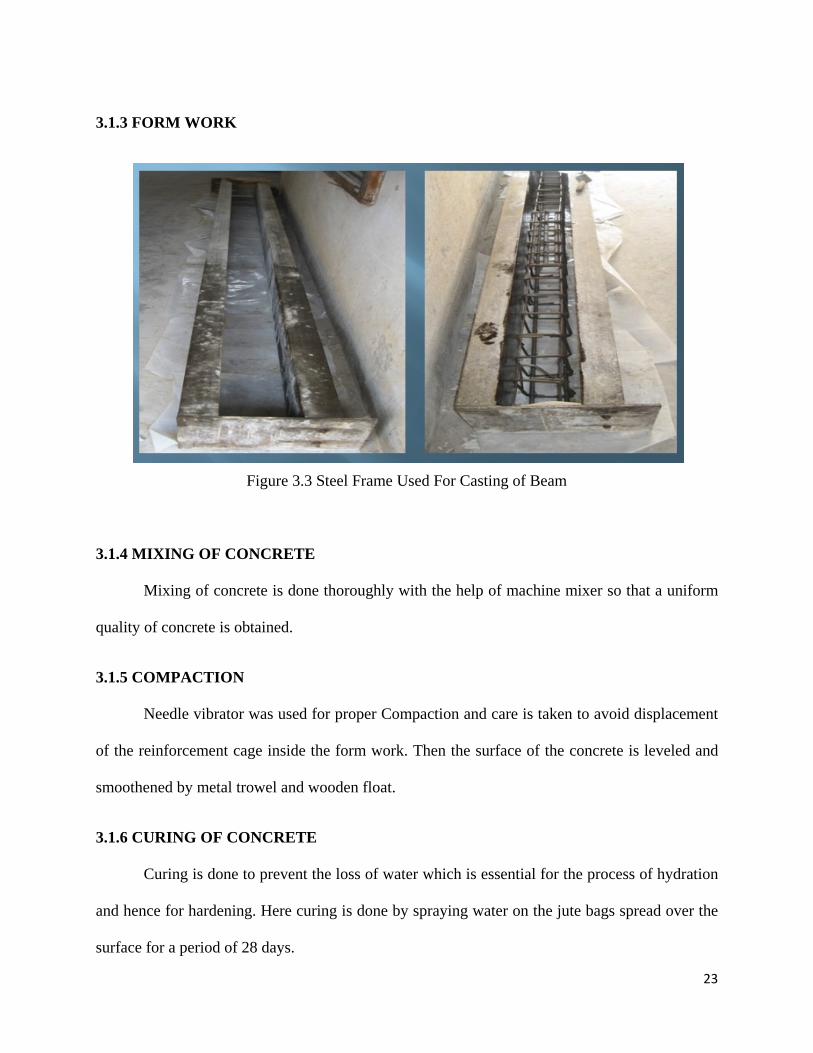
3.1.3 Form Work ......................................................................................................23
3.1.4 Mixing of concrete ..........................................................................................23
3.1.5 Compaction .....................................................................................................23
3.1.6 Curing of concrete ...........................................................................................23
3.2 Strengthening of beams ...................................................................................24
3.3 Experimental Setup .........................................................................................25
3.4 Fabrication of GFRP Plate ..............................................................................27
3.5 Determination of ultimate stress, ultimate load and young’s modulus ...........30
3.6 Testing of Beams ............................................................................................31

v
3.6.1 Beam-1 ............................................................................................................33
3.6.2 Beam-2 ............................................................................................................35
3.6.3 Beam-3 ............................................................................................................35
3.6.4 Beam-4 ............................................................................................................37
3.6.5 Beam-5 ............................................................................................................39
3.6.6 Beam-6 ............................................................................................................40
3.6.7 Beam-7 ............................................................................................................42
3.6.8 Beam-8 ............................................................................................................44
3.6.9 Beam-9 ............................................................................................................45
3.6.10 Beam-10 ..........................................................................................................47
3.6.11 Beam-11 ..........................................................................................................49
3.6.12 Beam-12 ..........................................................................................................51
3.6.13 Beam-13 ..........................................................................................................52
3.6.14 Beam-14 ..........................................................................................................54
CHAPTER 4 TEST RESULTS AND DISCUSSIONS
4.1 Experimental Results ......................................................................................58
4.1.1 Failure Modes .................................................................................................58
4.1.1.1 Control beam ...................................................................................................58
4.1.1.2 Strengthened Beam .........................................................................................58
4.1.2 Load Deflection and Load Carrying Capacity ................................................60
4.1.2.1 Strengthened Beam of S1 Series .....................................................................61
4.1.2.2 Strengthened Beam of S2 Series .....................................................................77

vi
CHAPTER 5 FINITE ELEMENT ANALYSIS
5.1 Formulations ...................................................................................................83
5.2 Validation of Experimental Value ..................................................................85
CHAPTER 6 CONCLUSIONS
6.1 Conclusions .....................................................................................................89
6.2 Scope of the future work. ................................................................................90
REFERENCES ...........................................................................................................91

vii
LIST OF TABLES
Title Page No
Table 3.1 Design Mix Proportions .........................................................................20
Table 3.3 Tensile Strength of the bars ...................................................................22
Table 3.4 Size of the specimens for tensile test .....................................................30
Table 3.4 Result of the specimens .........................................................................31
Table 3.5 Details of the Test Specimens for Series S1 ..........................................32
Table 3.6 Details of the Test Specimens for Series S2 ..........................................33
Table 4.1 Experimental Results of the Tested Beams for Series S1 ......................59
Table 4.2 Experimental Results of the Tested Beams for Series S2 ......................60

viii
LIST OF FIGURES
Title Page No
Fig. 3.1 Detailing of reinforcement .........................................................................22
Fig. 3.2 Cross section ..............................................................................................22
Fig. 3.3 Steel Frame Used For Casting of Beam ....................................................23
Fig. 3.4 Application of epoxy and hardener on the beam .......................................24
Fig. 3.5 Roller used for the removal of air bubble ..................................................25
Fig. 3.6 Experimental setup ....................................................................................26
Fig. 3.7(a) Continuous beam: Shear Force Diagram ..................................................27
Fig. 3.7(b) Continuous beam: Bending Moment Diagram .........................................28
Fig. 3.8 Specimens for tensile testing ....................................................................28
Fig. 3.9 Experimental set up of INSTRON 1195 ....................................................29
Fig. 3.10 Specimen failure after tensile test ..............................................................29
Fig. 3.11 Experimental Setup of the CB1 .................................................................34
Fig. 3.12 Flexural failure of CB1 ............................................................................34
Fig. 3.13 Control Beam, CB2 after failure ...............................................................35
Fig. 3.14 Experimental Setup of the Beam ................................................................36
Fig. 3.15 Debonding failure of FRP ...........................................................................36
Fig. 3.16 Magnified view of the failure of the beam .................................................37
Fig. 3.17 Tensile rupture of FRP ...............................................................................38
Fig. 3.18 Ultimate failure of beam by debonding ......................................................38
Fig. 3.19 U-jacketed GFRP wrapped on the Beam SB3 ............................................39
Fig. 3.20 Debonding failure of FRP ...........................................................................40
Fig. 3.21 Strengthening pattern of beam SB4 ............................................................41

ix
Fig. 3.22 Crack pattern after initial loading ...............................................................41
Fig. 3.23 Failure of the beam by tensile rupture ........................................................42
Fig. 3.24 Cracking pattern at lower load value ......................................................... 43
Fig. 3.25 Rupture of GFRP sheet at mid section of the right span ...........................43
Fig. 3.26 Debonding of FRP and cracking pattern ...................................................44
Fig. 3.27 Debonding failure of Strengthened beam SB6 ..........................................45
Fig. 3.28 Strengthening pattern of SB7 ....................................................................46
Fig. 3.29 Shear crack in the left span ........................................................................46
Fig. 3.30 Magnified view of shear crack and debonding of GFRP ..........................47
Fig. 3.31 Strengthening pattern of SB8 ....................................................................48
Fig. 3.32 Failure of SB8 by debonding of GFRP .....................................................48
Fig. 3.33 Strengthening and anchoring pattern of SB9 .............................................49
Fig. 3.34 Failure pattern of SB9 ................................................................................50
Fig. 3.35 Magnified view of Debonding ...................................................................50
Fig. 3.36 Top FRP of Beam TB1 before Testing ......................................................51
Fig. 3.37 FRP sheet separations without concrete ....................................................52
Fig. 3.38 Experimental set up and strengthening pattern of TB2 .............................53
Fig. 3.39 Failure of the beam by tensile rupture .......................................................53
Fig. 3.40 Strengthened beam TB3 ............................................................................54
Fig. 3.41 Failure of beam TB3 ..................................................................................55
Fig. 3.42 Shear crack in the left span ........................................................................55
Fig. 3.43 Failure mode of TB3 ..................................................................................56
Fig. 4.1 Load versus Deflection Curve for CB1 .....................................................61
Fig. 4.2 Load versus Deflection Curve for SB1 ......................................................62
Fig. 4.3 Load versus Deflection Curve for SB2 ......................................................63

x
Fig. 4.4 Load versus Deflection Curve for SB3 ......................................................64
Fig. 4.5 Load versus Deflection Curve for SB4 ......................................................65
Fig. 4.6 Load versus Deflection Curve for SB5 ......................................................66
Fig. 4.7 Load versus Deflection Curve for SB6 ......................................................67
Fig. 4.8 Load versus Deflection Curve for SB7 ......................................................68
Fig. 4.9 Load versus Deflection Curve for SB8 ......................................................69
Fig. 4.10 Load versus Deflection Curve for SB9 .....................................................70
Fig. 4.11 Load versus Deflection Curve for Set S1 beams with CB1 .....................72
Fig. 4.12 Load versus Deflection Curve for CB1, SB2, SB3 ..................................73
Fig. 4.13 Load versus Deflection Curve for CB1, SB4, SB5 ..................................73
Fig. 4.14 Load versus Deflection Curve for CB1, SB7, SB8 ..................................74
Fig. 4.15 Load versus Deflection Curve for CB1, SB6, SB9 ..................................75
Fig. 4.16 Ultimate Load Capacity of Series S1 beams ............................................75
Fig. 4.17 Percentage increase in the Ultimate Load Carrying capacity of
strengthened beams of S1 w.r.t CB1 ...........................................................................76
Fig. 4.18 Load versus Deflection Curve for CB2 ....................................................77
Fig. 4.19 Load versus Deflection Curve for TB1 ....................................................78
Fig. 4.20 Load versus Deflection Curve for TB2 ....................................................78
Fig. 4.21 Load versus Deflection Curve for TB3 ....................................................79
Fig. 4.22 Load vs. Deflection Curve for all the Beams of S2 ..................................80
Fig. 4.23 Ultimate Load (KN) Capacity of Series S2 beams ...................................80
Fig. 4.24 Percentage increase in the Ultimate Load Carrying capacity of
strengthened beams of S2 w.r.t CB2 ...........................................................................81
Fig. 5.1 Continuous beam .......................................................................................59
Fig. 5.1 Finite element model .................................................................................59

xi
Fig. 5.3 Beam element forces .................................................................................60
Fig. 5.4 Comparison of Experimental value with Numerical for CB1 ...................61

xii
ABBREVIATIONS
ACI American Concrete Institute
CFRP Carbon Fibre Reinforced Polymer
BM Bending Moment
EB Externally Bonded
FEM Finite Element Method
FRP Fibre Reinforced Polymer
FRPC Fibre Reinforced Polymer Composite
GFRP Glass Fibre Reinforced plastic
HSC High Strength Concrete
HYSD High Yield Strength Deformed
IC Intermediate Crack
IS Indian Standards
NSM Near Surface mounted
PSC Portland Slag Cement
RC Reinforced Concrete
RHSC Reinforced High Strength Concrete

xiii
NOTATIONS
D Overall Depth of the Beam
B Breadth of the Beam
d Effective Depth
L Span Length of the Beam
fck Characteristic Cube Compressive Strength of Concrete
fy Tensile Strength of the Bar
Pu Ultimate Load
λ Load Enhancement Ratio
φ Diameter of the Reinforcement
M Moment of Resistance
E Modulus of Elasticity
I Moment of Inertia
F Global Nodal Force Vector
K Stiffness Matrix
U Global Nodal Displacement Vector
u Displacement Field
Ni Interpolation Function
ui Nodal Displacements

1
CHAPTER-1
INTRODUCTION

2
CHAPTER-1
INTRODUCTION
1.1 GENERAL
A structure is designed for a specific period and depending on the nature of the
structure, its design life varies. For a domestic building, this design life could be as low as
twenty-five years, whereas for a public building, it could be fifty years. Deterioration in
concrete structures is a major challenge faced by the infrastructure and bridge industries
worldwide. The deterioration can be mainly due to environmental effects, which includes
corrosion of steel, gradual loss of strength with ageing, repeated high intensity loading,
variation in temperature, freeze-thaw cycles, contact with chemicals and saline water and
exposure to ultra-violet radiations. As complete replacement or reconstruction of the structure
will be cost effective, strengthening or retrofitting is an effective way to strengthen the same.
The most popular techniques for strengthening of RC beams have involved the use of
external epoxy-bonded steel plates. It has been found experimentally that flexural strength of
a structural member can increase by using this technique. Although steel bonding technique is
simple, cost-effective and efficient, it suffers from a serious problem of deterioration of bond
at the steel and concrete interphase due to corrosion of steel. Other common strengthening
technique involves construction of steel jackets which is quite effective from strength,
stiffness and ductility considerations. However, it increases overall cross-sectional
dimensions, leading to increase in self-weight of structures and is labour intensive. To
eliminate these problems, steel plate was replaced by corrosion resistant and light-weight
FRP Composite plates. FRPCs help to increase strength and ductility without excessive
increase in stiffness. Further, such material could be designed to meet specific requirements

3
by adjusting placement of fibres. So concrete members can now be easily and effectively
strengthened using externally bonded FRP composites.
By wrapping FRP sheets, retrofitting of concrete structures provide a more
economical and technically superior alternative to the traditional techniques in many
situations because it offers high strength, low weight, corrosion resistance, high fatigue
resistance, easy and rapid installation and minimal change in structural geometry. FRP
systems can also be used in areas with limited access where traditional techniques would be
impractical. However, due to lack of the proper knowledge on structural behavior of concrete
structures, the use of these materials for retrofitting the existing concrete structures cannot
reach up to the expectation. Successful retrofitting of concrete structures with FRP needs a
thorough knowledge on the subject and available user-friendly technologies/ unique
guidelines.
Beams are the critical structural members subjected to bending, torsion and shear in
all type of structures. Similarly, columns are also used as various important elements
subjected to axial load combined with/without bending and are used in all type of structures.
Therefore, extensive research works are being carried out throughout world on
retrofitting of concrete beams and columns with externally bonded FRP composites. Several
investigators took up concrete beams and columns retrofitted with carbon fibre reinforced
polymer (CFRP)/ glass fibre reinforced polymer (GFRP) composites in order to study the
enhancement of strength and ductility, durability, effect of confinement, preparation of design
guidelines and experimental investigations of these members.

4
1.2 FLEXURAL STRENGHTENING OF BEAMS
For flexural strengthening, there are many methods such as: section enlargement, steel
plate bonding, external post tensioning method, near-surface mounted (NSM) system and
externally bonded (EB) system. While many methods of strengthening structures are
available, strengthening structures via external bonding of advanced fibre-reinforced polymer
composite (FRP) has become very popular worldwide. During the past decade, their
application in this field has been rising due to the well-known advantages of FRP composites
over other materials. Consequently, a great quantity of research, both experimental and
theoretical, has been conducted on the behaviour of FRP-strengthened reinforced concrete
(RC) structures. In this regard, the evolving technology of using carbon-bonded fibre-
reinforced polymers (CFRP) for strengthening of RC beams has attracted much attention in
recent years.
1.3 ADVANTAGES OF FRP
Some of the main advantages of FRP can be listed below:
Low weight: The FRP is much less dense and therefore lighter than the equivalent volume of
steel. The lower weight of FRP makes installation and handling significantly easier than steel.
These properties are particularly important when installation is done in cramped locations.
Other works like works on soffits of bridges and building floor slabs are carried out from
man-access platforms rather than from full scaffolding. The use of fibre composites does not
significantly increase the weight of the structure or the dimensions of the member. And
because of their light weight, the transport of FRP materials has minimal environmental
impact.

5
Mechanical strength: FRP can provide a maximum material stiffness to density ratio of 3.5
to 5 times that of aluminium or steel. FRP is so strong and stiff for its weight, it can out-
perform the other materials.
Formability: The material can take up irregularities in the shape of the concrete surface. It
can be moulded to almost any desired shape. We can create or copy most shapes with ease.
Chemical resistance: FRP is minimally reactive, making it ideal as a protective covering for
surfaces where chemical
Joints: Laps and joints are not required.
Corrosion resistance: Unlike metal, FRP does not rust away and it can be used to make
long-lasting structures.
Low maintenance: Once FRP is installed, it requires minimal maintenance. The materials
fibres and resins are durable if correctly specified, and require little maintenance. If they are
damaged in service, it is relatively simple to repair them, by adding an additional layer.
Long life: It has high resistance to fatigue and has shown excellent durability over the last 50
years.
Easy to apply: The application of FRP plate or sheet material is like applying wallpaper;
once it has been rolled on carefully to remove entrapped air and excess adhesive it may be
left unsupported. Fibre composite materials are available in very long lengths while steel
plate is generally limited to 6 m.
These various factors in combination lead to a significantly simpler and quicker
strengthening process than when using steel plate.

6
1.4 SUITABILITY OF FRP FOR USES IN STRUCTURAL ENGINEERING
The strength properties of FRPs collectively make up one of the primary reasons for
which civil engineers select them in the design of structures. A material's strength is governed
by its ability to sustain a load without excessive deformation or failure. When an FRP
specimen is tested in axial tension, the applied force per unit cross-sectional area (stress) is
proportional to the ratio of change in a specimen's length to its original length (strain). When
the applied load is removed, FRP returns to its original shape or length. In other words, FRP
responds linear-elastically to axial stress. The response of FRP to axial compression is reliant
on the relative proportion in volume of fibres, the properties of the fibre and resin, and the
interface bond strength. FRP composite compression failure occurs when the fibres exhibit
extreme (often sudden and dramatic) lateral or sides-way deflection called fibre buckling.
FRP's response to transverse tensile stress is very much dependent on the properties of the
fibre and matrix, the interaction between the fibre and matrix, and the strength of the fibre-
matrix interface. Generally, however, tensile strength in this direction is very poor.
Shear stress is induced in the plane of an area when external loads tend to cause two
segments of a body to slide over one another. The shear strength of FRP is difficult to
quantify. Generally, failure will occur within the matrix material parallel to the fibres.
Among FRP's high strength properties, the most relevant features include excellent durability
and corrosion resistance. Furthermore, their high strength-to-weight ratio is of significant
benefit; a member composed of FRP can support larger live loads since its dead weight does
not contribute significantly to the loads that it must bear. Other features include ease of
installation, versatility, anti-seismic behaviour, electromagnetic neutrality, excellent fatigue
behaviour, and fire resistance. However, like most structural materials, FRPs have a few
drawbacks that would create some hesitancy in civil engineers to use it for all applications:
high cost, brittle behaviour, susceptibility to deformation under long-term loads, UV

7
degradation, photo-degradation (from exposure to light), temperature and moisture effects,
lack of design codes, and most importantly, lack of awareness.
1.5 APPLICATIONS OF FRP COMPOSITES IN CONSTRUCTION
There are three broad divisions into which applications of FRP in civil engineering
can be classified: applications for new construction, repair and rehabilitation applications,
and architectural applications. FRPs have been used widely by civil engineers in the design
of new construction. Structures such as bridges and columns built completely out of FRP
composites have demonstrated exceptional durability, and effective resistance to effects of
environmental exposure. Pre-stressing tendons, reinforcing bars, grid reinforcement and
dowels are all examples of the many diverse applications of FRP in new structures. One of
the most common uses for FRP involves the repair and rehabilitation of damaged or
deteriorating structures. Several companies across the world are beginning to wrap damaged
bridge piers to prevent collapse and steel-reinforced columns to improve the structural
integrity and to prevent buckling of the reinforcement. Architects have also discovered the
many applications for which FRP can be used. These include structures such as
siding/cladding, roofing, flooring and partitions.
1.6 CURRENT RESEARCH ON FRP
A serious matter relating to the use of FRPs in civil applications is the lack of design
codes and specifications. For nearly a decade now, researchers from Canada, Europe, and
Japan have been collaborating their efforts in hope of developing such documents to provide
guidance for engineers designing FRP structures.

8
1.7 DESIGN CONSIDERATIONS
The development of the advanced composite technology is an engineer's dream for
innovative design and application. The characteristics of a composite can be tailored and
designed to meet any desired specifications. Most of the information and design data
available on composites are in the aerospace applications, but they are protected under the
guise of proprietary systems and/or military classified documents. Unlike conventional
isotropic materials of steel and concrete, there are no readily available design charts and
guidelines to help the structural engineer. When it comes to working with composites as
opposed to conventional materials, as the author has discovered, the difference can be as
dramatic as night and day.
1.8 DISADVANTAGES OF FRP
The main disadvantage of externally strengthening structures with fibre composite
materials is the risk of fire, vandalism or accidental damage, unless the strengthening is
protected. A particular concern for bridges over roads is the risk of soffit reinforcement being
hit by over-height vehicles.
A perceived disadvantage of using FRP for strengthening is the relatively high cost of
the materials. However, comparisons should be made on the basis of the complete
strengthening exercise; in certain cases the costs can be less than that of steel plate bonding.
A disadvantage in the eyes of many clients will be the lack of experience of the techniques
and suitably qualified staff to carry out the work. Finally, a significant disadvantage is the
lack of accepted design standards.

9
CHAPTER-2
REVIEW
OF
LITERATURE

10
CHAPTER-2
REVIEW OF LITERATURE
2.1 BRIEF REVIEW
This chapter provides a review of literature on strengthening of RC concrete beams.
This review comprises of literature on strengthened beam under two types of support
condition i.e. simply supported and continuously supported.
2.1.1 SIMPLY SUPPORTED BEAM
Grace et al. (1999) investigated the behaviour of RC beams strengthened with CFRP
and GFRP sheets and laminates. They studied the influence of the number of layers, epoxy
types, and strengthening pattern on the response of the beams. They found that all beams
experienced brittle failure, with appreciable enhancement in strength, thus requiring a higher
factor of safety in design.
Experimental investigations, theoretical calculations and numerical simulations
showed that strengthening the reinforced concrete beams with externally bonded CFRP
sheets in the tension zone considerably increased the strength at bending, reduced deflections
as well as cracks width (Ross et al., 1999; Sebastian, 2001; Smith & Teng, 2002; Yang et al.,
2003; Aiello & Ombres, 2004). It also changed the behaviour of these beams under load and
failure pattern. Most often the strengthened beams failed in a brittle way, mainly due to the
loss of connection between the composite material and the concrete. The influence of the
surface preparation of the concrete, adhesive type, and concrete strength on the overall bond
strength is studied as well as characteristics of force transfer from the plate to concrete. They
concluded that the surface preparation along with along with soundness of concrete could

11
influence the ultimate bond strength. Thereafter, Study on de-bonding problems in concrete
beams externally strengthened with FRP composites are carried out by many researchers.
Many investigators used externally bonded FRP composites to improve the flexural
strength of reinforced concrete members. To evaluate the flexural performance of the
strengthened members, it is necessary to study flexural stiffness of FRP strengthened
members at different stages, such as pre-cracking, post-cracking and post-yielding. However,
only few studied are focused on the reinforced concrete members strengthened under pre-
loading or pre-cracking (Arduni & Nanni, 1997).
F. Ceroni(2010) investigated the experimental program on Reinforced Concrete (RC)
beams externally strengthened with carbon Fibre Reinforced Plastic (FRP) laminates and
Near Surface Mounted (NSM) bars under monotonic and cyclic loads, the latter ones
characterized by a low number of cycles in the elastic and post-elastic range. Comparisons
between experimental and theoretical failure loads are discussed in detail.
Obaidat et al. (2010) studied the Retrofitting of reinforced concrete beams using
composite laminates and the main variables considered are the internal reinforcement ratio,
position of retrofitting and the length of CFRP. The experimental tests were performed to
investigate the behaviour of beams designed in such a way that either flexural or shear failure
will be expected. The beams were loaded in four-point bending until cracks developed. The
beams were then unloaded and retrofitted with CFRP. Finally the beams were loaded until
failure. The ABAQUS program was used to develop finite element models for simulation of
the behaviour of beams. The concrete was modelled using a plastic damage model and two
models, a perfect bond model and a cohesive model, were evaluated for the concrete-CFRP
interface. From the analyses the load-deflection relationships until failure, failure modes and
crack patterns were obtained and compared to the experimental results. The FEM results

12
agreed well with the experiments when using the cohesive model regarding failure mode and
load capacity while the perfect bond model was not able to represent the debonding failure
mode. The results showed that when the length of CFRP increases the load capacity of the
beam increases both for shear and flexural retrofitting. FEM results also showed that the
width and stiffness of CFRP affect the failure mode of retrofitted beams. The maximum load
increases with increased width. Increased CFRP stiffness increases the maximum load only
up to a certain value of the stiffness, and thereafter it decreases the maximum load.
In another research, Hee Sun Kim (2011) carried on experimental studies of 14
reinforced concrete (RC) beams retrofitted with new hybrid fibre reinforced polymer (FRP)
system consisting carbon FRP (CFRP) and glass FRP (GFRP). The objective of this study
was to examine effect of hybrid FRPs on structural behavior of retrofitted RC beams and to
investigate if different sequences of CFRP and GFRP sheets of the hybrid FRPs have
influences on improvement of strengthening RC beams. The beams are loaded with different
magnitudes prior to retrofitting in order to investigate the effect of initial loading on the
flexural behavior of the retrofitted beam. The main test variables are sequences of attaching
hybrid FRP layers and magnitudes of preloads. Under loaded condition, beams are retrofitted
with two or three layers of hybrid FRPs, then the load increases until the beams reach failure.
Test results conclude that strengthening effects of hybrid FRPs on ductility and stiffness of
RC beams depend on orders of FRP layers.
2.1.2 CONTINUOUS BEAM
Although several research studies have been conducted on the strengthening of simply
supported reinforced concrete beams using external plates, there is very less reported work on
the behaviour of strengthened continuous beams. Moreover, most design guidelines have
been developed for simply supported beams with external FRP laminates. A critical literature

13
review revealed that a minimum amount of research work had been done for addressing the
possibility of strengthening the negative moment region of continuous beam using FRP
materials.
Grace et al., (1999) tested five continuous beams. Four different strengthening
systems were examined. The first beam was strengthened only for flexure, while the second
beam was strengthened for both flexure and shear. The third beam was strengthened with
glass fibre reinforced polymer (GFRP) sheets, and the fourth beam was strengthened by using
CFRP plates. The fifth beam was fabricated as control beam. All the beams were loaded and
unloaded for at least one loading cycle before failure. The use of FRP laminates to strengthen
continuous beams was effective for reducing deflections and for increasing their load
carrying capacity. It was also concluded that the beams strengthened with FRP laminates
exhibit smaller and better distributed cracks.
Grace et al., (2001) investigated the experimental performance of CFRP strips used
for flexural strengthening in the negative moment region of a full-scale reinforced concrete
beam. They considered two categories of beams (I and II) for flexural strengthening.
Category I beams were designed to fail in shear and Category II beams were designed to fail
in flexure. Five full scale concrete beams of each category were tested. It was found that
Category I beams failed by diagonal cracking with local debonding at the top of the beams,
meanwhile Category II beams failed by delamination at the interface of the CFRP strips and
the concrete surface, both with and without concrete-cover failure by means shear/tension
delamination. When the beams failed, the CFRP strips were not stressed to their maximum
capacity, which led to ductile failures in all the beams. The maximum increase of load-
carrying capacity due to strengthening was observed to be 29% for Category I beams, and
40% for Category II beams with respect to corresponding control beams.

14
On the other hand, Grace et al., (2005) performed another research work where three
continuous beams were tested. One of those beam was considered as the reference beam and
conventional ductile flexural failure occurred. They strengthened the other two beams along
their negative and positive moment regions around the top and bottom face on both sides as a
U-wrap. It was concluded that the strengthened beams with the triaxial fabric showed greater
ductility than those strengthened with CFRP sheets.
In another research, El-Refaie et al., (2003) examined 11 reinforced concrete (RC)
two-span beams strengthened in flexure with external bonded CFRP sheets. According to the
arrangement of the internal steel reinforcement, the beams were classified into two groups.
Each group included one non-strengthened reference beam. It was noted that, all strengthened
beams exhibited less ductility compared with the non-strengthened control beams. An
optimum number of CFRP layers were found beyond which there was no further
enhancement in the beam capacity. It was also investigated that extending the CFRP sheet
length to cover the entire hogging or sagging zones did not prevent peeling failure of the
CFRP sheets, which was the dominant failure mode of tested beams.
More recently, El-Refaie et al., (2003) tested five reinforced concrete continuous
beams strengthened in flexure with external CFRP laminates. All beams had the same
geometrical dimensions and internal steel reinforcement. The main parameters examined
were the position and form of the CFRP laminates. Three of the beams were strengthened
using different lay-up arrangements of CFRP reinforcement, and one was strengthened using
CFRP sheets. The performance of the CFRP strengthened beams was compared with a non-
strengthened reference beam. It was found that, peeling failure was the principal failure mode
for all the strengthened tested beams. It was found that the longitudinal elastic shear stresses
at the adhesive/concrete interface calculated at beam failure were close to the limiting value

15
recommended in (Concrete Society Technical Report 55, 2000). They also found that,
strengthened beams at both sagging and hogging zone produced the highest load capacity.
Ashour et al., (2004) tested 16 reinforced concrete (RC) continuous beams with
different arrangements of internal steel bars and external CFRP laminates. All test specimens
had the same geometrical dimensions and were classified into three groups according to the
amount of internal steel reinforcement. Each group included one non-strengthened control
beam designed to fail in flexure. Three failure modes were observed, namely laminate
rupture, laminate separation and peeling failure of the concrete cover attached to the
composite laminate. The ductility of all strengthened beams was reduced in comparison with
their respective reference beam. Additionally, simplified methods for estimating the flexural
load capacity and the interface shear stresses between the adhesive and the concrete material
were presented. As in previous studies, they observed that increasing the CFRP sheet length
in order to cover the entire negative or positive moment zones did not prevent peeling failure
of the CFRP laminates.
Aiello et al., (2007) compared the behaviour between continuous RC beams
strengthened with of CFRP sheets at negative or positive moment regions and RC beams
strengthened at both negative and positive moment regions. All the beams were strengthened
with one CFRP sheet layer and with the remark that the beams were not loaded at the middle
of span. The control beams underwent a typical flexural and failure of the strengthened
beams occurred by debonding of the CFRP sheets, together with concrete crushing. It was
found out that when the strengthening was applied to both hogging and sagging regions, the
ultimate load capacity of the beams was the highest and about 20% of moment redistribution
could be achieved by CFRP sheets externally glued in the sagging region.

16
Recently, Maghsoudi et al., (2009) examined the flexural behaviour and moment
redistribution of reinforced high strength concrete (RHSC) continuous beams strengthened
with carbon fibre. They observed that by increasing the number of CFRP layers, the ultimate
strength increases, meanwhile ductility, moment redistribution, and ultimate strain of CFRP
sheet decrease. Test results also showed that by increasing the number of CFRP sheet layers,
there was a change in the failure mode from tensile rupture to IC debonding. End U-straps
were effective in limiting end debonding, but not intermediate span debonding.
Again, Akbarzadeh et al., (2010) conducted an experimental program to study the
flexural behaviour and moment redistribution of reinforced high strength concrete (RHSC)
continuous beams strengthened with CFRP and GFRP sheets. As the previous work, test
results showed that by increasing the number of CFRP sheet layers, the ultimate strength
increases, while ductility, moment redistribution, and ultimate strain of CFRP sheet decrease.
However, by using the GFRP sheets in strengthening the continuous beams, it is possible to
reduce the loss in ductility and moment redistribution but a significant increase in the
ultimate strength cannot be achieved. The moment enhancement ratio of the strengthened
continuous beams was significantly higher than the ultimate load enhancement ratio for the
same beam. They also developed an analytical model for moment–curvature and load
capacity which they used for the tested continuous beams in this current study and in other
similar researches.
Finally, Majid Mohammed Ali Kadhim (2011) focused on the behavior of the high
strength concrete continuous beam strengthened with carbon fibre-reinforced polymer
(CFRP) sheet with different CFRP sheet lengths. Three full-scale continuous beams are
analyzed under two points load, and the data of analysis are compared with the experimental
data provided by other researchers. ANSYS program is used and the results obtained from

17
analysis give good agreement with experimental data with respect to load–deflection curve,
ultimate strength, and the crack patterns. The length of CFRP sheet is changed in the negative
and positive regions and the results showed that the ultimate strength of the beam was
reached when the value of Lsheet/Lspan reaches 1.0, and when the value decreases, the
ultimate strength of beam also decreases a little (1.4%), but when it decreases less than 0.6,
the ultimate strength also decreases a lot (15%).
From the above information, it is, thus, clear that there lies a vast scope of research in
the field of retrofitting of RC continuous beam. Although a great deal of research has been
carried out on simply supported reinforced concrete (RC) beams strengthened with Fibre
Reinforced Polymer composites (FRP), a few works has been focused on continuous beams.
2.2 OBJECTIVE AND SCOPE OF THE PRESENT WORK
The objective of this work is to carry out the investigation of externally bonded RC
continuous beams using FRP sheet.
In the present work, behavior of RC continuous rectangular beams strengthened with
externally bonded GFRP is experimentally studied. The beams are grouped into two series
labeled S1 and S2. Each series have different longitudinal and transverse steel reinforcement
ratios. All beams have the same geometrical dimensions. These beams are tested up to failure
by applying two points loading to evaluate the enhancement of flexural strength due to
strengthening. A finite element model has been developed to study the response of
strengthened beams.

18
CHAPTER-3
EXPERIMENTAL STUDY

19
CHAPTER 3
EXPERIMENTAL STUDY
The experimental study consists of casting of fourteen large scale continuous (two-span)
rectangular reinforced concrete beams. All the beams weak in flexure are casted and tested to
failure. The beams were grouped into two series labeled S1 and S2. Each series had different
longitudinal and transverse steel reinforcement ratios which are mentioned in Table 3.6 and
Table 3.7 for S1 and S2 respectively. Beams geometry as well as the loading and support
arrangements are illustrated in Figure 3.6. All beams had the same geometrical dimensions: 150
mm wide × 200 mm deep × 2300 mm long.
One beam from each series (S1 and S2) was not strengthened and was considered as a
control beam, whereas all other beams from both the series were strengthened with externally
bonded GFRP sheets. Experimental data on load, deflection and failure modes of each of the
beams are obtained. The change in load carrying capacity and failure mode of the beams are
investigated for different types of strengthening pattern.
3.1 CASTING OF SPECIMEN
For conducting experiment, the proportion of 1: 1.67: 3.33 is taken for cement, fine
aggregate and course aggregate. The mixing is done by using concrete mixture. The beams are
cured for 28 days. For each beam six concrete cube specimens were made at the time of casting
and were kept for curing. The uniaxial compressive tests on produced concrete (150 × 150 × 150
mm concrete cube) were performed and the average concrete compressive strength (fcu) after 28
days for each beam is shown in Table 3.6 and Table 3.7.

20
Description Cement Sand (Fine Aggregate)
Course Aggregate
Water
Mix Proportion (by weight) 1 1.67 3.33 0.55
Quantities of materials (Kg/m3) 368.42 533.98 1231.147 191.58
3.1.1 MATERIALS FOR CASTING
3.1.1.1 CEMENT
Portland Slag Cement (PSC) (Brand: Konark) is used for the experiment. It is tested for
its physical properties in accordance with Indian Standard specifications. It is having a specific
gravity of 2.96.
(i) Specific gravity : 2.96
(ii) Normal Consistency : 32%
(iii)Setting Times : Initial : 105 minutes Final : 535 minutes.
(iv) Soundness : 2 mm expansion
(v) Fineness : 1 gm retained in 90 micron sieve
3.1.1.2 FINE AGGREGATE
The fine aggregate passing through 4.75 mm sieve and having a specific gravity of 2.67
are used. The grading zone of fine aggregate is zone III as per Indian Standard specifications.
Table 3.1 Design Mix Proportions

21
3.1.1.3 COARSE AGGREGATE
The coarse aggregates of two grades are used one retained on 10 mm size sieve and
another grade contained aggregates retained on 20 mm sieve. It is having a specific gravity of
2.72.
3.1.1.4 WATER
Ordinary tap water is used for concrete mixing in all the mix.
3.1.1.5 REINFORCING STEEL
All the beams were grouped into two series labeled S1 and S2. Each series had different
longitudinal and transverse steel reinforcement ratios which are mentioned in Table 3.6 and
Table 3.7.
Series S1 beams are reinforced with two 8 mm diameter at the bottom, two 12 mm
diameter bars as top reinforcement throughout the length and two 10 mm diameter bars at top
tension zone. To strengthen the beam in shear, two different diameter bars is used for stirrups, 10
mm diameter is used in the shear zone of intermediate support and 8mm diameter is used in the
zone of end support. The diameter variation is given due to higher shear force in intermediate or
continuous support than end support. Series S2 beams were reinforced with two high-yield
Strength Deformed bars of 10 mm diameter at the bottom and two 10 mm diameter bars at top
tension zone, 6 mm bars were used as hanger bars, closed stirrups of 8 mm diameter high-yield
Strength Deformed bars at 100 mm centres were provided to prevent shear failure.
Three bars of each diameter rods were tested in tensile and the measured average yield
strength is averaged and shown in Table 3.3. The modulus of elasticity of steel bars was 2 × 10⁵
MPa.

22
Diameter of the reinforcement (mm)
Tensile strength (MPa)
8 523 10 429 12 578
3.1.2 DETAILING OF REINFORCEMENT
For the same series of continuous reinforced concrete beams, same arrangement for
flexure and shear reinforcement is made.
Table 3.2 Tensile Strength of the bars
Figure 3.1 Detailing of reinforcement 1, 2 – top and bottom steel reinforcement
Figure 3.2 Cross section: 1 – Longitudinal rebars, 2 – close stirrups
23
3.1.3 FORM WORK
3.1.4 MIXING OF CONCRETE
Mixing of concrete is done thoroughly with the help of machine mixer so that a uniform
quality of concrete is obtained.
3.1.5 COMPACTION
Needle vibrator was used for proper Compaction and care is taken to avoid displacement
of the reinforcement cage inside the form work. Then the surface of the concrete is leveled and
smoothened by metal trowel and wooden float.
3.1.6 CURING OF CONCRETE
Curing is done to prevent the loss of water which is essential for the process of hydration
and hence for hardening. Here curing is done by spraying water on the jute bags spread over the
surface for a period of 28 days.
Figure 3.3 Steel Frame Used For Casting of Beam

24
3.2 STRENGTHENING OF BEAMS
At the time of bonding of fiber, the concrete surface is made rough using a coarse sand
paper texture and then cleaned with an air blower to remove all dirt and debris. The fabrics are
cut according to the size and after that the epoxy resin is mixed in accordance with
manufacturer’s instructions. The mixing is carried out in a plastic container (100 parts by weight
of Araldite LY 556 to 10 parts by weight of Hardener HY 951). After the uniform mixing, the
epoxy resin is applied to the concrete surface. Then the GFRP sheet is placed on top of epoxy
resin coating and the resin is squeezed through the roving of the fabric with the roller. Air
bubbles entrapped at the epoxy/concrete or epoxy/fabric interface are eliminated. This operation
is carried out at room temperature. Concrete beams strengthened with glass fiber fabric are cured
for at least 7 days at room temperature before testing.
Figure 3.4 Application of epoxy and hardener on the beam

25
3.3 EXPERIMENTAL SETUP
The beams are tested in the loading frame of the “Structural Engineering” Laboratory of
National Institute of Technology, Rourkela. The testing procedure for the all the specimen is
same. The two-point loading arrangement is used for testing of beams. Two-point loading is
conveniently provided by the arrangement shown in Figure 3.6.
The load is transmitted through a load cell and spherical seating on to a spreader beam.
The spreader beam is installed on rollers seated on steel plates bedded on the test member with
cement in order to provide a smooth leveled surface. The test member is supported on roller
bearings acting on similar spreader plates. The specimen is placed over the two steel rollers
bearing leaving 150 mm from the ends of the beam. The remaining 1000 mm is divided into two
Figure 3.5 Roller used for the removal of air bubble

26
equal parts of 500 mm. Two dial gauges are placed just below the center of the mid span of the
beam i.e. just below the load point for recording the deflection of the beams.
Figure 3.6 Experimental setup

27
3.4 FABRICATION OF GFRP PLATE
There are two basic processes for moulding: hand lay-up and spray-up. The hand lay-up
process is the oldest and simplest fabrication method. The process is most common in FRP
marine construction. In hand lay-up process, liquid resin is placed along with FRP against
finished surface. Chemical reaction of the resin hardens the material to a strong light weight
product. The resin serves as the matrix for glass fiber as concrete acts for the steel reinforcing
rods.
The following constituent materials were used for fabricating plates:
1. Glass Fiber
2. Epoxy as resin
Figure 3.7 Continuous beam (a) Shear Force Diagram (b)Bending Moment Diagram
a
b

28
3. Diamine as hardener as (catalyst)
4. Polyvinyl alcohol as a releasing agent
A plastic sheet was kept on the plywood platform and a thin film of polyvinyl alcohol was
applied as a releasing agent by the use of spray gun. Laminating starts with the application of a
gel coat (epoxy and hardener) deposited in the mould by brush, whose main purpose was to
provide a smooth external surface and to protect fibers from direct exposure from the
environment. Steel roller was applied to remove the air bubbles. Layers of reinforcement were
applied and gel coat was applied by brush. Process of hand lay-up is the continuation of the
above process before gel coat is hardened. Again a plastic sheet was applied by applying
polyvinyl alcohol inside the sheet as releasing agent. Then a heavy flat metal rigid platform was
kept top of the plate for compressing purpose. The plates were left for minimum 48 hours before
transported and cut to exact shape for testing.
Plates of 2 layers, 4 layers, 6 layers and 8 layers were casted and six specimens from each
thickness were tested.
Figure 3.8 Specimens for tensile testing

29
Figure 3.10 Specimen failure after tensile test
Figure 3.9 Experimental set up of INSTRON 1195

30
No. of layers Length (cm) Width (cm) Thickness (cm)
2 15 2.3 0.1
4 15 2.3 0.25
6 15 2.3 0.3
8 15 2.3 0.45
3.5 DETERMINATION OF ULTIMATE STRESS, ULTIMATE LAOD AND YOUNG’S
MODULUS
The ultimate stress, ultimate load and young’s modulus was determined experimentally
by performing unidirectional tensile test on the specimens cut in longitudinal and transverse
direction. The dimensions of the specimens are shown in Table 3.4. The specimens were cut
from the plates by diamond cutter or by hex saw. After cutting by hex saw, it was polished in the
polishing machine.
For measuring the young’s modulus, the specimen is loaded in INSTRON 1195 universal
tensile test machine to failure with a recommended rate of extension. Specimens were gripped in
the upper jaw first and then gripped in the movable lower jaw. Gripping of the specimen should
be proper to prevent slippage. Here, it is taken as 50 mm from each side. Initially, the stain is
kept zero. The load as well as extension was recorded digitally with the help of the load cell and
an extensometer respectively. From these data, stress versus stain graph was plotted, the initial
slope of which gives the Young’s modulus. The ultimate stress and the ultimate load were
Table 3.3 Size of the specimens for tensile test

31
obtained at the failure of the specimen. The average value of each layer of the specimens is given
in the Table 3.5.
Thickness of the specimen
Ultimate stress
(MPa)
Ultimate Load (N) Young’s
modulus(MPa)
2 Layers 172.79 6200 6829.9
4 Layers 209.09 9200 7788.5
6 Layers 236.23 12900 7207.4
8 Layers 253.14 26200 7333.14
3.6 TESTING OF BEAMS
All the fourteen beams are tested one by one. All of them are tested in the above
arrangement. The gradual increase in load and the deformation in the dial gauge reading are
taken throughout the test. The load at which the first visible crack is developed is recorded as
cracking load. Then the load is applied till the ultimate failure of the beam. The deflections at
midpoint of each span are taken for all beams with and without GFRP and are recorded with
respect to increase of load. The data furnished in this chapter have been interpreted and discussed
in the next chapter to obtain a conclusion.
Table 3.4 Result of the specimens

32
Designation of
Beams
fcu (MPa)
Main Longitudinal
steel
Positive moment strengthening
Negative moment strengthening
Top Bottom No. of layers
Strengthened length(m)
No. of layers
Strengthened length(m)
CB1 22.67 2-12
2-10* 2-8 - - - -
SB1 23.3 2-12 2-10*
2-8 2
0.88m
6
0.88m
SB2 25.82 2-12 2-10*
2-8 1
SB3 23.85 2-12 2-10*
2-8 2
SB4 24.46 2-12 2-10*
2-8 3
SB5 24.68 2-12 2-10*
2-8 4
SB6 22.86 2-12 2-10*
2-8 4
SB7 25.3 2-12 2-10*
2-8 2 4
SB8 25.13 2-12 2-10*
2-8 3 6
SB9 23.9 2-12 2-10*
2-8 2
Table 3.5 Details of the Test Specimens for Series S1
*provided at top tension zone

33
Designation of
Beams
fcu (MPa)
Main Longitudinal steel
Positive moment strengthening
Negative moment strengthening
Top Bottom No. of layers
Strengthened length(m)
No. of layers
Strengthened length(m)
CB2 25.34 2-6,
2-10* 2-10 0 - 0 -
TB1 24.5 2-6, 2-10*
2-10 2
0.88m
6
0.88m TB2 23.51 2-6, 2-10*
2-10 2
TB3 25.61 2-6, 2-10*
2-10 4
3.6.1 BEAM-1
CONTROL BEAM (CB1)
The control beam, CB1, failed in the RC conventional flexural mode due to yielding of
internal tensile steel reinforcement. The wide flexural cracks were occurred at mid-span and
central support. These cracks were well extended to the compressive regions.
Table 3.6 Details of the Test Specimens for Series S2
*provided at top tension zone

34
Figure 3.12 Flexural failure of CB1
Figure 3.11 Experimental Setup of the CB1

35
3.6.2 BEAM-2
CONTROL BEAM (CB2)
The control beam, CB2 also failed in flexural failure as shown in Figure 3.13.
3.6.3 BEAM-3
STRENGHENED BEAM 1 (SB1)
The beam was strengthened by applying two layers of FRP below the beam (width= 150
mm) from support to support and six layers of FRP above the central support (width= 150 mm)
between two load points as shown in Figure 3.14. The strengthened beam SB1, showed crack at
a load of 110 KN and failed by debonding failure in which the FRP sheet was separated without
concrete cover and the ultimate failure occurred at 320KN as shown in Figure 3.15. The rupture
Figure 3.13 Control Beam, CB2 after failure

36
of FRP sheet was sudden and accompanied by a loud noise indicating a rapid release of energy
and a total loss of load capacity.
Figure 3.14 Experimental Setup of the Beam

37
3.6.4 BEAM-4
STRENGHENED BEAM 2 (SB2)
Single layer of U-wrap was applied on the beam to prevent flexural failure. Tensile
rupture of FRP occurred at the mid section of both left and right span at lower loads and as the
Figure 3.15 Debonding failure of FRP
Figure 3.16 Magnified view of the failure of the beam

38
load increased, the beam failed in debonding with concrete cover as shown in Figure 3.17 and
shear crack was developed below the FRP layer as shown in Figure 3.18.
Figure 3.17 Tensile rupture of FRP at mid section of right span at lower value of load

39
3.6.5 BEAM-5
STRENGHENED BEAM 3 (SB3)
U- Jacketed double Layered GFRP was applied to enhance the load capacity as shown in
the Figure3.19. By strengthening the RC beam using GFRP sheet, the cracking of the beam can
be delayed and flexural capacity can be increased. The strengthened beam failed in debonding of
FRP sheet (Figure 3.20).
Figure 3.18 Ultimate failure of beam by debonding of FRP with concrete cover

40
Figure 3.19 U-jacketed GFRP wrapped on the Beam SB3

41
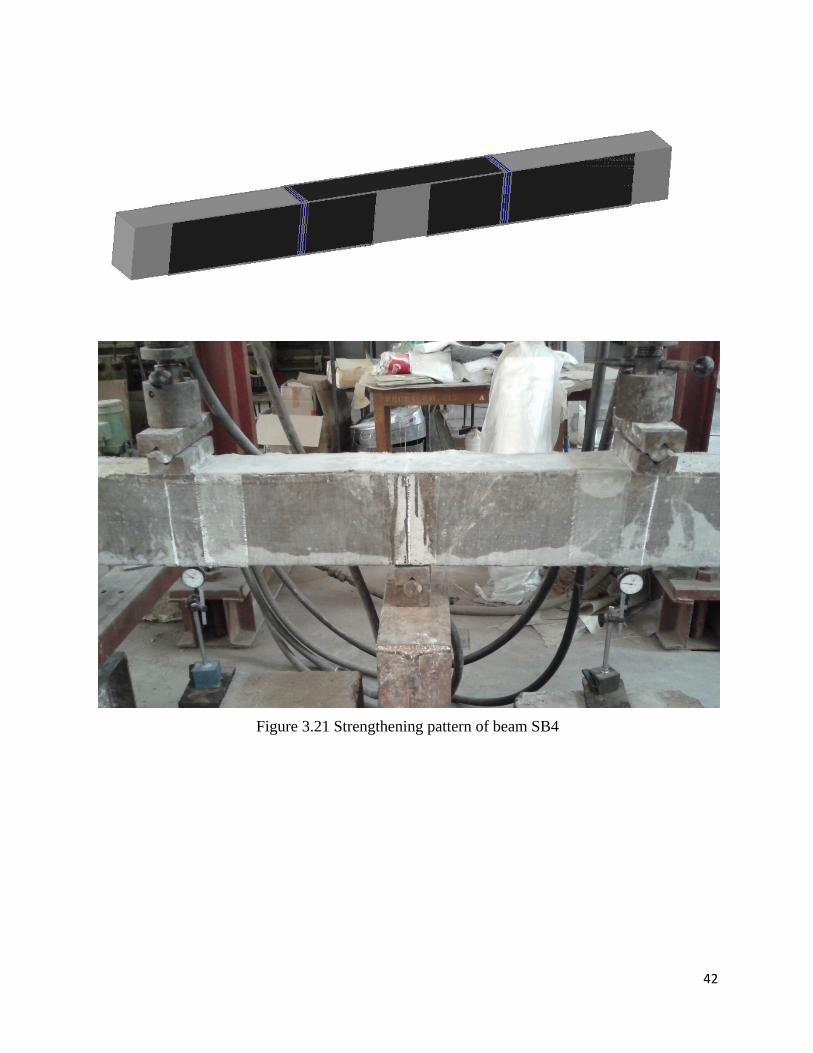
3.6.6 BEAM-6
STRENGHENED BEAM 5 (SB4)
To prevent debonding, one layer of complete U-wrap was provided above the FRP of two layers
which was applied at the soffit of the beam (width =150 mm) and one layer of U-strip of width
10 cm was applied over 6 layers FRP above the central support. Complete U-wrap took extra
load and prevented the debonding, the failure mode was tensile rupture and as the U-strip could
not prevent debonding of upper layer of FRP as it got ruptured at higher load value.
Figure 3.20 Debonding failure of FRP
42
Figure 3.21 Strengthening pattern of beam SB4

43
Figure 3.22 Crack pattern after initial loading
Figure 3.23 Failure of the beam by tensile rupture

44
3.6.7 BEAM-7
STRENGHENED BEAM 5 (SB5)
Same arrangement of FRP was made as SB4 and to enhance the capacity of beam SB4, two
layers of complete U-wrap was provided in place of one layer and layers of U-strip of width 10
cm was applied instead of one layer.
Figure 3.24 Cracking pattern at lower load value

45
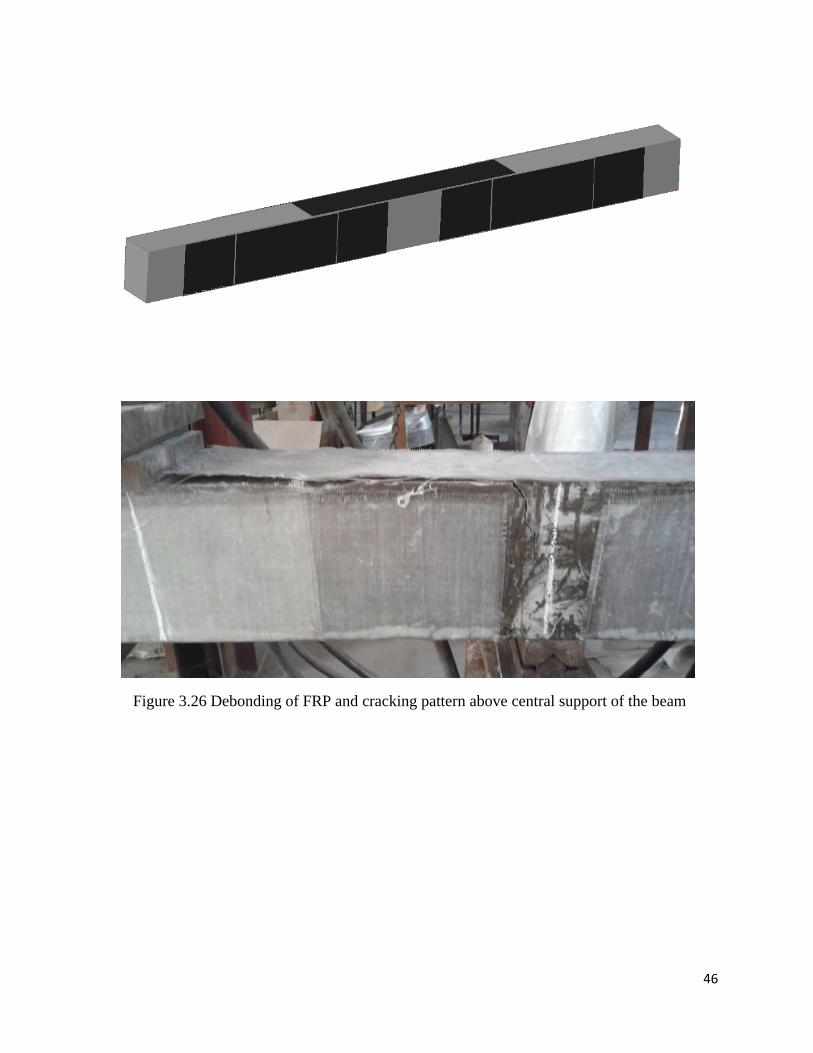
3.6.8 BEAM-8
STRENGHENED BEAM 6 (SB6)
Above the U- Jacketed double Layered GFRP, more two layers of FRP but half of the width of
the first two layers, was applied at the flexural zone to prevent the flexural failure. In this case,
instead of tensile rupture, debonding failure occurred as shown in Figure 3.27.
Figure 3.25 Rupture of GFRP sheet at mid section of the right span
46
Figure 3.26 Debonding of FRP and cracking pattern above central support of the beam

47
3.6.9 BEAM-9
STRENGHENED BEAM 7 (SB7)
The depth of the neutral axis was found out and the GFRP was provided up to the Neutral axis
from the tension face. Here, shear crack was found and debonding occurred as shown in Figure
3.29.
Figure 3.27 Debonding failure of Strengthened beam SB6

48
Figure 3.28 Strengthening pattern of SB7
Figure 3.29 Shear crack in the left span

49
3.6.10 BEAM-10
STRENGHENED BEAM 8 (SB8)
The no. of FRP layers was increased here as compared to SB7 to examine the changes in load
capacity or the failure pattern. The failure mode of the beam was debonding as shown in Figure
3.32.
Figure 3.30 Magnified view of shear crack and debonding of GFRP

50
Figure 3.31 Strengthening pattern of SB8
Figure 3.32 Failure of SB8 by debonding of GFRP

51
3.6.11 BEAM-11
STRENGHENED BEAM 9 (SB9)
To prevent debonding of FRP, steel bolt system was introduced. The holes in the beam were
made while casting of the beam and after applying FRP sheet to the beam the steel bolts were
inserted into the hole and were tightened after placing the steel plate after the FRP. Anchoring
plate, because of high compressive stress got buckled as shown in Figure 3.34.

52
Figure 3.33 Strengthening and anchoring pattern of SB9
Figure 3.34 Failure pattern of SB9

53
3.6.12 BEAM-12
TB1
The strengthened beam showed crack at a load of 110 KN and failed by debonding failure in
which the FRP sheet was separated without concrete cover at 224 KN which is shown in Figure
3.37. The rupture of FRP sheet was sudden and accompanied by a loud noise indicating a rapid
release of energy and a total loss of load capacity. By strengthening the RC beam using GFRP
sheet, the cracking of the beam can be delayed and flexural capacity can be increased.
Figure 3.35 Magnified view of Debonding

54
Figure 3.36 Top FRP of Beam TB1 before Testing
Figure 3.37 FRP sheet separations without concrete
Debonding failure

55
3.6.13 BEAM-13
TB2
Full double layered U-wrap was applied and six layers of FRP above the central support. The
ultimate failure load was 298 KN.

56
Figure 3.38 Experimental set up and strengthening pattern of TB2
Figure 3.39 Failure of the beam by tensile rupture

57
3.6.14 BEAM-14
TB3
Above the U- Jacketed double Layered GFRP, more two layers of FRP but half of the width of
the first two layers, was applied at the flexural crack zone to prevent the flexural failure. In this
case, instead of tensile rupture, debonding failure occurred as shown in Figure 3.41 and the
failure load was 326 KN.
Figure 3.40 Strengthened beam TB3

58
Figure 3.41 Failure of beam TB3
Figure 3.42 Shear crack in the left span

59
Figure 3.43 Failure mode of TB3

57
CHAPTER 4
TEST RESULTS
AND
DISCUSSIONS

58
CHAPTER 4
TEST RESULTS AND DISCUSSIONS
The beams were loaded with a concentrated load at the middle of each span and the
obtained experimental results are presented and discussed subsequently in terms of the
observed mode of failure and load-deflection curve. The crack patterns and the mode of
failure of each beam are also described in this chapter. All the beams are tested for their
ultimate strengths and it is observed that the control beam had less load carrying capacity
than the strengthened beam. Two sets of beams i.e. S1 and S2 were examined and one beam
from each series was tested as un-strengthened control beam and rest beams were
strengthened with various patterns of FRP sheets. The different failure modes of the beams
were observed for both the series S1 and S2 as shown in Table 4.1 and Table 4.2.
4.1 EXPERIMENTAL RESULTS
4.1.1 FAILURE MODES
4.1.1.1 CONTROL BEAM
The control beam CB1 and CB2 failed completely in flexure. The failure started first at the
tension zone and then propagated towards the compression zone and finally failed in flexure.
4.1.1.2 STRENGTHENED BEAM
Generally, the rupture of FRP sheet was sudden and accompanied by a loud noise indicating a
rapid release of energy and a total loss of load capacity. For all the strengthened beams, the
failure modes for Series S1 and S2 are described in Table 4.1 and Table 4.2.

59
The following failure modes were examined for all the tested beams:
Flexural failure
Debonding failure (with or without concrete cover)
Tensile rupture
Rupture of the FRP laminate is assumed to occur if the strain in the FRP reaches its design
rupture strain before the concrete reaches its maximum usable strain. GFRP debonding can
occur if the force in the FRP cannot be sustained by the substrate. In order to prevent
debonding of the GFRP laminate, a limitation should be placed on the strain level developed
in the laminate.
Designation of
Beams
Failure Mode Pu (KN) beam) Pu(Control
beam) henedPu(strengt=λ
CB1 Flexural failure 260 1 SB1 Debonding failure without
concrete cover 320 1.23
SB2 Tensile rupture 325 1.25 SB3 Debonding failure without
concrete cover 334 1.28
SB4 Tensile rupture 370 1.42
SB5 Tensile rupture 380 1.46
SB6 Debonding failure without concrete cover
415 1.59
SB7 Debonding failure 332 1.27
SB8 Debonding failure without concrete cover
345 1.32
SB9 Debonding failure 421 1.61
Table 4.1 Experimental Results of the Tested Beams for Series S1

60
Designation of
Beams
Failure Mode Pu (KN) beam) Pu(Control
beam) henedPu(strengt=λ
CB2 Flexural failure 200 1
TB1 Debonding failure 224 1.12
TB2 Tensile rupture 298 1.49
TB3 Debonding of FRP 326 1.68
4.1.2 LOAD DEFLECTION AND LOAD CARRYING CAPACITY
The GFRP strengthened beams and the control beams are tested to find out their
ultimate load carrying capacity. The deflection of each beam under the load point i.e. at the
midpoint of each span position is analyzed. Mid-span deflections of each strengthened beam
are compared with the control beam. It is noted that the behavior of the flexure deficient
beams when bonded with GFRP sheets are better than the control beams. The mid-span
deflections of the beams are lower when bonded externally with GFRP sheets. The stiffness
of the strengthened beams was higher than that of the control beams. Increasing the numbers
of GFRP layers generally reduced the mid span deflection and increased the beam stiffness
for the same value of applied load. The use of GFRP sheet had effect in delaying the growth
of crack formation.
Table 4.2 Experimental Results of the Tested Beams for Series S2

61
The ultimate failure load for all the tested beams are summarized in Table 4.1 and
Table 4.2. The ultimate load enhancement ratio (λ), which is the ratio of the ultimate load of
the externally strengthened beam to the control beam, is presented in Table 4.1 and Table 4.2.
From the two tables it is found that, addition of GFRP layers increased the ultimate load
capacity and by introducing the anchoring system, the enhancement of load capacity can be
done.
4.1.2.1 STRENGTHENED BEAM OF S1 SERIES
Beam 1 was taken as the control beam (CB1) which is weak in flexure and no
strengthening was done to this beam. Two point static loading was applied on the beam and
at the each increment of the load, deflection at midpoint of each span were taken with the
help of dial gauges. Using this load and deflection data, load vs. deflection curve was plotted.
0
50
100
150
200
250
0 2 4 6 8
Load
(KN
)
Deflection(mm)
Deflection at mid point of left span
Deflection at mid point of right span
Figure 4.1 Load versus Deflection Curve for CB1
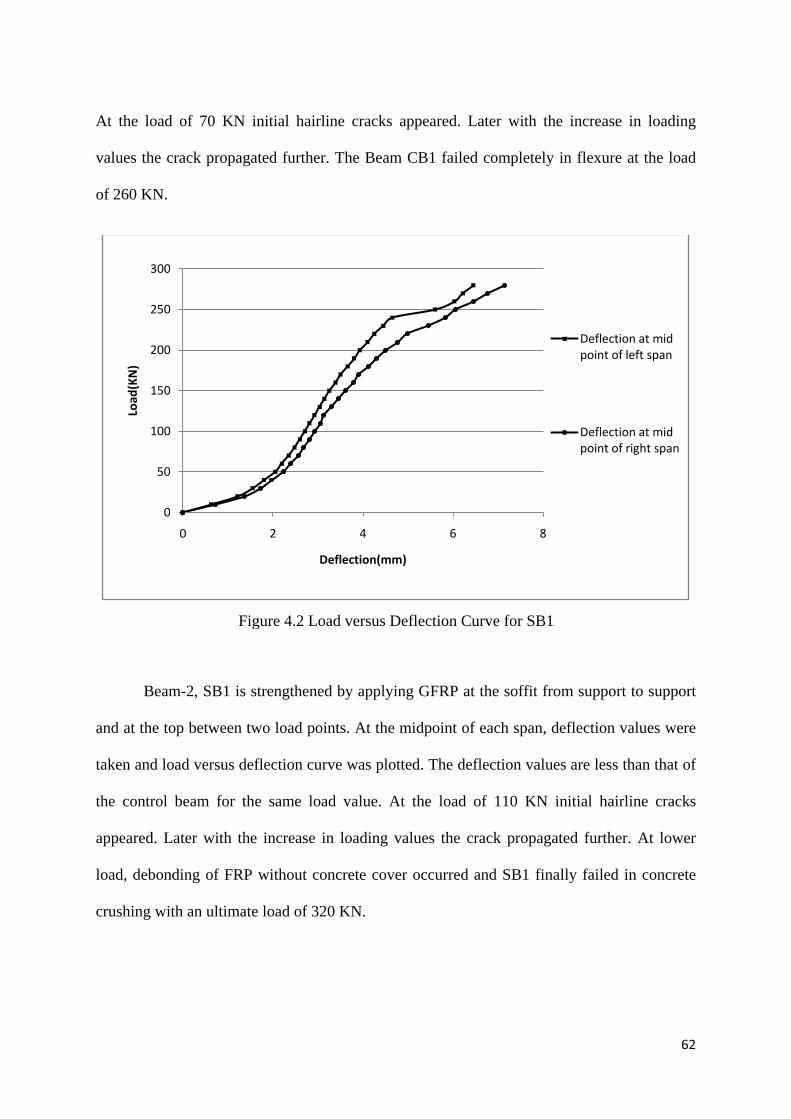
62
At the load of 70 KN initial hairline cracks appeared. Later with the increase in loading
values the crack propagated further. The Beam CB1 failed completely in flexure at the load
of 260 KN.
Beam-2, SB1 is strengthened by applying GFRP at the soffit from support to support
and at the top between two load points. At the midpoint of each span, deflection values were
taken and load versus deflection curve was plotted. The deflection values are less than that of
the control beam for the same load value. At the load of 110 KN initial hairline cracks
appeared. Later with the increase in loading values the crack propagated further. At lower
load, debonding of FRP without concrete cover occurred and SB1 finally failed in concrete
crushing with an ultimate load of 320 KN.
0
50
100
150
200
250
300
0 2 4 6 8
Load
(KN
)
Deflection(mm)
Deflection at mid point of left span
Deflection at mid point of right span
Figure 4.2 Load versus Deflection Curve for SB1

63
Beam-3, SB2 is strengthened with U-wrap from support to support distance and at the
top of the beam between the two load points. The deflection values are less than that of the
control beam for the same load value. No initial hairline cracks were visible due to the
covering of GFRP. Later with the increase in loading values the crack propagated further
under the GFRP. Tensile rupture took place at lower load and as the load increased,
debonding of the FRP occurred with concrete cover and finally the beam failed in shear and
the failure load was 325 KN.
0
50
100
150
200
250
300
0 1 2 3 4 5 6
Load
(KN
)
Deflection (mm)
Deflection at mid point of left span
Deflection at mid point of right span
Figure 4.3 Load versus Deflection Curve for SB2
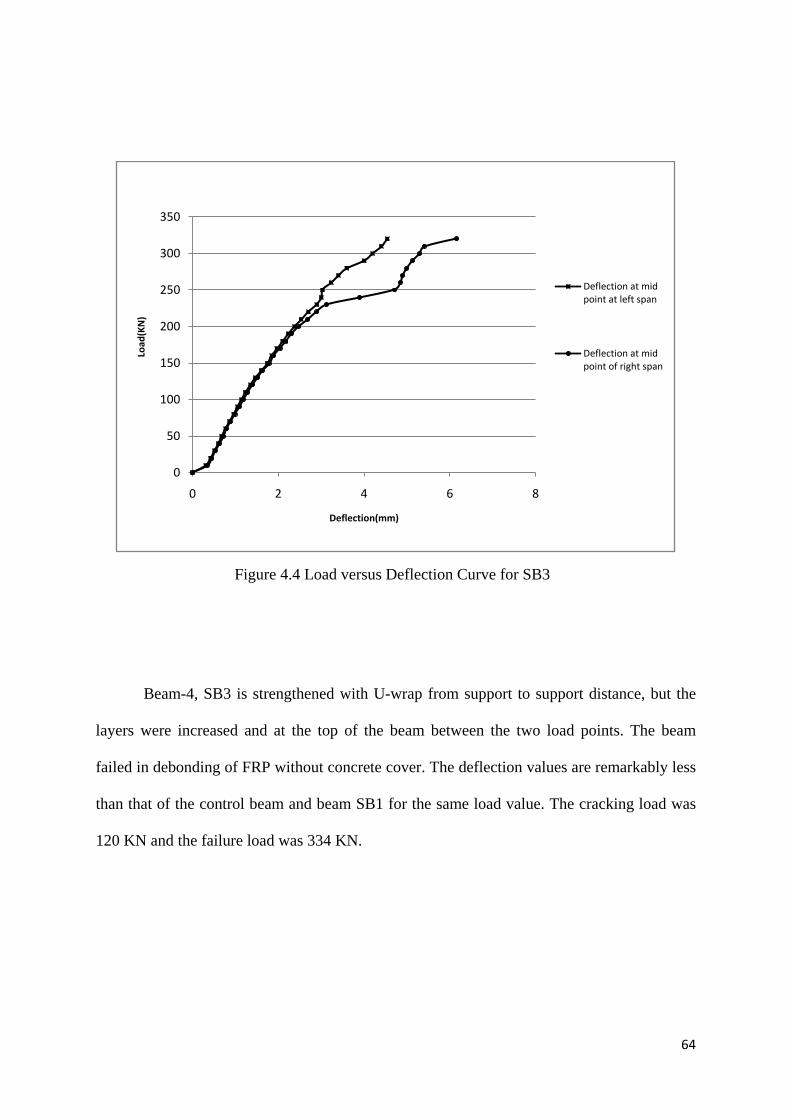
64
Beam-4, SB3 is strengthened with U-wrap from support to support distance, but the
layers were increased and at the top of the beam between the two load points. The beam
failed in debonding of FRP without concrete cover. The deflection values are remarkably less
than that of the control beam and beam SB1 for the same load value. The cracking load was
120 KN and the failure load was 334 KN.
0
50
100
150
200
250
300
350
0 2 4 6 8
Load
(KN
)
Deflection(mm)
Deflection at mid point at left span
Deflection at mid point of right span
Figure 4.4 Load versus Deflection Curve for SB3

65
Beam-5, SB4 is strengthened providing FRP at the soffit of the beam from support to
support distance and U-wrap above it, and at the top of the beam between the two load points
and U-strip above it. Tensile rupture of FRP without concrete cover occurred and later with
the increase in loading values the crack propagated further under the GFRP and beam failed
in flexure. The failure load of SB4 was 370 KN. The deflection values are again remarkably
less than that of the control beam for the same load value.
0
50
100
150
200
250
300
350
0 1 2 3 4 5
Load
(KN
)
Deflection (mm)
Deflection at mid point of left span
Deflection at mid point of right span
Figure 4.5 Load versus Deflection Curve for SB4

66
Beam-6, SB5 is strengthened providing FRP at the soffit of the beam from support to
support distance and U-wrap above it, and at the top of the beam between the two load points
and U-strip above it. Here the numbers of FRP layers of U-wrap and U-strip were increased.
Tensile rupture of FRP without concrete cover occurred at lower load value and later with the
increase in loading values the crack propagated further under the GFRP and beam failed in
flexure. The deflection values are less than that of the control beam for the same load value.
The failure load of SB5 was 380 KN. The ultimate load of this beam was higher than the
beam SB4, which was having same pattern of FRP wrapping.
0
50
100
150
200
250
300
350
0 1 2 3 4 5 6
Load
(KN
)
Deflection (mm)
Deflection at mid point of left span
Deflection at mid point of right span
Figure 4.6 Load versus Deflection Curve for SB5

67
Beam-7, SB6 is strengthened providing U-wrap FRP from support to support distance
and U-wrap FRP of half of the width above it, and at the top of the beam between the two
load points. Debonding of FRP without concrete cover occurred first and later with the
increase in loading values the crack propagated further under the GFRP and beam failed in
flexure. The deflection values are quite less than that of the control beam for the same load
value. The failure load of SB6 was 415 KN.
0
50
100
150
200
250
300
350
400
0 1 2 3 4
Load
(KN
)
Deflection (mm)
Deflection at mid point of left span
Deflection at mid point of right span
Figure 4.7 Load versus Deflection Curve for SB6

68
Beam-8, SB7 is strengthened providing U-wrap FRP from support to support distance
up to Neutral axis and U-wrap FRP at the top of the beam between the two load points up to
Neutral axis. Debonding of FRP without concrete cover occurred, with the increase in
loading values the shear crack developed and propagated and beam failed in shear. The
deflection values are quite less than that of the control beam for the same load value. The
failure load of SB7 was 332 KN.
0
50
100
150
200
250
300
0 1 2 3 4 5
Load
(KN
)
Deflection (mm)
Deflection at mid point of left span
Deflection at mid point of right span
Figure 4.8 Load versus Deflection Curve for SB7

69
Beam-9, SB8 is strengthened providing U-wrap FRP from support to support distance
up to Neutral axis and U-wrap FRP at the top of the beam between the two load points up to
Neutral axis. Here the layers of the U-wrap were increased. Beam failed in debonding of FRP
without concrete cover. Here also, the deflection values are quite less than that of the control
beam for the same load value. The failure load of SB8 was 345 KN.
0
50
100
150
200
250
300
350
0 1 2 3 4 5 6
Load
(KN
)
Deflection (mm)
Deflection at mid point of left span
Deflection at mid point of right span
Figure 4.9 Load versus Deflection Curve for SB8

70
Beam-10, SB9 is strengthened as beam SB6, i.e. U-wrap FRP from support to support
distance and U-wrap FRP of half of the width above it, and at the top of the beam between
the two load points. Here, to prevent debonding failure anchoring system was introduced. It
took more load than the corresponding beam SB6 and up to some load values it prevented the
debonding failure. It prevented the debonding failure up to some extent and finally failed in
flexure. The deflection values are quite less than that of the control beam for the same load
value. The failure load of SB9 was 421 KN.
0
50
100
150
200
250
0 0.5 1 1.5 2 2.5
Load
(KN
)
Deflection (mm)
Deflection at mid point of left span
Deflection at mid point of right span
Figure 4.10 Load versus Deflection Curve for SB9

71
0
100
200
0 5 10
Load
(KN
)
Deflection (mm)
Load vs. Deflection Curve for CB1 and SB1
CB1
SB1
0
100
200
0 5 10
Load
(KN
)
Deflection (mm)
Load vs. Deflection Curve for CB1 and SB2
CB1
SB2
0
100
200
0 5 10
Load
(KN
)
Deflection (mm)
Load vs. Deflection Curve for CB1 and SB3
CB1
SB3
0
100
200
0 5 10
Load
(KN
)
Deflection (mm)
Load vs. Deflection Curve for CB1 and SB4
CB1
SB4
0
100
200
0 5 10
Load
(KN
)
Deflection (mm)
Load vs. Deflection Curve for CB1 and SB5
CB1
SB5
0
100
200
0 5 10
Load
(KN
)
Deflection (mm)
Load vs. Deflection Curve for CB1 and SB6
CB1
SB6

72
In Figure 4.11, the midpoint deflection values of all the strengthened beams were
compared with the control beam CB1 separately and it was found that, by strengthening the
beams with GFRP, the stiffness increased and the deflection value reduced up to some extent.
0
100
200
0 5 10
Load
(KN
)
Deflection (mm)
Load vs. Deflection Curve for CB1 and SB7
CB1
SB7
0
100
200
0 5 10
Load
(KN
)
Deflection (mm)
Load vs. Deflection Curve for CB1 and SB8
CB1
SB8
0
100
200
0 5 10
Load
(KN
)
Deflection (mm)
Load vs. Deflection Curve for CB1 and SB9
CB1
SB9
Figure 4.11 Load versus Deflection Curve for Set S1 strengthened beams with CB1

73
In SB2 one layer and in SB3 two layers of U-wrap were provided to strengthen the
beams. The midpoint deflections were compared with the control beam and shown in Figure
4.12 from where it can be concluded that the deflection value is decreasing by strengthening
the beams and by increasing the layers of GFRP, the stiffness of beam increases slightly.
0
50
100
150
200
250
0 1 2 3 4 5 6 7
Load
(KN
)
Deflection (mm)
Load vs. Deflection curve for CB1,SB2,SB3
CB1
SB2
SB3
0
50
100
150
200
250
0 1 2 3 4 5 6 7
Load
(KN
)
Deflection (mm)
Load vs. Deflection curve for CB1,SB4,SB5
CB1
SB4
SB5
Figure 4.12 Load versus Deflection Curve for CB1, SB2, SB3
Figure 4.13 Load versus Deflection Curve for CB1, SB4, SB5
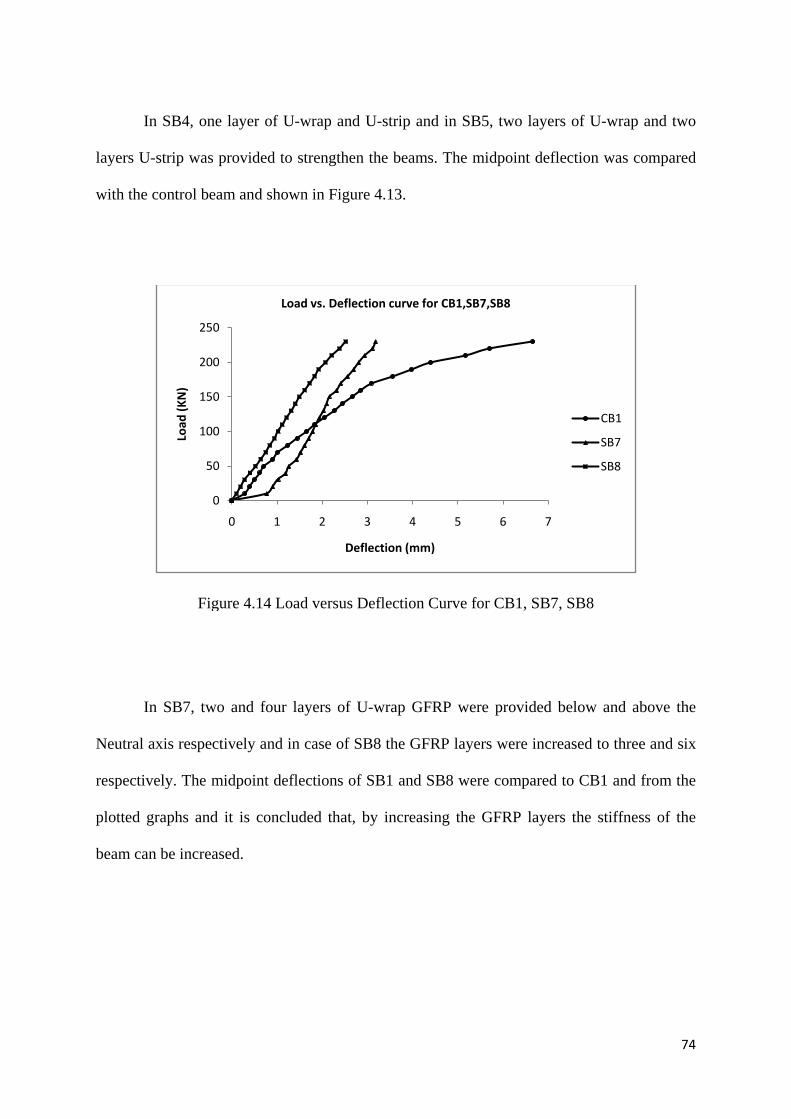
74
In SB4, one layer of U-wrap and U-strip and in SB5, two layers of U-wrap and two
layers U-strip was provided to strengthen the beams. The midpoint deflection was compared
with the control beam and shown in Figure 4.13.
In SB7, two and four layers of U-wrap GFRP were provided below and above the
Neutral axis respectively and in case of SB8 the GFRP layers were increased to three and six
respectively. The midpoint deflections of SB1 and SB8 were compared to CB1 and from the
plotted graphs and it is concluded that, by increasing the GFRP layers the stiffness of the
beam can be increased.
0
50
100
150
200
250
0 1 2 3 4 5 6 7
Load
(KN
)
Deflection (mm)
Load vs. Deflection curve for CB1,SB7,SB8
CB1
SB7
SB8
Figure 4.14 Load versus Deflection Curve for CB1, SB7, SB8
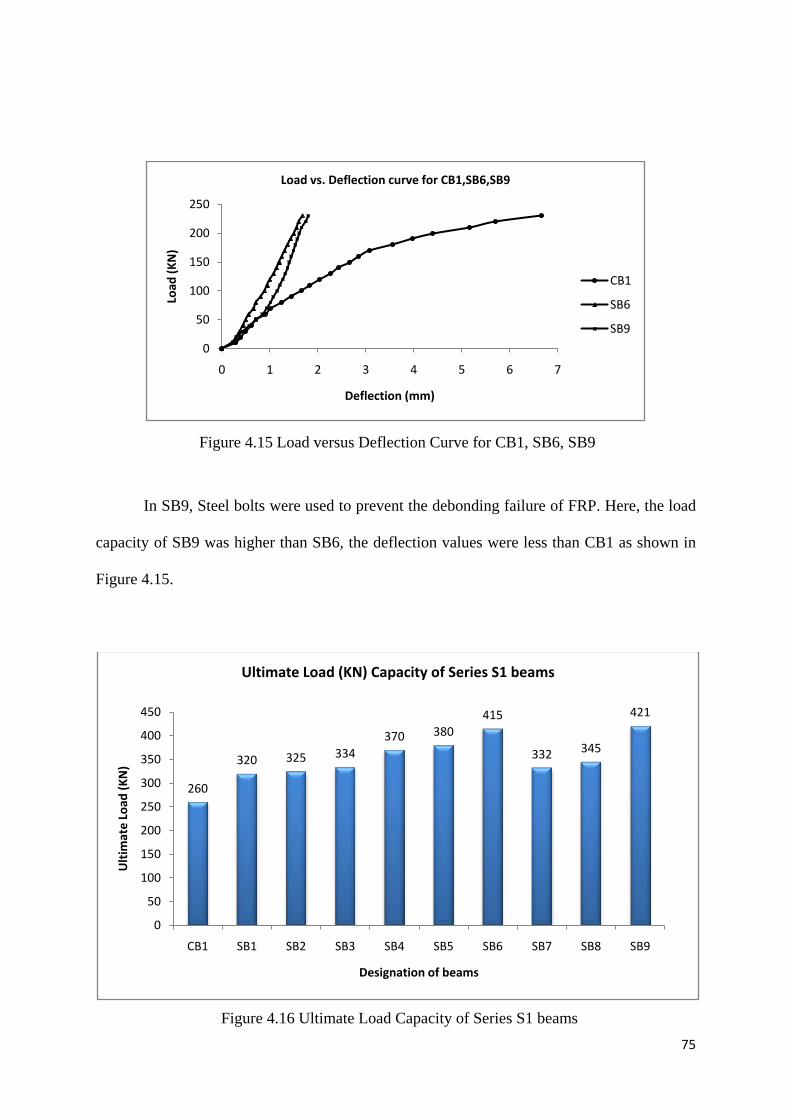
75
In SB9, Steel bolts were used to prevent the debonding failure of FRP. Here, the load
capacity of SB9 was higher than SB6, the deflection values were less than CB1 as shown in
Figure 4.15.
0
50
100
150
200
250
0 1 2 3 4 5 6 7
Load
(KN
)
Deflection (mm)
Load vs. Deflection curve for CB1,SB6,SB9
CB1
SB6
SB9
260
320 325 334370 380
415
332 345
421
0
50
100
150
200
250
300
350
400
450
CB1 SB1 SB2 SB3 SB4 SB5 SB6 SB7 SB8 SB9
Ulti
mat
e Lo
ad (K
N)
Designation of beams
Ultimate Load (KN) Capacity of Series S1 beams
Figure 4.15 Load versus Deflection Curve for CB1, SB6, SB9
Figure 4.16 Ultimate Load Capacity of Series S1 beams

76
From Figure 4.16, it is concluded that the load capacity of SB9 beam is highest and SB6
beam has second highest load capacity among all the strengthened beams of Series S1. The
percentage increase of load capacity of all the beams are calculated and are drawn in Figure
4.17 from which it can be concluded that, by application of GFRP to the beams the load
capacity can be enhanced. Strengthened beam SB6 and SB9 gives the maximum percentage
increase of load capacity.
23.07 2528.46
42.346.15
59.61
27.6932.69
61.92
0
10
20
30
40
50
60
70
SB1 SB2 SB3 SB4 SB5 SB6 SB7 SB8 SB9
% in
crea
se o
f Ulti
mat
e Lo
ad C
apac
ity
Designation of beams
Percentage increase in the Ultimate Load Carrying capacity w.r.t CB1
Figure 4.17 Percentage increase in the Ultimate Load Carrying capacity of strengthened beams of S1 w.r.t CB1

77
4.1.2.2 STRENGTHENED BEAM OF S2 SERIES
Beam 11, Control Beam for set S2, CB2, to which no external strengthening was
provided, two point static loading was applied and at the each increment of the load,
deflections at midpoint of each span were taken with the help of dial gauges. Using this load
and deflection data, load vs. deflection curve was plotted. At the load of 110 KN initial
hairline cracks appeared and the beam failed in flexure with an ultimate load value of 200
KN.
0
20
40
60
80
100
120
140
160
180
0 1 2 3 4 5
Load
(KN
)
Deflection (mm)
At mid point of left span
At mid point of right span
Figure 4.18 Load versus Deflection Curve for CB2

78
Beam-12, TB1 is strengthened at the soffit from support to support and at the top
between two load points. At the midpoint of each span, deflection values were taken and load
versus deflection curve was plotted. The deflection values are less than that of the control
beam for the same load value. At lower load value, debonding of FRP without concrete cover
occurred and TB1 finally failed in concrete crushing. At the load of 120 KN initial hairline
cracks appeared. Later with the increase in loading values the cracks propagated further and
the beam failed with an ultimate load of 224 KN.
020406080
100120140160180200
0 2 4 6 8
Load
(KN
)
Deflection(mm)
At mid point of left span
At mid point of right span
Figure 4.19 Load versus Deflection Curve for TB1
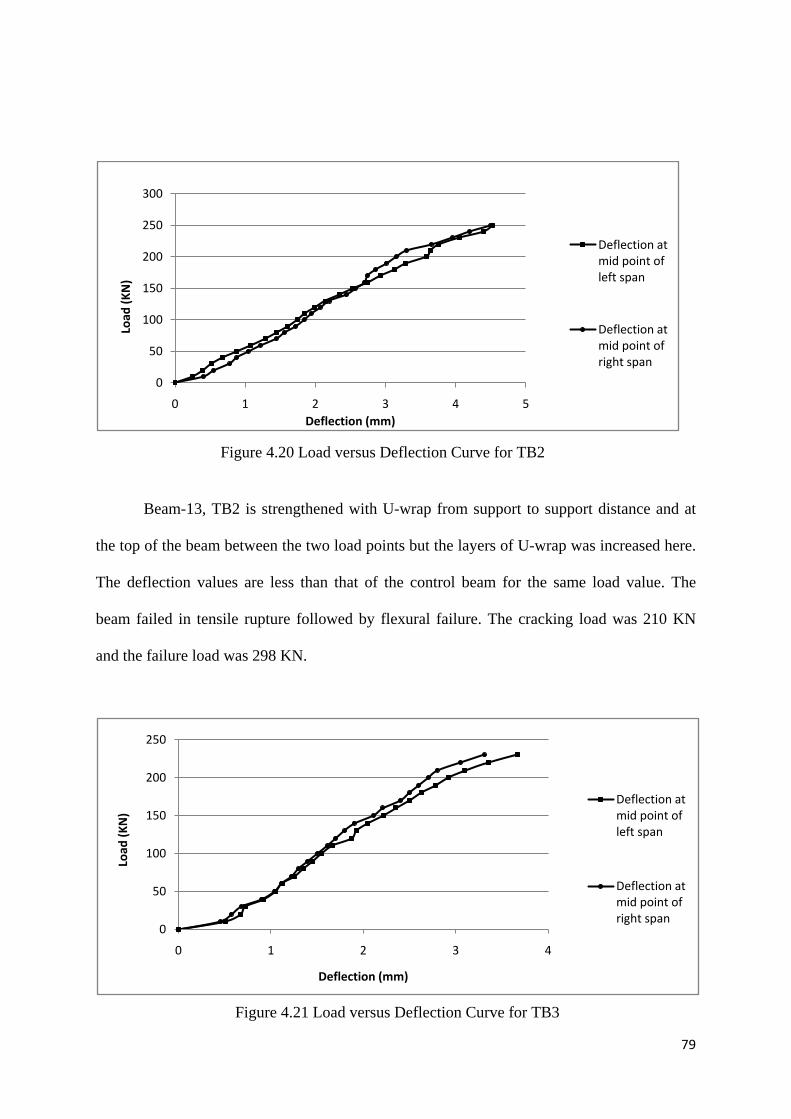
79
Beam-13, TB2 is strengthened with U-wrap from support to support distance and at
the top of the beam between the two load points but the layers of U-wrap was increased here.
The deflection values are less than that of the control beam for the same load value. The
beam failed in tensile rupture followed by flexural failure. The cracking load was 210 KN
and the failure load was 298 KN.
0
50
100
150
200
250
300
0 1 2 3 4 5
Load
(KN
)
Deflection (mm)
Deflection at mid point of left span
Deflection at mid point of right span
0
50
100
150
200
250
0 1 2 3 4
Load
(KN
)
Deflection (mm)
Deflection at mid point of left span
Deflection at mid point of right span
Figure 4.20 Load versus Deflection Curve for TB2
Figure 4.21 Load versus Deflection Curve for TB3

80
Beam-14, TB3 failed in debonding of FRP without concrete cover followed by shear
crack. The deflection values are remarkably less than that of the control beam, CB2 and
strengthened beam TB1 for the same load value. The failure load was 326 KN.
0
20
40
60
80
100
120
140
160
180
0 1 2 3 4 5
Load
(KN
)
Deflection (mm)
CB2
TB1
TB2
TB3
Figure 4.22 Load vs. Deflection Curve for all the Beams of S2

81
200224
298326
0
50
100
150
200
250
300
350
CB2 TB1 TB2 TB3
Load
(KN
)
Designation of beams
Ultimate Load (KN) Capacity of Series S2 beams
12
49
63
0
10
20
30
40
50
60
70
TB1 TB2 TB3
% in
crea
se o
f Ulti
mat
e Lo
ad C
apac
ity
Designation of beams
Percentage increase in the Ultimate Load Carrying capacity w.r.t CB2
Figure 4.23 Ultimate Load (KN) Capacity of Series S2 beams
Figure 4.24 Percentage increase in the Ultimate Load Carrying capacity of strengthened beams of S2 w.r.t CB2

82
The load capacity and the percentage increase of all the strengthened beams of series
S2 are discussed here and from Figure 4.23 and Figure 4.24, it is found that beam TB3 has
the maximum load capacity and maximum percentage increase of load carrying capacity
respectively.

82
CHAPTER 5
FINITE
ELEMENT
ANALYSIS

83
CHAPTER 5
FINITE ELEMENT ANALYSIS
Finite element method (FEM) is a numerical method for solving a differential or
integral equation. It has been applied to a number of physical problems, where the governing
differential equations are available. The method essentially consists of assuming the
piecewise continuous function for the solution and obtaining the parameters of the functions
in a manner that reduces the error in the solution.
5.1 FORMULATION
The governing equation for beam is given in Equation 5.1.
EIxyM 2
2
dd = (5.1)
The displacement field v(x) assumed for the beam element should be such that it takes on the
values of deflection and the slope at either end as given by the nodal values vi, ᶿi, vj, ᶿj.
The v(x) can be given by,
v(x) = c0 + c1x + c2 x2 +c3x3 (5.2)
In solving the differential equations through integration, there will be constants of integration
that must be evaluated by using the boundary and continuity conditions. The variables whose
values are to be determined are approximated by piecewise continuous polynomials. The
coefficients of these polynomials are obtained by minimizing the total potential energy of the
system. In FEM, usually, these coefficients are expressed in terms of unknown values of
primary variables. Thus, if an element has got n nodes, the displacement field u can be
approximated as,

84
∑=
=n
iii uNu
1 (5.3)
where ui are the nodal displacements in x-direction and Ni are the shape functions, which
are functions of coordinates.
Shape functions or interpolation functions Ni are used in the finite element analysis to
interpolate the nodal displacements of any element to any point within each element.
The beam element has modulus of elasticity E, moment of inertia I, and length L.
Each beam element has two nodes and is assumed to be horizontal as shown in Figure 5.1.
The element stiffness matrix is given by the following matrix, assuming axial deformation is
neglected.
−−−−
−−
=
22
22
3
4626612612
2646612612
LLLLLL
LLLLLL
LEIK (5.4)
It is clear that the beam element has four degrees of freedom: two at each node (a transverse
displacement and a rotation). The sign convention used is that the displacement is positive if
it points upwards and the rotation is positive if it is counter clockwise. Consequently for a
structure with n nodes, the global stiffness matrix K will be of size 2 n × 2 n (since we have
two degrees of freedom at each node). Once the global stiffness matrix K is obtained we have
the following structure equation
[ ]{ } { }FUK = (5.5)
where U is the global nodal displacement vector and F is the global nodal force vector.
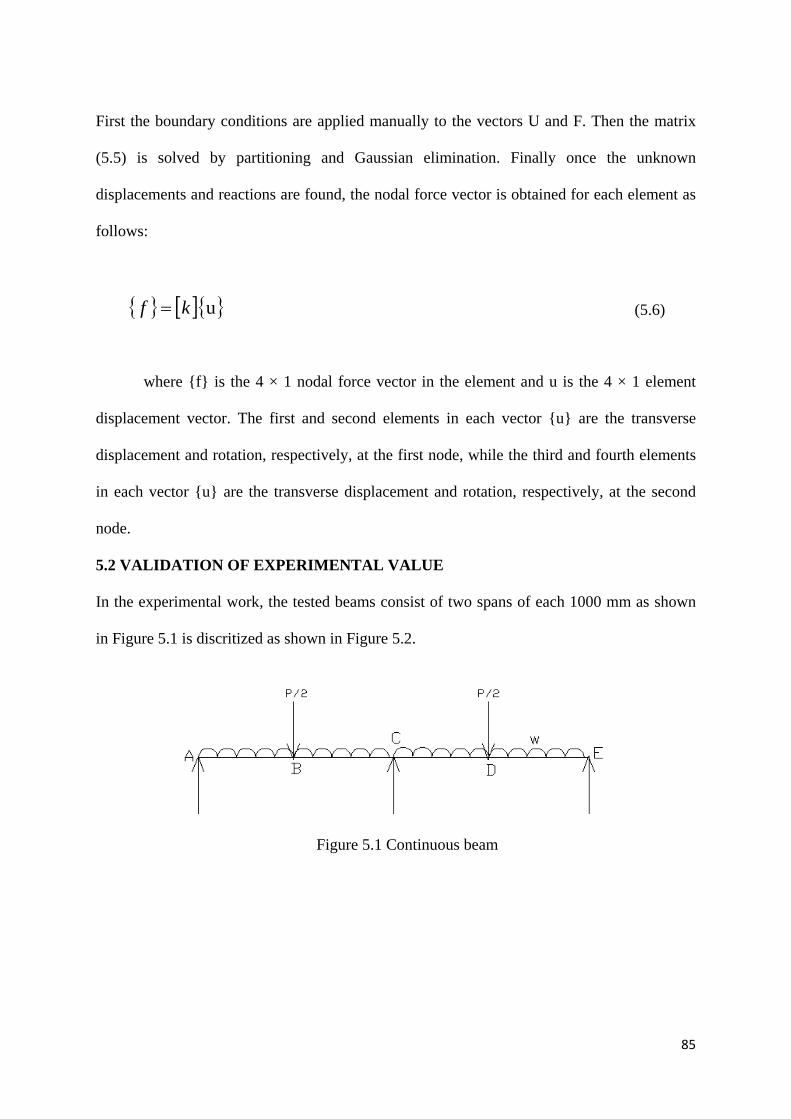
85
First the boundary conditions are applied manually to the vectors U and F. Then the matrix
(5.5) is solved by partitioning and Gaussian elimination. Finally once the unknown
displacements and reactions are found, the nodal force vector is obtained for each element as
follows:
{ } [ ]{ }u kf = (5.6)
where {f} is the 4 × 1 nodal force vector in the element and u is the 4 × 1 element
displacement vector. The first and second elements in each vector {u} are the transverse
displacement and rotation, respectively, at the first node, while the third and fourth elements
in each vector {u} are the transverse displacement and rotation, respectively, at the second
node.
5.2 VALIDATION OF EXPERIMENTAL VALUE
In the experimental work, the tested beams consist of two spans of each 1000 mm as shown
in Figure 5.1 is discritized as shown in Figure 5.2.
Figure 5.1 Continuous beam
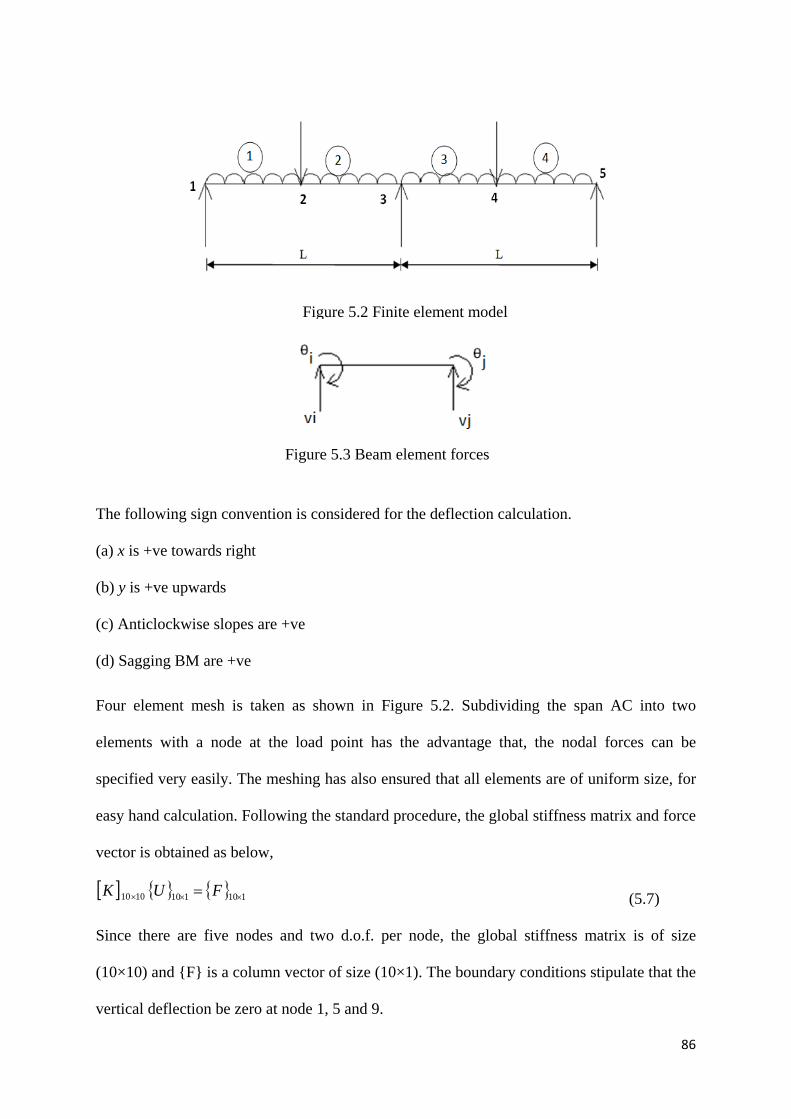
86
The following sign convention is considered for the deflection calculation.
(a) x is +ve towards right
(b) y is +ve upwards
(c) Anticlockwise slopes are +ve
(d) Sagging BM are +ve
Four element mesh is taken as shown in Figure 5.2. Subdividing the span AC into two
elements with a node at the load point has the advantage that, the nodal forces can be
specified very easily. The meshing has also ensured that all elements are of uniform size, for
easy hand calculation. Following the standard procedure, the global stiffness matrix and force
vector is obtained as below,
[ ] { } { } 11011010 10 ××× = FUK (5.7)
Since there are five nodes and two d.o.f. per node, the global stiffness matrix is of size
(10×10) and {F} is a column vector of size (10×1). The boundary conditions stipulate that the
vertical deflection be zero at node 1, 5 and 9.
Figure 5.3 Beam element forces
Figure 5.2 Finite element model

87
Boundary conditions are the known values of deflection and slope at specified values of x.
Here the following boundary conditions are used for the exact analysis of the continuous
beam.
At x = 0; y=0
At x= L; y= 0
At x= 2L; y=0
Thus reduced set of equations involving unknown nodal d.o.f. is obtained in matrix form as,
{ } [ ] { } 177717 u ××× = kf (5.8)
Solving the Equation 5.8, the nodal displacement is found out.
The experimental and numerical load-deflection curves obtained for the control beam, CB1
are illustrated in Figure 5.4.
0
30
60
90
0 0.5 1 1.5
Load
(KN
)
Deflection (mm)
Comparison of Experimental value with FEM analysis
Experiment
Numerical
Exact
Figure 5.4 Comparison of Experimental value with Numerical and Exact analysis for CB1

88
The numerical and experimental results for the beam are shown in Figure 5.4. The trend of
the loads varying with the deflection presents that the linear elastic state exits in the structure,
when the loads are equivalent to about 90 KN.

88
CHAPTER 6
CONCLUSIONS

89
CHAPTER 6
CONCLUSIONS
6.1 CONCLUSIONS
The present experimental study is carried out on the flexural behavior of reinforced
concrete rectangular beams strengthened by GFRP sheets. Fourteen reinforced concrete (RC)
beams weak in flexure having different set of reinforcement detailing are casted and tested.
The beams were grouped into two series labeled S1 and S2. Each series had different
longitudinal and transverse steel reinforcement ratios. From the test results and calculated
strength values, the following conclusions are drawn:
1. The ultimate load carrying capacity of all the strengthen beams is higher when
compared to the control beam.
2. The initial cracks in the strengthened beams are formed at higher load compared to
control beam.
3. From series S1, beam SB9 which was strengthened by U-wrap and was anchored by
using steel plate and bolt system, showed the highest ultimate load value of 415 KN.
The percentage increase of the load capacity of SB9 was 61.92 %.
4. The load carrying capacity of beam SB6, which was strengthened by two layers of U-
wrap of length 88 cm in positive moment zone and two layers of U-wrap of length 44
cm over first two layers, was 415 KN which was nearer to the load capacity of beam
SB9. The percentage increase of load carrying capacity was 59.61 % , from which it
can be concluded that applying FRP in the flexure zone is quite effective method to
enhance the load carrying capacity.

90
5. TB3 beam from Series S2, which was strengthened by two layers of U-wrap in
positive moment zone and two layers of U-wrap in flexure zone above first two
layers, was having maximum ultimate load value of 326 KN, than the other
strengthened beams of same category. The percentage increase of this beam was 63 %
which was highest among all strengthened beams.
6. Using of steel bolt and plate system is an effective method of anchoring the FRP sheet
to prevent the debonding failure.
7. Strengthening of continuous beam by providing U-wrap of FRP sheet is a new and
effective way of enhancing the capacity of load carrying.
8. Flexural failure at the intermediate support section can be prevented by application of
GFRP sheets.
9. In lower range of load values the deflection obtained using Finite Element models are
in good agreement with the experimental results. For higher load values there is a
deviation with the experimental results because linear FEM has been adopted.
6.2 SCOPE OF THE FUTURE WORK
It promises a great scope for future studies. Following areas are considered for future
research:
a. Experimental study of continuous beams with opening
b. Non linear analysis of RC continuous beam
c. FEM modeling of unanchored U-wrap
d. FEM modeling of anchored U-wrap

91
REFERENCES
[ 1 ] ACI Committee 440, “Starte-of-the-art report on fiber reinforced plastic reinforcement for
concrete structures”, Report ACI 440R-96, USA: American Concrete Institute, 1996.
[ 2 ] Aiello MA, Valente L, and Rizzo A, “Moment redistribution in continuous reinforced
concrete beams strengthened with carbon fiber-reinforced polymer laminates”, Mechanics
of Composite Materials, vol. 43, pp. 453-466, 2007.
[ 3 ] Aiello MA, and Ombres L, “Cracking and deformability analysis of reinforced concrete
beams strengthened with externally bonded carbon fiber reinforced polymer sheet”, ASCE
Journal of Materials in Civil Engineering, vol. 16, No. 5, pp.292-399,2004.
[ 4 ] Akbarzadeh H, and Maghsoudi AA, “Experimental and analytical investigation of
reinforced high strength concrete continuous beams strengthened with fiber reinforced
polymer”, Materials and Design, vol. 31, pp. 1130-1147, 2010.
[ 5 ] Arduini M, and Nanni A, “Behaviour of pre-cracked R. C. beams strengthened with
carbon FRP sheets”, ASCE Journal of Composites for Construction, vol. 1, No. 2, pp. 63-
70, 1997.
[ 6 ] Ashour AF, El-Refaie SA, and Garrity SW, “Flexural strengthening of RC continuous
beams using CFRP laminates”, Cement and Concrete Composites, vol. 26, pp. 765-775,
2003.
[ 7 ] Bank LC, and Arora D, “Analysis of RC beams strengthened with mechanically fastened
FRP (MF-FRP) strips”, Composite Structures, vol. 79, pp. 180–191, 2006.
[ 8 ] Bousselham A and Chaallal O, “Behavior of reinforced concrete T-beams strengthened in
shear with carbon fiber reinforced polymer - an experimental study”, ACI Structural
92
Journal, vol. 103, pp. 339–347, 2006.
[ 9 ] Brosens K, and Gemert D, “Anchoring stresses between concrete and carbon fiber
reinforced laminates”, Non-metallic (FRP) Reinforcement for Concrete Structures, Proc.
of 3rd International Symposium, Sapporo, Japan, pp. 271–278, 1997.
[ 10 ] Ceroni F, “Experimental performances of RC beams strengthened with FRP materials”,
Construction and Building Materials, vol. 24, pp. 1547-1559, 2010.
[ 11 ] Chahrour A, and Soudki K, “Flexural response of reinforced concrete beams strengthened
with end-anchored partially bonded carbon fiber-reinforced polymer strips”, Journal of
Composites for Construction ASCE, vol. 9(2), pp. 170–177, 2005.
[ 12 ] Concrete Society, “Design guidance for strengthening concrete structures using fibre
composite materials”, Report No. 55, 71p, 2000.
[ 13 ] El-Refaie SA, Ashour AF, and Garrity SW, “CFRP strengthened continuous concrete
beams”, Proceedings of the ICE - Structures and Buildings, pp. 395 - 404, 2003.
[ 14 ] El-Refaie SA, Ashour AF, and Garrity SW, “Sagging and hogging strengthening of
continuous reinforced concrete beams using carbon fibre-reinforced polymer sheets”, ACI
Structural Journal, vol. 100, pp. 446-453, 2003.
[ 15 ] El-Refaie SA, Ashour AF, and Garrity SW, “Sagging strengthening of continuous
reinforced concrete beams using carbon fibre sheets”, The 11th BCA Annual Conference
on Higher Education and the Concrete Industry, Manchester, UK, pp. 281–292, 3–4 July
2001.
[ 16 ] El-Refaie SA, Ashour AF, and Garrity SW, “Strengthening of reinforced concrete
continuous beams with CFRP composites”, The International Conference on Structural
Engineering, Mechanics and Computation, Cape Town, South Africa, 2–4. , pp.1591–

93
1598, April 2001.
[ 17 ] El-Refaie SA, Ashour AF, and Garrity SW, “Tests of reinforced concrete continuous
beams strengthened with carbon fibre sheets”, The 10th BCA Annual Conference on
Higher Education and the Concrete Industry, Birmingham, UK, pp. 187–198, Jun 2000.
[ 18 ] Eshwar N, Nanni A, and Ibell TJ, “Performance of two anchor systems of externally
bonded fiber-reinforced polymer laminates”, ACI Materials Journal, vol. 105(1), pp. 72–
80, 2008.
[ 19 ] Galati D, and De Lorenzis L, “Effect of construction details on the bond performance of
NSM FRP bars in concrete”, Advances in Structural Engineering, vol. 12(5), pp. 683–
700, 2009.
[ 20 ] Garden HN, and Hollaway LC, “An experimental study of the influence of plate end
anchorage of carbon fibre composite plates used to strengthen reinforced concrete
beams”, Composite Structures, vol. 42, pp. 175–188, 1998.
[ 21 ] Garden HN, and Hollaway LC, “An experimental study of the influence of plate end
anchorage of carbon fibre composite plates used to strengthen reinforced concrete
beams”, Composite Structures, vol. 42, pp. 175–188, 1998.
[ 22 ] Grace NF, “Strengthening of negative moment region of reinforced concrete beams using
carbon fiber- reinforced polymer strips”, ACI Structural Journal, vol. 98, No. 3, pp. 347-
358, 2001.
[ 23 ] Grace NF, Sayed GA, and Saleh KR, “Strengthening of continuous beams using fibre
reinforced polymer laminates”, American Concrete Institute, Farmington Hills, Mich, pp.
647-657, 1999.
[ 24 ] Grace NF, Wael R, and Sayed AA, “Innovative triaxailly braided ductile FRP fabric for

94
strengthening structures”, 7th International Symposium on Fiber Reinforce Polymer for
Reinforced Concrete Structures, ACI, Kansas City, MO, 2005.
[ 25 ] Grace NF, Abdel-Sayed G, Soliman AK, and Saleh KR, Strengthening of reinforced
concrete beams using fibre reinforced polymer (FRP) laminates”, ACI Structural Journal,
vol. 96, No. 5, pp. 865-874, 1999.
[ 26 ] Grace NF, Soliman AK, Abdel-Sayed G, and Saleh KR, “Strengthening of continuous
beams using fibre reinforced polymer laminates”, Proceedings of 4th International
Symposium on Fibre Reinforced Polymer Reinforcements for Reinforced Concrete
Structures, SP-188, American Concrete Institute, Farmington Hills, Michigan, USA,
pp.647-657, 1999.
[ 27 ] Jumaat MZ, and Alam MA, “Experimental and numerical analysis of end anchored steel
plate and CFRP laminate flexurally strengthened R. C. beams”, International Journal of
Physical Sciences, vol. 5, pp. 132-144, 2010.
[ 28 ] Jumaat MZ, Rahman MM, and Rahman MA, “Review on bonding techniques of CFRP in
strengthening concrete structures”, International Journal of the Physical Sciences, vol.
6(15), pp. 3567-3575, 4 August. 2011.
[ 29 ] Kadhim, “Effect of CFRP Sheet Length on the Behavior of HSC Continuous Beam”,
Journal of Thermoplastic composite materials, Vol. 00, 2011.
[ 30 ] Khalifa A, and Nanni A, “Improving shear capacity of existing RC T-section beams using
CFRP composites”, Cement and Concrete Composites, vol. 22, pp. 165–174, 2000.
[ 31 ] Khalifa A, Tumialan G, Nanni A, and Belarbi A, “Shear Strengthening of Continuous
Reinforced Beams Using Externally Bonded Carbon Fiber Reinforced Polymer Sheets”,
In: Fourth International Symposium on Fiber Reinforced Polymer Reinforcement for

95
Reinforced Concrete Structures, Baltimore, MD, American Concrete Institute, pp. 995–
1008, November 1999.
[ 32 ] Lamanna AJ, Bank LC, and Scott DW, “Flexural strengthening of reinforced concrete
beams using fasteners and fiber-reinforced polymer strips”, ACI Structural Journal, vol.
98(3), pp. 368–76, 2001.
[ 33 ] Lee TK, and Al-Mahaidi R, “An experimental investigation on shear behaviour of RC T-
beams strengthened with CFRP using photogrammetry”, Composite Structures, vol. 82,
pp. 185–193, 2008.
[ 34 ] Leung CKY, and Cao Q, “Development of strain hardening permanent formwork for
durable concrete structures”, Materials and Structures, vol. 43(7), pp. 993–1007, 2009.
[ 35 ] Leung CKY, “Delamination failure in concrete beams retrofitted with a bonded plate”,
Journal of Materials in Civil Engineering, vol. 13, pp. 106–113, 2001.
[ 36 ] Leung CKY, “FRP debonding from a concrete substrate: Some recent findings against
conventional belief”, Cement and Concrete Composites, vol. 28, pp. 742–748, 2006.
[ 37 ] Maghsoudi AA, and Bengar H, “Moment redistribution and ductility of RHSC continuous
beams strengthened with CFRP”, Turkish Journal of Engineering and Environmental
Sciences, vol. 33, pp. 45-59, 2009.
[ 38 ] Micelli F, Anniah RH, and Nanni A, “Strengthening of short shear span reinforced
concrete T joists with fiber reinforced plastic composites”, Journal of Composites for
Construction, vol. 6, pp. 264–271, 2002.
[ 39 ] Nguyen DM, Chan TK, and Cheong HK, “Brittle failure and bond development length of
CFRP-concrete beams”, Journal of Composites for Construction, vol. 5(1), pp. 12–17,

96
2001.
[ 40 ] Niemitz CW, James R, and Berña SF, “Experimental behavior of carbon fiber-reinforced
polymer (CFRP) sheets attached to concrete surfaces using CFRP anchors”, Journal of
Composites for Construction, vol. 12(2), pp. 185–194, 2010.
[ 41 ] Obaidat YT, Susanne H, Ola D, Ghazi A, Yahia A, “Retrofitting of reinforced concrete
beams using composite laminates”, Construction and Building Materials, vol. 25, pp.
591-597, 2010.
[ 42 ] Oehlers DJ, Liu IST, and Seracino R, “Shear deformation debonding of adhesively
bonded plates” Proc. Institution of Civil Engineers, vol. 158(1), pp. 77–84, 2005.
[ 43 ] Orton, SL, Jirsa JO, and Beyrak O, “Design considerations of carbon fiber anchors.”
Journal of Composites for Construction, vol. 12(6), pp. 608–616, 2008.
[ 44 ] Pan JL, and Leung CKY, “Effect of concrete composition on FRP/concrete bond
capacity.” Journal of Composites for Construction, vol. 11(6), pp. 611–618, 2007.
[ 45 ] Rahimi H, and Hutchinson A, “Concrete beams strengthened with externally bonded FRP
plates.” Journal of Composites for Construction, vol. 5(1), pp. 44–56, 2001.
[ 46 ] Ritchie PA, Thomas DA, Lu LW, and Connelly GM, “External reinforcement of concrete
beams using fiber reinforced plastic”, ACI Structural Journal, vol. 88(4), pp. 490–
500,1991.
[ 47 ] Smith ST, and Teng JG, “Debonding failures in FRP-plated RC Beams with or without U
strip end anchorage”, Proc. FRP Composites in Civil Engineering, vol. 1, pp. 607–615,
2001.

97
[ 48 ] Panda KC, Bhattacharyya SK, and Barai SV, “Shear behaviour of reinforced concrete T-
beams with U-bonded glass fibre reinforced plastic sheet”, Indian Concrete Journal, vol.
84, pp. 61–71, 2010.
[ 49 ] Riyadh A, “Coupled flexural retrofitting of RC beams using CFRP straps”, Composite
Structures, vol. 75, pp. 457-464, 2006.
[ 50 ] Ross CA, Jerome DM, Tedesco JW, and Hughes ML, “Strengthening of reinforced
concrete beams with externally bonded composite laminates”, ACI Structural Journal,
vol. 96. No. 2, pp. 65-71, 1999.
[ 51 ] Sebastian WM, “Significance of mid-span de-bonding failure in FRP-plated concrete
beams”, ASCE Journal of Structural Engineering, vol. 127, No. 7, pp.792-798, 2001.
[ 52 ] Sheikh SA, “Performance of concrete structures retrofitted with fibre reinforced
polymers”, Engineering Structures, vol. 24, pp. 869-879, 2002.
[ 53 ] Smith ST, and Teng JG, “FRP-strengthened RC beams I: Review of debonding strength
models”, Engineering Structures, vol. 24, No. 4, pp. 385-395, 2002.
[ 54 ] Spadea G, Bencardino F, and Swamy RN, “Structural behaviour of composite RC beams
with externally bonded CFRP”, Journal of Composites for Construction, ASCE, pp. 132–
7, 1998.
[ 55 ] Teng JG, Smith ST, Yao J, and Chen JF, “Intermediate crack-induced debonding in RC
beams and slabs”, Construcion and Building Materials, vol. 17(6–7), pp. 447–462, 2003.
[ 56 ] Yang ZJ, Chen JF, and Proverbs D, “Finite element modelling of concrete cover
separation failure in FRP plated R. C. beams”, Construction and Building Materials, vol.
17, No.1, pp. 3-13, 2003.

98
[ 57 ] Yao J, and Teng JG, “Plate end debonding in FRP-plated RC beams—I: Experiments”,
Engineering Structures, vol. 29(10), pp. 2457–2471, 2007.
[ 58 ] Yao J, Teng, JG, and Lam L, “Experimental study on intermediate crack debonding in
FRP-strengthened RC flexural members”, Advances in Structural Engineering, vol. 8(4),
pp. 365–396, 2005.