strengthening efforts for the eradication of … · civil society organizations, local government...
TRANSCRIPT

STRENGTHENING EFFORTS FOR THE ERADICATION OF POVERTY AND HUNGER
GHANA: COUNTRY REVIEW REPORT
THE ANNUAL MINISTERIAL REVIEW
GENEVA, SWITZERLAND JULY 2007

i
ACKNOWLEDGEMENTS The Government of Ghana would like to acknowledge the United Nation’s Economic Commission for Africa and the UNDP country office in Ghana for their support in facilitating the participation and presentation of Ghana’s country report at the 2007 ECOSOC Annual Ministerial Review (AMR) in Geneva.

ii
TABLE OF CONTENTS
ACKNOWLEDGEMENTS................................................................................................. i
TABLE OF CONTENTS.................................................................................................... ii
LIST OF TABLES AND FIGURES.................................................................................. iii
ABBREVIATIONS AND ACRONYMS........................................................................... v
EXECUTIVE SUMMARY .............................................................................................. vii
1.0 INTRODUCTION ....................................................................................................... 1
2.0 ECONOMIC POLICY ENVIRONMENT AND CHALLENGES IN 2000 ............... 1
3.0 POLICY INITIATIVES AFTER 2000........................................................................ 2
3.1 Restoring Macroeconomic Stability ............................................................ 2
3.2 Decision to Apply for HIPC ........................................................................ 3
4.0 NATIONAL DEVELOPMENT POLICY FRAMEWORKS....................................... 4
4.1 Ghana Poverty Reduction Strategy (GPRS I: 2003-2005) .................. 4
4.2 The Growth and Poverty Reduction Strategy (GPRS II: 2006-2007) ......... 6
4.3 Linking the GPRS to the Budget ................................................................. 6
4.4. Implementation, Monitoring and Evaluation............................................... 7
5.0 COUNTRY ACHIEVEMENTS .................................................................................. 8
5.1 Macroeconomic Stability ............................................................................ 8
5.2 Achievements in the GPRS Medium Term Priorities................................ 11
5.3 Reinforcing Commitment to Good Governance – The Africa Peer Review
Mechanism (APRM)................................................................................. 22
5.4 Progress towards the Achievements of the MDGs .................................... 24
5.5 Harnessing Investments for Growth and Poverty Reduction..................... 36
5.6 Bridging the Financing Gap....................................................................... 37
5.7 The Way Forward ....................................................................................... 38

iii
LIST OF TABLES AND FIGURES LIST OF TABLES
Table 1: Selected Government Fiscal Indicators, 2000-2005 (% of GDP)......................... 8
Table 2: Selected Performance Indicators, 2004-2005 ..................................................... 11
Table 3: Growth rates in Agriculture and Sub-sectors, (1998-2006)................................ 13
Table 4: World Bank’s CPIA Index* (Economic Policies Quality) and
Per Capita Growth of Selected Sub-Sahara African Countries (1998 -2005) .. 18
Table 5: Achievements of Basic Education Sector Indicators.......................................... 20
Table 6: Achievements of Basic Health Sector Indicators against Targets ...................... 20
Table 8: Total Cost Estimates of GPRSII Investment Expenditures,
2007-2009 (US$ million)................................................................................... 37
Table 7: ODA Receipts by GoG as % GDP, 1999 – 2005 ............................................... 36
Table 9: Gross Capital Flows, 2006-2009, ($ million) ..................................................... 38
LIST OF FIGURES
Figure 1: Government’s Budget Balance, 2000-200 .......................................................... 9
Figure 2: Trends in Inflation, 2000 - 2006....................................................................... 10
Figure 3: Trends in Real GDP and Real Per Capita Growth Rates, 2000-2005 (%) ........ 10
Figure 4: Growth Performance of the Agricultural Sector, 2000-2006 ............................ 13
Figure 5: Total Value of Cocoa Exports (2004-2006 ....................................................... 14
Figure 6: Value of Export of Selected Commodities (2004-2006)................................... 14
Figure 7a: Selected Consumption Indicators in Ghana, 1990-2002 ................................ 15
Figure 7b: Selected Indicators of Undernourishment in Ghana, 1990-2002 ................... 15
Figure 8: Trends of Children Nutritional Status in Ghana, 1998-2006 ............................ 16
Figure 9: Average Annual Growth of Yield per Hectare (2001-2005) 16
Figure 10: Average Annual Growth of Cultivated Area (2001-2005).............................. 16
Figure 11: Ghana-Doing Business Indicators 2005-06..................................................... 17
Figure 12: Resource Allocation to the Social Sector, (Percent) (2000 – 2006)................ 19

iv
Figure 13: Comparison of Poverty Rates in Ghana and Sub-Sahara Africa,
1991/2-2005/2006.............................................................................................. 24
Figure 14: Pattern and Trends of Poverty According to Regions, 1991/92 - 2005/06 .... 25
Figure 15: Percentage Increases in Consumption by Income Groups, 1991/2-2005/6..... 25
Figure. 16: Child Mortality Indicators in Ghana, 1980 -2003 .......................................... 27
Figure. 17: Trends in safe motherhood interventions, 1998 – 2003 ............................... 28
Figure 18: Official Development Assistance Flows to Ghana between 1997-2006......... 36

v
ABBREVIATIONS AND ACRONYMS ADF: African Development Foundation APR: Annual Progress Report APRM: Africa Peer Review Mechanism ARI: Acute Respiratory Infections BOG: Bank of Ghana CDF: Comprehensive Development Framework CIEA: Composite Index of Economic Activities CSOs: Civil Society Organisations CSPGs: Cross-Sectoral Planning Groups DAC: Development Assistance Committee FAA: Financial Accountability Assessment FAO: United Nation’s Food and Agriculture Organisation fCUBE: Free Compulsory Basic Education FINSSP: Financial Sector Strategic Plan GCB: Ghana Commercial Bank GDP: Gross Domestic Product GIS: Ghana Inter-Bank Settlement GLSS V: Ghana Living Standard Survey (Fifth Round) GOG: Government of Ghana GSE: Ghana Stock Exchange HIPC: Heavily Indebted Poor Country ICT: Information and Communication Technology IDGs: International Development Goals ITNs: Insecticides Treated Nets MDAs: Ministries, Departments and Agencies MDGs: Millennium Development Goals MDRI: Multilateral Debt Relief Initiative MMDAs: Metropolitan, Municipal and District Assemblies MOFEP: Ministry of Finance and Economic Planning MTP: Medium Term Priorities NDPC: National Development Planning Commission NED: National Economic Dialogue NEPAD: New Partnership for Africa Development NETS: National Expenditure Tracking System NGOs: Non-Governmental Organisation NPV: Net Present Value NTR: Non-Tax Revenue IGF: Internally Generated Funds OMO: Open Market Operations PLWHA: People Living With HIV/AIDs PMTCT: Prevention of Mother to Child Transmission PSBR: Public Sector Borrowing Requirement PSIA: Poverty and Social Impact Analysis

vi
PUFMARP: Public Financial Management Reform Programme SAP: Structural Adjustment Programme SEA: Strategic Environmental Assessment SMEs: Small and Medium Scale Enterprises START: Support Treatment and Anti Retroviral Therapy TOR: Tema Oil Refinery UN: United Nation VCT: Voluntary Counselling and Testing WAMZ: West African Monetary Zone WHO: World Health Organization

vii
EXECUTIVE SUMMARY Introduction In 2001 Ghana faced difficult policy choices emanating from the unfavourable economic policy environment and its negative impact on human development. The economy was characterised by large fiscal deficits and a heavy debt burden, a combination of which placed severe limitations on the nation’s capacity to address the high incidence of poverty. The government applied to access the Enhanced Highly Indebted Poor Country (HIPC) facility so as to lessen the huge debt burden and enhance its fiscal space for addressing poverty and implementing programmes of reforms required to restore macroeconomic stability. With this in view and as a requirement for accessing the HIPC initiative a policy framework, the Ghana Poverty Reduction Strategy (GPRS I), was formulated and implemented over the period 2003-2005. The process of formulating the GPRS I was participatory with consensus built through consultations with major stakeholders, including Ministries Departments and Agencies, civil society organizations, local government institutions, groups of experts and Ghana’s development partners. The strategy focused on the attainment of macroeconomic stability alongside the component of human development policies and programmes which targeted the objectives of improving access of Ghana’s population to basic needs and essential services. These programmes included basic education, safe water, improved health, environmental sanitation and special programmes for the vulnerable and excluded. In this respect, the GPRS I, broadly reflected a policy framework that was directed primarily towards the attainment of the anti-poverty objectives consistent with the UN’s Millennium Development Goals (MDGs). The GPRS I also incorporated a set of sector initiatives that were subsequently identified as strategic Medium Term Priorities (MTP). Based on the positive outcomes of GPRS I, especially in the area of attaining macroeconomic stability and some measure of progress made towards attaining the objectives of human development including the MDGs, a successor policy framework, the Growth and Poverty Reduction Strategy (GPRS II: 2006-2009) was formulated. While GPRS I focused on poverty Reduction Programmes and projects, the emphasis of GPRS II is on growth inducing policies and programmes which have the potential to accelerate wealth creation and poverty reduction.

viii
Strategies Key strategies for poverty reduction include the following:
• prudent fiscal and monetary policy management; • private sector-led agro-industrialization; • sound and sustainable management of the environment; • promotion of commercial agriculture using environmentally friendly
technologies; and • increased investments in economic and social services.
These strategies were strengthened by increased efforts to implement the following medium term priority interventions:
• infrastructure development • modernised agriculture based on rural development to ensure increased
production and employment; • investments in education, health, and sanitation to enhance delivery of basic
social services; • upholding the rule of law, respect for human rights and the attainment of social
justice and equity to enhance good governance; and • private sector development through macro-economic stability.
Additionally, measures were adopted to enhance the opportunities for implementing direct poverty reduction interventions at the district level through:
• utilisation of HIPC funds to support expenditures in health, water, sanitation, education and employment-generating projects at the district level;
• direct funding of local government by central government to implement projects that have immediate impact on the poor;
• increased shares of budgetary allocations to finance the provision of rural infrastructure;
• implementation of District Mutual Health Insurance Schemes. Key Successes and Challenges The prime objective of relative macroeconomic stability has been attained largely as a result of prudent fiscal and monetary policy management. Associated with this turn around:
• The fiscal space has widened with government revenue-GDP ratio rising from 17.7% in 2000 to 23.5% in 2006. This has facilitated rising increases in government expenditure from 32.34% to 36.77% of GDP between 2000 and 2006.
• End of year inflation has also dropped from 40.5% in 2000 to 10.5% by the end of 2006.
• Commercial bank lending rates have also declined from 47% in 2000 to 22% in 2006, whilst the violent cedi depreciation has been considerably reduced successively from 49.8% (dollar) in 2000 to 0.9% in 2006.

ix
• Relative progress has also been made in realising the objectives of the medium term priority areas. In agriculture, for example, the cocoa and forestry sub-sectors have experienced productivity gains;
• Investments in infrastructure have shown significant gains especially in the road sub-sector, energy and ICT.
• The improvements in the fiscal space of the economy has enabled significant increases in investments in the social sector in support of health, education, water and sanitation and special programmes targeted at women, children, the vulnerable and excluded. These have contributed to substantial progress towards the MDGs.
• The private sector has benefited from the improved macroeconomic conditions, increased government efforts to address the infrastructural bottlenecks, and from institutional reforms carried out in the financial sector, customs, legal system, labour market, land reform and civil service. These benefits have manifested themselves in increasing credits to the private sector, and in the ease of doing business in Ghana (CPIA = 3.9).
• These improvements have contributed significantly towards promoting accelerated growth and poverty reduction. The GDP growth rate increased from 3.7% in 2000 to 6.2% in 2006 and while poverty levels fell from 39% in 1998/99 to 26.5% in 2006 that puts Ghana on the road to achieving the millennium development goal of reducing poverty levels by half from the 1990 levels ahead of the 2015 target date in spite of some mixed results on the efforts to attain the other MDGs
Support from the International Community including the UN System The partnership between Ghana and her Development Partners has been central to the formulation, implementation and monitoring of the GPRS. In 2005, Ghana’s relationship with its development partners was given a new boost when the country signed on to the Paris Declaration on Aid Effectiveness. The declaration essentially formalized the relationship between development partners and aid recipients by explicitly outlining the roles and responsibilities of both parties. The principles underlying the Paris Declaration include:
• strengthening country’s ownership of the development process, • ensuring the alignment of development partner support on national priority, • ensuring harmonisation of donor procedures and country systems • managing resources on the basis of desired results and use of information to
improve decision making • ensuring mutual accountability in relation to resource flow and results achieved
through the implementation of national strategy The results of improved Government and Donor Partnership have influenced the current aid architecture in Ghana with mutual benefits to both parties. The new relationship has contributed to increased technical and financial support for the implementation of the GPRS from both bilateral and multilateral donors.

x
Challenges Ghana has made progress towards accelerated growth and poverty reduction in recent years, but major challenges still remain including the following:
• Lack of structural transformation of the economy in the face of sustained economic growth
• Energy crisis • Low level of accumulation of technological capabilities • High youth unemployment as a threat to social cohesion • Slow pace of public sector reform • Brain drain • Unsustainable management of natural resources • Persistent inequalities in the distribution of the gains of growth • The HIV/AIDS menace • Financing the infrastructure gap • High public sector wage bill
Key lessons learnt The key lessons learned from Ghana’s experience are that true ownership of national development strategies is critical for effective implementation and monitoring. Furthermore, while macro-stability is essential for growth complementary investments in institutions and supportive infrastructure play an important catalytic role in the growth process. In particular, credible reforms in political and corporate governance are essential for creating a favourable investment climate. Moreover, while rapid improvements in primary and secondary enrolment have been observed, looming challenges with respect to maintaining educational quality. Furthermore strengthening the partnership between government and its development partners promotes mutual accountability and overall improvements in the aid architecture.

1
STRENGTHENING EFFORTS FOR THE ERADICATION OF POVERTY AND HUNGER, (INCLUDING THROUGH GLOBAL
PARTNERSHIP(S) FOR DEVELOPMENT
1.0 INTRODUCTION Following the declaration of the Millennium Declaration in 2000, Ghana has adopted the Millennium Development Goals (MDGs), as its long term minimum objectives for socio-economic development that have influenced the determination of the country’s strategic priorities for national socio-economic development. Consequently, the targets of the MDGs have been mainstreamed in the country’s successive development policy frameworks – The Ghana Poverty Reduction Strategy (GPRS I) and the Growth and Poverty Reduction Strategy (GPRS II) respectively. The aim of this national report is to examine and provide an assessment of the implementation of Ghana’s national development strategies to achieve national development objectives, including the MDGs. The report focuses largely on the implementation of the GPRS I & II. It outlines the process of formulating the GPRS, the progress made towards strengthening efforts to accelerate growth and poverty reduction, challenges and bottlenecks encountered and support from development partners. The report is presented in four sections. After a brief introduction in Section I, Section II discusses the socio-economic environment and challenges that confronted the country in 2000. This is followed by an analysis of the economic policies and programmes that were implemented to address these challenges in Section III. Section IV outlines the country’s achievements in relation to the objectives of the national development frameworks including the MDGs. The paper concludes with lessons learnt and remaining challenges for the future.
2.0 ECONOMIC POLICY ENVIRONMENT AND CHALLENGES IN 2000
At the time of independence in 1957 Ghana had good prospects for economic growth and development. However the economy suffered a decline of more than 30% during the seventies and early eighties. With the implementation of an economic recovery programme, followed by a structural adjustment programme in the eighties the economy began to experience relative stability. From a negative growth rate of about 3.3% during 1979-1983 the GDP growth rates experienced upward trends averaging about 4.5% between 1984 and 2000. Notwithstanding these positive gains the country faced serious social and economic challenges including the following: ♦ The economy basically remained fragile i.e. small, open and highly dependent on
external inflows.

2
♦ Economic growth had remained stagnant at below 5% for almost two decades of stabilization and structural adjustment. The year 2000, for instance, had ended with a GDP growth of 3.7% just barely over the population growth rate of 3.1%.
♦ The institutions of state remained weak due to several decades of neglect and failure of SAP reforms to adequately address their deficiencies.
♦ Investments, particularly, private investment had hit its lowest levels in 2000, due to low levels of savings, and high interest rates.
♦ Poverty levels reduced by only 12 percentage points between 1991/92 and 1998/99, leaving about 49.5% of the total population and 63.9% of the rural population still below the poverty line in 2000.
♦ Fiscal policies depicted strong imbalances in government finances that appeared to reverse the modest gains from the recent past reforms. As a result overall government budget deficit remained large at 8.2% relative to the GDP in 2000.
♦ Monetary policy in 2000 was dictated by intensive government borrowing from the banking system to finance rising government fiscal deficit.
♦ The year 2000 saw interest rates generally spiralling upwards along with the inflationary trend. The commercial bank lending interest rates was about 47% whilst inflation stood at 40.5%.
♦ The year 2000 also experienced unfavourable terms of trade and foreign exchange depreciation in nominal terms of 57% against the US dollar. There was a decline in aid disbursements in the face of what donors characterised as a low effective absorptive capacity.
♦ As a result of high indebtedness of the state, interest payments on external and dom-estic debt rose in nominal terms by 110.8% and 70% respectively in 2000, with the absolute payments of national debt service far exceeding the total capital (investment) expenditure of the state.
♦ Investments in roads, health and education decline fiscal space. The health expenditure index, for instance, fell from 100 in 1993 or 120 in 1999 to 88 in 2000.
In the face of the above challenges, incidence of poverty remained high at 39.5% in 2000. This was, partly, as a result of lack of adequate fiscal space to undertake substantial investments in poverty reduction.
3.0 POLICY INITIATIVES AFTER 2000 3.1 Restoring Macroeconomic Stability Faced with a rapidly deteriorating financial situation the government acted swiftly to restore macroeconomic stability by preparing an austerity budget, applying for the HIPC initiative and preparing a national development policy framework document, the Ghana Poverty Reduction Strategy (GPRS II). These formed the basic foundation of the new policy direction of the government.
3
In order to arrest the fast deteriorating fiscal balance the government launched a stabilization strategy to create sufficient enhance opportunities for financing the necessary investments required to achieve the MDGs. The fiscal strategy focus was influenced largely by revenue enhancing and prudent spending management. This strategy was complemented with a tight monetary policy with the core objectives to reduce inflation to single digits and limit exchange-rate volatility by strengthening the autonomy of the Bank of Ghana (BOG). This autonomy has been further strengthened through the creation of a Monetary Policy Committee to guide the decisions of the Bank of Ghana, and the use of a prime interest rate as signals for the policy stance of the BOG. With the Bank of Ghana Act (612) the government’s borrowing requirements became tightly controlled and shifted away to non-banking sector sources and also per legislation pegged at 10% of its revenue. 3.2 Decision to Apply for HIPC A significant milestone in the evolution of Ghana’s new economic policy thrust in the new millennium was the decision of the government to apply for the enhanced initiative for Heavily Indebted Poor Countries (HIPC), with the view to reducing the debt burden and enhancing her access to more resources for accelerated poverty reduction. Ghana reached the HIPC Decision Point in 2002. In order to benefit from the debt relief under the HIPC initiative Ghana prepared a poverty reduction strategy document (GPRS). Through prudent fiscal and monetary policy the country reached the Completion Point of the Enhanced HIPC Initiative in July 2004, within a record time of thirty months. As a result the Paris Club of creditors offered an outright debt cancellation of about US$2 billion, with a further US$2 billion to be forgiven in instalments over the next 20 years. Ghana was required to use 80 percent of the savings generated from the debt relief for additional poverty related expenditures, and 20 percent to reduce domestic debt. In 2006 the fiscal space for investment in poverty reduction programmes was further widened with additional savings from a cancellation of Ghana’s debt under a Multilateral Debt Relief Initiative (MDRI) of the G-8 countries equivalent to about US$4.2 billion. Between 2001 and 2005 the HIPC debt relief created substantial savings to allow for substantial increases in poverty-related spending from 4.7% of GDP in 2001 to 8.5% in 2005. The savings also bolstered the fiscal consolidation efforts of the government and, thereby, contributed strongly to a significant reduction in domestic debt service. Between 2002 and 2006, for instance, the burden of the domestic debt service, as measured by the ratio of the domestic debt relative to the GDP, declined from a peak of 29.12% to about 15.2%. This, however, happened in the face of a substantial increase in the absolute debt stock by almost 25.2% over the 2005 stock or from ¢13,631.2 billion in 2003 to ¢17,061.2 billion in 2006.

4
4.0 NATIONAL DEVELOPMENT POLICY FRAMEWORKS 4.1 Ghana Poverty Reduction Strategy (GPRS I: 2003-2005) GPRS I was formulated to enable Ghana to benefit from a significant measure of debt relief under the global HIPC initiative and to position the country in an improved macroeconomic environment to address critical issues of poverty on an emergency basis. For the limited objective of attaining a measure of macroeconomic stability, sufficient enough to admit a programme of action on poverty an interim poverty reduction strategy (I-PRSP) was prepared followed by a “Ghana Poverty Reduction Strategy I. The strategy was designed at the time to address poverty reduction through programmes and measures which could be implemented over the medium-term, while a combination of a number of fiscal and monetary policies and reforms to governance were being implemented to stabilize the distressed macroeconomic environment. A key objective was to realign the distorted macroeconomic environment and improve the conditions for implementation of sectoral policies designed to promote sustainable economic growth and reduce the high incidence of poverty prevalent in the country. The strategy also focused on that component of human development which targeted measures designed to improve access of Ghana’s population to basic needs and essential services. These programmes included basic education, safe water and improved health and environmental sanitation. In this respect, the GPRS I, broadly reflected a policy framework that was directed primarily towards the attainment of the nation’s anti-poverty objectives which were also consistent with the UN’s Millennium Development Goals (MDGs). The process of formulating the GPRS I was participatory involving various stakeholders including representatives from all levels of government, development partners, think tanks, academia, private sector and civil society. To ensure the effective integration of cross-cutting sectoral development issues in the policy framework cross sectoral teams were established to conduct participatory poverty analyses and consultation workshops in sampled communities, districts and administrative regions. The reports of these groups were reviewed a two-day national consultative forum called the National Economic Dialogue (NED) in May 2001. This process led to several revisions of the initial draft GPRS I. Issues relating to poverty reduction were identified and packaged and addressed under the following five thematic areas:
Macroeconomic Stability Production and gainful employment Human development and basic services Special programmes for the vulnerable and excluded

5
Governance Policies and strategies under the macroeconomic stability focused on prudent fiscal, monetary and international trade management. Policies for improving production and generating gainful employment focused on enabling environment for improved private sector led development and agro-based industrial production. Policies and measures were designed to enhance human development and the provision of access to basic services to promote access and utilisation of basic services to the poor. Special programmes for the vulnerable and excluded were implemented under this thematic area with the aim ameliorating conditions of extreme poverty and social deprivation. Interventions also included those designed to respond rapidly to the needs of those affected by natural and man made disaster and promote gender balance, and ensure equity. In the area of good governance policies focussed on ensuring timely access to justice for all, transparency in government decision making, decentralisation, and accountability and zero tolerance for corruption. Given the magnitude of resources required to fund the entire GPRS I high priority was given to financing the implementation of the following programmes
• Infrastructure • Modernized Agriculture based on Rural Development • Enhanced Social Services • Good Governance • Private Sector Development
A review of available indicators show that generally the prime objective of macroeconomic stability was attained during the period 2003-2005 attained as a result of prudent fiscal and monetary policy. The relative stability of the economy was achieved in spite of the fact that Ghana’s main exports, cocoa and gold and its major imports were been subject to the volatile movements in international commodity pricing. In the economic sectors, agriculture remained the largest contributor to GDP. Within the sector cocoa and forestry sub-sectors made substantial gains in relative shares while the crops sub-sector declined marginally. Investments in infrastructure, especially in the road, energy and ICT sub-sectors, showed significant gains. Generally significant increases in expenditure outlays were made in the social sector in support of health, education, water and sanitation and special programmes targeted at women, children, the vulnerable and excluded under the GPRSI. The main objective of governance to ensure the protection of civil liberties, decentralised participatory decision-making and financial empowerment of district assemblies were achieved.

6
4.2 The Growth and Poverty Reduction Strategy (GPRS II: 2006-2007) Following the positive results achieved from the implementation of GPRS I, government launched a successor national development policy framework – the Growth and Poverty Reduction Strategy (GPRS II) to be implemented over the period 2006-2009. The strategic direction of the GPRS II is to accelerate economic growth and poverty reduction by supporting the private sector to create wealth. Accordingly emphasis is placed on the implementation of policies and measures which have the potential to fundamentally re-structure the economy by diversifying the export base, and increasing agricultural productivity, processing and storage, thereby contributing national food security and rural incomes. The second major thrust of GPRS II is a set of policies aimed at addressing existing weaknesses within the social structure, which comprises a high proportion of children, youth and women. This situation, coupled with its attendant high dependency ratio, is further aggravated by the low level of literacy, working skills and productivity especially among women and the rural population. Policies and programmes for attaining the targets of the MDGs are integrated in the appropriate thematic areas of the GPRS II 4.3 Linking the GPRS to the Budget In 2002 a process was initiated to harmonize sector priorities with Medium Term Priority (MTP) objectives and also link the GPRS with Medium Term Expenditure Framework (MTEF) and annual budgets. Under this initiative Ministries Departments and Agencies (MDAs) were required, not only to incorporate the GPRS policies into their sector plans and annual budgets but also to show evidence of progress made in achieving sector targets set in the GPRS as well as identify policy gaps to be implemented in the succeeding year. In the preparation of the annual budgets a number of activities were undertaken to link them to the GPRS including the following:
• Workshops were organised to improve MDAs understanding of the MTEF process as well as linking the GPRS and Annual Progress Report (APR) to the budget;
• Within each of the priority areas, the MDAs were required to show the progress made in achieving targets set in the GPRS and the remaining gaps.
• MDAs were required to incorporate poverty reduction policies of the GPRS into their Strategic Plans.
• The MDAs were reminded of the role of the GPRS and APR at the budget preparation stage and the inclusion of the GPRS programmes and projects in their budgets;
• The National Development Commission (NDPC) is represented at the budget preparation stage to ensure that the GPRS and the findings of the Annual Progress Report of the GPRS were incorporated in the budget.

7
A National Expenditure Tracking System (NETS) was also developed by the Ministry of Finance and Economic Planning (MOFEP) and Ghana’s Accountant General’s Department to track poverty-related expenditures in the priority areas of the GPRS. This tool also facilitated the harmonization of GPRS framework with the MTEF budget format. By capturing all sources of public sector funds and expenditure the NETS additionally served as a useful linkage for tracking expenditures on the implementation of the GPRS. In 2006 a refined mechanism that allows sector priorities to be effectively linked to the GPRS objectives through the MTEF was instituted by NDPC and MOFEP. This new mechanism establishes the links between the sector plans, GPRS priorities and the annual Budget by ensuring that all:
♦ MDAs objectives are properly aligned to the strategic objectives of the GPRS II, ♦ The objectives of the current MTEF are properly aligned to the GPRS II, ♦ Resources for financing expenditures associated with the implementation of the
GPRS II are consolidated and rationally allocated. 4.4. Implementation, Monitoring and Evaluation The strategy emphasises on stakeholder participation in the implementation, monitoring and evaluation of the GPRS. A national development communication strategy has been formulated to assist in dissemination the strategy to civil society. The participatory process is designed to ensure transparency and promote a sense of national ownership. The oversight responsibility of the parliamentary select committee on poverty will be strengthened to ensure the effective implementation of the strategy. A GPRS M&E system to produce an annual progress report that is fed into the annual planning and budget cycle is instituted. The GPRS consists of programs and projects that can be implemented by the government, the private sector and civil society organizations, and thus recognises the critical role of the various stakeholders in its effective implementation. Given that the private sector and civil society organizations have competencies in certain areas that government does not have, the GPRS identifies specific roles and responsibilities to these non-state actors based on their special competencies.
A GPRS Monitoring and Evaluation (M&E) plan has been established to monitor the implementation of programs and projects, and evaluate their results and impact on reducing poverty on a continuous basis. The M&E institutional arrangements have been designed to facilitate active participation of stakeholders to ensure policy recommendations are relevant and contribute to further enhancing policy formulation and resource allocation that are geared towards poverty reduction. The M&E Plan includes the following; • development of institutional framework for coordinating the system, • establishment of monitoring indicators against GPRS baselines and core targets

8
• establishment of special indicators to facilitate the tracking of the HIPC expenditures, Millennium Development Goals (MDGs), and the Medium terms priorities
• studies to enhance the knowledge and data base for the conduct of objective impact analysis of GPRS (i.e. PSIAs)
• dissemination plans and a communication strategy, based on sound understanding of the key stakeholders
• wider stakeholder participation (government, parliament, NGOs, CSOs, private sector) in monitoring progress of the GPRS.
An Annual Progress Report (APR) is prepared to assess the status of actions taken in implementing the GPRS using a set of indicators and targets agreed in the policy framework. It further identifies weaknesses that are likely to hinder the achievement of the goals and objectives of the GPRS and, recommends policies to resolve them. The APR also provides information on the linkage between the annual budget and the GPRS and is used to inform the Medium Term Expenditure Framework (MTEF) process for the preparation of the following year’s annual budget, to ensure that resources are refocused appropriately.
5.0 COUNTRY ACHIEVEMENTS 5.1 Macroeconomic Stability Considerable progress has been made towards the achieving the objectives of the GPRS I including the MDGs. The macroeconomic policy environment attained relatively stability, with the targeted macroeconomic indicators registering positive trends. Government revenue, increased from 17.7% in 2000 to 23.87% in 2005. Tax revenue also improved from 16.3% in 2000 to about 21% of GDP over the period. The level of improvement in revenue mobilization has led to increase in government expenditure from 32.3% to 36.8% of GDP between 2000 and 2005 (Table 1). Debt relief from HIPC and MDRI as well as increased support from Development Partners have contributed to increased investment investments in infrastructure, education and health, and governance. Over the period ODA flows, rose from 6% of GDP in 1999 to a peak of 18% in 2004 before levelling off at 10% in 2005.
Table 1: Selected Government Fiscal Indicators, 2000-2005 (% of GDP)
INDICATOR 2000 2001 2002 2003 2004 2005
Total Receipts 36.52 35.70 32.34 33.71 36.01 36.77 Total Revenue 17.72 18.16 18.42 20.12 23.81 23.87 Tax Revenue 16.26 17.25 17.90 19.56 21.81 20.76 Direct Taxes 5.19 5.59 5.85 6.27 6.70 6.82 Indirect Taxes 7.43 7.54 7.87 8.45 10.34 9.71 International Trade Taxes 3.63 4.13 4.18 4.84 4.77 4.24

9
Non-Tax Revenue 1.46 0.91 0.53 0.56 1.42 1.91 Grants 2.12 6.91 3.19 4.78 6.19 5.26 Other Receipts 16.69 10.62 10.73 8.57 6.45 4.53 Divestiture 1.19 0.41 0.02 0.65 0.36 0.24 Project Loans 3.72 5.17 2.48 3.13 3.11 3.17 Programme Loans 2.95 2.78 0.33 1.68 1.15 1.51 Exceptional Financing 0.00 0.00 2.60 2.76 1.33 1.23 Net Domestic Financing 8.83 2.27 4.88 0.35 0.49 -1.62 Total Payments 36.52 35.70 32.34 33.70 36.01 36.77 Statutory Payments 17.14 13.52 13.98 13.84 11.22 12.59 Discretionary Payments 19.38 22.18 18.36 19.86 24.78 24.18 Budget Balance -8.48 -7.24 -5.26 -3.40 -3.20 -2.00 Primary Budget Balance 2.45 3.80 2.14 2.50 0.70 3.40
Source: Ministry of Finance and Economic Planning The prudent fiscal and monetary policies have had a positive impact on almost all the fiscal and monetary indicators. The budget deficit reduced over the period from 8.4% of GDP in 2000 to 2% in 2005 (Figure 1), with the average inflation rate declining from 40.5% in 2000 to 10.3% in 2006 (Figure 2). The rate of depreciation of the cedi against the United State dollar has slowed down considerably from 49.8% (dollar) in 2000 to 0.9% in 2006.
Figure 1: Government’s Budget Balance, 2000-200
5
Total public debt declined substantially from a total stock of US$8,382.5 million in 2005 to US$4,670.59 million at the end of September, 2006, as a result of both fiscal prudence and debt relief under the enhanced Heavily-Indebted Poor Countries (HIPC) Initiative and the Multilateral Debt Relief Initiative (MDRI). This has resulted in a substantial decline in the debt burden (debt service-GDP ratio) from about 24 per cent of GDP in 2002 to below 10% of GDP in 2006.
-8.48
-7.24
-5.26
-3.4 -3.2
-2
-9
-8
-7
-6
-5
-4
-3
-2
-1
0
2000 2001 2002 2003 2004 2005

10
Figure 2: Trends in Inflation, 2000 - 2006
As a result of stability in the economy the Bank of Ghana lowered its prime rate and lending rates of commercial banks from about 42% and 47% in December 2000 to about 10% and 22% in 2006 respectively. However, the interest rate spread remained high at 13% in 2006, even though it had reduced considerably from more than 30% in 2000. From a deficit of about US$194 million in 2000, the balance of payment recorded a surplus of US$ 178.8 million in 2006. The economy has indeed responded positively to these new reforms with stronger growth, with the average output expanding from an annual rate of 3.7% in 2000 to 6.2% in 2006 (Figure 3). Since 2004 the GDP growth has averaged 6% which is the highest rate ever recorded over the past decades.
Figure 3 : Trends in Real GDP and Real Per Capita Growth Rates, 2000-2005 (%)
Trends in Real GDP and Real Per Capita growth rates (2000-2005)
3.74.2 4.5
5.25.8 5.8
2.1 2.3 2 2.2 1.9 2.1
0
1
2
3
4
5
6
7
2000 2001 2002 2003 2004 2005Year
Gro
wth
rate (%
)
Real GDP growth rate Real per capita growth Source: Budget Statement, various years A close look at Table 2 reveals that the improvement in economic growth rates has been the results of improvements in some macroeconomic indicators, which have been presented in Table 2.
0
5
10
15
20
25
30
35
40
45
Annual Average 25.2 32.9 14.8 26.7 12.6 14.4 10.9
End of Period 40.5 21.3 15.2 23.6 11.8 14.9 10.5
2000 2001 2002 2003 2004 2005 2006

11
Table 2: Selected Performance Indicators, 2004-2005
Indicator 2004 2005 2005 Difference
Difference
(% unless otherwise stated) Actual (C1) Target (C2) Actual (C3) C3-C1 C3-C2
National GDP Nominal GDP (¢ billion) 79,804 96,319 97,018 17,214.3 699 Real GDP Growth 5.8 5.8 5.8 0.0 0.0 Real Per Capita GDP Growth 1.9 2.1 0.2 Sectoral Growth Rates (%) Agriculture 7.5 6.5 6.5 -1.0 0.0 Industry 5.1 5.8 5.6 0.5 -0.2 Services 4.7 5.4 5.4 0.7 0.0 Fiscal Indicators (%) Domestic Revenue/GDP 23.8 24.6 24.9 1.1 0.3 Domestic Expenditure/GDP 23.1 22.2 22.2 -0.9 0.0 Tax Revenue/GDP 21.8 21.8 22.2 0.4 0.4 Primary Balance/GDP 0.7 2.5 2.7 2.0 0.2 Overall Balance/GDP -3.2 -2.2 -2.4 0.8 -0.2 Net Domestic Financing/GDP* 0.5 -1.0 0.0 -0.5 1.0 Monetary/Financial Indicators (%) Broad Money Supply (M2+) Growth 26.0 14.1 -11.9 Reserve Money Growth 18.8 11.2 -7.6 M2+/GDP 33.4 31.4 -2.0 Inflation (Year-on-Year) 11.8 13.5 14.8 3.0 Inflation (Yearly Average) 12.6 15.1 2.5 Interest Rates Demand Deposits (Annual Av.) 7.5 7.13 -0.37 Savings Deposits (Annual Av.) 9.5 6.38 -3.12 Time Deposits (Annual Av.) 13.25 7.75 -5.5 Lending Rates (Annual Av.) 28.75 26.00 -2.75 91-Day Bills (End Period) 17.00 11.13 -5.87 Lending Rates (End Period) 28.75 26.00 -2.75
5.2 Achievements in the GPRS Medium Term Priorities A summary of progress made toward the attainment of medium term prioritised under the GPRS is provided below: I. Enhanced Infrastructure Development Under this area the priority is to accelerate the provision of relevant infrastructure to support improved production and to generate gainful employment so as to reduce urban and rural poverty. The strategy focused on creating an enabling environment to stimulate

12
private sector investment and growth in the real sector (particularly agriculture and industry). Good progress appears to have been made in realising the objectives of this priority area. The transport (including road, rail, water and air transport) and construction sub-sector, in particular, recorded significant increases in growth under the GPRS I, as a result of increased road construction and other infrastructural development throughout the country. All the major highways specifically targeted in the GPRS I to open up the country and link it effectively with the trans-ECOWAS highway project, are nearing completion. The coverage of the feeder road network, linking the rural areas to the urban centres, increased from 32,601.8 kilometres in 2003 to 41,039 kilometres in 2005, of which 35% is estimated to be in good condition. The growth rate of the construction sub-sector rose from 4.8% in 2001 to 10% in 2005, and levelled off at 8.2% in 2006. The provision of ICT infrastructure also experienced substantial progress. The number of schools which have been equipped with computer terminals and PCs increased from virtually nothing in 2002 to a total of 913 at the end of 2005 and exceeded the overall target by 399. The number of fixed telephone lines installed increased significantly from the 2002 level of 200,000 to 331,000 in 2005, while the number of cellular phones and pay-phones stood at 2,655,000, and 11,037 respectively (about 72% and 11% increases respectively, over their 2004 levels. Overall the infrastructure sector benefited from substantial increases in government resource allocation, which exceeded the target set in the GPRS. The sector also accounted for an average of 44% of donor spending for the period. These resource allocations contributed to raise infrastructure’s share of the functional distribution of total (GoG and Donor) expenditure from 3.7% in 2002 to 5.6% in 2006. II. Modernized Agriculture Based On Rural Development: The government’s agricultural modernization strategy hinges on rural transformation, land reform, increased land under irrigation, increased mechanization, value addition to traditional crops such as cocoa, expanding cash crop production and strengthening support to the private sector.

13
Figure 4: Growth Performance of the Agricultural Sector, 2000-2006
2 . 1%
4 . 0 % 4 . 4 % 6 . 1%
7 . 5 %6 . 5 %
0.0%1.0%2.0%3.0%4.0%5.0%6.0%7.0%8.0%
2000 2001 2002 2003 2004 2005Ye a r s
Table 3: Growth rates in Agriculture and Sub-sectors, (1998-2006)
Sub-Sector Year/ Period
Crops/ Livestock Cocoa Forestry/
Logging Fisheries All
1998 4.4 11.0 10.0 1.8 5.1 1999 4.7 -0.5 6.8 1.0 3.9 2000 1.1 6.2 11.1 1.6 2.1 2001 4.6 -1.0 4.8 2.0 4.0 2002 5.2 -0.5 5.0 2.8 4.4 2003 5.3 16.4 6.1 3.0 6.1 2004 5.4 29.9 5.8 3.5 7.5 2005 6.0* 13.2* 5.6* 3.6* 6.5* Average 1990-94 0.9 1.1 2.5 2.0 1.1 1995-99 4.1 6.3 5.3 1.5 4.4 2000-05 4.6 10.7 6.4 2.8 5.1
*Provisional Source: ISSER 2006
Overall, the strategy has yielded some positive results. Since 2000, agricultural production has improved markedly largely due to double digit growth in the cocoa sector. For instance, during the period 2000-2005 average growth of the cocoa sector was twice the rate for the crops and livestock sector (Table 3). Notwithstanding the relatively slow growth in the crops and livestock sub-sector the average growth in per capita food production during the period 2001-2006 (3.6 percent) exceeded the annual demographic growth rate (2.7 percent) reflecting an improvement in food security over the period.

14
Figure 5: Total Value of Cocoa Exports (2004-2006
0
200,000,000
400,000,000
600,000,000
800,000,000
1,000,000,000
1,200,000,000
Value in US$
Cocoa 600,271,681 787,958,761 1,092,530,184
2004 2005 2006
Figure 6: Value of Export of Selected Commodities (2004-2006)
0
10,000,000
20,000,000
30,000,000
40,000,000
50,000,000
60,000,000
70,000,000
Value in US$
2004
2005
2006
2004 829,839 1,699,970 2,463,114 3,337 8,399,850 6,391,304 22,068,649 163,850 1,226,695 208,938 52,017,980
2005 380,865 490,862 28,968,495 703,229 10,951,355 4,453,105 12,784,322 134,559 1,081,280 458,940 45,763,617
2006 8,981,365 430,085 27,248,779 315,684 14,156,905 3,825,683 19,086,134 83,207 936,536 10,297,106 67,902,789
Cashew Coffee Sheanut Maize Yam Products
Exotic Vegetables
Pineapple Mango Paw paw Banana Fish and Sea Foods
The traditional proxies for food security (i.e., dietary protein consumption (g/person/day); dietary fat consumption (g/person/day); and dietary energy consumption (kcal/person/

15
day) also improved. As illustrated below average dietary protein consumption per day increased 46 g/person/day in 1990-2 to 58 g/person/day in 2003-2004 while dietary energy consumption per day per person rose by almost 30% from 2080 to 2690 (kcal/person/day) during the period between 1990-1992 and 2003-2004. Dietary fat consumption (g/person/day) also increased from 35 to 42 over the same period. The positive effects can also be seen in the downward trend in the prevalence of food deprivation in Ghana, which is reflected in the rapid decline in both the number and proportion of undernourished people from 5.8 million and 37% to 2.3 million and 11% respectively between 1990-1992 and 2003-2004.
Figure 7a Selected Consumption Indicators Figure 7b Selected Indicators of Undernourish-
in Ghana, 1990-2002 ment Ghana, 1990-2002
0
10
20
30
40
50
60
70
1990-1992 1995-1997 2000-2002 2003-2004
g/pe
rson
/day
0
500
1000
1500
2000
2500
3000
kcal
/per
son/
day
Dietary protein consumption (g/person/day) Dietary fat consumption (g/person/day) Dietary energy consumption (kcal/person/day)
0
1
2
3
4
5
6
1990-1992 1995-1997 2000-2002 2003-2004
Mill
ions
of U
nder
nour
ishe
d d
…...
10
15
20
25
30
35
40
% o
f Und
erno
uris
hed
Number of undernourished (millions)
Proportion of undernourishment (%)
The weight of the evidence thus suggests that Ghana has already more than achieved the MDG target of halving the proportion of Ghanaians suffering from Hunger relative to 1990 levels. Furthermore, trends in the proportion of underweight children as well as the incidence of wasting and stunting among children (Figure 8) have generally improved However, pockets of food insecurity persist among vulnerable groups. A study conducted by the Ministry of Agriculture in 2006, revealed that approximately 5.1% of rural households always experience food deficits, 35.1% claimed they experience deficits sometimes or often.

16
Figure 8: Trends of Children Nutritional Status in Ghana, 1998-2006
Food security in Ghana can benefit from improvements in agricultural productivity. Overall, agricultural growth has been driven more by expansion (26.3%) in acreage than by increases (5.27%) in productivity. Moreover, cash crop agriculture, particularly cocoa, has accounted for the bulk of the productivity gains. Conversely, expansion of acreage accounted for the bulk of food crop growth during the period 2001-2006. Factors accounting for the limited productivity gains in food crop agriculture include inadequate investments in inputs due to low returns on investment. Profit margins tend to be low in the sector due to inadequate support mechanisms to protect farmers from volatility in farmgate prices, high input costs, inadequate extension services and limited access to credit and markets. In the absence of effective price smoothing measures farmers are exposed to high market risks. This in turn reduces their capability and incentive to invest in yield-improving inputs. Furthermore, it reduces their credit worthiness and as well as their ability to repay loans. These factors may account for the unfavourable trend in the share of credit to the agriculture sector (excluding cocoa) which declined from 8.1% in 2004 to 4.8% in 2006 as against the 2006 target of 10%.
Figure 9: Average Annual Growth of Yield per Figure 10: Average Annual Growth of
Hectare (2001-2005) Cultivated Area (2001-2005)
17.4
8.0 7.2 6.5
2.00.6 0.1 0.0
-5.4-10
-5
0
5
10
15
20
Cocoa b
eans
Coarse
grain
primary
Fibre c
rops p
rimary
Cereals
Fruit e
xcl m
elons
Roots a
nd tu
bers
Vegetab
les+melo
ns
Citrus fr
uit
Oil crop
s prim
ary
Ann
ual p
erce
nt c
hang
e
10.1
5.4
2.1 1.70.2 0.0
-1.5 -1.7
-10.1-15
-10
-5
0
5
10
15
Oil crop
s prim
ary
Cocoa
bean
s
Roots
and t
ubers
Fruit e
xcl m
elons
Vegeta
bles+
melons
Citrus
fruit
Coarse
grain
prim
ary
Cereals
Fibre c
rops p
rimary
Ann
ual p
erce
nt c
hang
e
Source: Bogetic, (2007), FAO Agricultural database
0
5
10
15
20
25
30
35
1988 1993 1998 2003 2006
Perc
ent
Stunting Underweight Wasted

17
III. Private Sector Development: The objective of strengthening the private sector capacity to function effectively as the engine of growth and poverty reduction is pursued through
• facilitating private sector access to long-term finance, • promoting entrepreneurial skills, • facilitating reduction of bottlenecks in private sector development, and • generation of employment.
The share of credit to the private sector has risen since 2000. Credit growth to the private sector has increased from 11% in 2001 to 94.9% in 2006 and this has raised its share of total credit during the period has risen from 59.6% in 2000 to about to 81.6% in September 2006. The reduction in domestic debt has also brought some relief to the private sector and contributed to the increase in credit to the sector. The increasing domestic credit has also been complemented by rising long-term external credit facilities. In order to reduce structural bottlenecks and stimulate investment in support of private sector-led growth, various institutional reforms in the financial sector, customs (through the introduction of GCNET and Export-Rays), legal system (introduction of the fast track court system and court computerisation), labour sector, land and Civil Service were undertaken. These measures led to some reduction in business costs and improvements in business environment. For instance, commercial bank lending interest rates have declined substantially from 47% in 2000 to about 22% in 2006. There has also been improvements in Ghana’s ranking in the ‘Doing Business’ index from 102nd in 2005 to 94th position out of 175 countries in 2006. The Bank of Ghana Composite Index of Economic Activities (CIEA), which is an index of eight economic indicators and measures the level of confidence of businesses in the economy, increased from 145% in 2005 to 160% in real terms in 2006. The country is now rated the second most peaceful nation in Africa and ranked the fastest reforming nation on the African continent and 9th in the world in doing business. Also Ghana is now rated among the top 10 reformers in the ease of doing business.
Figure 11: Ghana-Doing Business Indicators 2005-06 (Lower rank number represents better performance)
(Left axis = Ghana's ranking among 186 countries;
0
20
40
60
80
100
120
140
160
Starting business Registering property Employing
workers Closing business Dealing withlicences
Paying Taxes Trading acrossborders
Enforcingcontracts
20062005
Formatted: Font: 11 pt
Formatted: Font: 11 pt

18
Moreover, the improvement in the quality of Ghana’s economic policies has made the World Bank, in its country policy and institutional assessment, to raise Ghana’s ranking on the CPIA index of the quality of overall economic policies on 16 dimensions of performance from 3.5 (medium performer) in 1998 to 3.9 (strong performer) in 2005. These ratings thus put Ghana among the top 5 policy performers in the Sub-Saharan African region (Table 4). In confirmation of the of the its sustained track record in prudent economic management and good governance Ghana has now been given a B+ sovereign credit rating (since 2004) by Standard and Poors, Fitch Ratings and at par with countries like Turkey, Brazil and Indonesia, in terms of sovereign credit risk. The improved investment climate has also impacted positively on the flow of foreign investments into the country, with the FDI net inflow increasing by almost 200% in 2006 alone from US$144.97million in 2005 to US$434.50million in 2006.
Table 4: World Bank’s CPIA Index* (Economic Policies Quality) and Per Capita Growth of Selected Sub-Sahara African Countries (1998 -2005)
Source: World Bank WBI and CPIA sheets. * Country Policy and Institutional Assessment (CPIA) † Africa average GDP per capita growth excluded oil countries.
In spite of the significant progress made in developing the private sector a number of issues need to be resolved in order to enhance the performance of the sector. These include: i) inadequate access to finance, especially for women; ii) falling but still fairly high interest rates; iii) weak commercial dispute resolution system; iv) vulnerability and a large informal sector where the youth and women predominate; and v) weak linkages between the informal sector and the formal sector. IV. Enhanced Social Services The objective of this medium term priority is to enhance the delivery of social services taking into consideration the need to ensure locational equity and quality, particularly in the areas of education, water, sanitation and health services. The strategy emphasis on
UgandaAfrica Average
BeninBurkina FasoGhana Kenya MadagascarMaliMozambiqueRwandaSenegalTanzania
2005 1998-2005 2005 1998-2005 2005 1998-2005 1998-2005
CPIA overall
Annual change
Macro economic
management Annual change
Public Sector management
Annual change
GDP per capita
growth†3.7 1.0% 4.0 1.5% 3.4 1.2% 1.3%3.8 2.6% 4.5 4.5% 3.6 2.6% 1.2%3.9 0.9% 4.2 1.3% 3.7 0.8% 2.5%3.6 3.0% 4.2 7.0% 3.3 2.6% 0.3%3.5 2.8% 3.3 1.0% 3.4 5.3% 0.4%3.7 1.2% 4.3 1.9% 3.6 3.3% 2.9%3.5 0.3% 4.2 0.6% 3.2 0.9% 6.1%3.5 2.1% 3.5 2.7% 3.3 2.0% 1.1%3.8 0.7% 4.2 -0.8% 3.6 1.5% 2.3%3.9 1.6% 4.5 1.7% 3.8 2.3% 3.7%3.9 -0.6% 4.5 -0.9% 3.3 -0.3% 2.3%3.2 0.5% 3.4 -0.1% 3.1 0.8% 1.7%
Formatted: Justified

19
developing basic education as well as bridging the equity gaps in health care provision, outreach services and clinics in deprived rural and peri-urban areas. Considerable progress has been made in improving the basic output and impact indicators in health, education and water. This has been the result of increased budget allocations since 2001, which have very often exceeded budget projections. The percentage of total government expenditure (GOG + Donor) to the social services sector, increased from 30% in 2001 to about 48% in 2006 (Figure 12).
Figure 12: Resource Allocation to the Social Sector, (Percent) (2000 – 2006)
30.18
34.71
38.67 38.837.4
48
37.2
47.445.8
42.744.4
54.5
25
30
35
40
45
50
55
2001 2002 2003 2004 2005 2006
GOG & Donor GOG
A summary of the performance of the education sector is provided in Table 5 below. Indicators that experienced positive trends include primary and secondary enrolment for boys and girls, gender parity at both the primary and secondary schools and the pupil textbook ratio. Increased enrolment however was not matched by corresponding increases in the number of trained teachers. As a result the pupil teacher ratio increased marginally. Overall, there have been measurable improvements in educational infrastructure with increases in both public and private school facilities. In spite of the reforms gender, regional and rural/urban disparities in enrolment persist across different levels of education. For instance, the gender parity index is lower at the secondary level than at the primary level.

20
Table 5: Achievements of Basic Education Sector Indicators 1990 2000 2004 2005 Poverty headcount ( percent) 52 51.7 35 28.5 Primary completion rate ( percent) 47 48 Gross Primary Enrolment Ratio (GPER) ( percent) 76.00 81.00 86.30 87.50 Gross Primary Enrolment Ratio for Girls ( percent) 67.00 74.00 83.10 84.40 Gender Parity Index (GPI) 1 0.78 0.88 0.93 0.95* Pupil – Teacher Ratio 34:1 35:1 Pupil: Core Textbook Ratio 1:0.5 1:0.3 % of Trained Teachers in Primary Schools ( percent) 76% 73.90% 72.40% Access to safe water ( percent) 54 56 Access to sanitation ( percent) 21 35
In the health sector some progress has been recorded although significant challenges remain (Table 6). Despite improvements in a number of input indicators (e.g., number of health facilities, immunization, access to health care services and incidence of hospital deliveries), impact indicators such as maternal and child mortality appear not to have changed very much. This may reflect lags between interventions and outcomes and/or improved reporting as a result of increased sensitization to health issues.
Table 6: Achievements of Basic Health Sector Indicators against Targets Indicators 1990 2000 2003 2004 2005 Infant mortality Per 1000 77 57 64 N/A N/A Under five mortality (per 1,000) 122 108 111 112 111 Child Malnutrition Percent 35.80% N/A N/A Immunization Coverage (Penta 3) Percent 76.00% 75.00% 85.00% Neo-Natal Mortality Per 1000 48 38 47.00% 49.00% 52.00% Maternal mortality 100,000 740 540 503 Proportion of supervised deliveries Percent 46% 51.90% 53.40% 54.10% % increase in health expenditure to total government expenditure Percent 11.80% 12.00% 11.20% Access to safe water ( percent) 54 56 55.00% Access to sanitation ( percent) 21 35 32.00% % of rural population with access to safe water sources Percent 45.5 47.70% 51.70% 52.00% Incidence of Guinea Worm cases 8,290 7,275 3,944 Stunting 26.5 27 30 32 33 Underweight Percent 26 25 22 21 20 Wasted Percent 12 10 7 7 6
V. Good Governance Good governance is critical for ensuring the success of the GPRS II and securing the gains of the recent past. Accordingly, GPRS delineated priority areas of good governance to include public sector reform (PSR), decentralisation, promotion of security and the rule

21
of law. Since the new millennium the government has implemented several policies and measures to achieve the set objectives of the various priority areas of good governance. A summary of country achievements resulting from the implementation of these objectives is provided as follows: Public Sector Reform: The key objective of this initiative is to reorient central government structures, organisations and functions with the view to making them more efficient, effective, and private sector-friendly. A significant achievement in this direction is the enhancement of the regulatory and legal environment to support transparency and accountability in public financial administration including improved auditing and public procurement. The passage of the following three important laws, namely;
♦ Financial Administration Act 2003, Act 654; ♦ Internal Audit Agency Act 2003, Act 658 and ♦ Public Procurement Act 2003, Act 663,
(all in 2003), is a major contribution to the attainment of this objective. Together with the Whistleblowers Act these laws aim to strengthen the fight against corruption. The administration of justice has also improved with successful computerisation and introduction of Fast Track Courts and augmentation of staff and capacity building of personnel in Performance Management, Alternative Dispute Resolution, Court Automation, Case Management and Change Management. In addition to these, civil society initiated a number of interventions. The Ghana Anti-Corruption Coalition, for instance, undertook a number of activities on creating public awareness on the negative impact of corruption on poverty reduction. The capacity of the Office of the Attorney General and the judiciary has been strengthened in terms of numbers of qualified staff, technology, training and equipment to ensure the rule of law. In line with its resolve to fight corruption the government has strengthened state institutions established to ensure public transparency and accountability in resource generation, allocation and management, and fraud detection, including the Police, Serious Fraud Office, Commission on Human Right and Administrative Justice (CHRAJ) and the Office of Accountability in the Presidency. In the area of strengthening law enforcement, the Police Service, has, since 2000, received significant support in the form of personnel and logistics to enhance their operations and effectiveness. Police-citizen ratio has improved substantially with the annual recruitment of about 2000 new police officers, but their fleet of patrol vehicles has greatly been expanded from a low figure of 100 in 2000 to over 2000 by the end of 2006. Collaboration of the police with civil society in the maintenance of law and order has also improved through the formation and training of Neighbourhood Watch Committees nationwide. The result is a decline in the incidence of crime by 15.7% between 2004 and 2005, with the level of commonly committed crimes such as rape, declining by 24.5% in 2005 as compared to 34% in the previous year. Decentralisation: Appreciable progress has been made in fiscal, administrative and political empowerment at the sub-national levels through increased resource allocations

22
from a diversity of central government sources. To enhance the capacity of the local government to deliver on their mandate, a new Local Government Service Act is being operationalised. In view of the weak nature policy framework that had impeded the implementation of the decentralisation programme a National Decentralisation Action Plan (NDAP) has been developed. Under this plan a number of reforms in the areas of administrative and fiscal decentralisation have been initiated including:
• Fixing rates generally and gazetting them. • Setting performance targets for the leadership of MMDAs and involving them in
the monitoring of the system; • Rotating revenue collectors every six months • Ensuring security of value books • Forging partnership between Metropolitan and Municipal Assemblies,
commercial banks and the private sector for the collection of local government revenues.
The results of these specific strategies are reflected in the increase in internally generated revenue from a maximum of 14% to 65% during 2006.
Security and Rule of Law: The provision of security and strengthening of the rule of law has benefited from rising government support. This support has enabled most state institutions such as the judiciary, police service, CHRAG to recruit additional officers, increase its equipment and logistical base. As a result of the increasing support the Ministry of Justice and Attorney General’s Department, for instance, has been able to organise legal aid clinics, and expedite action on the handling of cases in court, especially for the poor and disadvantaged. The National Commission on Civic Education and Parliament has also been able to mount educational campaigns on civic responsibilities and on government policies.
5.3 Reinforcing Commitment to Good Governance – The Africa Peer Review
Mechanism (APRM) A critical action taken by government to reinforce and demonstrate its commitment to improving governance is its decision to accede to the Africa Peer Review Mechanism (APRM). It is an initiative of African countries to institutionalise good governance practices in the body politic. Under the mechanism countries voluntarily submit themselves to be peer reviewed on the basis of internationally accepted governance indicators of both promoting democracy and the rule of law. The APRM serves as an instrument which African countries use to self-monitor their performance of agreed political, economic and corporate governance values, codes and standards, with the primary purpose to achieve political stability, high economic growth, sustainable development and accelerated sub-regional and continental economic integration. The key parameters of improve governance adopted in the APRM are highly consistent with the thematic pillars of the GPRS I & II. Consequently the policies and

23
recommendations emanating from the APRM have been effectively mainstreamed in the GPRS and aligned to the appropriate thematic areas to enhance the quality of national development framework. The APRM process consists of several inter-related stages of which Ghana has successfully completed including:
becoming one of the first countries to constitute a National Governing Council in 2004 to conduct an independent self-assessment of its governance record in the four APRM focus areas: Democracy and Political Governance; Economic Governance and Management; Corporate Governance; and Socio-Economic Development.
undergoing a successful APRM review became the first to produce a comprehensive Country Self-Assessment Report;
becoming the first African country to receive an independent APRM Panel of Experts to assess its APRM country reports prepared by the country’s technical advisory teams;
the President was among the first 2 Heads of State to be invited to APRM Peer Review Forum of participating African Heads of State on the basis of the country assessment, and to submit a final consolidated self-assessment report (Country Review Report);
producing an APRM Programme of Action to address institutional and other weaknesses highlighted in the assessment report.
hitherto submitting two bi-annual Progress Reports, to the APR Panel as part of the National African Peer Review Mechanism – Governing Council’s statutory obligation on the progress of implementation of the National Programme of Action. The essence of these reports is to (1) obtain feedback from government (through the Ministries, Departments and Agencies) on the progress made in the implementation of the Programme of Action, and (2) to obtain feedback from CSOs, citizens and experts about the extent to which the implementation of the national Programme of Action is improving governance and their socio-economic well-being.
According to the second annual PoA progress report of January 2007, there is considerable achievement in most of the key indicators under all the thematic areas of APRM namely political and democracy governance; economic management; corporate governance; and socio-economic development. These have further deepened the governance environment and led to a strengthening of the political stability of the country, as reflected in improvements in Ghana’s international ranking as the 2nd most peaceful country in Africa.

24
5.4 Progress towards the Achievements of the MDGs Poverty Reduction and MDGs: Over the last 15 years Ghana has managed to reduce poverty levels significantly by an annual average rate of 1.5% per year, from high of 51.7% in 1991/92 to 39.5% in 1998/99 and then further to 28.5% in 2005/6 (GLSS 5). The accelerated economic growth and poverty reduction put the country en route to achieving the key poverty Millennium Development Goal (MDG) well ahead of schedule (figure 9). Other gains apart from poverty reduction in Ghana coupled with the improved economic environment, have been the marked improvement in the availability and access indicators of hunger (food security). The decline in poverty and extreme poverty between 1998/99 and 2005/2006 was more evenly distributed than in the earlier period of 1991/92 to 1998/99. Almost all the localities and regions with the exception of the city of Accra and Upper West Region experienced declines in poverty. The Central Region, which had experienced an increase in poverty during the nineties, registered the largest decline in poverty from 48.4% in 1998/9 to 19.9% 2005/6 (Figure 13).
Figure 13: Comparison of Poverty Rates in Ghana and Sub-Sahara Africa,
1991/2-2005/2006
25
30
35
40
45
50
55
1991/92 1998/9 2005/6
%
SSA Ghana
25
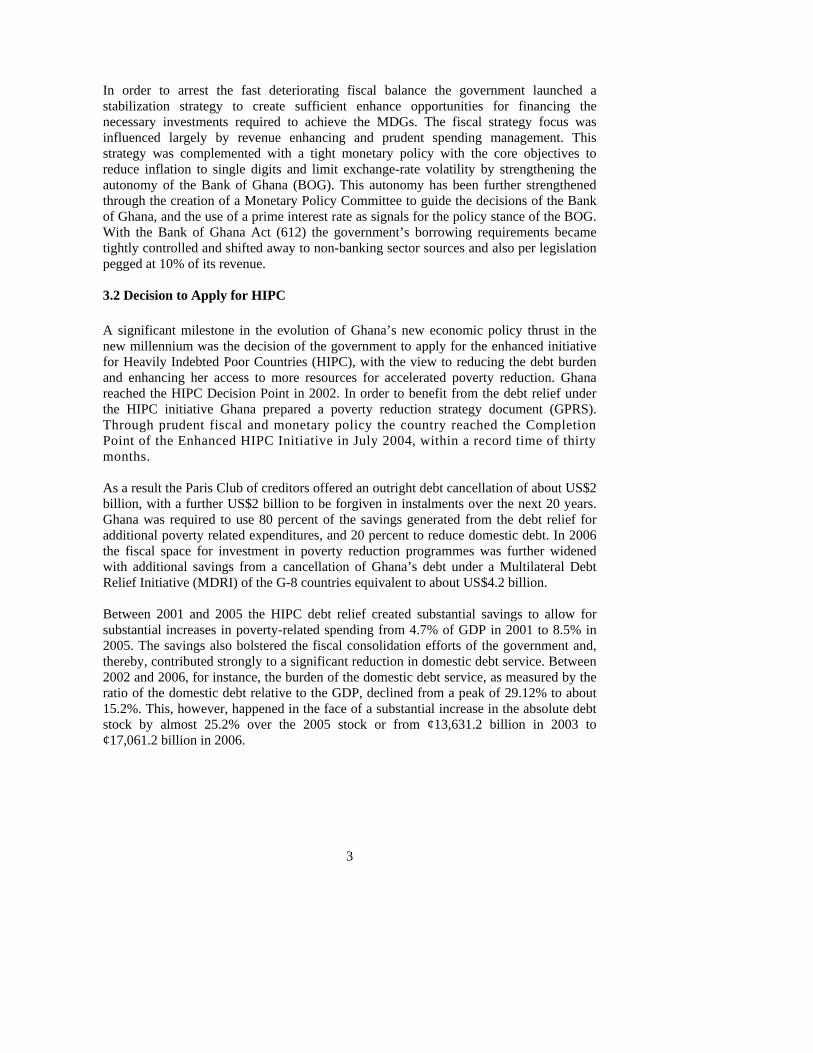
Figure 14: Pattern and Trends of Poverty According to Regions, 1991/92 - 2005/06
0
10
20
30
40
50
60
70
80
90Pe
rcen
t
Western Central GreaterAccra
Eastern Volta Ashanti Brong-Ahafo
Northern UpperWest
UpperEast
Urban Rural Total
1991/92 1998/99 2005/2006
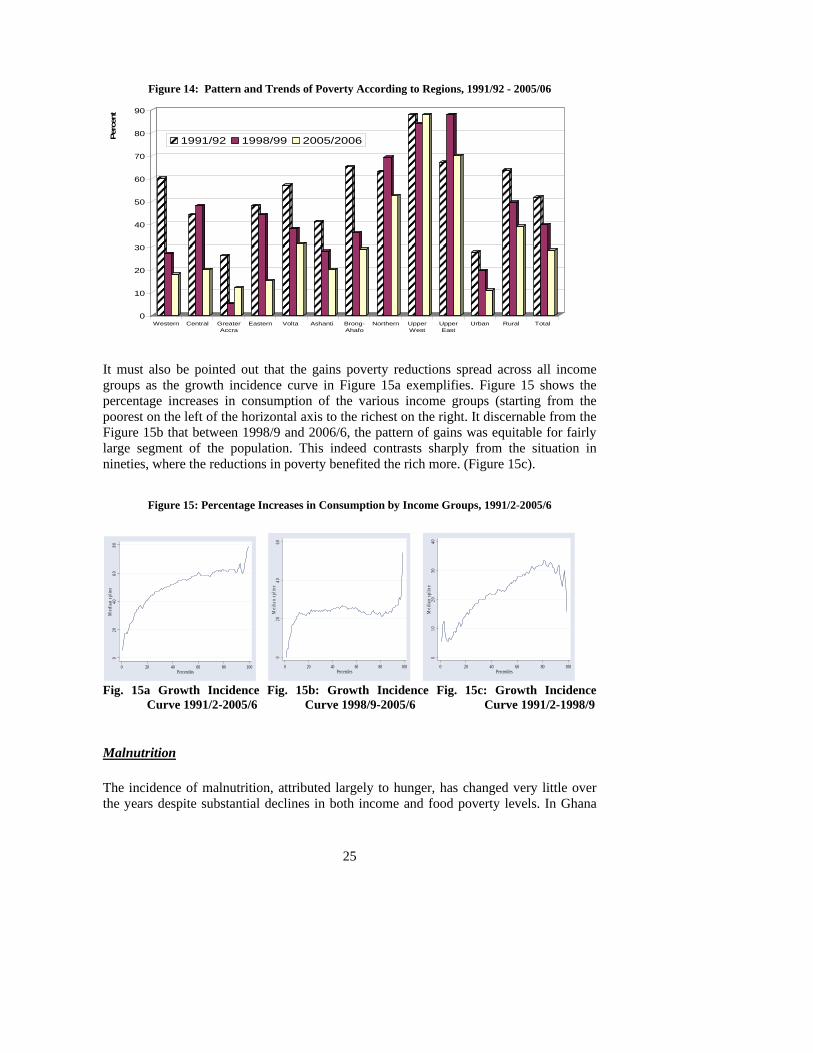
It must also be pointed out that the gains poverty reductions spread across all income groups as the growth incidence curve in Figure 15a exemplifies. Figure 15 shows the percentage increases in consumption of the various income groups (starting from the poorest on the left of the horizontal axis to the richest on the right. It discernable from the Figure 15b that between 1998/9 and 2006/6, the pattern of gains was equitable for fairly large segment of the population. This indeed contrasts sharply from the situation in nineties, where the reductions in poverty benefited the rich more. (Figure 15c).
Figure 15: Percentage Increases in Consumption by Income Groups, 1991/2-2005/6
020
4060
80M
edia
n sp
line
0 20 40 60 80 100Percentiles
020
4060
Med
ian
splin
e
0 20 40 60 80 100Percentiles
010
2030
40M
edia
n sp
line
0 20 40 60 80 100Percentiles
Fig. 15a Growth Incidence Fig. 15b: Growth Incidence Fig. 15c: Growth Incidence Curve 1991/2-2005/6 Curve 1998/9-2005/6 Curve 1991/2-1998/9
Malnutrition The incidence of malnutrition, attributed largely to hunger, has changed very little over the years despite substantial declines in both income and food poverty levels. In Ghana

26
almost 23% of children aged 0-35 months are considered to suffer from stunting, with about 18% and 5% suffering from underweight and wasting respectively in 2005. This is an improvement over the 2003 levels of 29.9%, 22.1% and 7.1% respectively. Nationwide, about 55% of mortality in children is associated with malnutrition. There are, however, wide geographical differences. Childhood malnutrition is lower, for instance, in Accra than in rural areas of Ghana but is still high, and close to 18% of children younger than three years of age suffer from low height-for-age. Protein energy malnutrition is the commonest nutritional disorder in children. However under the ongoing micronutrient deficiency control programme, the Vitamin A supplementation (VAS) achieved a national coverage of 98.6% in 2005. Achieve Universal Access to Primary Education: The goal requires governments to ensure that by 2015, children (both boys and girls) everywhere will be able to complete a full course of primary schooling. The government of Ghana sought to achieve this goal by providing a constitutional legal backing and included it in its constitution as a legal requirement in 1992. Since then attempts to achieve this goal have included a major restructuring of the first and second cycle education in 1987 which reduced its duration from 17 years to 15 years. This was followed by a concept of free and compulsory basic education for every child of school going age to be realised through the introduction of a Free Compulsory Basic Education programme (fCUBE). To ensure the achievement of MDG 2 government developed and launched the Education Strategic Plan (ESP) in 2003 to facilitate among other things, the attainment of the targets of Universal Primary Completion earlier than the target year of 2015, and Gender Parity in schools by the end 2008. An important policy measure to enhance basic school enrolment was the provision of capitation grant programme, meant to make basic school free from any form of school fees. This has also been augmented by a school feeding programme to enhance the nutritional status of school children and promote access, retention and quality of education. To augment the supply of teachers in the remote areas and deprived districts, Local Governments (i.e. District Assemblies) have been made to sponsor trainee teachers who are expected to be posted back after training to the various districts that sponsored them. In order to ensure equity in the distribution of textbooks so as to improve quality of teaching and learning, the Ministry of education has initiated a textbook policy ratio of 1:1 in the three core subjects (English, Mathematics and Integrated Science), for all basic schools in the country. As a result of these efforts some progress has been made towards the achievement of the MDG 2. Gross enrolment ratio has increased from 86.3% in 2003 to 93.7% in 2006.

27
Promote Gender Equality and Empower Women: Ghana aims at a Gender Parity Index (GPI) of 1 for all levels of education and training both under the MDGs and the Education Sector Strategic Plan (ESSP). Female participation in education has improved remarkably over the period with the attainment of a gender parity index in primary education of 0.96 (2006/2007) from 0.93 (2003/2004). On the whole, gender parity has improved more rapidly at the primary level than at junior and senior secondary school levels. This was achieved through special programmes targeted at the girl child. In some cases direct transfers are made to girls in the form of cash or support in kind by both government and non-governmental organizations. In spite of progress achieved there is the need to accelerate the pace of implementing policies and programmes targeted at promoting gender parity in education at all levels. The drop out rate of girls from school is still higher than that of boys. While about 47% of boys enter the secondary education after the basic education level, only 38% of girls do so. Illiteracy rate is not only higher among females in Ghana than males, the rate of change is very low and slow. Consequently one out of every three young women aged 15-24 still remains illiterate. Opportunities for females to enter public life and politics still remain limited. Prior to the recent adoption of affirmative action measures, (, there were only a few females in top positions. Of the 230 parliamentarians, less than 11% are females. Reduce Child Mortality: Ghana has prioritised child and maternal health care in its development policy framework. Budgetary allocations to the health sector have increased significantly. Progress in the reduction of under five mortality have been however very slow with a reduction rate of 111 per 1000 births in 2005 against 155 per 1000 births in 1987. Current trends indicate that by 2015 under five mortality will be about 80 per 1000 births. Given the current trends it is unlikely that the goal will be achieved unless efforts are intensify to strengthen the supportive environment.
Figure. 16: Child Mortality Indicators in Ghana, 1980 -2003

28
Improve Maternal Health: Various interventions have been initiated to improve maternal health and reduce the high level of maternal mortality. A list of selected health interventions aimed at reducing maternal mortality includes the following:
• Safe-Motherhood Initiative • Ghana VAST Survival Programme • Maternal Health Project • Prevention Maternal Mortality Programme (PMM) • Making Pregnancy Safer Initiative • Prevention and Management of Safe Abortion Programme • Intermittent Preventive Treatment (IPT) • Maternal and Neonatal Health Programme • Roll Back Malaria Programme
These interventions have led to improvements in a number of maternal health indicators as Figure 17 indicates. Yet maternal mortality remains very high and appears to have declined by only a quarter between 1990 and 2000 (between 740 – 540). With this slow performance it appears that the goal of improving maternal health by way of reducing maternal mortality rate by three quarters by 2015 may not be achieved.
Figure. 17: Trends in safe motherhood interventions, 1998 – 2003
Combat HIV/AID: HIV/AIDS is a major impediment to efforts to achieve the MDGs. Although the prevalence rate in Ghana is low compared to other African countries, government considers the disease a serious threat to economic and social development. Accordingly, measures have been put in place to contain its spread. Actions in this area predate the MDGs. For example, the government established a National Advisory Commission on AIDS in 1985, followed by the National AIDS Control Programme in 1987 and multi-

29
sectoral Ghana AIDS Commission in 2000. The Commission coordinates the involvement of all public and private sector stakeholders in combating the epidemic. The commission has developed two rolling HIV/AIDS Strategic Frameworks (2001-2005 and 2006-2009) to deal with issues concerning recent evolutions of the epidemic, the social forces driving the epidemic, and the socio-cultural environment. To ensure a proper and co-ordinated implementation of the national response a Programme of Work (POW) has been developed for the period 2006-2010 on the basis of some intervention areas identified in the NSF II. The government has also designated certain priority interventions, concerning prevention of new infections aimed at promoting safe sex (BCC), condom promotion, and management of STDs, blood safety, and infection control. A secondary set of activities are supposed to focus on HIV/AIDS management (care for people living with AIDS (PLWHA)) and integration of VCT and PMTCT into service provision. Other activities include interventions to reduce morbidity and mortality, strengthening of the health system for the provision of ART, care and support for people infected and affected by HIV/AIDS, counselling and home-based care, etc. To enhance competency and achieve results, guidelines (Guidelines on Anti-Retroviral Therapy and guidelines on the management of opportunistic Infections) for the management of HIV/AIDS and other opportunistic infections have been prepared. A set of activities are also aimed at treatment and vaccines. The government initiated in 2003 a Support Treatment and Anti Retroviral Therapy (START) in three sites to provide anti-retroviral drugs, in addition to Voluntary Counselling and Testing (VCT) and community sensitisation. These efforts have led to a reduction in the prevalence rate from 3.9% in 2000 to about 3.2% in 2006. According to the latest estimates in mid 2006 about 7,338 people were receiving ART (7070 adults and 268 children). VCT service users are charged 5,000 cedis and ART and laboratory examinations require a 50,000 cedis monthly contribution from patients. PMTCT, the treatment of certain opportunistic infections and CD4 tests are provided free of charge. Halt and Reverse Incidence of Malaria: Malaria in Ghana is the single most important cause of mortality and morbidity especially among children under five years and pregnant women. It accounts for about 44.5% of all outpatient illnesses, 36.9% of all admissions and 19% of all deaths in health institutions in Ghana. The disease is responsible for a substantial number of miscarriages and low birth weight babies among pregnant women. Among this group, malaria accounts for 13.8% of Out Patient Department (OPD) attendance, 10.6% of admissions and 9.4% of deaths. About 800,000 children under the age of five die from malaria every year. A new strategic National Malaria Control Programme (NMCP) has recently been initiated in the country to promote the use and availability of Insecticide Treated Nets (ITNs) through state-private sector partnership. This programme aims to reduce mortality and morbidity due to malaria by 25% by 2008 through improved case management,

30
implementation of multiple prevention methods, focused research and improved partnerships. As a result the use of ITNs has gone up substantially from 3.5% in 2002 for children less than 5 years of age to 35.6% in 2006 and from 2.7% of pregnant women to 32.7% during this period. This has also helped to raise Intermittent Preventive Treatment (IPT) coverage in pregnancy to improve from 20% midyear 2004 to 51% midyear 2005. Apart from these, there are increased efforts to enhance malaria prevention, through the promotion of chemoprophylaxis for pregnant women and improving environmental sanitation. In addition 2005 a new Anti-Malaria Drug Policy, Artesunate-Amodiaquine, was initiated and expanded into all the 138 districts of the country. The government has also adopted measures to improve malaria case management, through the preparation of treatment protocols. Ensure Environmental Sustainability Principles of sustainable development have been integrated into the country’s development framework. Indeed in 2003, the Environmental Protection Agency collaborated with the National Development Planning Commission in conducting a Strategic Environmental Assessment on the medium term development (GPRS) to holistically address issues related to environmental sustainability. The objectives are:
• to ensure that sustainable development principles are integrated into all development policies, plans, programmes and project.
• that development programmes and projects are consistent with the realisation of the MDG of sustainable development
A major challenge to formulating sustainable environmental programmes is the ability to balance genuine environmental concerns with the economic imperatives of stakeholders. Such tensions underline the operational difficulties in achieving effective enforcement. In effect, compliance with environmental laws is more likely to improve when such laws do not impose undue hardship on affected parties. The on-going community water and sanitation programme involving the state, development partners and non-governmental organizations has contributed immensely to improving safe water supply to households in Ghana. In addition, various poverty reduction programmes that are being implemented (e.g. GPRS I and II) and also on-going public health campaigns and non-formal education programmes, are expected to help households to improve their hygiene and sanitation practices to reduce the incidence of water borne and environmentally-related diseases. By 2006 78% of the population had access to safe drinking water (including 91% of urban dwellers and 69% of rural dwellers). But regularity and quality of supply are not guaranteed especially in urban areas, due to frequent water shortage and storage in unhygienic containers. An assessment of progress made towards improving sanitation is seriously compromised by the absence of adequate data. The most reliable data was sourced from the result of the

31
2003 Core Welfare Indicator Questionnaire (CWIQ) which indicates that only 55% of the population had access to adequate sanitation with marked regional variations. In this direction there is the need to set up a system to collect adequate data on sanitation on a regular basis. Within this framework, a national study should be conducted to establish the necessary baseline data to support the assessment of the status of progress towards the provision of adequate sanitation in rural and urban communities. Global Partnership for Development Strengthening of the partnership between Ghana and the Development Partners remains central to the formulation, implementation and monitoring of Ghana’s national development strategies. The partnership has evolved through sector dialogues, CG meetings and country review missions. As a consequence of these processes Ghana was among the first countries, to pilot a Comprehensive Development Framework (CDF) in 1999. Against the background of improved partnership the Consultative Group meetings were moved from the traditional location in Paris to Accra to facilitate participation of civil society and the private sector. As part of the deepening process in the donor-government relations regular meetings have also been introduced at the sectoral levels by the government for the Sectoral Partner Groups (SPGs). These meetings, usually led by national agencies, have discussed clearly defined focal points needing support from specific development partners. Overall, improved donor-government partnership has facilitated a shift activity-based to a results-oriented approach to aid delivery and management, which has contributed to change in the aid architecture of aid in Ghana. A very important new dimension was added to the partnership when in 2003, 9 development partners agreed to establish a direct budget support system: the Multi-Donor Budget Support (MDBS) system. The mechanism has since its initiation provided a forum for policy dialogue on strategic reforms for almost all development partners. This arrangement represents a shift from a sectoral, project-driven approach towards a national partnership based on direct budget support. Through the processes donors have agreed to a common disbursement schedule that has enhanced aid harmonisation and contributed to a common mechanism for the disbursement of budget support. The Ghana MDBS has brought some important innovations through the establishment of a two tranche system of disbursement as well as the creation of a common structure for dialogue between the MDBS partners and government, based on a programme of twice-yearly substantive discussions, including a formal annual progress assessment. It also has an agreed disbursement schedule which is explicitly linked to the budget cycle as well as an agreed common set of benchmarks for judging progress, based on a Performance Assessment Framework (PAF) matrix. A recent innovation that has taken the

32
government-development partner relations to a new higher level is the Joint Assistance Strategy (G-JAS), which has jointly been prepared by the World Bank and some 15 other development partners, which offer more than 90 percent of official development assistance to Ghana. This joint strategy has the prime objective to deepen the partnership framework and commitments to joint working, through the use of an annual harmonization action plan to move this agenda forward on a day-to-day basis. In 2005, Ghana’s relationship with its development partners was given a new boost when the country signed on to the Paris Declaration on Aid Effectiveness. The declaration essentially formalized the relationship between development partners and aid recipients by explicitly outlining the roles and responsibilities of both parties. The principles underlying the Paris Declaration include:
• strengthening country’s ownership of the development process, • ensuring the alignment of development partner support to national priorities, • ensuring harmonisation of donor procedures and country systems • managing resources on the basis of agreed results and use information to improve
decision making. • ensuring mutual accountability in relation to resource flow and results achieved
through the implementation of national strategy Strengthening country’s ownership of the development process: Ownership is critical to achieving development outcomes and is central to the Paris Declaration which is the main framework for the current partnership. In 2005, the Cabinet of Ghana approved the GPRS II as the medium term strategy for the period 2006 – 2009. The sector and the local governments derive their respective medium term plans from it. By this process the government takes over the overall leadership of the development process as well as the coordination of donor assistance towards implementation of the development policy framework. NDPC in collaboration with the Ministry of Finance and Economic Planning (MOFEP) coordinate the implementation, and monitoring of the GPRS. The implementation of the GPRS has been regularly discussed at ministerial and Cabinet levels, while the Parliamentary Sub-Committee on Poverty provide the oversight responsibility for the implementation of the GPRS II. There is a sustainable structure for continuing government stakeholder dialogue. At the National level, there are National Inter-agency Poverty Groups, which include government representatives, CSOs and development partners to oversee the monitoring of the GPRS implementation. At the sub-national level, there are regional Poverty Groups in all regions of the country, which build on and enhance the existing Regional Planning Coordinating Units, by including the regional heads of the Ghana Statistical Service, regional government representatives, CSOs and representative of regional house of chiefs.

33
In addition sector working groups within the MDBS framework have been established to provide opportunity for further dialogue on key policy issues. Currently 18 sector working groups, partly comprising of sector ministries and external partners have been established. Some of the sector working groups are well established (agriculture, health, HIV/AIDs, Education, Roads, Water), while others are more informal and adhoc in nature. A joint GOG-Donor working group has agreed on a set of actions to be taken to standardize the functions of sector working groups, increase their effectiveness and strengthen the links with national process. Ensuring the Alignment of Development Partner Support on National Priority: Ghana’s Poverty Reduction Strategy provides the framework for donor coordination and alignment. With the exception of few, most donors continue to identify the GPRS as the main framework on which their planning is based. The Ghana Partnership Strategy which was agreed upon at the November 2005 CG also reinforces the alignment. It includes a results matrix that spells out how external partners’ activities are aligned with the GPRS. Building on this, work has been completed on the preparation of a Ghana Joint Assistance Strategy (G-JAS) for 2007-10. The World Bank, European Commission, African Development Bank, United Kingdom and Netherlands intend to integrate their development co-operation country strategies fully with the Ghana Joint Assistance Strategy, while Canada, France, Germany, Switzerland, United States and Japan, as well as the UN agencies, with different programming cycles, expect to be closely associated with it. One of the obstacles to this arrangement is the difficulty of reflecting donor financial commitments fully and accurately in the national budget. Capacity constraints significantly undermine the ability of country systems to capture and co-ordinate aid flows more effectively. The Paris Declaration commits donors to providing more coordinated support to capacity development under country leadership, with a target of 50% provided in this form by 2010. However available information indicates that currently 40% of reported technical assistance is considered coordinated. Ensuring Harmonisation of Donor Procedures and Country Systems: In Ghana, project funding does not use the national budget execution system. After the signature of credit agreement or financing agreement, a stand-alone account is opened in any commercial bank with government-authorised signatories. The Controller and Accountant General usually requests that the Bank of Ghana open the account. The project management unit operates the account. After a draw-down of revolving funds which are credited to the account, they make direct request for replenishment. The account is not linked to the consolidated fund and therefore the funds are captured outside the budget framework and controlled between the project management unit and the donor supporting the project. However there appear to be an emerging donor consensus on aspects of aid harmonisation. Donors who are providing support to the government sector are harmonising programme-based approaches (PBAs) and sharing missions and analytical

34
work. This has provided a platform for actions to reduce aid fragmentation through specialisation and delegation, and improve internal incentives for collaborative behaviour. The proportion of reported government sector aid using PBAs and hence employing common arrangements is currently reported as 53%, reflecting almost equal volumes of direct budget support and support to joint programmes within particular sectors.
The MDBS programme was initiated by 14 bilateral and multilateral agencies in 2003 and the various Sector-Wide Approaches (SWAps) have further deepened this process of harmonisation. The Netherlands channels approximately 70% of its development assistance through sectoral and general budget support, while the United Kingdom disburses about 50% as general budget support and 25% through sector-wide approaches. The World Bank now provides approximately 40% of its new lending as budget support. These modalities point to an intensive use of country budget execution and financial reporting systems and, to a lesser extent, country audit systems as well. Available information indicates that, 52% of aid for the government sector made use of Ghana’s procurement system. This may reflect a positive trend initiated with the 2003 procurement law in which external partners increasingly rely on procurement systems. It also underlines the importance of direct budget support; all MDBS funds are subject to national procurement rules. Managing Resources on the Basis of Agreed Results: The Paris Declaration urges partner countries and donors to work together to manage resources on the basis of desired results, and to use information to improve decision making. This means strengthening the capacity to undertake such management and helping to increase the demand for a focus on results. Currently the availability and quality of poverty-related data are improving in Ghana. The formulation of GPRS II was guided by the series of surveys and censuses carried out by the Ghana Statistical Service and its partners, including a new Demographic and Health Survey, and a Poverty and Social Impact Analysis. However, there is more of a problem with data on intermediate outcomes because different ministries and agencies use different data collection systems, creating inconsistencies and time lags. These data limitations are reflected in the timeliness and the quality of the Annual Progress Reports (APRs) of the implementation of the GPRS, are widely disseminated by the National Development Planning Commission, with outreach activities including radio discussions. Effort is currently in progress to harmonise these processes and strengthen the existing system. The National Development Commission (NDPC) has currently developed technical Guidelines to assist sectors and District Assemblies (sub-national government) to formulate their respective M&E plans. This M&E plan is expected to help them develop monitor the implementation of their respective plans more effectively through the development of common indicators.

35
Ensuring Mutual Accountability in Relation to Resource Flow and Results Achieve: The current partnership arrangement between Ghana and its development partners calls for each other to be accountable to each other for the use of development resources, and in a way that strengthens public support for national policies and development assistance. This in turn requires government to improve country accountability systems and donors to be transparent about their own contributions. At the November 2005 CG meeting, the government and external partners agreed on an Aid Harmonisation and Effectiveness Matrix, which sets out country outcomes for each of the 12 Paris Declaration indicators and actions which the government and partners will undertake to achieve them. A core working group (composed of two government officials and a representative set of multilateral and bilateral donors) identified individual agencies to spearhead actions in different fields of aid effectiveness. The group meets monthly to monitor progress. Improved Government and Donor Partnership has defined the current Aid architecture in Ghana with mutual benefits to both parties. For Ghana the new relations have contributed to increased technical and financial support for the implementation of the GPRS from both bilateral and multilateral donors. In absolute terms, the MDBS has accounted for an average of about US $300 million on an annual basis. A close look at the ODA flows to Ghana shows that project aid to finance the GPRS experienced successive substantial increases over the GPRS I period of 2003-2005, whereas programme aid witness successive declines over the same period. As can be seen in Figure 18 the relative levels of both types of aid, in spite of the different trends, remained relatively higher than their levels in the second half of the nineties. 2001, for instance, witnessed an unprecedented high level of ODA disbursements to Ghana in the form of project and programme funding. Available information from OECD-DAC shows that ODA flows to Ghana steadily increased (in real terms) to reached a peak of 18 % of Gross National Income in 2004. It must be pointed out that OECD-DAC data are based on financial commitments by development agencies and are generally substantially in excess of ODA receipts as recorded in-country. In 2005, for instance, ODA receipts by GoG were estimated by the MoFEP’s Aid & Debt Management Unit to have reached in excess of US $ 1 billion, equivalent to 9% of GDP. Accounting for a significant proportion of the total flows was programme aid, which included HIPC debt relief and MDBS disbursements.
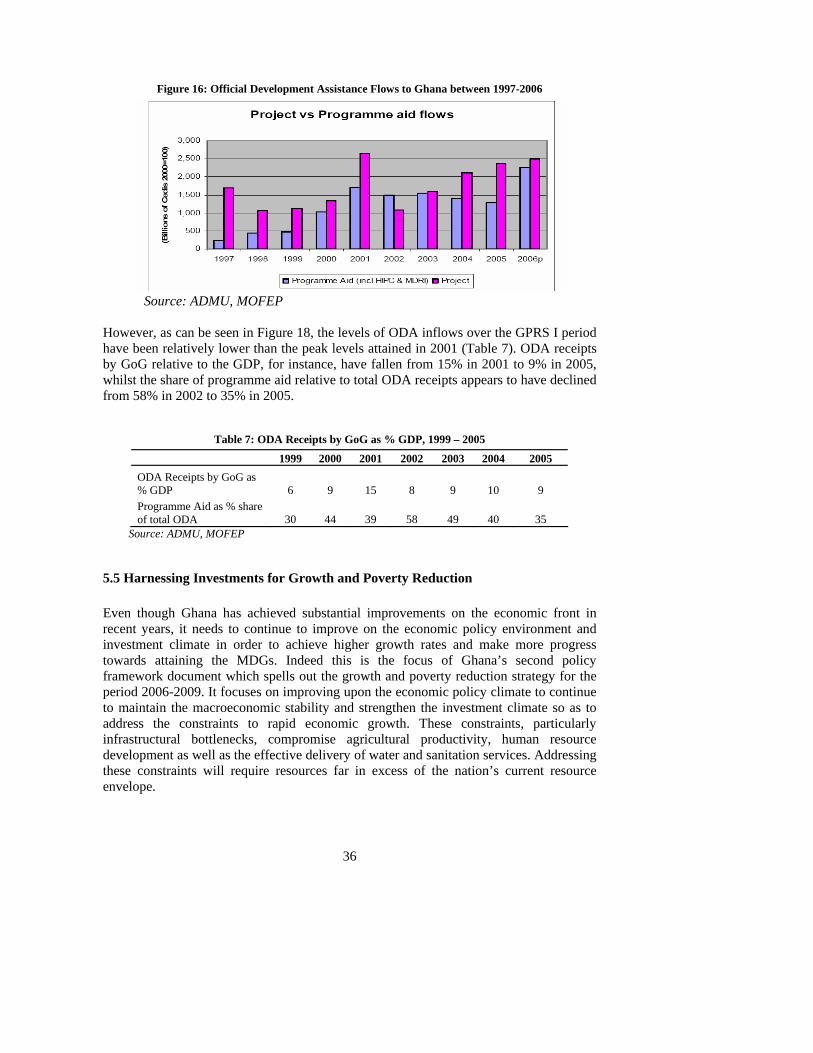
36
Figure 16: Official Development Assistance Flows to Ghana between 1997-2006
Source: ADMU, MOFEP
However, as can be seen in Figure 18, the levels of ODA inflows over the GPRS I period have been relatively lower than the peak levels attained in 2001 (Table 7). ODA receipts by GoG relative to the GDP, for instance, have fallen from 15% in 2001 to 9% in 2005, whilst the share of programme aid relative to total ODA receipts appears to have declined from 58% in 2002 to 35% in 2005.
Table 7: ODA Receipts by GoG as % GDP, 1999 – 2005
1999 2000 2001 2002 2003 2004 2005 ODA Receipts by GoG as % GDP 6 9 15 8 9 10 9 Programme Aid as % share of total ODA 30 44 39 58 49 40 35
Source: ADMU, MOFEP
5.5 Harnessing Investments for Growth and Poverty Reduction Even though Ghana has achieved substantial improvements on the economic front in recent years, it needs to continue to improve on the economic policy environment and investment climate in order to achieve higher growth rates and make more progress towards attaining the MDGs. Indeed this is the focus of Ghana’s second policy framework document which spells out the growth and poverty reduction strategy for the period 2006-2009. It focuses on improving upon the economic policy climate to continue to maintain the macroeconomic stability and strengthen the investment climate so as to address the constraints to rapid economic growth. These constraints, particularly infrastructural bottlenecks, compromise agricultural productivity, human resource development as well as the effective delivery of water and sanitation services. Addressing these constraints will require resources far in excess of the nation’s current resource envelope.
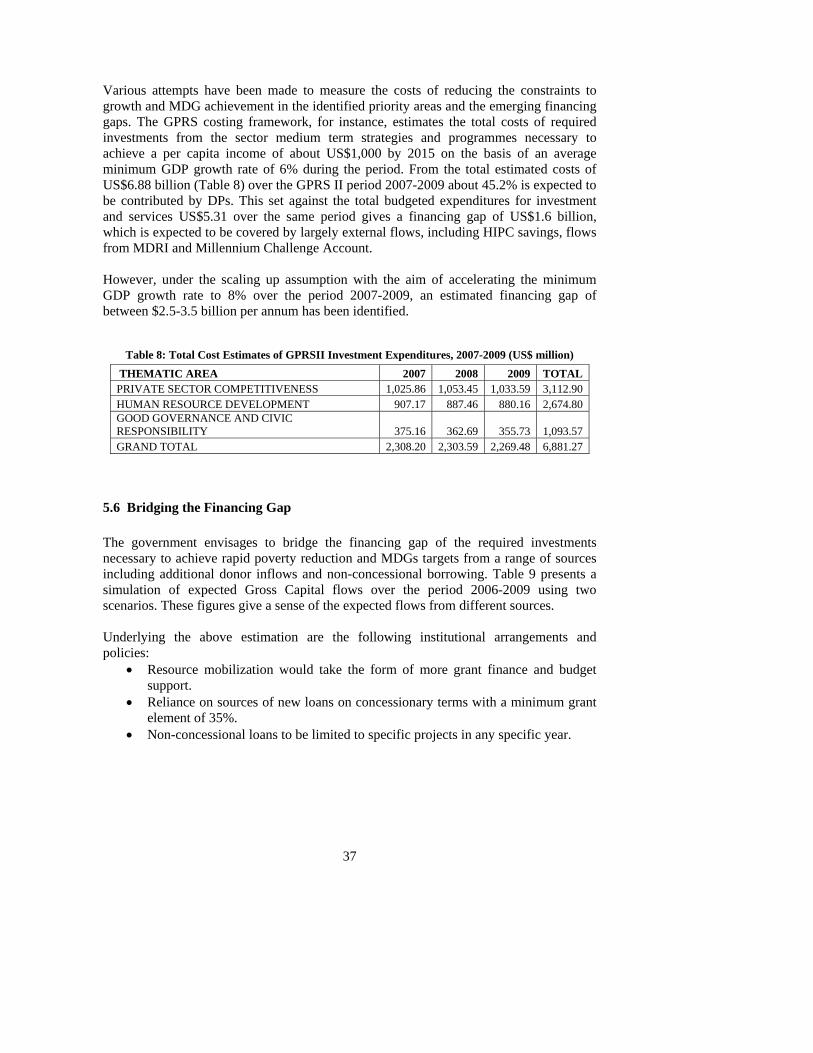
37
Various attempts have been made to measure the costs of reducing the constraints to growth and MDG achievement in the identified priority areas and the emerging financing gaps. The GPRS costing framework, for instance, estimates the total costs of required investments from the sector medium term strategies and programmes necessary to achieve a per capita income of about US$1,000 by 2015 on the basis of an average minimum GDP growth rate of 6% during the period. From the total estimated costs of US$6.88 billion (Table 8) over the GPRS II period 2007-2009 about 45.2% is expected to be contributed by DPs. This set against the total budgeted expenditures for investment and services US$5.31 over the same period gives a financing gap of US$1.6 billion, which is expected to be covered by largely external flows, including HIPC savings, flows from MDRI and Millennium Challenge Account. However, under the scaling up assumption with the aim of accelerating the minimum GDP growth rate to 8% over the period 2007-2009, an estimated financing gap of between $2.5-3.5 billion per annum has been identified.
Table 8: Total Cost Estimates of GPRSII Investment Expenditures, 2007-2009 (US$ million)
THEMATIC AREA 2007 2008 2009 TOTAL PRIVATE SECTOR COMPETITIVENESS 1,025.86 1,053.45 1,033.59 3,112.90 HUMAN RESOURCE DEVELOPMENT 907.17 887.46 880.16 2,674.80 GOOD GOVERNANCE AND CIVIC RESPONSIBILITY 375.16 362.69 355.73 1,093.57 GRAND TOTAL 2,308.20 2,303.59 2,269.48 6,881.27
5.6 Bridging the Financing Gap The government envisages to bridge the financing gap of the required investments necessary to achieve rapid poverty reduction and MDGs targets from a range of sources including additional donor inflows and non-concessional borrowing. Table 9 presents a simulation of expected Gross Capital flows over the period 2006-2009 using two scenarios. These figures give a sense of the expected flows from different sources. Underlying the above estimation are the following institutional arrangements and policies:
• Resource mobilization would take the form of more grant finance and budget support.
• Reliance on sources of new loans on concessionary terms with a minimum grant element of 35%.
• Non-concessional loans to be limited to specific projects in any specific year.

38
Table 9: Gross Capital Flows, 2006-2009, ($ million)
2006 2007 2008 2009 Concessional Flows 1057 1142 1355 1369 1482 Non-concessional Loans 0 0 250 250 200 I. Low borrowing scenario Non-concessional Loans 0 0 550 550 550 II. High borrowing scenario Total Flows Low 1605 1619 1682 High 1905 1919 2032 Gap from Sectoral Costing 2337 2575 2527
Source: Bank of Ghana
5.7 The Way Forward The nation has laid firm foundations for an accelerated growth trajectory through effective macro-economic stability measures, strengthened political and corporate governance systems, measurable gains in socio-economic development and strong global partnerships. Collectively these measures have increased investor confidence, improved overall economic growth and sustained political stability. While the nation’s performance with respect to the MDGs has been relatively modest, the rate of decline in poverty is well ahead of the 2015 target, primary and secondary school enrolment rates are on track and HIV/AIDS prevalence rates have taken a turn for the better. However, resource-intensive investments particularly in infrastructure that is supportive of agricultural production, processing and marketing are required to effect the economic transformation required for growth that is sustained and broad-based. Such investments undoubtedly require resources beyond the nation’s current resource envelope. In this context it is critical that development partners honour their commitments to scale-up the level and quality of aid to developing countries including Ghana. Meanwhile, recognizing that the ultimate responsibility for national development rests with the state, the government will continue to strengthen its domestic resource mobilization efforts as well as its governance and expenditure management systems to ensure more effective use of resources. Beyond financial resources, there is the need for developing countries to institutionalize peer learning and knowledge sharing mechanisms to strengthen evidence-based policymaking and minimize the incidence of policy failure. While the Annual Ministerial Review (AMR) provides such a mechanism it needs to be complemented by additional arrangements that facilitate more frequent interactions and exchanges among policymakers and development practitioners.