strengthening africa’s gateways to trade - pwc.co.za · strengthening africa’s gateways to...
TRANSCRIPT

An analysis of port development in sub-Saharan Africa • April 2018
Strengthening Africa’s gateways to trade
www.pwc.co.za/african-ports

Strengthening Africa’s gateways to trade
About this reportThis report was compiled by PwC’s Capital Projects and Infrastructure (CP&I) Transport and Logistics team using a combination of information obtained from interviews with port authorities and port operators, together with detailed research and incorporating our extensive knowledge of the port, trade and transport sector.
This report makes reference to countries in sub-Sahara with ports. For the purposes of this report these countries have been categorised into the regions of East Africa, West Africa, Islands and Southern Africa.
Mauritania
Kenya
DemocraticRepublicof Congo
Camer
oon
Nigeria
Benin
Togo
Gha
naCôted’Ivoire
Liberia
Sierra Leone
Guinea
SenegalGambia
Guinea Bissau
Gabon
Con
go
Angola
Moz
ambi
que
NamibiaBotswana
SouthAfrica
Mad
agas
car
Mauritius
Comoros
Seychelles
Cabo Verde
Somali
a
Djibouti
Tanzania
Equatorial Guinea
East Africa
Islands
Southern Africa
West Africa
AcknowledgementsThis report was prepared by Dr Francois Botes (PwC transport & logistics and ports subject matter expert) and Stacey Buck (Senior Manager: Capital Projects and Infrastructure) under the direction of Dr Andrew Shaw (Africa Transport and Logistics Leader). We thank those who contributed data, insights and analysis to the development of this
report. In particular, we would like to thank the following for their time and insights:
• Lars Greiner – independent consultant to PwC and Ports specialist
• Martin Diebel
• Liz Whitehouse and team from Africa House
• BMI Research – A Fitch Group Company
• Lullu Krugel and the PwC economics team
• Catherine Ensor and the PwC design team
We also thank those interviewees who shared their views with us.

PwC
Foreword
Africa, despite its enormous size, still represents only a small portion of world trade. Exports are largely commodity based and include oil, coal, iron ore, ferrochrome, precious metals, cocoa, palm oil and timber. Yet, Africa is growing and many of its larger economies are beginning to diversify away from a traditional commodity focus. Ports represent the gateways for these commodity exports, but as countries grow and develop, ports are also essential for sustaining and improving more robust and diverse growth in African economies through the import and export of manufactured goods and other products.
Ports are a vital part of the supply chain in Africa with each port having a far-reaching hinterland often spanning a number of countries. Ports have thus become a natural focus for regional development.
A number of global port logistics trends have emerged in the last decades, including the emergence of ‘hub’ ports, which facilitate dominant volumes of global trade in and out of a region. In Africa, the trend is gathering some momentum but is constrained by lower volumes of cargo relative to other parts of the world, poor port performance, hinterland dominance focused on certain ports, and global shipping routings that have not replicated the hub-and-spoke model more commonly found in other parts of the world.
Other trends such as improved intermodal facilities, enhanced back-of-port logistics and closer linkages to railway networks are common but are also less well developed than in other parts of the world. A number of corridor-based initiatives focused on improving the hinterland flow of goods both by road (the dominant mode) and by improvements in the railway network can be found across Africa and these are tending to focus on the higher-volume ports. Examples include improvements to the Gauteng-Durban corridor, initiatives to enhance trade between Rwanda, Burundi and Dar es Salaam and between Uganda and Mombasa. In the west similar trends are emerging between the landlocked countries of Mali, and Burkina Faso, and the Ports of Tema, Abidjan and Dakar.
Africa’s trade with China is growing. China imports commodities such as oil, iron ore, copper and other metal ores from Africa and as the region has developed, China has benefitted from exporting growing volumes of mostly manufactured products. China has also become a significant investor in African infrastructure projects and our research has identified increasing opportunities for China to play a stronger role in port investments.
We believe that the global transportation and logistics industry can no longer afford to ignore developments in Africa and that logistics service providers and ports in particular, will continue to play a key facilitating role in enabling economic growth across sub-Saharan Africa.
Dr Andrew ShawPwC Africa Transport & Logistics Leader
Manish R Sharma PwC India – Port Centre of Excellence and Transport & Logistics Leader
Julian SmithPwC Global Transport & Logistics Leader

Strengthening Africa’s gateways to trade
Foreword
Global production networks will increasingly drive port efficiency to integrate all components of the global logistics and supply chains. Ports will therefore come under increasing pressure to respond to the needs of shipping lines, logistics providers and multinational manufacturers as they seek to drive efficiencies throughout the value chain. Ports investment decisions, which in the past have been driven largely by supply-side factors, are likely to be increasingly dictated to by demand-side requirements.
There remains a strong case for Africa to focus on investment in ports. Developing port infrastructure ahead of demand, focusing on the ports with the greatest volume potential (the ‘hub’ ports of the future) and improving their overall functioning so that through productivity gains they are increasingly attractive as destinations for global trade.
Increased volumes of trade and more productive and attractive ports will accelerate changes in global shipping routes serving Africa. As in other
Dr Andrew Shaw PwC Africa Transport & Logistics Leader
Manish R Sharma PwC India – Port Centre of Excellence and Transport & Logistics Leader
Julian Smith PwC Global Transport & Logistics Leader
parts of the world, this will lead to increased integration with global shipping and trade routes, partly through the allocation of larger vessel sizes – reducing transit times and reducing the unit cost of transport to and from the continent.
Whether you represent government, port authority, port operator, shipping line or logistics provider, we are hoping that our assessment of sub-Saharan ports will help you better understand where the greatest opportunities lie in these rapidly-changing gateways to Africa.

PwC
Contents
1. PwC’s blueprint for sub-Saharan port investment 2
2. The African context 13
3. Volumes 18
4. Port performance 26
5. Liner shipping changing port infrastructure needs 45
6. Future drivers of investment 53
7. Moving forward: Summary of conclusions 65
8. PwC’s transport, logistics and ports expertise and services 70
9. Continuing the conversation 72
Appendices A Hub attractiveness score 76
B Sub-Saharan GDP growth data 78
C: Port Performance Ratings 80

Strengthening Africa’s gateways to trade2
1. PwC’s blueprint for sub-Saharan port investmentThe case for shifting focus
Sub-Saharan Africa (SSA) has been on a strong, sustained growth trajectory since the late 1980s. Growth is forecast to pick up from 2.6% in 2017 to 3.9% in 2022, and is predicated on commodity exports and rapidly transforming economies.1 While many of these economies are growing from a small and often fragile base, it is clear that growth is being led by Africa’s trade access to large global users of natural resources.
Ports provide a gateway to this African trade. Their competitiveness and positioning in global supply chains defines Africa’s ability to export and improving imports sustains greater economic resilience. Facilitating improvements in African trade through ports is complex. Ports are often fed by inland corridors that have their own infrastructure, delay and cost issues. Many African countries have no direct access to the sea.
1 International Monetary Fund, World Economic Outlook Database, October 2017. http://www.imf.org/en/data
Improving the way ports are run and managed, creating greater capacity and reducing delays to shippers is key to making ports more efficient. This is key to reducing the overall cost of logistics and improving reliability of goods in transit. There has been a lag in port investment, with port expansion and expenditure on port assets often not keeping pace with trade growth. Together with poor operational performance this creates a bottleneck to economic growth, increasing logistics costs, reducing reliability and making African countries less globally competitive.
A further challenge for African ports is that shipment sizes are small compared to those globally, driving up the unit cost of a shipment. This means moving a single container (or any other unit of volume) is 1.5 to 3.5 times2 more expensive from Africa than for high-volume trade routes over a comparable distance.
2 Based on quotes that PwC received from international shippers.

PwC 3
1. PwC’s blueprint for sub-Saharan port investment
This report was developed in response to the challenges facing sub-Saharan Africa’s ports in attracting sufficient external investment. The remainder of this chapter outlines a blueprint for ports investment based on our analysis of each of the identified issues:
• Section 2 contextualises why ports matter and how they facilitate trade and regional integration.
• Section 3 investigates freight volumes and port throughput within the current and likely future economic outlook.
• Section 4 looks at the operational performance track record of ports, and the challenges facing ports in this respect.
• Section 5 unpacks the main international investment trends that are likely to influence the flow of capital to SSA ports.
• Section 6 provides a summary of conclusions.
Supporting the main document is an annexure that provides detailed information and additional context on the trade of goods across SSA. The annexure provides regional and national trade statistics as well as a summary of each of the ports in the region.
Figure 1: Challenges facing sub-Saharan ports
Source: PwC analysis
Government
Growth bottleneck
Expo
rt co
mpe
tiven
ess Export com
petiveness
High logistics cost
Externalports
investment are driven by return on investment
Investors
Shipping lines
Por
t ope
rato
rs
Economies ofscale challenges
Infrastructureinvestment lag
Inef
ficie
nt la
nd-
base
d lo
gist
ics
Poor port
performance
Sustained growth in SSA is forecast to pick up from 2.6% in 2017 to 3.9% in 2022

Strengthening Africa’s gateways to trade4
1. PwC’s blueprint for sub-Saharan port investment
Step up investment in ports to achieve Africa’s economic development goalsThere needs to be greater awareness of the secondary drivers of port investments
Investment returns, rather than the secondary benefits stemming from commodity exports and consumer goods imports, should be the primary decision driver for investment in SSA ports. Business cases for port expansion are often defined only when capacity is already short and thus many ports operate under severe capacity constraints while investment decisions are being made. This continual lag, which often takes years, reduces competiveness and takes no account of the resulting reduced trade impact on African economies. China’s approach to the same problem is instructive. China considers port investments on the benefits it receives from trade.
China has the greatest incentive to invest in improving African port competitiveness. China is SSA’s biggest trading partner in both imports and exports. High port logistics costs, poor reliability and low economies of scale in trade volumes have a direct negative impact on both Chinese and African trade growth.
PwC estimates that China contributes only 15% of the total external ports investment budget, whereas it holds 20% of the volume of trade with SSA. In value terms, for every US$1 invested by China, China benefits US$13 in trade. For other countries this ratio is considerably smaller. Despite the media attention on the importance of China’s infrastructure contribution to Africa, the evidence shows that Chinese investment is significantly smaller in relative terms than that of Africa’s other trading partners. Most investors continue to view SSA port investment more from the perspective of receiving an acceptable return on the investment, rather than investing to achieve their trade objectives.
There is increasing competition between ports. Whereas competition between ports in most other parts of the world is driven by port efficiencies and revenue to ports operators, in SSA, each country has tended to protect their investment by channelling trade through their own ports, regardless of the economic consequences of the price of imported goods and the cost of exports.
Historically, governments have targeted revenues that can be extracted from ports as opposed to seeing them as trade and growth facilitators. The same is true in respect of ownership and operation, where governments have not always prioritised attracting private operators that have strong efficiency incentives, but instead have hung onto continued state operation with little or no incentive to improve operational efficiency. Making the link back to trade is a way for governments to re-position the role that ports play in enhancing trade and development.
Port investment requirements are increasingly defined through the impact of global shipping line strategies and port integration into dominant logistics chains. Shipping lines require good port infrastructure and for efficient ports to remain competitive. Private port operators are driving efficiencies in West African ports to a far greater extent than those at East and Southern African ports, which are predominantly government owned and operated. At least eight different independent port operators, some of which are owned by shipping lines such as Maersk and MSC, operate in West Africa, whereas only four independent operators are active in East and Southern Africa.
China has the greatest incentive to invest in improving African port competitiveness as China is SSA’s biggest trading partner in both imports and exports

PwC 5
1. PwC’s blueprint for sub-Saharan port investment
Channelling port investment for economic growth and financial sustainabilityAfrica’s ports should overcome their economy of scale challenge in maritime volumesPwC estimates that US$2.2 billion p.a. could be saved in logistics costs if the average throughput at the major ports in SSA doubled.3 This is because the unit cost of transferring cargo through a port rapidly reduces as the volume of traffic increases. This has led to a stronger focus on hub and feeder ports for containers and a focus on enhancing scale for commodity bulk terminals in many other parts of the world.
Emergence of hub container ports
Although individual countries in Africa have tended to push for developing their own hub ports, it is more likely that a few dominant ports will eventually emerge as major hubs, as has happened in Europe (Rotterdam and Antwerp), North America (Los Angeles, New York and New Jersey) and Asia (Singapore, Shanghai and Jawaharlal Neru). Network theory, which explains the natural formation of hubs in complex networks such as the internet, air links, and highway networks, is likely to see the ultimate emergence of three hub ports in Africa.
PwC’s analysis (see Figure 2) shows that, based on the degree of port centrality (shipping liner connectivity), the amount of trade passing through a port, and the size of the hinterland, Durban (South Africa), Abidjan (Cote d’Ivoire) and Mombasa (Kenya) are most likely to ultimately emerge as the major hubs in Southern Africa, West Africa and East Africa, respectively (The full set of hub attractiveness scores is included in Appendix A).
Figure 2: Top 10 ports according to PwC’s Hub Index
Source: PwC’s Hub Index 4
3 Calculationisbasedona10%efficiencygainduetoeconomiesofscaleexpectedfromhigherthroughput.
4 ThePwCHubIndexmeasurestheattractivenessofaporttodevelopandgrowasahubport.Itisbased on shipping liner connectivity, the amount of trade passing through a port and the size of the port hinterland.
0
20
40
60
80
100
Dakar
Dar-es
-Sala
amTema
Lago
s-Apap
a
Djibou
ti
Mombas
a
Abidjan
Ngqura
Cape T
own
Durban
By comparison, the Port of Rotterdam achieves a hub attractiveness score of 421
94
50 5046 46
40 40 4035 33
Greater integration of ports into logistics supply chains will have a positive impact on port performance. The continuously evolving relationship between consignees, consigners and shippers dictate to a large extent how supply chains are integrated. Ports are seen as just one component in a value chain, which means that they are increasingly forming part of a complex network in order to drive costs down and efficiency up. The quality of infrastructure and logistics operations of land-based supply chains corridors as well as effective back-of-port facilities support the landside effectiveness of ports.

Strengthening Africa’s gateways to trade6
1. PwC’s blueprint for sub-Saharan port investment
The closest rivals to these ports are Lagos-Apapa (Nigeria) and Tema (Ghana) as alternatives to Abidjan, and Djibouti and to a lesser extent Dar es Salaam to Mombasa. Due to their better operational performance, both Lagos-Apapa and Tema pose significant challenges to Abidjan’s emergence as a hub, which might eventually be decided on factors such as on political stability, port performance and quality of inland connections.
Djibouti poses much less of a threat to Mombasa due to the latter’s larger hinterland and operational efficiencies. Mombasa also serves established warehouses and trading facilities for the region. If it wasn’t for the close proximity of Dar es Salaam to Mombasa, it would have been a major contender to be an East African hub. Given their close proximity, it is unlikely that both Dar es Salaam and Mombasa will both emerge as hubs. Given Mombasa’s better hinterland connections and larger throughput, it is more likely to fulfil the role of a hub, with Dar es Salaam being a significant regional port. It is therefore important for Dar es Salaam to define its role in providing port services to its hinterland.
In the case of Durban, there is no real contender as its closest rival, Cape Town, is far from the main markets. The Port of Ngqura (Coega) near Port Elizabeth was built as an alternative to Durban, but despite significant capacity constraints at Durban, has not attracted any meaningful volumes due to less than favourable inland connections and a lack of critical mass. This should serve as a reminder to governments that spending on existing facilities may yield far better results than trying to create alternatives to established nodes in a network. Greenfield ports are extremely expensive to construct and seldom emerge as real economic alternatives to long-established ports.
The emergence of the identified ports as hubs has been constrained by three major factors:
• Hinterland corridors’ inability to have more than one truly competitive port outlet;
• A lack of change in the maritime trade routes running up and down the east and west coast of Africa, which currently don’t feed from priority hub ports; and
• Investment spend is not flowing to the dominant ports, but is being focussed instead on supporting smaller, less-viable port facilities.
This is not to say that hub ports should always be prioritised for investment, but rather that the type of investment should focus on the ports’ inherent function, including deepening of channels and transshipment facilities.
Although it may be tempting to leave the emergence of hub ports entirely to market forces at the one extreme, or government planning at the other, taking the wrong investment decisions might mean that hubs outside SSA emerge as the preferred nodes. In our extensive engagement with shipping lines we learned they choose far-flung hubs not so much because Africa does not have any, but because African ports are less efficient. China Merchant Port Holdings, for example, recently bought a majority stake in Hambantota Port in Sri Lanka for US$974 million, and plan a further investment of US$1.12 billion for it to serve as a hub for their East African shipping business.5 Such developments pose a real existential threat to the emergence of SSA-based hub ports. It is therefore important for SSA to improve port performance and develop critical mass to attract shipping lines to its hub ports.
5 “China Merchants to take over Sri Lanka port”, China Daily, 26/07/2017
US$2.2 billion p.a. could be saved in logistics costs if the average throughput at the major ports in SSA doubled

PwC 7
1. PwC’s blueprint for sub-Saharan port investment
Increase trade
Although PwC estimates that the value of SSA merchandise trade increased by roughly 300% over the past 30 years, SSA contributed less than 1% to the value of world trade growth during this period. Small volumes and their distance from foreign markets place SSA ports at a cost disadvantage compared to those in the rest of the world.
Despite its low contribution to trade, during the decade leading up to 2010, SSA received 10% of global investment allocations in ports.6 Almost 90% of this external investment was in concession agreements for existing port terminals, rather than investment in new infrastructure. The year 2010 is significant as it was around this time that demand for resources, and the value of global trade peaked. The current value of world trade is similar to that in 2010. In the intervening period investment in establishing new port capacity should have accelerated, but African ports have failed to attracted sufficient investment to effectively eliminate operational and capacity backlogs.
We used World Bank data to index SSA and global GDP and merchandise trade value since 1990 to depict trends in African trade and economic activity (see Figure 3). SSA trade trends closely mimic global trends with a distinct levelling off and more recent decline since 2010. Although global GDP softened after 2010, SSA trade continued to grow.
Notwithstanding the fact that the value of SSA exports of mainly bulk commodities have declined since the end of the global resources boom around 2010 (see Figure 4), imports continued to grow. This is not only reflected in the value of imports, which has overtaken that of exports, but also in container throughput, which grew by 26% between 2010 and 2015. Since 2015 container
6 Holman Fenwick Willan, Global investment in ports and terminals, 2013, p. 5
volumes and the value of imports has been in decline in line with the decline in GDP growth. As commodity prices begin to increase again, it is likely that commodity volumes will reverse the declining trend.
Figure 3: Indexed trade growth: SSA vs Global
Sources: PwC analysis based on World Bank, WTO and IMF data
0
100
200
300
400
500
600
700
800
2016
2015
2014
2013
2012
2011
2010
2009
2008
2007
2006
2005
2004
2003
2002
2001
2000
1999
1998
1997
1996
1995
1994
1993
1992
1991
1990
World trade SSA trade SSA GDP World GDP

Strengthening Africa’s gateways to trade8
1. PwC’s blueprint for sub-Saharan port investment
Addressing imbalances
In addition to the growing imbalance between imports and exports, the type of goods imported and exported poses major challenges to the cost of imports and exports. SSA imports are predominated by containerised cargo, while exports are mainly raw materials and agricultural products, which are mostly handled as bulk freight.
In essence, the vessels arriving with imports are not ideally suited to the goods being exported, which increases costs. Increasing the level of processing in exports would allow some of the bulk produce to be containerised and exported in containers that would otherwise leave the ports empty. Not only would this benefit exports in terms of taking advantage of reduced container handling costs, but imports would not have to carry the cost burden of importing and exporting a container. This rebalancing of containerised trade is a unique opportunity for African countries to beneficiate and expand trade in higher-value exports.
Figure 4: Indexed SSA imports and exports
Source: PwC analysis based on World Bank, WTO and IMF data.
0
50
100
150
200
250
300
350
400
450
2016
2015
2014
2013
2012
2011
2010
2009
2008
2007
2006
2005
2004
2003
2002
2001
2000
1999
1998
1997
1996
1995
1994
1993
1992
1991
1990
imports exports
Efficient African ports will reduce the price of imported goods and increase the value of exports.
Improving port performance by 25% could reduce the price of imported goods in SSA by US$3.2 billion annually, and add US$2.6 billion to the value of exports.7 This would add at least US$510 million p.a. to GDP growth in SSA, a 2% increase in GDP.8
Given the improvement in port performance as the key driver of cost savings, PwC developed a Port Performance Rating (PPR) by combining published ratings of infrastructure quality, port operations effectiveness, and logistics efficiency (customs, logistics quality, track-and-trace and timeliness).
7 Calculationisbasedontheextentofsavingsthatcouldbeexpectedfromhigherthroughput
8 World Economic Forum, Africa Strategic Infrastructure Initiative Project Overview: Accelerating Infrastructure Development in Africa, (WEF, 2015) p3
The full set of PPR scores are available in Appendix C.
From a SSA perspective, all the identified contenders for emerging hub ports, except Djibouti, feature among the top 10 in terms of their PPR. (Djibouti is added to Figure 5 for comparison purposes). Using Rotterdam is as an international benchmark even Durban, by far the best performer in SSA, only achieves 75% of the efficiency expected from a major global hub port. Other hub port contenders achieve 50% or less than the benchmark. PwC forecasts that investment of at least US$6 billion would be required to lift three hub ports up to the international benchmark.

PwC 9
1. PwC’s blueprint for sub-Saharan port investment
Figure 5: Port Performance Rating of top-10 SSA ports
Source: PwC analysis
0
20
40
60
80
100
120
140
Djibou
ti
Abidjan
Port L
ouis
Lago
s-Apap
aTe
ma
Walv
is Bay
Mom
basa
East L
ondon
Ngqur
a
Cape T
own
Durban
Rotte
rdam
Where to focus investmentIn addressing the SSA ports investment backlog, it is important to appreciate that each port is unique in the challenges it presents. It is nevertheless useful to understand the specific objectives of each type of port to appreciate where investment could have the most significant impact. The guide below gives a broad framework of factors to consider when evaluating investment in four types of port.
Hub portsHub ports are large regional container (or break-bulk) ports with high volumes (>2 million TEUs per annum) and direct shipments carried by very large vessels. In addition to serving a large hinterland, hubs have a predominance of transshipment volume and terminals that can load containers via a stack from one ship to another (e.g. Durban, Mombasa, Abidjan and Djibouti) for transfer to other hub ports or smaller feeder ports.
Although Durban is currently the only example that would qualify as a hub container port in SSA, we believe that at least one hub port will emerge in both West Africa and East Africa.
Even though the majority of ports are unlikely to emerge as hubs, this does not mean that they should be starved of investment. Much can be done to improve port performance and for them to serve as feeders to the main hubs, particularly at poor-performing feeder ports such as Douala, Luanda and Onne. We forecast that investment of at least US$10 billion would be required to achieve 75% of the performance of the international benchmark, i.e. the current efficiency score of Durban.
67% of the port and terminal operators interviewed in Southern Africa and 50% in West Africa strongly agree that they would like to expand their port facilities

Strengthening Africa’s gateways to trade10
1. PwC’s blueprint for sub-Saharan port investment
Competitive hub port facilitation requires the following specific investment support measures:
• Sufficient draught, quay length and crane sizes to accommodate the largest container vessels.
• Efficient transshipment facilities, as well as rapid loading and offloading performance.
• Stack capacity and supporting intermodal facilities and dry ports.
• Supporting efficient land transport connections along corridors leading into and out of the port.
• Back-of-port effectiveness and landside transport connections.
• Operations effectiveness, including rapid container handling and quick ship turnaround times.
Feeder ports Feeder ports are smaller ports that are limited by their volume capacity and the size of vessels they can accommodate. Typically they attract less than 100 000 TEUs per annum, usually through indirect ship calls. Most major SSA container ports fall somewhere between a hub port and a typical modern feeder port. Although many SSA ports fulfil the functions of hub ports, they are too small to be effective in leveraging the economies of scale required to make a hub-and-spoke system truly cost-effective.
The investment drivers are similar to that of hub ports, except that there is less emphasis on increasing draught to accommodate the largest container vessels, and on installing transshipment facilities.
Most major SSA container ports fall somewhere between a hub port and a typical modern feeder port
Bulk ports Given Africa’s reliance on commodity exports, purpose-built efficient bulk terminals that handle large volumes will retain a cost advantage and better terms of trade across a global market. Even in the most efficient Australian bulk export channels, transport (including port) costs can typically constitute 20-30% of the FOB cost of bulk commodities, thus making bulk terminals very cost sensitive. Vale, the Brazilian iron ore miner, recently purchased its own fleet of very large vessels with dedicated port facilities to compete with Australian producers that are closer to the Chinese market. Reducing transport costs therefore has the greatest impact on the development of bulk resources. Despite an abundance of natural resources, Africa finds it difficult to compete on the world market with the likes of Brazil and Australia, which have invested heavily in dedicated facilities and cost-effective supply chains.
Examples of purpose-built bulk ports include Richards Bay and Saldanha (South Africa), Port Saco (Angola) and Buchanan (Liberia). Although many African ports have dedicated bulk and oil & gas terminals, only Saldanha (iron ore) and Richards Bay (coal) were constructed as dedicated bulk ports. International best practice suggests that bulk terminals of significant size function best if they are purpose built and connected to dedicated rail networks.

PwC 11
1. PwC’s blueprint for sub-Saharan port investment
The way forward for attracting investmentGovernments should rethink their role in managing ports
Government intervention significantly impacts investment returns as a result of the manner in which they plan, regulate, own and operate ports in Africa. Almost all investors we spoke to during our research highlighted governance as the main risk consideration in their investment decisions. We believe that governments can significantly improve the investment environment in the following three ways:
• There should be greater collaboration between countries in establishing efficient international and local trade, and in acknowledging the role of specific ports, whether they are a container hub, feeder or bulk terminal. It is acknowledged that there may be strategic exceptions for duplicating facilities, but trade should be allowed to gravitate naturally to the ports that can handle the volume most efficiently and at lowest overall logistics cost. Consideration must also be given to the need for port services of landlocked countries.
• Investments should boost natural competitive advantage. Although inter-port competition should be encouraged by allowing ports the freedom to attract freight and investment funding, governments should avoid the temptation to misallocate port investment for the sake of creating new facilities for which there is clearly not a competitive advantage or critical mass of traffic.
• Creating a favourable bona fide investment environment. Bona fide investors (i.e. investors whose sole purpose it is to generate returns on investment) that we spoke to are overwhelmingly looking for a good risk-return ratio to generate revenue for their shareholders. Our research suggests that countries investing
in ports primarily for the trade benefits tend to benefit substantially more from an efficient import and export supply chain and thus create a conducive, investor-friendly environment for ports when this is part of an overall trade investment strategy. Financially sound investment is more likely in an environment where governments have a strong ports regulator and ports authority, but leave the operations and infrastructure management to the private sector.
In addition to encouraging infrastructure investment, governments can also do much to create a better operating environment in the short to medium term. Measures to consider include:
• Moving to a landlord ownership model that allows private operators to drive port efficiencies by investing in better equipment, logistics processes and systems. Large international operators are also well connected with global logistics companies and shipping lines, which would benefit ports in attracting more business and increase competition. Many ports, particularly in West Africa, can demonstrate significant operational benefits from private-sector partnerships.
• Streamlining customs and statutory processes can eliminate significant bottlenecks in container dwell time. Although we appreciate the complexity of ports management and the number of government departments involved, including customs, police and immigration, migrating to pre-clearance, on-site customs clearance, and paperless systems have been a great success in a number of SSA ports.
Almost all investors we spoke to highlighted governance as the main risk consideration in their investment decisions
• Better traffic management in and around ports would enable port freight to better negotiate congested road systems. Traffic congestion in many SSA cities is as much due to poor traffic management as it is due to a lack of infrastructure. Giving priority to freight vehicles on certain roads and during certain times of day could improve landside port access significantly.
These objectives are unlikely to be achieved merely through unilateral decisions and bilateral negotiations alone. Undertaking of a Ports Master Plan for SSA ports under the auspices for example of the African Union (AU) would provide considerable benefits and allow a more coordinated and integrated approach. This plan must be agreed to by all governments, and should be binding insofar as it guides the role of ports in SSA to benefit trade at a sub-continental level.
Strengthening Africa’s gateways to trade12
1. PwC’s blueprint for sub-Saharan port investment
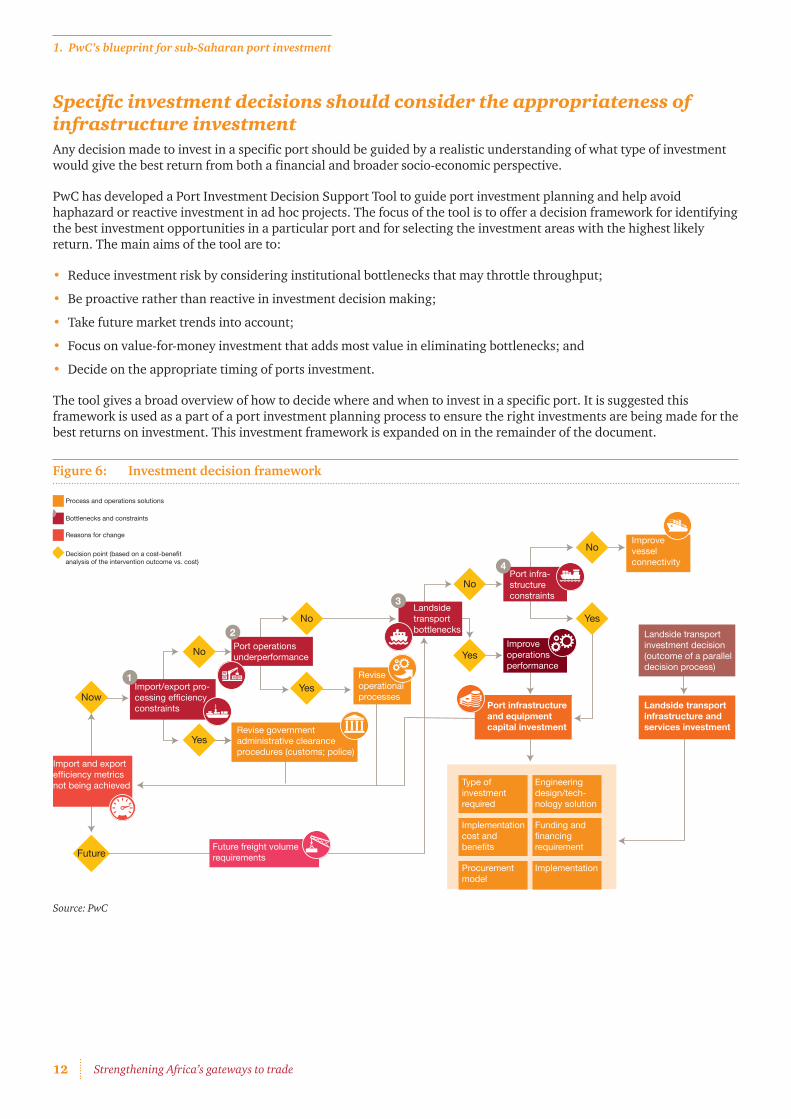
Specific investment decisions should consider the appropriateness of infrastructure investmentAny decision made to invest in a specific port should be guided by a realistic understanding of what type of investment would give the best return from both a financial and broader socio-economic perspective.
PwC has developed a Port Investment Decision Support Tool to guide port investment planning and help avoid haphazard or reactive investment in ad hoc projects. The focus of the tool is to offer a decision framework for identifying the best investment opportunities in a particular port and for selecting the investment areas with the highest likely return. The main aims of the tool are to:
• Reduce investment risk by considering institutional bottlenecks that may throttle throughput;
• Be proactive rather than reactive in investment decision making;
• Take future market trends into account;
• Focus on value-for-money investment that adds most value in eliminating bottlenecks; and
• Decide on the appropriate timing of ports investment.
The tool gives a broad overview of how to decide where and when to invest in a specific port. It is suggested this framework is used as a part of a port investment planning process to ensure the right investments are being made for the best returns on investment. This investment framework is expanded on in the remainder of the document.
Figure 6: Investment decision framework
Source: PwC
Improvevesselconnectivity
Revise governmentadministrative clearanceprocedures (customs; police)
No
No
Yes
Yes
Yes
No
No
Now
Future
Yes
Port infra-structureconstraints
4
Landsidetransportbottlenecks
Improveoperationsperformance
Infrastructure andequipment capitalinvestment
Infrastructure andequipment capitalinvestment
Port infrastructureand equipmentcapital investment
Landside transportinfrastructure andservices investment
Landside transportinvestment decision(outcome of a paralleldecision process)
Type ofinvestmentrequired
Implementationcost andbenefits
Procurementmodel
Engineeringdesign/tech-nology solution
Funding andfinancingrequirement
Implementation
Reviseoperationalprocesses
Port operationsunderperformance
Import/export pro-cessing efficiencyconstraints
Import and exportefficiency metricsnot being achieved
Future freight volumerequirements
Infrastructure and equipment capital investment
Process and operations solutions
Bottlenecks and constraints
Reasons for change
Decision point (based on a cost-benefitanalysis of the intervention outcome vs. cost)
3
2
1

PwC 13PwC 13
2. The African context
Why ports matterGlobalised supply chains have enabled goods and services to be transported across the world to meet the ever-increasing demands of populations. Ports are gateways for 80% of global merchandise trade by volume and 70% by value.9 As an emerging market region endowed with vast natural resources and a young and growing population, SSA must accelerate its market access and trade both across the region
9 United Nations Conference on Trade and Development, Review of Maritime Transport 2015, UNCTAD, 2015, pp. 3-14
and with the rest of the world. This is important to stimulate economic growth, diversify its economies, reduce the inflationary effects of weak transport and logistics infrastructure, become globally competitive, create employment and reduce poverty.
The transportation and logistics industry is the backbone of an economy. Freight logistics is regarded economically as a derived demand resulting from demand for other products and commodities; making industry and country competitiveness
strongly dependent on an effective logistics support industry. Internationally, logistics costs as a percentage of total production costs have steadily declined over the last decade, despite supply chains being more complex and having greater flexibility to customer needs than ever.
In developing countries, and specifically in Africa, logistics costs remain high as a percentage of total production costs and limit economic growth opportunities. High transport costs add 75% to the price of African

Strengthening Africa’s gateways to trade14
2. The African context
goods10. Most African countries either have inadequately-developed ports, too few ports and/or no port facilities in key areas. Considering that port demand volume is expected to grow by 6-8 times by 2040, the challenge is significant.
Without adequate infrastructure, Africa runs the risk of sacrificing about 2% of GDP growth per annum.11 Access to port and related infrastructure and operations to cope with current demand and future growth, to reduce cost, and improve overall freight logistics efficiency and reliability, are fundamental to the region’s future success.
In addition to appreciating the importance of port and landside transport connections for the efficient operations and productivity of ports, it is also essential to understand the link between port efficiency and landside transport accessibility with economic growth.12 The relationship between port efficiency and economic growth is depicted in Figure 7.
10 African Development Bank, Tracking Africa’s Progress in Figures: Chapter 5 Infrastructure, AFDB, 2014, pp. 50-54
11 World Economic Forum, Africa Strategic Infrastructure Initiative Project Overview: Accelerating Infrastructure Development in Africa, WEF, 2015, p. 3
12 Botes, FJ 2003, A model to forecast the impact of road accessibility on the economic development potential of industrial land in urban areas, PhD dissertation, University of Stellenbosch, South Africa.
Figure 7: The relationship between ports and economic growth
Source: Botes, FJ 2003
Given the important enabling role of transport infrastructure in economic development, ports infrastructure should be one of the top political priorities in SSA, as it can unlock economic growth and competitiveness.
Economies of scale in accommodating larger ships, and the accompanying stevedoring efficiency, could further enhance the appeal of certain ports as premier freight import/export gateways to Africa. Special attention would therefore have to be given to ensuring a feedback loop between port efficiency, regional integration and the infrastructure capacity analysis in undertaking the market analysis.
Figure 8: Importance of ports in the logistics chain
Source: Botes, FJ 2003.
Economic growth
Improved accessibility(travel time, connectivity,
reliability, goodshandling efficiency)
Increased goodsmovement
Enhancingthe logistics
chain
impacts on
requires
requires
requires
provides
Effective portand transportinfrastructure
Logisticschain
efficiency
impacts on
requires
provides
requires
Import/exportvolume

PwC 15
2. The African context
It should, however, be acknowledged that good logistics infrastructure is unable to compensate for poor operating, management and processes within ports. In many instances, advanced infrastructure requires even greater levels of process and management support to fully utilise new infrastructure and equipment efficiencies. This report focuses not only on port infrastructure, but other important components such as operations and efficiency, which we recognise as an integral part of port infrastructure investment.
Foreign direct investmentBased on our own analysis and the World Investment Report 2017, global foreign direct investment (FDI) inflows declined by 2% overall in 2016 to US$1 746 billion, down from US$1 774 billion in 2015.13
Flows to developed economies increased by 5% to US$1 032 billion and FDI in developing economies experienced a decline of 14% to US$646 billion. Africa’s share of global FDI decreased marginally from 3.5% to 3.4%.
Port investment in SSA is severely affected by international investment patterns. Our analysis found that weak commodity prices have held back FDI in SSA, with flows to Africa continuing to decline in 2016, though by a moderate 3% to US$59 billion.
FDI in SSA’s largest economies of Nigeria and South Africa remained well below past averages, although it is expected to increase moderately in 2017. Southern Africa has experienced the largest FDI decline of ±36%.
13 UNCTAD, World Investment Report 2017, http://unctad.org/en/PublicationsLibrary/wir2017_en.pdf
Corridors of tradeTrade corridors form the backbone of the SSA economy. They facilitate trade throughout the region by connecting seaports to inland markets and landlocked countries through various modes of transport.
In the past, focus was largely placed on extraction corridors as Africa is a resource-rich continent reliant on exporting commodities. These extraction corridors are dependent on external demand for the specific commodity being extracted via the corridor and are therefore subject to the whims of commodity price fluctuations. This poses high risk to investors.
Value corridors are an advancement on extraction corridors as they focus on a range of products and activities, often a mix of imports, exports and domestic or inter-African trade. With less reliance on a single commodity and with the primary focus on value instead of volume, these corridors have lower risk associated with them and create stronger business cases for investment from funders.
Introduced in July of 2010, the Programme for Infrastructure Development in Africa (PIDA) is aimed at establishing a strategic framework for the development of continental infrastructure to 2040 in the sectors of energy, transportation, information and communication technologies, and trans-boundary water resources.14 The PIDA initiative is being led by the African Union (AU) Commission, NEPAD Secretariat and the African Development Bank.
14 World Economic Forum, Africa Strategic Infrastructure Initiative Project Overview: Accelerating Infrastructure Development in Africa, WEF, 2015.
In 2016, flows to developed economies increased by 5% to US$1 032 billion and FDI in developing economies experienced a decline of 14% to US$646 billion

Strengthening Africa’s gateways to trade16
2. The African context
PIDA’s Priority Action Plan aims to accelerate the implementation of selected infrastructure projects by 2020. According to the plan, US$75 billion is needed to be spent on transport projects between 2012 and 2020, with US$16.5 billion to be spent on rail projects, US$11 billion on roads and US$3 billion on seaport projects. These figures suggest that, on the whole, the backlog in landside road and rail links are larger than those of ports, but ports remain critical as they are the trade gateways into and out of the continent.
PIDA acknowledges that the progress and effectiveness of mega infrastructure projects are highly dependent on the capital, technology, information and insight that the private sector will bring. By opening communication between the public and private sectors, the public sector can base project decisions and project hierarchy on objective, informed and transparent information.
Figure 9: Transport and trade corridors of Africa
Source: PwC analysis, Bolloré and World Economic Forum
Nouadhibou
Nouakchott
DakarBanjul
Kamsar
Conakry
Freetown
Monrovia
San Pedro
Abidjan
Takoradi
Tema
Lomé
CotonouLagos (Apapa)
Onne
Malabo
São Toméand Príncipe
Bata
OwandoLibreville
Pointe-Noire
Luanda
Lobito
Namibe
Port Gentil
Walvis Bay
Luderitz
Saldanha
Cape Town East London
Beira
Pemba
Mtwara
Dar es Salaam
Tanga
Mombasa
Mogadishu
Berbera
Djibouti
Maputo
Richards Bay
Durban
Douala
Ngqura
Praia
Kribi
Matadi
Cabinda
Nacala
Toamasina
Victoria
Mutsamudu
Port Louis
Lamu
Massawa
Port Sudan
Soyo
Note: Map prepared using available data
PwC 17
2. The African context
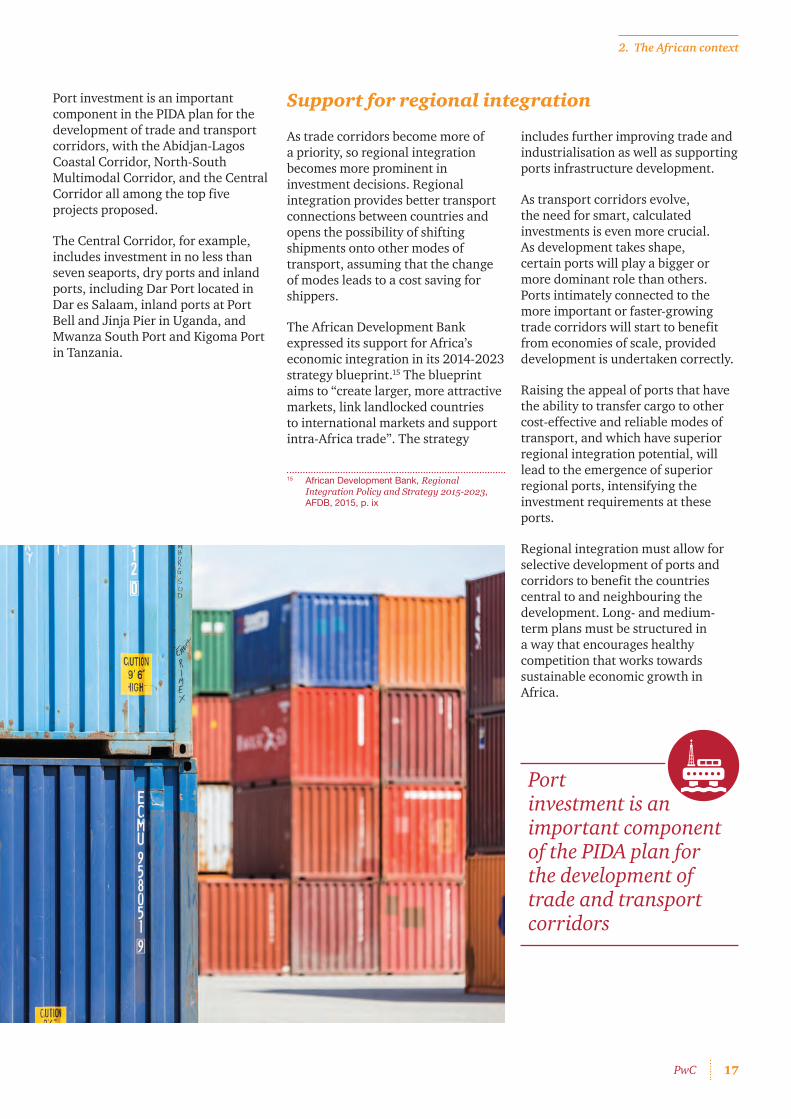
Port investment is an important component in the PIDA plan for the development of trade and transport corridors, with the Abidjan-Lagos Coastal Corridor, North-South Multimodal Corridor, and the Central Corridor all among the top five projects proposed.
The Central Corridor, for example, includes investment in no less than seven seaports, dry ports and inland ports, including Dar Port located in Dar es Salaam, inland ports at Port Bell and Jinja Pier in Uganda, and Mwanza South Port and Kigoma Port in Tanzania.
Support for regional integration
As trade corridors become more of a priority, so regional integration becomes more prominent in investment decisions. Regional integration provides better transport connections between countries and opens the possibility of shifting shipments onto other modes of transport, assuming that the change of modes leads to a cost saving for shippers.
The African Development Bank expressed its support for Africa’s economic integration in its 2014-2023 strategy blueprint.15 The blueprint aims to “create larger, more attractive markets, link landlocked countries to international markets and support intra-Africa trade”. The strategy
15 African Development Bank, Regional Integration Policy and Strategy 2015-2023, AFDB,2015,p.ix
Port investment is an important component of the PIDA plan for the development of trade and transport corridors
includes further improving trade and industrialisation as well as supporting ports infrastructure development.
As transport corridors evolve, the need for smart, calculated investments is even more crucial. As development takes shape, certain ports will play a bigger or more dominant role than others. Ports intimately connected to the more important or faster-growing trade corridors will start to benefit from economies of scale, provided development is undertaken correctly.
Raising the appeal of ports that have the ability to transfer cargo to other cost-effective and reliable modes of transport, and which have superior regional integration potential, will lead to the emergence of superior regional ports, intensifying the investment requirements at these ports.
Regional integration must allow for selective development of ports and corridors to benefit the countries central to and neighbouring the development. Long- and medium-term plans must be structured in a way that encourages healthy competition that works towards sustainable economic growth in Africa.

Strengthening Africa’s gateways to trade1818
3. Volumes
Sub-Saharan Africa’s economic outlook
The economy of SSA gained strong momentum up until 2014 when several factors led to a severe slowdown in growth. Major oil producing countries, notably Angola and Nigeria, were hit by falling oil prices, while South Africa saw contractions in its mining and manufacturing industries and had to deal with the effects of drought on the agriculture market.
The 1.2% growth estimate for 2016 is the lowest SSA has experienced for two decades and worse than that seen in the aftermath of the 2008/9 global economic crisis.16
16 International Monetary Fund, Regional Economic Outlook: Sub-Saharan Africa - Time for a Policy Reset, IMF, 2016.
PwC 19
3. Volumes
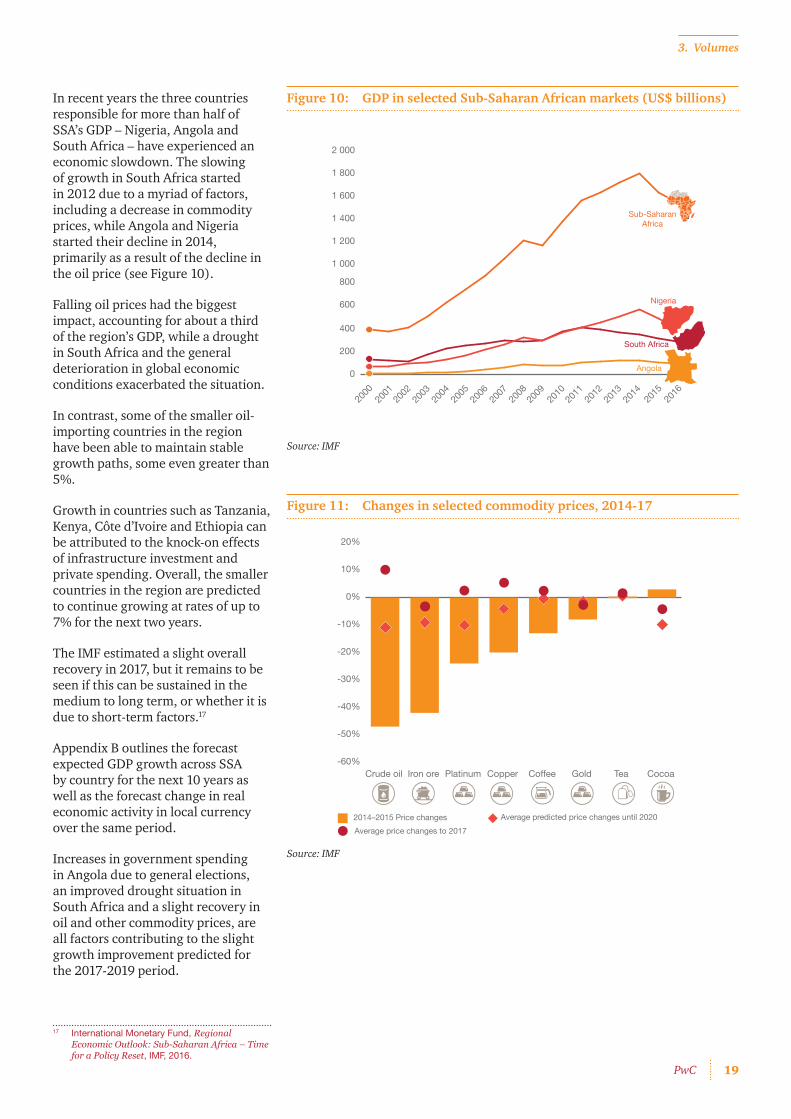
Figure 10: GDP in selected Sub-Saharan African markets (US$ billions)
Source: IMF
0
200
400
600
800
1 000
1 200
1 400
1 600
1 800
2 000
2016
2015
2014
2013
2012
2011
2010
2009
2008
2007
2006
2005
2004
2003
2002
2001
2000
Sub-SaharanAfrica
Nigeria
Angola
South Africa
In recent years the three countries responsible for more than half of SSA’s GDP – Nigeria, Angola and South Africa – have experienced an economic slowdown. The slowing of growth in South Africa started in 2012 due to a myriad of factors, including a decrease in commodity prices, while Angola and Nigeria started their decline in 2014, primarily as a result of the decline in the oil price (see Figure 10).
Falling oil prices had the biggest impact, accounting for about a third of the region’s GDP, while a drought in South Africa and the general deterioration in global economic conditions exacerbated the situation.
In contrast, some of the smaller oil-importing countries in the region have been able to maintain stable growth paths, some even greater than 5%.
Growth in countries such as Tanzania, Kenya, Côte d’Ivoire and Ethiopia can be attributed to the knock-on effects of infrastructure investment and private spending. Overall, the smaller countries in the region are predicted to continue growing at rates of up to 7% for the next two years.
The IMF estimated a slight overall recovery in 2017, but it remains to be seen if this can be sustained in the medium to long term, or whether it is due to short-term factors.17
Appendix B outlines the forecast expected GDP growth across SSA by country for the next 10 years as well as the forecast change in real economic activity in local currency over the same period.
Increases in government spending in Angola due to general elections, an improved drought situation in South Africa and a slight recovery in oil and other commodity prices, are all factors contributing to the slight growth improvement predicted for the 2017-2019 period.
17 International Monetary Fund, Regional Economic Outlook: Sub-Saharan Africa – Time for a Policy Reset, IMF, 2016.
Figure 11: Changes in selected commodity prices, 2014-17
Source: IMF
-60%
-50%
-40%
-30%
-20%
-10%
0%
10%
20%
CocoaTeaGoldCoffeeCopperPlatinumIron oreCrude oil
2014–2015 Price changesAverage price changes to 2017
Average predicted price changes until 2020

Strengthening Africa’s gateways to trade20
3. Volumes
The decline in prices for major commodities exported from SSA since 2014 resulted in worsening terms of trade and slowing GDP growth. The situation has improved since 2017, leading to improved GDP performance with an improved business environment, favourable demographics and infrastructure investments supporting growth.
The ability to export commodities remains the driving force of development in sub-Saharan economies. Comparing GDP to exports highlights the strong relationship that exists between GDP and export earnings(see Figure 12).
For every additional dollar exported, GDP is likely to increase by US$3.5 dollars. This can be explained by factors such as the multiplier effect. Furthermore, this relationship highlights the need for infrastructure developments and the efficient operation of ports in the region.
Figure 12 shows the clear relationship between exports and GDP in SSA. Growing exports is key to growing SSA economies. As the majority of SSA trade exports are by sea, increasing port effectiveness reduces export costs which in turn increases exports and GDP. There is a direct link between port effectiveness and SSA economic growth.
Figure 12: Sub-Saharan African GDP vs exports (US$ billions)
Source: PwC analysis
Exports GDP
0
100
200
300
400
500
600
0
500
1 000
1 500
2 000
GD
P
Exp
orts
For every additional dollar exported in sub-Saharan Africa, GDP is likely to increase by US$3.5 dollars
Opening Africa’s gateways to trade20

PwC 21
3. Volumes
Trade flowsPorts in countries dependant on commodities generally experienced a decline in trade volumes during 2011-2015, as shown in Figure 13. Countries that saw high levels of volume growth include Côte d’Ivoire, Cameroon, Djibouti, Kenya, Mozambique, Seychelles, Sierra Leone and Togo.
Figure 13: Changes in SSA trade tonnages, 2011–2015
Country Exports Imports Total
Seychelles 280% 81% 133%
Madagascar 8% 157% 112%
Sierra Leone 143% 13% 87%
Togo -12% 131% 75%
Kenya 4% 86% 65%
Djibouti 58% 53% 53%
Côte d'Ivoire 4% 69% 35%
Cameroon 42% 25% 34%
Mozambique 36% 23% 29%
Tanzania 20% 28% 27%
South Africa 25% 7% 21%
Gambia -34% 30% 18%
Ghana 12% 23% 18%
Guinea 13% 39% 17%
Comoros 11% 12% 12%
Country Exports Imports Total
Somalia -58% 22% 5%
Mauritius 16% 1% 5%
Mauritania 2% 12% 4%
Gabon 1% 15% 2%
Liberia 459% -53% -1%
Angola 1% -25% -2%
DR Congo -20% 10% -3%
Congo -13% 51% -3%
Senegal -39% 15% -4%
Namibia -31% 10% -9%
Equatorial Guinea -9% -11% -9%
Nigeria -12% -12% -12%
Guinea-Bissau -30% -8% -16%
Cabo Verde 138% -20% -16%
Benin -30% -27% -28%
Source: Africa House Analysis based on COMTRADE data
The commodities downturn during the last decade has seen reductions in total volumes among 37% of countries in SSA. With the exceptions of Namibia and Somalia, the worst affected countries are all in West Africa. Although volumes might have recovered, many countries have experienced a severe decline in their terms of trade.
On the whole, imports have remained steady with only 23% of countries experiencing reduced volumes. It should be borne in mind that many of these imports are staple foods such as rice, maize and wheat, which need to be imported regardless of the decline in exports.

Strengthening Africa’s gateways to trade22
3. Volumes
On the whole, imports have remained steady with only 23% of sub-Saharan countries experiencing reduced volumes
Key imports and exports by country
An analysis of trade statistics shows that trade in SSA is strongly based on commodities with palm oil, gold and diamonds, crude oil, cocoa, timber, and other precious metals being the main export commodities by value. Crude oil, petroleum, copper, iron ore and coal account for the biggest share of export tonnages.
Significant trends observed in our analysis include:
• A high proportion of exports to a single country, which makes exporting countries vulnerable to market fluctuations;
• China being the predominant export destination; and
• Highest growth in volume to single destinations – exports are becoming more single-market oriented.
There is large variability in the exports and imports of some products, making port investment risky when volumes are unstable from year to year. Machinery and equipment, chemicals, petroleum products, scientific instruments and foodstuffs are the main imports by value, whereas cement, rice, wheat, maize, fertilisers and cocoa beans are more important in terms of volume.
Nigeria is the largest commodity exporter in Africa, with commodities accounting for 39% of GDP and fossil fuels making up ±96% of exports by value in 2016, a reflection of the economy’s dependence on the oil & gas sector.
Angola has the highest commodity concentration of all established economies with 99.6% of merchandise exports being related to fuels (96.5%) and precious stones, metals and ores (3.1%) over the past five years.18
In contrast, the South African economy has one of the most diversified economies in SSA with commodities accounting for ±13% of GDP and 60% of merchandise exports by value, although precious stones, metals and ores account for 65% of commodity exports.
Other Southern African and East African regional economies are relatively diversified, although extractive commodities also make up the largest share of exports.
18 PwC calculations based on data from Trade Map

PwC 23
3. Volumes
Figure 14: Value of commodity exports from top-15 sub-Saharan countries (US$ millions)
Source: PwC analysis, www.worldstopexports.com/top-african-export-countries/
0
10 000
20 000
30 000
40 000
50 000
60 000
70 000
80 000
90 000
100 000
110 000
Zim
babw
e
Nam
ibia
Moz
ambi
que
Ken
ya
Tanz
ania
DR
Con
go
Equa
toria
l Gui
nea
Con
go
Zam
bia
Bot
swan
a
Gha
na
Cot
e d’
Ivoi
re
Sout
h Af
rica
Ango
la
Nig
eria
107
000
69 7
85
49 4
78
9 91
4
12 4
32
6 33
2
8 41
4
9 75
8
14 4
14
3 47
0
3 11
8
3 69
7
3 87
9
4 36
0
5 98
4
1111 8 23 3 3 2 2 1 1 1 1 1 1 1 1
% of total African merchandise exports
Regional port volumesAn estimated 14.5 million containers are handled at SSA ports each year. The freight volumes passing through ports in each subregion in containerised, and bulk and break-bulk freight is presented respectively in Figures 15 and 16. Since most exports are of bulk commodities, imports are largely driving demand for containerised freight.
Figure 15: Container traffic (proportion of TEUs handled)
Source: PwC analysis. Compiled from the latest available port information
5%
41%
18%
36%
West Africa
East Africa
Southern Africa
Island ports
Although containerised freight arriving at West African ports is distributed fairly evenly among a number of ports, trade in Southern African is dominated by South African ports, which make up 76% of containerised traffic in Southern Africa.
Figure 16: Bulk and break-bulk volumes
Source: PwC analysis. Compiled from the latest available port information
2%
72%
13%
13%
West Africa
East Africa
Southern Africa
Island ports
67% of the port and terminal operators interviewed in Southern Africa strongly agree that their port is growing rapidly and they urgently need to increase draughts and enhance quayside and port entrances

Strengthening Africa’s gateways to trade24
3. Volumes
Largest ports
Figure 17 shows the capacity of African container ports in terms of twenty-foot equivalent units (TEUs). Durban is by far the largest port in Southern Africa, Abidjan in West Africa and Mombasa in East Africa. Of these large ports, Abidjan’s likelihood of developing into a major regional hub port is the most vulnerable given the likely future competition from North African (Tangier) and Mediterranean ports.
It should be noted that very few sub-Saharan ports can accommodate Post Panamax and Super Panamax vessels.
10 ports in SSA handle more than 500 000 TEUs per year
Figure 17: Capacity of SSA container ports
Source: African Development Bank
Nouadhibou
Nouakchott
DakarBanjul
Kamsar
Conakry
Freetown
Monrovia
San Pedro
Abidjan
Takoradi
Tema
Lomé
CotonouLagos (Apapa)
Onne
Malabo
São Toméand Príncipe
Bata
OwandoLibreville
Pointe-Noire
Luanda
Lobito
Namibe
Port Gentil
Walvis Bay
Luderitz
Saldanha
Cape Town East London
Beira
Pemba
Mtwara
Dar es Salaam
Tanga
Mombasa
Mogadishu
Berbera
Djibouti
Maputo
Richards Bay
Durban
Douala
Ngqura
Praia
Kribi
Matadi
Cabinda
Nacala
Toamasina
Victoria
Mutsamudu
Port Louis
Lamu
Massawa
Port Sudan
Soyo
Volume/throughput
Design capacity
Key
Note: Map prepared using available data

PwC 25
3. Volumes
In terms of actual freight handled (see Figure 18), 10 ports in SSA handle more than 500 000 TEUs per year, and only two of these handle more than a million per year. Only Durban handles more than two million TEUs per year. Almost half of all containers at Southern African ports move through the port of Durban.
Figure 18: TEU share of 10 largest ports (TEUs p.a.)
Source: PwC analysis. Compiled from the latest available port information
0
500 000
1 000 000
1 500 000
2 000 000
2 500 000
3 000 000
Djibou
ti
Mom
basa
Dar es
Sala
am
Durban
Nqgura
Cape T
own
Luan
da
Lago
s-Apap
aTe
ma
Abidjan
West Africa Southern Africa East Africa
Figure 19 shows the SSA ports that handle more than 10 million tonnes of bulk and break-bulk freight per year. Four of the eight largest bulk ports are in South Africa, of which two, Saldanha and Richards Bay, are specialist ports handling iron ore and coal respectively. In addition to being the largest container port, Durban also handles the third-largest bulk and break-bulk volume.
Only one large specialist bulk port is located in West Africa, whereas the two East African ports (Mombasa and Dar es Salaam) handle containers, bulk and break-bulk freight.
Figure 19: Largest ports by bulk and break-bulk
Source: PwC analysis. Compiled from the latest available port information
0
20 000 000
40 000 000
60 000 000
80 000 000
100 000 000
120 000 000
Mom
basa
Dar es
Sala
am
Map
uto
Durban
Richar
ds Bay
Cape T
own
Saldan
ha
Nouad
hibou
Volume in tonnes
Southern Africa East AfricaWest Africa
Conclusions• The trade imbalance between the types of commodities imported and exported means
that many containers return empty, thereby absorbing valuable port capacity. This could be a significant advantage if exports could be processed or beneficiated to a state where they can be exported as containerised freight.
• Most imports arrive in containers, while most exports are of raw materials, meaning that greater port specialisation is required.
• Due to the fact that countries in SSA trade very little with each other, a large proportion of trade is seaborne rather than along overland connections. Although the development of intraregional trade is important, port infrastructure will remain essential for development of trade to the rest of the world.
Note: Ports in this figure and the remaining sections are arranged regionally from west to east

Strengthening Africa’s gateways to trade2626
4. Port performance
The efficiency and effectiveness of a port and port terminals is critical to success. Performance also has a direct impact on the efficiency and reliability of the transport network in which the port is just a node for the transfer of goods. High quay productivity does not mean much when ships have to wait at anchorage, while cargo delivery processes are slow and inland transportation networks are poor.
A range of physical, organisational, technological and institutional elements all play an integrated role in determining port capacity and efficiency. Although the sections below analyse each component separately, it is important to recognise that they contribute in an integrated manner to port capacity.
Operational inefficiencies and physical factors, including water depth, mooring places, land, equipment, access and so forth
can reduce port throughput, while technological factors impact the availability of real-time information for stakeholders and the streamlining of both import and export value chains.
Port capacity and utilisation assessments require multiple metrics. It should be appreciated that the aim of this study is to provide a broad overview of the investment focus, rather than to recommend specific improvements to individual ports.

PwC 27
4. Port performance
Port performance analysis (PPA)The following five metrics have been selected to test the performance of SSA ports against international best practice norms and standards:
• Port infrastructure – physical design, equipment and container stacking capacity of the port;
• Landside transport connections – quality and connectivity of landside transport connections;
• Vessel connectivity – links to main shipping line routes and vessel size;
• Port operations performance – the quality of the port infrastructure and efficiency of container handling; and
• Import/export processing efficiency – government processes and freight logistics efficiency.
These metrics were selected on the basis of demonstrating where the bottlenecks in port performance lie in order to guide investment decisions. For example, if it is found that port design capacity is sufficient, there is no point in investing in increasing the hard infrastructure if improved internal processes and equipment can release more functional capacity.
Port infrastructureDesign capacityIt is essential to understand the current and future capacity constraints of a port, and how these are defined. It is recognised that capacity constraints at ports often manifest in ship delays and longer turnaround times, but there is a clear distinction between seaside capacity (number and size of berths available, draught, etc.) and landside capacity constraints (access links, crane movements, stevedoring, etc.).
Given the importance of understanding where bottlenecks occur, it is reasonable to include both seaside and landside ports specialists when specific capacity analyses are undertaken to ensure that investment choices are correctly identified. In addition, smart operational improvements could alleviate some delays and release capacity with no or minor capital investment. A decision support tool for port expansion is included in Figure 6 on page 12. Developing a similar decision framework for land transport infrastructure and services falls outside the scope of this report, but its linkage with the port infrastructure expansion decision is shown on the diagram. The stated design capacity of ports in terms of theoretical volume throughput for the respective regions is shown in Figure 20.
Figure 20: Port design capacity in terms of theoretical volume throughput
38%
13%
49%
West Africa
East AfricaSouthern Africa
The efficiency and effectiveness of a port and port terminals is critical to success
Source: PwC analysis. Compiled from the latest available port information

Strengthening Africa’s gateways to trade28
4. Port performance
Comparing actual throughput (see Figure 21) with theoretical design capacity, we see that West African ports have by far the most spare capacity with only 60% of the installed capacity utilised, followed by Southern African ports with 75% utilisation. South African ports’ installed capacity is typically 60% of their design capacity.
Lagos-Apapa, Luanda, Dar es Salaam and Mombasa port volumes exceed their actual throughput capacities. For East African ports this is by a factor of more than two. This implies considerable delay (especially during busy periods) and means that significant capacity would have to be added to ports to meet future demand.
Figure 21: Comparison of throughput and theoretical capacity of selected ports (TEUs p.a.)
Source: PwC analysis. Compiled from the latest available port information
Figure 22 presents a list of some of the planned port investments to address current and future capacity shortfalls. The main challenge is in funding the investments required, and to select the right projects to address the capacity constraints.19
Transnet continues to invest heavily in the South African rail and ports network. In 2017, almost R1 billion was invested in the maintenance and acquisition of cranes, tipplers and dredgers in South African ports. Investments continue in the Waterberg region (predominately to support coal exports) and enhancements to the Port of Durban tank farm terminal which handles petroleum and diesel products for transportation through the new NMPP pipeline to Gauteng. New planned investments at the Port of Durban Maydon Warf quay, include wall strengthening and container terminal berth deepening, part of Transnet’s strategy to accommodate larger vessel sizes. Consideration is also being given to extending quay lengths, increasing channel depths and investing in larger outreach cranes. Other investments include enhancements to the manganese and coal export lines as well as investments to support line expansions in the Waterberg and Mpumalanga. In addition Transnet has acquired 1 319 new locomotives for the general freight and coal businesses, of which 541 new locomotives were in operation by October 2017.
19 Africa House Insight & Access Projects & Trade, www.africainfo.co.za
0
500 000
1 000 000
1 500 000
2 000 000
2 500 000
3 000 000
3 500 000
Djibou
ti
Mom
basa
Dar es
Sala
am
Durban
Ngqur
a
Cape T
own
Walv
is Bay
Luan
da
Point N
oire
Libre
ville
Douala
Lago
s-Apap
a
Coton
ouTe
ma
Abidjan
Mon
rovia
Free
town
Conak
ry
Dakar
Design capacity Volume/Throughput
West Africa Southern Africa East Africa
West African ports have the most spare capacity, followed by Southern Africa, with East African ports volumes exceeding their design capacity

PwC 29
4. Port performance
Figure 22: Planned port investments
Country location & value/level of funding
Name of project Stage in project cycle
Project description
Côte d’Ivoire US$50 million
Abidjan Logistics Hub
Pre-feasibility The Côte d’Ivoire Ministry of Transport, together with the authority of the Port of Abidjan (PAA) plans to build a logistics hub and parking lot for trucks in order to relieve traffic congestion around the Port of Abidjan. The project will be located at pk26 on the northern highway, 10 kilometres from the Yopougon-Gesco corridor and will cover a surface area of 25 hectares. The parking lot will have the parking space capacity of 800–1 000 heavy goods vehicles and will also include a living area for drivers. The location of the project will also host the loading and offloading of heavy goods vehicles from the inland of the country and provide access to the port for these vehicles. The project is aimed at relieving traffic congestion around the port area, reducing transportation costs and regulating the parking of heavy vehicles.
Côte d’Ivoire US$70 million
Abidjan Port Grain Terminal
Pre-feasibility The Côte d’Ivoire Ministry of Transport, together with the PPA plans to build three berths at the Port of Abidjan that will be able to cater for bulk carriers, as well as develop five hectares of land in order to build warehouses, thereby increasing storage capacities in bonded areas for operators.
Côte d’Ivoire US$150 million
Abidjan Port Wharf
Pre-feasibility The Côte d’Ivoire Ministry of Transport, together with the PAA, plans to build and operate an ore wharf at the Abidjan port in order to increase the port’s operational capacities, cater for bulk carriers andimproveexportandimportconditionsofminingproducts.Theproject includes the construction of three new berths, backfilling nine hectares of the land area around the port, the development of indoor storage areas and the installation of conveyor belts for the delivery of products to the storage areas.
Côte d’Ivoire US$606 million
Ferkessédougou Dry Port
Pre-feasibility The Côte d’Ivoire Ministry of African Integration and Ivoirians Living Overseas aim to build and operate a dry port in Ferkessédougou and thereby reduce congestion at the Abidjan port. The main components of the project are: a logistics platform, a hydrocarbon depot, a regional abattoir and cattle market and an industrial zone for the development of agricultural and mining processing facilities.
Côte d’Ivoire US$520 million
San Pedro Port Container Terminal Relocation andExpansionProgramme
Planning In order to meet the growing requirements and cargo entering the Port of San Pedro, the Côte d’Ivoire Ministry of Transport, together with the authority of the Port of San Pedro (PASP), plans to relocate andexpandthecontainerterminalattheport.Theprojectincludesthe construction of a 700-metre quay (18 metres deep), access roads, the development of quayside land covering a surface area of 28 hectares and with a capacity of 1 000 000 TEU/year; dredging of the basin, and the supply and installation of transhipment equipment.
Côte d’Ivoire US$10 million
San Pedro Port Mixed-UseCommercial Terminal
Pre-feasibility The Côte d’Ivoire Ministry of Transport, together with the PASP, planstoconstructacommercialmixed-useterminal.Theterminalwill be used for the treatment of conventional goods, roll-on/roll-off(ro-ro)traffic,palmoilexportsandcerealimports.Theterminalwill be developed on a surface area of five hectares and will also include two warehouses.

Strengthening Africa’s gateways to trade30
4. Port performance
Country location & value/level of funding
Name of project Stage in project cycle
Project description
Côte d’Ivoire US$40 million
San Pedro Port Mixed-UseIndustrial Terminal
Pre-feasibility The Côte d’Ivoire Ministry of Transport, together with the PASP planstoconstructamixed-useindustrialterminal.Theconstructionwill include a 270-metre linear wharf (depth of 14 metres), the development of a storage area for the trafficking of minerals (iron ore and manganese) and supplying and installing transhipment equipment.
Côte d’Ivoire US$240 million
Vridi Lagoon Bay Backfilling & Development Programme & Vridi Bietry Bridge
Early implementation
The Côte D’Ivoire Ministry of Transport, together with the PAA plans to create industrial space around the Port of Abidjan in order to address the issue of the saturation of 800 hectares of existingPortDomain,offerbetterconditionsforthetransitionofheavy goods vehicles and develop industrial and logistic activities that will ensure job creation. The project will be Implemented in three phases. The first phase, currently underway, includes the backfilling and development of 35 hectares of land at the level of the Vridi Lagoon Bay. The second phase includes the backfilling and development of an additional 100 hectares of land at the level of the Lagoon Bay. The third phase involves the construction of the Vridi-Bietry Bridge.
Kenya Not stated
Lamu Port Development
Early implementation
Developments include berths of which the first three are sheduled to come online in 2018. On completion of the development programme, the port will have 32 berths with a total length of 6 000 metres.
Mozambique US$869 million
Beira Port Terminal 11
Planning The Ministry of Transport and Communications has announced its plans for the construction of Terminal 11a, 11b and 11c at Beira port. The project will be implemented in three phases. Phase 1 includes the paving of a 20-hectare surface area for containers containing general cargo. Phase 2 will involve the construction of a fertiliser terminal and its supporting infrastructure and phase 3 involves the construction of Terminal 11c.
Mozambique US$500 million
Essar Beira Port Coal Terminal
Planning Essar Ports has announced that it plans to invest US$500 million toexpandcapacitiesattwoexistingIndianportprojects(Haziraand Salaya) as well as build a new coal terminal in Mozambique. The funds will be invested over 30 months. The new terminal will be located in the central Mozambican Port of Beira. Essar Ports signed a 30-year concession agreement with the Mozambican Government to develop the Beira coal terminal as a public-private partnership (PPP) project in August 2017. The project will be executedonadesign,build,own,operateandtransfer(DBOOT)basis through a subsidiary, New Coal Terminal Beira, SA (NCTB SA), which is a joint venture between Essar (which will own 70%) and Mozambique’s publicly-owned port and rail company, CFM (which will own the remaining 30%). The project is intended to enhance the coal-handling capacity of Mozambique by 20 million tonnes a year, in two phases of 10 million tonnes a year each.
Nigeria Not stated
Ibom Deep Sea Port (IDSP)
Planning The Federal Government of Nigeria, together with the Akwa Ibom State Government, plans to develop the Ibom Deep Sea Port (IDSP), located in the free-trade zone in the southeast of the Akwa Ibom State, southern Nigeria.

PwC 31
4. Port performance
Country location & value/level of funding
Name of project Stage in project cycle
Project description
Tanzania Not stated
Bagamoyo Special Economic Zone Project
Planning The Tanzanian Government has approved the Bagamoyo Special Economic Zone Project, which is an integrated project that will include the development of a port and an adjoining industrial zone in Tanzania. The project will be implemented by the Oman Sultanate’s State General Reserve Fund (SGRF), along with its partner, China Merchants Ports (CMPorts). The project includes dredging of the navigational channel, construction of a port and logistics park and the development of the portside industrial free zone. The first phase will include four marine berths, two of which will be allocated to containers. The first phase of the port will be developed parallel to the development of the supporting infrastructure, as well as the industrial zone associated with the port. An additional area of 700 hectares will be allocated for the futuredevelopmentoftheport,whichisexpectedtoaccommodategiant vessels.
Container stacking capacityIn-port container stacking capacity should be evaluated in conjunction with container volumes being handled and container dwell times, i.e. the time that the container spends in port after being offloaded or before being loaded onto the ship.
Higher volumes and longer dwell times require larger container yards for stacking. For example, the very large stacking capacities at West African ports such as Abidjan and Tema, compared to, say, Durban – which handles more than three times the number of containers – are due mainly to the longer container dwell times, which requires more stacking capacity in the port. In such cases, port container stacking needs are therefore due to handling and administrative inefficiencies, rather than container throughput volumes.
Although stacking capacity may be a serious constraint on capacity in some ports, investment should not be channelled to increase capacity when the bottleneck lies with container processing efficiency.
Figure 23: Container stacking capacity (TEU ground slot capacity)
Source: PwC analysis. Compiled from the latest available port information
Figure 23 shows container stacking capacity in terms of available ground slots for TEUs in a terminal. Depending on the terminal, containers are stacked two or three high (depending on the available equipment) and empties may be stacked higher. Good operating practice keeps containers in the terminal stack for the shortest possible time, usually through charging higher prices for storage. In West African ports TEU ground slot capacity is reportedly high as a consequence of the need for terminal operators to keep containers for extended periods of time.
West Africa Southern Africa East Africa
0
5 000
10 000
15 000
20 000
25 000
Djibou
ti
Mom
basa
Dar es
Sala
am
Map
uto
Durban
Cape T
own
Walv
is Bay
Luan
daLo
me
Pointe
-Noir
e
Libre
ville
Douala
Lago
s-Apap
aTe
ma
Abidjan
Mon
rovia
Free
town
Conak
ry
Dakar

Strengthening Africa’s gateways to trade32
4. Port performance
Supporting transport networks
Importance of hinterland transportation connectionsPorts are an integral part of the overall transport and logistics chain. Port authorities and governments therefore need to look beyond national boundaries to achieve the best regional efficiencies, and to increase port catchments beyond national borders. At the same time, port development also needs to focus on maximising value creation for all stakeholders.
As ports are a node in a transport system, their efficiency is linked to overall transport infrastructure capacity. Of the 54 countries in Africa, 16 are landlocked, making land transport connections between ports and the hinterland even more important. The transport network determines how efficiently goods can be imported and exported, which in general means that countries pay more for their imports and get less for their exports if connections are poor.
Global terminal operators have recognised the importance of hinterland transportation and different logistics concepts. For instance, DP World has received a concession to develop and operate a new logistics centre in Kigali, Rwanda. The terminal will have a storage yard capacity of 50 000 TEUs and a warehouse facility. With this facility, Rwanda aspires to become a logistics hub for its region, including Burundi and the eastern parts of the Democratic Republic of Congo (DRC). The hub function is desired by many ports and terminals, while adjacent free-trade zones and industrial complexes are seen as an instrument for economic growth.
Road and rail Road and rail connections are a lifeline for many landlocked countries. Therefore, the race between ports to be recognised as a gateway depends to a large extent on the success of road and rail infrastructure and how effectively these reach the hinterland.
From a transport and logistics viewpoint, the main railway ports in East Africa are Mombasa, Djibouti, and Dar es Salaam, and Maputo in Southern Africa. Lamu in Kenya and Bagamoyo in Tanzania are ambitious new ports and special economic zones, but lack viable supporting railway networks at present.
Other rail and road-related projects planned or currently underway include:
• The Addis Ababa-Djibouti Railway which began commercial operation on 1 January 2018.20 The 756-km electrified railway is a joint venture between landlocked Ethiopia, Djibouti and China. It is the first cross-border and longest electrified railway in Africa. Freight capacity is expected to reach 24.9 million tonnes by 2025.21
• The Lamu Port-South Sudan-Ethiopia Transport (LAPSSET) Corridor will connect the port of Lamu, Kenya, with Sudan and Ethiopia via an 880-kilometre highway and a 1 710-kilometre railway. The LAPSSET Corridor Programme is East Africa’s largest and most ambitious infrastructure project consisting of seven key infrastructure projects, including:
• a new 32-berth port at Lamu (Kenya);
20 “Chinese-built Ethiopia-Djibouti railway begins commercial operations”, New China, 1January 2018,www.xinhuanet.com/english/2018-01/01/c_136865306.htm.
21 David Rogers, “Ethiopia steams ahead with vision for a modern national rail network”. Global Construction Review. 17 February 2015, www.globalconstructionreview.com/markets/ethiopia-steams-ahead-vision-modern-n8a8t8i8o8n8al/
Freight capacity of the Addis Ababa-Djibouti Railway is expected to reach 24.9 million tonnes by 2025

PwC 33
4. Port performance
• interregional highways from Lamu to Isiolo, Isiolo to Juba (South Sudan), Isiolo to Addis Ababa (Ethiopia), and Lamu to Garsen (Kenya);
• crude oil pipeline from Lamu to Isiolo, Isiolo to Juba;
• product oil pipeline from Lamu to Isiolo, Isiolo to Addis Ababa; and
• interregional standard-gauge railway lines from Lamu to Isiolo, Isiolo to Juba, Isiolo to Addis Ababa, and Nairobi to Isiolo.
• MWAPORC (Mwambani Port and Railway Corridor Company) includes the development of a deepsea port at Mwambani, Tanzania, handling bulk and up to 18 000-TEU container ships. An 8 500-kilometre railway is to link the Indian Ocean from Tanzania through Rwanda, Uganda and Congo all the way to the South Atlantic Ocean.
Listed below we have highlighted a few of the additional rail and road-related developments activities across sub-Saharan Africa. 22
Figure 24: Additional rail and road related deveopments
Country location & value/level of funding
Name of project Stage in project cycle
Project description
Côte d’Ivoire US$1.2 billion
Dabou-San Pedro Highway Rehabilitation Programme
Conceptual The Côte d’Ivoire Ministry of Economic Infrastructure plans to rehabilitatetheroadbetweenDabouAndSanPedro(approximately400 kilometres), in order to maintain viable access to the south-west parts of the country. The first phase of the project involved the rehabilitation of the Abidjan-Dabou Highway, which spans forapproximately50kilometres.SouthwesternCôted’IvoireIs considered a key area as it has the largest agro-industrial production and the country’s second-largest port.
Lesotho US$18.3 million
Lesotho Transport Infrastructure and Connectivity Project
Planning The World Bank has approved a US$18.3million loan for the Lesotho Transport Infrastructure and Connectivity Project. The aim of the project is to build capacity for the transport sector to deal with and manage road safety.
Regional – Burkina Faso, Côte d’Ivoire US$700 million
Burkina Faso-Côte d’Ivoire Railway Rehabilitation Programme
Planning French logistics company, the Bolloré Group, has signed an agreement with the Côte d’Ivoire Ministry of Transport for the rehabilitationoftheexistingrailwayinfrastructurebetweenCôted’Ivoire and Burkina Faso in order to relaunch operations for the transport of passengers and goods carried out by SITARAIL.
Regional – Lesotho, South Africa US$9.36 million
Maluti Transshipment Hub
Bankable feasibility
Corporate advisory firm, Africa Is Open For Business, plans to rehabilitateanddevelopthesix-hectarerailterminalinFicksburg,Free State Province, into a multi-commodity transshipment hub (rail and road interlink dry port). In addition, it plans to operate a railway concession between the Ficksburg and Bethlehem rail branches and the terminal.
Regional – Mozambique, South Africa US$321.4 million
Ressano Garcia Railway Line Rehabilitation Programme
Planning The Ministry of Transport and Communications has announced its plans to rehabilitate the Ressano Garcia Railway line. The project is part of Mozambique’s Ports & Railway Company (CFM) network. The line is 88 kilometres long and serves part of the cargo transportation network into South Africa and vice versa. It begins in Ressano Garcia at the Lebombo border with South Africa and ends at the Maputo Port. The project will be implemented in two phases. The first phase will be implemented by Transnet.
22 Africa House Insight & Access Projects & Trade, www.africainfo.co.za

Strengthening Africa’s gateways to trade34
4. Port performance
Country location & value/level of funding
Name of project Stage in project cycle
Project description
Regional – Rwanda, Tanzania US$900 million
Isaka-Kigali Standard Gauge Railway
Bankable feasibility
The Tanzanian president and Rwandan President have agreed to begin the construction of the Isaka-Kigali standard-gauge railway (SGR) in 2018. The SGR will connect Kigali via Isaka to the Port of Dar es Salaam. The 400-kilometre railway will be jointly financed by the two countries. The feasibility studies and other preparations have been completed for the project. Tanzania has already begun with the construction of the SGR in two phases. The first is from Dar es Salaam to Morogoro and the second is from Morogoro to Makutupore in Dodoma. The two phases have secured funding from local sources.
Regional – Tanzania, Uganda US$1.2 million
Masaka-Kumunasi Road
Planning The preparation phase for the proposed Masaka-Kumunasi Road, which will link Uganda and Tanzania through Masaka and Kumunasi respectively, has recently commenced. The African Development Bank (AfDB)’s East Africa Regional Resource Centre (EARC) and the East African Community (EAC) have signed a financing agreement to the value of US$1.2 million to finance the project’s preparation phase of three key multinational road sections between Masaka in Uganda to Kumunasi in Tanzania. The key multinational road sections that will be covered under the agreement for preparatory works include, Masaka to Mutukula Section (89.5 kilometre) in Uganda, Mutukula to Kyaka Section (30 kilometre) in Tanzania as well as Bugene to Kasulo to Kumunasi Section (133 kilometres)alsolocatedinTanzania.
Zambia Not stated
Kafue- Mazabuka Road Rehabilitation Project
Pre-feasibility The well-known Kafue-Mazabuka road is to be rehabilitated. The road is a gateway to the Victoria Falls and the two borders at Kazungula and Sesheke, two of the country’s important entry andexitpoints.TheroadisalsoacentralfeatureoftheWalvisBay-Ndola-Lubumbashi Development Corridor (WBNLDC) and the North-South Corridors. Most of the cargo freight from Wenela/Katima-Mulilo, Kazungula and Victoria Falls borders passes through this stretch before proceeding to Ndola and eventually Kasumbalesa-Lubumbashi (DRC) and the Nakonde and Tunduma borders in Zambia and Tanzania respectively.

PwC 35
4. Port performance
Figure 25: Railway connections
Source: PwC
Nouadhibou
Nouakchott
DakarBanjul
Kamsar
Conakry
Freetown
Monrovia
San Pedro
Abidjan
Takoradi
Tema
Lomé
CotonouLagos (Apapa)
Onne
Malabo
São Toméand Príncipe
Bata
OwandoLibreville
Pointe-Noire
Luanda
Lobito
Namibe
Port Gentil
Walvis Bay
Luderitz
Saldanha
Cape Town East London
Beira
Pemba
Mtwara
Dar es Salaam
Tanga
Mombasa
Mogadishu
Berbera
Djibouti
Maputo
Richards Bay
Durban
Douala
Ngqura
Praia
Kribi
Matadi
Cabinda
Nacala
Toamasina
Victoria
Mutsamudu
Port Louis
Lamu
Massawa
Port Sudan
Soyo
Note: Map prepared using available data

Strengthening Africa’s gateways to trade36
4. Port performance
Ports that can accommodate larger vessels generally have a higher capacity than comparable ports that can only handle smaller vessels
Vessel connectivityLiner shipping connectionsWhereas bulk carriers are designed and deployed to carry bulk product efficiently between specific ports, container ships follow particular routes that include multiple ports. Precise scheduling is less important for bulk freight (the vessels which are often independently contracted per voyage), for which services are planned between two specific ports. Ship size can also be planned to accommodate the limitations of the ports and route.
Liner shipping, however, adheres to strict time schedules that creates certainty in seaborne trade and allows complex just-in-time logistics practices. Good liner shipping connectivity is important for the following reasons:
• It increases competition between shipping lines;
• Less reliance on more costly and irregular charter services;
• Higher frequency of freight arrivals reduces the need for high stock levels and the associated cost of storage and unproductive capital locked up in stored goods;
• Better connectivity means that a country can be included in the international logistics network, creating export opportunities, and allowing lean manufacturing practices.
Shipping line connectivity to SSA ports is generally poor with only South Africa achieving a score above 20 in UNCTAD’s Liner Shipping Connectivity Index (see Figure 26). Ports with very good connectivity would typically be rated above 70, whereas the best Asian ports score above 100. South Africa compares well with other emerging economies such as Brazil and Mexico, which also score around 30. However all African ports, including South Africa’s fall short of international benchmarks.
Figure 26: Liner Shipping Connectivity Index
Source: UNCTAD (http://unctadstat.unctad.org/wds/TableViewer/tableView.aspx?ReportId=92)
0
5
10
15
20
25
30
35
Djibou
ti
Somali
a
Kenya
Tanz
ania
Seych
elles
Comor
os
Mau
ritius
Mad
agas
car
Moz
ambique
South
Afri
ca
Namibia
Angola
Cabo
Verd
eTo
go
DR Con
go
Congo
Gabon
Camer
oon
Nigeria
Benin
Ghana
Côte d
’Ivoir
e
Liber
ia
Sierra
Leon
e
Guinea
Guinea
-Biss
au
Gambia
Seneg
al
Mau
ritan
ia
*The benchmark of ports with good connectivity is a score of 70
West Africa Southern Africa
EastAfrica
Islands
Isl
and

PwC 37
4. Port performance
Although distance might be a factor contributing to higher shipping costs for commodities going to Asian markets compared to Australia, countries like Brazil, which is equally far, have been able to overcome their cost disadvantage through innovative investments in ports and bulk carriers.
Given that South African ports outperform those in East Africa and West Africa, which are arguably closer to trade routes, there is no evidence that distance from trade routes plays a significant role in SSA’s poor container line shipping connectivity.
The main reasons for the poor connectivity at SSA ports can therefore be ascribed to:
• Low freight volumes means it is not cost effective for shipping lines.
• SSA ports are unable to accommodate vessels above a certain size due to draught channel and equipment limitations. Shipping lines adopt the most efficient vessels for particular routes. If a specific port is unable to handle the size of ship on the route it is unlikely that the line would compromise on the economies of scale offered by larger ships to accommodate a specific port’s limitation.
• Port inefficiencies delay ships, which makes calling at a port more costly, and often results in unexpected delays that interfere with travel time schedules and increase costs to shippers (see discussion below).
To improve liner connectivity, we propose the following approach:
• Increasing freight volumes by identifying hub ports to attract more and larger ships by concentrating freight.
• Focusing investment on hub port expansion to accommodate larger ships.
• Improving port performance and specifically transshipment efficiency to allow efficient servicing of minor ports.
• Enhance liner competitiveness to establish an SSA-focused shipping line.
Vessel sizeThe maximum vessel size that can be accommodated by a port impacts port performance in two ways. Firstly, those that can only accept smaller vessels limit the number of shipping lines that can call at the port. Secondly, accommodating larger ships enable ports to increase
their capacity by increasing ship working time, thereby better utilising equipment. Ports that can accommodate larger vessels therefore generally have a higher capacity than comparable ports that can only handle smaller vessels.
Vessel size is limited mainly by the draught of the channel, pier, anchorage, width of channels, berth length and reach of equipment. Our research found that the major constraint at SSA ports is receiving larger vessels and this is related to draught limitations (see Section 5 for a discussion of the latest trends in liner shipping). Internationally, a port depth of at least 16 metres is the norm for large ports, while 17 metres is preferred.
For ports to accommodate Panamax size vessels, the draught of the port channel, pier and anchorage needs to exceed 12 metres. Although half of the ports analysed have the required channel and anchorage depths, very few have the required pier depth. The significance of this is that the enlargement of the Panama Canal enables New Panamax vessels to be larger, requiring a draught of at least 15 metres. As Panamax vessels are being replaced by New Panamax vessels on high-volume routes, it would be logical for these vessels to be re-allocated onto Africa’s lower-volume routes. If ports in SSA are unable to accept these vessels, the opportunity to encourage the replacement of less-efficient vessels on African routes will be lost.
Although a number of SSA’s bulk and oil & gas terminals can accept carrier vessels of greater than 60 000 dwt and Cape Size Bulk vessels (125 000 to 220 000 dwt) these are more difficult to accommodate. Bulk and oil & gas terminals thus consist mainly of finger jetties with ship loaders or conveyors loading ships.

Strengthening Africa’s gateways to trade38
4. Port performance
Port operational performance
Even if ports can accommodate larger vessels, the quality of port equipment and operations needs to be sufficient to process a sufficient number of containers to make it economical for such ships to call at a port
important to establish whether handling inefficiencies were the result of poor equipment or operational issues.
Although there are many other measures of operational performance, such as vessel turnaround time and berth productivity, these are largely a function of how quickly a vessel can be loaded and offloaded. Freight dwell time, the duration that cargo stays in port before shipment or after discharge, is dealt with under logistics efficiency, which includes the customs clearance processes and the speed with which containers can be moved overland from the port.
While port operational performance is related to physical port capacity, we tried to isolate the measurement of freight handling while the vessel is moored.
Even if ports can accommodate larger vessels, the quality of port equipment and operations needs to be sufficient to process a sufficient number of containers to make it economical for such ships to call at a port. If handling efficiency is poor, large ships stay in port longer, thereby incurring additional cost and wasting time. This could diminish the economies of scale offered by a larger vessel to such an extent that smaller, often older vessels become the best choice for shipping lines.
The operational performance of SSA ports are measured below in terms of their container handling efficiency, the speed at which freight is loaded and offloaded from ships, and the quality of the port infrastructure. While the quality of infrastructure influences handling speed, for the purposes of this study it was
Figure 27: Best performing ports in terms of TEUs per ship working hour
Source: PwC analysis
0
10
20
30
40
50
60
70
Mom
basa
Durban
Ngqur
a
Cape T
own
Pointe
-Noir
e
Libre
ville
Lago
s-Apap
a
Coton
ouTe
ma
Abidjan
Conak
ry
West Africa Southern Africa EastAfrica
Container handling efficiencyThe best performing SSA ports’ efficiency in terms of TEUs per ship working hour is only about 60% of best practice international standards. Durban, which is the best performing SSA port, handles almost 30 containers per hour less than Rotterdam. In addition, only six of the 10 largest SSA ports (Abidjan, Tema, Lagos-Apapa, Cape Town, Nqgura and Durban) fall into the best performing list, which includes all ports that handle more than 30 TEUs per hour (see Figure 27).

PwC 39
4. Port performance
It is significant that the smaller ports are where we see lowest performance, except for Luanda which is regarded as a midsize port, but performs poorly. This suggests that operational improvements at larger ports have to some extent kept pace with what is expected from modern ports.
Figure 28: Worst performing ports in terms of TEUs per ship working hour
Source: PwC analysis
0
2
4
6
8
10
12
14
Mut
sam
udu
Pemba
Luan
da
Mat
adi
Tako
radi
Mon
rovia
Nouak
chot
t
Nouad
hibou
West Africa Southern Africa Islands
Quality of port infrastructureThe World Economic Forum (WEF) annually publishes its Quality of Port Infrastructure Rating, a measure of business executive’s perception of their country’s port facilities. The quality of port infrastructure is rated on a seven-point scale, where 1 is extremely underdeveloped and 7 is well developed and efficient by world standards.23 Port infrastructure has a significant impact on freight cost. According to the World Trade Report, handling costs for low scoring ports are typically three times higher than those of high scoring ports.24
The WEF survey shows that SSA countries’ score of 3.4 is well below that of countries in the Eurozone (5.1) and East Asia & Pacific (4.4). Only eight of the 21 SSA countries assessed have a rating above four. Within SSA, performance is also mixed, with West Africa (3.8) scoring slightly better than East Africa (3.5). Although Southern Africa scores well (4.4), the results are skewed by the good performance of South Africa and Namibia, masking the very poor performance of Angola and Mozambique.
23 Klaus Schwab, The Global Competitiveness Report 2016-2017, World Economic Forum, 2017.
24 World Trade Organization, World Trade Report, WTO, 2004.
Figure 29: Quality of Port Infrastructure Rating
Source: World Economic Forum, 2016
0.0
1.0
2.0
3.0
4.0
5.0
6.0
Kenya
Tanz
ania
Mau
ritius
Moz
ambique
South
Afri
ca
Namibia
Angola
Gabon
Camer
oon
Nigeria
Ghana
Côte d
’Ivoir
e
Liber
ia
Sierra
Leon
e
Seneg
al
Mau
ritan
ia
2.7
4.1
2.8
3.6
5.2
3.5
3.03.3
5.2
2.7
4.9
3.6
4.7
3.4
4.2
3.2
West Africa Southern Africa EastAfrica
Isl
and

Strengthening Africa’s gateways to trade40
4. Port performance
In order to better appreciate the relationship between infrastructure quality and container handling efficiency, we developed a container handling efficiency rating based on a SSA benchmark of 40 container moves per ship loading hour. A comparison of port infrastructure quality and the container handling rating in Figure 30 shows that despite the relatively poor quality of equipment as compared to global best practice, there is much scope to make better use of available infrastructure. Put in another way, investment in port infrastructure should be accompanied by extensive operational restructuring to make a real impact on overall operational performance.
Figure 30: Infrastructure quality vs container handling efficiency
Source: PwC analysis, World Economic Forum
0.0
1.0
2.0
3.0
4.0
5.0
6.0
Kenya
Tanz
ania
Mau
ritius
Moz
ambique
South
Afri
ca
Namibia
Angola
Gabon
Camer
oon
Nigeria
Ghana
Côte d
’Ivoir
e
Liber
ia
Sierra
Leon
e
Seneg
al
Mau
ritan
ia
West Africa Southern Africa
EastAfrica
Isl
and

PwC 41
4. Port performance
Import/export processing efficiency
Of the port and terminal operators interviewed in Southern Africa, 67% strongly agree that the road network around their port is not suitable to sustain port volumes. 50% of West Africa interviewees strongly agree with this view
Processing efficiency can be measured by the container dwell time in the port as well as through logistics efficiency surveys that express stakeholders’ impressions of the efficiency of the system.
Container dwell timeDwell time in African ports, i.e. the amount of time from when a container is offloaded until it leaves a port, may be up to four times longer than in Asia. As more than 50% of total land transport time from port to hinterland cities in landlocked SSA countries is spent in ports, reducing port dwell time is critical to improving logistics efficiency.25
It is commonly assumed that controlling agencies such as customs are primarily responsible for long port delays, with infrastructure issues being a secondary cause. This is also reflected in the customs efficiency rating, which is consistently lower than the overall Logistics Performance Index at SSA ports (see Figure 32).
Other studies, however, suggest that this assumption may be incorrect in most ports in SSA and that it is indeed freight forwarders that benefit financially from delaying containers in the port.26 Finding the
25 Jean-François Arvis, Gael Raballand and Jean-François Marteau. The Cost of Being Landlocked, The World Bank, 2010.
26 Gael Raballand, Salim Refas, Monica Beuran, et al, Why Cargo Dwell Time Matters in Trade, The World Bank, 2012.
underlying reasons for cargo delays in ports is crucial to understanding whether institutional port reform, customs reform or infrastructure investment are the most appropriate interventions required.
Based on the finding of these studies, complemented by anecdotal information gathered during interviews with stakeholders, we have identified the following major causes of excessive dwell time at some SSA ports:
• Customs clearance processes;
• Landside connections not able to move containers out of the port quickly enough; and
• Freight forwarders charging clients demurrage for the additional time for keeping containers in port and therefore being slow to process clearance.
These operational issues should be resolved before a decision is made to invest in infrastructure improvements to improve port performance.
Figure 31: Container dwell time (days)
Source: African Development Bank, 201027
27 African Development Bank, African Development Report 2010: Ports, Logistics and Trade in Africa, AFDB, 2010, Table 2.7, p. 47.
0
5
10
15
20
25
30
Port S
udan
Mom
basa
Dar es
Sala
am
Toam
asina
Map
uto
Durban
Cape T
own
Walv
is Bay
Luan
da
Mat
idi
Douala
Lago
s
Coton
ouTe
ma
Dakar
7
25
22
12 12
26
12
86
28
26
7
2222
9
54
West Africa Southern Africa East Africa
Isl
ands

Strengthening Africa’s gateways to trade42
4. Port performance
Logistics efficiencyThe World Bank’s Logistics Performance Index (LPI)28 assesses a country’s logistics efficiency based on its customs clearance process, quality of trade- and transport-related infrastructure, ease of arranging competitively priced shipments, quality of logistics services, ability to track and trace consignments, and frequency with which shipments reach the consignee within the scheduled time. The index ranges from 1 to 5, with a higher score representing better performance.
Figure 32 shows that customs clearance is a significant contributor to the overall poor performance of port efficiency. This indicator scores consistently lower than the overall LPI of the countries surveyed.
28 Jean-François Arvis, Daniel Saslavsky, Lauri Ojala, et al, Connecting to Compete 2016: Trade Logistics in the Global Economy, The Logistics PerformanceIndexandItsIndicators,TheWorld Bank, 2016, pp. 93-369.
Figure 32: Logistics Performance Index vs customs efficiency rating
Source: The World Bank, 2016
Even though South Africa ranks 25th in the world, it outperforms all other African ports by a considerable margin. As a general rule landlocked countries would not be able to perform better than the country whose ports it is forced to rely on.
On average, East African ports perform 12% better in terms of LPI than those in West Africa, while Southern Africa, skewed by the good performance of South Africa, scores marginally (4%) higher than East Africa. South Africa scores 27% better than East Africa.
Customs clearance and landside transport infrastructure perform worst of all indicators, and score more than 20% lower than timeliness of services, which scores best. In the case of landside transport infrastructure, survey respondents were most dissatisfied with rail infrastructure connections to ports.
Certain areas are more affected than others. In West Africa, customs clearance seems to be a bigger issue than in East Africa and Southern Africa. LPI survey results are supported by the data in Figure 31, which shows that West African ports such as Tema and Lagos have considerably higher container dwell times than East African ports such as Dar es Salaam and Mombasa, which are on par with South African ports.
Given the better quality of port infrastructure and higher design capacity of West African ports compared to those in East Africa, the latter perform relatively better due to their efficient operations. Capital investment in East African ports therefore has the potential to unlock the most value for investors.
0.0
0.5
1.0
1.5
2.0
2.5
3.0
3.5
4.0
Djibou
ti
Kenya
Tanz
ania
Comor
os
Mau
ritius
Mad
agas
car
Moz
ambique
South
Afri
ca
Namibia
Angola
DR Con
go
Congo
Gabon
Camer
oon
Nigeria
Benin
Ghana
Côte d
’Ivoir
e
Liber
ia
Sierra
Leon
e
Guinea
Guinea
-Biss
au
Gambia
Seneg
al
Mau
ritan
ia
LPI index score Customs efficiency score
West Africa SouthernAfrica
EastAfrica
Islands

PwC 43
4. Port performance
Global terminal operators bring the latest terminal-related systems, but ports are more than the interface point between modes of transport.
AutomationMany see automation as a way to improve productivity, safety, efficiency and competitiveness. Automation includes the use of various control systems for operating equipment such as automated guided vehicles (AGVs) and automatic stacking cranes (ASCs) to perform horizontal transfer and yard stacking. Semi-automation refers to automated yard stacking only. The first automated container terminal opened in 1993 at the Port of Rotterdam, while the first automated bulk terminal started operations in 2009 in the Port of Shanghai.
Ten years ago there were only five countries with automated or semi-automated container terminals, but now that number has tripled. Some are even located in regions where labour costs are relatively low. However, less than 5% of container ports or terminals are either fully or semi-automated. All these automated and semi-automated terminals are, however, able to handle the largest ships and handle very large volumes. Consequently, they can employ more ship-to-shore gantry cranes per vessel and thus ship turnaround times are further reduced.
A study conducted by CTI in 2016 found that 20 ports in Asia and Europe have seen a decline in berth productivity since the introduction of automation or semi-automation, suggesting these technologies do not necessarily improve performance in medium and small ports. Despite the call for more automation, many of the container ports and terminals that have pursued it have had difficulty achieving the levels of productivity they had before. None of these container ports and terminals were able to fulfil expectations of lower operating costs or increased berth and yard efficiency. Investment in highly automated systems may therefore not be appropriate for SSA ports.
Information technology Global terminal operators bring the latest terminal-related systems, but ports are more than the interface point between modes of transport. In the current digitally-focused environment and with logistics service providers expecting digital interfaces, there is a need for operators and other stakeholders to have the right information at the right time.
Having the right information results in more efficient and better-planned shipping and logistics. This will drive down costs and improve the efficiency of warehousing and manufacturing activity, thus improving African competiveness. Port community systems can bring improvements, but should be designed with the local community in mind. Information is no longer nice to have, but brings new insights, while the right technology can put smaller ports on a par with their bigger rivals.
Often, ports and terminals tend to look at what is happening elsewhere instead of looking at what is appropriate within the context of their own operations and the local logistics community. Merely adopting solutions that seem to work elsewhere, or taking a wait-and-see approach to investing in appropriate technologies, is not the right option. Innovation needs to address the real bottlenecks with appropriate technologies in the SSA context to improve reliability and quality of service at ports.

Strengthening Africa’s gateways to trade44
4. Port performance
Conclusions• Using the port performance analysis assessment and notwithstanding
the fact that each region and port has their own challenges, it is possible to draw the following conclusions about SSA ports:
– African ports generally operate at higher densities than American, European or Asian terminals due to land constraints.
– Terminal capacity utilisation is often constrained by vessel sizes, vessel utilisation and call frequency.
– Channel and berth draught are exogenous constraints that limit the more efficient use of larger vessels, which would lead to more efficient shipping patterns and the establishment of a greater focus on hub ports.
– There are significant opportunities in West Africa to create a hub port to accept very large vessels, and improve equipment and land transport connections, particularly given the number of close smaller ports in the region.
– Much of the handling inefficiencies and long container dwell times at SSA ports can be attributed to port management, and customs and associated container clearing processes, rather than poor infrastructure.
– Infrastructure tends to be well below global standards, despite most SSA ports having substantial unused design capacity in their infrastructure.

PwC 45PwC 45
5. Liner shipping changing port infrastructure needsIntroductionHistorically, ports and terminals had to compete on the basis of price leadership or value-added services. Over the last few decades, however, many locations introduced special economic zones around ports to further enhance the appeal of both the port and the economic benefit of the jurisdiction around the port (and thus the host country).
A further trend has emerged with ports positioning themselves as hub ports for transshipment to smaller neighbouring ports. This trend is particularly prevalent in West Africa where a number of ports are attempting to market themselves to provide such a service. Notwithstanding these ambitions, Figure 2 shows that in practice only a few African ports can truly be
classified as a hub port. In addition to the fact that most do not have the supporting landside regional transport system essential for the concentration of cargo flows required at a hub port, hub ports and terminals must also be able to accommodate larger ships and handle large volumes efficiently.

Strengthening Africa’s gateways to trade46
5. Liner shipping changing port infrastructure needs
From this perspective the following drivers have been identified:
• Ship size;
• Hub ports; and
• Carrier liner consolidation.
As the size of ships increases due to economies of scale, so ports’ willingness to be able to accept these ships increase. They are not able to merely accept these larger vessels as the port requirements differ largely as the size of the vessels change. New requirements for bigger vessels are a lot more infrastructure-intensive and improvements to infrastructure require more investment.
Vessel sizeAlthough larger vessels combined with hub ports offer increased efficiency, provided there are sufficient volumes, ports may not only have to accommodate bigger call sizes, but also fewer service calls. This will likely increase pressure on port infrastructure, requiring investment upgrades and new equipment to efficiently load and offload larger vessels.
The Alphaliner Database reported delivery of 136 vessels in 2016 with a total capacity of 934 000 TEUs, while 201 vessels with a capacity of 665 000 TEUs were scrapped.29 Deliveries were dominated by vessels with a capacity of more than 10 000, while mainly smaller and mid-sized vessels were scrapped. These vessels had an average scrapping age of 19 years. At the end of 2016, the container fleet stood at 20.3 million TEUs of which 6.9% was idle, but the global container fleet grew by 4% in 2016. The effect of overcapacity is lower freight rates, which will undermine the profitability of container carriers, but the consolidation wave will give them more economic control of certain routes and global regions.
The new ultra-large container ships are being deployed on the main
29 https://www.alphaliner.com/
East-West routes, whereas existing vessels are being pushed to smaller trade routes through the cascade effect. This will have an impact on African ports, but the magnitude may differ between different ports. Transshipment ports and terminals could, for example, come under threat especially if domestic cargo is insufficient to allow a direct port call. The balance between transshipment and domestic volume should ideally be around 40/60 to cope with a changing environment.
We are already seeing carriers redeploying ships on certain routes once ultra-large ships have been introduced on their main routes. This cascading may benefit smaller ports, but only if they can accommodate the depth of redeployed ships. A 2016 study by Hofstra University showed that only 38% of more than 500 container ports and terminals have a water depth of more than 14 metres, which limits the opportunities for redeploying larger ships to African ports.
Figure 33: Growth of container
Ship sizes are increasing. The Alphaliner Database reported delivery of 136 vessels in 2016 with a total capacity of 934 000 TEUs, while 201 vessels with a capacity of 665 000 TEUs were scrapped

PwC 47
5. Liner shipping changing port infrastructure needs
ships sizes
Type Year TEUs LOA (m) Beam (m) Draught (m) Berth depth (m)
Early container ship <1968 500-800 137 17 9 9.8
Cellular >1970 1 000-2 500 213-215 20-27.4 10-10.8 11.6
Panamax >1980 3 000-3 400 250 32 12.5 13.3
Panamax-Max >1985 3 400-4 500 290-294 32 12.2-12.5 13.3
Post-Panamax >1988 4 000-5 000 280-305 40-41.1 12.7-13 13.8
Post-PanamaxPlus >2000 6 000-8 000 300-347 42.9-43 14-14.5 15.3
SuperPost-Panamax >1997 8 000-11 400 320-380 43-47 14.5-15 15.8
Ultra Large Container ship >2006 14 500 380-400 56.4 15.5 16.3
NewPanamax >2010 12 500 366 49 15.2 16.0
Triple E >2013 18 000 400 59 16 16.8
MOL Triumph 2017 20 170 400 58.8 16 16.8
Maersk Madrid 2017 20 568 399 58.6 16.02 17.0
OOCL Hong Kong 2017 21 413 399.87 58.8 16 16.8
Nextgeneration >2021 24 000 430-456 62-65 16-16.5 17.3
Note: Maximum draught is rarely realised, even when vessels are fully laden, so required berth depth is less in practice Source: Experion Global

Strengthening Africa’s gateways to trade48
5. Liner shipping changing port infrastructure needs
The current generation of ultra-large container ships can expand towards a capacity of around 22 000 TEUs. The new generation container ships will have a capacity of at least 24 000 TEUs and these ships have different dimensions with an overall length of 430-456 metres, a beam of 62-65 metres and a similar draught to the current largest ships of 16 metres. Whether these new generation container ships will come into service is hard to predict, but besides the capacity debate, there are some other disadvantages attached to bigger ships. In any case larger ships will create more peaks in ports, and cities and will bring more pressure on hinterland transport.
Figure 34: Port water depth
Source: PwC analysis
Tema
7.6 7.6 21.3
12.5 11 9.4
10 7.6 15.2
9.1 10 18.2
– 10 6.1
10 7.6 10
12.2 9.1 16
10 7.6 13.7
10.2 – –
13.7 9.1 21.3
10 9.1 9.1
– – –
10 7.6 10
12.2 10 15.2
12.5 – –
12.5 – –
9.1 15.2 9.1
7.6 7.6 7.6
7.6 7.6 7.6
10 4.6 15.2
23.2 10 23.2
18.2 10 23.2
23.2 10 23.2
6.1 6.1 7.6
23 23 20.5
13.7 10 12.2
15.2 10 13.7
13.7 9.1 23.2
12.2 9.1 22.9
19.8 15.2 19.8
7.6 9.1 12.2
4.6 9.1 12.2
23.3 9.1 23.3
– – –
10 10 21.3
15 13.5 13.5
– – –
10 7.6 7.6
12.2 10 12.2
12.2 9.1 9.1
- 9.1 7.6
- 10 13.7
23.2 10 9.1
- 10 9.1
- 6.1 9.1
18.29.1
21.3
-3
10
Peer depth
Anchorage depth
Channel depth
Key
23.2 10 9.1
Nouadhibou
Nouakchott
DakarBanjul
Kamsar
Conakry
Freetown
Monrovia
San Pedro
Abidjan
Takoradi
Tema
Lomé
CotonouLagos (Apapa)
Onne
Malabo
São Toméand Príncipe
Bata
OwandoLibreville
Pointe-Noire
Luanda
Lobito
Namibe
Port Gentil
Walvis Bay
Luderitz
Saldanha
Cape Town East London
Beira
Pemba
Mtwara
Dar es Salaam
Tanga
Mombasa
Mogadishu
Berbera
Djibouti
Maputo
Richards Bay
Durban
Douala
Ngqura
Praia
Kribi
Matadi
Cabinda
Nacala
Toamasina
Victoria
Mutsamudu
Port Louis
Lamu
Massawa
Port Sudan
Soyo
Note: Map prepared using available data

PwC 49
5. Liner shipping changing port infrastructure needs
Sustained growth in port volumes provides ports with investment confidence, especially if these are accompanied by a promising national and regional economic outlook. Many African countries depend on commodity exports to support economic growth. Much of the demand for these commodities is centred on growth in the Chinese economy. Drewry believes that the forecast of 4% growth in global terminal throughput for 2017 is expected to hold into 2018.30 But throughputs at African ports handling more than 125 000 TEUs per annum rose by approximately 13%.
30 https://www.drewry.co.uk/
Drewry Research recently reported that the top five container carriers will control a little under 60% of the world’s container ship fleet by 2021
These figures indicate that volumes are beginning to recover after the economic slowdown in China that began in 2015, but many commodity-reliant ports report that volumes remain below those seen in 2014. Drewry foresees a good recovery in the medium to long term for the African region. Meanwhile, the OECD expects trade to outpace GDP growth for the next decade, although at a slower pace than prior to 2008.31 OECD estimates that world trade will grow at around 3.5% annually.
To conclude, carriers will take advantage of new deepwater terminals by employing larger ships. Consequently, there will be winners and losers depending on the strategy individual ports take. Those that rely on ship’s gear for cargo handling will always remain less attractive.
31 http://www.oecd.org/economy/oecd-sees-synchronised-momentum-for-global-economy-but-urges-further-policy-action-to-ensure-sustainable-and-inclusive-medium-term-growth.htm

Strengthening Africa’s gateways to trade50
5. Liner shipping changing port infrastructure needs
Hub ports
Figure 35: Hub port attractiveness
Source: PwC analysis
16
18
6
3315
8
22
16
16
26
25
46
24
40
31
40
32
30
192922
292118
18
12
30
22
28
17
5050
94
19
20
22
23
9
16
5
6
24
35
46
4
18
29
10
40
18
Note: Map prepared using available data
Nouadhibou
Nouakchott
DakarBanjul
Kamsar
Conakry
Freetown
Monrovia
San Pedro
Abidjan
Takoradi
Tema
Lomé
CotonouLagos (Apapa)
Onne
Malabo
São Toméand Príncipe
Bata
OwandoLibreville
Pointe-Noire
Luanda
Lobito
Namibe
Port Gentil
Walvis Bay
Luderitz
Saldanha
Cape Town East London
Beira
Pemba
Mtwara
Dar es Salaam
Tanga
Mombasa
Mogadishu
Berbera
Djibouti
Maputo
Richards Bay
Durban
Douala
Ngqura
Praia
Kribi
Matadi
Cabinda
Nacala
Toamasina
Victoria
Mutsamudu
Port Louis
Lamu
Massawa
Port Sudan
Soyo
Hub ports require a sufficient number of berth slots and freight volumes that balance in and outbound freight. It is important for a carrier that vessel utilisation is always above 60-65% and a liner service is well set up to limit the ‘end-station’ effect in which lower ship utilisation is common at ports at the extremities of the route. There may be significant
inefficiencies if large ships have to call at all ports on a route rather than terminating their service early at a hub port and allowing regional distribution by smaller ships.
It is important to note that competition between neighbouring ports is increasingly not about efficiency, but also the economic
power of container carriers, particularly given their route dominance in various parts of Africa. It is therefore also important to consider how the shipping liner industry is evolving and what influence shipping lines will have on port investment.

PwC 51
5. Liner shipping changing port infrastructure needs
Carrier line consolidationShipping lines find it difficult to align supply with demand. The capital-intensive nature of the industry and the long lead times required when adding new capacity means that supply and demand is rarely in balance. This has led to highly cyclical and fluctuating earnings. In addition, larger ships offer significant economies of scale, which means that container shipping lines can achieve cost savings by introducing vessels that reduce the unit cost of moving a container.
Given the highly competitive nature of the industry, all major lines are employing the same strategy to bring in ever-larger ships in order to retain their competitive advantage. Larger freight volumes provide opportunities for smarter operations, especially when trade volumes keep pace with ship capacities. More recently, however, trade imbalances and the decline in global trade have put container shipping lines at risk. The period since the 2008 financial crisis has therefore often been described as a lost decade for shipping.
Financial duress in the shipping industry has brought about a wave of carrier consolidations that will impact shippers, consignees, ports and terminals. Drewry Research recently reported that the top five container carriers will control a little under 60% of the world’s container ship fleet by 2021 (see Figure 36).32
It is not only large carriers that are consolidating into larger entities, but it is also expected that medium-size carriers will follow the wave of mergers and acquisitions. For example, the number of carriers deploying ships in Asia-North Europe trade dropped from 16 to nine between January 2015 and June 2017. In trans-Pacific trade the number declined from 21 to 16 over the same period.
32 https://www.drewry.co.uk/2017
The obvious consequence of these developments is that shippers and consignees have fewer options to attract shippers to their ports. It has also enabled large container carriers to acquire their own terminal operating companies or to buy shares in global terminal operators. Container carriers are therefore starting to reshape their network strategy around their own assets, which include ever-larger ships and their own ports infrastructure.
Figure 36: Top-10 container ship fleets, June 2017 (number of ships)
Source: Drewry Research
0
100
200
300
400
500
600
700
NYK
Hambur
g Sud
OOCLPIL
Everg
reen
Hapag
Lyyo
y
COSCO
CMA-C
GNM
SC
Mae
rsk
636
512
461
313
220194
142107 105 100
The consolidation wave results in fewer customers for ports and terminals. Here, renegotiation starts at the level of the lowest rates, while more volume means larger rebates. Hence ports and terminals continue to be confronted by operational and financial dilemmas, especially those which are operating independently or are dependent on one or two lines. Consolidation through mergers and acquisitions is likely to continue among carriers, including small and medium-sized ones.
These developments mean that carriers will increasingly put pressure on African ports and terminals to invest in new equipment and to accept larger ships, while simultaneously driving down port charges. Should African ports fail to meet these challenges, they may be excluded from main shipping routes and be avoided by large efficient lines, driving up import and export costs.

Strengthening Africa’s gateways to trade52
5. Liner shipping changing port infrastructure needs
Figure 37: Mergers and takeovers among carrier lines
Source: Experion Global
0
5
10
15
20
25
30
35
40
2018
2017
2016
2015
2014
2013
2012
2011
2010
2009
2008
2007
2006
2005
2004
2003
2002
2001
2000
1999
1998
1997
1996
1997Hanjin – SenatorP&O – Nedloyd
1999CMA – CGMMaersk – Sealand 2005
Maersk – P&O NedLloydHapag Lloyd – CP Ships
2014Hapage Lloyd – CSAV
2015Hamburg Sud – CCNI
2016COSCO – CSCL
CMA CGM – APL
2017Hanjin, declared bankrupt
Hapag Lloyd – UAC2018
NYK – MOL –K Line (ONE)
1998Evergreen – Lloyds TriestinoNOL – APL
Regional trendsThere are considerable differences between Southern Africa, East Africa and West Africa. Typically, ships deployed in Southern Africa are the biggest, whereas those calling at West African ports are bigger than those in East Africa. The average capacity of container ships in West Africa is around 5 500 TEUs, peaking at 13 000 TEUs, compared to 2 900-5 000-TEU vessels operating in East Africa. The largest container vessel to call at Durban has a capacity of 11 660 TEUs. Due to the Port of Durban’s shallow draught by international standards, ships of this size cannot enter the port fully laden.
There are also more carriers and liner services operating to Southern Africa and West Africa than to East Africa. Carriers use deepsea services that make direct calls at a number of Southern African ports, notably Durban and Cape Town. West African hub ports feed smaller ports in the region and also make use of services that are interlinked via the East-West trade corridor making a stop at a Mediterranean hub. As a result, West Africa has highly complex service networks. The number of services in West Africa is therefore higher than
in East Africa. The former are linked to services with Europe, Asia and America, while the latter are mainly linked to Asia and to a lesser extent, South America.
The hub-and-spoke system is hardly practised in East Africa, whereas in West Africa this system is mainly used in Asian trade. The actual hub ports are shown in Figure 2. MSC is using Lomé and San Pedro extensively as its hubs, but Abidjan and Pointe-Noire should also be mentioned. However, carriers have shown that they are open to altering course when circumstances change.
Maersk and CMA CGM have each dropped one loop in West Africa for the Asian service. In contrast, MSC is increasing capacity on this route and has deployed vessels with 20% higher capacity. The cascade effect is bringing larger vessels to West Africa and East Africa, though vessels are larger in West Africa. In West Africa, the maximum ship size in the Asian service is already 13 000 TEUs. MSC started using its Asia-West Africa service ships at just over 13 000 TEUs in 2017.
The cascade effect could lead to the expansion of the hub-and-spoke system. Bigger ships and alliances normally bring fewer calls and a need for larger container terminals. That said, the ultra-large container ships have not yet reduced the number of port calls made as a part of their route optimisation.
In East Africa more carriers are making a call in Somalia and steady progress has been made in improving efficiency at privately-managed container terminals at the ports of Djibouti, Berbera and Maputo.

PwC 53
6. Future drivers of investment
Many countries in sub-Saharan Africa remain dependent on port infrastructure built before the 1960s, when port standards were very different. Today, larger deep-draught vessels require a depth of 10 metres or more, while the ports developed in the past offer no more than seven metres. Furthermore, these established ports are often major trade hubs that are congested and difficult to expand given their position within the bounds of rapidly growing cities.
New port developments are multifaceted in that they are increasingly multisectoral in nature, involving a number of ancillary projects across a broad range of sectors, often focussing on back-of-port economies and linkages by other modes of transport. These sectors include power and water supply, road and air links, industrial plants, commercial properties and agricultural supply, all of which play major roles in the development of economies.
PwC’s assessment of current investment revealed a number of trends:
• Port ownership and service models are gravitating towards greater private-sector involvement;
• Increasing competition between ports is driving investment decisions;
• Shipping lines and port operators are increasingly driving port investment;

Strengthening Africa’s gateways to trade54
6. Future drivers of investment
• Externally-funded commodities and consumer goods are driving investment;
• Appetite for large greenfield investment is waning;
• Focus on intermodal facilities and dry ports is increasing; and
• There is greater awareness of infrastructure interdependencies.
It is important to note that these trends reflect the views of lenders and investors, and are not necessarily aligned with individual port authorities’ expressed infrastructure expansion requirements, or support for their countries’ growth and development goals. Case study examples of each trend are discussed below.
Greater private-sector involvementOne of the key questions around port investmenst is to understand which ownership and management structure offers the best opportunities for:
• Raising capital;
• Connecting to the hinterland through corridors of trade;
• Owning and operating other ports and related infrastructure; and
• Protecting a strategic resource to further governments’ developmental goals.
To answer these questions, it is important to consider the types of ports and their functions, as certain port types tend to favour specific ownership and management models. This section explores the different port ownership and operating models viewed from the ownership and management structure.
Whereas most of the large ports in the developed world are landlord ports that are owned by either a city or regional government, SSA ports are often regarded as a national strategic asset and are by and large owned by the national or central government.
Container port ownership by private companies is not common, but a good example of a privately-owned container port is ABP (Associated British Ports) in the UK. Some of the world’s largest bulk and oil & gas terminals are privately owned by multinationals such as Vale in Brazil and BHP and Rio Tinto in Australia.
The latest trend is for bigger ports to adopt a corporatised model as it gives them more freedom and opportunities to expand their services to hinterland transport connections, or to obtain shares in foreign ports. The Rotterdam Port Authority and Antwerp Port Authority have, for example, both bought interests in ports in Oman, while the former is also active in Indonesia and Brazil. There is an incentive for these port operators to support or control the transport chain for the benefit of their own ports, thus the line between port and non-port activities is becoming blurred.
Port service models in SSA are diverse. Whereas West Africa has mainly adopted a tool port model, East and Southern African ports are predominantly public-service ports, although some have private terminals such as the TICS container terminal at Dar es Salaam. Even in South Africa, the operator, Transnet, is a state-owned company, which puts port ownership and operations under government control. However, Transnet has separated the landlord and port operation functions through two divisions, Transnet National Ports Authority and Transnet Port Terminals respectively.
Many countries in sub-Saharan Africa remain dependent on port infrastructure built before the 1960s

PwC 55
6. Future drivers of investment
Figure 38 shows the typical port services models, with the level of public and private sector participation. A public service port has the greatest degree of direct government involvement with ownership and all related services provided by the public sector. The other extreme is a private service port where a private company owns and operates all services in the port. Private service ports are fairly uncommon for container terminals, but there are a number of privately- owned and operated bulk ports. Public services ports are still fairly common, but the trend is for governments to play more of an oversight/regulatory and ownership role, leaving cargo handling (tool port), ownership of superstructures and some infrastructure (landlord port), and all aspects except ownership (corporatised port) to the private sector. Greater levels of private ownership opens more opportunities for private investment, particularly in the current scenario in which many governments are fiscally constrained.
Figure 38: Port operating models
Note: The circles indicate private sector involvement. Large circles show full private sectors participation. Smaller circles indicate where services could be provided by either private or public operators. Blocks without circles show that services are provided by the public sector only Source: PwC analysis
According to the World Bank, many countries fear that more private-sector involvement complicates regulation and increases the risk to a country of not achieving its development goals. To facilitate the trade-off between gaining access to private capital for port expansion to grow the economy, and managing sovereignty over ports, a good regulatory and legal framework needs to be put in place to balance financial return requirements and socio-economic development goals.
Figure 39: Public-private balance of risk and regulation
Source: World Bank
Publicservice port
Tool port
Landlord port
Corporatisedport
Privateservice port
Ownership Portadmin.
Nauticalman.
Port infra-structure
Port super-structure
Cargohandling
Pilotage Towage Mooringservices
DredgingOwnership Ownership Ownership OwnershipNauticalman.
Port infra-structure
Port infra-structure
Cargohandling
Port modelService to
High
LowLow High
Pub
lic-s
ecto
r ris
k
Importance of regulation
Public service port
Tool port
Landlord port
Private port

Strengthening Africa’s gateways to trade56
6. Future drivers of investment
Although hard and fast rules do not apply, and each case should be considered on its own merits, the landlord model provides the best option for raising private finance through a public-private partnership (PPP). However, the landlord model may not always be in the best interests of a port or country, especially when private companies have a bigger share in the joint venture concessionaire. It is often difficult for smaller and less-developed countries to regulate large international port operators, increasing the risk of not being able to serve the national interest. The formulation of contract obligations on concessioners and the monitoring thereof is critical to providing governments with overall long-term control.
Many West African governments have adopted the landlord port model and PPP partnerships. The build, operate and transfer (BOT) model is considered a useful way to facilitate investment when there is limited financial means. Carriers and global terminal operators are willing to build and operate ports for a few decades, thus recouping construction costs before transferring ownership back to the host government. The government will then benefit from the global operators training the personnel, making African ports as good as any other in the world, but what these operators cannot change is the ease of doing business or dealing with the concept of economic free trade.
Djibouti is a small country with a population of around 850 000. The national plan is very much linked to its relationship with Ethiopia. The construction of Doraleh Container Terminal (DCT) has been a catalyst for growth. Opened in 2009, it is now operated by the Port of Djibouti, which is a joint venture between DP World and China Merchant Group. DCT was essential as the old port lacked capacity and water depth to accommodate large container ships. DCT claims to be one of the most technologically advanced terminals in Africa, with a handling capacity of 1.6 million TEUs, 1 080-metre quay length, a water depth of 18 metres and eight Super-Post-Panamax cranes. Shallow waters have pushed the terminal to be built away from the shore with a bank connecting land to terminals. The development has recently been expanded with the Doraleh Multipurpose Port, also operated by DP World and China Merchant Group, being inaugurated in May 2017.
In general, political influence in port development has negative outcomes resulting from over- optimistic expectations and trade forecasts. There are a number of examples where forecasts were found to be over optimistic and volumes did not materialise after investment. One of the main reasons for this is the double counting that takes place where two competing ports justify investment on the basis of attracting each other’s market share, or where the diversion from a competing port does not materialise due to entrenched agreements with shippers and shipping lines.
Port model definitions:Public service portWith the public service port, the port authority owns, maintains and operates all the port assets, offering the complete range of services needed for the functioning of the seaport. Cargo handling is undertaken by labour employed directly by the port authority.
Tool portIn the tool port scenario, the port authority owns, develops and maintains the port infrastructure (including the superstructure, cargo handling equipment, quay, cranes, forklift trucks, etc.) and port authority staff usually operates all equipment owned by the port authority. Cargo handling (on the vessels, aprons and quays) is usually carried out by private cargo handling firms contracted by the shipping agents.
Landlord portThe characteristics of a landlord port is that it is a mixed public-private port model. Here, the port authority owns and maintains the basic port infrastructure and acts as regulatory body and landlord, and leases the port operations (especially cargo handling) out to private companies.
Corporatised port In this port model, the public port authority, or part thereof, is altered into a corporation. The port authority (or one or more of its constituent parts) is converted into a legally and financially independent legal entity with its own board of directors, with the government/public port authority retaining ownership in all shares of the venture.
Privatised port/Private service portHere the port is fully privatised – examples of these are few in number. With this type of model, port land is privately owned and port systems are completely privately operated and maintained. In some cases, governments may simultaneously transfer the regulatory functions to private companies.

PwC 57
6. Future drivers of investment
The challenge for governments and local administrators is to keep up with the speed at which private businesses operate. Experience shows how easily carriers and terminal operators can give up concession agreements and that strategies are quickly adapted to new realities. On the other hand, logistics companies prefer ports that have a strong customer focus, are efficient, and cost effective when it comes to cargo handling and transportation. They weigh up various options and are not afraid to reroute cargo to other nearby ports. It is the interaction between public and private parties that, to a large extent, determines the success of a port, suggesting that a holistic view is required to ensure positive outcomes.
For example, the Addis Ababa-Djibouti Railway has relieved pressure in the Doraleh ports somewhat with daily trains, but road transportation remains a bottleneck. It is estimated that about 1 500 trucks leave Djibouti for Ethiopia every day, yet there is a big capacity constraint. This is partly due to cross-border formalities, as the Ethiopian Government needs foreign currency and relies on customs revenues. In addition, it can take trucks up to 10 days to complete what should be a 48-hour journey from Djibouti to Addis Ababa due to the state of the roads and harsh climate.
Increasing competition between ports
Due to the fact that ports in Africa are mostly government owned, direct competition between ports is often viewed as direct competition between countries, rather than between commercial entities. Discussion of investment decisions for attracting business are therefore done much more discreetly than in many other parts of the world, where ports are much more upfront about their competitive position and growth objectives. There are, nevertheless, a few example of cases where ports are clearly positioning themselves to become dominant in a certain region.
The Kenyan Government has invested significantly in Mombasa port to cement its position as the preferred port in East Africa. Mombasa competes directly with Djibouti to emerge as a hub, and with Dar es Salaam for regional freight. A series of major investments has taken place in Mombasa and in upgrading the road and rail network to accommodate the throughput of 2.5 million TEUs by 2020.
The port is central to the Kenyan economy as 40% of the country’s revenue comes from import and export duties. To keep pace with increasing cargo volumes, Mombasa port has completed a number of development projects mainly with the help of Japan. As a part of the MPDP (Mombasa Port Development Programme) the container capacity was doubled in February 2016 by reclaiming land from the sea and adding a second terminal at Kipevu West. Later that year, the governments of Kenya and Japan reached agreement for another phase, to build and complete Dongo Kundu Special Economic Zone by 2019. This will include the construction of another berth, bridge and causeway bypass. The Japanese master plan for Mombasa also indicates the construction of a third container terminal at Dongo Kundu with another 1.1 kilometres of quay length.
Many West African governments have adopted the landlord port model and PPP partnerships
Benin’s port of Contonou is a city port and was developed as a potential gateway to landlocked countries such as Mali, Niger and Burkina Faso, and to Nigeria. The rehabilitation of the port has great advantages for Contonou. In recent years the port has been modernised with new cargo handling equipment and improved infrastructure intended to improve productivity and achieve growth objectives. The port is the main driver of the country’s economy, but is struggling to compete with nearby ports that took similar steps in upgrading terminal facilities. As a result, Contonou has seen a drop in volume from 10.5 million tonnes in 2014 to 8.7 million tonnes in 2016. The ports of Tema, Lomé and Lagos are just a few hours away, while the greenfield development in Badagry, Nigeria, is just 50km away. Badagry is reachable by barge and rail giving better opportunities to reach the hinterland, but cumbersome regulations in Nigeria have helped to direct imports through the port of Contonou. Another interesting development is that neighbouring countries such as Chad and Burkina Faso have their own warehouses to store goods at Contonou port.
Somali ports are thriving and more ships are calling at the ports of Berbera, Mogadishu and Kismayo. At the moment six carriers call on these ports (CMA CGM, MSC, PIL, Emirates Shipping, Simatech and X-press Feeders) with ships of between 1 100 and 2 700 TEUs. Berbera port is 280 kilometres east of Djibouti and could become a significant competitor for both Ethiopian and Kenyan trade. In September 2016, DP World won a concession to manage and develop the port. DP World, together with the Government of Somaliland will develop a new modern multipurpose port.

Strengthening Africa’s gateways to trade58
6. Future drivers of investment
DP World sees Berbera as being complementary to its activities in Djibouti, while Ethiopia is looking for more options. With the current rate of development in terms of population and the economy, Ethiopia will need more ports than Djibouti and Berbera will be able to fill this need. Improved rail connectivity will give Ethiopia broader access to Indian Ocean ports.
Shipping lines and port operatorsModern ports are essential to the development of the economy. Shipping lines and logistics companies seek good infrastructure, efficient and effective ports. When comparing West African ports to East African ports, it is clear that the former are far more developed when considering terminal operations. There are more liner services and global terminal operators in West Africa. APM Terminals (Maersk), TIL Group (MSC), CMA Terminals, DP World, ICTSI, Bolloré, China Merchants Group and Portek are all global port operators actively involved in region.
Trade between Asia and East Africa drives the economics of having regional transshipment ports. Currently, the port of Colombo in Sri Lanka is a transshipment hub for East Africa, i.e. transshipment does not have to take place on the continent where the freight is destined. Shipping lines depend on efficiencies and the Seychelles could be seen as a transshipment option for cargo on route to Tanzania, Kenya and Djibouti, and Mauritius or Madagascar for Mozambique and South Africa.
Consolidation of multiple terminals in one port in terms of both operations and ownership is to be expected. In several port terminals, mainly hub terminals, interests of carriers and global terminal operators are closely knit. This can lead to foreclosure
(exclusion of competing services) and monopolistic price setting. Although this maximises revenue and profit, by stifling trade it could be to the detriment of the country’s economic development goals.
The expansion of existing ports and terminals is more successful than greenfield developments. The container terminal in Lomé, Togo, which opened in 2014, is a good example of this. The port backed by TIL (MSC) is growing fast and handled over 500 000 TEUs in 2016. TIL recently signed a 35-year concession agreement for San Pedro to upgrade and operate the container terminal. San Pedro is the second port in Côte d’Ivoire and the improvements will allow vessels up to 14 000 TEUs to use the terminal. It is notable that TIL is involved in two nearby ports, which indicates that MSC is not relying on having a single hub in the region.
As mentioned, East Africa still has some way to go compared with West Africa from a route consolidation and ‘hub’ port perspective. The enhancement of the hub-and-spoke model that is developing in West Africa has not so far been adopted on the East coast. HPH, DP World and China Merchants Group are the only global terminal operators active in East Africa, but recently P&O Ports announced the development of Bosaso, Somalia.
There are many plans to expand or develop new terminals and deepen access channels in East Africa. One example is Maputo, Mozambique, which will be dredged from 11 metres to 14.2 metres to accommodate expected container volume increases, which will also require more investment in quay length. The railway lines connecting Maputo to Gauteng, South Africa’s industrial heartland, as well as Lusaka in Zambia and Harare in Zimbabwe, are an advantage, particularly since the distances between Maputo and Johannesburg, and Durban and Johannesburg, are similar.
Due to the fact that ports in Africa are mostly government owned, direct competition between ports is often viewed as direct competition between countries, rather than between commercial entities

PwC 59
6. Future drivers of investment
In Contonou, concessions have been given to operate and manage terminals by private companies selected on the basis of controlling cargo flows in order to have volume guarantees. The French logistics company Bolloré is operating the South Wharf Container Terminal, while APMT is operating a rather space-restricted terminal facility on the other side of the basin together with a local partner.
For Contonou, the danger is in APMT’s involvement at the nearby Badagry port. Here, APMT, together with TIL (MSC) and other Nigerian partners, have a concession to manage and operate the port. However, Badagry is behind schedule and it appears that limited progress has been made. APMT is a performance-orientated company not afraid to review its strategy when circumstances require.
APMT has stated a renewed focus on optimising existing assets rather than on greenfield developments. Badagry port could put Contonou in a more difficult position, but APMT’s decision will favour Contonou. This shows the ambivalent position for ports when global terminal operators, linked to mega carriers, play a dominant role in their success. These companies have the capital, worldwide networks and skills to make the infrastructure more competitive, but their business models are based on following cargo flows, which may lead to a conflict with a port or government.
The port of Djibouti is a success story thanks in part to outside investors and the conflict between Ethiopia and Eritrea. The port of Assab in Eritrea is the more natural port for landlocked Ethiopia. However, due to conflict between the two nations, Assab Port has come to a complete standstill and Ethiopian cargo is now routed via Djibouti. To a lesser extent, Djibouti competes with Somali port Berbera for Ethiopian cargo, but with the new Djibouti-Addis Ababa Railway operational, competition has decreased. Approximately 85% of Djibouti’s business involves imports and exports from Ethiopia with imports dominating.
DP World is partnering with the Government of Somaliland to develop a modern multipurpose port. They will have 65% of the shares and the total investment will be around US$442 million. The first phase will have a 400-metre quay and involve the extension of the yard and then installation of gantry cranes and reach stackers to handle containers and cargo. The construction of the quay will take 12 months. The long-term development plan includes an 11-square kilometre free-trade zone, while the rest will total 4.25 square kilometres.

Strengthening Africa’s gateways to trade60
6. Future drivers of investment
The involvement of China presents opportunities to obtain capital for port and infrastructure investments
Externally-funded commodities and consumer goodsAfrican countries are engaged in the development of new deepwater ports to be used for the bulk export of minerals, oil and gas. There are numerous examples of deepwater ports being developed as alternatives to established ports: San Pedro for Abidjan in Côte d’Ivoire, Kribi for Douala in Cameroon and Saldanha for Cape Town in South Africa.
The involvement of China has presented opportunities to obtain capital for port and infrastructural investments, from which Ethiopia and Djibouti have benefitted tremendously. China and Chinese investors take a broader view when considering investments. This goes beyond purely financial considerations and could include geopolitical objectives, thus making the investment amount an issue of minor importance. At the moment, Chinese investors are showing less interest in greenfield developments, but more in existing port and terminal businesses. The main goal is to find new markets for Chinese goods and services, gain access to raw materials and increase their global political influence.
Ethiopian cargo is controlled by the large national company ESLSE (Ethiopian Shipping and Logistics Enterprise) established in 2012 after a merger of three companies. The company owns ships, trucks, warehouses and dry port(s) and is responsible for logistics between Ethiopia and its seaports. The main dry port in Modjo is nearly 75 kilometres east of Addis Ababa, while new dry ports are planned in Moyale, Mekelle, Woreta and Dire Dawa. The aim is to create an infrastructure that is interlinked with regional trade.
The China Merchant Group acquired a 23.5% stake in Djibouti port in 2008. This state-owned company is trying to get a 40% stake in ESLSE. Due diligence started in December 2016, but the negotiations are still
ongoing. Should China Merchant Group succeed, they will have near complete control over Ethiopian logistics.
China is already Ethiopia’s most important trading partner. As a result, Ethiopia buys containers full of Chinese manufactured goods, which arrive at a Chinese built container terminal and are moved by rail financed and built by three Chinese banks, while managed by two Chinese contractors, controlled and coordinated by the Chinese Government. Workers handling the goods all travel using the light rail network in Addis Ababa, constructed by the China Railway Group.
Among West African countries, Nigeria and Angola have similarly taken advantage of their relationships with China. Renewed economic growth has increased demand for construction services in these countries, which is largely being financed and executed by Chinese companies.
Waning appetite for large greenfield investmentThe disadvantage of city ports is that they may ultimately have to be relocated to coastal waters with deepwater access to allow bigger ships and to make room for enhanced back-of-port developments that are often constrained by historical city growth patterns. Port master plans set out the growth path for each port, and its community. These master plans invariably express a vision and commitment to a sustainable world-class port and guarantee its prosperous future. Naturally, economic conditions are subject to change and forecasting needs to be a continuous process in order to respond adequately.
Port development is a process of short-term actions and long-term ideas. Infrastructure projects of this scale take considerable time to complete as they involve

PwC 61
6. Future drivers of investment
planning, tendering, negotiations, environmental studies, a number of technical studies and so forth. The need for public support is also important, particularly for these reasons:
• The need to have funds and attract investment;
• The need to promote environmental and economic sustainability; and
• The need to support the community and create jobs.
An ambitious greenfield plan to develop a new major port was developed for the port of Kribi in Cameroon. Features include a quay length of 6.4 kilometres, 15-16-metre water depth and industrial zones. Phase one was delivered with a 350-metre container berth and a 266-metre multipurpose berth.
The inhabitants have had a long wait for new jobs while the population has also grown as other jobseekers have moved to the area. The port developer is the state-owned China Harbour Engineering Company (CHEC), which together with Bolloré and CMA CGM, have been the concessionaires for the container terminal since 2015. The signing process was drawn out and when the final signing was meant to take place it was suddenly adjourned without any further information. The consortium for the multipurpose terminal, Necotrans-KPMO, welcomed its first ship in June 2017, but not before they and the winner of the tugging and mooring contract waited more than two years for approval.
Another example of wavering commitment to greenfield investment are two developments in Nigeria, the ports of Lekki and Badagry. The global terminal operator ICTSI and carrier CMA CGM were nominated as concessionaires to develop and operate a container terminal in Lekki Port in 2012. The terminal was scheduled to be operational by 2016 with a 1 200-metre quay, 14 Post-
Panamax cranes and suitable for 10 000-TEU ships, but ICTSI decided to terminate the agreement in 2017 citing delays in execution of the project. CMA CGM is likely to follow ICTSI’s lead.
Badagry port is an example of a greenfield development that can be turned into a mega full-service port after completion. A full-service port is one where all functions are managed and operated by the same company, in this case it is the consortium that is building the port. The plan includes a quay length of seven kilometres, a design depth of 16.5 metres and facilities for containers, ro-ro, dry and liquid bulk, and general cargo. The plan also includes a free-trade zone with a power plant, oil refinery, an industrial park, warehousing and container depot functions. Operations were scheduled to start in 2018 when the first phase will come available, however, Badagry is behind schedule and it appears that limited progress has been made.
In some cases the future of port projects is unclear, as is the case with the port of Bagamoyo. This port project was announced in 2013 and was expected to be an 800-hectare port and include a 1 700-hectare industrial complex with an overall investment of US$11 billion. The project work began in October 2015 with support from China Merchants Group and Oman. With the aim to have the first phase completed by 2017, the project was suspended in 2016 and it is unclear if it will continue. Whether the effects of the recent financial boost for Dar es Salaam will have consequences for Bagamoyo Port is not yet clear.
Similar to Bagamoyo in Tanzania, Kenya has the Lamu Port development at Manda Bay. The project was announced in 2012 with the aim to build a container terminal with 32 deepwater berths of 18 metres. The port is located on a Unesco heritage site, Lamu archipelago, and environmental concerns about the project have raised controversy.
Over 50% of those port and terminal operators interviewed in Southern Africa and West Africa agree that their port terminals are not large enough for their current requirements and development on terminal landside is required

Strengthening Africa’s gateways to trade62
6. Future drivers of investment
Lamu port is linked to the development of the Lamu Port- South Sudan-Ethiopia Transport (LAPSSET) Corridor. In October 2016 a consortium led by the Development Bank of South Africa agreed to invest US$1.9 billion in the project with the aim of building a terminal with three berths and a modern road to Isiolo. This town, centrally located in Kenya, will be the main waypoint for the LAPSSET Corridor with the first berth expected to be operational in 2018.
Plans to build Africa’s biggest port facility just 50 kilometres north of Luanda were revealed in 2014. This greenfield port in Dande was expected to be larger than the Durban port and would challenge it as a regional hub for landlocked countries such as copper-rich Zambia. The aim was to shift cargo from Luanda and have an alternative in place before terminal capacity is reached. The plans, however, have been put on hold due to drastic declines in cargo volume.
Ninety kilometres south of Pointe-Noire is another greenfield development with high expectation, Port de Caio in the Angolan province of Cabinda. The province plays a significant role in the country’s economy, accounting for more than 65% of oil exports and is rich in coffee, rubber, palm oil and timber. In 2015, Angola signed cross-border agreements with neighbouring countries to facilitate trade and after completion, Port de Caio will be seen as a gateway to the Democratic Republic of Congo and Republic of Congo.
Development and implementation of the plans took time but development of the initial phases has begun. The first phase will be ready for operations in 2018 with a quay length of 630 metres and water depth of 14 metres in the basin, while a power plant, warehouses and a free-trade zone are scheduled for completion in
2019. The PPP model will be adopted, but no possible operators are yet known. There is a high expectation that the new port and industrial zones will create, directly and indirectly, 30 000 jobs. The rationale behind the job creation expectation is that economic free zones are an enabler of innovation and business growth, which Cabinda has seen in other fast-growing areas.
Increasing focus on intermodal facilities and dry portsThere is an increasing drive for the establishment of intermodal facilities and dry ports to overcome the space constraints for expanding many SSA ports. It should be noted that such facilities will only save money if they can avoid additional handling of containers, which is a significant percentage of distribution cost. Unless distribution facilities are integrated with intermodal transfer facilities, an additional road trip between the rail freight terminal and established warehouses would be necessary. Not only would this add a feeder truck transport trip to the cost of goods handling, but it would also include additional handling and freight time costs. An intermodal transfer facility, which combines the transfer with storage and sorting, would allow the logistics system to take advantage of the inherent efficiencies of the rail system without the burden of additional transport and storage cost.
One way the port of Luanda tried to overcome the pressure caused by long dwell times and laborious customs regulations was to move cargo from sea terminals to what is called second-line terminals. This concept is the same as extended gates or dry ports and often used in heavily-congested areas. These facilities are custom-bonded areas intended to allow cargo clearance and avoid traffic jams.
There is an increasing drive for the establishment of intermodal facilities and dry ports to overcome the space constraints for expanding many SSA ports.

PwC 63
6. Future drivers of investment
The second-line terminals are a few kilometres away from the port and containers are transferred mainly during the night.
The Mulemba second-line terminal in Luanda is located near the railway line, which runs through urban areas and creates noise pollution at night. The container terminal is managed and operated by APMT and a local company, who have organised a shuttle service between terminals, which brings additional costs for consignees and shippers. The use of the second-line terminal does, however, improve the performance of the sea terminal due to lower congestion in the storage yard, reduced external traffic and fewer gate movements.
Dar es Salaam port is notorious for its congestion and inefficiencies. Building an inland port at Ruvu makes it possible to store containers away from Dar es Salaam, but adds to the overall cost of logistics making the port less attractive to competing traffic.
Greater awareness of infrastructure interdependenciesDevelopment of deepwater ports has important implications for supporting infrastructure, notably the construction of new rail lines linked to neighbouring mining centres (as in the case of San Pedro and Pointe- Noire) as well as bulk handling facilities for mining produce, oil and gas. Railways and ports are inextricably linked, but in many instances underinvestment in rail over a number of years has resulted in the need for significant investment now to make a meaningful contribution to efficiency and throughput.
The World Bank is currently funding 30 projects in Tanzania as well as having approved a second loan, valued at US$345 million, in July of 2017. Initially, Tanzania wanted to build a new port north of Dar es Salaam, but now the focus is on the expansion and deepening of the existing port. This is known as the Dar es Salaam Maritime Gateway Project.
A new two-berth container terminal is planned to be built with a water depth of 14 metres. The aim is to increase annual container capacity to around 1.2 million TEUs. The infrastructure will also be improved by upgrading the three roads out of the port from three to six lanes, while there are also plans for a modern railway to be constructed.
Chinese state-owned CHEC has been approved to execute the civil works of deepening and strengthening the berths to accommodate larger container ships. Dar es Salaam has an average economic growth of 9% per annum, which has raised questions about whether the new container capacity will be sufficient. The aim is to transform Dar es Salaam into a regional gateway for landlocked countries such as Burundi, Democratic Republic of Congo, Malawi, Rwanda, Uganda and Zambia, but processing inefficiencies increase the risks of infrastructure investment and could lead to the full potential of the investment not being realised.

Strengthening Africa’s gateways to trade64
6. Future drivers of investment
A number of ports in the region are surrounded by cities, resulting in port and city congestion. Traffic congestion is very much prevalent in Contonou. Other than cargo collection and delivery, trucks have to drive into town to collect new transport assignments. Traffic and port communication systems can assist to alleviate traffic congestion if they are designed in a way that maximises the use of technology and the ability of truck drivers to access it. The challenge to keep Contonou sustainable lies in putting more emphasis on spatial planning in the master plans, where the main focus is commonly on cargo flows and trade forecast scenarios.
Increasingly, ports have become the interface between major transport logistics and oil & gas infrastructure. From a trade perspective they are often a key end point to major inland corridors, but are also often constrained by city expansion, congestion and urban encroachment. Modern ports have become reliant on a complex array of back-of-port facilities. These include bonded facilities, distribution centres, container warehousing and packing and repacking services. In addition, specialised services often locate in this vicinity to manage bulk and repack and blend a growing array of complex goods. Examples include foodstuffs, fertilisers, petrochemical products and bulk commodities.
New drivers for African PortsPorts around the world are changing, not only in terms of how they integrate into the logistics chain and the role they play in economic development, but also in terms of how they are operated and managed.
Some key trends that are directly applicable to Africa, include:
• Tracking and digital platforms are the norm – Logistics service providers and customers are increasingly using radio-frequency ID tags and tracking devices to accurately determine vehicle and consignment locations. Together with digital technology, this allows operators to track real-time progress along the supply chain, often through the use of mobile phones.
• The paperless port – Through increasing utilisation of digital technology and a shift by customs & excise authorities to use the internet as the means of processing shipments, there has been a significant decrease in the use of paper at ports. Many freight forwarders have been active in creating more interactive tools for customers, which reduce or eliminate the need for paper in the import and export process.
• Improved inland terminals – These help consolidate freight flows and act as important hubs from where corridors may diverge. Because of border control requirements, they are often located close to border points and also often offer bonded warehouse facilities.
• Hub ports – They have developed in most parts of the world and demonstrate a shift towards greater maritime freight consolidation. Their emergence has been driven to a large extent by the global trade in containers, which continues to grow and is reducing the size of the break-bulk and in some instances even the bulk market. Many higher- value commodities such as wood chips, maize, higher-value ores, copper concentrates now move by container when in the past they would have been treated as bulk or break-bulk freight.
• Improved back-of-port logistics facilities – The area behind the port has become increasingly sophisticated and specialised in recent years. Holding facilities for specialised commodities, such as edible oils, foodstuffs, etc. are now common in areas close to the port. Consolidation areas, warehouses and commercial or retail distribution areas are also now commonly located in these areas. This requires sound land use and local transport planning, but can be used to attract specific traffic, especially to hub ports.

PwC 65
7. Moving forward: Summary of conclusions This report analyses the current operating conditions of the most significant ports in sub-Saharan Africa. In reading the main conclusions, it should be borne in mind that the intention is ultimately to unlock investment by highlighting opportunities and challenges facing ports in the region.
Based on our analysis, we highlight the following points with respect to the investment environment affecting port projects in SSA:
• The economic outlook for sub-Saharan Africa has worsened substantially since the resources boom. Most countries have experienced severe economic and fiscal challenges since the period around 2014/15. This is likely to severely curtail governments’ spending on large port infrastructure projects, with banks and development agencies finding it increasingly difficult to lend money for large-scale projects given existing debt burdens and loan-servicing challenges. Attracting private-sector investment is therefore increasingly important in developing large port projects.
• Notwithstanding the above, there is a slow upward trend in commodity prices and the forecast economic outlook for most African economies remains strong (see Appendix B).

Strengthening Africa’s gateways to trade66
7. Moving forward: Summary of conclusions
• SSA ports are predominantly either public-service ports or tool ports, which makes the raising of capital in a constrained economic environment particularly difficult. Countries, therefore, need to strike a balance between attracting private capital, keeping control of ports to further specific economic objectives, and dealing with the complexities of the regulatory environment to manage private investments. SSA governments and port authorities would benefit by driving a stronger agenda towards private-sector involvement in new port investments and in port operations at these ports. Investment in ports should not only follow appropriate structural adjustment in ownership and operating models, but also a strong focus on incentives that improve managerial and operational efficiency.
• In addition to the more recent overall decrease in freight volumes, the fact that most African countries have an imbalance in trade focussed on commodity exports and manufactured imports creates an inefficient logistics model with higher overall prices for freight moved. This increases the cost of both imports and exports. Opportunities therefore exist in managing the types of freight at ports to balance imports and exports. Countries could consider providing tariff adjustments which seek to benefit exporters of beneficiated and manufactured goods.
• Although many ports have a clear lack of capacity, administrative and customs regulations still cause substantial delays in container processing despite significant progress in this area. What appears to be low port productivity and efficiency is often the result of statutory processes, rather than capacity. Before investments to improve capacity and handling efficiency are considered, due care has to be taken to ensure that processes are streamlined.
• Many ports do not have automation technology. Combined with poor labour productivity and skills deficits, there is little scope to improve efficiencies without significant investment. It is, however, important to strike a balance between automation and the skills required to operate complex systems. Systems and skills improvements should therefore accompany investment to make the most of port enhancements.
• Good road and rail connections to ports are often a bottleneck in the processing of containers. Many SSA ports are within cities with substantial congestion. Inner-city road congestion, combined with often dysfunctional rail systems, pose a major risk to investment. Port investment should therefore also take account of investment in landside transportation, as is happening in Europe with the increasing popularity of corporatised port operators that also control landside transport. Integrated supply chain investment would create more investment opportunities by ensuring that bottlenecks along the entire system are addressed in a holistic manner.
• Shipping liners will play an increasingly important role in determining which ports they serve with large, efficient ships. Most ports are too shallow to accommodate even the ships that are currently being phased out on the busiest sea routes. Deepening ports to accommodate large ships should therefore be a priority. It should also be taken into account that shipping lines can use their balance sheets to finance port expansion and improve their efficiencies, provided it is in their interests. Attracting investment from lines and other major ports should therefore be a priority.
Opportunities exist in managing the types of freight at ports to balance imports and exports. Countries could consider providing tariff adjustments which seek to benefit exporters of beneficiated and manufactured goods

PwC 67
7. Moving forward: Summary of conclusions
• Vessel sizes will continue to increase and shipping lines will decide which ports provide the most efficient connectivity options. Ports should not only be expanded and deepened to accommodate larger vessels, but port authorities should increasingly engage with the private sector freight and shipping industry to ensure that ports respond appropriately to international market forces and logistics efficiency demands.
• Vessel size increases will ultimately result in a hub-and-spoke system in which some ports will expand to become hub ports and others will provide local access. Investors should take this into account when considering investing in port infrastructure, especially in identifying which ports will eventually emerge as hubs.
• From a port expansion perspective, investment should in the first instance focus on export value chains that generate wealth by improving the terms of trade and offering better competitive advantage in the world market. Port investment should thus be intimately aligned to trade-enhancement strategies.
• Improving landside access to ports is key. The problem is usually most acute in the immediate vicinity of the port – often in the immediately adjacent congested urban area. Attention should also be given to the quality of infrastructure along the main hinterland corridors to and from the port, particularly as many of these corridors cross country borders. Improving rail is also a key element in improving port functionality and lowering logistics costs.
• Most SSA countries have not paid much attention to growing the modal share of rail freight as a strategic advantage to serving key emerging ‘hub’ ports. Providing dry ports and intermodal terminals on land outside city boundaries with well-connected rail shuttle services to the port can be a highly efficient alternative where land for port expansion in cities is limited.
• In addition to hub ports, there are opportunities to develop specialist resource export terminals. Many of these are privately funded, but could benefit from government leadership to set them up as ‘shared-service’ facilities for multiple operators/customers using a PPP outsourcing model.
In addition to hub ports, there are opportunities to develop specialist resource export terminals

Strengthening Africa’s gateways to trade68
7. Moving forward: summary of conclusions
Oil and gas interplay with portsThe diagram below33 prepared from PwC research shows that SSA has significant oil and gas resources. Prior to the oil price crash in 2014, many African countries such as Angola and Nigeria relied heavily on oil and gas exports to drive their economies. Others, such as Uganda, Mozambique and South Africa are hoping for higher oil prices to return to the market before their oil, gas and shale gas fields become financially sustainable for investment.
33 PwC, Learning to Leapfrog: Oil & Gas review. 2016
Oil reserves
128.0 billion barrels7.5% of the world’s proven reserves
Gas reserves
496.7Tcf, 86.8 billion BoE
7.6% of the world’s proven reserves up 0.1% from prior year
Shale oil potentialLibya 5th globally
26 billion barrels
Shale gas potentialAlgeria 3rd globally
707Tcf, 121.9 billion BoE
Bidding rounds in 2017 include: Gabon, Congo-Brazzaville, Egypt, Equatorial Guinea, Namibia, Nigeria, Seychelles, Somalia, South Sudan and Tunisia
By 2050, Africa’s oil & gas is
set to increase by 74% and global consumption by 45%. Africa’s share of global consumption will increase from
4.3% to 5.1%
Refinery capacity as % of
global: 3.5%Actual throughput 2015
2.6% or 2.1 million bbl/day
LNG exports from Nigeria, Algeria, Angola, Egypt and Equatorial Guinea was
48.7Bcm, 13.1% of world exports in 2015
Global LNG nominal liquefaction capacity 339.7 MTPA at December 2016. Africa capacity 68.3 MTPA,
20.2% of global capacity, a decline of 4% over the past 2 years
LNG operating capacity in
Africa in 2016 51%, average world operating capacity 82%Average excluding Africa
90%
Gas pipeline exports were 45.6 bcm, 6.2% of the world’s export. Africa exports increased by 8.3% in 2016
Global oil discoveries were down to 174, the lowest level for 60 years. Africa only had
3 major discoveries in 2016 and H1 of 2017, down from11 in 2015
Global oil discoveries declined to 2.4 billion barrels in 2016
compared to an average of 9 billion barrels p.a. over the past 15 years
Oil production as % of global:
8.6%, down 0.5% from prior year
Oil consumption as % of global same as prior year at
4.2%, although it grew
regionally by 1.5%
Gas consumption 13.3 Bcf per day, grew by 1.4% in 2016

PwC 69
7. Moving forward: summary of conclusions
Given the importance of this sector to the economies of many countries, the efficiency with which the product can be exported becomes extremely important in a highly competitive market. In this respect, it is important to bear in mind that most recent African oil and gas discoveries are offshore, not only requiring efficient export terminals for storage processing and loading, but also efficient ports for the maintenance and replenishment of offshore service vessels. Ports are also important for handling processed and refined petroleum products. Many oil producing SSA countries, including Nigeria and Angola, do not have refining capacity and import refined product for domestic use through terminals in their ports.
Whereas onshore oil and gas are usually piped to a port and loaded onto ships at a terminal, which may be far out at sea and not even require a port, offshore exports are somewhat more complex, and use one of three methods before the product can be loaded. Each has specific implications for port development:
• Gas collected from offshore wells is most often piped to land for processing and liquefaction before being exported. This usually means building an onshore facility that purifies the gas and then chills it until it becomes a liquid. The chilled product, known as liquefied natural gas (LNG), is 600 times smaller in volume and therefore easier and cheaper to transport by ship in large cryogenic tanks. As more deepsea oil and gas fields are developed, piping becomes a challenge.
• Recently, Petrobras of Brazil started production from its Cascade and Chinook fields 260 kilometres offshore in 3 000 metres of water in the Gulf of Mexico and using shuttle tankers to transport the oil to shore.
• To exploit the Prelude gas field more than 160 kilometres off the northwest coast of Australia, Shell has opted to develop a system which will do liquefaction at sea. Prelude will become the world’s first floating LNG plant. This means avoiding the costly tasks of building a pipeline to the coast and of constructing an LNG facility on land, that might face a long series of planning and environmental obstacles, and require new infrastructure in a remote location. The floating LNG plant will be positioned above the gas field for a projected 25 years and become a rig for harvesting the gas from the ocean floor, liquefaction plant, a storage facility and a loading dock for tankers.
Oil and gas terminals are usually funded and costed as part of the gas field development. It therefore has little bearing on existing port activities other than providing maintenance and repairs to offshore supply vessels, and replenishing offshore activities.
Lags in port investment lead to capacity constraints and in turn to suboptimal economic growth

Strengthening Africa’s gateways to trade70
8. PwC’s transport, logistics and ports expertise and services
PwC has a deep expertise in the transport sector, including all aspects of engagement lifecycles from strategy development, feasibility studies, funding, procurement, policy development, to implementation of the engagement, risk assurance and governance. We have the demonstrated capacity and are qualified to perform the required
services. Our transport expertise sits within our Capital Projects and Infrastructure division. Our team has strong ports advisory expertise, deep technical experience, extensive project management capability, recognised finance skills, knowledge of how organisations change and unrivalled business improvement understanding.

PwC 71
8. PwC’s transport, logistics and ports expertise and services
PwC is one of the world’s leading advisers to the ports and maritime sector. Our Ports Infrastructure Advisory practice, supported by the Ports Centre of Excellence, comprises partners and staff of all levels who advise on a wide range of port and maritime projects all over the world covering, among others, the following areas highlighted below.
The strength and reputation of our Ports Infrastructure Advisory practice is demonstrated by the clients that we work for, which include some of the world’s leading ports and shipping lines.
As the infrastructure (including ports and shipping) industry is a capital- intensive sector, we have developed a specialised approach for the evaluation of infrastructure project investment such as expansions, refurbishments and new (greenfield) project developments and investment projects opportunities.
Our strategic investment analysis:
• Informs decision makers on the rationale for investment;
• Evaluates various strategic options; and
• Identifies the critical success factors of a project.
In the ports and shipping industry globally, including in sub-Saharan Africa, we have developed a number of financial models for a number of port projects, including the feasibility of port infrastructure (container and bulk terminals) as well as on the viability of port management and operations companies/bodies.
Our maritime services
Port sectorreform,
restructuringand
privatisation
Liberalisationof the ports
and maritimesectors
Port PPPs – transaction structuring
to deals
Trafficforecasting
Businessstrategy, business
planning andinvestment
planningOperational
efficiency andsystems
development

Strengthening Africa’s gateways to trade72
9. Continuing the conversation
Our Capital Project and Infrastructure team, incorporating our Transportation and Logistics group, has developed into a leading advisor to clients facing complex challenges across the capital projects, transport and logistics and port/maritime industries.
Our specialists work in many countries across sub-Saharan Africa and globally, supporting our clients to achieve business goals, finding the best solutions for their business challenges and delivering on their key projects.
For any port-related queries, services or assistance required, please contact one of our team listed on the next page.

PwC 73
9. Continuing the conversation
Africa
Francois BotesTransport & Logistics Port Expert PwC South Africa
+27 (11) 7975089
Southern Africa
Dr Andrew ShawAfrica Transport & Logistics Leader PwC South Africa
+27 (11) 797 5395
Jonathan CawoodAfrica Capital Projects & Infrastructure Leader PwC South Africa
+27 (11) 7975236
East Africa
West Africa
Global transport & logistics and ports contacts
Julian SmithGlobal Transport & Logistics Leader PwC Indonesia
+ 62 21 52890966
Socrates Leptos-Bourgi Global Shipping & Ports Coordinator and Transport & Logistics Leader PwC Greece
+30 210 6874630
[email protected]. com
Manish R Sharma Ports Centre of Excellence and India Transport & Logsitics Leader PwC India
+91-124-3306414
Peter Kauschke Global Transport & Logistics Director PwC Germany
+49 211 981 2167
Tom VermeirenTransport & Logistics Port Consultant PwC Belguim
+32 9 2688233
Jean-Philippe DuvalPartner Public Sector & Space PwC Francophone Africa
+33 672795011
Kuria MuchariaEast Africa Capital Projects & Infrastructure Leader PwC Kenya
+254 (20) 2855263
Rishit Shah Tanzania Tax Leader and Consumer & Industrial Products Leader PwC Tanzania
+255 (0) 22 219 2601
Vish AshiagborGhana Capital Projects & Infrastructure Leader PwC Ghana
+233 (0) 302
Ian AruofurNigeria Capital Projects & Infrastructure Leader PwC Nigeria
+234 1 271 1700 Ext 47001
Edward KerichKenya Infrastructure Leader PwC Kenya
+254 (20) 2855397

Strengthening Africa’s gateways to trade74

PwC 75PwC
Appendices

Strengthening Africa’s gateways to trade76
Appendices
Appendix A: Hub attractiveness score
Region Country Port Total
Rotterdam 421
Southern Africa South Africa Durban 94
Southern Africa South Africa Cape Town 50
Southern Africa South Africa Nqgura 50
West Africa Côte d’Ivoire Abidjan 46
East Africa Kenya Mombasa 46
East Africa Djibouti Djibouti 40
West Africa Nigeria Lagos-Apapa 40
West Africa Ghana Tema 40
East Africa Tanzania Dar es Salaam 35
Southern Africa South Africa East London 34
West Africa Senegal Dakar 33
West Africa Cameroon Douala 32
West Africa Benin Cotonou 31
West Africa Nigeria Onne 30
Southern Africa Angola Luanda 30
West Africa Congo Pointe-Noire 29
Southern Africa Namibia Walvis Bay 28
West Africa Côte d’Ivoire San Pedro 26
West Africa Ghana Takoradi 25
Island Mauritius Port Louis 24
West Africa Togo Lomé 24
Southern Africa Mozambique Pemba 23
West Africa Guinea Conakry 22
Southern Africa Mozambique Nacala 22
Source: PwC analysis

PwC 77
Appendices
Region Country Port Total
Southern Africa Angola Lobito 22
West Africa Equatorial Guinea Malabo 22
West Africa Gabon Libreville 21
Southern Africa Mozambique Beira 20
Southern Africa Mozambique Maputo 19
West Africa Cameroon Kribi 19
Southern Africa Angola Cabinda 18
Southern Africa Angola Soyo 18
East Africa Kenya Lamu 18
West Africa Equatorial Guinea Bata 18
West Africa Mauritania Nouakchott 18
Southern Africa Namibia Luderitz 17
West Africa Liberia Monrovia 16
Island Madagascar Toamasina 16
West Africa Sierra Leone Freetown 16
West Africa Mauritania Nouadhibou 16
West Africa Gambia Banjul 15
West Africa DR Congo Matadi 12
East Africa Somalia Berbera 10
East Africa Tanzania Mtwara 9
West Africa Guinea-Bissau Kamsar 8
Island Comore Mutsamudu 6
Island Cabo Verde Praia 6
Island Seychelles Victoria 5
East Africa Somalia Mogadishu 4
Source: PwC analysis

Strengthening Africa’s gateways to trade78
Appendices
Appendix B: Sub-Saharan GDP growth data
Country 2017e 2018–2022f 2023–2027f Forecast % change in real economic activity in local currency over the next 10 years
Angola 1.9% 2.9% 1.4% 24%
Benin 4.4% 4.8% 4.7% 60%
Botswana 1.5% 4.9% 5.6% 67%
Burkina Faso 5.6% 6.6% 6.8% 91%
Burundi -1.6% 2.3% 4.0% 36%
Cameroon 5.2% 5.5% 5.2% 69%
Cabo Verde 3.8% 2.5% 3.2% 33%
Central African Republic 2.7% 5.0% 5.7% 69%
Chad -5.0% 0.2% 1.0% 6%
DR Congo 2.9% 4.7% 5.7% 65%
Congo -4.6% 2.7% 3.1% 33%
Côte d`Ivoire 7.8% 6.1% 6.0% 80%
Djibouti 6.9% 7.1% 6.1% 90%
Equatorial Guinea 7.9% -0.2% 0.1% -1%
Eritrea -0.5% 0.7% 0.9% 8%
Ethiopia 7.5% 7.2% 6.1% 90%
Gabon 0.9% 3.6% 3.3% 41%
Gambia 3.3% 4.9% 4.6% 59%
Ghana 8.0% 6.2% 6.1% 81%
Guinea 5.4% 4.0% 4.3% 51%
Guinea-Bissau 5.5% 4.5% 5.0% 60%
Kenya 4.5% 5.3% 5.4% 68%
Lesotho 4.0% 3.6% 4.6% 50%
Liberia 4.2% 5.4% 6.0% 74%
Source: PwC analysis, BMI

PwC 79
Appendices
Country 2017e 2018–2022f 2023–2027f Forecast % change in real economic activity in local currency over the next 10 years
Madagascar 4.0% 4.0% 4.1% 49%
Malawi 5.2% 5.1% 5.6% 68%
Mali 5.0% 5.1% 4.9% 62%
Mauritania 3.1% 4.4% 4.5% 54%
Mauritius 3.9% 3.8% 4.4% 50%
Mozambique 4.1% 5.6% 8.2% 94%
Namibia -0.6% 3.4% 4.3% 46%
Niger 5.6% 5.7% 5.6% 74%
Nigeria 0.7% 4.0% 4.7% 53%
Rwanda 5.7% 7.3% 7.6% 106%
São Tomé and Príncipe -0.6% 6.0% 4.1% 64%
Senegal 7.3% 7.4% 7.4% 104%
Seychelles 5.0% 4.4% 4.6% 55%
Sierra Leone -6.9% 5.3% 5.2% 67%
Somalia 2.6% 2.6% 2.6% 29%
South Africa 0.8% 2.0% 3.0% 28%
South Sudan 1.2% 4.4% 4.4% 54%
Swaziland 0.6% 0.9% 2.5% 19%
Tanzania 5.3% 5.9% 6.1% 79%
Togo 5.2% 4.4% 4.4% 54%
Uganda 6.0% 6.3% 6.4% 85%
Zambia 6.3% 5.7% 5.5% 72%
Zimbabwe 0.9% 3.4% 4.9% 50%
Source: PwC analysis, BMI

Strengthening Africa’s gateways to trade80
Appendices
Appendix C: Port Performance Ratings
Region Country Port PPR
Rotterdam 129
Southern Africa South Africa Durban 98
Southern Africa South Africa Cape Town 90
Southern Africa South Africa Nqgura-Coega-PE 90
Southern Africa South Africa East London 77
East Africa Kenya Mombasa 74
Southern Africa Namibia Walvis Bay 67
West Africa Ghana Tema 64
West Africa Nigeria Lagos-Apapa 64
Island Mauritius Port Louis 62
West Africa Côte d’Ivoire Abidjan 60
West Africa Gabon Libreville 59
West Africa Benin Cotonou 59
West Africa Senegal Dakar 58
Southern Africa Mozanique Maputo 58
Southern Africa South Africa Saldanha 56
Southern Africa South Africa Richards Bay 56
East Africa Tanzania Dar-es-Salaam 53
East Africa Djibouti Djibouti 53
West Africa Sierra Leone Freetown 52
West Africa Ivory Coast San Pedro 52
Southern Africa Namibia Luderitz 52
West Africa Liberia Monrovia 48
East Africa Kenya Lamu 48
West Africa Ghana Takoradi 47
West Africa Gambia Banjul 42
Source: PwC analysis

PwC 81
Appendices
Region Country Port PPR
Southern Africa Mozambique Pemba 41
East Africa Tanzania Mtwara 41
Southern Africa Mozambique Nacala 40
Southern Africa Mozambique Beira 40
West Africa Guinea Conakry 39
West Africa Congo Pointe-Noire 38
West Africa Mauritania Nouakchott 37
West Africa Cameroon Kribi 37
Island Madagascar Toamasina 36
West Africa Mauritania Nouadhibou 36
West Africa Guinea-Bissau Kamsar 35
Southern Africa Angola Cabinda 33
Island Seychelles Victoria 32
Southern Africa Angola Lobito 30
West Africa Cameroon Douala 28
Southern Africa Angola Luanda 26
West Africa DR Congo Matadi 24
Island Comoros Mutsamudu 20
West Africa Nigeria Onne 18
Southern Africa Angola Soyo 17
West Africa Togo Lomé 0
West Africa Equatorial Guinea Malabo 0
West Africa Equatorial Guinea Bata 0
East Africa Somalia Berbera 0
Island Cabo Verde Praia 0
East Africa Somalia Mogadishu 0
Source: PwC analysis


www.pwc.co.za
The information contained in this publication is provided for general information purposes only, and does not constitute the provision of legal or professional advice in any way. Before making any decision or taking any action, a professional adviser should be consulted. No responsibility for loss to any person acting or refraining from action as a result of any material in this publication can be accepted by the author, copyright owner or publisher.
This publication has been prepared for general guidance on matters of interest only, and does not constitute professional advice. You should not act upon the information contained in this publication without obtaining specificprofessionaladvice.Norepresentationorwarranty(expressorimplied)isgivenastotheaccuracyorcompletenessoftheinformationcontainedinthispublication,and,totheextentpermittedbylaw,PricewaterhouseCoopers Inc, its subsidiary and associated companies and entities and their respective directors, employees agents and subcontractors do not accept or assume any liability, responsibility or duty of care for any consequences of you or anyone else acting, or refraining to act, in reliance on the information contained in this publication or for any decision based on it.
© 2018 PricewaterhouseCoopers (‘PwC’), a South African firm, PwC is part of the PricewaterhouseCoopers International Limited (‘PwCIL’) network that consists of separate and independent legal entities that do not act as agents of PwCIL or any other member firm, nor is PwCIL or the separate firms responsible or liable for the acts or omissions of each other in any way. No portion of this document may be reproduced by any process without the written permission of PwC.
(18-21653)