strength of composite sla bs: comparison of basic
TRANSCRIPT
STRENGTH OF COMPOSITE SLABS: COMPARISON OF BASIC PARAMETERS AND THEI R BAC KGROUND
M atti V. Leskel ii Rakenteiden Mekaniikka, Vol . 25 No 2 1992, ss . 20 - 38
ABSTRACT: Composite slabs are a special type of concrete slab which have their tensile reinforcement in the form of profiled steel sheeting. For economical use of the steel sheeting, adequate anchorage must be provided in order to allow full plastic flexural resistance in the slab. The design problems involved in composite slabs are closely connected with predicting the anchorage resistance required for verification of slab performance.
There are two types of anchorage parameter which can be used to determine the ultimate load resistance of a composite slab for design purposes, (1) a nominal bond or anchorage strength, calculated for a horizontal project area of the sheet surface along the shear span of the slab, and (2) parameters m and k for determining the ultimate shear resistance of the slab independent of the failure type.
Both parameters are determined experimentally but questions sometimes arise to whether these parameters have something in common or not, whether there is any correlation between the two, or whether the nominal bond strength performs better for describing the true flexural behaviour up to failure. In brief, this paper is intended to study, whether the coefficients m and k can be considered to give a reliable prediction of the ultimate resistance if the slab has the nominal bond strength determined for it beforehand. For this purpose, a formulation is provided for predicting the ultimate shear resistance of the slab in the case of a typical test setup, i .e. the slab tests are simulated on the assumption that the true bond strength of the steel sheeting is known. Some numerical examples are given to study the correlation. Eurocode-type notation (EC4, Part 1, section 1.6) is used for the symbols where this proves to be reasonable. The compressive strength of the concrete is defined according to the Finnish tradition, with respect to the cube strength.
INTRODUCTION
Profiled light-gauge steel sheetings are a useful form of concrete reinforcement
because their cross-sectional area is considerable, in the normal case of 0,9 mm
sheet thickness far more than 1000 mm 2 of cross-sectional area is obtained. If no
special means are provided for bonding the sheeting to the concrete, the profile
cannot hardly be effectively utilised as a reinforcement, because the tensile stress
resultant must be maintained in order to develop full plastic flexural resistance in the
slab.
20

There are two types of anchorage parameters available to determine the ultimate
load resistance of a composite slab for design purposes,
(a) <ud, a nominal design bond strength calculated for a horizontal area b · lb,
b being the design width and lb the anchorage length along the span of the
slab. <ud is determined experimentally.
(b) parameters m and k for determining the shear resistance of the slab in the
case of an anchorage failure occurring. The coefficients m and k are based on
experiments carried out with full-scale test slabs . The results are analysed
using a standard procedure given in EC4 and its background documents /1, 3/.
NOMINAL BOND STRENGTH 'ru
The concept of horizontal shear resistance r u in relation to partial shear
connection theory is only suitable for composite slabs with a ductile behaviour as
defined in EC4, Part 1, 1 0.3.1.4 /1/:
The behaviour of a test slab is classified as brittle if the failure load does not exceed the load causing first end slip by more than 10 %. If the maximum load is reached at a midspan deflection exceeding L/50, the failure load shall be taken as the load at the midspan deflection of L/50. All other cases are classified as ductile.
The definition given above is not quite exact. No indication is given in this
section for detecting the first end slip of the sheeting, and in many cases it would be
a matter of a good guess to judge the initiation of slipping unanimously from the test
recordings. Luckily enough, a very careful scrolling through paragraphs other than
10.3 of EC4/Part 1 reveals that the initial slip load is defined in passing when
considering deflections in composite slabs in the paragraph 7 .6.2 .2, clause (9): the
load causing an end slip of 0.5 mm shall be called the initial slip load.
Anyway, the idea behind the definition is clear: in order to develop a plastic
distribution for the connection shear flow, a certain amount of end slip is required
to be sure that the tensile stress resultant of the sheeting, Ft is anchored by an evenly
distributed horizontal shear stress r u , see Fig. 1.
21

Fig. 1.
l J
v
I
I I
....::::~_ I
I
If the connection is ductile, the bond stresses in the connection interface can develop a plastic uniform distribution <u
PARAMETERS m and k
There is no mechanical background for the parameters m and k, although such
ideas have sometimes erraneously been put forward. The coefficients are solely
based on the evaluation of test results in certain coordinates: it has been found
that there is a close correlation between the maximum vertical shear force obtained
in the tested slabs and their principal properties (see Fig 1.):
depth of the slab, d,
shear span of the slab, L5 ,
cross-sectional area of the sheeting, Aap,
tensile strength, fct, or some other similar strength parameter of the
concrete.
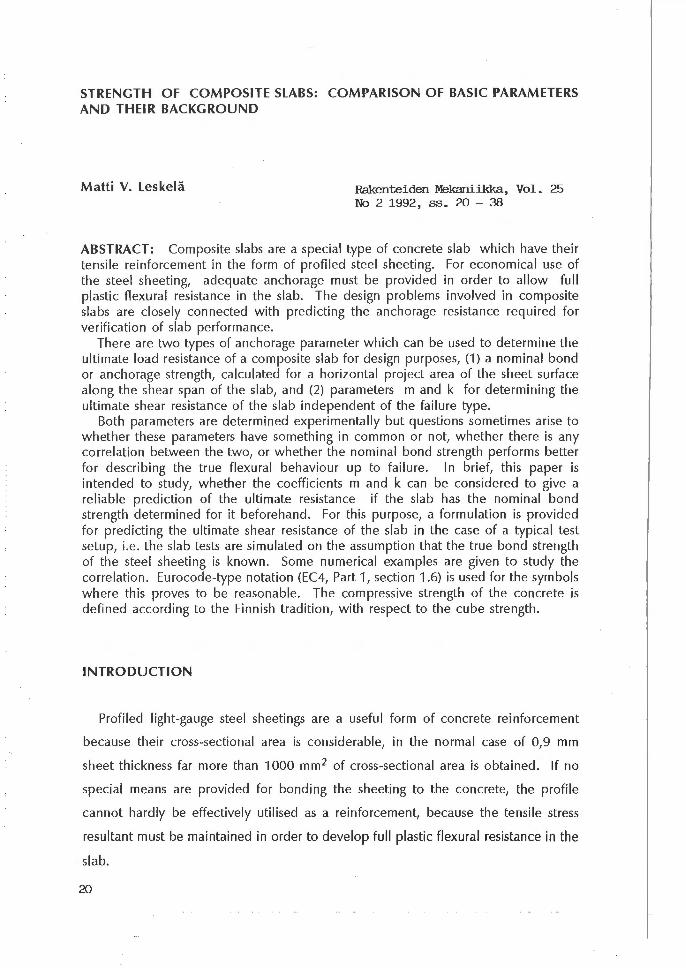
If these properties are varied, the test results will show nearly linear behaviour in
the coordinates given in Fig. 2., hence a linear regression analysis can be applied to
evaluate the tests and to give a design relationship for the maximum vertical shear
force predicting the ultimate resistance and the principal properties of the slab /1/.
(mpd/L5 + kfctd)bd/yy, Yv = 1.25 (1)
22
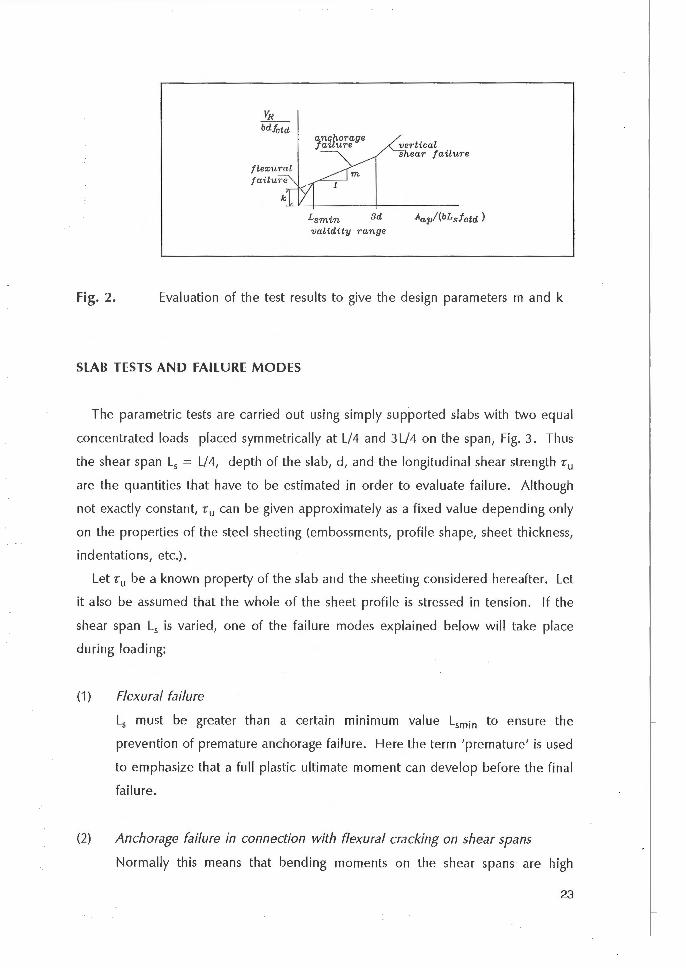
Fig. 2.
flexura l
anchorage fai lure
Lsmin 3 d validity range
vertical s ear failure
Evaluation of the test resul ts to give the des ign parameters m and k
SLAB TESTS AND FAILURE MODES
The parametri c tests are ca rried out using simply supported slabs w ith two eq ual
concentrated loads placed symmetrica lly at L/4 and 3 L/4 on the span, Fig. 3. Thu s
th e shear span L5 = L/4, depth of the slab, d, and the longitudinal shear strength r u
are th e quantiti es that have to be estim ated in order to evaluate failure. Al though
not exactl y constant, r u can be given approximately as a fixed value depending only
on the properties of th e stee l sheeting (embossments, profil e shape, sheet thi ckn ess,
ind entations, etc.).
Let ru be a known property of the slab and th e sheeting considered hereafte r. Let
it also be assumed th at the w hole of the sheet profil e is stressed in tension. If th e
shear span L5 is va ried, one of the fa ilure modes explained below w ill take place
during load ing:
(1) Flexural failure
L5 must be greater than a certa in mini mum value Lsmin to ensure the
prevention of premature anchorage failure. Here th e term 'premature' is used
to emphas ize th at a full plasti c ultimate moment ca n develop before th e fin al
failure.
(2) Anchorage failure in connection with flexural cracking on shear spans
Normally this means that bending moments on th e shear spans are high
23

enough to induce flexural cracks, which tend towards the concentrated loads
due to interaction with the vertical shear force.
(3) Anchorage failure in connection with a high longitudinal shear flow on shear spans which still remain uncracked, no end slip produced
Normally this means that the shear spans must be short. When the shear flow
reaches the critical value bru, anchorage failure will take place simultaneously
with the diagonal or vertical cracking of the concrete and a total collapse will
ensue. This type of failure is not usual and belongs to non-ductile rigid
connections.
(4) Diagonal tensile failure of concrete
Fig. 3.
For very short shear spans diagonal tension failure can occur in the concrete.
Normally this type of failure requires a load which is very much higher than
in the other modes, because part of the load is transferred to the support by
the arching effect formed on the short shear spans.
Test arrangement for the determination of parameters m and k. Central deflection is measured for definition of the ultimate load in the test. End slip between the concrete and the steel profile is measured in order to define the initial slip load and the mode of failure: · the mode is defined as flexural if initiation of slipping is lacking before the ultimate load .
FAILURE PREDICTION
Equations for predicting the failure loads for different span and depth
configurations are derived on the basis of the material and mechanical definitions
listed below.
24

(1) The flexural cracking resistance of the slab, Mcr.R, is predicted according to
the ultimate tensile strain Ectu at the level of the centroid of the sheet profile.
Although t:ctu may have a somewhat random character, measurements suggest
that it will most likely be Ectu = 0.2 ... 0.4 o/oo. Thus
(EI)i =
e = a
composite flexural stiffness of the uncracked slab cross-section,
distance of the sheet profile centroid from the neutral axis.
(2)
(EI)i is calculated on the basis of the complete interaction using the formula
(EI)i = (1 + ai )(EI)c,
(EI)c = Ec bhc3 /12,
(EA)c = Ec bhc 1
ei = da + he /2,
ai = ei 2 (EA)ap /(EI)c,
eco = (O.Shc (EA)c + d(EA)ap )/((EA)c + (EA)ap ),
ea = d - eco.
(3)
(2) The longitudinal shear flow along the shear span is calculated with respect to
the vertical shear force V,
vi = (EA)ap e3 V/(EI)i . (4)
If the maximum value for v1 is b-ru, the failure load for the mode (3) is
(5)
(3) The shear stresses of the concrete on the level of the neutral axis are
calculated accordingly as
Tc = (EA)co ec V/(EI)i,
(EA)co = Ecd bhc /2, ec = eco /2. (6)
25

If the maximum shear stress to be reached is fct, the failure load for the
mode (4) is
V dt.R = fct (EI)i /((EA)co ec ). (7)
(4) The effective design secant modulus of the concrete, Ec , is calculated
according to EC2/Part 1 /2/
Ecd = 9525(0.8K + 8) 113 , (MPa), (8)
K = cube strength of the concrete (MPa).
In order to allow for the incomplete interaction due to the bond slip, a
reduced value Ecd = Ec /1,5 could be used for the deflection calculations.
(5) The flexural resistance of the slab in the case of full shear connection
(L5 2: Lsmin) is calculated according to the reinforced concrete formula
Mpi.R = ,ubd 2 fcc, fcc = 0.7K,
,u = w(1 - w/2), w = Aap fy /(bdfcc ). (9)
For the cases L5 2: Lsmin (lsmin is defined in the next section), the failure load
is
(1 0)
FLEXURAL FAILURE VS. ANCHORAGE FAILURE
For certain shear spans L5 > Lsmin the bond resistance is capable of preventing
premature anchorage failure along the sheared connection interface. Let the
uncracked section of the shear span be denoted with lb = length in which the
longitudinal shear flow can develop to its plastic value bru. In the cracked section
of the shear span the bond will have deteriorated because the stiffness of the
concrete between the adjacent cracks is not sufficient to transfer the full shear flow
of the connection into the compressed concrete. Thus a linear variation from bru to
zero is assumed for this section (see Fig. 4 ).
26

Fig. 4.
\ Partial plastic connection shear flow distribution for the failure load estimation VI.R
If the plastic yielding of the steel profile is to be reached before the initial slip
load, the following condition must be satisfied
Aap fy ~ b-rbis 1Ls1 + (Ls + lb )/2], or
lb 2: 2Aap fy /(brbis ) - L5 - 2 l 51 .
(11)
rbis denotes the nominal bond stress rb at the moment of the initial slip. lb is
estimated according to the anchorage properties. Let rb be distributed uniformly
along the total L5 provided that there are no other cracks than that under the point
load. When rb < rbis, more cracks can form on the shear spans on condition that
the tensile resultant Fer inducing cracking is exceeded in the connection interface
(Fig. 5). F cr is calculated from the ultimate tensile strain of the concrete,
(12)
(13)
lb can now be inserted into equation (11) in order to solve it for L5 ,
(14)
27

Fig. 5.
cracking section
Anchorage length lb is evaluated according to the possibility of an additional crack forming, if the resultant Fb1 - Fb2 > F cr
Let us now assume that L5 < Lsmin, i.e. full flexural resistance Mpi.R cannot be
reached. According to the flexural equilibrium and the ultimate limit state of the
rotating section (see Fig. 4), we can write
VI .R L5 = (d - x/2)bru [L51 + (L5 + lb )/2],
X = iu [L51 + (L5 + lb )/2]/fcc 1
thus
VI.R = bru {d -~ [L51 + (L5 + lb )/2l}!Ls1 + (L5 + lb )/2] Ls 2fcc
(15)
(16)
Equation (16) is based solely on the force equilibrium and does not consider the
failure condition of the concrete at the edge of the principal crack. Thus it shows
only the upper bound for the failure load, which still has to be evaluated from the
failure condition of the concrete.
Let the stresses of the compression zone be ac and rc. Failure will ensue when
the principal tensile stress due to the components ac and rc becomes equal to the
tensile strength, i.e.
(17)
If a parabolic distribution is assumed for the shear stresses ic and normal stresses
ac, this equation can be further manipulated to give
(18)
28

in which Vap.R denotes the shear resistance of the steel sheeting alone. In order to
manage with equation (18), the normal stress ac needs to estimated. A natural guess
for it will be ac = fcc· Furthermore, Vap.R should be estimated according to the
profile form of the sheeting.
One further boundary case has to be considered: the yielding of the steel profile
for situations L5 < Lsmin . Although the connection is capable of letting the steel
profile develop a yield, failure must be considered to be of the anchorage type if
initial slip has occurred. This most propably means that the slab cannot develop full
plastic resistance Mpi.R due to slipping. This time equation (16) predicts the failure
load directly according to Mpi.R /L5 or higher, if no boundary conditions are set.
To simulate the real situation, we assume that 0.8Mpi.R can be reached if yielding
is entered at the same time as r u develops. If yielding is entered at the moment of
reaching rbis' it is assumed that full plastic moment can develop. The linear
variation is set between (0.8 ... 1.0)Mpi.R , and the ultimate load is calculated
according to the maximum moment evaluated for the case. It must noted that
reduction 0.8 may be true for some sheetings but not unconditionally for all.
NUMERICAL CALCULATIONS
The calculations were performed by means of a PC program designed to use the
formulation given. The procedure for the determination of the most probable failure
mode to take place may be listed briefly as follows:
(1) Calculate Lsmin I v dt.R I v vi.R I vi.R and v mpi.R . For vi.R apply equations
(16) and (18) to get the minimum value. Check that VI.R does not exceed the
boundary value defined by yielding,
(2) If L5 > Lsmin , take V mpi.R for the resistance,
(3) If Ls :5 Lsmin I take vi.R for the resistance,
Furthermore, check that upper bounds Vdt.R or Vvi.R are not exceeded by VI.R
(rigid, non-ductile connection).
Three slab depths, having values d = 105, 145 and 185 mm were employed for
the calculation, and a representative cross-section area Aap = 1200 mm 2 was
assumed for fictitious sheeting having a yield strength fy = 360 MPa. The
29

bond strength levels ru = 0.35, 0.50, 0.65 and 0.80 MPa were used to study
whether the formulation will yield any reasonable results or not. The 'randomness'
of the cracking of the concrete was modelled by letting ectu have values in
the range 0.2 .. 0.4 o/oo. The variation in ectu directly affects the value of lb . The
influence of different slip performances was studied by using two ductility settings.
A more ductile connection was considered by setting rbis = 0.5ru, and a less ductile
one was considered by setting rbis = 0,9ru, which can still be classified as ductile
according to EC4.
The most representative of the calculation results are gathered together in
Tables 1. and 2. Different shear spans were employed in the range of
Lsmin > Ls > 3d. A linear regression analysis was used to see the correlation ofthe
results for a line in the coordinates given in Fig 2. The correlation
coefficient r = ± 1 indicates a perfect fit while r = 0 would imply no fit at all.
Figs. 6. to 9 . present the calculation results when the less ductile connection
was employed.
Table 1. Coefficients m and k and correlation coefficient r from a linear regression analysis employing different sets of parameters ru . when eighteen values for VI.R were calculated for each "u· Three depths d were used, d = 105, 145 and 185 mm, and two shear spans for each slab depth. Three values for ectu were given to simulate the 'randomness of cracking', ectu = 0.2, 0.3 and 0.4 o/oo. One concrete strength class was employed, K35 (= cube strength 35 MPa), rbis /ru = 0.5 was assumed for all cases.
'iu m k r
0.80 MPa 281.62 0.039 0.994
0.65 MPa 284.94 0.030 0.996
0.50 MPa 262 .16 0.036 0.993
0.35 MPa 111.82 0.116 0.995
30

Table 2. Coefficients m and k and correlation coefficient r from a linear regression analysis employing different sets of parameters ou when eighteen values for VI.R were calculated for each o u . The same three values for ectu were used as in Table 1. Concrete strength class K35, obis lou = 0.9 was supposed for all cases.
Slab depths d = 105, 145, 185 mm
m k
0.35 MPa 47.89 0.180 0.876
0.50 MPa 96.63 0.198 0.855
Slab depths d = 75, 95, 115 mm
m k
0.65 MPa 72 .20 0.251 0.925
0.80 MPa 89.14 0.296 0.909
Considering now 'test results' of Table 1., we can see that there is no systematic
change in the correlation coefficient between the different effectivenesses of the
bond. Only one concrete class was employed (the same is also true of real testing),
and this may influence the minimum scatter of the values. It seems that there is no
clear difference between classes ou = 0.80 and ou = 0.65 MPa for the coefficients
m and k. Only the class having ou = 0.35 MPa differs markedly from the others,
and this class may be considered to have only a moderate bond effectiveness. One
factor should be noted between the groups having 'moderate' and 'fair' bonds: it
seems as though the dependence of the resistance on the shear span is greater for
a fair bond than for a moderate one. This is seen from the values for the
coefficients k, which clearly regulate the dependence on the strength of the concrete.
The contents of Table 1 may look 'too good', and it must be asked whether the
perfect fit has something to do with the selections made. Most of all these include
the ratio obis lru , which characterizes the ductility of the connection. More
calculations were made to see what would happen if the connection were more
brittle. Still remaining in the area of a ductile connection, the ratio obis lou = 0.9
was chosen according to the limit at which the connection would still be classified
as ductile. The results of this calculation are shown in Table 2. A clear trend was
noted for this computation: if the slab depths were kept the same for all bond
31

classes, there was a clear reduction in the correlation coefficient as the bond strength
increased. This is due to the decrease in Lsmin relative to the increasing bond,
i.e. the span (Lsmin - 3d) grows smaller and it is not possible to maintain it within
reasonable limits unless the slab depths employed are reduced for higher bonds.
The correlations could be .maintained satisfactorily for the depths chosen.
It can be also expected that all the classes in Table 2. would have yielded
correlation coefficients r 2': 0. 9 if the depths had been chosen appropriately. The
sets employed are shown to emphasize that the selections made for testing the slab
are of great importance for the interpretation of its behaviour and parameters. These
questions are discussed further in the next section.
TESTING OF COMPOSITE FLOOR SLABS IN EC4
The rules given in EC4/Part 1, section 1 0.3, aim only to explain the test for
determining the behaviour in the anchorage failure mode, i.e. the main reason for
testing the slabs is to obtain values form and k to use in design (see equation (1)),
or to find •ud for the partial connection theory explained in EC4/Part 1, annex F.
A minimum of six tests is required to determine the appropriate m and k. The
specimens should be divided into groups of two or three so that the shear span in
one group should be as long as possible whilst still providing an anchorage failure
and that in the other group as short as possible whilst still providing the same mode
of failure. As it is a well-known fact that if the shear span is shortened unlimitedly
part of the shear force is transmitted directly to the support, the shear span in tests
must not be less than 3d.
The reliability of the system is clearly dependent of the grouping of the specimens,
i.e. arranging the test plot groups to be as far from each other as possible. Another
point of importance is evaluation of the test results, i.e. how to judge the real failure
mode. The spirit of EC4 is that all test results producing a failure load less than
Vmpi.R should be classified as anchorage failures. This avoids use of the reduction
coefficients otherwise required to evaluate flexural resistance.
32

Fig. 6.
Fig. 7.
Vz.R bdfctd
0 .30
0.25
0.20
0 .15 --------0
" kL:: " v---- c
~ c
c
-2 0.5 1.0 1.5 2 .0 x10
Aap/(bLsfctd )
Plot of calculation data for •u = 0.35 MPa, rbis /ru = 0.9. Eighteen data points for three slab depths d = 105, 145, 185 mm. Correlation with the line of best fit, r = 0.876.
Vz.R bdfctd
0 .40
0.35
0 .30
0.25
0.20 /
0
"L A
Q
0.5 1.0 1.5
~ 8 c
Plot of calculation data for 'l'u = 0.50 MPa, rbis lru = 0.9. Eighteen data points for three slab depths d = 105, 145, 185 mm. Correlation with the line of best fit, r = 0.855.
33

The correlation coefficient in Table 1. is practically unity, i.e. there is a perfect
correlation for the regression line in all cases considered. But the question arises of
what to do if the bond is near 'perfect', or the connection shows a very rigid
performance, i.e. there is only a small range of shear spans having a possibility to
produce an ancorage failure. The expectations can be postulated as follows :
for sheetings having only a moderate bond strength it is possible to arrange test groups easily as one wishes, because the range of L5
producing anchorage failures is not limited due to the high value of (Lsmin - 3d),
for the sheeting having an effective bond, (lsmin - 3d) becomes quite small and it may not be possible to find easily an appropriate range of test setups to characterize the idea of two groups, i.e. if only tests with an anchorage failure are approved, the plots will be relatively close together, unless there is some pre-knowledge of the characteristics of the connection available to choose the slab depths appropriately. Wrong selections will produce a poor correlation factor.
In section 10.3 .1.4 of EC4/Part 1, clause (5), a simple determination rule for the
design relationship m and k is given on condition that no deviation in any individual
test result from the- mean for its group exceeds 10 %:
semi-characteristic values are obtained from the two groups by taking the minimum value for the group reduced by 10 %. The straight line explaining the dependence of the resistance VI.R on the parameters m and k is formed through these semi-characteristic values.
In other cases a very elaborate procedure, not fully explained in EC4/Part 1, must
be undertaken. Details for this procedure are found in a background document to
EC3 /3/.
Nothing is said in EC4/Part 1 about the correlation required for satisfactory
evaluation of the test results. As seen before, there may be a reducing correlation
in the regression analysis as the bond strength increases. In the background
document for EC3 /3/ the correlation for the calculation model chosen is said to be
sufficient if r ~ 0.9, but nothing further is said about the procedure in the case of
insufficient correlation. Perhaps another model for the calculation should then be
chosen.
34
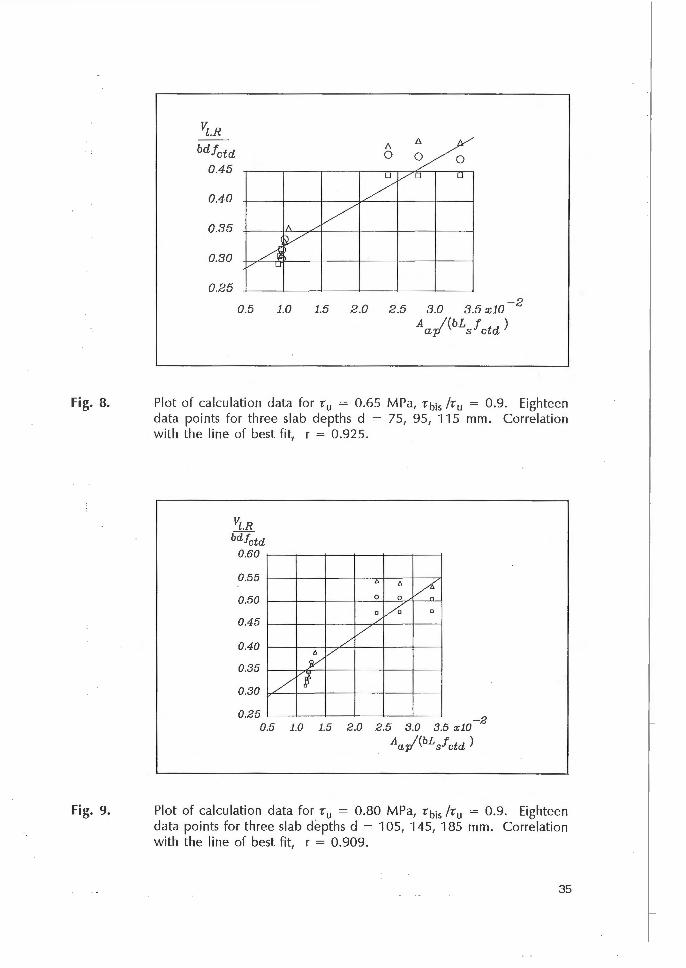
Fig. 8.
Fig. 9.
Vz.R bdfctd
0.45
0.40
0.35
0.30
0.25
v
0.5
lA
v1 v
u
1.0
/',.
~ 0
0 vo 0
/ v
1.5 2.0 2.5 3 .0 3.5 x10 -2
Aa.j(bLJctd)
Plot of calculation data for iu = 0.65 MPa, ibis hu = 0.9. Eighteen data points for three slab depths d = 75, 95, 115 mm. Correlation with the line of best fit, r = 0 .925 .
yt.R bdfctd
0.60
0.55
0.50
0.45
0.40 ./ v
h.
"' h.
~ 0 0
cl,/c' c
v y 0.35
0.30 / 't
0.25 0.5 1.0 1.5 2.0 2.5 3.0 3.5 x10 -
2
Aa-/(bLsfctd)
Plot of calculation data for iu = 0.80 MPa, ibis hu = 0.9. Eighteen data points for three slab depths d = 105, 145, 185 mm. Correlation with the line of best fit, r = 0.909.
35
DISCUSSION AND CONCLUSIONS
In the formulation derived for the anchorage type of failure concerning a loading
setup with two point loads on a simply supported span, it was shown that the
minimum shear span required to produce flexural failure is dependent on the bond
characteristics and the ductility of the connection. This is a totally different idea
from the current approach of considering Lsmin on the basis of Aap fyf(b-c u).
The calculations performed here show that certain pre-knowledge is preferable in
order to be able to make the right decisions for the specimen dimensions (d, L5 ).
Interpretation of the test results is also of importance: to identify an anchorage
failure, one must only check for the amount of end slip at the moment
of failure (0.5 mm required to indicate the initiation of bond slipping and entry into
the anchorage failure mode), independent of the plastic yielding in the zone of
maximum moment.
The partial shear connection theory was not applied in the manner expressed in
EC4/Part 1, due to the fact that this theory finds its best applications in cases having
deep sheet profiles, i.e. part of the steel section is compressed. For the moment
there is no such sheeting being used in practice in Finland, although increasing
interest can be seen towards them. This paper does not claim to go deeply into the
problems of where part of the steel section is compressed. It is enough to state that
the theory explained here could also be used for such a problem, providing that
appropriate alterations are made to the formulation concerning stress resultants and
equilibrium conditions. Another paper may be prepared for this case.
ACKNOWLEDGEMENTS
Special thanks are expressed to RAUTARUUKKI OY/Paavo Rannila Oy for letting
the author check the validity of the theory explained in this paper with some values
from the world of real sheetings. Further thanks are expressed to HOMECON OY
for their manifestations of suspicion concerning the validity of the m-k method, and
for giving an impulse to the formulation of the problem. In closing, LOHJA OY must
not be forgotten, in view of their enthusiasm for developing products based on
composite steel sheeting.
36

NOTATIONS
A Eurocode type of symbolism was used in this paper where it proved to be
appropriate. Due to the fact that the notations employed are not familiar, it may be
useful to list those not fully explained in text.
ap index for the steel sheeting
d index for the design values, effective depth of the cross-section
R index for the resistance
he depth of slab over the steel sheeting
da distance of the sheeting centroid from the top of the sheeting
Aap cross-sectional area of the steel sheeting
Mpi.R flexural resistance of the cross-section, calculated according to the
plastic theory
VI.R maximum shear force obtained for the structure before anchorage-type
failure
(EA) block notation for axial stiffness
(EI) block notation for flexural stiffness
m tangent modulus of the regression line, calculated according to the
criterion of ordinary least squares, see /4/
k distance of vertical axis intersection point from origo of the regression
line, see /4/
correlation coefficient calculated from the linear regression analysis,
see /4/
REFERENCES
/1/ Eurocode No. 4: Design of Composite Steel and Concrete Structures Part 1 - General Rules and Rules for Buildings. Revised draft. Issue 1, Oct. 1990. Eurocode 4 Editorial Group
/2/ Eurocode No. 2: Design of Concrete Structures Part 1 - General Rules and Rules for Buildings. Revised Final Draft, December 1989. Eurocode 2 Editorial Group
37

/3/ Report No.: Bl-87-112 Procedure for the determination of design resistance from tests November 1987, update June 1988, update November 1988 TNO Institute for Building and Materials and Structures RWTH Aachen lnstitul fOr Stahlbau University of Technology, Eindhoven
/4/ Wonnacot, T.H. and Wonnacot, R.j.: Introductory Statistics, Fifth Edition John Wiley & Sons, Singapore 1990
Matti V. Leskela, PhD(Eng.), Academy of Finland
38