streamlining tool design and manufacturing process for balancing …787032/fulltext… · ·...
TRANSCRIPT
Streamlining tool design and manufacturing process for balancing and function test equipment to a propeller hub assembly
Effektivisering av konstruktions- och tillverkningsprocess för balanserings- och
provkörningsfläns till propellernav
Jimmy Vestlund
Faculty of health, science and technology
Degree project for master of science in engineering, mechanical engineering
30 credit points
Supervisor: Anders Wickberg
Examiner: Jens Bergström
Date: Spring semester 2014, 2014-10-02-

“The product development process is the tactical vehicle to convey the business strategy or strategic objectives
of improving customer satisfaction, shorten lead-times, and reduce costs through the application of a product
family.” (Lange & Imsdahl, 2014)

Acknowledgements The overall goal of this master’s thesis is for the author to display the knowledge and capability
required for independent work as a Master of Science in Mechanical Engineering, Karlstad
University. The thesis work was carried out between January and June, 2014, at Rolls-Royce AB’s
Manufacturing Engineering Department in Kristinehamn, Sweden.
First and foremost I would like to thank the Production Manager and the Manufacturing
Engineering Manager at Rolls-Royce AB for the opportunity to perform the master’s thesis at the
company. Thanks are extended to the entire Manufacturing Department for their welcoming and
guidance during the entire 5 month process. Special thanks to Rolf Redman, Triumf Elshani,
Mikael Jansson, and Göran Blixt for their insight and feedback regarding tool and fixture
development, and production planning. In addition thanks are extended to Jan-Åke Eriksson at
Wenmec AB for providing insight in their manufacturing operations and process data of previous
function test flanges.
Last but not least the author extends his thanks to his supervisor Anders Wickberg at Karlstad
University for being a great resource throughout the research and for his support throughout the
thesis.
Abstract
Rolls-Royce AB in Kristinehamn, Sweden, part of Rolls-Royce Marine, is a leading developer and
supplier of water jet and propeller based propulsion equipment. Its low volume production series
and wide product variety offered to its customers along with an increasingly competitive market has
entailed an increased demand on both delivery time and cost reductions. The on-site manufacturing
engineering department is responsible for developing all tools and fixtures, and programming
required to maintain the on-site production, assembling and quality testing. As part of the
departments streamlining efforts this study aimed on evaluating streamlining possibilities related to
the existing tool design used for static balancing and function testing controllable pitch propeller
assemblies before packaging and shipping, along with the related tool development and
manufacturing processes has been conducted.
The process evaluation started from the point when a hub assembly design was finalized until when a
manufactured tool was delivered for use in production. Work focused on locating inefficient activities
and product properties, with respect to tool cost and lead time, followed by setting up an
amendment proposal, implementing it and producing an alternate tool design of which the effects on
tool cost and manufacturing lead time would be evaluated. Post evaluating the current state of the
process and product a set based front loaded product development methodology known as Modular
Function Deployment was chosen to be the applied method. This application resulted in a modular
tool design that avoided the determined most inefficient manufacturing operation combination of
welding and annealing. Modularity increased manufacturing flexibility, enabling more concurrent
manufacturing, to reduce the lead time. The tool design also applied integral properties by
identifying the common components and features between tool sizes. This led to reducing
manufacturing and material costs. Possible lead time reduction for manufacturing was determined to
be 35-45%, 3-4weeks, in comparison with the original tool design due to increased parallel
manufacturing and avoiding inefficient manufacturing methods. The estimated cost reduction for
combined development and manufacturing was determined to be 105K SEK the initial year followed
by 175K SEK the second year assuming the current tool manufacturing rate. The combined effects of
reduced cost and lead time would be beneficial to Rolls-Royce AB by contributing to an increase in
delivery reliability and competitive prices on the market
Keywords
Modular Function Deployment, Lean, Lean Product Development, Product Architecure, Cross
Functional Process Map, Value Stream, Concurrent Engineering, Product Improvement

Table of Content Acknowledgements ................................................................................................................................. 3
Keywords ......................................................................................................................................... 4
Table of Content ...................................................................................................................................... 5
Nomenclature .......................................................................................................................................... 7
1. Introduction ......................................................................................................................................... 1
1.1 Background .................................................................................................................................... 1
1.2 Purpose and Objectives ................................................................................................................. 2
1.3 Delimitations ................................................................................................................................. 2
2. Frame of Reference ............................................................................................................................. 3
2.1 Concurrent Engineering ................................................................................................................. 4
2.1.1 Set Based Concurrent Engineering ......................................................................................... 5
2.2 Lean Product Development ........................................................................................................... 5
2.2.1 Product Definition .................................................................................................................. 7
2.2.2 Product Architecture Development ....................................................................................... 7
2.2.3 Product/Process Design.......................................................................................................... 9
2.3 Modular Function Deployment ..................................................................................................... 9
2.3.1 Step 1: Defining the customer requirements ....................................................................... 10
2.3.2 Step 2: Select the technical solutions ................................................................................... 10
2.3.3 Step 3: Module concept generation ..................................................................................... 11
2.3.4 Step 4: Evaluate concepts .................................................................................................... 12
2.3.5 Step 5: Individual module improvements ............................................................................ 13
2.4 Project Aims ................................................................................................................................. 14
3. Methodology ..................................................................................................................................... 15
3.1 Current State Report: Understanding the current situation ................................................... 15
3.2 Streamlining product design through Module Function Deployment .................................... 16
3.3 Future State Report: Results and effects from process and product amendments ............... 18
4. Result ................................................................................................................................................. 19
4.1 Current State ............................................................................................................................... 19
4.1.1 Current State Value Stream Mapping .................................................................................. 21
4.1.2 Cross Functional Process Map .............................................................................................. 22
4.1.3 Current State Analysis .......................................................................................................... 22
4.2 MFD product assessment ............................................................................................................ 23
4.2.1 Module designs for A1 balancing and function testing tool series ...................................... 26

4.3 Future State Proposal .................................................................................................................. 27
5. Discussion .......................................................................................................................................... 29
5.1 Process evaluation ....................................................................................................................... 29
5.2 Tool design .................................................................................................................................. 30
5.3 Cost and lead time ....................................................................................................................... 31
6. Conclusions ........................................................................................................................................ 33
6. References ......................................................................................................................................... 34
7. Appendixes ........................................................................................................................................ 36
Appendix 1 ......................................................................................................................................... 36
Appendix 2 ......................................................................................................................................... 37
Appendix 3 ......................................................................................................................................... 38
Appendix 4 ......................................................................................................................................... 39
Appendix 5 ......................................................................................................................................... 40
Appendix 6 ......................................................................................................................................... 41
Appendix 7 ......................................................................................................................................... 42
Appendix 8 ......................................................................................................................................... 43
Appendix 9 ......................................................................................................................................... 44
Appendix 10 ....................................................................................................................................... 45
Appendix 11 ....................................................................................................................................... 46
Appendix 12 ....................................................................................................................................... 47
Appendix 13 ....................................................................................................................................... 48
Appendix 14 ....................................................................................................................................... 49
Appendix 15 ....................................................................................................................................... 50
Appendix 16 ....................................................................................................................................... 51
Appendix 17 ....................................................................................................................................... 52
Appendix 18 ....................................................................................................................................... 53
Appendix 19 ....................................................................................................................................... 54
Appendix 20 ....................................................................................................................................... 55
Appendix 21 ....................................................................................................................................... 56
Appendix 22 ....................................................................................................................................... 57
Appendix 23 ....................................................................................................................................... 58
Appendix 24 ....................................................................................................................................... 59
Appendix 25 ....................................................................................................................................... 60
Nomenclature
ABC Activity Based Costing
CE Concurrent Engineering
CFPM Cross Functional Process Map
DFA Design For Assembly
DFM Design For Manufacturing
DFMA Design For Manufacturing and Assembly
HoQ House of Quality
LPD Lean Product Development
MFD Modular Function Deployment
MIM Module Indication Matrix
QFD Quality Function Deployment
SBCE Set Based Concurrent Engineering
VSM Value Stream Map

1
1. Introduction This chapter introduces the master’s thesis by providing a brief background of the Company’s
business and the motivation behind why this project is carried out. This will be followed by the
purpose, objectives and the research questions of the master’s thesis accompanied by the
delimitations.
1.1 Background Rolls-Royce is a global company focused on providing its customers with high quality and
technologically advanced power solutions in a wide range of markets comprised of civil- and defense
aerospace, energy and marine. Rolls-Royce Marine is a leading developer and supplier of propulsion
equipment. The site in Kristinehamn, Sweden, is considered a center of excellence for both designing
and manufacturing of propulsion systems. The site offers customers customized propulsion systems
used in applications ranging between offshore, naval as well as merchant sectors. These systems
include water jets, pods as well as fixed- and controllable pitch propellers.
Lean thinking throughout the organization entails there to be no prebuilt stocked items but rather
the customized system design and manufacturing starts upon
the finalizing of purchasing orders from the customers. The
customizability of propulsion systems offered to Rolls-Royce
clients results in a great variety in manufactured products and
components. The size diversification of the sites product
catalog along with the usually small series production entails
large investment costs for tools and fixtures as well as ever-
growing needs for inventory space for the increasing amount of
unique tools obtained over time. One varying parameter for
the controllable pitch propellers that are designed and
manufactured on site is the hub size. During the manufacturing
process of these hubs one of the final steps before packaging
and shipping includes the static balancing and the hydraulic
function testing of the full hub assembly. This function test
involves using hydraulic pressure to maneuver the piston up
and down, see indicators in the assembly in Figure 1, which in
turn rotates the connected crank pin rings and propeller
blades. For these tests to be possible a customized dummy
flange, an example of which is shown in Figure 1, is required to
be fixed to the hub, thereby enabling lift, rotation as well as
pressurization of the hub assembly.
Current tool manufacturing of the balancing and function test
flanges is estimated to consist of five unique tool setups each
year, each of which has a lead time of 16weeks from the start
of design to final assembly. Hub diameters, based on the
current product catalog, vary from 60cm to 132cm with a
Figure 1: Schematic representation of how the balance and function test flange is fitted and used. The two hydraulic systems used to change propeller blade pitch are colormarked.

2
manufacturing cost starting at 107K SEK.
A new generation of low cost controllable pitch propeller hubs, known as A1, along with its
associated tools required for manufacturing has been introduced to the Manufacturing Engineering
department. As such they’re scrutinizing the current static balancing and function testing tool design
along with the tool development and manufacturing process. The purpose being to identify further
streamlining possibilities in order to reduce cost and overall lead time for customer orders as well as
reducing storage needs for manufactured tools. This is desired in order to meet future production
needs and remain competitive in today’s market.
1.2 Purpose and Objectives The purpose of the study is to evaluate the current tool design and produce a proposal for
streamlining the tool design for the function test equipment for the A1-hub assembly. It will also
evaluate and propose improvements for the general tool development and manufacturing process of
tools used for static balancing and hydraulic function testing of hub assemblies. This will be done by
an initial analysis of the current state processes, whereby identifying root causes for any wasteful
processes during development and manufacturing. Any process amendments shall be derived from
the gathered data. Thereafter the proposed process shall be implemented on the balancing and
function test flange tool for the A1 hub assembly. Finally the resulting tool design and process will be
evaluated against the current design and process taking into account to overall tool cost, lead time,
as well as storage needs for the manufactured tools. Results from both the product and process
evaluation shall be summarized in a future state proposal showing any proposed changes and what
the anticipated effects are. The proposal shall strive towards reduced cost, lead time, and inventory
requirements for tools without having a negative effect on production safety and delivery reliability.
Relevant questions to be answered within the study:
Current state analysis of tool development and manufacturing of A1 hub balancing and
function test flanges
o Does the process currently contain any unnecessary, time consuming, costly, or in
other ways wasteful activities?
o Does the tool design currently contain any unnecessary, time consuming, costly, or in
other ways wasteful activities?
Product and process amendments
o Can any process amendments be implemented to reduce overall cost and lead time?
o How can tool design amendments on the A1 hub assembly balancing and function
test flanges reduce tool cost, lead time, and tool based storage needs?
Design features, manufacturing method, and material selection shall be
taken into account.
1.3 Delimitations The scope of the paper focuses on tool design, tool development process and manufacturing process
of the described test equipment. The parts of the organizational process that’s covered within the
study’s evaluation stretches from the point where a hub design is developed, when it reaches the
Manufacturing Engineering department whom starts the tool development process on to when the
tool is manufactured, assembled and delivered for use in the production facilities. Within this
specified part of the process the paper will be comprised of evaluating the information

3
transfer/management, the self-made manufacturing as well as the outsourced manufacturing
process. The expected outcome shall be a new tool development and manufacturing process and a
proposal for new tool design for the balance and function test flanges for the A1 hub assembly. This
proposal shall contain a tool cost comparison and a comparison of lead time for manufacturing as
well as storage needs.
2. Frame of Reference The frame of reference starts by providing a summary of the lean thinking philosophy and the basic
principles of it. Thereafter results from best practice as well as research related to concurrent
engineering (CE) and set based concurrent engineering (SBCE) and their relation to lean product
development (LPD) are summarized. The different phases of LPD are thereafter accounted for before
a detailed process description of implementing the product development method known as Modular
Function Deployment (MFD) is provided.
Despite more than 20 years of research focused on developing principles and practices aimed at
increasing efficiency and effectiveness of product development there is still a lot of unanswered
questions on the subject. What has been shown, drawing from years of best practice, is that a vital
aspect for increasing engineering efficiency is concurrent engineering. A currently leading approach
for product development, which incorporates this, is called Lean Product Development which has its
initial inspiration from the works by Womack and Jones et al The Machine that Changed the World
(Womack, et al., 1991), and Lean Thinking: Banish Waste and Create Wealth in Your Organization
(Womack & Jones, 1996). Their studies of the Toyota Production System, its values and principles
initiated a revolution in manufacturing. Womack and Jones defined lean thinking from a
manufacturing point of view by the five core principles; value, value stream, flow, pull, and
perfection (Womack & Jones, 1996).
The first principle of lean, Value, is defined as the ability to fulfill the customer needs at the right
time, in each case defined by him, for an appropriate cost. The second principle of lean, Value
Stream, is defined as the set of required activities from the point of order and product design to
delivering the end product to the customer. Depending on the type of work this includes everything
between concept and launch, order to delivery, raw material to delivering a product into the hands
of the customer. The authors continue to describe every value stream as consisting of three types of
activities. The first defined type of activity is value adding, the second type of activity is non-value
adding but is unavoidable with the company’s current assets, and the final type of activity doesn’t
add any value and can be immediately avoided. Womack describes flow, the third principle of lean,
as the “progressive achievement of tasks along the value stream so that a product proceeds from
design to launch, order to delivery and raw material into the hands of the customer with no
stoppages, scrap or backflows” (Womack & Jones, 1996). One may liken the principle by the
preference of water traveling down a natural river rather than up a sluiced channel on the basis that
it induces less stress on surroundings (i.e. machinery or personnel), the downstream river provides a
comparably quicker way of travel (the flow of products or the “value”) and the state of which it
arrives at the end destination is easier to manage (easier and quicker identification of deviations
from the normal quality). The fourth lean principle defined is Pull, which the author describes as a
“system of cascading production and delivery instructions from downstream to upstream in which
nothing is produced by the upstream supplier until the downstream customer signals a need”
4
(Womack & Jones, 1996). The fifth and final principle is Perfection which is defined as the “complete
elimination of waste so that all activities along a value stream creates value” (Womack & Jones,
1996). One attempt to further reduce the explanation of lean concept down to its basics was done by
Myles Walton who in one of his papers states:
Lean is the search for perfection through the elimination of waste and insertion of practices that
contribute to reduction in cost and schedule while improving performance of products.” (Walton,
1999)
Following the mentioned manufacturing revolution a wide range of research took off with the aim of
implementing the same principles in areas other than manufacturing. While the basic concept of lean
is easy to grasp it has proven harder and easily overwhelming from a research and implementation
point of view to adapt and implement these onto other areas than manufacturing. As such, to this
day, the philosophy is often well implemented on the factory floor whilst the level of education and
implementation of it in other areas within the companies’ organization are often very low. One of
these areas which have been of interest for continued research and implementation is LPD.
2.1 Concurrent Engineering The term concurrent engineering is in itself a relatively new term that refers to the philosophy of
using cross-functional cooperation to create better products both quicker and cheaper. In one of his
papers R.P. Smith (Smith, 1997) describes concurrent engineering using the four principles:
Manufacturing and functional design constraints need to be considered simultaneously.
Combining people with different functional backgrounds into design teams is a useful way to
combine the different knowledge bases.
Engineering designers must bear in mind customer preferences during the design process
Time to market is an important determinant of eventual success in the market.
The individual principles existed in the industry for many years before the coining of the unifying
term concurrent engineering. As such concurrent engineering is considered a summary of years of
best practice in product development. As previously stated it is not considered a product of Toyotas
lean philosophy however the concept is embraced by the flow principle within LPD, as one important
aspect when reducing process door-to-door lead times. Cross-functional concurrent engineering
teams contribute to creating a flow throughout the design process and the product development
operations much like a single-piece flow in a manufacturing system, in comparison to having large
batches. In this engineering process the new product design flows continuously from concept to
production without stops, or backflow, when the project travels between separate departments.
A desire for this kind of product development process is commonly contradicted by the function
oriented organizations which companies often tend to reorganize into as they grow in size and get a
wider range of stable products. This often occurs naturally as a small company, which is usually based
around a single core product, is often organized as one united collaborative multifunctional team. As
the same company grows it more often gets more apparent separations with respect to engineering
disciplines or functions, and is eventually split into separate functional teams. These teams tend to
become increasingly isolated from each other and sub-optimize within itself. This can lead to
miscommunication and lowered productivity which associates with an increased amount of required
backflow and reworking as projects seesaw between departments. Enabling multiple engineering

5
specialties to work within the same team would therefore entail that a product design wouldn’t need
to travel between multiple departments in the same fashion.
2.1.1 Set Based Concurrent Engineering
In his work Sobek defines set based concurrent engineering (SBCE) as engineers and product
designers “reasoning, developing, and communicating about sets of solutions in parallel and
relatively independently” (Sobek, 1997). SBCE is the result of the continued development and
research of concurrent engineering, inspired by Toyota’s lean think regarding product development.
It has and is the subject for continued research. The approach involves starting a development
process by considering a broader range of designs and delaying certain decisions longer. The purpose
of this is to gradually narrow design options, while working with multiple parts of the product in
parallel, and thereby reducing the chance of
picking and committing to a suboptimal
design early on. This has been empirically
proven that, while the approach prolongs the
initial steps of defining a solution, it results in
an overall quicker convergence of the
different partial design steps and on to
production.
In Figure 2 the illustration by Walton,
illustrates the concept of this approach. It
symbolizes a team consisting of three distinct
specialties that initially brainstorm a wide
range of design concepts. Thereafter they
evaluate the individual concepts with regards
to how well they fulfill their respective
specialties demands. As the process
progresses they gradually combine designs so they fulfill every given product demand, and gradually
excludes faulty designs until there’s only one left.
Throughout a LPD process the use of SBCE is favorable during both the initial product definition
phase as well as the following product architectural phase. Developing the larger set of solution
options allows for people with differing expertise to more efficiently consider design problems from
their perspective. By then combining and gradually excluding designs, until only one remains, a more
beneficial design for the application is usually obtained.
2.2 Lean Product Development Lean product development (LPD) is a leading approach of product development. When applying the
lean principles to product development several different phrasings have appeared to define the
implications on the process. There is to this date no one unifying definition within the scientific
community on what the LPD process entails. Studies of the Toyota Product Development System
have however summarized the company techniques down to 13 principles (Morgan & Liker, 2006):
1. Establish customer-defined value to separate value-added from waste.
Figure 2: Illutration of the process of the set-based concurrent engineering approach. (Walton, 1999)

6
2. Front-load the product development process to explore thoroughly alternative solutions
while there is maximum design space.
3. Create an even product development process flow.
4. Utilize rigorous standardization to reduce variation, and create flexibility and predictable
outcomes.
5. Develop a chief engineer system to integrate development from start to finish.
6. Organize to balance functional expertise and cross-functional integration.
7. Develop towering competence in all engineers.
8. Fully integrate suppliers into the product development system.
9. Build in learning and continuous improvement.
10. Build a culture to support excellence and relentless improvement.
11. Adapt technologies to fit employees and process.
12. Align the organization through simple visual communication.
13. Use powerful tools for standardization and organizational learning.
Another example of attempt to define LPD is when researchers, for the purpose of a review over
current state LPD, formulate the broad definition:
Lean Product Development is viewed as the cross-functional design practices (techniques and tools)
that are governed by the philosophical underpinnings of lean thinking – value, value stream, flow,
pull, and perfection – and can be used (but are not limited) to maximize value and eliminate waste in
Product Development (Martinez León & Farris, 2011).
Due to LPD being a relatively young approach in comparison to traditional product development.
Work has been done in order to find common ground between the two in order to correlate older
and newer research, thereby providing a larger base on which to base continued studies on. This
correlation has resulted with the categorizing of seven knowledge domains (Martinez León & Farris,
2011). These are Performance-based, Decision-based, Process-modelling, Strategy,
Supplier/Partnership, Knowledge networks, and Lean manufacturing-based.
The Performance-based research focuses on developing methods for measuring effectiveness and
the efficiency of lean product development practices. Decision-based research focuses on identifying
and categorizing the major decisions made during a product development and how decision-making
is ideally made in a lean product development process. Process-modelling related research focuses
on the modelling and studying of the process architectures. The purpose of this specific type of
studies is to improve overall process performance by identifying and maximizing values and
information flow, while minimizing waste. Strategy-based research relates to project management,
product platform development and multi-project management. Studies on Supplier/Partnership
focus on companies’ abilities to effectively coordinate design and manufacturing activities involving
their suppliers. The reason for this specific domain being of interest is the general assumption that a
company’s ability to deliver new products with better quality faster strongly correlates with the
organizations ability to coordinate both design and manufacturing activities with its suppliers.
Therefore the primary research question within this domain is how a supplier relationship is best
managed within different kinds of organizations. Works comprised within this area of interest include
the master’s thesis Managing the Defense Industry Transition to Performance-Based Practices and
Supply Chain Integration (Campbell, 1998), as well as the review article Supply Chain Integration

7
Framework Using Literature Review (Alfalla-Luque, et al., 2013). Research related to Knowledge-
based networks covers how knowledge is created, transferred and updated throughout the product
development system. The final domain, the Lean manufacturing-based, is focused on how the lean
manufacturing principles translate/adapts, and is implemented in the product development setting.
This application of lean principles on the product development process can be summarized within
three identified phases. The first one of these is the Product Definition where customer needs and
requirements are identified. The second phase is the Product Architecture Development where set
based approaches of integrality and modularity is included. The third and final phase is the
Product/Process Design phase which includes the detailed designs as well as prototype building and
testing. (Walton, 1999)
2.2.1 Product Definition
The Product Definition, where the products needs and requirements are generated, is one of the
most influential steps with regards to success for a project. As they require the most rework and
generate the most waste problems that arise from a faulty requirement generation is the most
expensive to fix if not caught early. A successful and effective requirement generation is often
attributed to three main factors (Walton, 1999).
The first main factor for successful requirement generation is having competent people. For the best
requirement generation trained and experienced personnel are needed. There’s a need to
understand the customer, the end goal, as well as their own process. This phase is can be the most
social phase cause of the need to gather and document inputs from people with varying perspectives
while at the same time both having to securing the customers’ needs and convey information to
them.
The second main factor for a successful requirement generation is having a well-structured process.
A well-structured process does not in itself provide any direct results but acts more like a road map
which aids with identifying requirements. Therefore having a standardized guideline for this process
makes it more efficient and also acts as a quality assurance that different projects are measured
equally. Note that while the process may be tailored and differ slightly between organizations the
core structure is usually the same.
The third main factor for the requirements process is the managements support. Whilst requirement
generation is a time consuming activity it doesn’t result in as physical results as that of design or
manufacturing. Consequently it’s not uncommon for it to gain less management support. However in
previous studies, based on industrial experience, the management support is suggested to be
comprised of two parts. First part, as mentioned, is allowing the process the time needed to obtain
the requirements and to validate what is feasible with respect to technology, cost, and time. The
other key aspect for management support is getting the understanding how late changes to
requirements influence the process, thereby knowing when they are to be accepted and when
management simply needs to say no.
2.2.2 Product Architecture Development
During the Product Architecture Development phase the products functions are assigned to different
elements and the interactions between these are defined. Architecture in products is defined by
being either integral or modular. In integral architectures all components are customized and
optimized for the product. A function may be spread over multiple elements and multiple functions

8
can be shared by the same components. Products with integral architectures usually provide better
overall performance, contrary to products with modular architectures, but on the expense of
sometimes more desirable strategic properties such as upgradability, product variety, and process
flexibility. Modular architectures are characterized by using the same kind of components in all of the
products sub-systems and that the modules have common interfaces to ease replacement
(Cunningham, 1998). In this section the basics of modularity and modular product architecture will
be explained.
Modularity combines components into blocks which each satisfy different needs of the product. Any
components present in all variants of the product are defined as essential blocks. It’s this
commonality across product variants that represent the benefits of modularity. As the initial
development time and costs and can be split upon a greater number of products the increased
volume contributes to an overall more efficient process. The tradeoff for the economic benefits
through standardization is the reduced ability to customize the product for individual customer
needs. This reduced customizability may sound contradictory when considering the aim of having
easy replaceable modules. As a product is comprised of an increasing amount of modules, and
thereby customizability, its architecture increases to resemble a handcrafted item. This increase in
customizability entails that the economic benefit of higher production volumes is lost. Thus the main
challenge with modularity is defining the desired amount of standard components that will satisfy
the greatest amount of customers.
The six defined categories (Walton, 1999) of modularity
are illustrated, illustrated in Figure 3. Component
sharing, or commonality, involves using the same
components on multiple products. Component
swapping contributes to the products variety by pairing
different components with the core product. An
example of this would be car stereos. The Fabricate-to-
fit category is utilized when a component is variable. As
seen in the figure the fuselage of a plane is a prime
example of this type of modularity. Mix modularity is
categorized as the combining of components, for
example paints, to create a new one. Bus modularity is
defined by a common structure, a standardized interface, where many different components can be
attached. Examples of these can be either computer racks on which a varying amount of components
can be attached onto, or once again the fuselage of a plane on which different kinds of subsystems
may be attached. The final type of modularity is sectional which is defined as when a collection of
components may be arranged in any way as long as they are connected by a standardized interface.
An apparent and illustrative example of category of modularity is Lego building blocks.
Benefits of having an established modular designed product include the ability to quickly replace
modules containing components with rapidly changing technology thereby making it easier to keep
pace with their respective development. Modular designs with well-defined sub-systems and
interfaces also have the benefit of being able to borrow components, ideas and experience from
previous designs or other product lines. That way it’s easier to utilize and learn from previous
experience. By modularizing a problem into smaller parts with specified functions it may also become
Figure 3: Illustration of the six categories of modularity. (Walton, 1999)

9
more controllable for designers, thereby making it easier to solve. Other benefits of modularity are
that designers can work on separate modules in parallel, entailing a reduced lead time for product
development, and that that the designer can more easily focus on the specified function for his
module, thereby often getting a more effective design solution. Lastly modular design of products
may provide an organization with expertise and gained specialization in specific product areas
(Walton, 1999).
When considering modularizing a design there are also disadvantages that need to be taken into
account. Initial design steps of the product development will be more difficult if compared to a
traditional stand-alone product system. The core difficulty is determining how to separate the system
into modules and how to make them interconnect. Only after these questions have been answered
can the remaining steps throughout the product development process be simplified. Another
disadvantage, as mentioned in the previous paragraph, is that a modular design generally sacrifices
some of the performance optimization. When modularizing products potentially shared functions can
be overlooked and hence some methods or solutions may be overlooked. Modularity also usually
makes a product more clunky then integral designs due to an increases size and/or weight.
Additionally if splitting a product into modules for separate teams to develop, and communication
between groups is lacking, there may either occur redundancy in their work or the modules
themselves may be difficult to optimize in order to make them work with each other (Walton, 1999).
2.2.3 Product/Process Design
The addition of lean thinking during the final development phase, when the detailed designs are
produced, focuses mainly on increasing cost awareness in designs, assembly oriented designs, and
data standardizing (Walton, 1999). Taking these kinds of product aspects into account, including but
not exclusive to Designing For Manufacturing (DFM) as well as Designing For Assembly (DFA), and
understanding how they affect the end cost is very important since designing “right first time” is the
easiest way of obtaining low-cost products compared to having to redesign it later on.
2.3 Modular Function Deployment Modular Function Deployment (MFD) is a product architecture method focused on the practical
implementation of a modular product design. It is utilized by companies with the aim of being able to
offer an increased product variety while also improving customer satisfaction, shorten lead-times,
and reduce costs (Simpson, et al., 2006). The MFD method is the result of researchers’ effort to
improve and an attempt to streamline and simplify the QFD (Quality Function Deployment) process.
The coining of the method was first done in the doctorate thesis “Modular Function Deployment – A
Method for Product Modularisation” (Erixon, 1998). The MFD concept follows the procedure set by
its predecessor with the addition of a modularity concept. MFD is comprised of a five step process.
These sequentially performed steps, along with available tools and techniques are (Value Driven
Design Ltd, 2013):
Step 1 Defining the customer requirements
QFD Analysis
Step 2 Select the technical solutions
Pugh Matrix
Step 3 Module concept generation

10
Module Indication Matrix (MIM)
Step 4 Evaluate concepts
Design For Manufacture and Assembly (DFMA), Activity Based Costing
(ABC) & Design to Target Cost (DTC)
Step 5 Individual module improvements
Rank Order Cluster (ROC)
Depending on the applied situation, and which steps are deemed required, the methodology can
either be performed as a whole or using only selected steps. Gunnar Erixon, founder of the method,
emphasizes that the design of products and processes is an iterative process and as such both the
starting points and the amount of iterations may vary before the desired results are satisfied. It is
also emphasized that the method has proven most successful when executed by a cross functional
project team (Ericsson & Erixon, 1999).
2.3.1 Step 1: Defining the customer requirements
The initial “customer requirement” step of the QFD analysis serves to clarify and/or verify the current
as well as the desired future product functionality. This step can be summarized as the translation of
customer demands, needs and requests into technical design and manufacturing specifications.
The first action of this process is communicating and summarizing the customers own needs. This can
be done in varying ways, ranging from an interview with a company representative to conducting a
marketing survey directed to the general population, depending on who the targeted customers are.
After summarizing customer needs the next step, if deemed required, is to analyze and benchmark
the competition with respect to if or how they have fulfilled these customer needs. As this is finished
all customer demands are translated into technical specifications and assigned target values that are
to be met. A commonly used tool for this which, amongst others, visualizes how the technical
specifications relate to each other and the set of demands is the House of Quality (HoQ). An example
of how the HoQ can be seen in Appendix 1. A simplified version of this QFD method, illustrated in
Appendix 2, has also proven to work well for this task. Note that unlike the original QFD matrix the
simplified one is missing the correlation matrix (the roof), the fields for benchmarking, and has
“Modularity” directly incorporated in the Design Requirements list.
2.3.2 Step 2: Select the technical solutions
This step is consists of two main parts, identifying the product functions and selecting a technical
solution for each function. Firstly to be able to continue on with the product design from the
previous step it is needed to evaluate the obtained specification list from a more technical point of
view. This is done by doing a functional decomposition; analyzing the specification list from a
functional view, breaking down the product into individual functions and sub-functions, and
determining their corresponding technical solution, or “function carrier”. The purpose of this is
getting a mutual understanding within a project group of how each part contributes to the whole.
This is necessary since identifying functional independence is required when wanting to create an
optimal modular design. When identifying functional independences these can be isolated, treated
separately from each other, and a more robust modular design can be obtained with minimal
interactions between modules.
11
Technical
solutions
❾
❾ ❸
❾ ❾
① ❸
❾
❾
❸ ① ❸
❾
Sum
Module
Drivers
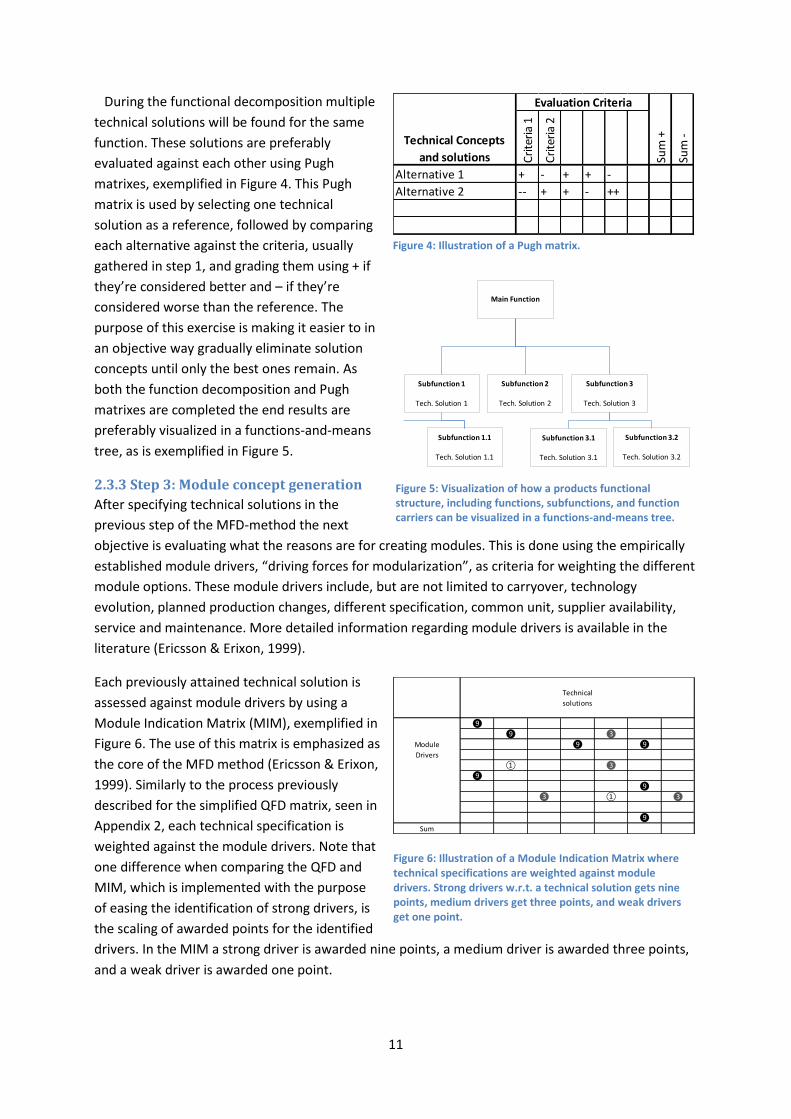
During the functional decomposition multiple
technical solutions will be found for the same
function. These solutions are preferably
evaluated against each other using Pugh
matrixes, exemplified in Figure 4. This Pugh
matrix is used by selecting one technical
solution as a reference, followed by comparing
each alternative against the criteria, usually
gathered in step 1, and grading them using + if
they’re considered better and – if they’re
considered worse than the reference. The
purpose of this exercise is making it easier to in
an objective way gradually eliminate solution
concepts until only the best ones remain. As
both the function decomposition and Pugh
matrixes are completed the end results are
preferably visualized in a functions-and-means
tree, as is exemplified in Figure 5.
2.3.3 Step 3: Module concept generation
After specifying technical solutions in the
previous step of the MFD-method the next
objective is evaluating what the reasons are for creating modules. This is done using the empirically
established module drivers, “driving forces for modularization”, as criteria for weighting the different
module options. These module drivers include, but are not limited to carryover, technology
evolution, planned production changes, different specification, common unit, supplier availability,
service and maintenance. More detailed information regarding module drivers is available in the
literature (Ericsson & Erixon, 1999).
Each previously attained technical solution is
assessed against module drivers by using a
Module Indication Matrix (MIM), exemplified in
Figure 6. The use of this matrix is emphasized as
the core of the MFD method (Ericsson & Erixon,
1999). Similarly to the process previously
described for the simplified QFD matrix, seen in
Appendix 2, each technical specification is
weighted against the module drivers. Note that
one difference when comparing the QFD and
MIM, which is implemented with the purpose
of easing the identification of strong drivers, is
the scaling of awarded points for the identified
drivers. In the MIM a strong driver is awarded nine points, a medium driver is awarded three points,
and a weak driver is awarded one point.
Figure 5: Visualization of how a products functional structure, including functions, subfunctions, and function carriers can be visualized in a functions-and-means tree.
Main Function
Subfunction 2
Tech. Solution 2
Subfunction 3
Tech. Solution 3
Subfunction 1
Tech. Solution 1
Subfunction 3.1
Tech. Solution 3.1
Subfunction 1.1
Tech. Solution 1.1
Subfunction 3.2
Tech. Solution 3.2
Figure 6: Illustration of a Module Indication Matrix where technical specifications are weighted against module drivers. Strong drivers w.r.t. a technical solution gets nine points, medium drivers get three points, and weak drivers get one point.
Cri
teri
a 1
Cri
teri
a 2
Sum
+
Sum
-
Alternative 1 + - + + -
Alternative 2 -- + + - ++
Evaluation Criteria
Technical Concepts
and solutions
Figure 4: Illustration of a Pugh matrix.

12
To know which function carriers would be the most beneficial module candidates you start with
picking out the highest Module Driver-scoring technical solutions and continue with looking for any
patterns within the matrix. When analyzing the MIM a technical solution that has few and/or low
weighted module drivers indicate that it could be easy either to encapsulate or to group with other
solutions. Provided that there is a matching module driver pattern or at the least no contradictions,
such as putting a carry-over together with a planned product change, integration of these functions
should be considered. A technical solution that gets highly weighted, has many and/or unique
module drivers does on the other hand indicate that it is likely to form a module by itself, due to its
complicated requirement pattern, or that it at the least has be a basis for a module.
When looking to identify modules in a product the MFD literature proposes a rule of thumb stating
that in order to reach the minimum lead time “the number of modules equals the square root of the
number of assembly operations in the average product” (Ericsson & Erixon, 1999), see Equation 1.
Note that this is based on desired balance between time required for assembling each separate
module and the time required to assemble the modules to each other in a main flow of an ongoing
production line. It assumes that, based on average “best practice” experience, that an assembly
operation for parts takes about 10 seconds and that the average final assembly time between
modules takes between 10 and 50 seconds.
Equation 1: The general rule of thumb used for finding the optimal amount of modularisation in an assembly line.
𝑃𝑟𝑜𝑑𝑢𝑐𝑡𝑚𝑜𝑑𝑢𝑙𝑒𝑠 ≈ √𝑃𝑟𝑜𝑑𝑢𝑐𝑡𝐴𝑠𝑠𝑒𝑚𝑏𝑙𝑦 𝑂𝑝𝑒𝑟𝑎𝑡𝑖𝑜𝑛𝑠
As the identification of what function carriers are best kept by themselves and which ones are
preferably integrated into a single module is finished a set of concepts containing rough module
designs, dimensioning and forms are developed through brainstorming. One, or a few, of these are
then selected to be kept for continued evaluation.
2.3.4 Step 4: Evaluate concepts
As a modular concept has been generated it is
evaluated if or how much better it is compared
to either each other or an already existing
design. Keeping in mind that the assembly
order and the interfaces between modules are
of vital importance determining how fast and
simple the product is to assemble during
production. A way of evaluating these
interface relations is by using an Interface
Matrix (Ericsson & Erixon, 1999), exemplified
in Figure 7. This matrix works in a similar
fashion as the correlation matrix (the roof) of a
traditional House of Quality. In the interface
matrix interfacial connections are split into
three categories. If an interfacial connection is
fixed, only transmitting forces, it is marked
with a G for “geometry”. When an interface
Module 3
Module 4
Module 1
Module 3
Module 2
Module 5
Base unit assembly
"Hamburger"assembly
Figure 7: Exemplification of the Interface Matrix used to get an overview of module interface relations. Modules are inserted in assembly order and interactions between modules are marked as G for geometry, E for energy transmitting, and M for media transmitting.

13
connection is moving, also enabling the transmittance of rotating or alternating energy, it is marked
with an E for energy. Lastly an interface marked is marked with an M for media, when it transmits
some kind of media such as fluids or electricity.
In order for a product to obtain a quick and easy assembly procedure the interface relations should
preferably follow either the “hamburger” assembly or the base unit assembly line seen in Figure 7.
When modular relationships divert from these sidelines it is worth evaluating further if they can be
redesigned in order to ease the assembly process.
Other than module interface relations there are several aspects that should to be considered when
evaluating a design. Estimating the cost for product is one of these aspects. While doing an activity-
based cost (ABC) analysis it’s worth noting however that it may not always value the benefits and
effects that a modular product entails unless the entire product assortment is taken into account
during the assessment. Similarly more consideration to if and how well the benefits of modularity are
represented when applying common tools and methods such as Design for Manufacturing and
Assembly (DFMA). When doing these analyses beneficial representations may vary depending on
whether they’re done on a single component, a module, a product, or on assortment level. Despite a
lack of standardized methods and tools for fairly comparing different modular benefits and deciding
on a final module concept empirics has shown that open discussions about specific design aspects
within the cross functional project team are beneficial to have. Recommended topics based on the
empirics are (Hjalmarsson & Jonsson, 2010) (Erixon, et al., 1994):
Recommended number of modules in a product is the square root of the expected amount of
components in the end product.
Create modules that enable a wide product assortment.
Design module interfaces for quick assembly. Target value, based on “best practice” <10seconds
per interface.
Develop modules that are individually testable.
Minimize cross-modular relations by avoiding the same function being spread onto multiple
modules.
Maximize the proportion of carry-over modules.
What modules could be bought from available manufacturing suppliers?
Avoid multiple materials within the same module, due to environmental aspects (recycling).
To help making a final module design choice assigning appropriate design rules or measurable
metrics may aid to rationalize and evaluate the effect of modularized concepts.
2.3.5 Step 5: Individual module improvements
After the evaluation of the module concept is finalized detailed specifications are established for
each individual module. These specifications can include but are not limited to technical information,
possible material requirements, module functions, descriptions of variants, planned development,
and cost targets. As the information stated in the module specifications will come to represent the
backbone of the continued product platform the specifications need to be both comprehensive and
unambiguous. Establishing this enables continued independent design and development of the
modules.

14
Since the MFD method has its focus on a product-module-level its process description doesn’t delve
further into detail regarding the design development and improvement process other than
commenting on the still significant work of “traditional” design improvements on component level in
order to secure the resulting final product. At this point the previously established module indication
matrix serves as a pointer of what aspects might be especially important to take into consideration
for each module. An example of this could be a module with a high Technology Evolution driver
which could be preferable to design with a layout that would require minimal design alterations in
the future; or a module with a high Service and Maintenance driver being designed with additional
focus on easing disassembly.
2.4 Project Aims Based on the identified aspects within the development and manufacturing process of the A1 hub
assembly function test flanges Module Function Deployment shall be utilized for implementing the
proposed process and product development amendments. The effects of the amendments shall be
accounted for by producing a comparison between the current development process and product
design with the proposed process and product design, based upon the projects stated goal
parameters. This comparison shall be comprised of activity based process and lead time
requirements, personnel costs, and product material costs. To ensure fair representation of the
amendment effects the comparison shall be produced for an initial tool, a subsequent tool, as well as
a full series of tools.

15
3. Methodology The study initiated with compiling existing product demands, characteristics and requirements with
the aid of the on-site manufacturing engineers. Thereafter the following work was comprised of
constructing and analyzing the current state value stream map and cross functional process map. The
analysis was to identify any unnecessary steps or stops that would prolong the combined process as
well as identifying costly or in other ways wasteful activities within the process. Results from the
analysis were used to deduce what amended or alternate product architecture and development
process was to be applied. Thereafter the proposed method for product development was applied on
the balance and function test equipment for the A1-hub series. After developing the new tool design
a comparison between the proposed and the existing product and process summarizing cost and lead
times was produced.
3.1 Current State Report: Understanding the current situation
The current state analysis was comprised of a current state Value Stream Map/Analysis (VSM) and a
Cross Functional Process Map (CFPM). When combined the two maps visualizes all activities and
people involved throughout the tool development and manufacturing processes providing a more
easily comprehensible understanding of the work process, and enabling identification of any costly or
in other ways wasteful activities. The VSM was used to visualize the material flow throughout the
process, outline and identify the critical path through the material value stream, and identifying the
most wasteful manufacturing operations in the sense of value adding time set in relation to the
process time it entails. Individual activities within the value stream maps critical path were therefore
individually analyzed in order to review their effect on the overall process cost and induced lead
time. The CFPM, also known as a Swimlane-diagram, was made in order to clarify informational
dependencies throughout the process.
Initial study activity was comprised of interviews and a tour through the manufacturing facilities
alongside the manufacturing engineering manager, manufacturing engineers, and production
manager. Additional input gathering from the operators was done to ensure that a comprehensive
understanding of the tool and how it was used during production.
The data gathering for the CFPM was done by conducting individual interviews with all the roles
involved throughout the tool development and manufacturing process. These interviews includes the
Production Planners who receives the initial work order and plans the in-house manufacturing, the
Manufacturing Engineers who were responsible for tool design and drawings, the Buyer at the
purchasing department who handles supplier contacts, and the Quotation Engineer at a supplier who
receives and plans the received manufacturing orders. Following these initial interviews and the
compiling of all gathered information into the CFPM follow-up discussions involving all previously
involved parties as well as the Manufacturing Engineering Manager was done. These discussions
served the dual purpose of both verifying the validity of the CFPM as well as giving the possibility for
all involved parties to reflect and give feedback on any possible process amendments.
The VSM interviews and data gathering as well as follow-up discussions were conducted
simultaneously as the CFPM. Compiling available process data from previously made equivalent tools
as well as the verification of the compiled value stream map was done alongside the Production
Planner and the suppliers Quotation Engineer. Final discussions regarding the VSM were thereafter
conducted alongside the Production Planner, the Manufacturing Engineers and the Manufacturing

16
Engineering Manager. These final discussions focused on comparing and reflecting on the
possibilities and limitations regarding manufacturing processes, including both the self-made and
outsourced components. This analysis and the conclusions derived from it took into account
component sizes effects on manufacturability, chosen manufacturing methods, and their relative
wastefulness with regards to value adding time in relation to entailed added lead time the addition
of the individual manufacturing operation implies.
After finalizing the VSM and the CFPM the identified issues and possible amendments regarding the
current tool development process and product design was used for deciding the desired product
architecture and the suitable product development process perceived to be the most time and cost
efficient for the application. This choice was derived from surveying and setting up a framework
based on prior research regarding product architectures and product development methods and
practical approaches. The choice of what product development method was to be adapted and
implemented was taken based on the gathered product demands, starting with deciding the
appropriate product architecture. Thereafter the decision of what product development method was
to be utilized was done focusing on light weight modelling and efficient tools, while still being able to
take into accounts the determined product properties and layout. The focus on using lightweight and
efficient methods and tools was considered important due to it being a major aspect on whether
new methods are to be embraced and possibly replicated within existing organizations that are
already occupied with everyday work.
Implementing the chosen, 5-step method, known as Module Function Deployment (MFD), on the A1-
series function test equipment was done on the basis of starting from the existing design with the
aim for the continued development to reduce the existing cost, lead time and tool based storage
needs.
3.2 Streamlining product design through Module Function Deployment
The initial step of product development was setting up a What-How-matrix, of which a visual
representation is shown in Appendix 2. As the project assumed an existing design this meant setting
up what product aspects were to be improved and setting them in relation with what product
properties would be considered within the study in order to fulfill these needs. The product
properties listing how the improvement needs were to be fulfilled was gradually supplemented until
the relations showed that no needs were being neglected. Simultaneously a summary of the existing
product specifications was set up for the latter stages of development. Before continuing on to the
latter stages of the MFD method the table of technical requirements and the What-How-matrix was
discussed and approved by manufacturing engineers. This was done in order verify that no product
requirements had been missed and that the product aspects were adequate to be able to fulfill the
desired improvement needs.
The next step was using the technical specifications as a base to divide the product into functions and
sub-functions in the function decomposition. Conceptual technical solutions were then individually
developed for each of these functions and sub-functions through brainstorming sessions alongside
manufacturing engineers. These were then evaluated individually for each function and the most
beneficial solution or solutions for each function was selected, through the use of Pugh-matrixes
based on the company’s improvement needs, for continued development. After selecting the
functions technical concepts they, along with their respective functions and sub-functions were

17
summarized and visualized in a functions-and-means tree to enable easy review and feedback from
the manufacturing engineers as well as the manufacturing engineering manager.
Following the selection of which technical solutions for the products functions that were to be kept
for continued development they were all evaluated and mapped against the Module Drivers,
explained in section 2.3.3, in a Module Indication Matrix. After mapping the technical solution’s
relations to the drivers the matrix was used to find patterns and similarities that either indicated that
different solutions would be best kept separate or that multiple solutions had integral properties
with each other. Before finalizing the splitting of the technical solutions into modules the rule of
thumb, seen in Equation 1, was taken into account as a preliminary guide on the appropriate amount
of modularization for the product.
After deciding on a desired number of modules the functions were grouped into their preferred
modules and an Interface Matrix, seen in Figure 7, was used to visualize and determine the preferred
module assembly and disassembly order in order for ease the operators workload the most as the
equipment would be used during regular production. After deciding on the assembly orders a series
of interface concepts were developed through brainstorming sessions. Thereafter the interface
concepts were evaluated against each other, in unison with the manufacturing engineers, using
Pugh-matrixes based on predetermined product design properties. This process led to the decision
regarding which single interface concept was to be kept for the continued development.
Following the interface concept decision the possible integrality within the flange plate module
throughout the A1-hub series was done. The integrality was limited by two factors, wherein the first
was the maximum allowed overhang from the edge of the hub to the flange plate’s edge. Its second
limiting factor for integrality being the hole pattern diameters of the guide pins and shaft bolts which
wasn’t allowed to overlap with the hub sealing of an integrated model size without it losing its
function. The sizing and detailed specifications of module interface layouts as well as common joints
between modules was calculated by considering the extreme cases that would occur and
standardizing the results throughout the full product series. These results were thereafter compiled
along with the description of module variants, technical specifications and design target and used to
provide a module specific technical specification, thereby enabling separate detail designs to be
developed for each desired module throughout the entire size range of the function test equipment.
Thereafter a detailed design model was developed for each module, using the produced module
specifications as a base. The new design was developed while keeping in mind the result from the
current state VSM in order to avoid the proven increasingly wasteful manufacturing processes with
regards to its value adding process time in relation to the increase in lead time that the use of the
process implied. Individual module designing started with considering alternate internal component
designs and materials, followed by rough calculations of minimal material thickness required to
maintain component function as well as the sizing of internal joints. This was followed by surveying
and mapping available material dimensions from suppliers while doing minor amendments to
component sizing in order to accommodate for available material dimensions and minimizing the
amount of machining required.
After finishing the individual designs and 3D-model for each of the three modules they were
assembled and reviewed as a finished product, alongside the manufacturing engineers, serving as a
18
final stage gate and quality assurance before declaring the design as final and initiating the final lead
time, cost, and tool based storage need comparison.
3.3 Future State Report: Results and effects from process and product amendments
As the balance and function test equipment design was finalized a cost and time comparison
between the new design and the current was conducted. This included the material-, manufacturing-
, and product development cost as well as a brief storage space and cost comparison.
Material costs were to be estimated by doing an assumption of 2-5mm surplus material, depending
on component size, on all component surfaces intended for machining. Thereafter volumetric
calculations were made for each of the components. Thereafter averaged material purchasing costs
from suppliers for standard structural steel (such as S355JR // SS-2172-00) and aluminum bronze
(JM7-15 // SS-5716-15), were applied to acquire material costs.
The manufacturing time comparison was made by summarizing estimated manufacturing times for
each individual tool component. These estimations were calculated by first listing the operation
parameters required for manufacturing followed by applying basic formulas for calculating machining
durations for turning, milling, drilling/boring, and threading correspondingly. All equations that were
used are accounted for in Appendix 3. After the machine duration calculation estimated machine
time efficiencies (for manual machine) were applied as well as adding machine setup times. These
were then summarized into process times. At this point key components that had not been
significantly altered compared to previous designs were used to benchmark and validate the
convergence between calculated process times and empirical process times from similar previously
manufactured components. Two variables, machine setup time and averaged machining efficiency,
were used to calibrate the convergence between the model and reality. Note that the machining
efficiency, which takes into account time between cuts, amongst others varies depending on manual
or automated machines. The provision of this empirical data, as well as the verification of
convergence between theory and reality, was carried out in cooperation with the production
planners. After finalizing the process times the internal hourly rate for production personnel at the
site was applied to obtain the final manufacturing cost. For the lead time comparison, initially, a
single worker working sequentially with all tasks was assumed and the previously acquired overall
“value adding” efficiency obtained from the initial value stream mapping, after removing the effects
of the welding and annealing processes, was applied.
The process time for the product development phase was carried out in a similar fashion for both the
current process as well as the proposed MFD process. Individual activities were identified and each
respective activity times estimated. Post estimating the individual activity times a standardized work
efficiency factor used when planning officials’ workload, 82%, provided by the manufacturing
engineering manager, was applied. After verifying the resulting time estimates with the
manufacturing engineers these were summarized to a total process time both for initial tool
development as well as subsequent tool development within the tool series. As the final process
times had been set the internal hourly rate for engineering officials at the site was applied to obtain
the final product development cost. The calculation of lead time for the product development
process was, where applicable, done assuming parallel work between the existing two manufacturing
engineers currently working with tool and fixture development.
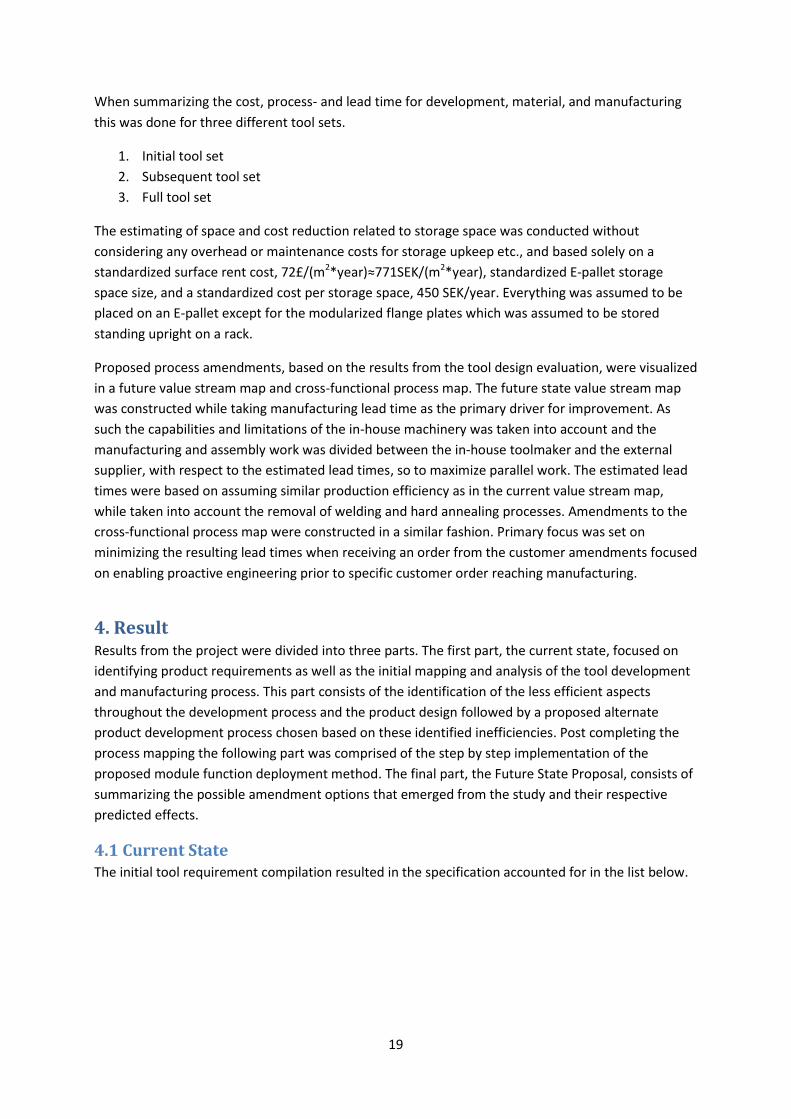
19
When summarizing the cost, process- and lead time for development, material, and manufacturing
this was done for three different tool sets.
1. Initial tool set
2. Subsequent tool set
3. Full tool set
The estimating of space and cost reduction related to storage space was conducted without
considering any overhead or maintenance costs for storage upkeep etc., and based solely on a
standardized surface rent cost, 72£/(m2*year)≈771SEK/(m2*year), standardized E-pallet storage
space size, and a standardized cost per storage space, 450 SEK/year. Everything was assumed to be
placed on an E-pallet except for the modularized flange plates which was assumed to be stored
standing upright on a rack.
Proposed process amendments, based on the results from the tool design evaluation, were visualized
in a future value stream map and cross-functional process map. The future state value stream map
was constructed while taking manufacturing lead time as the primary driver for improvement. As
such the capabilities and limitations of the in-house machinery was taken into account and the
manufacturing and assembly work was divided between the in-house toolmaker and the external
supplier, with respect to the estimated lead times, so to maximize parallel work. The estimated lead
times were based on assuming similar production efficiency as in the current value stream map,
while taken into account the removal of welding and hard annealing processes. Amendments to the
cross-functional process map were constructed in a similar fashion. Primary focus was set on
minimizing the resulting lead times when receiving an order from the customer amendments focused
on enabling proactive engineering prior to specific customer order reaching manufacturing.
4. Result Results from the project were divided into three parts. The first part, the current state, focused on
identifying product requirements as well as the initial mapping and analysis of the tool development
and manufacturing process. This part consists of the identification of the less efficient aspects
throughout the development process and the product design followed by a proposed alternate
product development process chosen based on these identified inefficiencies. Post completing the
process mapping the following part was comprised of the step by step implementation of the
proposed module function deployment method. The final part, the Future State Proposal, consists of
summarizing the possible amendment options that emerged from the study and their respective
predicted effects.
4.1 Current State The initial tool requirement compilation resulted in the specification accounted for in the list below.

20
At the current state the time required to design and manufacture a balancing and function test
flange has been set to a standardized 16 weeks. This includes all activities from the point when the
new tool design and its corresponding work order package arrives at the manufacturing engineering
department and the tool is manufactured, assembled, and delivered to production. Out of this time
the first 6 week period has been dedicated to tool design development, planning the self-made
manufacturing, prepping tool and fixture manufacturing work orders, and placing purchasing orders.
Following this the last 10 weeks have been dedicated to tool manufacturing.
The production planner explained the overall preparation phase. During this phase he designates
what tools and fixtures are to be used during the manufacturing and testing, which of these already
exist and which ones are brand new and needs to be designed and manufactured. The production
planner provided process times for previously manufactured comparable tools. He also explained the
collaboration with the toolmaker as new components and assembly structures are received from the
upstream design department, with regards estimating lead times for manufacturing and assembly.
The manufacturing engineers explained their process from receiving requests for design
development for new tools and fixtures in their order stock. This generally started with a brief check
if any previously manufactured components could be utilized followed by the production of any new
components along with their associated detail and/or assembly drawings.
To understand the outsourcing process the appointed Rolls-Royce buyer in the purchasing
department was also interviewed. He provided a step by step description of the purchasing process,
the information he needed to be able to start the process as well as the general lead times for each
step of the process.
Alongside the interviews carried out within the organization a study visit was also conducted at the
most recurring and reliable supplier of outsourced manufacturing. This started with a brief tour of
their manufacturing facilities, consisting of machining, welding, assembly, packaging and shipping
areas. Thereafter the interview with their quotation engineer discussed manufacturing routines,
estimated process and lead times of the sequential step in the manufacturing process. At this point a
brief discussion was also had with regards to the possibilities for continued streamlining of the
combined outsourced process in terms of reducing lead times. Foreseeing a potential need to
reengineer flange design feedback from operators about previous flange designs concerning
unpractical manufacturing geometries, and possible machine limitations, was also discussed.
Technical Specification● All product joints shall be sealed.
● All major components shall be equipped with CE marked lifting devices (safety factor 4).
● Flange must be able to cope with pressures at 1.5 times safety valve pressure level during workshop pressure tests.
SP-system: 4.7Bar design pressure. 7Bar test pressure.
A-system: 80Bar design pressure. 120Bar test pressure.
B-system: 160Bar design pressure. 240Bar test pressure.
● Tap shall have the same diameter as their corresponding propeller shaft flanges.
● Tap shall have the same length as their corresponding propeller shaft flanges.
● Flanges shall have same guide pin and shaft bolt hole patterns as corresponding hubs.
● Product shall hold combined tool and hub assembly weight in radial force during static balancing.
● Assembled product shall have mass centre on centre axis.
21
The gathering of data from these interviews and facility tours throughout the different process steps
resulted in the current state value stream map in Appendix 4 as well as the cross functional process
map in Appendix 5.
4.1.1 Current State Value Stream Mapping
As visualized in the value stream map in Appendix 4 and the cross functional process map in
Appendix 5 the general manufacturing process for tools and fixtures started when the production
planners received an electronic work order from the, upstream, product design department. This
work order is sent to signal that the products design, along with its related drawings, manufacturing
lead times and deadlines as well as manuals, for a new hub assembly has been finalized. As an order
arrived to the production planners his initial responsibility was to create work orders for
manufacturing engineers to produce tool designs and associated drawings. Once these drawings
were reviewed and finished the production planner categorized whether components were either
“Purchased Items” or “Manufactured Items” depending on whether they were standard component,
needed to be outsourced for manufacturing, or if it was to be self-made. Following this categorizing
the production planner, accompanied by the toolmaker, estimated the process times for the items
that would be self-made. Thereafter the production planner purchased standard components and
raw materials needed for the self-made manufacturing while simultaneously prepping the work
orders for the self-made components and final assembly before transferring accountability for these
activities to the toolmaker. At the same time the production planner sent purchase requests for all
outsourced components to the appointed buyer, at the on-site purchasing department, who initiated
quotation and purchasing processes.
While awaiting the ordered materials intended for the self-made tool components the tool maker
continued the process by planning the work order, taking into account the individual orders
respective deadlines. When the raw materials arrived he carried out the self-made manufacturing as
per given descriptions. Post finishing with the self-made manufacturing and receiving the purchased
components, the toolmaker carried out the final assembly and quality inspection of the finished
product before delivering the finished tool to production.
The buyer received the list of desired purchased items along with related drawings and the maximum
allowed lead time through the use of the determined deadlines for delivery. At this point the buyer
inherited the on-site accountability for components being delivered on time and started the
purchasing process by sending out requests for quotations. A standard waiting time to receive
quotations from suppliers was set to five days before evaluating the received quotations those that
had been received and sending out purchasing orders.
When the manufacturing supplier receives the purchasing order he started by confirming the
previously given price and lead time stated in the quotation, orders any materials needed and
scheduled the manufacturing process for the component. As the raw materials arrived
manufacturing started with the first stage of turning and welding. Thereafter the intermediate
product was shipped to a second supplier for stress relief annealing. Once the product returned from
annealing the second round of turning and boring was performed. Thereafter the finished flange was
packaged and shipped back to the toolmaker at Rolls-Royce who would initiate the final tool
assembly.
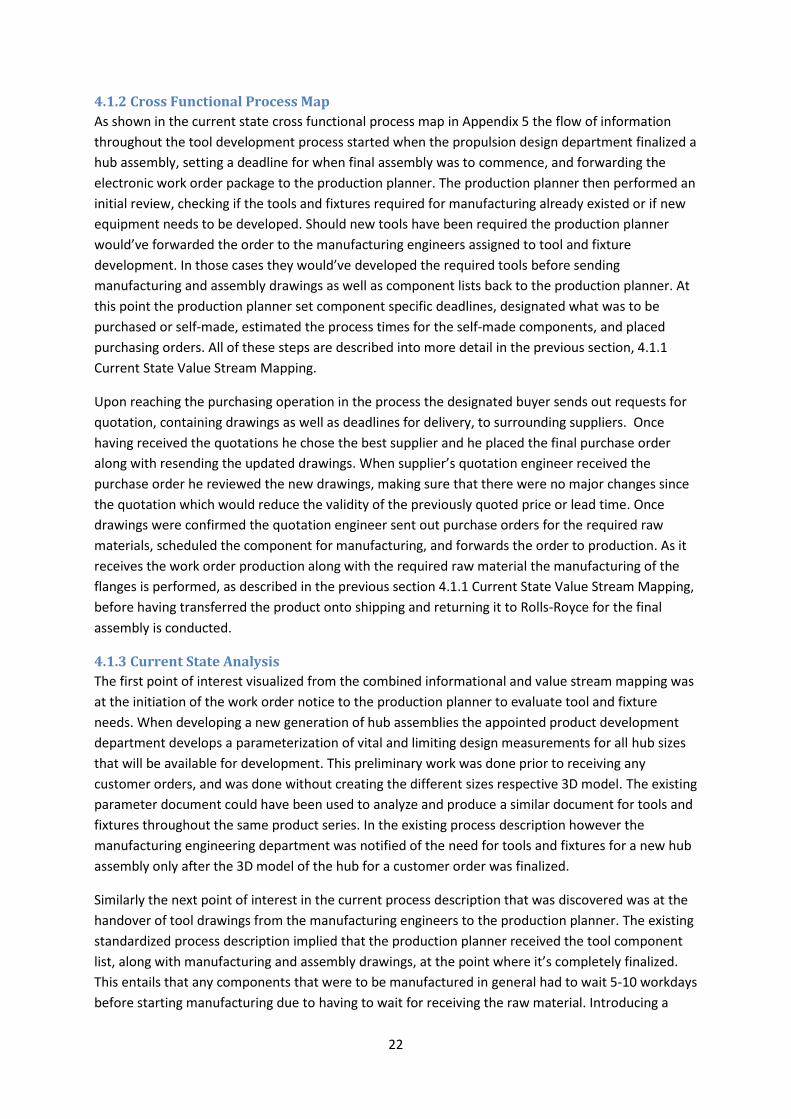
22
4.1.2 Cross Functional Process Map
As shown in the current state cross functional process map in Appendix 5 the flow of information
throughout the tool development process started when the propulsion design department finalized a
hub assembly, setting a deadline for when final assembly was to commence, and forwarding the
electronic work order package to the production planner. The production planner then performed an
initial review, checking if the tools and fixtures required for manufacturing already existed or if new
equipment needs to be developed. Should new tools have been required the production planner
would’ve forwarded the order to the manufacturing engineers assigned to tool and fixture
development. In those cases they would’ve developed the required tools before sending
manufacturing and assembly drawings as well as component lists back to the production planner. At
this point the production planner set component specific deadlines, designated what was to be
purchased or self-made, estimated the process times for the self-made components, and placed
purchasing orders. All of these steps are described into more detail in the previous section, 4.1.1
Current State Value Stream Mapping.
Upon reaching the purchasing operation in the process the designated buyer sends out requests for
quotation, containing drawings as well as deadlines for delivery, to surrounding suppliers. Once
having received the quotations he chose the best supplier and he placed the final purchase order
along with resending the updated drawings. When supplier’s quotation engineer received the
purchase order he reviewed the new drawings, making sure that there were no major changes since
the quotation which would reduce the validity of the previously quoted price or lead time. Once
drawings were confirmed the quotation engineer sent out purchase orders for the required raw
materials, scheduled the component for manufacturing, and forwards the order to production. As it
receives the work order production along with the required raw material the manufacturing of the
flanges is performed, as described in the previous section 4.1.1 Current State Value Stream Mapping,
before having transferred the product onto shipping and returning it to Rolls-Royce for the final
assembly is conducted.
4.1.3 Current State Analysis
The first point of interest visualized from the combined informational and value stream mapping was
at the initiation of the work order notice to the production planner to evaluate tool and fixture
needs. When developing a new generation of hub assemblies the appointed product development
department develops a parameterization of vital and limiting design measurements for all hub sizes
that will be available for development. This preliminary work was done prior to receiving any
customer orders, and was done without creating the different sizes respective 3D model. The existing
parameter document could have been used to analyze and produce a similar document for tools and
fixtures throughout the same product series. In the existing process description however the
manufacturing engineering department was notified of the need for tools and fixtures for a new hub
assembly only after the 3D model of the hub for a customer order was finalized.
Similarly the next point of interest in the current process description that was discovered was at the
handover of tool drawings from the manufacturing engineers to the production planner. The existing
standardized process description implied that the production planner received the tool component
list, along with manufacturing and assembly drawings, at the point where it’s completely finalized.
This entails that any components that were to be manufactured in general had to wait 5-10 workdays
before starting manufacturing due to having to wait for receiving the raw material. Introducing a

23
parameterized design for a testing flange series would have eased the production planners’ work by
enabling him to, instead of having to wait for finished drawings, purchase the required materials for
components through the use of preliminary external dimensions obtained from the earlier
preliminary work.
An additional identified point of interest was the seemingly unbalanced parallelized work load when
comparing the predefined overall manufacturing lead time, 10 weeks, with the summarized process
time for manufacturing the self-made components and the final assembly, which was 2-3 weeks in
total. The longer set lead time showed to be greatly dependent on the manufacturing and delivery of
the flange component which, after finalizing the outsourcing agreement between Rolls-Royce AB and
the supplier, was given an average lead time of 8 weeks. This lead time was noted to be largely
depending on logistics, which comprised ~25% of the total lead time. Other factors contributing to
the flange components overall required lead time was the chosen manufacturing method and size-
dependent geometrical difficulties during manufacturing. This entailed the continued tool design
evaluation to focus largely on this flange component.
The value stream map showed the flange component to be the critical component, with respect to
lead time, during manufacturing. Analyzing the value stream for the flange component showed a
comparably great amount of downtime caused by long waiting times between machines and
operations. Continued focus on manufacturing operations involved to produce the flange
component, showed the welding and stress relief annealing to be the single most wasteful operation
throughout the value stream. This was concluded by comparing the process and value adding time
with the lead time the combined manufacturing method entailed by requiring the component to be
transported to and from an additional third party between operations.
4.2 MFD product assessment The initial steps summary of customer demands resulted in the what/how-matrix shown in Figure 8.
Figure 8: The resulting "What"/"How"-matrix showing what the customer demands are and how it will be met.
"How"
"What"
Reduced lead time ❻ ❻ ❾ ❻ ❻ 33
Reduce cost ❻ ❻ ❻ ❻ ❾ 33
Reduce storage space occupied by tools. ❾ ① ❾ 19
21 13 15 12 24
Inte
grat
e m
ult
iple
siz
e-o
pti
on
s in
on
e to
ol
Des
ign
to
wit
h r
esp
ect
to a
vaila
ble
pro
cess
ing
too
ls.
Pro
du
ct M
anu
fact
ura
bili
ty /
Des
ign
Fo
r
Man
ufa
ctu
rin
g
SumCo
mp
on
ent
asse
mb
ly m
eth
od
(D
esig
n F
or
Ass
emb
ly)
(eas
e d
isas
sem
bly
an
d r
edu
ce a
ssem
bly
tim
e)
Mo
du
lari
ty
Sum
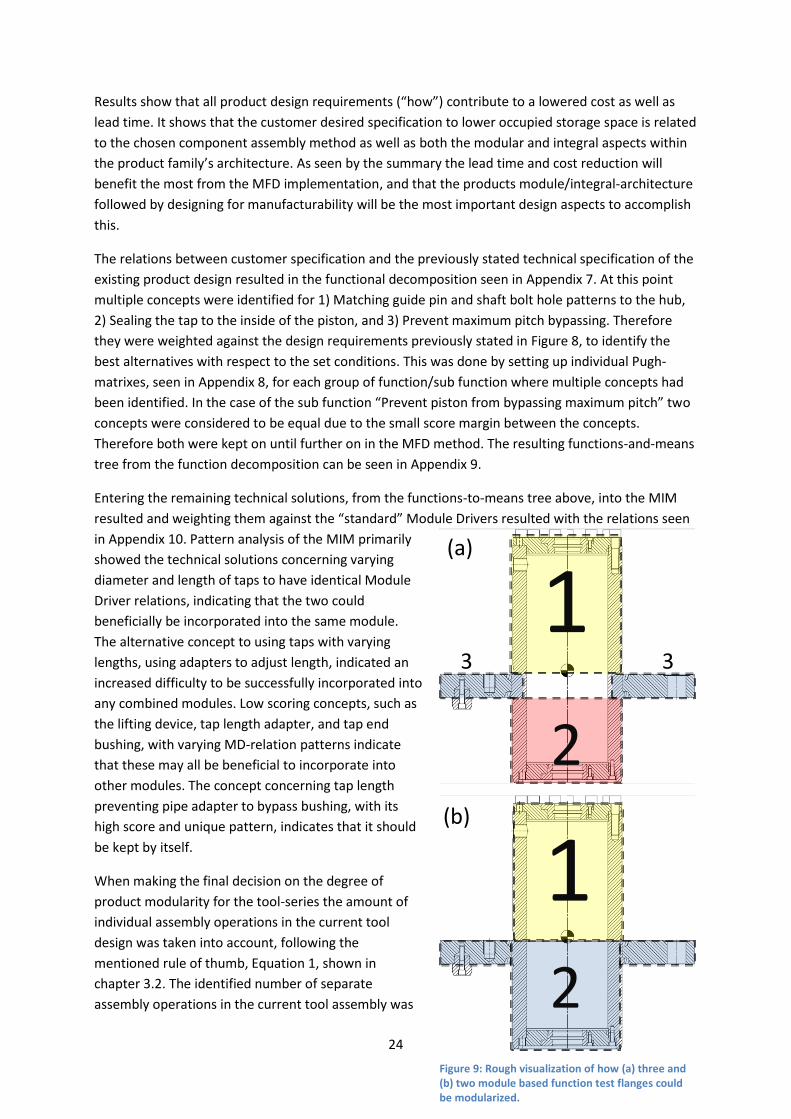
24 Figure 9: Rough visualization of how (a) three and
(b) two module based function test flanges could be modularized.
2
1
2
1
3 3
(a)
(b)
Results show that all product design requirements (“how”) contribute to a lowered cost as well as
lead time. It shows that the customer desired specification to lower occupied storage space is related
to the chosen component assembly method as well as both the modular and integral aspects within
the product family’s architecture. As seen by the summary the lead time and cost reduction will
benefit the most from the MFD implementation, and that the products module/integral-architecture
followed by designing for manufacturability will be the most important design aspects to accomplish
this.
The relations between customer specification and the previously stated technical specification of the
existing product design resulted in the functional decomposition seen in Appendix 7. At this point
multiple concepts were identified for 1) Matching guide pin and shaft bolt hole patterns to the hub,
2) Sealing the tap to the inside of the piston, and 3) Prevent maximum pitch bypassing. Therefore
they were weighted against the design requirements previously stated in Figure 8, to identify the
best alternatives with respect to the set conditions. This was done by setting up individual Pugh-
matrixes, seen in Appendix 8, for each group of function/sub function where multiple concepts had
been identified. In the case of the sub function “Prevent piston from bypassing maximum pitch” two
concepts were considered to be equal due to the small score margin between the concepts.
Therefore both were kept on until further on in the MFD method. The resulting functions-and-means
tree from the function decomposition can be seen in Appendix 9.
Entering the remaining technical solutions, from the functions-to-means tree above, into the MIM
resulted and weighting them against the “standard” Module Drivers resulted with the relations seen
in Appendix 10. Pattern analysis of the MIM primarily
showed the technical solutions concerning varying
diameter and length of taps to have identical Module
Driver relations, indicating that the two could
beneficially be incorporated into the same module.
The alternative concept to using taps with varying
lengths, using adapters to adjust length, indicated an
increased difficulty to be successfully incorporated into
any combined modules. Low scoring concepts, such as
the lifting device, tap length adapter, and tap end
bushing, with varying MD-relation patterns indicate
that these may all be beneficial to incorporate into
other modules. The concept concerning tap length
preventing pipe adapter to bypass bushing, with its
high score and unique pattern, indicates that it should
be kept by itself.
When making the final decision on the degree of
product modularity for the tool-series the amount of
individual assembly operations in the current tool
design was taken into account, following the
mentioned rule of thumb, Equation 1, shown in
chapter 3.2. The identified number of separate
assembly operations in the current tool assembly was
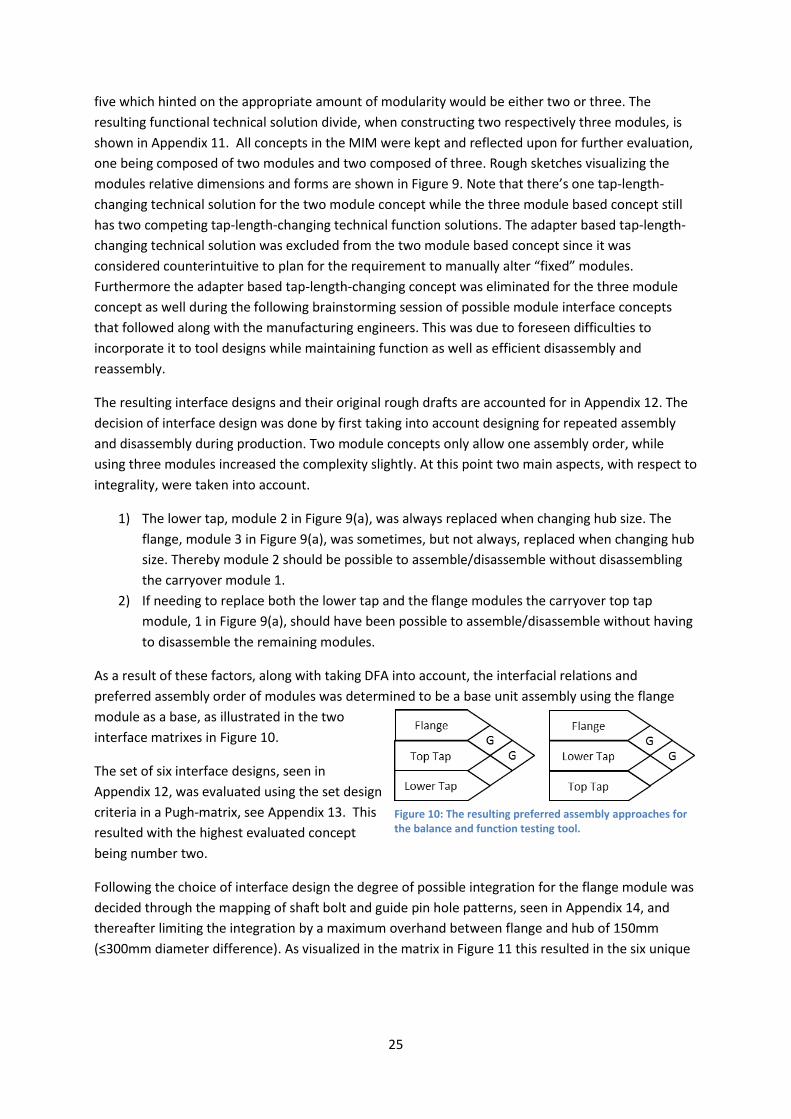
25
five which hinted on the appropriate amount of modularity would be either two or three. The
resulting functional technical solution divide, when constructing two respectively three modules, is
shown in Appendix 11. All concepts in the MIM were kept and reflected upon for further evaluation,
one being composed of two modules and two composed of three. Rough sketches visualizing the
modules relative dimensions and forms are shown in Figure 9. Note that there’s one tap-length-
changing technical solution for the two module concept while the three module based concept still
has two competing tap-length-changing technical function solutions. The adapter based tap-length-
changing technical solution was excluded from the two module based concept since it was
considered counterintuitive to plan for the requirement to manually alter “fixed” modules.
Furthermore the adapter based tap-length-changing concept was eliminated for the three module
concept as well during the following brainstorming session of possible module interface concepts
that followed along with the manufacturing engineers. This was due to foreseen difficulties to
incorporate it to tool designs while maintaining function as well as efficient disassembly and
reassembly.
The resulting interface designs and their original rough drafts are accounted for in Appendix 12. The
decision of interface design was done by first taking into account designing for repeated assembly
and disassembly during production. Two module concepts only allow one assembly order, while
using three modules increased the complexity slightly. At this point two main aspects, with respect to
integrality, were taken into account.
1) The lower tap, module 2 in Figure 9(a), was always replaced when changing hub size. The
flange, module 3 in Figure 9(a), was sometimes, but not always, replaced when changing hub
size. Thereby module 2 should be possible to assemble/disassemble without disassembling
the carryover module 1.
2) If needing to replace both the lower tap and the flange modules the carryover top tap
module, 1 in Figure 9(a), should have been possible to assemble/disassemble without having
to disassemble the remaining modules.
As a result of these factors, along with taking DFA into account, the interfacial relations and
preferred assembly order of modules was determined to be a base unit assembly using the flange
module as a base, as illustrated in the two
interface matrixes in Figure 10.
The set of six interface designs, seen in
Appendix 12, was evaluated using the set design
criteria in a Pugh-matrix, see Appendix 13. This
resulted with the highest evaluated concept
being number two.
Following the choice of interface design the degree of possible integration for the flange module was
decided through the mapping of shaft bolt and guide pin hole patterns, seen in Appendix 14, and
thereafter limiting the integration by a maximum overhand between flange and hub of 150mm
(≤300mm diameter difference). As visualized in the matrix in Figure 11 this resulted in the six unique
Figure 10: The resulting preferred assembly approaches for the balance and function testing tool.

26
flanges for the product series: 60/86, 66/94, 72/102, 79/111, 121, 132.
Figure 11: Visualizing of possible integrality within the flange module when comparing shaft bolt and guide pin hole patterns with hub sealing placements and flange diameter differences between size models.
Module specific interface dimensions were thereafter calculated and summarized in Appendix 15.
Standard MC6S 12.9 insex bolts were assumed for all bolted joints. The proposed bolt dimensions
used to connect the different combinations of component are summarized in Table 1. General
recommendation for sealing placements at module interfaces were, due to recommendations based
on operator experience, during the continued module design sought to be placed radially where
possible in order to ease assembly. The data in Appendix 15, Table 1, along with the supplementary
specifications in Appendix 16 made up the module specifications used for the continued independent
development of individual modules.
Table 1: Summary of calculated standardized bolt dimensions at inter-modular interface joints.
Interface Hole Pattern Number of bolts per pattern
Minimum Clamp Length Lk
Bolt size
Top Tap // Flange Ø235mm 12 ≥48mm M16x60
Flange // Bottom Tap 60/86: Ø315mm 66/94: Ø340mm 72/102: Ø375mm 79/111: Ø415mm 121: Ø455mm 132: Ø495mm
12 ≥24mm ≥29mm ≥39mm ≥30mm ≥40mm ≥60mm
M8x55 -“- -“- M10x65 -“- -“-
4.2.1 Module designs for A1 balancing and function testing tool series
The detailed designs of modules started with determining if component materials mechanical
properties or bolted joint sizing were the dominant factor, with respect to product function and
induced stress, when designing the components. As bolted joints were the dominant factor these
were all sized simultaneously and the results compiled into Table 2.
Table 2: Summary of precalculated bolt sizes and patterns within modules throughout the full tool series.
Module Interface Hole Pattern Number of bolts per
Minimum Clamp Length
Bolt size
1 1 1 1 1 1 1 1 0 0
60 66 72 79 86 94 102 111 121 132
1 60 x
1 66 x
1 72 x
1 79 x
1 86 x
1 94 x
1 102 x
1 111 x
0 121
0 132
Possible Flange
Integration
● : No overlap of seal and hole patterns
● : Flange size difference >300mm. thereby disabling integration during function test with blades assembled.

27
pattern Lk
Top tap End cap // Pipe Ø165mm 12 ≥36mm M12x40
Top tap Pipe // Flange interface plate
Ø165mm 12 ≥36mm* M12x40*
Flange plate Cover plates // Flange plate
Ø70mm 4 ≥12mm M4x16
Bottom tap End cap // Pipe 60: Ø205mm 66: Ø225mm 72: Ø245mm 79: Ø270mm 86: Ø305mm 94: Ø330mm 102: Ø365mm 111: Ø405mm 121: Ø445mm 132: Ø485mm
12 -“- -“- -“- -“- -“- -“- -“- 16 -“-
≥24mm ≥30mm ≥30mm ≥30mm ≥40mm ≥55mm ≥42mm ≥45mm ≥42mm ≥57mm
M8x40 M8x40 M10x40 M10x40 M10x65 M10x65 M14x55 M14x55 M14x65 M14x65
Bottom tap Pipe // Flange interface plate
60: Ø215mm 66: Ø235mm 72: Ø255mm 79: Ø280mm
12 ≥24mm ≥30mm ≥30mm ≥30mm
M8x40 M8x40 M10x40 M10x40
*Critical point of design. Calculation based on a safety factor of 3, ≤350mm lever during static balancing, ≤17500kg total
weight, 60% load distributed on top tap side, and ≤65% pretension in bolts.
Due to there being no specified need for more advanced materials to obtain the desired tool function
the same type of regular structural steel as was used in previously manufactured tools was kept due
to its low cost. Thereafter the design, sizing and assembly of 3D-model component were produced
individually for each broken down module for the combined hub size 60/86 tool set, after having
taken into account the availability of manufacturing methods and surveyed available standardized
material dimensions at suppliers. The resulting model design for the top tap is visualized in Appendix
18, the flange plate with dual hub size integration in Appendix 19, and the size specific bottom tap
for hub size 60 in Appendix 20. Note that the bottom tap for the larger hub size, 86, had the same
design concept with the exception of not including the upper module interface plate. A schematic
cross section of the fully assembled tool design, enabling easy comparison with existing tool design,
is shown in Appendix 21. The semi-assembled cross section of the 60/86 modular tool is shown in
Appendix 22, visualizing the minimal degree of possible preassembly and maximum required
disassembly when switching between hub sizes.
The summary of the calculated process and lead times as well as cost comparison between the
current and the proposed product architectures is shown in Appendix 23. Storage space comparison
of a full set of tools resulted in ~3m2 (~20%) reduced space, from 14.4m2 to 11.5m2. Storage cost
comparison of a full set of tools resulted in ~800 SEK/year (~10%) cost reduction, from 6750 SEK/year
to 5950 SEK/year.
4.3 Future State Proposal Two options for the continued tool development and manufacturing process were included in the
future state proposal.
1. Only implementing the amendments to the initiating product development process steps, as
visualized in the future state cross functional process map shown in Appendix 24. This would

28
have led to reduced lead time when the customer order arrives for the initial tool within the
product series from four to one week (~75%) for tool development but no cost reductions.
2. In addition to option 1, implement the proposed amendments related to changing product
architecture. By making the tool series modular it would have enabled the changes visualized
in the future state value stream map in Appendix 25. The results of this would’ve been an
equivalent cost for the initial tool set, comprised of tools for two hub sizes, followed by an
average cost reduction of ~35’000 SEK/tool (~25%) thereon due to combined material and
manufacturing cost reductions. Lead time reductions due to the changes in product
architecture would have been 3-4 weeks/tool (≥35% of manufacturing lead time) due to
reduced amount of components required to be manufactured along with increased possible
parallel manufacturing of the individual tool components.

29
5. Discussion The initial value stream mapping started with scheduling a meeting with the external supplier’s
quotation engineer, followed by a tour of their manufacturing facilities. During the meeting the
manufacturing engineers responsible for tool and fixture development were also present. At the
meet, even if disregarding the value of the intended data gathering for the papers value stream and
cross functional process mapping, valuable experience was gained by the manufacturing engineers as
well. An increased understanding of the possibilities and limitations of the supplier’s machinery
entailed an enhanced potential for more efficient product designing with respect to manufacturing.
Thusly similar contacts between engineers responsible for product development and companies
frequently used manufacturing suppliers are seen as beneficial as it enables more efficient designs, in
regards to DFM aspects, in developed products.
5.1 Process evaluation What became apparent from the CFPM was that when developing a new balance and function
testing flange there was no need for an entire 3D modelled assembly to be complete for the
manufacturing engineers to initiate tool development. In order to be able to start designing the tool
there is only a need for some vital measurements to be determined.
The initial product specifications for the tool showed relatively simple technical requirements, a
relatively wide product variety due to differing hub sizes, and that maintained tool functionality
wasn’t relying on an optimized high performance design. Meanwhile the current state value stream
mapping visualized a lack of strategic product properties, such as enabling a more parallelized work
process, in the current integral tool design. These were the two main factors when deciding on
implementing the modularized product architecture. Rolls-Royce AB’s expressed desire to reduced
tool based storage needs, particularly for bigger tool sets, was an additional contributing factor for
modularization due to the apparent benefit to storage efficiency gained by being able to disassemble
them.
The increased standardization within the product family, gained by taking the entire tool series into
account during the MFD development process was considered to contribute to increased engineering
efficiency, entailing reduced the overall time needed for development. Additionally the modular
concept was thought to increase the possibility of parallel concurrent engineering during module
design development, entailing further reduced lead time
As the VSM visualized the outsourced flange component as the critical path for manufacturing lead
time this became the main focus of the continued tool design evaluation. Modularization of this main
component was motivated by wanting to enable better balanced parallel manufacturing in order to
reduce its lead time.
Current manufacturing of tools and fixtures were split between in-house and external supplier
manufacturing. Outsourcing manufacturing of low volume components had the benefit of reducing
variation in production as well as reducing operational costs from machines, personnel and
maintenance. From a suppliers point of view low component volumes did however result in
comparably low manufacturing-value of the outsourced parts. Also noted was that the recurrences of
outsourcing similar tools for manufacturing to the same supplier were somewhat irregular. The
combination of these two factors entailed that when a new manufacturing order reached the

30
supplying manufacturer he couldn’t usually economically justify setting it as a high priority (thereby
reducing lead time) order compared to other perhaps more regular and/or bigger manufacturing
orders. As such outsourced tool components got longer lead times for delivery. Although not having
been covered to any bigger extent within the study, except concluding that logistics were a
significant issue, one possible way of reducing the lead time for these component could have been
continued development of local supplier-partnerships focused on creating closer relations and the
mutual benefits of increasing manufacturing efficiency and reducing the limitations on
manufacturing lead time caused by, amongst others, logistics.
5.2 Tool design Many produced product development processes in research originated from the notion of having a
continuous large scale production. This had to be taken into account when adapting it to the existing
small series manufacturing of in-house tools. During the use of the MFD process when designing the
modules and their connecting interfaces the rule of thumb for the degree of modularization,
Equation 1, was an obvious example of this. The rule of thumb was derived from wanting to create
the optimal amount of parallel assembly with respect to the assembly times of modules alongside a
primary assembly lane. Due to this, while still taking the rule into consideration, it wasn’t applied
literary but rather interpreted so to design the interfaces in such a way to minimize the required
disassembly and reassembly while moving the tool between hubs and to allow the most amount of
possible preassembly of a tool to a hub without disrupting an ongoing function test.
Initially interface concepts were evaluated with respect to the most beneficial assembly order. This
was done by considering the most extreme situation that could occur within the Balancing and
Function testing operations during full capacity, and thereby identifying the most efficient and
versatile (thereby most desirable) disassembly and assembly order. Interface concepts were
thereafter compared with respect to their perceived relative manufacturability compared to each
other, taking into account estimated manufacturing time requirements.
To ease assembly, possible future maintenance, as well as reduce the amount spare parts entailed to
keep in storage to secure production bolted joints were, to an extent, standardized so that the same
size bolts were usable throughout the entire tool series.
The avoidance of welding and its associated annealing process have been stated as a principal design
aspect for the tool. Additionally the development of new components was done while striving for
basic geometry in order to further ease the manufacturability. When considering the design of the
top taps an alternate design, which would have increased material cost but simultaneously reduce
labor cost, was manufacturing these in one piece through a single turning operation instead of
drilling, threading and bolting the cylinder and flange plate together. This would plausibly reduce the
amount of possible failure modes and lower the initial assembly time required by reducing the
number of bolt and sealing elements however the availability of a standardized pipe with the
required dimensions also showed to be limited.
Bushings fitted using bolted joints was also considered in order to ease material separation for future
recycling. This assembly method was however disregarded due to the combined factors of the
increased bronze material usage, which would affect both the economic and environmental impact,
as well as an increase in manufacturing time. Using bolted joint fitted bushings also entailed an

31
increased number of sealing components relied upon for maintained tool function, thereby entailing
an increased function failure plausibility.
When implementing modularized in-house tools transparency and communication between
departments was considered to be key aspects for making it work long term. Even though having
taken into account that assembly and disassembly was to be as easy and quick as possible during
production it would inevitably entail a slightly increased work for the operator assigned to the task.
Because of this having working continuous two-way feedback between the manufacturing engineers
and operators were considered to be vital. The manufacturing engineers responsible for tool
development would be required to communicate the implied savings, thereby clarifying the gained
value despite the additional assembly operation when a reoccurring hub assembly would be received
in the future. Simultaneously the operators would get to provide feedback to the engineer regarding
working aspects of the tool design as well as, should something be causing more work than
estimated, notify the engineer any neglected needs prior to the next tool size or tool generation
would be manufactured so that it could be properly documented and wouldn’t be repeated.
5.3 Cost and lead time When setting up time and cost comparisons the empiric process data gathered for the current tool
development proved to be equally helpful and limiting. This was due to Rolls-Royce AB and the
supplier using different logging methods and categorizing process data to different extents. The
obtained empirical data had also been from differing tool sizes and tools from different generations.
As such the provided process times were solely used to benchmark and calibrate the simulated
model for calculating individual process times for both the old and the new components, rather than
being used as absolute values when comparing with the model. While this ensured an equitable
comparison between the different products designs it was emphasized that the resulting lead time
and cost comparisons from this method would preferably be reviewed as relatively to each other
rather than absolute savings. This was stated due to it in general always being possible to further
refine and reduce deviations between reality and a theorized model, due to variable changes. By
doing a relative comparison between designs these deviations would however, to a bigger extent, be
negligible while still providing a fair assessment of the effects of proposed product amendments.
Note that the lead times in Appendix 23 differed from the lead time in the future state value stream
map in Appendix 25. This was due to the comparison in Appendix 23 having the main purpose of
showing the overall reduction of manufacturing time needed, as well as the related cost effects,
caused by the tool design changes. As seen the tool design related manufacturing reduction was
estimated to ~70 hours for the first tool set comprised of the sizes 60 and 86, and a ~195 hours lead
time reduction for a sub-sequent tool set comprised of the sizes 66 and 94. Appendix 25 continues by
utilizing the flexibility provided to the manufacturing process by the modular product architecture,
which shows a continued reduction in lead time caused by the increase in parallelism of the
manufacturing. This step assumed the continued outsourcing of the flange plate, which couldn’t be
self-made without possibly disrupting normal production, along with the corresponding cover plates
assembled to it before delivery. Simultaneously the initial manufacturing for the top tap and a
bottom tap, applying an averaged manufacturing time, was assumed to be self-made. The resulting
value stream for the outsourced component, which still had the longest time estimate, entailed a
reduced lead time of ~35-45% compared to the original value stream. This variation depended on if
assuming the same overall manufacturing process efficiency, ~45% reduction, or the same estimated

32
time the components spent in storage between machining processes, ~35%, as the current state
value stream showed.
When adding all processes post tool development, thereby including the initial two week period
dedicated to quotation and purchasing, the amendments entailed a potentially reduced
manufacturing delivery of 26-37%, depending on supplier processing efficiency. This, along with the
previously mentioned cost reduction, was considered to provide considerable benefits to Rolls-Royce
AB’s competitiveness and delivery reliability on the market.
At the time of the study it was noted that the product development time wasn’t logged or in other
ways documented towards specific customer orders or products in order to enable an objective
comparison between products. As such the process comparison was based on making a work
package breakdown of the processes, both the old and the new, and accompanying these with
individual work package times based upon estimations done alongside the manufacturing engineers.
In the case for the MFD development process the work package times were based on the times
gained by the implementation of the process on the A1 hub series performed within the scope of the
study. Due to the apparent subjectivity of the gathering of this product development time no greater
emphasis was put on this comparison. No increase or decrease in efficiency with regards to overall
tool development process time was made. The only deduction made was that the altered process
enabled more work to be performed before a customer order was received, thereby assisting in the
reduction in lead time for incoming orders in the future.
Note that the calculated cost reduction was solely based on personnel and material costs.
Determining the internal value of a reduced delivery date for a customer order was not deemed
relevant for the study, but was considered to further increase the economic benefits of the proposed
development process and product amendments.
33
6. Conclusions The implementation of both suggested amendments stated in the future state proposal would have
been economically beneficial provided that at least two out of the ten developed hub sizes were
going to be manufactured on the site at some point. The modularization would have enabled a 26-
37% reduction in overall manufacturing lead time for the tools, reducing it from 10 weeks to 6-7
weeks depending on supplier manufacturing efficiency. This was largely thanks to the increased
possibility of parallel manufacturing thanks to the modularity, as well as the reduction of
manufacturing required for sub-sequent tool sets due to the tool integrality. Deriving from the initial
statement of five tool sets being manufactured each year this would entail a cost reduction of ~105K
SEK the initial year followed by up to ~175K SEK the following year assuming the remaining five tool
sets would be manufactured. These savings were made possible due to material savings, enabled by
the integrality within the tool series, and the corresponding cost reduction from reduced
manufacturing needs.
Should solely the suggested minor process amendments be implemented; first part of the future
state proposal be implemented, then the proactive engineering and parameterization of the
balancing and function test equipment would not generate any cost reductions but would still reduce
tool development lead time of the initial tool set when a new generation of hubs would be
introduced.
Continued study is recommended to focus on potential supplier/partnership developments, its
possibilities, limitations, and mutual benefits gained from it. If wanting to continue streamlining the
product development process, for further lead time or cost reductions, some sort of activity based
time logging would be recommended in order to enable objective evaluation of any process changes.
Should Rolls-Royce AB choose to adapt to the proposed method and modularized product
architecture for the static balance and function test equipment, and its implementation proved
successful, then the set based product development methodology would be easily applicable on
other tools and fixtures. By having implemented this kind of approach for proactive engineering it
could enable continued improvements and savings by enabling off-site outsourcing of the final
repetitive engineering activities such as 3D-modelling and drawing development. This would thereby
enable the on-site manufacturing engineers to focus more on continuous improvements and
developing efficient solutions for new generations of tools and fixtures.

34
6. References
Alfalla-Luque, R., Medina-Lopez, C. & Dey, P. K., 2013. Supply Chain Integration Framework Using
Literature Review. Production Planning & Control, 24(8/9), pp. 800-817.
Anjard, R. P., 1996. Process Mapping: One of Three, New, Special Quality Tools For Management,
Wuality and all Other Professionals. Microelectron Reliab., 36(2), pp. 223-225.
Blixt, G., 2014. Production Planner [Interview] (28 January 2014).
Campbell, E. B., 1998. Managing the Defense Industry Transition to Performance-Based Practices and
Supply Chain Integration, Cambridge: Massachussetts Institute of Technology.
Cooper, R. G. & Kleinschmidt, E. J., 2007. Winning Business in Product Development. The Critical
Success Factors. Research Technology Management, 50(3), pp. 52-66.
Cunningham, T. W., 1998. Chains of Function Delivery: A Role For Product Architecture in Concept
Design, Cambridge: Massachusetts Institute of Technology.
Edman, R., 2014. Manufacturing Engineer [Interview] (23 January 2014).
Elshani, T., 2014. Manufacturing Engineer [Interview] (23 January 2014).
Ericsson, A. & Erixon, G., 1999. Controlling Design Variants. New York: ASME Press, The American
Society of Mechanical Engineers.
Eriksson, J.-Å., 2014. Quotation Engineer [Interview] (6 February 2014).
Erixon, G., 1998. Modular Function Deployment - A Method for Product Modularisation, Stockholm:
The Royal Institute of technology.
Erixon, G., von Yxkull, A. & Östgren, B. M., 1994. "Modularize Your Product", in Swedish. Stockholm:
Förlagets AB Industrilitteratur.
Hjalmarsson, D. & Jonsson, J., 2010. Modularization: Module based architecture - flexible engine
module line, Karlstad: Karlstads University.
Jansson, M., 2014. Manufacturing Engineer [Interview] (23 January 2014).
Lange, M. W. & Imsdahl, A., 2014. Modular Functino Deployment - Using Module Drivers to Impart
Strategies to a Product Architecture. In: Advances in Product Family and Product Platform Design:
Methods and Applications. New York: Springer-Verlag, pp. 91-118.
Martinez León, H. C. & Farris, J. A., 2011. Lean Production Development Research: Current State and
Future Directions. Engineering Management Journal, 23(1), pp. 29-51.
Morgan, J. M. & Liker, J. K., 2006. The Toyota Product Development System. New York: Productivity
Press.
Ohlsson, K.-Å., 2013. Buyer [Interview] (30 January 2013).
35
Rask, I. & Sunnersjö, S., 1998. Konceptkonstruktion, val av material och tillverkningsmetoder.
Göteborg: IVF, Institutet för Verkstadsteknisk Forskning.
Rother, M. & Shook, J., 2004. Learning to See - Value Stream Mapping to Create Value and Eliminate
Muda. Cambridge: Lean Enterprise Institute.
Simpson, T. W., Siddique, Z. & Jiao, J. R., 2006. Product Platform and Product Family Design; Methods
and Applications. New York: Springer Science + Business Media.
Smith, R., 1997. The Historical Roots of Concurrent Engineering Fundamentals. Engineering
Management, IEE Transactions on, 44(1), pp. 67-78.
Sobek, D. K., 1997. Principles that Shape Product Development Systems: A ToyotaChrysler
Comparison, Ann Arbor: University of Michigan.
Walton, M., 1999. Strategies for Lean Product Development, Cambridge: Massachusetts Institute of
Technology.
Value Driven Design Ltd, 2013. Manufacturing Management and Technology Guide. [Online]
Available at: www.valuedrivendesign.co.uk/managementguide/06.18.aspx
[Accessed 04 March 2014].
Ward, A. C., Liker, J. J. C. & Sobek, D. K., 1995. The Second Toyota Paradox: How Delaying Decisions
Can Make Cars Faster. Sloan Management Review, 36(3), pp. 43-61.
Womack, J. P. & Jones, D. T., 1996. Lean Thinking: Banish Waste and Create Wealth in Your
Corporation. New York: Simon & Schuster.
Womack, J. P., Jones, D. T. & Roos, D., 1991. The Machine That Changed The World: The Story of Lean
Production. New York: HarperPerennial.
36
7. Appendixes
Appendix 1
Appendix 1: Visualizing of the different components included in a "House of Quality".
37
Appendix 2
Appendix 2: Illustration visualizing a simplified QFD matrix showing the relations between customer wants ("what") and product properties ("how").
Ho
w
Wh
at
❾
Sum
Cu
sto
me
r "W
ants
"
Pro
du
ct P
rop
ert
ies
Mo
du
lari
tySu
m
❾=
Stro
ng
rela
tio
n(9
)❻
= M
ed
ium
rela
tio
n (6
)①
= W
eak
re
lati
on
(1)
38
Appendix 3
Appendix 3: Summary of basic formulas utilized for calculating and estimating component manufacturing time.
𝑣𝑐 =𝐷𝑐𝑎𝑝 ∗ 𝜋 ∗ 𝑛
1000
𝑣𝑓 = 𝑓𝑧 ∗ 𝑛 ∗ 𝑧𝑐 ↔ 𝑛 =𝑣𝑓
𝑓𝑧 ∗ 𝑧𝑐
𝑣𝑓 =1000 ∗ 𝑣𝑐 ∗ 𝑓𝑧 ∗ 𝑧𝑐
𝐷𝑐𝑎𝑝 ∗ 𝜋
Milling
Boring/Drilling
𝑇𝑐 =𝐿𝑚
𝑣𝑐∗𝑓 [mm] / [rev/min]*[mm/rev]
𝑣𝑐 =𝜋 ∗ 𝐷𝑚 ∗ 𝑛
1000
𝑓 =𝐼
𝑛
𝑇𝑐 =𝐿𝑚𝐼
𝑇𝑐 =𝜋 ∗ 𝐷𝑚 ∗ 𝐿𝑚1000 ∗ 𝑣𝑐 ∗ 𝑓
Turning machining:
𝑇𝑐 =𝐿 ∗ 𝑃2 + 𝜋2 ∗ 𝑑2
𝑃 ∗ 𝑣𝑐 ∗ 1000
1
𝑓𝑀__= 𝑃2 + 𝜋2 ∗ 𝑑2
𝑃 ∗ 𝑣𝑐[𝑚𝑖𝑛 𝑚 ]
𝑓𝑀__ =𝑃 ∗ 𝑣𝑐 ∗ 1000
𝑃2 + 𝜋2 ∗ 𝑑2[𝑚𝑚 𝑚𝑖𝑛 ]
𝑇𝑐 =𝐿
𝑓𝑀_
Turning threading process time
f
M6=8476,34mm/min
fM10
=7630,74mm/min
fM14
=7268,14mm/min
fM18
=7066,65mm/min
fM22
=5783,67mm/min
fM30
=5937,69mm/min
fM45
=5090,38mm/min
fM52
=4894,78mm/min

39
Appendix 4
Appendix 4: Value Stream Map of the tool manufacturing process.
2 w
ee
ks2
day
s7
h2d
ays
7 h
8 h
25 h
2
day
19 h
Lead
tim
e:
290
Val
ue
Ad
din
g:66
2day
s1d
ay2d
ays
2day
s1d
ay1d
ay2d
ays
1day
5 d
ays
3 d
ays
4 d
ays
Lead
Cyc
leti
me
(C/T
): 8
h
Pro
cess
tim
e(S
/T):
1 d
ay
Ou
tsid
e
Sup
pli
ers
R-R
Stre
ss R
eli
ef
An
eal
ing
Pro
du
ct
Pla
nn
ing
Man
ufa
ctu
ring
En
gin
ee
rin
g
Qu
ota
tio
n
Engi
ne
er /
O
uts
ide
Pu
rch
asin
g
Mat
eri
al
sup
pli
er
Turn
ing
1
Cyc
leti
me
(C/T
): N
/AP
roce
ssti
me
(S/T
):7h
We
ldin
g
Cyc
le ti
me
(C/T
): N
/AP
roce
ss ti
me
(S/T
):7h
Lead
tim
e: 1
day
Lead
tim
e: 2
day
s
Lead
tim
e: 1
day
Turn
ing
2
Cyc
le ti
me
(C/T
) : N
/AP
roce
ssti
me
(S/T
) : 2
5h
Bo
rin
g
Cyc
le ti
me
(C/T
) : N
/AP
roce
ssti
me
(S/T
) : 1
9h
Ass
em
bly
Cyc
le ti
me
(C/T
): 4
hP
roce
ssti
me
(S/T
):4h
Mac
hin
ing
(Tu
rnin
g, B
ori
ng,
Th
read
ing,
Mil
lin
g)
Cyc
le ti
me
(C/T
): N
/AP
roce
ss ti
me
(S/T
):38
h
Lead
tim
e: 2
we
eks
Lead
tim
e: 1
day
Lead
tim
e: 1
we
ek
Lead
tim
e: 2
-3 w
ee
ksLe
ad t
ime
: 2w
ee
ks 2
day
sLe
ad t
ime
: 1 w
ee
k

40
Appendix 5
Appendix 5: Cross functional process map of the analyzed tool design and manufacturing process
De
sign
De
par
tme
nt
Pro
du
ctio
n P
lan
ne
rM
anu
fact
uri
ng
Engi
ne
ers
Too
lmak
er
"Bu
yer"
/ P
urc
has
ing
De
par
tme
nt
Ou
tsid
e s
up
pli
ers
Qu
ota
tio
n e
ngi
ne
er
/
Ou
tsid
e s
up
pli
er
Man
ufa
ctu
rin
g /
Ou
tsid
e
sup
pli
er
Ou
tsid
e s
up
pli
er
Are
all
d
ocu
me
nts
fi
nal
an
d
"re
leas
ed
"
Sen
d q
uo
tati
on
req
ue
sts
for
Pu
rch
ase
d It
em
s
De
sign
ate
wh
at c
om
po
ne
nts
ar
e:
1 ¤
Man
ufa
ctu
red
Ite
ms
2 ¤
Pu
rch
ase
d It
em
s.
Pro
du
ce to
ol d
esi
gn a
nd
d
raw
ings
Pla
n s
che
du
le fo
r m
anu
fact
uri
ng
the
M
anu
fact
ure
d It
em
s
Dis
trib
ute
ord
ere
d st
and
ard
co
mp
on
en
ts
and
raw
mat
eri
als
n
ee
de
d fo
r man
ufa
ctur
ed
ite
ms.
Man
ufa
ctu
re a
ll M
anu
fact
ure
d
Ite
ms
Is q
uo
tati
on
sa
tisf
acto
ry
Pac
kage
an
d d
istr
ibu
te ra
w
mat
eri
als.
Pro
du
ce q
uo
tati
on
for
Pu
rch
ase
d It
em
s
Sen
d P
urc
has
e o
rde
r fo
r raw
m
ate
rial
s.Do
es
fin
al
dra
win
gs
mat
ch
Pla
n s
che
du
le fo
r m
anu
fact
uri
ng
the
P
urc
has
ed
Ite
ms
Sen
d p
urc
has
e o
rde
rs fo
r st
d.c
om
po
ne
nt /
raw
mat
eri
al
Exe
cute
ph
ase
1 o
f m
anu
fact
uri
ng,
turn
ing
and
we
ldin
g, o
f Pu
rch
ased
Exe
cute
str
ess
reli
ef
ann
eal
ing
of P
urc
has
ed
It
em
Exe
cute
ph
ase
2 o
f m
anu
fact
uri
ng,
turn
ing
and
b
ori
ng,
of P
urc
has
ed
Ite
ms
Esti
mat
e in
div
idu
al p
roce
ss
and
lead
tim
e fo
r M
anu
fact
ure
d C
om
po
ne
nts
.
Set d
ead
lin
e w
he
n co
mp
on
en
ts n
ee
d to
be
fi
nis
he
d an
d a
vail
able
fo
r as
sem
bly
.
Fin
al a
sse
mb
ly o
f to
ol
De
sign
hu
b a
sse
mb
ly
and
pro
du
ce
do
cum
en
tati
on
Yes
No
Yes
No
No
Yes
Are
the
d
raw
ings
fi
nal
?
Yes
No
Are
ne
w
de
sign
s o
r d
raw
ings
for
too
ls/f
ixtu
res
req
uir
ed
?
No
Yes
No
21
2

41
Appendix 6
Appendix 6: Cross section and 3D-model visualization of the current tool design for the A1-series controllable pitch propeller hub.

42
Appendix 7
Appendix 7: Resulting function decomposition of the balancing and function testing flange.
Fun
ctio
ns
Sub-
func
tion
sTe
ch.s
olu
tio
n
Fix/
Seal
th
e h
ub
ass
em
bly
to
th
e t
est
fla
nge
Mat
ch f
lan
ges
guid
e p
ins
and
sh
aft
bo
lt p
atte
rn t
o h
ub
Re
pla
ceab
le p
late
s w
ith
siz
e-s
pe
cifi
c h
ole
pat
tern
s
Re
pla
ceab
le p
late
wit
h m
ult
iple
se
t o
f h
ole
s
On
e p
late
wit
h m
ult
iple
se
ts o
f h
ole
pat
tern
s
Seal
fla
nge
to
hu
bFl
ange
pla
te w
ith
no
n-d
isru
pte
d c
on
tact
are
a to
war
ds
hu
b s
eal
Lift
ing
eq
uip
me
nt
for
com
bin
ed
to
ol a
nd
hu
b a
sse
mb
lySa
fe li
fts
of
all m
ajo
r co
mp
on
en
tsC
E-ce
rtif
ied
lift
ing
de
vice
on
eac
h m
ajo
r co
mp
on
en
t/m
od
ule
De
lim
it a
nd
se
al h
ydra
uli
c sy
ste
ms
Seal
oil
dis
trib
uti
on
pip
e b
ush
ings
Exch
ange
able
bu
shin
g w
ith
se
al a
t ta
p e
nd
cap
s f
or
dif
fere
nt
pip
e s
ize
s
On
e s
tan
dar
diz
ed
bu
shin
g w
ith
se
al f
or
the
en
tire
pro
du
ct s
eri
es
Pre
ven
t o
il d
istr
ibu
tio
n p
ipe
ad
apte
r fr
om
tra
veli
ng
pas
t se
alA
dju
st t
op
tap
len
gth
to
pre
ven
t ad
apte
r tr
ave
l be
yon
d s
eal
Exch
ange
able
to
p t
aps
wit
h v
aryi
ng
len
gth
Re
pla
ceab
le t
ap w
ith
var
yin
g d
iam
ete
r
On
e t
ap w
ith
se
mic
ircu
lar
adap
tab
le b
ush
ings
fo
r se
lin
g
Re
pla
ceab
le t
ap, v
aryi
ng
len
gth
On
e t
ap w
ith
ad
apte
rs t
o a
dju
st le
ngt
h
Tele
sco
pic
ad
just
able
tap
-le
ngt
h
Pre
ven
t p
isto
n t
rave
l be
yon
d d
esi
gne
d m
axim
um
pit
ch
Co
nti
nu
ou
s le
vele
d s
urf
ace
be
twe
en
th
e t
op
of
the
hu
b a
nd
th
e f
lan
ge p
late
Ho
ld h
ub
ass
em
bly
du
rin
g st
atic
bal
anci
ng
Ho
ld f
or
ind
uce
d r
adia
l fo
rce
sSi
ze t
oo
l to
han
dle
to
tal h
ub
ass
em
bly
an
d t
oo
l we
igh
t
Pre
ven
t to
ol d
esi
gn f
rom
aff
ect
ing
bal
anci
ng
resu
lts
Too
l mu
st h
ave
axi
ally
ce
ntr
ed
mas
s ce
ntr
e
Seal
insi
de
of
pis
ton
to
tap
Pre
ven
t co
llis
ion
be
twe
en
pis
ton
an
d b
ott
om
tap
du
rin
g
max
imu
m p
itch

43
Appendix 8
Appendix 8: Resulting Pugh-matrixes from step 2 of the MFD method where multiple technical concepts for functions were identified.
Match flanges guide pins and shaft bolt pattern to hub.
Mo
du
lari
ty
Effi
cien
t co
mp
on
ent
asse
mb
ly
Des
ign
ed f
or
Man
ufa
ctu
rin
g
Des
ign
ed f
or
mac
hin
e
avai
lab
ility
Pro
du
ct f
amily
inte
grat
ion
Sum
+
Sum
-
One plate with multiple sets of hole
patterns - + - + 2 2
Replaceable plate with multiple set of
holes + + + - 3 1
Replaceable plates with size-specific
hole patterns.
Seal tap to inside of piston
Mo
du
lari
ty
Effi
cien
t co
mp
on
ent
asse
mb
ly
Des
ign
ed f
or
Man
ufa
ctu
rin
g
Des
ign
ed f
or
mac
hin
e
avai
lab
ility
Pro
du
ct f
amily
inte
grat
ion
Sum
+
Sum
-
Replaceable tap with varying diameter + - + + 3 1
Have one tap with split semicircular
adaptable bushing for sealing
Mo
du
lari
ty
Effi
cien
t co
mp
on
ent
asse
mb
ly
Des
ign
ed f
or
Man
ufa
ctu
rin
g
Des
ign
ed f
or
mac
hin
e
avai
lab
ility
Pro
du
ct f
amily
inte
grat
ion
Sum
+
Sum
-
Replaceable tap, varying lengths + - ++ + - 4 2
One tap with adapters to adjust length + - + + - 3 2
Telescopic adjustable tap-length
Technical Concepts and solutions
Evaluation Criteria
Reference concept
Reference concept
Reference concept
Technical Concepts and solutions
Evaluation Criteria
Technical Concepts and solutions
Evaluation Criteria
Prevent collision between piston and bottom tap during maximum pitch

44
Appendix 9
Appendix 9: Function-and-means tree of the balancing and function testing flange tool. Function and sub functions explained at the top of boxes while technical solutions are noted in their bottom half.
Bal
anci
ng
and
Fu
nct
ion
Te
st E
qu
ipm
en
t
1 Fi
xan
d s
eal
th
e h
ub
as
sem
bly
to t
he
te
st f
lan
geEx
chan
geab
lefl
ange
pla
te
wit
h m
ult
iple
se
ts o
f ho
les
and
no
n-d
isru
pte
d c
on
tact
1.1
Mat
ch f
lan
ges
guid
e p
ins
and
sh
aft
bo
lt p
atte
rn t
o h
ub
Re
pla
ceab
le p
late
wit
h
mu
ltip
le s
et o
f ho
les
3.1
Seal
insi
de
of p
isto
n
to t
ap
Re
pla
ceab
le t
ap w
ith
va
ryin
g d
iam
ete
r
3 D
eli
mit
an
d s
eal
hyd
rau
lic
syst
em
sEx
chan
geab
le b
ott
om
tap
san
do
il
dis
tr. p
ipe
bu
shin
gs.L
eve
led
bo
tto
m
surf
ace
on
fla
nge
pla
te.T
op
tap
len
gth
ad
just
ed
to p
reve
nt o
il d
istr
. pip
e
adap
ter f
rom
co
llid
ing
wit
h e
nd
cap
.
3.2
Pre
ven
t co
llis
ion
be
twe
en
p
isto
n a
nd
bo
tto
m t
ap d
uri
ng
max
imu
m p
itch
Re
pla
ceab
le t
ap, v
aryi
ng
leng
th
2 Li
ftin
g /
Logi
stic
s
CE-
cert
ifie
d lif
tin
g d
evi
ce
on
eac
h m
ajo
r co
mp
on
en
t/m
od
ule
4 H
old
hu
b a
sse
mb
ly
du
rin
g st
atic
bal
anci
ng
Size
too
l to
han
dle
tota
l h
ub
ass
em
bly
an
d to
ol
we
igh
t an
d h
ave
axi
ally
ce
ntr
ed
mas
s ce
ntr
e 3.5
Pre
ven
t oil
dis
tr.
pip
e a
dap
ter
fro
m
trav
eli
ng
pas
t se
alA
dju
st to
p ta
p le
ngt
h to
p
reve
nt a
dap
ter t
rave
l b
eyo
nd
se
al
3.4
Seal
oil
dis
trib
uti
on
p
ipe
bu
shin
gs
Exch
ange
able
bu
shin
g w
ith
se
al a
t ta
p e
nd
cap
s
for
dif
fere
nt p
ipe
size
s
1.2
Seal
fla
nge
to h
ub
No
n-d
isru
pte
d c
on
tact
are
a to
war
ds
hu
b s
eal
3.3
Pre
ven
t pis
ton
tra
vel
be
yon
d d
esi
gne
d
max
imu
m p
itch
Le
vele
d s
urf
ace
be
twee
n
the
top
of t
he
hu
b a
nd
th
e fl
ange
pla
te
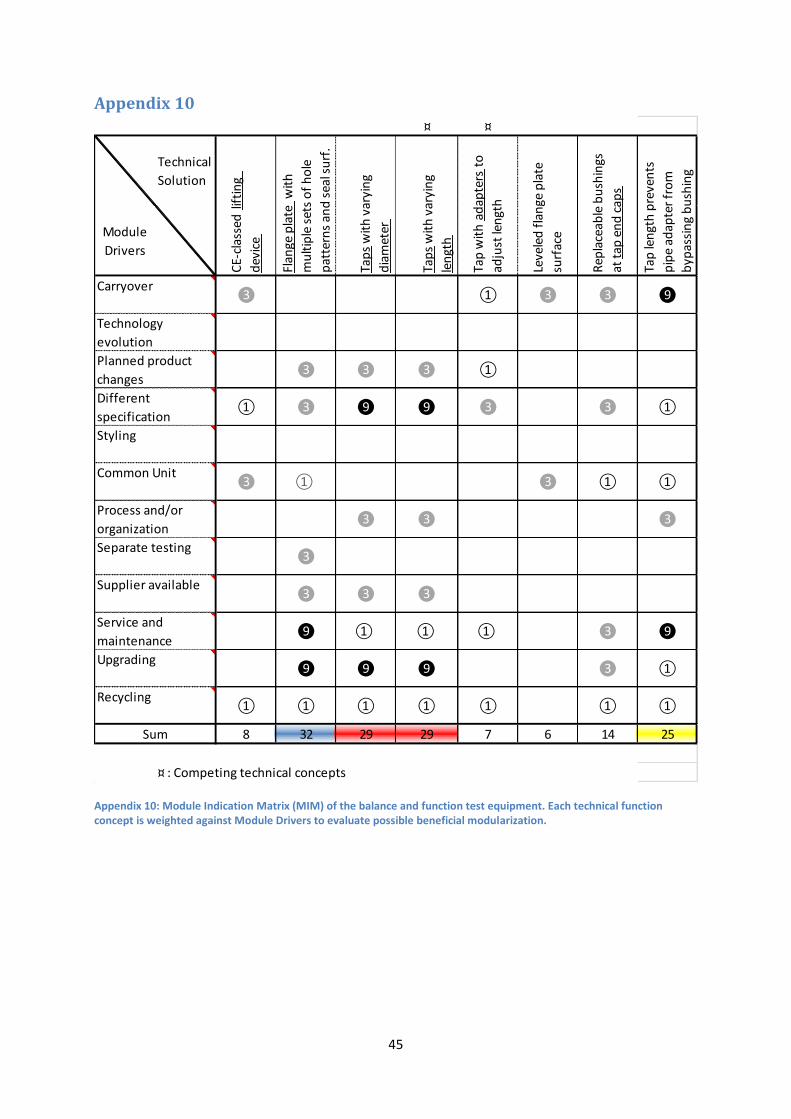
45
Appendix 10
Appendix 10: Module Indication Matrix (MIM) of the balance and function test equipment. Each technical function concept is weighted against Module Drivers to evaluate possible beneficial modularization.
¤ ¤
Technical
Solution
Module
Drivers
❸ ① ❸ ❸ ❾
❸ ❸ ❸ ①
① ❸ ❾ ❾ ❸ ❸ ①
❸ ① ❸ ① ①
❸ ❸ ❸
❸
❸ ❸ ❸
❾ ① ① ① ❸ ❾
❾ ❾ ❾ ❸ ①
① ① ① ① ① ① ①
8 32 29 29 7 6 14 25
¤ : Competing technical concepts
Tap
len
gth
pre
ven
ts
pip
e ad
apte
r fr
om
byp
assi
ng
bu
shin
g
CE-
clas
sed
lif
tin
g
dev
ice
Flan
ge p
late
wit
h
mu
ltip
le s
ets
of
ho
le
pat
tern
s an
d s
eal s
urf
.
Tap
s w
ith
var
yin
g
dia
met
er
Tap
wit
h a
dap
ters
to
adju
st le
ngt
h
Rep
lace
able
bu
shin
gs
at t
ap e
nd
cap
s
Leve
led
fla
nge
pla
te
surf
ace
Sum
Tap
s w
ith
var
yin
g
len
gth
Recycling
Upgrading
Service and
maintenance
Styling
Common Unit
Process and/or
organization
Separate testing
Supplier available
Carryover
Technology
evolution
Planned product
changes
Different
specification

46
Appendix 11
Appendix 11: Summary of how function related technical solutions were split onto three respectively two module concepts during the MFD process.
3 m
od
ule
s -
alt
. 13
mo
du
les
- a
lt. 2
Tap
len
gth
pre
ven
ts p
ipe
ad
apte
r fr
om
byp
assi
ng
bu
shin
gTa
p le
ngt
h p
reve
nts
pip
e a
dap
ter
fro
m b
ypas
sin
g b
ush
ing
CE-
clas
sed
lift
ing
de
vice
CE-
clas
sed
lift
ing
de
vice
Bu
shin
gs a
t ta
p e
nd
cap
sB
ush
ings
at
tap
en
d c
aps
Tap
s w
ith
var
yin
g le
ngt
hTa
p w
ith
ad
apte
rs t
o a
dju
st le
ngt
h
Tap
s w
ith
var
yin
g d
iam
ete
rTa
ps
wit
h v
aryi
ng
dia
me
ter
CE-
clas
sed
lift
ing
de
vice
CE-
clas
sed
lift
ing
de
vice
Bu
shin
gs a
t ta
p e
nd
cap
sB
ush
ings
at
tap
en
d c
aps
Flan
ge p
late
wit
h m
ult
iple
se
ts o
f h
ole
pat
tern
sFl
ange
pla
te w
ith
mu
ltip
le s
ets
of
ho
le p
atte
rns
CE-
clas
sed
lift
ing
de
vice
CE-
clas
sed
lift
ing
de
vice
2m
od
ule
s Tap
len
gth
pre
ven
ts p
ipe
ad
apte
r fr
om
byp
assi
ng
bu
shin
g
CE-
clas
sed
lift
ing
de
vice
Bu
shin
gs a
t ta
p e
nd
cap
s
Tap
s w
ith
var
yin
g le
ngt
h
Tap
s w
ith
var
yin
g d
iam
ete
r
CE-
clas
sed
lift
ing
de
vice
Bu
shin
gs a
t ta
p e
nd
cap
s
Flan
ge p
late
wit
h m
ult
iple
se
ts o
f h
ole
pat
tern
s
CE-
clas
sed
lift
ing
de
vice

47
Appendix 12
Appendix 12: Original sketches of the evaluated set of module interface designs. Designs 1-4 consists of 3modules while 5-6 consists of 2modules.

48
Appendix 13
Appendix 13: The resulting Pugh-matrix from evaluating the set of module interface designs.
Des
ign
Fo
r A
ssem
bly
Des
ign
Fo
r
Man
ufa
ctu
rin
g
Pro
du
ct F
amily
Inte
grat
ion
Forc
e Tr
ansm
itta
nce
bet
wee
n m
od
ule
s
Sum
+
1
2 + + 2
3 - + + 1
4 - + - -1
5 + + - - 0
6 + ++ - - 1
Module
concept
Reference concept
Evaluation Criteria

49
Appendix 14
Appendix 14: Mapping of the A1 series hub seals and diameter ranges occupied by shaft bolts and guide pins depending on hub size.

50
Appendix 15
Interface parameter Parameter value [mm]
Top tap inner diameter 135
Top tap total module length 350
Top tap // Flange plate interface diameter 260
Top tap interface plate thickness at bolted joints 30
Flange plate countersink at top tap interface 3
Flange plate countersink at bottom tap interface 20
Flange plate-60/86 // Bottom tap interface diameter 340
Flange plate-66/94 // Bottom tap interface diameter 365
Flange plate-72/102 // Bottom tap interface diameter 400
Flange plate-79/111 // Bottom tap interface diameter 440
Flange plate-121 // Bottom tap interface diameter 480
Flange plate-132 // Bottom tap interface diameter 520 Appendix 15: Summary of the intermodular interface parameters.

51
Appendix 16
Module specifications, 3-module concept
Top Tap Flange Plate Bottom Tap
Replaceable oil distribution pipe bushing seal with varying diameters.*
Shaft bolt and guide pin hole patterns mimics hub.
Seal pipe bushing.
Tap long enough to accommodate for both longest oil distribution pipe and pitch stroke in product series, >135mm internal protrusion, , and provide sufficient length for safe maneuverability during static balancing, >300mm.
Withstand force transmitted from top tap induced by A-system.*
Provide seal towards flange plate.
Tap inner diameter accommodates widest oil distribution pipe in product series, >=135mm internal tap diameter.
Withstand force transmitted from bottom tap induced by A-system.*
Withstand A-system exterior pressure, 120bar.
Withstand A-systems internal pressure, 120bar.
Withstand SP-system internal pressure, 5bar.
Non-through threaded hole pattern facing flange plate.
Through bolted joint hole pattern for flange plate.
Leveled bottom surface. Tap length and outer diameter mimics shaft flange.*
Pipefitting for hydraulic fluid for SP-system.
Provide seal towards top tap.
Create seal for unused through holes.
*See Appendix 17 for size-specific data. **See Appendix 14 for hole patterns and sealing overlaps. Appendix 16: Module specific technical specifications for the three module concept.

52
Appendix 17
Appendix 17: Summary of the vital model size specific data referred to in module specifications.
Mo
de
l siz
e60
6672
7986
9410
211
112
113
2
Oil
dis
triu
tio
n p
ipe
dia
me
ter
60 m
m60
mm
75 m
m75
mm
90 m
m90
mm
100
mm
100
mm
115
mm
115
mm
Shaf
tfla
nge
tap
len
gth
190
mm
202
mm
217
mm
240
mm
267
mm
283
mm
307
mm
325
mm
355
mm
384
mm
Shaf
tfla
nge
tap
dia
me
ter
240
mm
260
mm
280
mm
305
mm
340
mm
365
mm
400
mm
440
mm
480
mm
520
mm
Ind
uce
d a
xial
fo
rce
on
to
p t
ap
exp
ose
d t
o A
-sys
tem
pre
ssu
re15
0.80
kN
150.
80 k
N13
1.71
kN
131.
71 k
N10
8.38
kN
108.
38 k
N90
.48
kN90
.48
kN60
.08
kN60
.08
kN
Ob
s. A
ssu
med
inn
er t
ap
dia
met
er=
140m
m
Ind
uce
d a
xial
fo
rce
on
bo
tto
m t
ap
by
A-s
yste
m p
ress
ure
508.
94 k
N60
3.19
kN
685.
89 k
N82
3.73
kN
1013
.16
kN11
79.2
8 kN
1413
.72
kN17
30.3
9 kN
2046
.83
kN24
23.8
2 kN

53
Appendix 18
Appendix 18: Visualizing of the bolts and manufactured components included in the top tap module before and after assembly with bolts and O-ring seals.
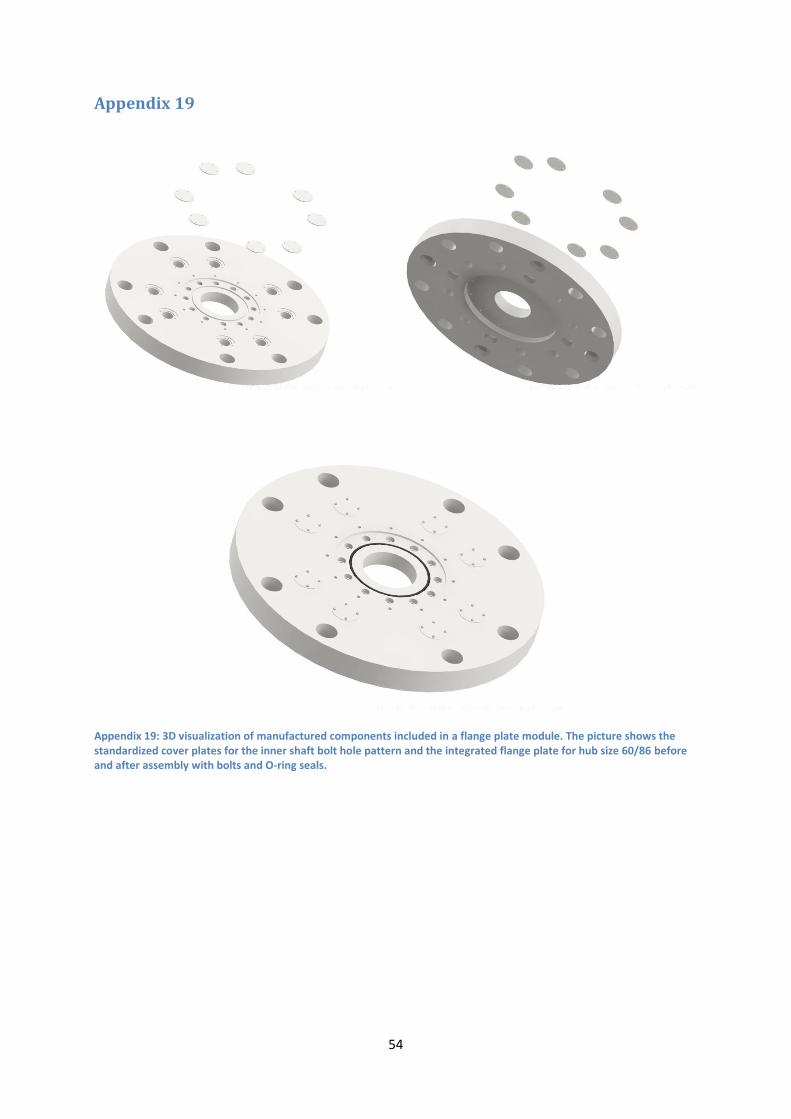
54
Appendix 19
Appendix 19: 3D visualization of manufactured components included in a flange plate module. The picture shows the standardized cover plates for the inner shaft bolt hole pattern and the integrated flange plate for hub size 60/86 before and after assembly with bolts and O-ring seals.

55
Appendix 20
Appendix 20: 3D representation of bolts, seals, and manufactured components included in the bottom tap module for hub size 60 before and after assembly.
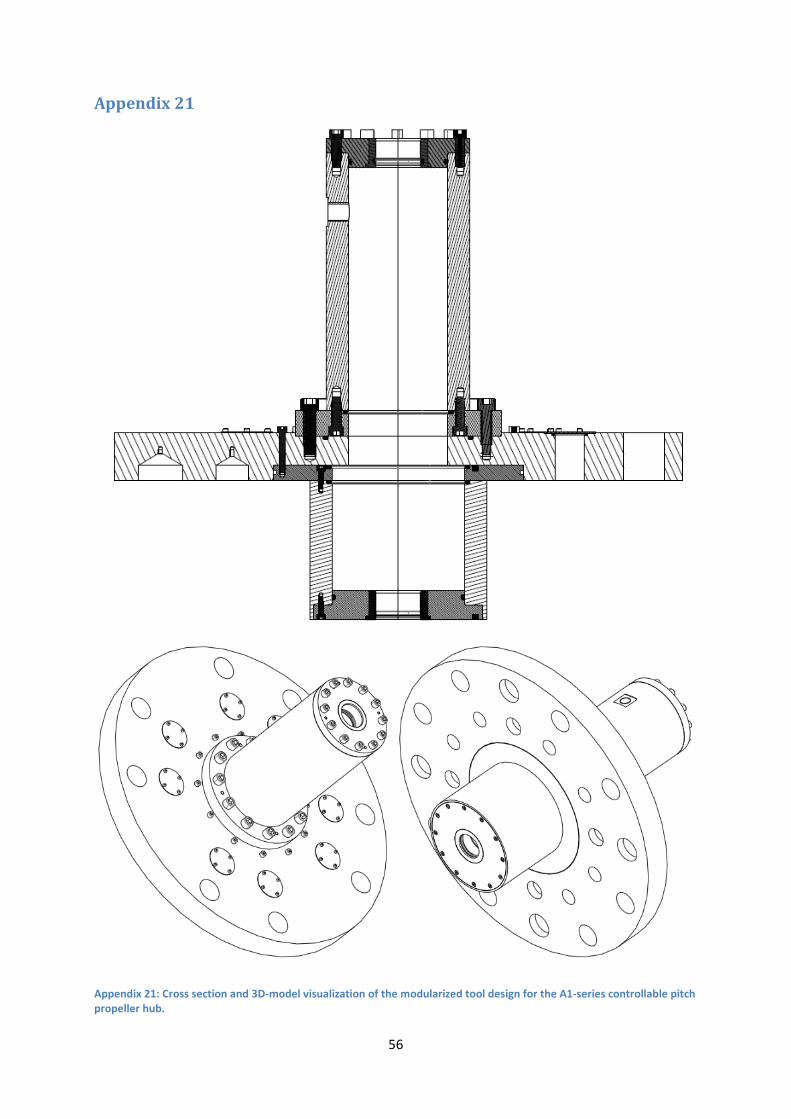
56
Appendix 21
Appendix 21: Cross section and 3D-model visualization of the modularized tool design for the A1-series controllable pitch propeller hub.

57
Appendix 22
Appendix 22: Compilation of components included in the size 60/86 tool. It shows the bolted replaceable top endcap, the bolted joint between the carry-over top tap and the flange plate, and the size specific bolted bottom taps for size 60 and 86.

58
Appendix 23
Appendix 23: Summary of calculated process times, lead times, and total cost estimates for manufacturing and product development for the current tool design as well as the modular concept. This is shown for an initial dual tool set, a subsequent tool set, and the full tool series. Calculations assumed employees work 40h/week, one operator doing the manufacturing, one engineer doing product development for the current design, and two engineers working parallel for the module concept design.
Initial Tool set: 60/86
Current Design Process Time [h] Lead Time [h] Cost [kr]
Manufacturing 132.9 h 536.3 h 148 503.64 kr
Prod. Development 185.4 h 185.4 h 92 682.93 kr
Total: 318.3 h 721.7 h 241 186.57 kr
18 week
Module Concept Process Time [h] Lead Time [h] Cost [kr]
Manufacturing 115.4 h 465.4 h 126 364.20 kr
Prod. Development 226.8 h 135.4 h 113 414.63 kr
Total: 342.2 h 600.8 h 239 778.83 kr
15 week
Results of process change: 23.9 h -120.9 h -1 407.74 kr
Subsequent Tool set: 66/94
Current Design Process Time [h] Lead Time [h] Cost [kr]
Manufacturing 137.3 h 553.8 h 154 387.34 kr
Prod. Development 82.9 h 41.5 h 41 463.41 kr
Total: 220.2 h 595.2 h 195 850.76 kr
15 week
Module Concept Process Time [h] Lead Time [h] Cost [kr]
Manufacturing 88.9 h 358.8 h 99 200.24 kr
Prod. Development 54.9 h 36.6 h 27 439.02 kr
Total: 143.8 h 395.4 h 126 639.27 kr
10 week
Results of process change: -76.4 h -199.9 h -69 211.49 kr
Full Tool Series: 60-132
Current Design Process Time [h] Lead Time [h] Cost [kr]
Manufacturing 724.4 h 2922.6 h 827 232.68 kr
Prod. Development 517.1 h 351.2 h 258 536.59 kr
Total: 1241.5 h 3273.8 h 1 085 769.26 kr
Module Concept Process Time [h] Lead Time [h] Cost [kr]
Manufacturing 501.0 h 2021.3 h 574 428.49 kr
Prod. Development 461.6 h 263.4 h 230 792.68 kr
Total: 962.6 h 2284.7 h 805 221.17 kr
Results of process change: -278.9 h -989.1 h -280 548.09 kr

59
Appendix 24
Appendix 24: Proposed future state cross-functional process map for tool development.
De
sign
De
par
tme
nt
Pro
du
ctio
n P
lan
ne
rM
anu
fact
uri
ng
Engi
ne
er
Too
lmak
er
"Bu
yer"
/ P
urc
has
ing
De
par
tme
nt
Ou
tsid
e s
up
pli
ers
Qu
ota
tio
n e
ngi
ne
er
/
Ou
tsid
e s
up
pli
er
Man
ufa
ctu
rin
g /
Ou
tsid
e
sup
pli
er
Are
all
d
ocu
me
nts
fi
nal
an
d
"re
leas
ed
"
Sen
d q
uo
tati
on
req
ue
sts
for
Pu
rch
ase
d It
em
s
De
sign
ate
wh
at c
om
po
ne
nts
ar
e:
¤ M
anu
fact
ure
d It
em
s¤
Std
.co
mp
./R
awM
ate
rial
¤
Pu
rch
ase
d It
em
s.
Pro
du
ce to
ol d
raw
ings
Pla
n s
che
du
le fo
r m
anu
fact
uri
ng
the
M
anu
fact
ure
d It
em
s
Dis
trib
ute
ord
ere
d st
d.c
om
p./
raw
mat
eri
als
Man
ufa
ctu
re a
ll M
anu
fact
ure
d
Ite
ms
Is q
uo
tati
on
sa
tisf
acto
ry
Pac
kage
an
d d
istr
ibu
te ra
w
mat
eri
als.
Pro
du
ce q
uo
tati
on
for
Pu
rch
ase
d It
em
s
Sen
d P
urc
has
e o
rde
r fo
r raw
m
ate
rial
s.Do
es
fin
al
dra
win
gs
mat
ch
Pla
n s
che
du
le fo
r m
anu
fact
uri
ng
the
P
urc
has
ed
Ite
ms
Sen
d p
urc
has
e o
rde
rs fo
r st
d.c
om
po
ne
nt /
raw
mat
eri
al
Exe
cute
the
m
anu
fact
uri
ng
of
Pu
rch
ase
d It
em
s
Esti
mat
e in
div
idu
al p
roce
ss
and
lead
tim
e fo
r M
anu
fact
ure
d C
om
po
ne
nts
.
Set d
ead
lin
e w
he
n co
mp
on
en
ts n
ee
d to
be
fi
nis
he
d an
d a
vail
able
fo
r as
sem
bly
.
Fin
al a
sse
mb
ly o
f to
ol
Pro
du
ce d
ocu
me
nta
tio
n fo
r o
rde
red
hu
b a
sse
mb
ly
Yes
No
Yes
No
No
Yes
Are
the
d
raw
ings
fi
nal
?Ye
s
No
Are
ne
w
dra
win
gs fo
r to
ols
/fix
ture
s re
qu
ire
d?
No
Yes
No
De
sign
par
ame
triz
ed
hu
b
asse
mb
ly
Par
ame
triz
e to
ol d
esi
gn f
or
hu
b s
eri
es
Is
par
ame
triz
ed
to
ol d
esi
gn
fin
al?
Yes
No

60
Appendix 25
Appendix 25: Proposed future state value stream map for static balancing and function test of A1 controllable pitch propeller hub assemblies.
2 w
ee
k1
day
11.0
h1
day
3.0
h1
day
14.5
h1
day
0.5
h1
day
4.0
hLe
ad t
ime
:15
3
Val
ue
Ad
din
g:33
.0
Lead
Cyc
le ti
me
(C/T
): N
/AP
roce
ss ti
me
(S/T
):15
hC
ycle
tim
e (C
/T):
N/A
Pro
cess
tim
e (S
/T):
1h
Ou
tsid
e
Sup
pli
ers
R-R
Pro
du
ct
Pla
nn
ing
Man
ufa
ctu
ring
En
gin
ee
rin
g
Qu
ota
tio
n
Engi
ne
er /
O
uts
ide
Pu
rch
asin
g
Mat
eri
al
sup
pli
er
Turn
ing
1
Cyc
leti
me
(C/T
): N
/AP
roce
ssti
me
(S/T
): 1
1h
Mil
lin
g
Cyc
le ti
me
(C/T
) : N
/AP
roce
ssti
me
(S/T
) : 3
h
Bo
rin
g /
Thre
adin
g
Ass
em
bly
Cyc
le ti
me
(C/T
): N
/AP
roce
ssti
me
(S/T
):1h
Turn
ing
/ P
ress
ing
Cyc
le ti
me
(C/T
): N
/AP
roce
ss ti
me
(S/T
):12
h
Lead
tim
e: 2
we
eks
Lead
tim
e: 1
day
Lead
tim
e: 2
we
eks
Lead
tim
e: 3
-4 w
ee
ks
Lead
tim
e:3
-4w
ee
ks
Cyc
le ti
me
(C/T
) : N
/AP
roce
ssti
me
(S/T
) : 1
4,5h
Ass
em
bly
Cyc
le ti
me
(C/T
) : N
/AP
roce
ssti
me
(S/T
) : 0
,5h
Bo
rin
g /
Thre
adin
gA
sse
mb
lyM
illi
ng
Cyc
le ti
me
(C/T
): N
/AP
roce
ss ti
me
(S/T
):4,
5h