streaming video 2015 04 10 - svod - the battle begins
TRANSCRIPT

DISCLOSURE APPENDIX AT THE BACK OF THIS REPORT CONTAINS IMPORTANT DISCLOSURES, ANALYST CERTIFICATIONS, AND THE STATUS OF NON-US ANALYSTS. US Disclosure: Credit Suisse does and seeks to do business with companies covered in its research reports. As a result, investors should be aware that the Firm may have a conflict of interest that could affect the objectivity of this report. Investors should consider this report as only a single factor in making their investment decision.
CREDIT SUISSE SECURITIES RESEARCH & ANALYTICS BEYOND INFORMATION®
Client-Driven Solutions, Insights, and Access
10 April 2015
Asia Pacific/Australia
Equity Research
Radio & TV Broadcasting (Media (AU)/Telecommunications (AU))
Streaming video THEME
SVOD: The battle begins
■ Proven demand for SVOD: Experience overseas demonstrates proven
demand for SVOD. Netflix is in almost 40% of US Internet homes (over 37mn
subs), with c. 60% total penetration including Hulu/Amazon. SVOD has grown
quickly in the UK (estimated c. 25% broadband household penetration).
■ Australian user base to grow rapidly; we forecast 1.5mn subs by
yearend: We anticipate strong demand for SVOD in Australia, driven by: (1)
low price points; (2) quality content; (3) adoption of connected devices, e.g.
Apple TV and Google Chromecast; and (4) distribution deals with Telcos.
■ $700mn industry revenue by 2023; room for three profitable players:
We expect SVOD penetration in Australia to grow to US levels of 60% of
broadband households over time and for industry revenue of over $700mn
by 2023. Netflix, Stan and Presto all have compelling content offerings, and
we do not expect a huge difference in market share among the three. We
provisionally model Netflix to take the highest share (40%) due to its global
reach and track record. We forecast 33% share for Stan and 27% for Presto
(due to its higher price point of A$14.99 for movies and TV).
■ Strong start for Stan: NEC and FXJ launched their SVOD JV Stan at the
end of January and signed over 100k subscribers within six weeks. We
forecast distribution deals to help Stan reach 500k subscribers by year-end
and 2mn by 2023. Our expectation that the market will be fragmented puts a
cap on SVOD valuations. We value Stan at A$312mn on a DCF basis.
Figure 1: Australian SVOD subscriber forecasts
Source: ABS, Credit Suisse estimates. Note: Penetration of Broadband Households.
0%
10%
20%
30%
40%
50%
60%
70%
0
1,000
2,000
3,000
4,000
5,000
6,000
7,000
2015 2016 2017 2018 2019 2020 2021 2022 2023
Stan Presto Netflix
Gross Penetration Net Penetration
Research Analysts
Fraser McLeish
61 2 8205 4069
Lucas Goode
61 2 8205 4431

10 April 2015
Streaming video 2
Table of contents Executive summary – expect rapid growth in SVOD 3
SVOD penetration in the United States at 60% 3 We forecast over 3mn SVOD subscribers in Australia by 2017 and 6mn by 2023 4 Market share – room for three players 4 Stan – we value at A$312mn on DCF basis 5
The SVOD model – quality content at low price 6 Content is king 6 Pricing – services priced at A$8.99 to A$14.99 7 Adoption of connected devices increasing 8 Bandwidth and data caps largely sufficient for HD streaming 9 Distribution deals to help drive adoption 9
The experience overseas 11 Netflix now in 40% of broadband-connected households in the US 11 US market worth over US$4bn in 2014 12 UK SVOD penetration has reached 25% 12 UK market projected to be worth almost £800m by 2018 13
Australian SVOD market forecasts 14 Penetration forecast to reach 60% of broadband households by 2023F 14 Australian SVOD market worth $700mn by 2023 15 Netflix to take largest share; room for three profitable players 16
Stan forecasts – breakeven in year 3 18 Stan revenue and market share forecasts 18 Stan breakeven by year 3 18 Stan financial forecasts 19 Base case valuation of A$312mn 20
SVOD valuation summary – valuation upside muted 21 Appendix - Impact of SVOD on linear TV 22
US and UK ad spend still growing despite audience declines 22 SVOD doesn't necessarily destroy live viewing 22 Pay TV 'cord cutting' not widespread in US 23

10 April 2015
Streaming video 3
Executive summary – expect rapid growth in SVOD
We expect uptake subscription video on demand (SVOD) in Australia to grow rapidly following
the launch of three major services in the past three months (Stan, Presto and Netflix).
The initial signs are positive with Stan having said that it is on track for over 100k
subscribers by mid-March (six weeks from launch).
The key attractions of SVOD are the low price point (c. A$10 per month), a wide range of
on demand content and the ability to access the service over multiple devices. All
operators have been signing distribution deals with Telcos and ISPs, and we expect this to
be a key take-up driver. We expect a high degree of overlap, with customers subscribing
to more than one service. Figure 2 contains a summary of the main SVOD services.
Figure 2: Summary of Australian SVOD services
Source: Company websites and press releases
SVOD penetration in the United States at 60%
The success of Netflix in the US demonstrates that there is proven demand for SVOD.
Netflix reported almost 38mn domestic streaming subscribers in 4Q14, equivalent to
almost 40% penetration of US broadband households (31% of total households). Our US
Internet team expects strong subscriber growth to continue, with Netflix projected to reach
56mn domestic subs by 2018.
Nielsen says total penetration of SVOD services (including Amazon Prime Instant Video
and Hulu Plus, was 55.5% of US TV households in December 2014, implying penetration
of broadband households of over 60%. This is in a market with multichannel pay-TV
Service Price Devices Key content (exclusive content in bold)
$10 p/mth
*HD available
• Android• Apple TV (via
AirPlay)• Chromecast• iOS• PC
• Better Call Saul (AMC)• Gallipoli (original)• Transparent (Amazon)• Mozart in the Jungle (Amazon)• Community (NBC)• Star Trek (CBS)• CSI (CBS)• Ray Donovan (Showtime)• Dexter (Showtime)
• Californication (Showtime)• Doctor Who (BBC)• Top Gear (BBC)• Viacom children’s and general
entertainment content (Nickelodeon, MTV, Comedy Central)
• Movies from MGM, Paramount and Sony
$9.99 p/mth(TV only)$14.99 p/mth(incl movies)
*SD only
• Android• Chromecast• iOS• PC
• Boardwalk Empire (HBO)• Entourage (HBO)• Rome (HBO)• True Blood (HBO)• The Sopranos (HBO)• The Wire (HBO)• Modern Family (Fox)• Ray Donovan (Showtime)
• Dexter (Showtime)• Sons of Anarchy (Fox)• Homeland (Fox)• Californication (Showtime)• Viacom children’s and general
entertainment content • Movies from MGM, Disney,
Universal and Sony
$8.99 p/mth(1 device, SD)$11.99 p/mth(2 devices, HD)$14.99(4 devices, 4K)
*HD and Ultra HD available
• Android• Apple TV• Chromecast• iOS• PC• Playstation• Smart TVs• XBox
• House of Cards (original)• Orange is the New Black
(original)• Bloodline (original)• Marco Polo (original)• Daredevil (original)
• Lost (Disney)• Heroes (Universal)• Suits (Universal)• Homeland (Fox)• Arrow (Warner)• Movies from Warner, Sony,
MGM and Universal
$9.99 p/mthfor streaming
• Most devices (no Apple TV)
• 117k subscribers at Dec 2014 (down from 123k in June)• c70% are streaming subs (also offer DVD and Blu Ray)

10 April 2015
Streaming video 4
penetration of c. 85%. Nielsen data shows that 31% of SVOD users in the United States
subscribe to more than one service.
The UK has also seen a rapid uptake of SVOD. Netflix UK launched in 2012, and we
estimate SVOD penetration is already at 25% of broadband households based on
research by MTM and Futuresource Consulting.
We forecast over 3mn SVOD subscribers in Australia by 2017 and 6mn by 2023
We forecast SVOD uptake in Australia to follow a similar path to the UK and ultimately
achieve similar levels of penetration as the US.
We forecast 1.5mn SVOD subscribers by the end of 2015, with uptake driven by Telco
distribution deals. We forecast 3.2mn total SVOD subscribers in Australia by 2017
(37% penetration of broadband households) and 6.2mn subscribers by 2023 (60%
gross penetration of broadband households). Assuming half of all subscribers take
more than one service, this implies net penetration of c. 40% of broadband households
(36% of total households).
Figure 3: SVOD penetration of broadband households Figure 4: Australian SVOD subscription forecasts
Source: Company data, Statistica, MTM, HIS, ONS. Source: Credit Suisse estimates.
Market share – room for three players
We believe that the Australian SVOD market will be large enough to support three strong
players. We forecast total SVOD industry revenues to grow to c. A$700mn by 2023,
equivalent to c. 12% of total home entertainment and pay-TV subscription revenues
(compared to the US where SVOD already accounts for 23% of home entertainment
industry revenue in 2014).
We expect all three players to have compelling content offerings and for a high proportion
of customers to subscribe to more than one service. Differences in price points and
distribution partnerships will be a key driver of market share, in our view.
It is very early to try to forecast market shares, but on the basis of what we know to date,
we have made some provisional forecasts. Given the strength of the offerings, we do not
expect a significant gap in market shares among the three services. We assume:
■ Netflix – we forecast Netflix to be the number-one provider (a 40% market share
longer term). This reflects its strong track record in other markets and its global reach
providing the ability to invest in own produced content.
■ Stan – Stan has got off to a good start and has signed up a strong slate of content
deals. Its owners are committed to the space, and it has the simplest offering in terms
of price. We forecast Stan to achieve c. a 33% market share in the longer term.
■ Presto – Presto has the strongest distribution deals so we expect initial rapid uptake
as Telstra is providing 6m free to its new mobile and broadband customers. However,
Presto has the highest price point of the three operators (A$14.99 for movies and TV
39%
16%
60%
25%
0%
US UK Australia
Netflix Other
0%
10%
20%
30%
40%
50%
60%
70%
0
1,000
2,000
3,000
4,000
5,000
6,000
7,000
2015 2016 2017 2018 2019 2020 2021 2022 2023
Subscribers Net Penetration Gross Penetration

10 April 2015
Streaming video 5
bundled), so its content has to be meaningfully better in order to compete. We expect
Foxtel's cannibalisation dilemma to hold Presto back in terms of commitment to the
SVOD space. We forecast Presto to have 27% market share longer term.
Figure 5: SVOD subscribers by service Figure 6: Subscriber market share by service
Source: Credit Suisse estimates Source: Credit Suisse estimates
Stan – we value at A$312mn on DCF basis
Given our bullish outlook on SVOD subscriber growth, we believe that Stan can reach
500k subs by the end of 2015 and 750k subscribers by the end of 2016.
We forecast cash breakeven pre-marketing costs in 2016 and cash breakeven on a fully
allocated basis in 2017 (NEC has previously said that it expects breakeven on a pre-
marketing basis at 400-450k subs).
On a DCF basis, we value Stan at A$312mn (for 100%), equivalent to 9x FY20F EBITDA.
Whilst we expect the market to be large in terms of subscribers, the low price of the
product and our expectation that the market will be relatively fragmented would put a cap
on potential valuations for all players.
Figure 7: Stan summary financial forecasts
Source: Credit Suisse estimates. Note: Only includes cash marketing costs. Contra provided by partners not included.
0
500
1,000
1,500
2,000
2,500
3,000
2015 2016 2017 2018 2019 2020 2021 2022 2023
Netflix Stan Presto
20%
25%
30%
35%
40%
45%
2015 2016 2017 2018 2019 2020 2021 2022 2023
Stan Presto Netflix
2015 2016 2017 2018 2019 2020 2021 2022 2023
Year End Subs 500 750 1,050 1,260 1,449 1,630 1,793 1,937 2,072
Growth 50% 40% 20% 15% 13% 10% 8% 7%
Revenue ($m) 13 68 98 126 148 168 187 203 219
Expenses 43 65 78 96 109 120 129 136 142
EBITDA pre-marketing -30 4 20 30 38 48 58 68 77
Margin NM 5% 21% 23% 26% 29% 31% 33% 35%
Marketing Costs 18 10 13 12 13 14 15 15 16
EBITDA fully allocated -48 -6 7 17 26 34 43 52 60
Margin NM -9% 7% 14% 17% 20% 23% 26% 28%
10 April 2015
Streaming video 6
The SVOD model – quality content at low price
The rapid uptake of SVOD services around the world has been driven by a number of key
factors:
■ Content: Depth and quality of content is a necessity in attracting and retaining
customers and is the key differentiator between services.
■ Low price point: The low c. A$10 per month price point is key as it is a relatively small
commitment and means that consumers can generally afford more than one service.
We note that SVOD is particularly cheap relative to traditional pay-TV.
■ Availability of devices and fast broadband: Streaming requires connected devices
(e.g., Apple TV, connected smart TVs, Chromecast), fast Internet connections and
large data plans (Netflix is responsible for approximately one-third of US traffic).
■ Distribution: Partnerships with Telcos can provide a boost to subscriber acquisition
and retention. These arrangements also can include unmetered streaming.
We look at these issues in relation to the Australian market in more detail in this report.
Content is king
Managing the content mix is key to the SVOD model. The low-cost nature of the service
means that the content budget is relatively limited (when compared to pay-TV or
advertising funded FTA).
As a result, SVOD content tends to consist of a large library of older and typically non-
exclusive shows mixed with enough exclusive/proprietary and recent content to
differentiate itself from competitors and keep consumers coming back.
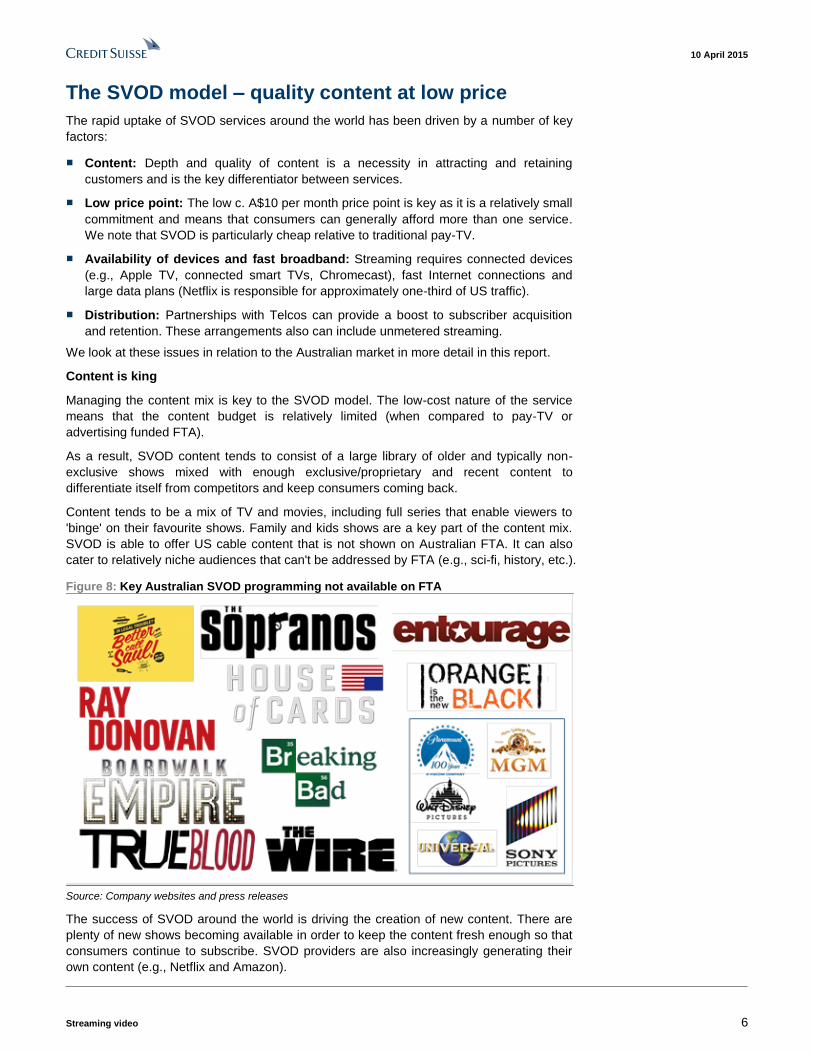
Content tends to be a mix of TV and movies, including full series that enable viewers to
'binge' on their favourite shows. Family and kids shows are a key part of the content mix.
SVOD is able to offer US cable content that is not shown on Australian FTA. It can also
cater to relatively niche audiences that can't be addressed by FTA (e.g., sci-fi, history, etc.).
Figure 8: Key Australian SVOD programming not available on FTA
Source: Company websites and press releases
The success of SVOD around the world is driving the creation of new content. There are
plenty of new shows becoming available in order to keep the content fresh enough so that
consumers continue to subscribe. SVOD providers are also increasingly generating their
own content (e.g., Netflix and Amazon).
10 April 2015
Streaming video 7
All three providers have announced a series of deals with major studios to date:
■ Stan: Key suppliers include AMC Networks, CBS/Showtime, NBCUniversal, MGM,
Village Roadshow, BBC Worldwide, Viacom and Sony Pictures. Exclusive shows
include Better Call Saul, Community and Amazon original Transparent.
■ Netflix: Major studio deals include Disney, Fox, NBCUniversal, Warner Bros and
Village Roadshow. Key exclusive content is Netflix original programming, such as
House of Cards, Orange is the New Black, Bloodline and Marco Polo.
■ Presto: Presto recently announced an output deal with 21st Century Fox, including
exclusive Australian SVOD rights to Modern Family. Presto also has exclusive
streaming rights to selected HBO content, including Boardwalk Empire, Entourage and
The Sopranos. Other studio agreements include CBS/Showtime, Disney, MGM, Sony
and Viacom. Presto also has access to original content from Foxtel and Seven.
Australian streaming search engine Gyde estimates that as at 24 March, Stan had the
largest library of the three major players, with c. 7,000 hours of content across 1,250 titles.
Netflix is estimated to have c5,000 hours and Presto c. 4,500 hours of content. We expect
these libraries to grow substantially over time (for example, Netflix Australia currently has
1,120 titles vs 7,110 titles on its US service, according to Gyde).
Content deals can take several forms, including:
■ Exclusive deals: Exclusive arrangements typically last for the life of the series. An
example is Stan's exclusive first-run Australian rights to Better Call Saul.
■ Life-of-series: Streaming rights to an ongoing series on a non-exclusive basis.
Depending on terms the content may be available immediately or subject to windowing.
■ Library content: Shorter-term agreements (typically two to three years) allowing a
service to select a certain number of hours from a studio's library subject to some
restrictions (e.g. windowing and tiering). The service may be able to update its library
during the life of the deal by removing older or unpopular items and replacing them with
other content.
Pricing – services priced at A$8.99 to A$14.99
The low monthly price of SVOD services is a key driver of adoption. The cost is a fraction
of full pay-TV and consumers can afford to subscribe to more than one service.
Netflix's standalone streaming plan in the US was priced from its launch in November
2010 through May 2014 at a single rate of US$7.99 per month, including streaming in HD
on up to two devices. In May 2014, Netflix moved to a new three-tiered pricing structure
(see Figure 9), with the cost of a basic subscription increasing by US$1 to US$8.99.
Existing subscribers were grandfathered in at the previous rate for two years.
Netflix made similar pricing changes to its international services at the time of the domestic
price increase, with the cost of the basic UK subscription raised from £5.99 to £6.99 per
month and "standard definition only" and "Family" plans added.
Netflix in Australia has the cheapest entry price for consumers at A$8.99, although this
only includes standard definition and access on a single device. Netflix benefits from not
having to charge GST as a foreign company (effectively a 10% cost benefit versus local
players). However, in order to watch high definition content and/or access via two devices
simultaneously, subscribers must pay A$11.99. A "Family" subscription that includes Ultra
HD (or 4K) streaming and access to four devices at once costs A$14.99 per month.
Stan has the simplest pricing model, with a single price of A$10 per month allowing access
to three screens at once in HD.

10 April 2015
Streaming video 8
Presto offers three separate subscriptions: A$9.99 for either Presto TV or Presto Movies,
or A$14.99 for both. Presto can be streamed on two devices simultaneously but does not
currently offer high definition.
Figure 9: SVOD pricing comparison
Australia USA UK
Netflix pricing per
month
A$8.99/mth (1 device, SD only)
A$11.99/mth (2 devices, HD)
A$14.99/mth (4 devices, 4K)
US$7.99/mth (1 device, SD only)
US$8.99/mth (2 devices, HD)
US$11.99/mth (4 devices, 4K)
£5.99/mth (1 device, SD only)
£6.99/mth (2 devices, HD)
£8.99/mth (4 devices, 4K)
Other SVOD pricing Stan A$10 per month
Presto A$9.99/mth for TV or
movies, A$14.99/mth for both
Hulu Plus US$8/mth
HBO Now US$15/mth
Lovefilm £5.99/mth
NOW TV Entertainment Pass
£6.99/mth
Pay TV ARPU (Cable
& Satellite only)
A$96/mth (Foxtel) US$117/mth (DirecTV)
US$84/mth (DISH)
£48/mth (Sky)
Source: Company data. ARPUs are for most recent reporting period.
Adoption of connected devices increasing
The ability to watch streaming content on multiple devices, particularly on the main screen,
is likely to be a key driver of adoption. Nielsen data shows that penetration of connected
devices is increasing (see Figure 10).
We estimate that 71% of Australian households now have a fixed broadband connection,
slightly below the US (78% in 2014 per Nielsen) and the UK (80% in 2014 per ONS). We
forecast broadband penetration to grow to 90% by 2022 (see Figure 11). Popular
connected devices and their compatibility with SVOD are summarised below.
■ Apple TV: Currently in over 1mn homes (source: SMH). Netflix has an app on Apple
TV. Stan can be watched via AirPlay. Presto currently doesn't support Apple TV.
■ Google Chromecast: Google has sold over 10mn units worldwide. Supported by all
three services.
■ Smart TVs: Nielsen data shows that 29% of Australians have Internet-ready TVs.
Parks Associates estimates that 70% of smart TV owners in the United States have
their sets connected. Netflix supports a number of smart TVs, the only service to do so.
■ IPTV: Presto is supported on c. 760k Telstra T-Boxes, Netflix on c. 200k Fetch TV
boxes.
■ Gaming consoles: Netflix is supported on Sony PlayStation and Microsoft Xbox One.
Stan and Presto are not currently compatible. Around 1.2mn PlayStations and Xboxes
were sold in Australia in 2014 alone according to data from NPD Group.
■ Smartphones and tablets: All three services support most newer iOS and Android
smartphones and tablets.

10 April 2015
Streaming video 9
Figure 10: Penetration of various devices Figure 11: Australian broadband penetration forecasts
Source: Nielsen. *Not necessarily connected Source: Company data, Credit Suisse estimates
Bandwidth and data caps largely sufficient for HD streaming
The average broadband download speed in Australia is 16.9Mbps (Source: Ookla), more
than sufficient to stream HD video. According to Netflix, SD streaming requires a download
speed of 1.5Mbps, while HD and Ultra HD streaming require speeds of 6.7Mbps and
15.5Mbps, respectively.
ABS data (see Figure 12) shows that 68% of Australian broadband connections have
advertised speeds above 8Mbps (sufficient for HD streaming), while 98% are able to
download at over 1.5Mbps (the minimum required for SD streaming).
All broadband plans under A$90 now include at least 200GB of data per month in their
bundled broadband/home phone plans (see Figure 13), while many are uncapped.
Standard definition streaming uses around 0.7GB of data per hour according to Netflix,
while HD and Ultra HD use 3GB/hr and 7GB/hr, respectively.
We also note that some of the services have agreed distribution deals that include
unmetering arrangements (e.g., iiNet/Netflix, Telstra/Presto).
Figure 12: Australian advertised download speeds (% of
total subscribers)
Figure 13: Data caps for plans under $90 per month
Source: Australian Bureau of Statistics, June 2014 Source: Company websites. *Includes 100GB bonus data **$80 p/mth
***$60 p/mth ^$70 p/mth
Distribution deals to help drive adoption
SVOD services have signed a number of distribution deals with Telcos. These agreements
include unmetering arrangements, longer free trials and bundling offers (with Telcos
paying a wholesale rate for the service). Distribution deals provide SVOD services with
significant exposure to large customer bases and help reduce marketing costs.
50%
22%18%
53%
37%
22%
55%
45%
29%
0%
10%
20%
30%
40%
50%
60%
PVR Households Tablet Penetration IPTV Capability*
2012 2013 20140%
10%
20%
30%
40%
50%
60%
70%
80%
90%
100%
2014 2015F 2016F 2017F 2018F 2019F 2020F 2021F 2022F 2023F
2%
31%
51%
17%
<1.5Mbps 1.5 - 8MBps 8 - 24MBps 24Mbps+
200GB
Unlimited
200GB
Unlimited Unlimited
Telstra* Optus iiNet** Dodo*** TPG^

10 April 2015
Streaming video 10
■ Presto currently has the best Australian distribution arrangements in place through its
relationship with Telstra (Telstra mobile, broadband and T-Box customers are eligible
for six months free Presto). These deals give it access to over 11mn mobile customers
(47% market share) and 3mn broadband customers (46% share).
■ Netflix's deals with Optus and iiNet provide exposure to c. 4.5mn mobile subscribers
and c2mn broadband customers.
■ Stan has announced a distribution deal with Vodafone covering both new and existing
customers on Vodafone Red plans, the only distribution deal with a mobile provider to
cover existing customers. We estimate that Vodafone has c. 2.5mn postpaid handheld
subscribers. Stan has also previously said that it is in discussions with Telstra.
10 April 2015
Streaming video 11
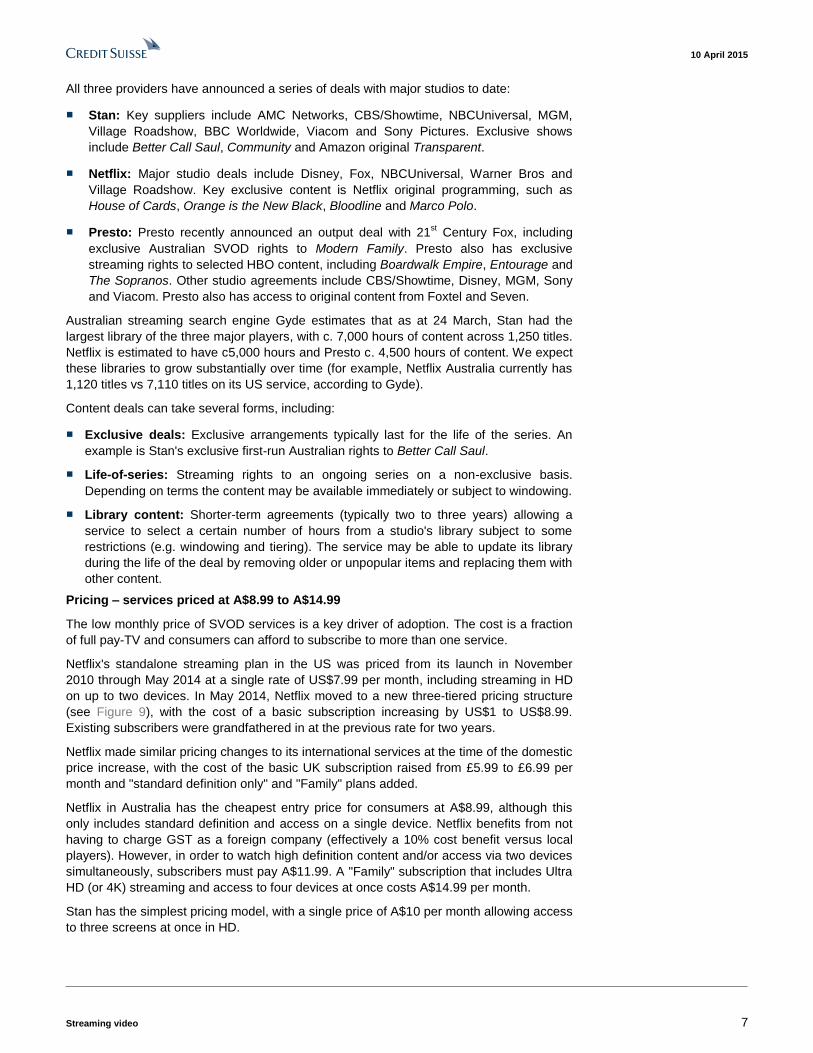
Figure 14: Australian SVOD distribution deals
Service Agreements
Netflix Unmetering arrangement with iiNet. We believe Netflix pays a small fee (c. A$1 per sub per month) to iiNet
Six months free Netflix to new Optus mobile or broadband customers on contracts of A$60 per month or more
(unmetered for fixed broadband customers)
Supported on Fetch TV service. Gives Netflix an extra installed base of c. 200,000 Fetch boxes
Presto Six months free Presto for new Telstra mobile and broadband customers (unmetered for fixed broadband
customers)
Six months free Presto for all T-Box owners (c760k T-Boxes in the market as of mid-2014)
Stan Three months free subscription to all existing Vodafone Red mobile subscribers
New and recontracting subscribers to Vodafone Red plans can choose to receive up to a year's free subscription to
Stan (six months for A$70 and A$80 plans, one year for A$100 plan)
Confirmed discussions with Telstra about "a promotional offer to Telstra customers"
Netflix has use of distribution deals globally, as it has expanded its geographic footprint. For
example, in the UK, Virgin Media last year added Netflix to its TiVo box, with new customers
receiving a six-month free subscription. Netflix signed a similar agreement with Orange in
France within two weeks of launch. Deutsche Telekom was Netflix's launch partner in
Germany, with the company's app being made available on the Telco's IPTV platform.
The experience overseas
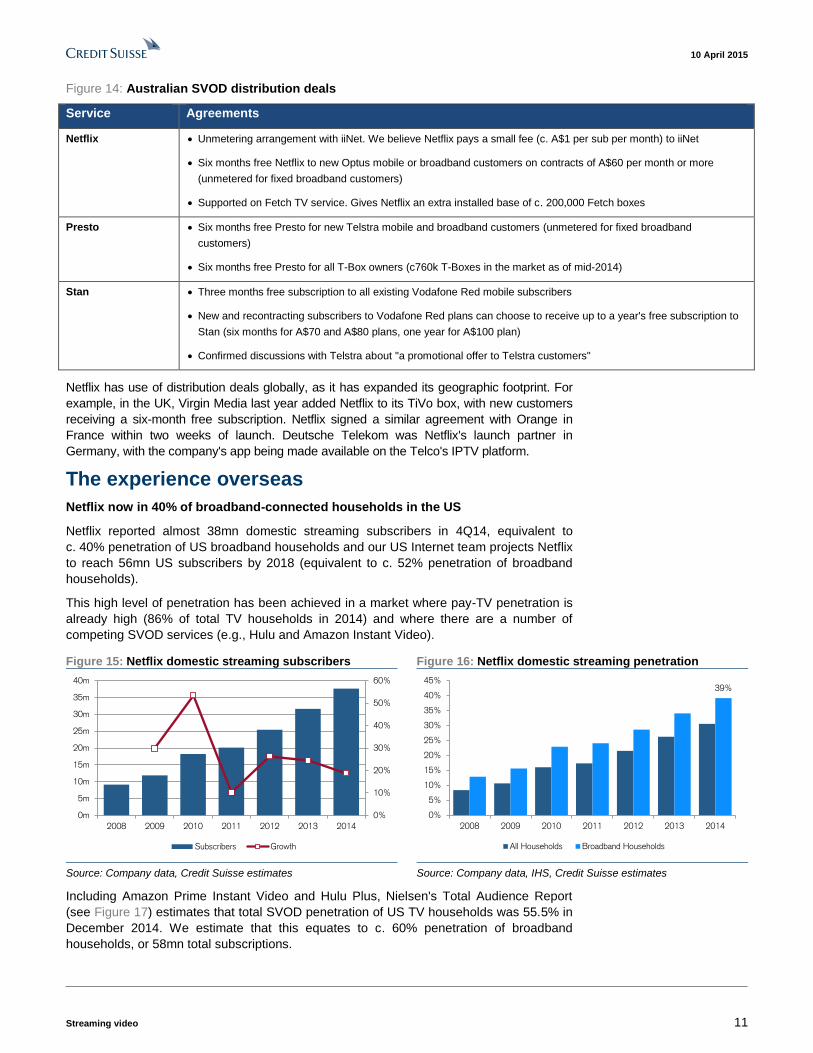
Netflix now in 40% of broadband-connected households in the US
Netflix reported almost 38mn domestic streaming subscribers in 4Q14, equivalent to
c. 40% penetration of US broadband households and our US Internet team projects Netflix
to reach 56mn US subscribers by 2018 (equivalent to c. 52% penetration of broadband
households).
This high level of penetration has been achieved in a market where pay-TV penetration is
already high (86% of total TV households in 2014) and where there are a number of
competing SVOD services (e.g., Hulu and Amazon Instant Video).
Figure 15: Netflix domestic streaming subscribers Figure 16: Netflix domestic streaming penetration
Source: Company data, Credit Suisse estimates Source: Company data, IHS, Credit Suisse estimates
Including Amazon Prime Instant Video and Hulu Plus, Nielsen's Total Audience Report
(see Figure 17) estimates that total SVOD penetration of US TV households was 55.5% in
December 2014. We estimate that this equates to c. 60% penetration of broadband
households, or 58mn total subscriptions.
0%
10%
20%
30%
40%
50%
60%
0m
5m
10m
15m
20m
25m
30m
35m
40m
2008 2009 2010 2011 2012 2013 2014
Subscribers Growth
39%
0%
5%
10%
15%
20%
25%
30%
35%
40%
45%
2008 2009 2010 2011 2012 2013 2014
All Households Broadband Households

10 April 2015
Streaming video 12
Nielsen data shows that around one-third of subscribers to Netflix, Amazon Prime and
Hulu Plus use more than one service (and 6% subscribe to all three). In total, Nielsen
estimates that 40.3% of US TV households (c. 44% penetration of broadband households)
subscribe to at least one SVOD service.
It is estimated that Netflix is now responsible for more than one-third of all downstream
Internet traffic in the US (see Figure 18).
Figure 17: Penetration of US TV households Figure 18: Share of US downstream Internet traffic
Source: Nielsen Total Audience Report Q4 2014 Source: Sandvine. Note: Fixed Internet only.
US market worth over US$4bn in 2014
The US SVOD market was worth US$4bn in 2014 and accounted for 23% of total home
entertainment revenue (source: Digital Home Entertainment Group). Netflix is projected to
earn US$5.8bn in domestic streaming revenue in 2018 according to our US team.
SVOD appears to be taking revenue share from other forms of home entertainment
(particularly DVD sales and rentals). Total US home entertainment revenue fell 2% in
2014, despite 27% growth in SVOD revenue, due to declines in physical sales and rentals
of 11% and 16%, respectively (see Figure 19).
Figure 19: US home entertainment revenue growth Figure 20: Share of US home entertainment revenue
(2014)
Source: Digital Home Entertainment Group Source: Digital Home Entertainment Group
UK SVOD penetration has reached 25%
Netflix entered the UK market in January 2012 and announced that it had reached 1mn
subscriptions by August 2012. Netflix was estimated to have reached 16% penetration of
Internet households in November 2014 (source: MTM Consulting), implying c. 3.5mn
subscribers.
34.9%
14.0%
3.0% 2.6% 1.4%
0%
5%
10%
15%
20%
25%
30%
35%
40%
Netflix YouTube Facebook AmazonVideo
Hulu
2H13 1H14 2H14
-20%
-10%
0%
10%
20%
30%
40%
50%
SubscriptionVOD
Digital Sales Physical Sales PhysicalRental*
TransactionVOD
2013 2014
Subscription VOD23%
Digital Sales9%
Physical Sales39%
Physical Rental*, 19%
Transaction VOD11%
10 April 2015
Streaming video 13
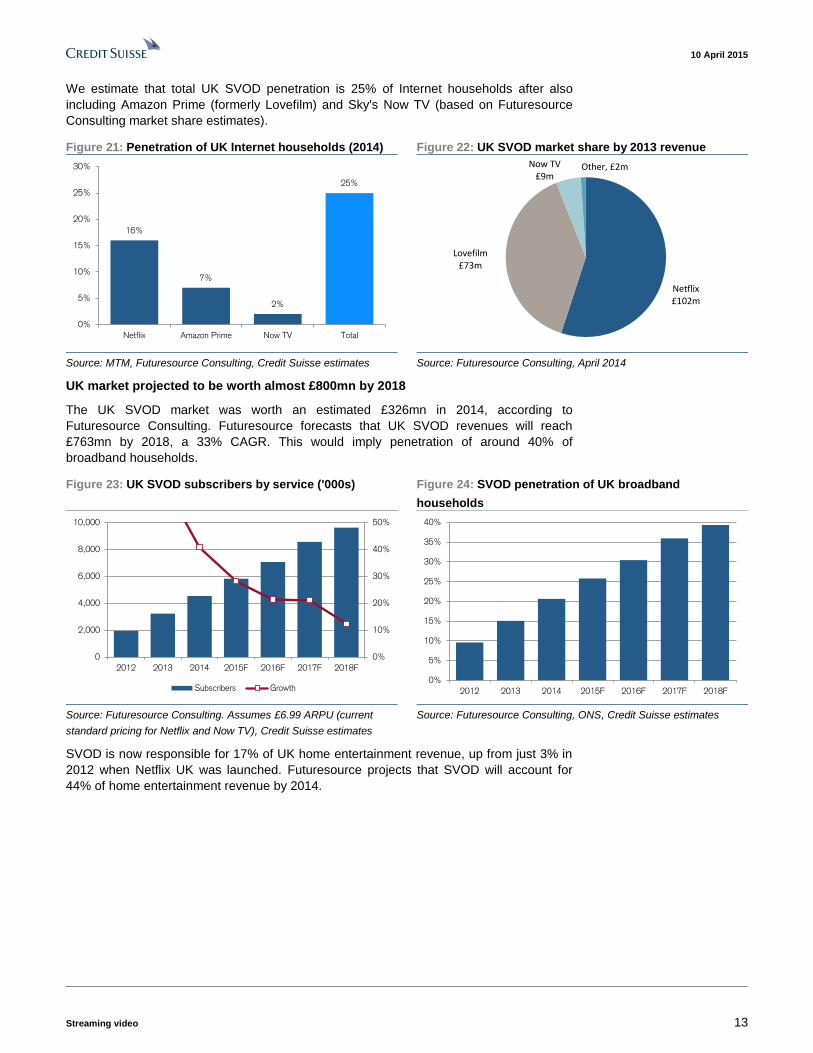
We estimate that total UK SVOD penetration is 25% of Internet households after also
including Amazon Prime (formerly Lovefilm) and Sky's Now TV (based on Futuresource
Consulting market share estimates).
Figure 21: Penetration of UK Internet households (2014) Figure 22: UK SVOD market share by 2013 revenue
Source: MTM, Futuresource Consulting, Credit Suisse estimates Source: Futuresource Consulting, April 2014
UK market projected to be worth almost £800mn by 2018
The UK SVOD market was worth an estimated £326mn in 2014, according to
Futuresource Consulting. Futuresource forecasts that UK SVOD revenues will reach
£763mn by 2018, a 33% CAGR. This would imply penetration of around 40% of
broadband households.
Figure 23: UK SVOD subscribers by service ('000s) Figure 24: SVOD penetration of UK broadband
households
Source: Futuresource Consulting. Assumes £6.99 ARPU (current
standard pricing for Netflix and Now TV), Credit Suisse estimates
Source: Futuresource Consulting, ONS, Credit Suisse estimates
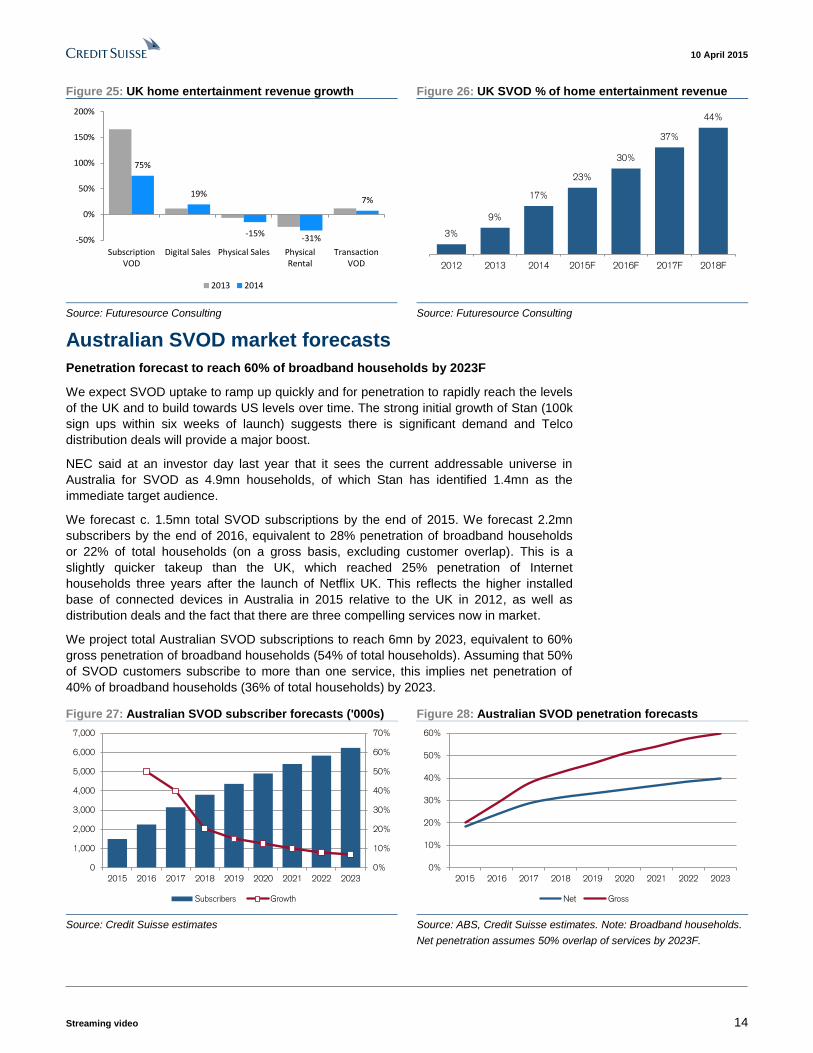
SVOD is now responsible for 17% of UK home entertainment revenue, up from just 3% in
2012 when Netflix UK was launched. Futuresource projects that SVOD will account for
44% of home entertainment revenue by 2014.
16%
7%
2%
25%
0%
5%
10%
15%
20%
25%
30%
Netflix Amazon Prime Now TV Total
Netflix£102m
Lovefilm£73m
Now TV£9m
Other, £2m
0%
10%
20%
30%
40%
50%
0
2,000
4,000
6,000
8,000
10,000
2012 2013 2014 2015F 2016F 2017F 2018F
Subscribers Growth0%
5%
10%
15%
20%
25%
30%
35%
40%
2012 2013 2014 2015F 2016F 2017F 2018F
10 April 2015
Streaming video 14
Figure 25: UK home entertainment revenue growth Figure 26: UK SVOD % of home entertainment revenue
Source: Futuresource Consulting Source: Futuresource Consulting
Australian SVOD market forecasts
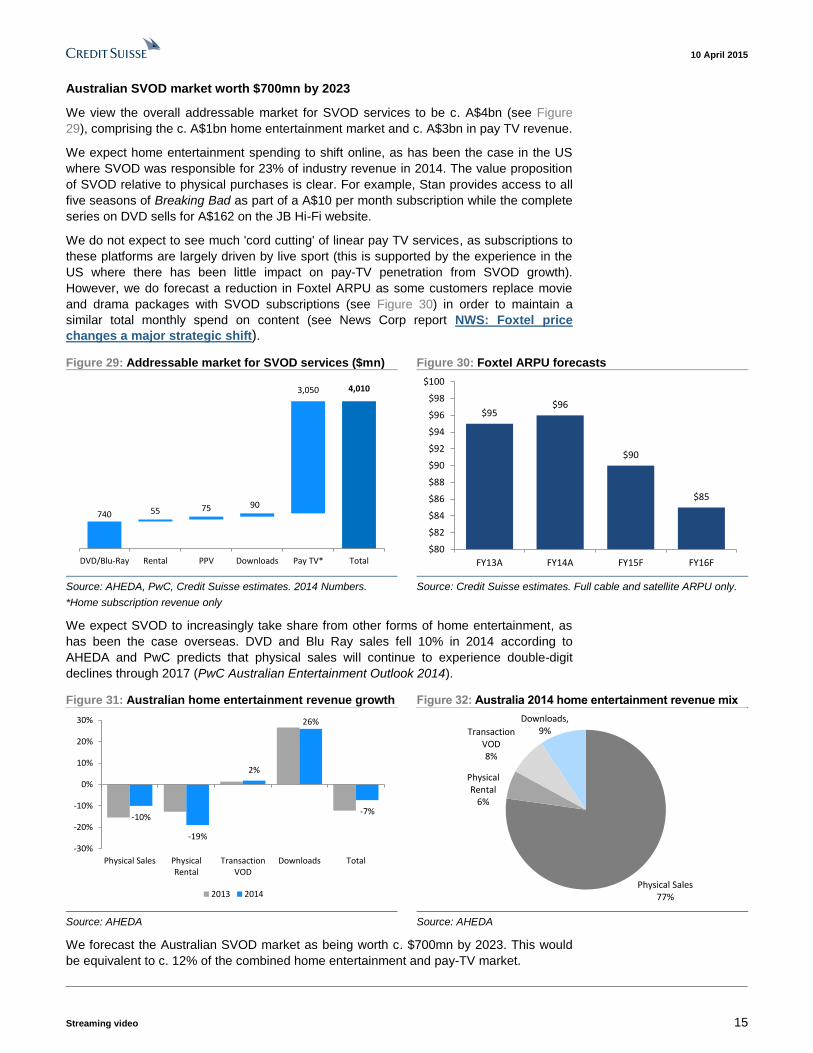
Penetration forecast to reach 60% of broadband households by 2023F
We expect SVOD uptake to ramp up quickly and for penetration to rapidly reach the levels
of the UK and to build towards US levels over time. The strong initial growth of Stan (100k
sign ups within six weeks of launch) suggests there is significant demand and Telco
distribution deals will provide a major boost.
NEC said at an investor day last year that it sees the current addressable universe in
Australia for SVOD as 4.9mn households, of which Stan has identified 1.4mn as the
immediate target audience.
We forecast c. 1.5mn total SVOD subscriptions by the end of 2015. We forecast 2.2mn
subscribers by the end of 2016, equivalent to 28% penetration of broadband households
or 22% of total households (on a gross basis, excluding customer overlap). This is a
slightly quicker takeup than the UK, which reached 25% penetration of Internet
households three years after the launch of Netflix UK. This reflects the higher installed
base of connected devices in Australia in 2015 relative to the UK in 2012, as well as
distribution deals and the fact that there are three compelling services now in market.
We project total Australian SVOD subscriptions to reach 6mn by 2023, equivalent to 60%
gross penetration of broadband households (54% of total households). Assuming that 50%
of SVOD customers subscribe to more than one service, this implies net penetration of
40% of broadband households (36% of total households) by 2023.
Figure 27: Australian SVOD subscriber forecasts ('000s) Figure 28: Australian SVOD penetration forecasts
Source: Credit Suisse estimates Source: ABS, Credit Suisse estimates. Note: Broadband households.
Net penetration assumes 50% overlap of services by 2023F.
75%
19%
-15%-31%
7%
-50%
0%
50%
100%
150%
200%
SubscriptionVOD
Digital Sales Physical Sales PhysicalRental
TransactionVOD
2013 2014
3%
9%
17%
23%
30%
37%
44%
2012 2013 2014 2015F 2016F 2017F 2018F
0%
10%
20%
30%
40%
50%
60%
70%
0
1,000
2,000
3,000
4,000
5,000
6,000
7,000
2015 2016 2017 2018 2019 2020 2021 2022 2023
Subscribers Growth
0%
10%
20%
30%
40%
50%
60%
2015 2016 2017 2018 2019 2020 2021 2022 2023
Net Gross
10 April 2015
Streaming video 15
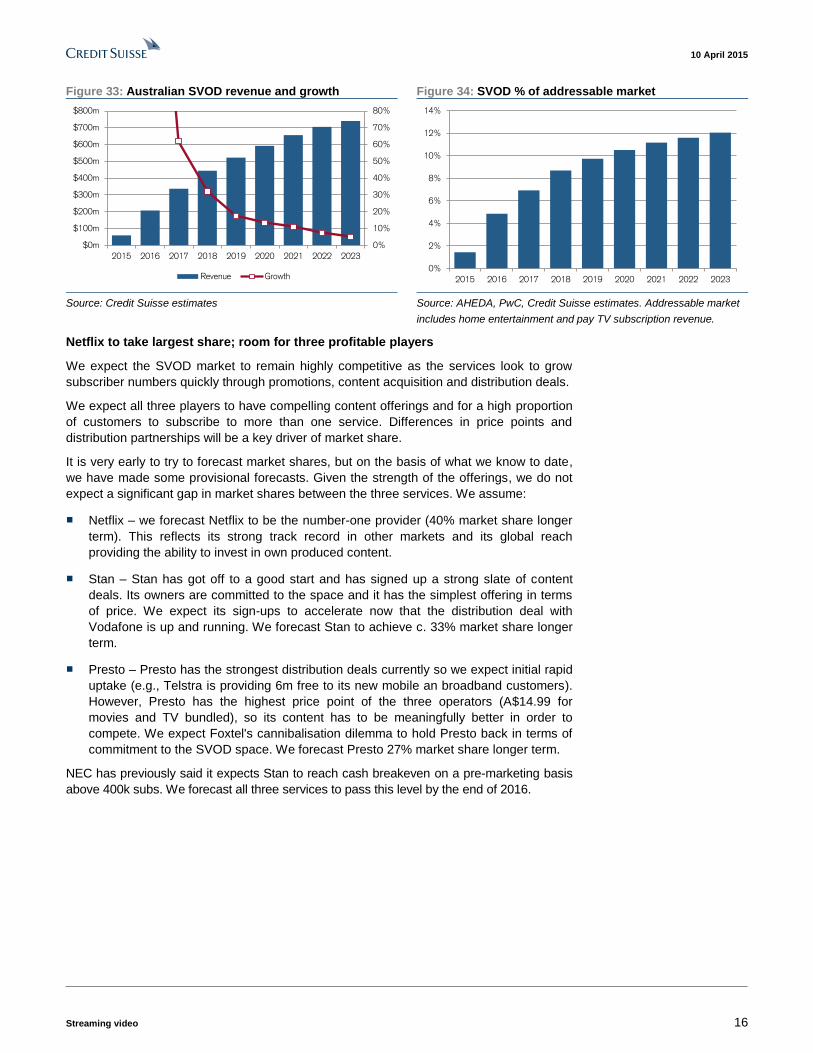
Australian SVOD market worth $700mn by 2023
We view the overall addressable market for SVOD services to be c. A$4bn (see Figure
29), comprising the c. A$1bn home entertainment market and c. A$3bn in pay TV revenue.
We expect home entertainment spending to shift online, as has been the case in the US
where SVOD was responsible for 23% of industry revenue in 2014. The value proposition
of SVOD relative to physical purchases is clear. For example, Stan provides access to all
five seasons of Breaking Bad as part of a A$10 per month subscription while the complete
series on DVD sells for A$162 on the JB Hi-Fi website.
We do not expect to see much 'cord cutting' of linear pay TV services, as subscriptions to
these platforms are largely driven by live sport (this is supported by the experience in the
US where there has been little impact on pay-TV penetration from SVOD growth).
However, we do forecast a reduction in Foxtel ARPU as some customers replace movie
and drama packages with SVOD subscriptions (see Figure 30) in order to maintain a
similar total monthly spend on content (see News Corp report NWS: Foxtel price
changes a major strategic shift).
Figure 29: Addressable market for SVOD services ($mn) Figure 30: Foxtel ARPU forecasts
Source: AHEDA, PwC, Credit Suisse estimates. 2014 Numbers.
*Home subscription revenue only
Source: Credit Suisse estimates. Full cable and satellite ARPU only.
We expect SVOD to increasingly take share from other forms of home entertainment, as
has been the case overseas. DVD and Blu Ray sales fell 10% in 2014 according to
AHEDA and PwC predicts that physical sales will continue to experience double-digit
declines through 2017 (PwC Australian Entertainment Outlook 2014).
Figure 31: Australian home entertainment revenue growth Figure 32: Australia 2014 home entertainment revenue mix
Source: AHEDA Source: AHEDA
We forecast the Australian SVOD market as being worth c. $700mn by 2023. This would
be equivalent to c. 12% of the combined home entertainment and pay-TV market.
740
4,010
55 75 90
3,050
DVD/Blu-Ray Rental PPV Downloads Pay TV* Total
$95$96
$90
$85
$80
$82
$84
$86
$88
$90
$92
$94
$96
$98
$100
FY13A FY14A FY15F FY16F
-10%
-19%
2%
26%
-7%
-30%
-20%
-10%
0%
10%
20%
30%
Physical Sales PhysicalRental
TransactionVOD
Downloads Total
2013 2014Physical Sales
77%
Physical Rental
6%
Transaction VOD8%
Downloads, 9%
10 April 2015
Streaming video 16
Figure 33: Australian SVOD revenue and growth Figure 34: SVOD % of addressable market
Source: Credit Suisse estimates Source: AHEDA, PwC, Credit Suisse estimates. Addressable market
includes home entertainment and pay TV subscription revenue.
Netflix to take largest share; room for three profitable players
We expect the SVOD market to remain highly competitive as the services look to grow
subscriber numbers quickly through promotions, content acquisition and distribution deals.
We expect all three players to have compelling content offerings and for a high proportion
of customers to subscribe to more than one service. Differences in price points and
distribution partnerships will be a key driver of market share.
It is very early to try to forecast market shares, but on the basis of what we know to date,
we have made some provisional forecasts. Given the strength of the offerings, we do not
expect a significant gap in market shares between the three services. We assume:
■ Netflix – we forecast Netflix to be the number-one provider (40% market share longer
term). This reflects its strong track record in other markets and its global reach
providing the ability to invest in own produced content.
■ Stan – Stan has got off to a good start and has signed up a strong slate of content
deals. Its owners are committed to the space and it has the simplest offering in terms
of price. We expect its sign-ups to accelerate now that the distribution deal with
Vodafone is up and running. We forecast Stan to achieve c. 33% market share longer
term.
■ Presto – Presto has the strongest distribution deals currently so we expect initial rapid
uptake (e.g., Telstra is providing 6m free to its new mobile an broadband customers).
However, Presto has the highest price point of the three operators (A$14.99 for
movies and TV bundled), so its content has to be meaningfully better in order to
compete. We expect Foxtel's cannibalisation dilemma to hold Presto back in terms of
commitment to the SVOD space. We forecast Presto 27% market share longer term.
NEC has previously said it expects Stan to reach cash breakeven on a pre-marketing basis
above 400k subs. We forecast all three services to pass this level by the end of 2016.
0%
10%
20%
30%
40%
50%
60%
70%
80%
$0m
$100m
$200m
$300m
$400m
$500m
$600m
$700m
$800m
2015 2016 2017 2018 2019 2020 2021 2022 2023
Revenue Growth0%
2%
4%
6%
8%
10%
12%
14%
2015 2016 2017 2018 2019 2020 2021 2022 2023

10 April 2015
Streaming video 17
Figure 35: SVOD subscribers by service Figure 36: Subscriber market share by service
Source: Credit Suisse estimates Source: Credit Suisse estimates
0
500
1,000
1,500
2,000
2,500
2015 2016 2017 2018 2019 2020 2021 2022 2023
Netflix Stan Presto
20%
25%
30%
35%
40%
45%
2015 2016 2017 2018 2019 2020 2021 2022 2023
Stan Presto Netflix

10 April 2015
Streaming video 18
Stan forecasts – breakeven in year 3
Stan revenue and market share forecasts
Stan has started strongly with the company saying it was on track for 100k sign ups only
six weeks from launch. We expect increased awareness and distribution deals to drive
ongoing uptake.
We assume Stan is able to take about a 33% share of subscribers in the medium to long
term. On this basis, we forecast Stan to achieve 500k subscribers by the end of 2015 and
750k by the end of 2016. We forecast Stan to grow to just over 2mn subscribers by 2023.
Figure 37: Australian market subscriber forecasts Figure 38: Stan net adds and subscriber growth
Source: Credit Suisse estimates Source: Credit Suisse estimates
Stan breakeven by year 3
We forecast Stan to reach cash breakeven on a pre-marketing basis by the end of its
second year. We expect overall profitability (including marketing costs) to follow in year 3.
While NEC has previously said that it believes it expects breakeven before marketing
costs at around 400-450k subscribers.
We assume a net cash investment of A$74mn to break even (slightly above NEC estimate
at its 2014 investor day of A$50mn–$65mn to break even, which was made before the
announcement of Fairfax as a JV partner). This compares to the A$100mn that NEC and
FXJ says that it has committed to the JV (including non-cash marketing inventory).
Longer term we forecast EBITDA margins to grow to 28% (by 2023). This is in line with
Netflix in the US, which reported EBITDA margins of 28% in 4Q14 and our US team
forecasts this to expand to 36% by 2018.
Figure 39: Netflix US costs per sub per month Figure 40: Netflix US quarterly EBITDA and margin
Source: Company data. Domestic streaming only. Source: Company data. Domestic streaming only.
0%
10%
20%
30%
40%
50%
60%
70%
0
1,000
2,000
3,000
4,000
5,000
6,000
7,000
2015 2016 2017 2018 2019 2020 2021 2022 2023
Stan Presto Netflix
Gross Penetration Net Penetration
0%
10%
20%
30%
40%
50%
60%
0
100
200
300
400
500
600
2015 2016 2017 2018 2019 2020 2021 2022 2023
Net Adds Sub Growth
$5.20
$5.40
$5.60
$5.80
$6.00
$6.20
$6.40
$6.60
$6.80
0
5,000
10,000
15,000
20,000
25,000
30,000
35,000
40,000
1Q12
2Q12
3Q12
4Q12
1Q13
2Q13
3Q13
4Q13
1Q14
2Q14
3Q14
4Q14
Domestic Subs Cost per Sub
0%
5%
10%
15%
20%
25%
30%
0
50
100
150
200
250
300
1Q12
2Q12
3Q12
4Q12
1Q13
2Q13
3Q13
4Q13
1Q14
2Q14
3Q14
4Q14
EBITDA ($m) Margin
10 April 2015
Streaming video 19
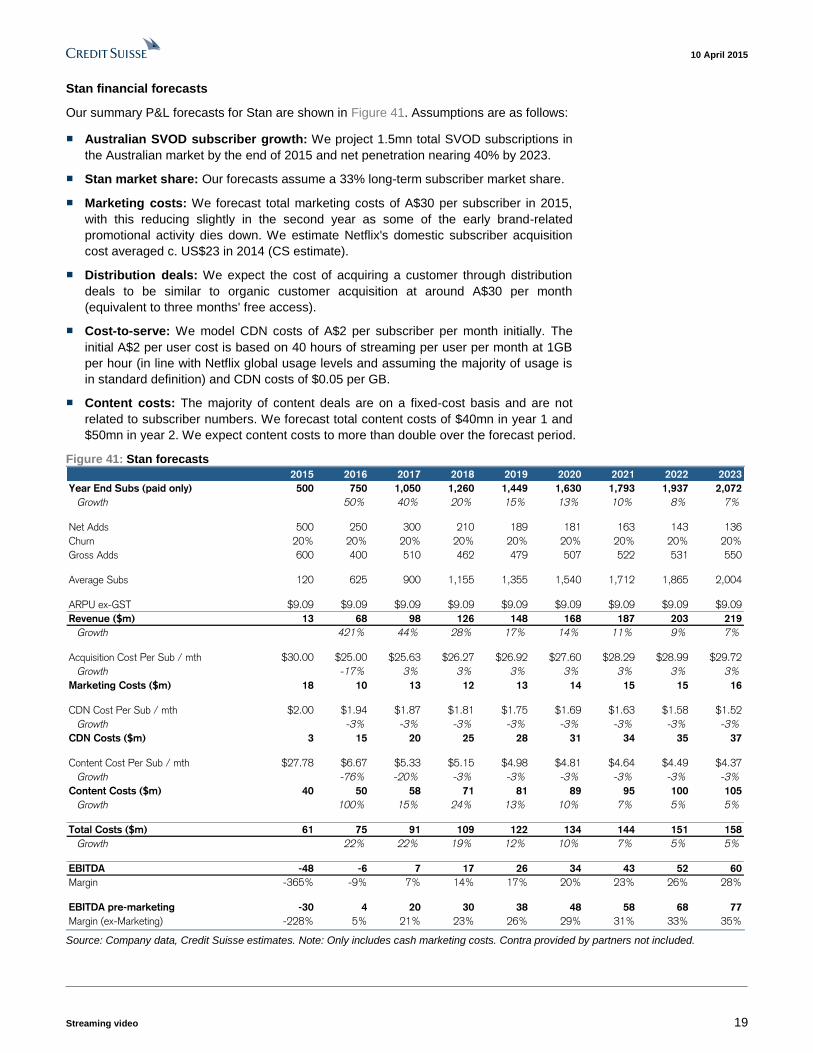
Stan financial forecasts
Our summary P&L forecasts for Stan are shown in Figure 41. Assumptions are as follows:
■ Australian SVOD subscriber growth: We project 1.5mn total SVOD subscriptions in
the Australian market by the end of 2015 and net penetration nearing 40% by 2023.
■ Stan market share: Our forecasts assume a 33% long-term subscriber market share.
■ Marketing costs: We forecast total marketing costs of A$30 per subscriber in 2015,
with this reducing slightly in the second year as some of the early brand-related
promotional activity dies down. We estimate Netflix's domestic subscriber acquisition
cost averaged c. US$23 in 2014 (CS estimate).
■ Distribution deals: We expect the cost of acquiring a customer through distribution
deals to be similar to organic customer acquisition at around A$30 per month
(equivalent to three months' free access).
■ Cost-to-serve: We model CDN costs of A$2 per subscriber per month initially. The
initial A$2 per user cost is based on 40 hours of streaming per user per month at 1GB
per hour (in line with Netflix global usage levels and assuming the majority of usage is
in standard definition) and CDN costs of $0.05 per GB.
■ Content costs: The majority of content deals are on a fixed-cost basis and are not
related to subscriber numbers. We forecast total content costs of $40mn in year 1 and
$50mn in year 2. We expect content costs to more than double over the forecast period.
Figure 41: Stan forecasts
Source: Company data, Credit Suisse estimates. Note: Only includes cash marketing costs. Contra provided by partners not included.
2015 2016 2017 2018 2019 2020 2021 2022 2023
Year End Subs (paid only) 500 750 1,050 1,260 1,449 1,630 1,793 1,937 2,072
Growth 50% 40% 20% 15% 13% 10% 8% 7%
Net Adds 500 250 300 210 189 181 163 143 136
Churn 20% 20% 20% 20% 20% 20% 20% 20% 20%
Gross Adds 600 400 510 462 479 507 522 531 550
Average Subs 120 625 900 1,155 1,355 1,540 1,712 1,865 2,004
ARPU ex-GST $9.09 $9.09 $9.09 $9.09 $9.09 $9.09 $9.09 $9.09 $9.09
Revenue ($m) 13 68 98 126 148 168 187 203 219
Growth 421% 44% 28% 17% 14% 11% 9% 7%
Acquisition Cost Per Sub / mth $30.00 $25.00 $25.63 $26.27 $26.92 $27.60 $28.29 $28.99 $29.72
Growth -17% 3% 3% 3% 3% 3% 3% 3%
Marketing Costs ($m) 18 10 13 12 13 14 15 15 16
CDN Cost Per Sub / mth $2.00 $1.94 $1.87 $1.81 $1.75 $1.69 $1.63 $1.58 $1.52
Growth -3% -3% -3% -3% -3% -3% -3% -3%
CDN Costs ($m) 3 15 20 25 28 31 34 35 37
Content Cost Per Sub / mth $27.78 $6.67 $5.33 $5.15 $4.98 $4.81 $4.64 $4.49 $4.37
Growth -76% -20% -3% -3% -3% -3% -3% -3%
Content Costs ($m) 40 50 58 71 81 89 95 100 105
Growth 100% 15% 24% 13% 10% 7% 5% 5%
Total Costs ($m) 61 75 91 109 122 134 144 151 158
Growth 22% 22% 19% 12% 10% 7% 5% 5%
EBITDA -48 -6 7 17 26 34 43 52 60
Margin -365% -9% 7% 14% 17% 20% 23% 26% 28%
EBITDA pre-marketing -30 4 20 30 38 48 58 68 77
Margin (ex-Marketing) -228% 5% 21% 23% 26% 29% 31% 33% 35%

10 April 2015
Streaming video 20
We expect costs per subscriber to decline over time as the subscriber base grows,
ultimately falling below A$6 per sub ex-marketing by 2023.
Figure 42: Stan costs per sub per month (pre marketing) Figure 43: Stan revenue and EBITDA margin
Source: Company data. Domestic streaming only. Source: Company data. Domestic streaming only.
Base case valuation of A$312mn
Based on the assumptions outlined in the previous section, we value Stan on a DCF basis
at A$312mn (for 100%). This equates to a value of A$190 per subscriber based on the
2020F subscriber base of 1.63mn.
We note that Netflix currently has a market capitalisation of US$26bn or US$520 per sub.
Figure 44: Stan DCF
Source: Company data, Credit Suisse estimates
The economics of a streaming service are highly dependent on the size of the subscriber
base given the largely fixed nature of content costs.
NEC has previously indicated that Stan will reach breakeven pre-marketing costs at
around 400-450k subscribers and we estimate that a customer base of c. 750k is
necessary to reach cash breakeven post-marketing. Given the start-up costs involved,
Stan likely needs a customer base of 800k–900k to be NPV positive.
$0.00
$2.00
$4.00
$6.00
$8.00
$10.00
0
500
1,000
1,500
2,000
2,500
2015 2016 2017 2018 2019 2020 2021 2022 2023
Subs Cost per Sub
-10%
-5%
0%
5%
10%
15%
20%
25%
30%
$0m
$50m
$100m
$150m
$200m
$250m
2015 2016 2017 2018 2019 2020 2021 2022 2023
Revenue Margin
DCF 2015 2016 2017 2018 2019 2020 2021 2022 2023
EBITDA -48 -6 10 20 29 37 46 56 62
D&A -5 5 5 5 5 5 5 5 5
EBIT -53 -1 15 25 34 42 51 61 67
Tax 0 0 -5 -8 -10 -13 -15 -18 -20
Capex -15 -5 -5 -5 -5 -5 -5 -5 -5
FCF -63 -11 1 8 14 19 26 33 37
Present Value -60 -9 1 6 9 12 14 16 16
Valuation 332
WACC 10%
TGR 5%
10 April 2015
Streaming video 21
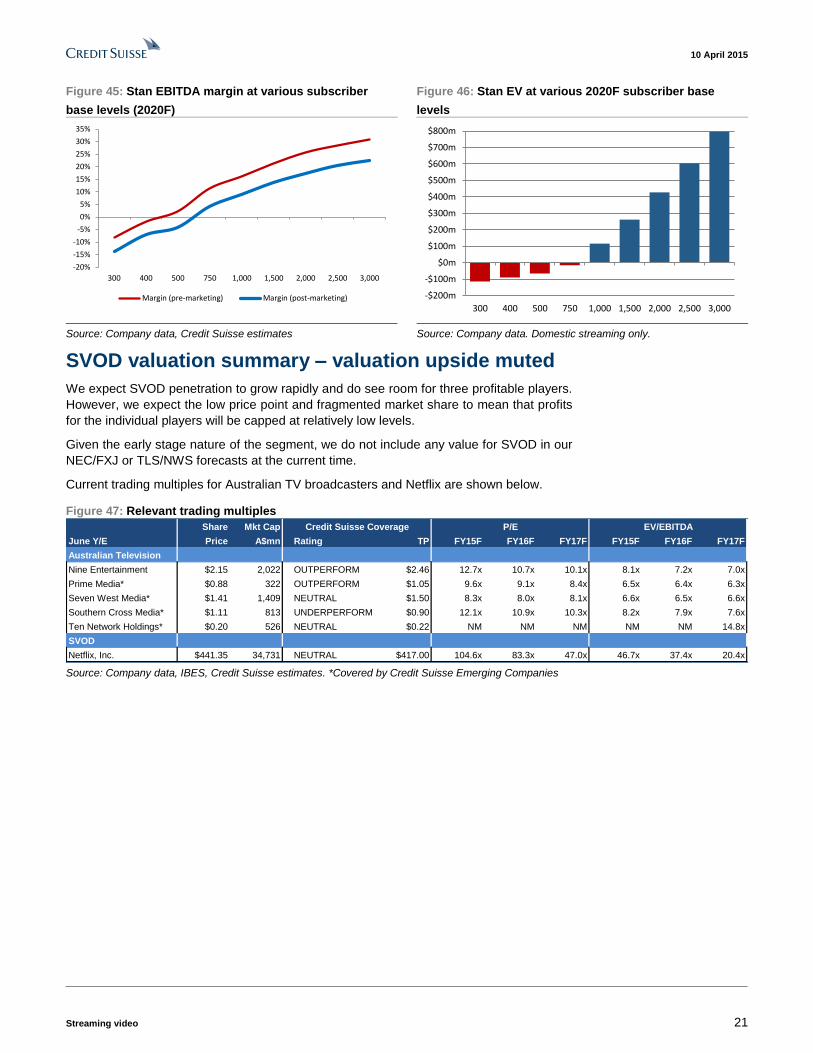
Figure 45: Stan EBITDA margin at various subscriber
base levels (2020F)
Figure 46: Stan EV at various 2020F subscriber base
levels
Source: Company data, Credit Suisse estimates Source: Company data. Domestic streaming only.
SVOD valuation summary – valuation upside muted
We expect SVOD penetration to grow rapidly and do see room for three profitable players.
However, we expect the low price point and fragmented market share to mean that profits
for the individual players will be capped at relatively low levels.
Given the early stage nature of the segment, we do not include any value for SVOD in our
NEC/FXJ or TLS/NWS forecasts at the current time.
Current trading multiples for Australian TV broadcasters and Netflix are shown below.
Figure 47: Relevant trading multiples
Source: Company data, IBES, Credit Suisse estimates. *Covered by Credit Suisse Emerging Companies
-20%
-15%
-10%
-5%
0%
5%
10%
15%
20%
25%
30%
35%
300 400 500 750 1,000 1,500 2,000 2,500 3,000
Margin (pre-marketing) Margin (post-marketing) -$200m
-$100m
$0m
$100m
$200m
$300m
$400m
$500m
$600m
$700m
$800m
300 400 500 750 1,000 1,500 2,000 2,500 3,000
Share Mkt Cap P/E EV/EBITDA
June Y/E Price A$mn Rating TP FY15F FY16F FY17F FY15F FY16F FY17F
Australian Television
Nine Entertainment $2.15 2,022 OUTPERFORM $2.46 12.7x 10.7x 10.1x 8.1x 7.2x 7.0x
Prime Media* $0.88 322 OUTPERFORM $1.05 9.6x 9.1x 8.4x 6.5x 6.4x 6.3x
Seven West Media* $1.41 1,409 NEUTRAL $1.50 8.3x 8.0x 8.1x 6.6x 6.5x 6.6x
Southern Cross Media* $1.11 813 UNDERPERFORM $0.90 12.1x 10.9x 10.3x 8.2x 7.9x 7.6x
Ten Network Holdings* $0.20 526 NEUTRAL $0.22 NM NM NM NM NM 14.8x
SVOD
Netflix, Inc. $441.35 34,731 NEUTRAL $417.00 104.6x 83.3x 47.0x 46.7x 37.4x 20.4x
Credit Suisse Coverage

10 April 2015
Streaming video 22
Appendix – Impact of SVOD on linear TV
In this section, we briefly consider the impact of SVOD uptake on linear TV viewing and
advertising. We look at the key trends from the US and the UK, where SVOD penetration
is already at relatively high levels.
US and UK ad spend still growing despite audience declines
In the US, the 18-49 audience has declined in each of the past eight years across the Big
4 broadcast networks in the US (ABC, CBS, FOX and NBC), although the rate of decline
was substantially less in the 2013-14 ratings season after the previous year was impacted
by particularly poor ratings at FOX.
Overall, 18-49 audiences have declined at a 4.6% CAGR over the past five years across
the Big 4 networks. Despite the audience decline, broadcast TV advertising saw a 3.5%
CAGR over the same period.
Likewise, UK TV ad spend has grown 5% in each of the past two years despite viewing
declines of 4%–5% per person as higher CPMs have offset audience declines.
Figure 48: US Big 4 broadcast audience (18-49) vs FTA ad
spend
Figure 49: UK TV viewing vs TV ad spend
Source: Nielsen, MagnaGlobal Source: BARB, ZenithOptimedia. Note: Average weekly time spent
viewing TV per person. Includes FTA and pay TV.
SVOD doesn't necessarily destroy live viewing
While live TV viewing in the US fell slightly in 2014, we note that due to increases in time
shifted viewing and digital video, overall video consumption grew 2%. Additionally, Nielsen
data shows that the top quintile of streamers also watch more live TV than both non-
streamers and the overall population.
Figure 50: 2014 US viewing growth Figure 51: Consumption of video content per month
Source: Nielsen. Note: All People 18+ Source: Nielsen
-15%
-10%
-5%
0%
5%
10%
15%
18-49 Audience FTA Ad Spend
-6%
-4%
-2%
0%
2%
4%
6%
2011 2012 2013 2014
Weekly Time Spent TV ad spend
-3%
10%
63%
2%
-10%
0%
10%
20%
30%
40%
50%
60%
70%
Live TV Time Shifted Digital Total
23.80.0 2.8
251.0223.1 233.7
0
50
100
150
200
250
300
Top Quintile Non Streamers All
Streaming TV
10 April 2015
Streaming video 23
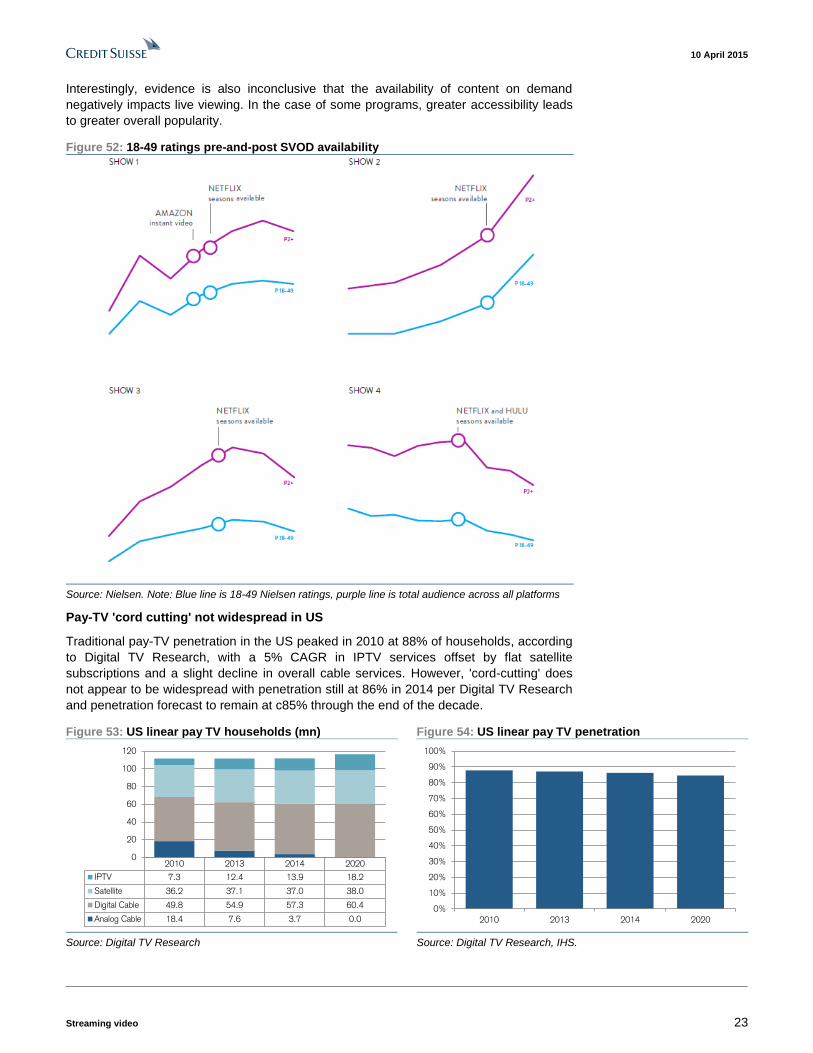
Interestingly, evidence is also inconclusive that the availability of content on demand
negatively impacts live viewing. In the case of some programs, greater accessibility leads
to greater overall popularity.
Figure 52: 18-49 ratings pre-and-post SVOD availability
Source: Nielsen. Note: Blue line is 18-49 Nielsen ratings, purple line is total audience across all platforms
Pay-TV 'cord cutting' not widespread in US
Traditional pay-TV penetration in the US peaked in 2010 at 88% of households, according
to Digital TV Research, with a 5% CAGR in IPTV services offset by flat satellite
subscriptions and a slight decline in overall cable services. However, 'cord-cutting' does
not appear to be widespread with penetration still at 86% in 2014 per Digital TV Research
and penetration forecast to remain at c85% through the end of the decade.
Figure 53: US linear pay TV households (mn) Figure 54: US linear pay TV penetration
Source: Digital TV Research Source: Digital TV Research, IHS.
2010 2013 2014 2020
IPTV 7.3 12.4 13.9 18.2
Satellite 36.2 37.1 37.0 38.0
Digital Cable 49.8 54.9 57.3 60.4
Analog Cable 18.4 7.6 3.7 0.0
0
20
40
60
80
100
120
0%
10%
20%
30%
40%
50%
60%
70%
80%
90%
100%
2010 2013 2014 2020

10 April 2015
Streaming video 24
Companies Mentioned (Price as of 09-Apr-2015)
21st Century Fox Inc. (FOXA.OQ, $34.36) Amazon com Inc. (AMZN.OQ, $383.54) Apple Inc (AAPL.OQ, $126.56) British Sky Broadcasting (SKYB.L, 1045.0p) CBS Corporation (CBS.N, $61.2) Comcast Corporation Inc. (CMCSA.OQ, $59.59) Deutsche Telekom (DTEGn.F, €17.37) DirecTV (DTV.OQ, $87.36) Fairfax Media (FXJ.AX, A$0.985) Google, Inc. (GOOGL.OQ, $548.02) Hutch Telcom (HTA.AX, A$0.084) JB Hi-Fi (JBH.AX, A$19.0) Liberty Global (LBTYA.OQ, $52.02) Microsoft Corporation (MSFT.OQ, $41.48) Netflix, Inc. (NFLX.OQ, $439.5) News Corporation (NWS.AX, A$20.62) Nine Entertainment (NEC.AX, A$2.15) Orange (ORAN.PA, €15.5) Prime Media Group (PRT.AX, A$0.88) * Quickflix (QFX.AX, A$0.001) Seven West Media Ltd (SWM.AX, A$1.41) * Singapore Telecom (STEL.SI, S$4.37) Sony (6758.T, ¥3,620) Southern Cross Media Group (SXL.AX, A$1.11) * Telstra Corporation (TLS.AX, A$6.27) Ten Network Holdings (TEN.AX, A$0.2) * The Walt Disney Company (DIS.N, $106.77) Viacom Inc. (VIAB.OQ, $69.32) Vodafone Group (VOD.L, 225.7p) iiNet (IIN.AX, A$8.89) * * CSEC Coverage
Disclosure Appendix
Important Global Disclosures
Lucas Goode and Fraser McLeish, each certify, with respect to the companies or securities that the individual analyzes, that (1) the views expressed in this report accurately reflect his or her personal views about all of the subject companies and securities and (2) no part of his or her compensation was, is or will be directly or indirectly related to the specific recommendations or views expressed in this report.
The analyst(s) responsible for preparing this research report received Compensation that is based upon various factors including Credit Suisse's total revenues, a portion of which are generated by Credit Suisse's investment banking activities
As of December 10, 2012 Analysts’ stock rating are defined as follows:
Outperform (O) : The stock’s total return is expected to outperform the relevant benchmark*over the next 12 months.
Neutral (N) : The stock’s total return is expected to be in line with the relevant benchmark* over the next 12 months.
Underperform (U) : The stock’s total return is expected to underperform the relevant benchmark* over the next 12 months.
*Relevant benchmark by region: As of 10th December 2012, Japanese ratings are based on a stock’s total return relative to the analyst's coverage uni verse which consists of all companies covered by the analyst within the relevant sector, with Outperforms representing the most att ractive, Neutrals the less attractive, and Underperforms the least attractive investment opportunities. As of 2nd October 2012, U.S. and Canadian as well as European ra tings are based on a stock’s total return relative to the analyst's coverage universe which consists of all companies covered by the analyst within the relevant sector, with Outperforms representing the most attractive, Neutrals the less attractive, and Underperforms the least attractive investment opportunities. For Latin Ame rican and non-Japan Asia stocks, ratings are based on a stock’s total return relative to the average total return of the relevant country or regional benchmark; prior to 2nd October 2012 U.S. and Canadian ratings were based on (1) a stock’s absolute total return potential to its current share price and (2) the relative attractiveness of a stock’s total return potential within an analyst’s coverage universe. For Australian and New Zealand stocks, 12 -month rolling yield is incorporated in the absolute total return calculation and a 15% and a 7.5% threshold replace the 10-15% level in the Outperform and Underperform stock rating definitions, respectively. The 15% and 7.5% thresholds replace the +10-15% and -10-15% levels in the Neutral stock rating definition, respectively. Pr ior to 10th December 2012, Japanese ratings were based on a stock’s total return relative to the average total return of the relevant country or regional benchmark.
Restricted (R) : In certain circumstances, Credit Suisse policy and/or applicable law and regulations preclude certain types of communications, including an investment recommendation, during the course of Credit Suisse's engagement in an investment banking transaction and in certain other circumstances.
Volatility Indicator [V] : A stock is defined as volatile if the stock price has moved up or down by 20% or more in a month in at least 8 of the past 24 months or the analyst expects significant volatility going forward.
Analysts’ sector weightings are distinct from analysts’ stock ratings and are based on the analyst’s expectations for the fundamentals and/or valuation of the sector* relative to the group’s historic fundamentals and/or valuation:
Overweight : The analyst’s expectation for the sector’s fundamentals and/or valuation is favorable over the next 12 months.

10 April 2015
Streaming video 25
Market Weight : The analyst’s expectation for the sector’s fundamentals and/or valuation is neutral over the next 12 months.
Underweight : The analyst’s expectation for the sector’s fundamentals and/or valuation is cautious over the next 12 months.
*An analyst’s coverage sector consists of all companies covered by the analyst within the relevant sector. An analyst may cover multiple sectors.
Credit Suisse's distribution of stock ratings (and banking clients) is:
Global Ratings Distribution
Rating Versus universe (%) Of which banking clients (%)
Outperform/Buy* 44% (53% banking clients)
Neutral/Hold* 38% (51% banking clients)
Underperform/Sell* 16% (43% banking clients)
Restricted 3%
*For purposes of the NYSE and NASD ratings distribution disclosure requirements, our stock ratings of Outperform, Neutral, and Underperform most closely correspond to Buy, Hold, and Sell, respectively; however, the meanings are not the same, as our stock ratings are determined on a relative basis. (Please refer to definitions above.) An investor's decision to buy or sell a security should be based on investment objectives, current holdin gs, and other individual factors.
Credit Suisse’s policy is to update research reports as it deems appropriate, based on developments with the subject company, the sector or the market that may have a material impact on the research views or opinions stated herein.
Credit Suisse's policy is only to publish investment research that is impartial, independent, clear, fair and not misleading. For more detail please refer to Credit Suisse's Policies for Managing Conflicts of Interest in connection with Investment Research: http://www.csfb.com/research-and-analytics/disclaimer/managing_conflicts_disclaimer.html
Credit Suisse does not provide any tax advice. Any statement herein regarding any US federal tax is not intended or written to be used, and cannot be used, by any taxpayer for the purposes of avoiding any penalties.
See the Companies Mentioned section for full company names
The subject company (NEC.AX, SWM.AX, NFLX.OQ) currently is, or was during the 12-month period preceding the date of distribution of this report, a client of Credit Suisse.
Credit Suisse expects to receive or intends to seek investment banking related compensation from the subject company (NEC.AX, SWM.AX, TEN.AX, NFLX.OQ) within the next 3 months.
As of the date of this report, Credit Suisse makes a market in the following subject companies (NFLX.OQ).
For other important disclosures concerning companies featured in this report, including price charts, please visit the website at https://rave.credit-suisse.com/disclosures or call +1 (877) 291-2683.
Important Regional Disclosures
Singapore recipients should contact Credit Suisse AG, Singapore Branch for any matters arising from this research report.
The analyst(s) involved in the preparation of this report have not visited the material operations of the subject company (NEC.AX, PRT.AX, SWM.AX, SXL.AX, TEN.AX, NFLX.OQ) within the past 12 months
Restrictions on certain Canadian securities are indicated by the following abbreviations: NVS--Non-Voting shares; RVS--Restricted Voting Shares; SVS--Subordinate Voting Shares.
Individuals receiving this report from a Canadian investment dealer that is not affiliated with Credit Suisse should be advised that this report may not contain regulatory disclosures the non-affiliated Canadian investment dealer would be required to make if this were its own report.
For Credit Suisse Securities (Canada), Inc.'s policies and procedures regarding the dissemination of equity research, please visit http://www.csfb.com/legal_terms/canada_research_policy.shtml.
As of the date of this report, Credit Suisse acts as a market maker or liquidity provider in the equities securities that are the subject of this report.
Principal is not guaranteed in the case of equities because equity prices are variable.
Commission is the commission rate or the amount agreed with a customer when setting up an account or at any time after that.
To the extent this is a report authored in whole or in part by a non-U.S. analyst and is made available in the U.S., the following are important disclosures regarding any non-U.S. analyst contributors: The non-U.S. research analysts listed below (if any) are not registered/qualified as research analysts with FINRA. The non-U.S. research analysts listed below may not be associated persons of CSSU and therefore may not be subject to the NASD Rule 2711 and NYSE Rule 472 restrictions on communications with a subject company, public appearances and trading securities held by a research analyst account.
Credit Suisse Equities (Australia) Limited ............................................................................................................... Lucas Goode ; Fraser McLeish
Credit Suisse Emerging Companies (Australia) Pty Limited ("CSEC") is the research report provider in relation to this report. Credit Suisse has disclosed its conflicts of interest also in this report as Credit Suisse is a material shareholder in CSEC; the distributor of this research; and has re-branded this document. Despite the foregoing, Credit Suisse is not liable or responsible for the content of this research report and provides it as distributor for informational purposes only

10 April 2015
Streaming video 26
Credit Suisse Emerging Companies (Australia) Pty Limited ("CSEC") is an incorporated joint venture entered into between Credit Suisse and First NZ Capital. Pursuant to this arrangement, Credit Suisse makes available to its clients certain research produced by CSEC. CSEC is not an affiliate or related body corporate of Credit Suisse. Credit Suisse is not liable or responsible for the content of such research and provides such research as its distributor for informational purposes only
CSEAL Analysts involved in the preparation of this report may be co-located with Credit Suisse Emerging Companies (CSEC) analysts.
For Credit Suisse disclosure information on other companies mentioned in this report, please visit the website at https://rave.credit-suisse.com/disclosures or call +1 (877) 291-2683.

10 April 2015
Streaming video 27
References in this report to Credit Suisse include all of the subsidiaries and affiliates of Credit Suisse operating under its investment banking division. For more information on our structure, please use the following link: https://www.credit-suisse.com/who_we_are/en/This report may contain material that is not directed to, or intended for distribution to or use by, any person or entity who is a citizen or resident of or located in any locality, state, country or other jurisdiction where such distribution, publication, availability or use would be contrary to law or regulation or which would subject Credit Suisse AG or its affiliates ("CS") to any registration or licensing requirement within such jurisdiction. All material presented in this report, unless specifically indicated otherwise, is under copyright to CS. None of the material, nor its content, nor any copy of it, may be altered in any way, transmitted to, copied or distributed to any other party, without the prior express written permission of CS. All trademarks, service marks and logos used in this report are trademarks or service marks or registered trademarks or service marks of CS or its affiliates. The information, tools and material presented in this report are provided to you for information purposes only and are not to be used or considered as an offer or the solicitation of an offer to sell or to buy or subscribe for securities or other financial instruments. CS may not have taken any steps to ensure that the securities referred to in this report are suitable for any particular investor. CS will not treat recipients of this report as its customers by virtue of their receiving this report. The investments and services contained or referred to in this report may not be suitable for you and it is recommended that you consult an independent investment advisor if you are in doubt about such investments or investment services. Nothing in this report constitutes investment, legal, accounting or tax advice, or a representation that any investment or strategy is suitable or appropriate to your individual circumstances, or otherwise constitutes a personal recommendation to you. CS does not advise on the tax consequences of investments and you are advised to contact an independent tax adviser. Please note in particular that the bases and levels of taxation may change. Information and opinions presented in this report have been obtained or derived from sources believed by CS to be reliable, but CS makes no representation as to their accuracy or completeness. CS accepts no liability for loss arising from the use of the material presented in this report, except that this exclusion of liability does not apply to the extent that such liability arises under specific statutes or regulations applicable to CS. This report is not to be relied upon in substitution for the exercise of independent judgment. CS may have issued, and may in the future issue, other communications that are inconsistent with, and reach different conclusions from, the information presented in this report. Those communications reflect the different assumptions, views and analytical methods of the analysts who prepared them and CS is under no obligation to ensure that such other communications are brought to the attention of any recipient of this report. Some investments referred to in this report will be offered solely by a single entity and in the case of some investments solely by CS, or an associate of CS or CS may be the only market maker in such investments. Past performance should not be taken as an indication or guarantee of future performance, and no representation or warranty, express or implied, is made regarding future performance. Information, opinions and estimates contained in this report reflect a judgment at its original date of publication by CS and are subject to change without notice. The price, value of and income from any of the securities or financial instruments mentioned in this report can fall as well as rise. The value of securities and financial instruments is subject to exchange rate fluctuation that may have a positive or adverse effect on the price or income of such securities or financial instruments. Investors in securities such as ADR's, the values of which are influenced by currency volatility, effectively assume this risk. Structured securities are complex instruments, typically involve a high degree of risk and are intended for sale only to sophisticated investors who are capable of understanding and assuming the risks involved. The market value of any structured security may be affected by changes in economic, financial and political factors (including, but not limited to, spot and forward interest and exchange rates), time to maturity, market conditions and volatility, and the credit quality of any issuer or reference issuer. Any investor interested in purchasing a structured product should conduct their own investigation and analysis of the product and consult with their own professional advisers as to the risks involved in making such a purchase. Some investments discussed in this report may have a high level of volatility. High volatility investments may experience sudden and large falls in their value causing losses when that investment is realised. Those losses may equal your original investment. Indeed, in the case of some investments the potential losses may exceed the amount of initial investment and, in such circumstances, you may be required to pay more money to support those losses. Income yields from investments may fluctuate and, in consequence, initial capital paid to make the investment may be used as part of that income yield. Some investments may not be readily realisable and it may be difficult to sell or realise those investments, similarly it may prove difficult for you to obtain reliable information about the value, or risks, to which such an investment is exposed. This report may provide the addresses of, or contain hyperlinks to, websites. Except to the extent to which the report refers to website material of CS, CS has not reviewed any such site and takes no responsibility for the content contained therein. Such address or hyperlink (including addresses or hyperlinks to CS's own website material) is provided solely for your convenience and information and the content of any such website does not in any way form part of this document. Accessing such website or following such link through this report or CS's website shall be at your own risk. This report is issued and distributed in Europe (except Switzerland) by Credit Suisse Securities (Europe) Limited, One Cabot Square, London E14 4QJ, England, which is authorised by the Prudential Regulation Authority and regulated by the Financial Conduct Authority and the Prudential Regulation Authority. This report is being distributed in Germany by Credit Suisse Securities (Europe) Limited Niederlassung Frankfurt am Main regulated by the Bundesanstalt fuer Finanzdienstleistungsaufsicht ("BaFin"). This report is being distributed in the United States and Canada by Credit Suisse Securities (USA) LLC; in Switzerland by Credit Suisse AG; in Brazil by Banco de Investimentos Credit Suisse (Brasil) S.A or its affiliates; in Mexico by Banco Credit Suisse (México), S.A. (transactions related to the securities mentioned in this report will only be effected in compliance with applicable regulation); in Japan by Credit Suisse Securities (Japan) Limited, Financial Instruments Firm, Director-General of Kanto Local Finance Bureau (Kinsho) No. 66, a member of Japan Securities Dealers Association, The Financial Futures Association of Japan, Japan Investment Advisers Association, Type II Financial Instruments Firms Association; elsewhere in Asia/ Pacific by whichever of the following is the appropriately authorised entity in the relevant jurisdiction: Credit Suisse (Hong Kong) Limited, Credit Suisse Equities (Australia) Limited, Credit Suisse Securities (Thailand) Limited, regulated by the Office of the Securities and Exchange Commission, Thailand, having registered address at 990 Abdulrahim Place, 27th Floor, Unit 2701, Rama IV Road, Silom, Bangrak, Bangkok 10500, Thailand, Tel. +66 2614 6000, Credit Suisse Securities (Malaysia) Sdn Bhd, Credit Suisse AG, Singapore Branch, Credit Suisse Securities (India) Private Limited (CIN no. U67120MH1996PTC104392) regulated by the Securities and Exchange Board of India (registration Nos. INB230970637; INF230970637; INB010970631; INF010970631), having registered address at 9th Floor, Ceejay House, Dr.A.B. Road, Worli, Mumbai - 18, India, T- +91-22 6777 3777, Credit Suisse Securities (Europe) Limited, Seoul Branch, Credit Suisse AG, Taipei Securities Branch, PT Credit Suisse Securities Indonesia, Credit Suisse Securities (Philippines ) Inc., and elsewhere in the world by the relevant authorised affiliate of the above. Research on Taiwanese securities produced by Credit Suisse AG, Taipei Securities Branch has been prepared by a registered Senior Business Person. Research provided to residents of Malaysia is authorised by the Head of Research for Credit Suisse Securities (Malaysia) Sdn Bhd, to whom they should direct any queries on +603 2723 2020. This report has been prepared and issued for distribution in Singapore to institutional investors, accredited investors and expert investors (each as defined under the Financial Advisers Regulations) only, and is also distributed by Credit Suisse AG, Singapore branch to overseas investors (as defined under the Financial Advisers Regulations). By virtue of your status as an institutional investor, accredited investor, expert investor or overseas investor, Credit Suisse AG, Singapore branch is exempted from complying with certain compliance requirements under the Financial Advisers Act, Chapter 110 of Singapore (the "FAA"), the Financial Advisers Regulations and the relevant Notices and Guidelines issued thereunder, in respect of any financial advisory service which Credit Suisse AG, Singapore branch may provide to you. This information is being distributed by Credit Suisse AG, Dubai Branch, duly licensed and regulated by the Dubai Financial Services Authority (DFSA), and is directed at Professional Clients or Market Counterparties only, as defined by the DFSA. The financial products or financial services to which the information relates will only be made available to a client who meets the regulatory criteria to be a Professional Client or Market Counterparty only, as defined by the DFSA, and is not intended for any other person. This research may not conform to Canadian disclosure requirements. In jurisdictions where CS is not already registered or licensed to trade in securities, transactions will only be effected in accordance with applicable securities legislation, which will vary from jurisdiction to jurisdiction and may require that the trade be made in accordance with applicable exemptions from registration or licensing requirements. Non-U.S. customers wishing to effect a transaction should contact a CS entity in their local jurisdiction unless governing law permits otherwise. U.S. customers wishing to effect a transaction should do so only by contacting a representative at Credit Suisse Securities (USA) LLC in the U.S. Please note that this research was originally prepared and issued by CS for distribution to their market professional and institutional investor customers. Recipients who are not market professional or institutional investor customers of CS should seek the advice of their independent financial advisor prior to taking any investment decision based on this report or for any necessary explanation of its contents. This research may relate to investments or services of a person outside of the UK or to other matters which are not authorised by the Prudential Regulation Authority and regulated by the Financial Conduct Authority and the Prudential Regulation Authority or in respect of which the protections of the Prudential Regulation Authority and Financial Conduct Authority for private customers and/or the UK compensation scheme may not be available, and further details as to where this may be the case are available upon request in respect of this report. CS may provide various services to US municipal entities or obligated persons ("municipalities"), including suggesting individual transactions or trades and entering into such transactions. Any services CS provides to municipalities are not viewed as "advice" within the meaning of Section 975 of the Dodd-Frank Wall Street Reform and Consumer Protection Act. CS is providing any such services and related information solely on an arm's length basis and not as an advisor or fiduciary to the municipality. In connection with the provision of the any such services, there is no agreement, direct or indirect, between any municipality (including the officials, management, employees or agents thereof) and CS for CS to provide advice to the municipality. Municipalities should consult with their financial, accounting and legal advisors regarding any such services provided by CS. In addition, CS is not acting for direct or indirect compensation to solicit the municipality on behalf of an unaffiliated broker, dealer, municipal securities dealer, municipal advisor, or investment adviser for the purpose of obtaining or retaining an engagement by the municipality for or in connection with Municipal Financial Products, the issuance of municipal securities, or of an investment adviser to provide investment advisory services to or on behalf of the municipality. If this report is being distributed by a financial institution other than Credit Suisse AG, or its affiliates, that financial institution is solely responsible for distribution. Clients of that institution should contact that institution to effect a transaction in the securities mentioned in this report or require further information. This report does not constitute investment advice by Credit Suisse to the clients of the distributing financial institution, and neither Credit Suisse AG, its affiliates, and their respective officers, directors and employees accept any liability whatsoever for any direct or consequential loss arising from their use of this report or its content. Principal is not guaranteed. Commission is the commission rate or the amount agreed with a customer when setting up an account or at any time after that.
Copyright © 2015 CREDIT SUISSE AG and/or its affiliates. All rights reserved.
Investment principal on bonds can be eroded depending on sale price or market price. In addition, there are bonds on which investment principal can be eroded due to changes in redemption amounts. Care is required when investing in such instruments. When you purchase non-listed Japanese fixed income securities (Japanese government bonds, Japanese municipal bonds, Japanese government guaranteed bonds, Japanese corporate bonds) from CS as a seller, you will be requested to pay the purchase price only.
Streaming video 2015 04 10 - SVOD - The battle begins
v2.docx