stream flow monitoring in the englishman river watershed,...
TRANSCRIPT

Stream Flow Monitoring in the Englishman River Watershed, 2003
as part of the
Englishman River Watershed Recovery Plan
Prepared for
Pacific Salmon Foundation Vancouver, B.C.
By
H.M. Wright BC Conservation Foundation
Nanaimo, B.C.

Stream Flow Monitoring in the Englishman River Watershed, 2003__________________________________________ii
_____________________________________________________________________________________________ British Columbia Conservation Foundation
ACKNOWLEDGEMENTS James Craig and Brad Smith1 provided key support preparing the proposal and completing fieldwork. Leonard Fong, Luke Downs and Carol Cornish2 assisted with stream flow measurements. Melissa Andrews3 provided technical support. Craig Wightman4 supported the study.
1 Fisheries Technicians, BC Conservation Foundation, Nanaimo, B.C. 2 Parksville Streamkeepers, Parksville, B.C. 3 Technician, Water Survey of Canada, Nanaimo, B.C. 4 Senior Fisheries Biologist, Ministry of Water, Land and Air Protection, Nanaimo, B.C.

Stream Flow Monitoring in the Englishman River Watershed, 2003__________________________________________iii
_____________________________________________________________________________________________ British Columbia Conservation Foundation
TABLE OF CONTENTS
1.0 INTRODUCTION.....................................................................................................1
2.0 STUDY AREA .........................................................................................................1
3.0 METHODS ..............................................................................................................3 3.1 MAINSTEM.............................................................................................................3 3.2 MORISON CREEK ...................................................................................................3
4.0 RESULTS................................................................................................................3 4.1 MAINSTEM.............................................................................................................3 4.2 MORISON CREEK ...................................................................................................4
5.0 DISCUSSION/RECOMMENDATIONS....................................................................5 5.1 MAINSTEM.............................................................................................................5 5.2 MORISON CREEK ...................................................................................................5
REFERENCES..................................................................................................................6 LIST OF FIGURES Figure 1. Englishman River watershed with stream flow measurement locations. ..........2 Figure 2. Comparison of Englishman River dishcarge values at locations above and below reaches suspected of groundwater loss, July 14 to September 25, 2003 ……….. 4 Figure 3. Mean daily discharge in Morison Creek, June 4 to October 2, 2003…….….... 4 LIST OF APPENDICES Appendix A. Depth/velocity spreadsheets used to derive discharge. Appendix B. Stage/discharge relationship for Morison Creek semi-permanent
flow station.

Stream Flow Monitoring in the Englishman River Watershed, 2003__________________________________________1
_____________________________________________________________________________________________ British Columbia Conservation Foundation
1.0 Introduction The Englishman River Watershed Recovery Plan, developed for and primarily funded by the Pacific Salmon Endowment Fund Society (PSEFS), is an initiative aimed at rebuilding wild salmon and steelhead stocks in the Englishman River. The Englishman River was selected for recovery by regional biologists from Department of Fisheries and Oceans (DFO) and Ministry of Water, Land and Air Protection (MWLAP) because it is a suitable size for habitat restoration activities and has a wide range of mostly wild anadromous fish species (Bocking and Gaboury 2001). Following initial development of the Plan, Lough and Morley conducted a study to identify limiting factors to salmonid production and “identify opportunities to alleviate these constraints to fish production”. Their study found “reduced summer rearing habitat caused by low summer flows” to be a major limiting factor. Additionally, a channel assessment identified potential for loss of surface flow through groundwater seepage, compounding the effects of low flows (nhc 2002). In 2002, the BC Conservation Foundation (BCCF) completed an extensive stream flow and water quality monitoring project. Results included four recommendations:
1. re-assess mainstem discharge to confirm if potential loss of flow resulting from groundwater seepage is significant (2002 results were inconclusive);
2. determine the cause of water losses in Morison Creek; 3. maintain summer flow near 20% of mean annual discharge (2.76 m3/s), with
a short term minimum base flow no lower than 10% (1.38 m3/s); and 4. initiate stream enrichment in the mainstem to increase primary productivity
(Wright 2003). This monitoring study addresses the first two recommendations listed above. Loss of flow resulting from groundwater seepage was re-assessed in 2003 with a series of discharge transects. Using a semi-permanent hydrometric station, a second year of flow data was collected in Morison Creek to confirm if unusual water losses observed in 2002 were atypical. 2.0 Study Area The Englishman River enters the Strait of Georgia on the central east coast of Vancouver Island near the city of Parksville (Figure 1). It supplies water to residents of Parksville and the Parksville East Water District. The watershed originates on Mount Arrowsmith and has a total area of approximately 325 km2 (Bocking and Gaboury 2001). Mean annual discharge (MAD), based on 23 years of Water Survey of Canada (WSC) data from 1915 to 2000, is 13.8 m3/s. A dam on the outlet of Arrowsmith Lake, in the headwaters of the Englishman River, has been augmenting low summer flows for fisheries and domestic purposes since 1999. The reservoir has a live storage volume of 9,000,000 m3 of water. Approximately 50% of the storage is allocated for fisheries purposes (Regional District of Nanaimo website). The current water license requires that 1.6 m3/s, (11.6% MAD), be maintained in the

Stream Flow Monitoring in the Englishman River Watershed, 2003__________________________________________2
_____________________________________________________________________________________________ British Columbia Conservation Foundation
lower river (Provisional Operation Rule), as measured at the WSC gauge at the Highway 19A bridge in Parksville.
Figure 1. Englishman River watershed with stream flow measurement locations.

Stream Flow Monitoring in the Englishman River Watershed, 2003__________________________________________3
_____________________________________________________________________________________________ British Columbia Conservation Foundation
3.0 Methods
3.1 Mainstem Discharge was measured in the Englishman River mainstem at a glide adjacent to the claybank 700 m downstream of the South Englishman River confuence, and at a glide 500 m downstream of the Highway 19A bridge (Figure 1). Sites were thus located located upstream and downstream of reach E3 (Lough and Morely 2002) where loss of flow stemming from groundwater seepage is suspected. Though the upstream site excludes flow diverted into the TimberWest side-channel5 that enters the bottom of reach E3, locating the site downstream of the South Englishman confluence was seen to be more important. Site selection and metering methodology was consistent with Resources Information Committee standards. Depth and velocity measurements were taken at a minimum of 20 stations equally spaced across the wetted width. Discharge was calculated by entering transect data into a standardized depth/velocity spreadsheet (Appendix A). Flows were measured at both sites every two weeks between mid-July and the end of September. On each day, the two sites were measured in succession to avoid significant time lapse.
3.2 Morison Creek For continuous monitoring, a semi-permanent pressure transducer device was installed on Morison Creek approximately 200 m upstream of its mouth. Equipment was purchased from Edutech Technologies Corp. (Gibson’s, B.C.) for the 2002 study. The instruments recorded hourly stage measurements while discharge at the site was manually measured bi-weekly to develop a rating curve (Appendix B). A staff gauge referenced to a benchmark was set to allow for correction and confirm the pressure transducer did not shift during the study period. 4.0 Results
4.1 Mainstem Flow metering results indicate that discharge downstream of the Hwy 19A bridge was typically higher than downstream of the South Englishman confluence. On four of six dates, discharge was greater at the lower site by approximately 0.1 m3/s. On July 14, the metered discharge was 0.4 m3/s greater at the upper site, though rain showers through the day account for some of this change. On August 11, during a stable hydrograph, discharge was 0.03 m3/s higher at the upper site, a difference of less than 2.5%.
5 Flow in the side-channel is consistently in the range of 0.1 m3/s during the summer.

Stream Flow Monitoring in the Englishman River Watershed, 2003__________________________________________4
_____________________________________________________________________________________________ British Columbia Conservation Foundation
2.1
1.0
1.21.1
1.6
1.3
1.7
1.2 1.2 1.21.1
1.7
1.4
0
0.5
1
1.5
2
2.5
July 14 July 29 Aug 11 Aug 25 Aug 28 Sep 15 Sep 25
Dis
char
ge (m
3 /s)
D/S of South EnglishmanD/S of Highw ay 19AMinimum fish f low requirement
Figure 2. Comparison of Englishman River discharge values at locations above and below reaches suspected of groundwater loss, July 14 to September 25, 2003. Results also suggest that minimum fish flow required under the current Provisional Operation Rule was not maintained (Figure 2). On August 28, test measurements were conducted with WSC staff to confirm metering results. Flows measured by WSC and BCCF personnel were 1.10 m3/s and 1.093 m3/s, respectively, confirming that flows were well below the required minimum of 1.6 m3/s.
4.2 Morison Creek Mean daily discharge derived from Morison Creek flow station data is displayed in Figure 3. Following installation on June 4, discharge decreased rapidly from 38 L/s to 15 L/s on June 10. After mid-June, flow decreased steadily until September 4, when the season’s lowest measurement of 6.6 L/s was recorded.
5
10
15
20
25
30
35
40
Jun Jul Aug Sep Oct
Dis
char
ge (L
/s)
Low est reading = 6.6 L/s on Sept.4
Figure 3. Mean daily discharge in Morison Creek, June 4 to October 2, 2003.

Stream Flow Monitoring in the Englishman River Watershed, 2003__________________________________________5
_____________________________________________________________________________________________ British Columbia Conservation Foundation
5.0 DISCUSSION/RECOMMENDATIONS
5.1 Mainstem Loss of discharge through groundwater seepage in the lower Englishman was confirmed to be insignificant. As would be expected, discharge was typically higher at the lower transect site than it was downstream of the South Englishman confluence (Figure 2). The July 14th data point suggests otherwise (0.4 m3/s loss of flow), but rain caused flow to increase throughout the day,6 and the upper transect was completed approximately 1.5 hours later that the lower transect. The upper transect site, downstream of the South Englishman, excludes water that is diverted into the TimberWest side-channel. Flow in the side-channel re-enters the mainstem upstream of the lower transect site. This diversion likely accounts for most if not all of the 0.1 m3/s higher flow typically measured below Highway 19A. Five of seven transects completed below the Highway 19A bridge indicate discharge values well below the 1.6 m3/s minimum required under the current operation rule (Figure 2). Riffle hydraulic suitability and wetted width analysis in 2002 indicated significant habitat loss occurs when flows drop below 10% MAD, or 1.4 m3/s (Wright 2003). Releases from Arrowsmith Dam are managed by the City of Parksville to achieve 1.6 m3/s or greater, based on discharge data emailed daily by WSC. Discharge data is preliminary and calculated using the most recent approved stage/discharge curve, which, in this case, was finalized in February 2003 (R. Gregory, WSC, pers. comm.). The discrepancy between calculated and measured flows suggests that channel conveyance at the WSC station changed significantly by the summer of 2003. This is an inherent complication with hydrometric stations, as real-time stage data must be translated to discharge using curves that quickly become outdated due to channel dynamics. Operationally, WSC is not currently resourced to modify staff/discharge relationships continuously, despite the fact that changes are regularly monitored and noted, and that their mandate is to determine flows within +/- 5% (R. Gregory, WSC, pers. comm.). WSC has suggested that an alternative to the present system that would alleviate some of the potential error from year to year. If necessary and adequately funded, preliminary shifts in the Englishman rating curve could be provided to Arrowsmith Water Service (City of Parksville) following each field measurement. The shift could be uploaded to the WSC database immediately and applied to obtain a preliminary corrected flow for Arrowsmith Water Service to better manage water releases from Arrowsmith Dam.
5.2 Morison Creek Results from the Morison Creek hydrometric station show a steady hydrograph in 2003 (Figure 3). There were no sudden water withdrawals in the headwaters to cause drastic
6 WSC data from the Englishman River hydrometric station indicate that flow steadily increased by 58% over the day.

Stream Flow Monitoring in the Englishman River Watershed, 2003__________________________________________6
_____________________________________________________________________________________________ British Columbia Conservation Foundation
loss of water. In 2002, there was a significant drop from 17 L/s to 4 L/s on August 4, likely due to agricultural withdrawals, though this was not confirmed. Low water in summer 2002 was exacerbated by an extremely dry fall, causing discharge to drop to 2 L/s in late October. REFERENCES Bocking, R.C. and M. Gaboury. 2001. Englishman River watershed recovery plan.
Prepared for Pacific Endowment Fund Society by LGL Limited, Sidney, BC.
Weyerhaeuser Canada Ltd., 2002. DRAFT Englishman River watershed assessment. Ostapowich Engineering Ltd. and Bill Pollard and Associates. Executive Summary. 10pp.
Lough, M.J and C.F. Morley. 2002. Overview assessment of fish and fish habitat in the Englishman River watershed. Prepared for Pacific Salmon Foundation, funded by Pacific Salmon Endowment Fund Society. pp 28 plus appendices.
Northwest Hydraulic Consultants. 2002. Englishman River channel assessment. Prepared for Pacific Salmon Foundation, funded by Pacific Salmon Endowment Fund Society. pp 15 plus appendices.
Resources Information Committee Standards. Government of British Columbia. Water Survey of Canada. 2002. HYDAT Version 2000 – 20.1, surface water and
sediment data. Environment Canada.
Wright, H.M. 2003. Stream flow, water quality, and low-level nutrient monitoring in the Englishman River watershed, 2002. Prepared for Pacific Salmon Foundation, funded by Pacific Salmon Endowment Fund Society. pp. 23 plus appendices.
Personal Communication Andrews, M. Environmental Monitoring Technician, Nanaimo Sub Office, Environment
Canada, Nanaimo, BC. Gregory, R. Head, Nanaimo Sub Office, Environment Canada, Nanaimo, B.C.
.

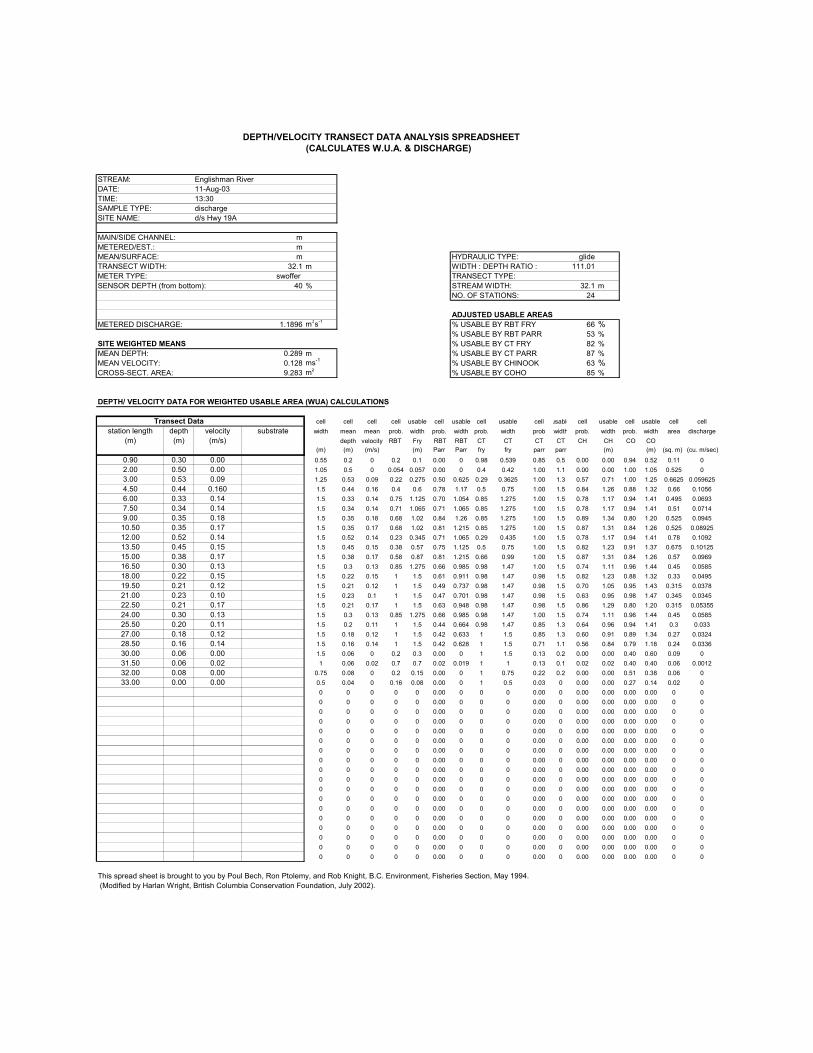
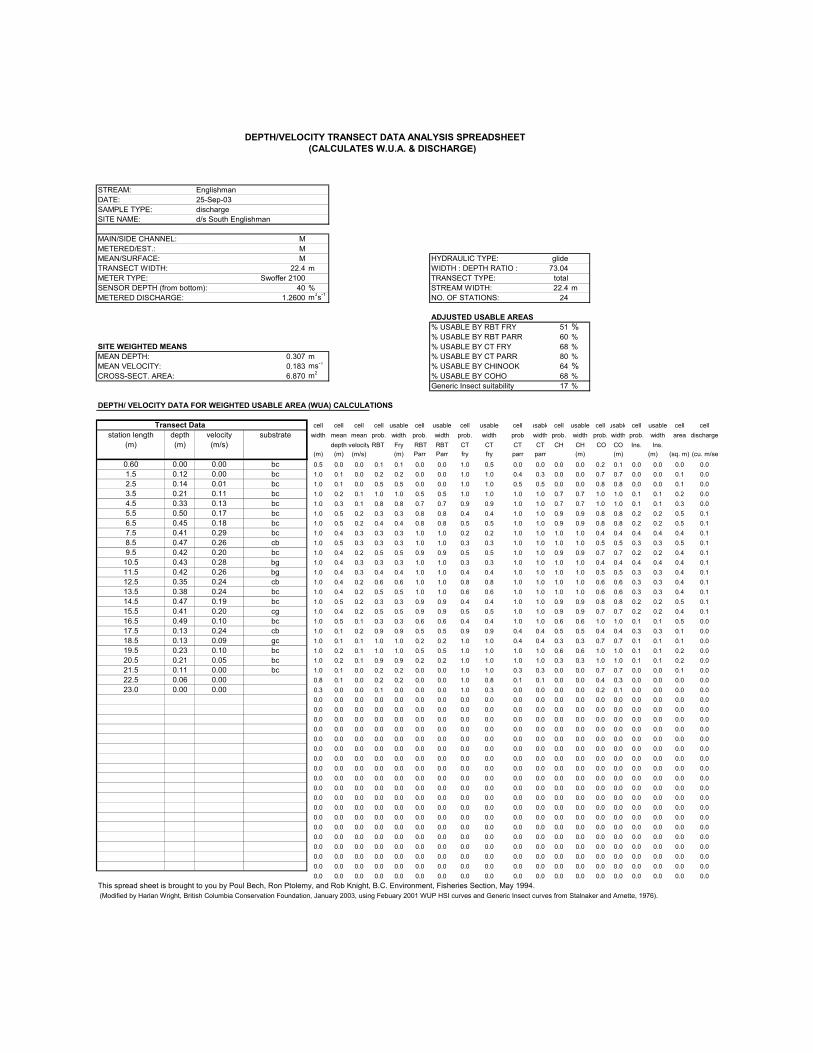
Appendix A
Depth/velocity spreadsheets used to derive discharge.

DEPTH/VELOCITY TRANSECT DATA ANALYSIS SPREADSHEET (CALCULATES W.U.A. & DISCHARGE)
STREAM:DATE:TIME:SAMPLE TYPE:SITE NAME:
MAIN/SIDE CHANNEL: mMETERED/EST.: mMEAN/SURFACE: m HYDRAULIC TYPE: glideTRANSECT WIDTH: 32.7 m WIDTH : DEPTH RATIO :METER TYPE: swoffer TRANSECT TYPE: totalSENSOR DEPTH (from bottom): 40 % STREAM WIDTH: 32.7 m
NO. OF STATIONS: 25
ADJUSTED USABLE AREASMETERED DISCHARGE: 1.7421 m3s-1 % USABLE BY RBT FRY %
% USABLE BY RBT PARR %SITE WEIGHTED MEANS % USABLE BY CT FRY %MEAN DEPTH: 0.326 m % USABLE BY CT PARR %MEAN VELOCITY: 0.164 ms-1 % USABLE BY CHINOOK %CROSS-SECT. AREA: 10.649 m2 % USABLE BY COHO %
DEPTH/ VELOCITY DATA FOR WEIGHTED USABLE AREA (WUA) CALCULATIONS
Transect Data cell cell cell cell usable cell usable cell usable cell usable cell usable cell usable cell cellstation length depth velocity substrate width mean mean prob. width prob. width prob. width prob width prob. width prob. width area discharge
(m) (m) (m/s) depth velocity RBT Fry RBT RBT CT CT CT CT CH CH CO CO(m) (m) (m/s) (m) Parr Parr fry fry parr parr (m) (m) (sq. m) (cu. m/sec)
1.00 0.28 0.00 0.75 0.23 0 0.2 0.2 0.00 0 0.98 0.735 0.98 0.7 0.00 0.00 0.98 0.74 0.1725 02.50 0.64 0.00 1.5 0.64 0 0.022 0.033 0.00 0 0.15 0.225 1.00 1.5 0.00 0.00 1.00 1.50 0.96 04.00 0.53 0.16 1.5 0.53 0.16 0.22 0.33 0.78 1.17 0.29 0.435 1.00 1.5 0.84 1.26 0.88 1.32 0.795 0.12725.50 0.40 0.230 1.5 0.4 0.23 0.478 0.718 0.96 1.44 0.594 0.891 1.00 1.5 0.97 1.46 0.60 0.90 0.6 0.1387.00 0.38 0.19 1.5 0.38 0.19 0.58 0.87 0.87 1.305 0.66 0.99 1.00 1.5 0.92 1.38 0.76 1.14 0.57 0.10838.50 0.44 0.19 1.5 0.44 0.19 0.4 0.6 0.87 1.305 0.5 0.75 1.00 1.5 0.92 1.38 0.76 1.14 0.66 0.125410.00 0.50 0.16 1.5 0.5 0.16 0.27 0.405 0.78 1.17 0.4 0.6 1.00 1.5 0.84 1.26 0.88 1.32 0.75 0.1211.50 0.47 0.17 1.5 0.47 0.17 0.34 0.51 0.81 1.215 0.4 0.6 1.00 1.5 0.87 1.31 0.84 1.26 0.705 0.1198513.00 0.52 0.21 1.5 0.52 0.21 0.223 0.335 0.92 1.38 0.261 0.3915 1.00 1.5 0.95 1.43 0.68 1.02 0.78 0.163814.50 0.46 0.20 1.5 0.46 0.2 0.36 0.54 0.90 1.35 0.4 0.6 1.00 1.5 0.94 1.41 0.72 1.08 0.69 0.13816.00 0.36 0.18 1.5 0.36 0.18 0.65 0.975 0.84 1.26 0.66 0.99 1.00 1.5 0.89 1.34 0.80 1.20 0.54 0.097217.50 0.30 0.14 1.5 0.3 0.14 0.85 1.275 0.70 1.044 0.98 1.47 1.00 1.5 0.78 1.17 0.94 1.41 0.45 0.06319.00 0.22 0.19 1.5 0.22 0.19 1 1.5 0.70 1.057 0.98 1.47 0.98 1.5 0.92 1.38 0.74 1.11 0.33 0.062720.50 0.20 0.22 1.5 0.2 0.22 0.94 1.41 0.71 1.058 0.882 1.323 0.85 1.3 0.92 1.38 0.60 0.90 0.3 0.06622.00 0.25 0.24 1.5 0.25 0.24 0.89 1.335 0.89 1.338 0.882 1.323 1.00 1.5 0.98 1.47 0.56 0.84 0.375 0.0923.50 0.30 0.18 1.5 0.3 0.18 0.85 1.275 0.82 1.235 0.98 1.47 1.00 1.5 0.89 1.34 0.80 1.20 0.45 0.08125.00 0.31 0.19 1.5 0.31 0.19 0.82 1.23 0.85 1.279 0.85 1.275 1.00 1.5 0.92 1.38 0.76 1.14 0.465 0.0883526.50 0.22 0.20 1.5 0.22 0.2 1 1.5 0.73 1.094 0.98 1.47 0.98 1.5 0.94 1.41 0.70 1.05 0.33 0.06628.00 0.19 0.19 1.5 0.19 0.19 1 1.5 0.62 0.927 0.98 1.47 0.85 1.3 0.84 1.26 0.70 1.05 0.285 0.0541529.50 0.12 0.08 1 0.12 0.08 1 1 0.19 0.189 1 1 0.36 0.4 0.22 0.22 0.70 0.70 0.12 0.009630.00 0.08 0.12 0.75 0.08 0.12 1 0.75 0.16 0.118 1 0.75 0.22 0.2 0.16 0.12 0.51 0.38 0.06 0.007231.00 0.10 0.10 1 0.1 0.1 1 1 0.18 0.182 1 1 0.27 0.3 0.19 0.19 0.61 0.61 0.1 0.0132.00 0.09 0.07 1 0.09 0.07 1 1 0.12 0.116 1 1 0.27 0.3 0.12 0.12 0.56 0.56 0.09 0.006333.00 0.07 0.00 0.85 0.07 0 0.2 0.17 0.00 0 1 0.85 0.22 0.2 0.00 0.00 0.45 0.38 0.0595 033.70 0.00 0.00 0.35 0.035 0 0.12 0.042 0.00 0 1 0.35 0.03 0 0.00 0.00 0.20 0.07 0.0123 0
0 0 0 0 0 0.00 0 0 0 0.00 0 0.00 0.00 0.00 0.00 0 00 0 0 0 0 0.00 0 0 0 0.00 0 0.00 0.00 0.00 0.00 0 00 0 0 0 0 0.00 0 0 0 0.00 0 0.00 0.00 0.00 0.00 0 00 0 0 0 0 0.00 0 0 0 0.00 0 0.00 0.00 0.00 0.00 0 00 0 0 0 0 0.00 0 0 0 0.00 0 0.00 0.00 0.00 0.00 0 00 0 0 0 0 0.00 0 0 0 0.00 0 0.00 0.00 0.00 0.00 0 00 0 0 0 0 0.00 0 0 0 0.00 0 0.00 0.00 0.00 0.00 0 00 0 0 0 0 0.00 0 0 0 0.00 0 0.00 0.00 0.00 0.00 0 00 0 0 0 0 0.00 0 0 0 0.00 0 0.00 0.00 0.00 0.00 0 00 0 0 0 0 0.00 0 0 0 0.00 0 0.00 0.00 0.00 0.00 0 00 0 0 0 0 0.00 0 0 0 0.00 0 0.00 0.00 0.00 0.00 0 00 0 0 0 0 0.00 0 0 0 0.00 0 0.00 0.00 0.00 0.00 0 00 0 0 0 0 0.00 0 0 0 0.00 0 0.00 0.00 0.00 0.00 0 00 0 0 0 0 0.00 0 0 0 0.00 0 0.00 0.00 0.00 0.00 0 00 0 0 0 0 0.00 0 0 0 0.00 0 0.00 0.00 0.00 0.00 0 00 0 0 0 0 0.00 0 0 0 0.00 0 0.00 0.00 0.00 0.00 0 00 0 0 0 0 0.00 0 0 0 0.00 0 0.00 0.00 0.00 0.00 0 0
This spread sheet is brought to you by Poul Bech, Ron Ptolemy, and Rob Knight, B.C. Environment, Fisheries Section, May 1994. (Modified by Harlan Wright, British Columbia Conservation Foundation, July 2002).
100.41
7273
63657287
Englishman River14-Jul-0313:15discharged/s Hwy 19A

DEPTH/VELOCITY TRANSECT DATA ANALYSIS SPREADSHEET (CALCULATES W.U.A. & DISCHARGE)
STREAM:DATE:TIME:SAMPLE TYPE:SITE NAME:
MAIN/SIDE CHANNEL: mMETERED/EST.: mMEAN/SURFACE: m HYDRAULIC TYPE: glideTRANSECT WIDTH: 22.5 m WIDTH : DEPTH RATIO :METER TYPE: swoffer TRANSECT TYPE: fullSENSOR DEPTH (from bottom): 40 % STREAM WIDTH: 22.5 m
NO. OF STATIONS: 24
ADJUSTED USABLE AREASMETERED DISCHARGE: 2.1254 m3s-1 % USABLE BY RBT FRY %
% USABLE BY RBT PARR %SITE WEIGHTED MEANS % USABLE BY CT FRY %MEAN DEPTH: 0.392 m % USABLE BY CT PARR %MEAN VELOCITY: 0.241 ms-1 % USABLE BY CHINOOK %CROSS-SECT. AREA: 8.816 m2 % USABLE BY COHO %
DEPTH/ VELOCITY DATA FOR WEIGHTED USABLE AREA (WUA) CALCULATIONS
Transect Data cell cell cell cell usable cell usable cell usable cell usable cell usable cell usable cell cellstation length depth velocity substrate width mean mean prob. width prob. width prob. width prob width prob. width prob. width area discharge
(m) (m) (m/s) depth velocity RBT Fry RBT RBT CT CT CT CT CH CH CO CO(m) (m) (m/s) (m) Parr Parr fry fry parr parr (m) (m) (sq. m) (cu. m/sec)
23.10 0.00 0.00 0.55 0.025 0.035 0.32 0.2 0.00 0 1 0.55 0.03 0 0.01 0.01 0.12 0.07 0.0138 0.00048122.00 0.10 0.07 1.05 0.1 0.07 1 1.05 0.13 0.139 1 1.05 0.27 0.3 0.14 0.14 0.61 0.64 0.105 0.0073521.00 0.17 0.05 1 0.17 0.05 0.9 0.9 0.19 0.189 1 1 0.71 0.7 0.27 0.27 0.87 0.87 0.17 0.008520.00 0.25 0.03 1 0.25 0.03 0.8 0.8 0.16 0.164 0.98 0.98 1.00 1 0.22 0.22 1.00 1.00 0.25 0.007519.00 0.35 0.05 1 0.35 0.05 0.612 0.612 0.30 0.3 0.85 0.85 1.00 1 0.35 0.35 1.00 1.00 0.35 0.017518.00 0.36 0.10 1 0.36 0.1 0.65 0.65 0.55 0.55 0.66 0.66 1.00 1 0.63 0.63 1.00 1.00 0.36 0.03617.00 0.40 0.09 1 0.4 0.09 0.52 0.52 0.50 0.5 0.66 0.66 1.00 1 0.57 0.57 1.00 1.00 0.4 0.03616.00 0.48 0.25 1 0.48 0.25 0.267 0.267 1.00 1 0.3 0.3 1.00 1 0.99 0.99 0.52 0.52 0.48 0.1215.00 0.55 0.27 1 0.55 0.27 0.142 0.142 1.00 1 0.16 0.1595 1.00 1 1.00 1.00 0.44 0.44 0.55 0.148514.00 0.50 0.24 1 0.5 0.24 0.24 0.24 0.98 0.98 0.36 0.36 1.00 1 0.98 0.98 0.56 0.56 0.5 0.1213.00 0.53 0.26 1 0.53 0.26 0.18 0.18 1.00 1 0.218 0.2175 1.00 1 1.00 1.00 0.48 0.48 0.53 0.137812.00 0.55 0.25 1 0.55 0.25 0.155 0.155 1.00 1 0.218 0.2175 1.00 1 0.99 0.99 0.52 0.52 0.55 0.137511.00 0.53 0.30 1 0.53 0.3 0.15 0.15 1.00 1 0.102 0.1015 0.99 1 1.00 1.00 0.33 0.33 0.53 0.15910.00 0.45 0.34 1 0.45 0.34 0.209 0.209 1.00 1 0.09 0.09 0.95 1 0.99 0.99 0.20 0.20 0.45 0.1539.00 0.44 0.25 1 0.44 0.25 0.344 0.344 1.00 1 0.375 0.375 1.00 1 0.99 0.99 0.52 0.52 0.44 0.118.00 0.53 0.20 1 0.53 0.2 0.22 0.22 0.90 0.9 0.29 0.29 1.00 1 0.94 0.94 0.72 0.72 0.53 0.1067.00 0.60 0.36 1 0.6 0.36 0.064 0.064 1.00 1 0.027 0.0273 0.92 0.9 0.97 0.97 0.14 0.14 0.6 0.2166.00 0.58 0.39 1 0.58 0.39 0.057 0.057 1.00 1 0.013 0.0126 0.80 0.8 0.94 0.94 0.08 0.08 0.58 0.22625.00 0.42 0.48 1 0.42 0.48 0.083 0.083 1.00 1 0.005 0.005 0.40 0.4 0.80 0.80 0.00 0.00 0.42 0.20164.00 0.33 0.30 1 0.33 0.3 0.51 0.51 0.99 0.99 0.298 0.2975 0.99 1 1.00 1.00 0.33 0.33 0.33 0.0993.00 0.30 0.21 1 0.3 0.21 0.825 0.825 0.90 0.902 0.882 0.882 1.00 1 0.95 0.95 0.68 0.68 0.3 0.0632.00 0.23 0.07 0.9 0.23 0.07 1 0.9 0.34 0.306 0.98 0.882 0.98 0.9 0.46 0.41 0.98 0.88 0.207 0.014491.20 0.20 0.00 0.7 0.2 0 0.2 0.14 0.00 0 0.98 0.686 0.85 0.6 0.00 0.00 0.94 0.66 0.14 00.60 0.00 0.00 0.3 0.1 0 0.2 0.06 0.00 0 1 0.3 0.27 0.1 0.00 0.00 0.61 0.18 0.03 0
0 0 0 0 0 0.00 0 0 0 0.00 0 0.00 0.00 0.00 0.00 0 00 0 0 0 0 0.00 0 0 0 0.00 0 0.00 0.00 0.00 0.00 0 00 0 0 0 0 0.00 0 0 0 0.00 0 0.00 0.00 0.00 0.00 0 00 0 0 0 0 0.00 0 0 0 0.00 0 0.00 0.00 0.00 0.00 0 00 0 0 0 0 0.00 0 0 0 0.00 0 0.00 0.00 0.00 0.00 0 00 0 0 0 0 0.00 0 0 0 0.00 0 0.00 0.00 0.00 0.00 0 00 0 0 0 0 0.00 0 0 0 0.00 0 0.00 0.00 0.00 0.00 0 00 0 0 0 0 0.00 0 0 0 0.00 0 0.00 0.00 0.00 0.00 0 00 0 0 0 0 0.00 0 0 0 0.00 0 0.00 0.00 0.00 0.00 0 00 0 0 0 0 0.00 0 0 0 0.00 0 0.00 0.00 0.00 0.00 0 00 0 0 0 0 0.00 0 0 0 0.00 0 0.00 0.00 0.00 0.00 0 00 0 0 0 0 0.00 0 0 0 0.00 0 0.00 0.00 0.00 0.00 0 00 0 0 0 0 0.00 0 0 0 0.00 0 0.00 0.00 0.00 0.00 0 00 0 0 0 0 0.00 0 0 0 0.00 0 0.00 0.00 0.00 0.00 0 00 0 0 0 0 0.00 0 0 0 0.00 0 0.00 0.00 0.00 0.00 0 00 0 0 0 0 0.00 0 0 0 0.00 0 0.00 0.00 0.00 0.00 0 00 0 0 0 0 0.00 0 0 0 0.00 0 0.00 0.00 0.00 0.00 0 00 0 0 0 0 0.00 0 0 0 0.00 0 0.00 0.00 0.00 0.00 0 0
This spread sheet is brought to you by Poul Bech, Ron Ptolemy, and Rob Knight, B.C. Environment, Fisheries Section, May 1994. (Modified by Harlan Wright, British Columbia Conservation Foundation, July 2002).
Englishman River14-Jul-0315:00Discharge Transectd/s South Englishman
57.43
7257
41714987
DEPTH/VELOCITY TRANSECT DATA ANALYSIS SPREADSHEET (CALCULATES W.U.A. & DISCHARGE)
STREAM:DATE:TIME:SAMPLE TYPE:SITE NAME:
MAIN/SIDE CHANNEL: mMETERED/EST.: mMEAN/SURFACE: m HYDRAULIC TYPE: glideTRANSECT WIDTH: 32.1 m WIDTH : DEPTH RATIO :METER TYPE: swoffer TRANSECT TYPE:SENSOR DEPTH (from bottom): 40 % STREAM WIDTH: 32.1 m
NO. OF STATIONS: 24
ADJUSTED USABLE AREASMETERED DISCHARGE: 1.1896 m3s-1 % USABLE BY RBT FRY %
% USABLE BY RBT PARR %SITE WEIGHTED MEANS % USABLE BY CT FRY %MEAN DEPTH: 0.289 m % USABLE BY CT PARR %MEAN VELOCITY: 0.128 ms-1 % USABLE BY CHINOOK %CROSS-SECT. AREA: 9.283 m2 % USABLE BY COHO %
DEPTH/ VELOCITY DATA FOR WEIGHTED USABLE AREA (WUA) CALCULATIONS
Transect Data cell cell cell cell usable cell usable cell usable cell usable cell usable cell usable cell cellstation length depth velocity substrate width mean mean prob. width prob. width prob. width prob width prob. width prob. width area discharge
(m) (m) (m/s) depth velocity RBT Fry RBT RBT CT CT CT CT CH CH CO CO(m) (m) (m/s) (m) Parr Parr fry fry parr parr (m) (m) (sq. m) (cu. m/sec)
0.90 0.30 0.00 0.55 0.2 0 0.2 0.1 0.00 0 0.98 0.539 0.85 0.5 0.00 0.00 0.94 0.52 0.11 02.00 0.50 0.00 1.05 0.5 0 0.054 0.057 0.00 0 0.4 0.42 1.00 1.1 0.00 0.00 1.00 1.05 0.525 03.00 0.53 0.09 1.25 0.53 0.09 0.22 0.275 0.50 0.625 0.29 0.3625 1.00 1.3 0.57 0.71 1.00 1.25 0.6625 0.0596254.50 0.44 0.160 1.5 0.44 0.16 0.4 0.6 0.78 1.17 0.5 0.75 1.00 1.5 0.84 1.26 0.88 1.32 0.66 0.10566.00 0.33 0.14 1.5 0.33 0.14 0.75 1.125 0.70 1.054 0.85 1.275 1.00 1.5 0.78 1.17 0.94 1.41 0.495 0.06937.50 0.34 0.14 1.5 0.34 0.14 0.71 1.065 0.71 1.065 0.85 1.275 1.00 1.5 0.78 1.17 0.94 1.41 0.51 0.07149.00 0.35 0.18 1.5 0.35 0.18 0.68 1.02 0.84 1.26 0.85 1.275 1.00 1.5 0.89 1.34 0.80 1.20 0.525 0.094510.50 0.35 0.17 1.5 0.35 0.17 0.68 1.02 0.81 1.215 0.85 1.275 1.00 1.5 0.87 1.31 0.84 1.26 0.525 0.0892512.00 0.52 0.14 1.5 0.52 0.14 0.23 0.345 0.71 1.065 0.29 0.435 1.00 1.5 0.78 1.17 0.94 1.41 0.78 0.109213.50 0.45 0.15 1.5 0.45 0.15 0.38 0.57 0.75 1.125 0.5 0.75 1.00 1.5 0.82 1.23 0.91 1.37 0.675 0.1012515.00 0.38 0.17 1.5 0.38 0.17 0.58 0.87 0.81 1.215 0.66 0.99 1.00 1.5 0.87 1.31 0.84 1.26 0.57 0.096916.50 0.30 0.13 1.5 0.3 0.13 0.85 1.275 0.66 0.985 0.98 1.47 1.00 1.5 0.74 1.11 0.96 1.44 0.45 0.058518.00 0.22 0.15 1.5 0.22 0.15 1 1.5 0.61 0.911 0.98 1.47 0.98 1.5 0.82 1.23 0.88 1.32 0.33 0.049519.50 0.21 0.12 1.5 0.21 0.12 1 1.5 0.49 0.737 0.98 1.47 0.98 1.5 0.70 1.05 0.95 1.43 0.315 0.037821.00 0.23 0.10 1.5 0.23 0.1 1 1.5 0.47 0.701 0.98 1.47 0.98 1.5 0.63 0.95 0.98 1.47 0.345 0.034522.50 0.21 0.17 1.5 0.21 0.17 1 1.5 0.63 0.948 0.98 1.47 0.98 1.5 0.86 1.29 0.80 1.20 0.315 0.0535524.00 0.30 0.13 1.5 0.3 0.13 0.85 1.275 0.66 0.985 0.98 1.47 1.00 1.5 0.74 1.11 0.96 1.44 0.45 0.058525.50 0.20 0.11 1.5 0.2 0.11 1 1.5 0.44 0.664 0.98 1.47 0.85 1.3 0.64 0.96 0.94 1.41 0.3 0.03327.00 0.18 0.12 1.5 0.18 0.12 1 1.5 0.42 0.633 1 1.5 0.85 1.3 0.60 0.91 0.89 1.34 0.27 0.032428.50 0.16 0.14 1.5 0.16 0.14 1 1.5 0.42 0.628 1 1.5 0.71 1.1 0.56 0.84 0.79 1.18 0.24 0.033630.00 0.06 0.00 1.5 0.06 0 0.2 0.3 0.00 0 1 1.5 0.13 0.2 0.00 0.00 0.40 0.60 0.09 031.50 0.06 0.02 1 0.06 0.02 0.7 0.7 0.02 0.019 1 1 0.13 0.1 0.02 0.02 0.40 0.40 0.06 0.001232.00 0.08 0.00 0.75 0.08 0 0.2 0.15 0.00 0 1 0.75 0.22 0.2 0.00 0.00 0.51 0.38 0.06 033.00 0.00 0.00 0.5 0.04 0 0.16 0.08 0.00 0 1 0.5 0.03 0 0.00 0.00 0.27 0.14 0.02 0
0 0 0 0 0 0.00 0 0 0 0.00 0 0.00 0.00 0.00 0.00 0 00 0 0 0 0 0.00 0 0 0 0.00 0 0.00 0.00 0.00 0.00 0 00 0 0 0 0 0.00 0 0 0 0.00 0 0.00 0.00 0.00 0.00 0 00 0 0 0 0 0.00 0 0 0 0.00 0 0.00 0.00 0.00 0.00 0 00 0 0 0 0 0.00 0 0 0 0.00 0 0.00 0.00 0.00 0.00 0 00 0 0 0 0 0.00 0 0 0 0.00 0 0.00 0.00 0.00 0.00 0 00 0 0 0 0 0.00 0 0 0 0.00 0 0.00 0.00 0.00 0.00 0 00 0 0 0 0 0.00 0 0 0 0.00 0 0.00 0.00 0.00 0.00 0 00 0 0 0 0 0.00 0 0 0 0.00 0 0.00 0.00 0.00 0.00 0 00 0 0 0 0 0.00 0 0 0 0.00 0 0.00 0.00 0.00 0.00 0 00 0 0 0 0 0.00 0 0 0 0.00 0 0.00 0.00 0.00 0.00 0 00 0 0 0 0 0.00 0 0 0 0.00 0 0.00 0.00 0.00 0.00 0 00 0 0 0 0 0.00 0 0 0 0.00 0 0.00 0.00 0.00 0.00 0 00 0 0 0 0 0.00 0 0 0 0.00 0 0.00 0.00 0.00 0.00 0 00 0 0 0 0 0.00 0 0 0 0.00 0 0.00 0.00 0.00 0.00 0 00 0 0 0 0 0.00 0 0 0 0.00 0 0.00 0.00 0.00 0.00 0 00 0 0 0 0 0.00 0 0 0 0.00 0 0.00 0.00 0.00 0.00 0 00 0 0 0 0 0.00 0 0 0 0.00 0 0.00 0.00 0.00 0.00 0 0
This spread sheet is brought to you by Poul Bech, Ron Ptolemy, and Rob Knight, B.C. Environment, Fisheries Section, May 1994. (Modified by Harlan Wright, British Columbia Conservation Foundation, July 2002).
111.01
6385
66538287
Englishman River11-Aug-0313:30discharged/s Hwy 19A

DEPTH/VELOCITY TRANSECT DATA ANALYSIS SPREADSHEET (CALCULATES W.U.A. & DISCHARGE)
STREAM:DATE:TIME:SAMPLE TYPE:SITE NAME:
MAIN/SIDE CHANNEL: mMETERED/EST.: mMEAN/SURFACE: m HYDRAULIC TYPE: glideTRANSECT WIDTH: 21.9 m WIDTH : DEPTH RATIO :METER TYPE: swoffer TRANSECT TYPE: fullSENSOR DEPTH (from bottom): 40 % STREAM WIDTH: 21.9 m
NO. OF STATIONS: 24
ADJUSTED USABLE AREASMETERED DISCHARGE: 1.2223 m3s-1 % USABLE BY RBT FRY %
% USABLE BY RBT PARR %SITE WEIGHTED MEANS % USABLE BY CT FRY %MEAN DEPTH: 0.313 m % USABLE BY CT PARR %MEAN VELOCITY: 0.179 ms-1 % USABLE BY CHINOOK %CROSS-SECT. AREA: 6.846 m2 % USABLE BY COHO %
DEPTH/ VELOCITY DATA FOR WEIGHTED USABLE AREA (WUA) CALCULATIONS
Transect Data cell cell cell cell usable cell usable cell usable cell usable cell usable cell usable cell cellstation length depth velocity substrate width mean mean prob. width prob. width prob. width prob width prob. width prob. width area discharge
(m) (m) (m/s) depth velocity RBT Fry RBT RBT CT CT CT CT CH CH CO CO(m) (m) (m/s) (m) Parr Parr fry fry parr parr (m) (m) (sq. m) (cu. m/sec)
2.00 0.00 0.00 0.5 0.018 0 0.04 0.0 0.00 0 1 0.5 0.03 0 0.00 0.00 0.05 0.03 0.0088 03.00 0.07 0.00 1 0.07 0 0.2 0.2 0.00 0 1 1 0.22 0.2 0.00 0.00 0.45 0.45 0.07 04.00 0.08 0.05 1 0.08 0.05 0.9 0.9 0.08 0.075 1 1 0.22 0.2 0.08 0.08 0.51 0.51 0.08 0.0045.00 0.17 0.10 1 0.17 0.1 1 1 0.35 0.347 1 1 0.71 0.7 0.49 0.49 0.87 0.87 0.17 0.0176.00 0.29 0.00 0.75 0.29 0 0.176 0.132 0.00 0 0.98 0.735 1.00 0.8 0.00 0.00 1.00 0.75 0.2175 06.50 0.25 0.07 0.5 0.25 0.07 1 0.5 0.36 0.182 0.98 0.49 1.00 0.5 0.46 0.23 1.00 0.50 0.125 0.008757.00 0.28 0.21 0.75 0.28 0.21 0.883 0.662 0.87 0.656 0.882 0.6615 1.00 0.8 0.95 0.71 0.68 0.51 0.21 0.04418.00 0.31 0.17 1 0.31 0.17 0.82 0.82 0.79 0.794 0.85 0.85 1.00 1 0.87 0.87 0.84 0.84 0.31 0.05279.00 0.40 0.18 1 0.4 0.18 0.52 0.52 0.84 0.84 0.66 0.66 1.00 1 0.89 0.89 0.80 0.80 0.4 0.072
10.00 0.47 0.19 1 0.47 0.19 0.34 0.34 0.87 0.87 0.4 0.4 1.00 1 0.92 0.92 0.76 0.76 0.47 0.089311.00 0.45 0.23 1 0.45 0.23 0.35 0.35 0.96 0.96 0.45 0.45 1.00 1 0.97 0.97 0.60 0.60 0.45 0.103512.00 0.45 0.16 1 0.45 0.16 0.38 0.38 0.78 0.78 0.5 0.5 1.00 1 0.84 0.84 0.88 0.88 0.45 0.07213.00 0.49 0.21 1 0.49 0.21 0.281 0.281 0.92 0.92 0.36 0.36 1.00 1 0.95 0.95 0.68 0.68 0.49 0.102914.00 0.38 0.27 1 0.38 0.27 0.458 0.458 1.00 1 0.363 0.363 1.00 1 1.00 1.00 0.44 0.44 0.38 0.102615.00 0.41 0.13 1 0.41 0.13 0.48 0.48 0.67 0.67 0.5 0.5 1.00 1 0.74 0.74 0.96 0.96 0.41 0.053316.00 0.40 0.20 1 0.4 0.2 0.52 0.52 0.90 0.9 0.66 0.66 1.00 1 0.94 0.94 0.72 0.72 0.4 0.0817.00 0.45 0.27 1 0.45 0.27 0.3 0.3 1.00 1 0.275 0.275 1.00 1 1.00 1.00 0.44 0.44 0.45 0.121518.00 0.52 0.24 1 0.52 0.24 0.205 0.205 0.98 0.98 0.261 0.261 1.00 1 0.98 0.98 0.56 0.56 0.52 0.124819.00 0.43 0.24 1 0.43 0.24 0.383 0.383 0.98 0.98 0.45 0.45 1.00 1 0.98 0.98 0.56 0.56 0.43 0.103220.00 0.29 0.20 1 0.29 0.2 0.88 0.88 0.87 0.873 0.98 0.98 1.00 1 0.94 0.94 0.72 0.72 0.29 0.05821.00 0.18 0.07 1 0.18 0.07 1 1 0.27 0.268 1 1 0.85 0.9 0.39 0.39 0.89 0.89 0.18 0.012622.00 0.17 0.00 1 0.17 0 0.2 0.2 0.00 0 1 1 0.71 0.7 0.00 0.00 0.87 0.87 0.17 023.00 0.14 0.00 0.95 0.14 0 0.2 0.19 0.00 0 1 0.95 0.50 0.5 0.00 0.00 0.78 0.74 0.133 023.90 0.00 0.00 0.45 0.07 0 0.2 0.09 0.00 0 1 0.45 0.22 0.1 0.00 0.00 0.45 0.20 0.0315 0
0 0 0 0 0 0.00 0 0 0 0.00 0 0.00 0.00 0.00 0.00 0 00 0 0 0 0 0.00 0 0 0 0.00 0 0.00 0.00 0.00 0.00 0 00 0 0 0 0 0.00 0 0 0 0.00 0 0.00 0.00 0.00 0.00 0 00 0 0 0 0 0.00 0 0 0 0.00 0 0.00 0.00 0.00 0.00 0 00 0 0 0 0 0.00 0 0 0 0.00 0 0.00 0.00 0.00 0.00 0 00 0 0 0 0 0.00 0 0 0 0.00 0 0.00 0.00 0.00 0.00 0 00 0 0 0 0 0.00 0 0 0 0.00 0 0.00 0.00 0.00 0.00 0 00 0 0 0 0 0.00 0 0 0 0.00 0 0.00 0.00 0.00 0.00 0 00 0 0 0 0 0.00 0 0 0 0.00 0 0.00 0.00 0.00 0.00 0 00 0 0 0 0 0.00 0 0 0 0.00 0 0.00 0.00 0.00 0.00 0 00 0 0 0 0 0.00 0 0 0 0.00 0 0.00 0.00 0.00 0.00 0 00 0 0 0 0 0.00 0 0 0 0.00 0 0.00 0.00 0.00 0.00 0 00 0 0 0 0 0.00 0 0 0 0.00 0 0.00 0.00 0.00 0.00 0 00 0 0 0 0 0.00 0 0 0 0.00 0 0.00 0.00 0.00 0.00 0 00 0 0 0 0 0.00 0 0 0 0.00 0 0.00 0.00 0.00 0.00 0 00 0 0 0 0 0.00 0 0 0 0.00 0 0.00 0.00 0.00 0.00 0 00 0 0 0 0 0.00 0 0 0 0.00 0 0.00 0.00 0.00 0.00 0 00 0 0 0 0 0.00 0 0 0 0.00 0 0.00 0.00 0.00 0.00 0 0
This spread sheet is brought to you by Poul Bech, Ron Ptolemy, and Rob Knight, B.C. Environment, Fisheries Section, May 1994. (Modified by Harlan Wright, British Columbia Conservation Foundation, July 2002).
Englishman River11-Aug-0315:00discharged/s South Englishman
70.06
6470
49607184

DEPTH/VELOCITY TRANSECT DATA ANALYSIS SPREADSHEET (CALCULATES W.U.A. & DISCHARGE)
STREAM:DATE:TIME:SAMPLE TYPE:SITE NAME:
MAIN/SIDE CHANNEL: mMETERED/EST.: mMEAN/SURFACE: m HYDRAULIC TYPE: glideTRANSECT WIDTH: 35.7 m WIDTH : DEPTH RATIO :METER TYPE: swoffer TRANSECT TYPE:SENSOR DEPTH (from bottom): 40 % STREAM WIDTH: 35.7 m
NO. OF STATIONS: 27
ADJUSTED USABLE AREASMETERED DISCHARGE: 1.1797 m3s-1 % USABLE BY RBT FRY %
% USABLE BY RBT PARR %SITE WEIGHTED MEANS % USABLE BY CT FRY %MEAN DEPTH: 0.243 m % USABLE BY CT PARR %MEAN VELOCITY: 0.136 ms-1 % USABLE BY CHINOOK %CROSS-SECT. AREA: 8.681 m2 % USABLE BY COHO %
DEPTH/ VELOCITY DATA FOR WEIGHTED USABLE AREA (WUA) CALCULATIONS
Transect Data cell cell cell cell usable cell usable cell usable cell usable cell usable cell usable cell cellstation length depth velocity substrate width mean mean prob. width prob. width prob. width prob width prob. width prob. width area discharge
(m) (m) (m/s) depth velocity RBT Fry RBT RBT CT CT CT CT CH CH CO CO(m) (m) (m/s) (m) Parr Parr fry fry parr parr (m) (m) (sq. m) (cu. m/sec)
0.50 0.14 0.00 0.5 0.115 0.025 0.7 0.4 0.04 0.02 1 0.5 0.36 0.2 0.06 0.03 0.66 0.33 0.0575 0.0014381.50 0.32 0.05 1 0.32 0.05 0.702 0.702 0.30 0.297 0.85 0.85 1.00 1 0.35 0.35 1.00 1.00 0.32 0.0162.50 0.53 0.13 1 0.53 0.13 0.22 0.22 0.67 0.67 0.29 0.29 1.00 1 0.74 0.74 0.96 0.96 0.53 0.06893.50 0.52 0.160 1.25 0.52 0.16 0.23 0.288 0.78 0.975 0.29 0.3625 1.00 1.3 0.84 1.05 0.88 1.10 0.65 0.1045.00 0.48 0.12 1.5 0.48 0.12 0.31 0.465 0.63 0.945 0.4 0.6 1.00 1.5 0.71 1.07 1.00 1.50 0.72 0.08646.50 0.32 0.11 1.5 0.32 0.11 0.78 1.17 0.58 0.876 0.85 1.275 1.00 1.5 0.67 1.01 1.00 1.50 0.48 0.05288.00 0.41 0.13 1.5 0.41 0.13 0.48 0.72 0.67 1.005 0.5 0.75 1.00 1.5 0.74 1.11 0.96 1.44 0.615 0.079959.50 0.42 0.12 1.5 0.42 0.12 0.46 0.69 0.63 0.945 0.5 0.75 1.00 1.5 0.71 1.07 1.00 1.50 0.63 0.075611.00 0.34 0.17 1.5 0.34 0.17 0.71 1.065 0.81 1.215 0.85 1.275 1.00 1.5 0.87 1.31 0.84 1.26 0.51 0.086712.50 0.32 0.16 1.5 0.32 0.16 0.78 1.17 0.77 1.158 0.85 1.275 1.00 1.5 0.84 1.26 0.88 1.32 0.48 0.076814.00 0.31 0.15 1.5 0.31 0.15 0.82 1.23 0.74 1.103 0.85 1.275 1.00 1.5 0.82 1.23 0.91 1.37 0.465 0.0697515.50 0.28 0.16 1.5 0.28 0.16 0.91 1.365 0.74 1.112 0.98 1.47 1.00 1.5 0.84 1.26 0.88 1.32 0.42 0.067217.00 0.19 0.13 1.5 0.19 0.13 1 1.5 0.48 0.714 0.98 1.47 0.85 1.3 0.67 1.01 0.88 1.32 0.285 0.0370518.50 0.22 0.10 1.5 0.22 0.1 1 1.5 0.45 0.668 0.98 1.47 0.98 1.5 0.63 0.95 0.97 1.46 0.33 0.03320.00 0.21 0.18 1.5 0.21 0.18 1 1.5 0.66 0.983 0.98 1.47 0.98 1.5 0.88 1.32 0.76 1.14 0.315 0.056721.50 0.24 0.14 1.5 0.24 0.14 1 1.5 0.62 0.937 0.98 1.47 1.00 1.5 0.78 1.17 0.93 1.40 0.36 0.050423.00 0.17 0.23 1.5 0.17 0.23 0.92 1.38 0.60 0.907 0.9 1.35 0.71 1.1 0.76 1.13 0.52 0.78 0.255 0.0586524.50 0.17 0.12 1.5 0.17 0.12 1 1.5 0.40 0.595 1 1.5 0.71 1.1 0.55 0.83 0.87 1.31 0.255 0.030626.00 0.13 0.19 1.5 0.13 0.19 1 1.5 0.40 0.6 1 1.5 0.36 0.5 0.46 0.69 0.56 0.84 0.195 0.0370527.50 0.11 0.18 1.5 0.11 0.18 1 1.5 0.31 0.466 1 1.5 0.27 0.4 0.33 0.49 0.53 0.79 0.165 0.029729.00 0.09 0.10 1.5 0.09 0.1 1 1.5 0.16 0.239 1 1.5 0.27 0.4 0.16 0.25 0.56 0.84 0.135 0.013530.50 0.06 0.19 1.5 0.06 0.19 1 1.5 0.15 0.222 1 1.5 0.13 0.2 0.14 0.21 0.30 0.46 0.09 0.017132.00 0.04 0.11 1.5 0.04 0.11 0.8 1.2 0.05 0.08 1 1.5 0.03 0 0.07 0.10 0.27 0.41 0.06 0.006633.50 0.07 0.01 1.5 0.07 0.01 0.5 0.75 0.01 0.016 1 1.5 0.22 0.3 0.01 0.02 0.45 0.68 0.105 0.0010535.00 0.14 0.13 1.25 0.14 0.13 1 1.25 0.34 0.427 1 1.25 0.50 0.6 0.43 0.54 0.75 0.94 0.175 0.0227536.00 0.12 0.00 0.6 0.12 0 0.2 0.12 0.00 0 1 0.6 0.36 0.2 0.00 0.00 0.70 0.42 0.072 036.20 0.00 0.00 0.1 0.06 0 0.2 0.02 0.00 0 1 0.1 0.13 0 0.00 0.00 0.40 0.04 0.006 0
0 0 0 0 0 0.00 0 0 0 0.00 0 0.00 0.00 0.00 0.00 0 00 0 0 0 0 0.00 0 0 0 0.00 0 0.00 0.00 0.00 0.00 0 00 0 0 0 0 0.00 0 0 0 0.00 0 0.00 0.00 0.00 0.00 0 00 0 0 0 0 0.00 0 0 0 0.00 0 0.00 0.00 0.00 0.00 0 00 0 0 0 0 0.00 0 0 0 0.00 0 0.00 0.00 0.00 0.00 0 00 0 0 0 0 0.00 0 0 0 0.00 0 0.00 0.00 0.00 0.00 0 00 0 0 0 0 0.00 0 0 0 0.00 0 0.00 0.00 0.00 0.00 0 00 0 0 0 0 0.00 0 0 0 0.00 0 0.00 0.00 0.00 0.00 0 00 0 0 0 0 0.00 0 0 0 0.00 0 0.00 0.00 0.00 0.00 0 00 0 0 0 0 0.00 0 0 0 0.00 0 0.00 0.00 0.00 0.00 0 00 0 0 0 0 0.00 0 0 0 0.00 0 0.00 0.00 0.00 0.00 0 00 0 0 0 0 0.00 0 0 0 0.00 0 0.00 0.00 0.00 0.00 0 00 0 0 0 0 0.00 0 0 0 0.00 0 0.00 0.00 0.00 0.00 0 00 0 0 0 0 0.00 0 0 0 0.00 0 0.00 0.00 0.00 0.00 0 00 0 0 0 0 0.00 0 0 0 0.00 0 0.00 0.00 0.00 0.00 0 0
This spread sheet is brought to you by Poul Bech, Ron Ptolemy, and Rob Knight, B.C. Environment, Fisheries Section, May 1994. (Modified by Harlan Wright, British Columbia Conservation Foundation, July 2002).
Englishman River25-Aug-0313:00discharged/s Hwy 19A
146.82
5777
77488573

DEPTH/VELOCITY TRANSECT DATA ANALYSIS SPREADSHEET (CALCULATES W.U.A. & DISCHARGE)
STREAM:DATE:TIME:SAMPLE TYPE:SITE NAME:
MAIN/SIDE CHANNEL: mMETERED/EST.: mMEAN/SURFACE: m HYDRAULIC TYPE: glideTRANSECT WIDTH: 21.8 m WIDTH : DEPTH RATIO :METER TYPE: swoffer TRANSECT TYPE: fullSENSOR DEPTH (from bottom): 40 % STREAM WIDTH: 21.8 m
NO. OF STATIONS: 26
ADJUSTED USABLE AREASMETERED DISCHARGE: 1.1022 m3s-1 % USABLE BY RBT FRY %
% USABLE BY RBT PARR %SITE WEIGHTED MEANS % USABLE BY CT FRY %MEAN DEPTH: 0.316 m % USABLE BY CT PARR %MEAN VELOCITY: 0.160 ms-1 % USABLE BY CHINOOK %CROSS-SECT. AREA: 6.883 m2 % USABLE BY COHO %
DEPTH/ VELOCITY DATA FOR WEIGHTED USABLE AREA (WUA) CALCULATIONS
Transect Data cell cell cell cell usable cell usable cell usable cell usable cell usable cell usable cell cellstation length depth velocity substrate width mean mean prob. width prob. width prob. width prob width prob. width prob. width area discharge
(m) (m) (m/s) depth velocity RBT Fry RBT RBT CT CT CT CT CH CH CO CO(m) (m) (m/s) (m) Parr Parr fry fry parr parr (m) (m) (sq. m) (cu. m/sec)
1.00 0.00 0.00 0.5 0.035 0 0.12 0.1 0.00 0 1 0.5 0.03 0 0.00 0.00 0.20 0.10 0.0175 02.00 0.14 0.00 1 0.14 0 0.2 0.2 0.00 0 1 1 0.50 0.5 0.00 0.00 0.78 0.78 0.14 03.00 0.19 0.02 0.85 0.19 0.02 0.7 0.595 0.08 0.066 0.98 0.833 0.85 0.7 0.14 0.12 0.92 0.78 0.1615 0.003233.70 0.21 0.08 0.6 0.21 0.08 1 0.6 0.35 0.211 0.98 0.588 0.98 0.6 0.51 0.31 0.95 0.57 0.126 0.010084.20 0.15 0.14 0.65 0.15 0.14 1 0.65 0.39 0.254 1 0.65 0.50 0.3 0.49 0.32 0.76 0.49 0.0975 0.013655.00 0.33 0.21 0.9 0.33 0.21 0.728 0.655 0.91 0.82 0.765 0.6885 1.00 0.9 0.95 0.86 0.68 0.61 0.297 0.062376.00 0.40 0.25 1 0.4 0.25 0.447 0.447 1.00 1 0.495 0.495 1.00 1 0.99 0.99 0.52 0.52 0.4 0.17.00 0.55 0.18 1 0.55 0.18 0.18 0.18 0.84 0.84 0.29 0.29 1.00 1 0.89 0.89 0.80 0.80 0.55 0.0998.00 0.47 0.24 1 0.47 0.24 0.303 0.303 0.98 0.98 0.36 0.36 1.00 1 0.98 0.98 0.56 0.56 0.47 0.11289.00 0.35 0.23 1 0.35 0.23 0.626 0.626 0.96 0.96 0.765 0.765 1.00 1 0.97 0.97 0.60 0.60 0.35 0.0805
10.00 0.48 0.14 0.75 0.48 0.14 0.31 0.233 0.71 0.533 0.4 0.3 1.00 0.8 0.78 0.59 0.94 0.71 0.36 0.050410.50 0.49 0.28 0.5 0.49 0.28 0.218 0.109 1.00 0.5 0.22 0.11 1.00 0.5 1.00 0.50 0.40 0.20 0.245 0.068611.00 0.43 0.21 0.75 0.43 0.21 0.417 0.313 0.92 0.69 0.45 0.3375 1.00 0.8 0.95 0.71 0.68 0.51 0.3225 0.06772512.00 0.44 0.08 0.75 0.44 0.08 0.4 0.3 0.45 0.338 0.5 0.375 1.00 0.8 0.52 0.39 1.00 0.75 0.33 0.026412.50 0.41 0.15 0.5 0.41 0.15 0.48 0.24 0.75 0.375 0.5 0.25 1.00 0.5 0.82 0.41 0.91 0.46 0.205 0.0307513.00 0.46 0.16 0.75 0.46 0.16 0.36 0.27 0.78 0.585 0.4 0.3 1.00 0.8 0.84 0.63 0.88 0.66 0.345 0.055214.00 0.44 0.12 1 0.44 0.12 0.4 0.4 0.63 0.63 0.5 0.5 1.00 1 0.71 0.71 1.00 1.00 0.44 0.052815.00 0.45 0.22 1 0.45 0.22 0.357 0.357 0.94 0.94 0.45 0.45 1.00 1 0.96 0.96 0.64 0.64 0.45 0.09916.00 0.40 0.18 1 0.4 0.18 0.52 0.52 0.84 0.84 0.66 0.66 1.00 1 0.89 0.89 0.80 0.80 0.4 0.07217.00 0.32 0.14 1 0.32 0.14 0.78 0.78 0.70 0.703 0.85 0.85 1.00 1 0.78 0.78 0.94 0.94 0.32 0.044818.00 0.25 0.16 1 0.25 0.16 1 1 0.71 0.71 0.98 0.98 1.00 1 0.84 0.84 0.88 0.88 0.25 0.0419.00 0.31 0.00 1 0.31 0 0.164 0.164 0.00 0 0.85 0.85 1.00 1 0.00 0.00 1.00 1.00 0.31 020.00 0.15 0.07 1 0.15 0.07 1 1 0.22 0.22 1 1 0.50 0.5 0.29 0.29 0.81 0.81 0.15 0.010521.00 0.08 0.03 1 0.08 0.03 0.8 0.8 0.05 0.045 1 1 0.22 0.2 0.05 0.05 0.51 0.51 0.08 0.002422.00 0.06 0.00 0.9 0.06 0 0.2 0.18 0.00 0 1 0.9 0.13 0.1 0.00 0.00 0.40 0.36 0.054 022.80 0.00 0.00 0.4 0.03 0 0.12 0.048 0.00 0 1 0.4 0.03 0 0.00 0.00 0.20 0.08 0.012 0
0 0 0 0 0 0.00 0 0 0 0.00 0 0.00 0.00 0.00 0.00 0 00 0 0 0 0 0.00 0 0 0 0.00 0 0.00 0.00 0.00 0.00 0 00 0 0 0 0 0.00 0 0 0 0.00 0 0.00 0.00 0.00 0.00 0 00 0 0 0 0 0.00 0 0 0 0.00 0 0.00 0.00 0.00 0.00 0 00 0 0 0 0 0.00 0 0 0 0.00 0 0.00 0.00 0.00 0.00 0 00 0 0 0 0 0.00 0 0 0 0.00 0 0.00 0.00 0.00 0.00 0 00 0 0 0 0 0.00 0 0 0 0.00 0 0.00 0.00 0.00 0.00 0 00 0 0 0 0 0.00 0 0 0 0.00 0 0.00 0.00 0.00 0.00 0 00 0 0 0 0 0.00 0 0 0 0.00 0 0.00 0.00 0.00 0.00 0 00 0 0 0 0 0.00 0 0 0 0.00 0 0.00 0.00 0.00 0.00 0 00 0 0 0 0 0.00 0 0 0 0.00 0 0.00 0.00 0.00 0.00 0 00 0 0 0 0 0.00 0 0 0 0.00 0 0.00 0.00 0.00 0.00 0 00 0 0 0 0 0.00 0 0 0 0.00 0 0.00 0.00 0.00 0.00 0 00 0 0 0 0 0.00 0 0 0 0.00 0 0.00 0.00 0.00 0.00 0 00 0 0 0 0 0.00 0 0 0 0.00 0 0.00 0.00 0.00 0.00 0 00 0 0 0 0 0.00 0 0 0 0.00 0 0.00 0.00 0.00 0.00 0 0
This spread sheet is brought to you by Poul Bech, Ron Ptolemy, and Rob Knight, B.C. Environment, Fisheries Section, May 1994. (Modified by Harlan Wright, British Columbia Conservation Foundation, July 2002).
69.05
6074
51567182
Englishman River25-Aug-0314:30discharged/s South Englishman

DEPTH/VELOCITY TRANSECT DATA ANALYSIS SPREADSHEET (CALCULATES W.U.A. & DISCHARGE)
STREAM:DATE:SAMPLE TYPE:SITE NAME:
MAIN/SIDE CHANNEL: MMETERED/EST.: MMEAN/SURFACE: M HYDRAULIC TYPE: glideTRANSECT WIDTH: 32.0 m WIDTH : DEPTH RATIO :METER TYPE: Swoffer 2100 TRANSECT TYPE: totalSENSOR DEPTH (from bottom): 40 % STREAM WIDTH: 32.0 mMETERED DISCHARGE: 1.0927 m3s-1 NO. OF STATIONS: 25
ADJUSTED USABLE AREAS% USABLE BY RBT FRY %% USABLE BY RBT PARR %
SITE WEIGHTED MEANS % USABLE BY CT FRY %MEAN DEPTH: 0.289 m % USABLE BY CT PARR %MEAN VELOCITY: 0.118 ms-1 % USABLE BY CHINOOK %CROSS-SECT. AREA: 9.266 m2 % USABLE BY COHO %
Generic Insect suitability %
DEPTH/ VELOCITY DATA FOR WEIGHTED USABLE AREA (WUA) CALCULATIONS
Transect Data cell cell cell cell usable cell usable cell usable cell usable cell usable cell usable cell usable cell cellstation length depth velocity substrate width mean mean prob. width prob. width prob. width prob width prob. width prob. width prob. width area discharge
(m) (m) (m/s) depth velocity RBT Fry RBT RBT CT CT CT CT CH CH CO CO Ins. Ins.(m) (m) (m/s) (m) Parr Parr fry fry parr parr (m) (m) (m) (sq. m) (cu. m/se
1.59 0.00 0.00 0.0 0.1 0.0 0.2 0.0 0.0 0.0 1.0 0.0 0.3 0.0 0.0 0.0 0.6 0.0 0.0 0.0 0.0 0.01.6 0.39 0.00 0.7 0.4 0.0 0.1 0.1 0.0 0.0 0.7 0.5 1.0 0.7 0.0 0.0 1.0 0.7 0.0 0.0 0.3 0.03.0 0.56 0.08 1.5 0.6 0.1 0.2 0.2 0.5 0.7 0.2 0.3 1.0 1.5 0.5 0.8 1.0 1.5 0.1 0.1 0.8 0.14.5 0.44 0.12 1.5 0.4 0.1 0.4 0.6 0.6 0.9 0.5 0.8 1.0 1.5 0.7 1.1 1.0 1.5 0.1 0.2 0.7 0.16.0 0.42 0.11 1.5 0.4 0.1 0.5 0.7 0.6 0.9 0.5 0.8 1.0 1.5 0.7 1.0 1.0 1.5 0.1 0.2 0.6 0.17.5 0.35 0.16 1.5 0.4 0.2 0.7 1.0 0.8 1.2 0.9 1.3 1.0 1.5 0.8 1.3 0.9 1.3 0.2 0.2 0.5 0.19.0 0.34 0.12 1.5 0.3 0.1 0.7 1.1 0.6 0.9 0.9 1.3 1.0 1.5 0.7 1.1 1.0 1.5 0.1 0.2 0.5 0.110.5 0.38 0.11 1.5 0.4 0.1 0.6 0.9 0.6 0.9 0.7 1.0 1.0 1.5 0.7 1.0 1.0 1.5 0.1 0.2 0.6 0.112.0 0.42 0.18 1.5 0.4 0.2 0.5 0.7 0.8 1.3 0.5 0.8 1.0 1.5 0.9 1.3 0.8 1.2 0.2 0.3 0.6 0.113.5 0.46 0.15 1.5 0.5 0.2 0.4 0.5 0.8 1.1 0.4 0.6 1.0 1.5 0.8 1.2 0.9 1.4 0.2 0.2 0.7 0.115.0 0.41 0.10 1.5 0.4 0.1 0.5 0.7 0.6 0.8 0.5 0.8 1.0 1.5 0.6 0.9 1.0 1.5 0.1 0.2 0.6 0.116.5 0.33 0.11 1.5 0.3 0.1 0.8 1.1 0.6 0.9 0.9 1.3 1.0 1.5 0.7 1.0 1.0 1.5 0.1 0.2 0.5 0.118.0 0.20 0.15 1.5 0.2 0.2 1.0 1.5 0.6 0.8 1.0 1.5 0.9 1.3 0.8 1.2 0.9 1.3 0.2 0.2 0.3 0.019.5 0.21 0.09 1.5 0.2 0.1 1.0 1.5 0.4 0.6 1.0 1.5 1.0 1.5 0.6 0.8 1.0 1.4 0.1 0.1 0.3 0.021.0 0.24 0.15 1.5 0.2 0.2 1.0 1.5 0.7 1.0 1.0 1.5 1.0 1.5 0.8 1.2 0.9 1.4 0.2 0.2 0.4 0.122.5 0.20 0.19 1.5 0.2 0.2 1.0 1.5 0.7 1.0 1.0 1.5 0.9 1.3 0.9 1.3 0.7 1.1 0.2 0.3 0.3 0.124.0 0.24 0.14 1.5 0.2 0.1 1.0 1.5 0.6 0.9 1.0 1.5 1.0 1.5 0.8 1.2 0.9 1.4 0.1 0.2 0.4 0.125.5 0.25 0.12 1.5 0.3 0.1 1.0 1.5 0.6 0.9 1.0 1.5 1.0 1.5 0.7 1.1 1.0 1.5 0.1 0.2 0.4 0.027.0 0.21 0.08 1.5 0.2 0.1 1.0 1.5 0.4 0.5 1.0 1.5 1.0 1.5 0.5 0.8 1.0 1.4 0.1 0.1 0.3 0.028.5 0.16 0.09 1.5 0.2 0.1 1.0 1.5 0.3 0.4 1.0 1.5 0.7 1.1 0.4 0.6 0.8 1.3 0.1 0.1 0.2 0.030.0 0.09 0.01 1.5 0.1 0.0 0.5 0.8 0.0 0.0 1.0 1.5 0.3 0.4 0.0 0.0 0.6 0.8 0.0 0.0 0.1 0.031.5 0.07 0.10 1.3 0.1 0.1 1.0 1.3 0.1 0.1 1.0 1.3 0.2 0.3 0.1 0.1 0.5 0.6 0.0 0.1 0.1 0.0
32.50 0.06 0.04 0.8 0.1 0.0 0.9 0.6 0.0 0.0 1.0 0.8 0.1 0.1 0.0 0.0 0.4 0.3 0.0 0.0 0.0 0.033.0 0.03 0.00 0.6 0.0 0.0 0.1 0.1 0.0 0.0 1.0 0.6 0.0 0.0 0.0 0.0 0.2 0.1 0.0 0.0 0.0 0.033.6 0.00 0.00 0.3 0.0 0.0 0.0 0.0 0.0 0.0 1.0 0.3 0.0 0.0 0.0 0.0 0.1 0.0 0.0 0.0 0.0 0.0
0.0 0.0 0.0 0.0 0.0 0.0 0.0 0.0 0.0 0.0 0.0 0.0 0.0 0.0 0.0 0.0 0.0 0.0 0.00.0 0.0 0.0 0.0 0.0 0.0 0.0 0.0 0.0 0.0 0.0 0.0 0.0 0.0 0.0 0.0 0.0 0.0 0.00.0 0.0 0.0 0.0 0.0 0.0 0.0 0.0 0.0 0.0 0.0 0.0 0.0 0.0 0.0 0.0 0.0 0.0 0.00.0 0.0 0.0 0.0 0.0 0.0 0.0 0.0 0.0 0.0 0.0 0.0 0.0 0.0 0.0 0.0 0.0 0.0 0.00.0 0.0 0.0 0.0 0.0 0.0 0.0 0.0 0.0 0.0 0.0 0.0 0.0 0.0 0.0 0.0 0.0 0.0 0.00.0 0.0 0.0 0.0 0.0 0.0 0.0 0.0 0.0 0.0 0.0 0.0 0.0 0.0 0.0 0.0 0.0 0.0 0.00.0 0.0 0.0 0.0 0.0 0.0 0.0 0.0 0.0 0.0 0.0 0.0 0.0 0.0 0.0 0.0 0.0 0.0 0.00.0 0.0 0.0 0.0 0.0 0.0 0.0 0.0 0.0 0.0 0.0 0.0 0.0 0.0 0.0 0.0 0.0 0.0 0.00.0 0.0 0.0 0.0 0.0 0.0 0.0 0.0 0.0 0.0 0.0 0.0 0.0 0.0 0.0 0.0 0.0 0.0 0.00.0 0.0 0.0 0.0 0.0 0.0 0.0 0.0 0.0 0.0 0.0 0.0 0.0 0.0 0.0 0.0 0.0 0.0 0.00.0 0.0 0.0 0.0 0.0 0.0 0.0 0.0 0.0 0.0 0.0 0.0 0.0 0.0 0.0 0.0 0.0 0.0 0.00.0 0.0 0.0 0.0 0.0 0.0 0.0 0.0 0.0 0.0 0.0 0.0 0.0 0.0 0.0 0.0 0.0 0.0 0.00.0 0.0 0.0 0.0 0.0 0.0 0.0 0.0 0.0 0.0 0.0 0.0 0.0 0.0 0.0 0.0 0.0 0.0 0.00.0 0.0 0.0 0.0 0.0 0.0 0.0 0.0 0.0 0.0 0.0 0.0 0.0 0.0 0.0 0.0 0.0 0.0 0.00.0 0.0 0.0 0.0 0.0 0.0 0.0 0.0 0.0 0.0 0.0 0.0 0.0 0.0 0.0 0.0 0.0 0.0 0.00.0 0.0 0.0 0.0 0.0 0.0 0.0 0.0 0.0 0.0 0.0 0.0 0.0 0.0 0.0 0.0 0.0 0.0 0.00.0 0.0 0.0 0.0 0.0 0.0 0.0 0.0 0.0 0.0 0.0 0.0 0.0 0.0 0.0 0.0 0.0 0.0 0.00.0 0.0 0.0 0.0 0.0 0.0 0.0 0.0 0.0 0.0 0.0 0.0 0.0 0.0 0.0 0.0 0.0 0.0 0.0
This spread sheet is brought to you by Poul Bech, Ron Ptolemy, and Rob Knight, B.C. Environment, Fisheries Section, May 1994. (Modified by Harlan Wright, British Columbia Conservation Foundation, January 2003, using Febuary 2001 WUP HSI curves and Generic Insect curves from Stalnaker and Arnette, 1976).
11
110.58
6086
7050
Englishman28-Aug-03discharged/s Hwy 19A
7986

DEPTH/VELOCITY TRANSECT DATA ANALYSIS SPREADSHEET (CALCULATES W.U.A. & DISCHARGE)
STREAM:DATE:SAMPLE TYPE:SITE NAME:
MAIN/SIDE CHANNEL: MMETERED/EST.: MMEAN/SURFACE: M HYDRAULIC TYPE: glideTRANSECT WIDTH: 36.4 m WIDTH : DEPTH RATIO :METER TYPE: Swoffer 2100 TRANSECT TYPE: totalSENSOR DEPTH (from bottom): 40 % STREAM WIDTH: 36.4 mMETERED DISCHARGE: 1.6534 m3s-1 NO. OF STATIONS: 38
ADJUSTED USABLE AREAS% USABLE BY RBT FRY %% USABLE BY RBT PARR %
SITE WEIGHTED MEANS % USABLE BY CT FRY %MEAN DEPTH: 0.238 m % USABLE BY CT PARR %MEAN VELOCITY: 0.190 ms-1 % USABLE BY CHINOOK %CROSS-SECT. AREA: 8.681 m2 % USABLE BY COHO %
Generic Insect suitability %
DEPTH/ VELOCITY DATA FOR WEIGHTED USABLE AREA (WUA) CALCULATIONS
Transect Data cell cell cell cell usable cell usable cell usable cell usable cell usable cell usable cell usable cell cellstation length depth velocity substrate width mean mean prob. width prob. width prob. width prob width prob. width prob. width prob. width area discharge
(m) (m) (m/s) depth velocity RBT Fry RBT RBT CT CT CT CT CH CH CO CO Ins. Ins.(m) (m) (m/s) (m) Parr Parr fry fry parr parr (m) (m) (m) (sq. m) (cu. m/se
2.30 0.05 0.03 0.5 0.0 0.1 0.8 0.4 0.0 0.0 1.0 0.5 0.1 0.1 0.0 0.0 0.3 0.1 0.0 0.0 0.0 0.03.3 0.12 0.09 1.0 0.1 0.1 1.0 1.0 0.2 0.2 1.0 1.0 0.4 0.4 0.2 0.2 0.7 0.7 0.1 0.1 0.1 0.04.3 0.14 0.16 1.0 0.1 0.2 1.0 1.0 0.4 0.4 1.0 1.0 0.5 0.5 0.5 0.5 0.7 0.7 0.2 0.2 0.1 0.05.3 0.18 0.27 1.0 0.2 0.3 0.8 0.8 0.7 0.7 0.6 0.6 0.9 0.9 0.9 0.9 0.4 0.4 0.3 0.3 0.2 0.06.3 0.16 0.12 1.0 0.2 0.1 1.0 1.0 0.4 0.4 1.0 1.0 0.7 0.7 0.5 0.5 0.8 0.8 0.1 0.1 0.2 0.07.3 0.16 0.18 1.0 0.2 0.2 1.0 1.0 0.5 0.5 1.0 1.0 0.7 0.7 0.6 0.6 0.7 0.7 0.2 0.2 0.2 0.08.3 0.15 0.18 1.0 0.2 0.2 1.0 1.0 0.5 0.5 1.0 1.0 0.5 0.5 0.6 0.6 0.6 0.6 0.2 0.2 0.2 0.09.3 0.17 0.11 1.0 0.2 0.1 1.0 1.0 0.4 0.4 1.0 1.0 0.7 0.7 0.5 0.5 0.9 0.9 0.1 0.1 0.2 0.010.3 0.23 0.17 1.0 0.2 0.2 1.0 1.0 0.7 0.7 1.0 1.0 1.0 1.0 0.9 0.9 0.8 0.8 0.2 0.2 0.2 0.011.3 0.26 0.28 1.0 0.3 0.3 0.7 0.7 0.9 0.9 0.5 0.5 1.0 1.0 1.0 1.0 0.4 0.4 0.4 0.4 0.3 0.112.3 0.21 0.27 1.0 0.2 0.3 0.8 0.8 0.8 0.8 0.5 0.5 1.0 1.0 1.0 1.0 0.4 0.4 0.3 0.3 0.2 0.113.3 0.19 0.27 1.0 0.2 0.3 0.8 0.8 0.7 0.7 0.5 0.5 0.9 0.9 0.9 0.9 0.4 0.4 0.3 0.3 0.2 0.114.3 0.17 0.29 1.0 0.2 0.3 0.7 0.7 0.6 0.6 0.4 0.4 0.7 0.7 0.8 0.8 0.3 0.3 0.4 0.4 0.2 0.015.3 0.18 0.42 1.0 0.2 0.4 0.3 0.3 0.7 0.7 0.0 0.0 0.6 0.6 0.8 0.8 0.0 0.0 0.6 0.6 0.2 0.116.3 0.17 0.28 1.0 0.2 0.3 0.8 0.8 0.6 0.6 0.6 0.6 0.7 0.7 0.8 0.8 0.3 0.3 0.4 0.4 0.2 0.017.3 0.21 0.26 1.0 0.2 0.3 0.8 0.8 0.8 0.8 0.7 0.7 1.0 1.0 1.0 1.0 0.5 0.5 0.3 0.3 0.2 0.118.3 0.25 0.29 1.0 0.3 0.3 0.7 0.7 0.9 0.9 0.3 0.3 1.0 1.0 1.0 1.0 0.4 0.4 0.4 0.4 0.3 0.119.3 0.17 0.19 1.0 0.2 0.2 1.0 1.0 0.5 0.5 1.0 1.0 0.7 0.7 0.7 0.7 0.7 0.7 0.2 0.2 0.2 0.020.3 0.14 0.11 1.0 0.1 0.1 1.0 1.0 0.3 0.3 1.0 1.0 0.5 0.5 0.4 0.4 0.8 0.8 0.1 0.1 0.1 0.021.3 0.15 0.11 1.0 0.2 0.1 1.0 1.0 0.3 0.3 1.0 1.0 0.5 0.5 0.4 0.4 0.8 0.8 0.1 0.1 0.2 0.022.3 0.14 0.17 1.0 0.1 0.2 1.0 1.0 0.4 0.4 1.0 1.0 0.5 0.5 0.5 0.5 0.7 0.7 0.2 0.2 0.1 0.023.3 0.17 0.29 1.0 0.2 0.3 0.7 0.7 0.6 0.6 0.4 0.4 0.7 0.7 0.8 0.8 0.3 0.3 0.4 0.4 0.2 0.024.3 0.21 0.29 1.0 0.2 0.3 0.7 0.7 0.8 0.8 0.3 0.3 1.0 1.0 1.0 1.0 0.3 0.3 0.4 0.4 0.2 0.125.3 0.27 0.31 1.0 0.3 0.3 0.6 0.6 0.9 0.9 0.2 0.2 1.0 1.0 1.0 1.0 0.3 0.3 0.4 0.4 0.3 0.126.3 0.38 0.22 1.0 0.4 0.2 0.5 0.5 0.9 0.9 0.6 0.6 1.0 1.0 1.0 1.0 0.6 0.6 0.2 0.2 0.4 0.127.3 0.28 0.17 1.0 0.3 0.2 0.9 0.9 0.8 0.8 1.0 1.0 1.0 1.0 0.9 0.9 0.8 0.8 0.2 0.2 0.3 0.028.3 0.23 0.17 1.0 0.2 0.2 1.0 1.0 0.7 0.7 1.0 1.0 1.0 1.0 0.9 0.9 0.8 0.8 0.2 0.2 0.2 0.029.3 0.25 0.18 1.0 0.3 0.2 1.0 1.0 0.8 0.8 1.0 1.0 1.0 1.0 0.9 0.9 0.8 0.8 0.2 0.2 0.3 0.030.3 0.24 0.19 1.0 0.2 0.2 1.0 1.0 0.8 0.8 1.0 1.0 1.0 1.0 0.9 0.9 0.8 0.8 0.2 0.2 0.2 0.031.3 0.26 0.2 1.0 0.3 0.2 1.0 1.0 0.8 0.8 1.0 1.0 1.0 1.0 0.9 0.9 0.7 0.7 0.2 0.2 0.3 0.132.3 0.42 0.18 1.0 0.4 0.2 0.5 0.5 0.8 0.8 0.5 0.5 1.0 1.0 0.9 0.9 0.8 0.8 0.2 0.2 0.4 0.133.3 0.32 0.17 1.0 0.3 0.2 0.8 0.8 0.8 0.8 0.9 0.9 1.0 1.0 0.9 0.9 0.8 0.8 0.2 0.2 0.3 0.134.3 0.33 0.15 1.0 0.3 0.2 0.8 0.8 0.7 0.7 0.9 0.9 1.0 1.0 0.8 0.8 0.9 0.9 0.2 0.2 0.3 0.035.3 0.41 0.16 1.0 0.4 0.2 0.5 0.5 0.8 0.8 0.5 0.5 1.0 1.0 0.8 0.8 0.9 0.9 0.2 0.2 0.4 0.136.3 0.5 0.12 1.0 0.5 0.1 0.3 0.3 0.6 0.6 0.4 0.4 1.0 1.0 0.7 0.7 1.0 1.0 0.1 0.1 0.5 0.137.3 0.44 0.13 1.0 0.4 0.1 0.4 0.4 0.7 0.7 0.5 0.5 1.0 1.0 0.7 0.7 1.0 1.0 0.1 0.1 0.4 0.138.3 0.5 0 0.7 0.5 0.0 0.1 0.0 0.0 0.0 0.4 0.3 1.0 0.7 0.0 0.0 1.0 0.7 0.0 0.0 0.4 0.038.7 0 0 0.2 0.3 0.0 0.2 0.0 0.0 0.0 1.0 0.2 1.0 0.2 0.0 0.0 1.0 0.2 0.0 0.0 0.1 0.0
0.0 0.0 0.0 0.0 0.0 0.0 0.0 0.0 0.0 0.0 0.0 0.0 0.0 0.0 0.0 0.0 0.0 0.0 0.00.0 0.0 0.0 0.0 0.0 0.0 0.0 0.0 0.0 0.0 0.0 0.0 0.0 0.0 0.0 0.0 0.0 0.0 0.00.0 0.0 0.0 0.0 0.0 0.0 0.0 0.0 0.0 0.0 0.0 0.0 0.0 0.0 0.0 0.0 0.0 0.0 0.00.0 0.0 0.0 0.0 0.0 0.0 0.0 0.0 0.0 0.0 0.0 0.0 0.0 0.0 0.0 0.0 0.0 0.0 0.00.0 0.0 0.0 0.0 0.0 0.0 0.0 0.0 0.0 0.0 0.0 0.0 0.0 0.0 0.0 0.0 0.0 0.0 0.0
This spread sheet is brought to you by Poul Bech, Ron Ptolemy, and Rob Knight, B.C. Environment, Fisheries Section, May 1994. (Modified by Harlan Wright, British Columbia Conservation Foundation, January 2003, using Febuary 2001 WUP HSI curves and Generic Insect curves from Stalnaker and Arnette, 1976).
23
152.62
7464
7863
Englishman15-Sep-03discharged/s Hwy 19A
7282

DEPTH/VELOCITY TRANSECT DATA ANALYSIS SPREADSHEET (CALCULATES W.U.A. & DISCHARGE)
STREAM:DATE:SAMPLE TYPE:SITE NAME:
MAIN/SIDE CHANNEL: MMETERED/EST.: MMEAN/SURFACE: M HYDRAULIC TYPE: glideTRANSECT WIDTH: 21.8 m WIDTH : DEPTH RATIO :METER TYPE: Swoffer 2100 TRANSECT TYPE: totalSENSOR DEPTH (from bottom): 40 % STREAM WIDTH: 21.8 mMETERED DISCHARGE: 1.5683 m3s-1 NO. OF STATIONS: 23
ADJUSTED USABLE AREAS% USABLE BY RBT FRY %% USABLE BY RBT PARR %
SITE WEIGHTED MEANS % USABLE BY CT FRY %MEAN DEPTH: 0.345 m % USABLE BY CT PARR %MEAN VELOCITY: 0.209 ms-1 % USABLE BY CHINOOK %CROSS-SECT. AREA: 7.515 m2 % USABLE BY COHO %
Generic Insect suitability %
DEPTH/ VELOCITY DATA FOR WEIGHTED USABLE AREA (WUA) CALCULATIONS
Transect Data cell cell cell cell usable cell usable cell usable cell usable cell usable cell usable cell usable cell cellstation length depth velocity substrate width mean mean prob. width prob. width prob. width prob width prob. width prob. width prob. width area discharge
(m) (m) (m/s) depth velocity RBT Fry RBT RBT CT CT CT CT CH CH CO CO Ins. Ins.(m) (m) (m/s) (m) Parr Parr fry fry parr parr (m) (m) (m) (sq. m) (cu. m/se
1.70 0.07 0.00 0.4 0.1 0.0 0.2 0.1 0.0 0.0 1.0 0.4 0.1 0.1 0.0 0.0 0.3 0.1 0.0 0.0 0.0 0.02.5 0.13 0.00 0.9 0.1 0.0 0.2 0.2 0.0 0.0 1.0 0.9 0.4 0.3 0.0 0.0 0.7 0.7 0.0 0.0 0.1 0.03.5 0.23 0.03 1.0 0.2 0.0 0.8 0.8 0.2 0.2 1.0 1.0 1.0 1.0 0.2 0.2 1.0 1.0 0.0 0.0 0.2 0.04.5 0.23 0.05 1.0 0.2 0.1 0.9 0.9 0.3 0.3 1.0 1.0 1.0 1.0 0.4 0.4 1.0 1.0 0.1 0.1 0.2 0.05.5 0.35 0.27 1.0 0.4 0.3 0.5 0.5 1.0 1.0 0.5 0.5 1.0 1.0 1.0 1.0 0.4 0.4 0.3 0.3 0.4 0.16.5 0.52 0.30 1.0 0.5 0.3 0.2 0.2 1.0 1.0 0.1 0.1 1.0 1.0 1.0 1.0 0.3 0.3 0.4 0.4 0.5 0.27.5 0.54 0.27 1.0 0.5 0.3 0.2 0.2 1.0 1.0 0.2 0.2 1.0 1.0 1.0 1.0 0.4 0.4 0.3 0.3 0.5 0.18.5 0.46 0.29 1.0 0.5 0.3 0.3 0.3 1.0 1.0 0.1 0.1 1.0 1.0 1.0 1.0 0.4 0.4 0.4 0.4 0.5 0.19.5 0.46 0.19 1.0 0.5 0.2 0.4 0.4 0.9 0.9 0.4 0.4 1.0 1.0 0.9 0.9 0.8 0.8 0.2 0.2 0.5 0.110.5 0.47 0.25 1.0 0.5 0.3 0.3 0.3 1.0 1.0 0.3 0.3 1.0 1.0 1.0 1.0 0.5 0.5 0.3 0.3 0.5 0.111.5 0.46 0.29 1.0 0.5 0.3 0.3 0.3 1.0 1.0 0.1 0.1 1.0 1.0 1.0 1.0 0.4 0.4 0.4 0.4 0.5 0.112.5 0.50 0.20 1.0 0.5 0.2 0.3 0.3 0.9 0.9 0.4 0.4 1.0 1.0 0.9 0.9 0.7 0.7 0.2 0.2 0.5 0.113.5 0.43 0.19 1.0 0.4 0.2 0.4 0.4 0.9 0.9 0.5 0.5 1.0 1.0 0.9 0.9 0.8 0.8 0.2 0.2 0.4 0.114.5 0.45 0.25 1.0 0.5 0.3 0.3 0.3 1.0 1.0 0.4 0.4 1.0 1.0 1.0 1.0 0.5 0.5 0.3 0.3 0.5 0.115.5 0.48 0.24 1.0 0.5 0.2 0.3 0.3 1.0 1.0 0.4 0.4 1.0 1.0 1.0 1.0 0.6 0.6 0.3 0.3 0.5 0.116.5 0.43 0.26 1.0 0.4 0.3 0.4 0.4 1.0 1.0 0.4 0.4 1.0 1.0 1.0 1.0 0.5 0.5 0.3 0.3 0.4 0.117.5 0.38 0.18 1.0 0.4 0.2 0.6 0.6 0.8 0.8 0.7 0.7 1.0 1.0 0.9 0.9 0.8 0.8 0.2 0.2 0.4 0.118.5 0.27 0.19 1.0 0.3 0.2 0.9 0.9 0.8 0.8 1.0 1.0 1.0 1.0 0.9 0.9 0.8 0.8 0.2 0.2 0.3 0.119.5 0.30 0.04 1.0 0.3 0.0 0.7 0.7 0.2 0.2 1.0 1.0 1.0 1.0 0.3 0.3 1.0 1.0 0.0 0.0 0.3 0.020.5 0.18 0.12 1.0 0.2 0.1 1.0 1.0 0.4 0.4 1.0 1.0 0.9 0.9 0.6 0.6 0.9 0.9 0.1 0.1 0.2 0.021.5 0.13 0.05 1.0 0.1 0.1 0.9 0.9 0.1 0.1 1.0 1.0 0.4 0.4 0.2 0.2 0.7 0.7 0.0 0.0 0.1 0.022.5 0.08 0.01 1.0 0.1 0.0 0.5 0.5 0.0 0.0 1.0 1.0 0.2 0.2 0.0 0.0 0.5 0.5 0.0 0.0 0.1 0.023.5 0.03 0.00 0.5 0.1 0.0 0.2 0.1 0.0 0.0 1.0 0.5 0.1 0.1 0.0 0.0 0.3 0.2 0.0 0.0 0.0 0.0
0.0 0.0 0.0 0.0 0.0 0.0 0.0 0.0 0.0 0.0 0.0 0.0 0.0 0.0 0.0 0.0 0.0 0.0 0.00.0 0.0 0.0 0.0 0.0 0.0 0.0 0.0 0.0 0.0 0.0 0.0 0.0 0.0 0.0 0.0 0.0 0.0 0.00.0 0.0 0.0 0.0 0.0 0.0 0.0 0.0 0.0 0.0 0.0 0.0 0.0 0.0 0.0 0.0 0.0 0.0 0.00.0 0.0 0.0 0.0 0.0 0.0 0.0 0.0 0.0 0.0 0.0 0.0 0.0 0.0 0.0 0.0 0.0 0.0 0.00.0 0.0 0.0 0.0 0.0 0.0 0.0 0.0 0.0 0.0 0.0 0.0 0.0 0.0 0.0 0.0 0.0 0.0 0.00.0 0.0 0.0 0.0 0.0 0.0 0.0 0.0 0.0 0.0 0.0 0.0 0.0 0.0 0.0 0.0 0.0 0.0 0.00.0 0.0 0.0 0.0 0.0 0.0 0.0 0.0 0.0 0.0 0.0 0.0 0.0 0.0 0.0 0.0 0.0 0.0 0.00.0 0.0 0.0 0.0 0.0 0.0 0.0 0.0 0.0 0.0 0.0 0.0 0.0 0.0 0.0 0.0 0.0 0.0 0.00.0 0.0 0.0 0.0 0.0 0.0 0.0 0.0 0.0 0.0 0.0 0.0 0.0 0.0 0.0 0.0 0.0 0.0 0.00.0 0.0 0.0 0.0 0.0 0.0 0.0 0.0 0.0 0.0 0.0 0.0 0.0 0.0 0.0 0.0 0.0 0.0 0.00.0 0.0 0.0 0.0 0.0 0.0 0.0 0.0 0.0 0.0 0.0 0.0 0.0 0.0 0.0 0.0 0.0 0.0 0.00.0 0.0 0.0 0.0 0.0 0.0 0.0 0.0 0.0 0.0 0.0 0.0 0.0 0.0 0.0 0.0 0.0 0.0 0.00.0 0.0 0.0 0.0 0.0 0.0 0.0 0.0 0.0 0.0 0.0 0.0 0.0 0.0 0.0 0.0 0.0 0.0 0.00.0 0.0 0.0 0.0 0.0 0.0 0.0 0.0 0.0 0.0 0.0 0.0 0.0 0.0 0.0 0.0 0.0 0.0 0.00.0 0.0 0.0 0.0 0.0 0.0 0.0 0.0 0.0 0.0 0.0 0.0 0.0 0.0 0.0 0.0 0.0 0.0 0.00.0 0.0 0.0 0.0 0.0 0.0 0.0 0.0 0.0 0.0 0.0 0.0 0.0 0.0 0.0 0.0 0.0 0.0 0.00.0 0.0 0.0 0.0 0.0 0.0 0.0 0.0 0.0 0.0 0.0 0.0 0.0 0.0 0.0 0.0 0.0 0.0 0.00.0 0.0 0.0 0.0 0.0 0.0 0.0 0.0 0.0 0.0 0.0 0.0 0.0 0.0 0.0 0.0 0.0 0.0 0.00.0 0.0 0.0 0.0 0.0 0.0 0.0 0.0 0.0 0.0 0.0 0.0 0.0 0.0 0.0 0.0 0.0 0.0 0.00.0 0.0 0.0 0.0 0.0 0.0 0.0 0.0 0.0 0.0 0.0 0.0 0.0 0.0 0.0 0.0 0.0 0.0 0.0
This spread sheet is brought to you by Poul Bech, Ron Ptolemy, and Rob Knight, B.C. Environment, Fisheries Section, May 1994. (Modified by Harlan Wright, British Columbia Conservation Foundation, January 2003, using Febuary 2001 WUP HSI curves and Generic Insect curves from Stalnaker and Arnette, 1976).
6086
Englishman15-Sep-03discharged/s South Englishman
20
63.24
7064
4867

DEPTH/VELOCITY TRANSECT DATA ANALYSIS SPREADSHEET (CALCULATES W.U.A. & DISCHARGE)
STREAM:DATE:SAMPLE TYPE:SITE NAME:
MAIN/SIDE CHANNEL: MMETERED/EST.: MMEAN/SURFACE: M HYDRAULIC TYPE: glideTRANSECT WIDTH: 35.5 m WIDTH : DEPTH RATIO :METER TYPE: Swoffer 2100 TRANSECT TYPE: totalSENSOR DEPTH (from bottom): 40 % STREAM WIDTH: 35.5 mMETERED DISCHARGE: 1.3638 m3s-1 NO. OF STATIONS: 26
ADJUSTED USABLE AREAS% USABLE BY RBT FRY %% USABLE BY RBT PARR %
SITE WEIGHTED MEANS % USABLE BY CT FRY %MEAN DEPTH: 0.272 m % USABLE BY CT PARR %MEAN VELOCITY: 0.141 ms-1 % USABLE BY CHINOOK %CROSS-SECT. AREA: 9.639 m2 % USABLE BY COHO %
Generic Insect suitability %
DEPTH/ VELOCITY DATA FOR WEIGHTED USABLE AREA (WUA) CALCULATIONS
Transect Data cell cell cell cell usable cell usable cell usable cell usable cell usable cell usable cell usable cell cellstation length depth velocity substrate width mean mean prob. width prob. width prob. width prob width prob. width prob. width prob. width area discharge
(m) (m) (m/s) depth velocity RBT Fry RBT RBT CT CT CT CT CH CH CO CO Ins. Ins.(m) (m) (m/s) (m) Parr Parr fry fry parr parr (m) (m) (m) (sq. m) (cu. m/se
0.30 0.00 0.00 0.4 0.0 0.0 0.2 0.1 0.0 0.0 1.0 0.4 0.0 0.0 0.0 0.0 0.1 0.0 0.0 0.0 0.0 0.01.0 0.10 0.02 1.1 0.1 0.0 0.7 0.8 0.0 0.0 1.0 1.1 0.3 0.3 0.0 0.0 0.6 0.7 0.0 0.0 0.1 0.02.5 0.13 0.01 1.5 0.1 0.0 0.5 0.8 0.0 0.0 1.0 1.5 0.4 0.5 0.0 0.1 0.7 1.1 0.0 0.0 0.2 0.04.0 0.10 0.06 1.5 0.1 0.1 1.0 1.4 0.1 0.2 1.0 1.5 0.3 0.4 0.1 0.2 0.6 0.9 0.0 0.1 0.2 0.05.5 0.12 0.13 1.5 0.1 0.1 1.0 1.5 0.3 0.4 1.0 1.5 0.4 0.5 0.3 0.5 0.7 1.0 0.1 0.2 0.2 0.07.0 0.11 0.17 1.5 0.1 0.2 1.0 1.5 0.3 0.4 1.0 1.5 0.3 0.4 0.3 0.5 0.6 0.8 0.1 0.2 0.2 0.08.5 0.15 0.13 1.5 0.2 0.1 1.0 1.5 0.4 0.6 1.0 1.5 0.5 0.8 0.5 0.7 0.8 1.2 0.1 0.2 0.2 0.010.0 0.15 0.14 1.5 0.2 0.1 1.0 1.5 0.4 0.6 1.0 1.5 0.5 0.8 0.5 0.7 0.8 1.1 0.1 0.2 0.2 0.011.5 0.15 0.18 1.5 0.2 0.2 1.0 1.5 0.5 0.7 1.0 1.5 0.5 0.8 0.6 0.8 0.6 1.0 0.2 0.3 0.2 0.013.0 0.22 0.22 1.5 0.2 0.2 0.9 1.4 0.8 1.1 0.9 1.3 1.0 1.5 1.0 1.4 0.6 0.9 0.2 0.4 0.3 0.114.5 0.22 0.21 1.5 0.2 0.2 1.0 1.5 0.7 1.1 0.9 1.3 1.0 1.5 1.0 1.4 0.7 1.0 0.2 0.3 0.3 0.116.0 0.23 0.18 1.5 0.2 0.2 1.0 1.5 0.7 1.1 1.0 1.5 1.0 1.5 0.9 1.3 0.8 1.2 0.2 0.3 0.3 0.117.5 0.26 0.18 1.5 0.3 0.2 1.0 1.5 0.8 1.2 1.0 1.5 1.0 1.5 0.9 1.3 0.8 1.2 0.2 0.3 0.4 0.119.0 0.19 0.15 1.5 0.2 0.2 1.0 1.5 0.5 0.8 1.0 1.5 0.9 1.3 0.7 1.1 0.8 1.3 0.2 0.2 0.3 0.020.5 0.27 0.16 1.5 0.3 0.2 0.9 1.4 0.7 1.1 1.0 1.5 1.0 1.5 0.8 1.3 0.9 1.3 0.2 0.2 0.4 0.122.0 0.31 0.18 1.5 0.3 0.2 0.8 1.2 0.8 1.2 0.9 1.3 1.0 1.5 0.9 1.3 0.8 1.2 0.2 0.3 0.5 0.123.5 0.35 0.17 1.5 0.4 0.2 0.7 1.0 0.8 1.2 0.9 1.3 1.0 1.5 0.9 1.3 0.8 1.3 0.2 0.3 0.5 0.125.0 0.37 0.15 1.5 0.4 0.2 0.6 0.9 0.8 1.1 0.7 1.0 1.0 1.5 0.8 1.2 0.9 1.4 0.2 0.2 0.6 0.126.5 0.44 0.16 1.5 0.4 0.2 0.4 0.6 0.8 1.2 0.5 0.8 1.0 1.5 0.8 1.3 0.9 1.3 0.2 0.2 0.7 0.128.0 0.47 0.09 1.5 0.5 0.1 0.3 0.5 0.5 0.8 0.4 0.6 1.0 1.5 0.6 0.9 1.0 1.5 0.1 0.1 0.7 0.129.5 0.40 0.12 1.5 0.4 0.1 0.5 0.8 0.6 0.9 0.7 1.0 1.0 1.5 0.7 1.1 1.0 1.5 0.1 0.2 0.6 0.131.0 0.50 0.12 1.5 0.5 0.1 0.3 0.4 0.6 0.9 0.4 0.6 1.0 1.5 0.7 1.1 1.0 1.5 0.1 0.2 0.8 0.132.5 0.45 0.16 1.5 0.5 0.2 0.4 0.6 0.8 1.2 0.5 0.8 1.0 1.5 0.8 1.3 0.9 1.3 0.2 0.2 0.7 0.134.0 0.62 0.13 1.5 0.6 0.1 0.1 0.2 0.7 1.0 0.2 0.2 1.0 1.5 0.7 1.1 1.0 1.4 0.1 0.2 0.9 0.135.5 0.21 0.00 0.9 0.2 0.0 0.2 0.2 0.0 0.0 1.0 0.9 1.0 0.9 0.0 0.0 1.0 0.9 0.0 0.0 0.2 0.035.8 0.00 0.00 0.1 0.1 0.0 0.2 0.0 0.0 0.0 1.0 0.1 0.3 0.0 0.0 0.0 0.6 0.1 0.0 0.0 0.0 0.0
0.0 0.0 0.0 0.0 0.0 0.0 0.0 0.0 0.0 0.0 0.0 0.0 0.0 0.0 0.0 0.0 0.0 0.0 0.00.0 0.0 0.0 0.0 0.0 0.0 0.0 0.0 0.0 0.0 0.0 0.0 0.0 0.0 0.0 0.0 0.0 0.0 0.00.0 0.0 0.0 0.0 0.0 0.0 0.0 0.0 0.0 0.0 0.0 0.0 0.0 0.0 0.0 0.0 0.0 0.0 0.00.0 0.0 0.0 0.0 0.0 0.0 0.0 0.0 0.0 0.0 0.0 0.0 0.0 0.0 0.0 0.0 0.0 0.0 0.00.0 0.0 0.0 0.0 0.0 0.0 0.0 0.0 0.0 0.0 0.0 0.0 0.0 0.0 0.0 0.0 0.0 0.0 0.00.0 0.0 0.0 0.0 0.0 0.0 0.0 0.0 0.0 0.0 0.0 0.0 0.0 0.0 0.0 0.0 0.0 0.0 0.00.0 0.0 0.0 0.0 0.0 0.0 0.0 0.0 0.0 0.0 0.0 0.0 0.0 0.0 0.0 0.0 0.0 0.0 0.00.0 0.0 0.0 0.0 0.0 0.0 0.0 0.0 0.0 0.0 0.0 0.0 0.0 0.0 0.0 0.0 0.0 0.0 0.00.0 0.0 0.0 0.0 0.0 0.0 0.0 0.0 0.0 0.0 0.0 0.0 0.0 0.0 0.0 0.0 0.0 0.0 0.00.0 0.0 0.0 0.0 0.0 0.0 0.0 0.0 0.0 0.0 0.0 0.0 0.0 0.0 0.0 0.0 0.0 0.0 0.00.0 0.0 0.0 0.0 0.0 0.0 0.0 0.0 0.0 0.0 0.0 0.0 0.0 0.0 0.0 0.0 0.0 0.0 0.00.0 0.0 0.0 0.0 0.0 0.0 0.0 0.0 0.0 0.0 0.0 0.0 0.0 0.0 0.0 0.0 0.0 0.0 0.00.0 0.0 0.0 0.0 0.0 0.0 0.0 0.0 0.0 0.0 0.0 0.0 0.0 0.0 0.0 0.0 0.0 0.0 0.00.0 0.0 0.0 0.0 0.0 0.0 0.0 0.0 0.0 0.0 0.0 0.0 0.0 0.0 0.0 0.0 0.0 0.0 0.00.0 0.0 0.0 0.0 0.0 0.0 0.0 0.0 0.0 0.0 0.0 0.0 0.0 0.0 0.0 0.0 0.0 0.0 0.00.0 0.0 0.0 0.0 0.0 0.0 0.0 0.0 0.0 0.0 0.0 0.0 0.0 0.0 0.0 0.0 0.0 0.0 0.00.0 0.0 0.0 0.0 0.0 0.0 0.0 0.0 0.0 0.0 0.0 0.0 0.0 0.0 0.0 0.0 0.0 0.0 0.0
This spread sheet is brought to you by Poul Bech, Ron Ptolemy, and Rob Knight, B.C. Environment, Fisheries Section, May 1994. (Modified by Harlan Wright, British Columbia Conservation Foundation, January 2003, using Febuary 2001 WUP HSI curves and Generic Insect curves from Stalnaker and Arnette, 1976).
8278
Englishman25-Sep-03discharged/s Hwy 19A
13
130.75
6279
7253
DEPTH/VELOCITY TRANSECT DATA ANALYSIS SPREADSHEET (CALCULATES W.U.A. & DISCHARGE)
STREAM:DATE:SAMPLE TYPE:SITE NAME:
MAIN/SIDE CHANNEL: MMETERED/EST.: MMEAN/SURFACE: M HYDRAULIC TYPE: glideTRANSECT WIDTH: 22.4 m WIDTH : DEPTH RATIO :METER TYPE: Swoffer 2100 TRANSECT TYPE: totalSENSOR DEPTH (from bottom): 40 % STREAM WIDTH: 22.4 mMETERED DISCHARGE: 1.2600 m3s-1 NO. OF STATIONS: 24
ADJUSTED USABLE AREAS% USABLE BY RBT FRY %% USABLE BY RBT PARR %
SITE WEIGHTED MEANS % USABLE BY CT FRY %MEAN DEPTH: 0.307 m % USABLE BY CT PARR %MEAN VELOCITY: 0.183 ms-1 % USABLE BY CHINOOK %CROSS-SECT. AREA: 6.870 m2 % USABLE BY COHO %
Generic Insect suitability %
DEPTH/ VELOCITY DATA FOR WEIGHTED USABLE AREA (WUA) CALCULATIONS
Transect Data cell cell cell cell usable cell usable cell usable cell usable cell usable cell usable cell usable cell cellstation length depth velocity substrate width mean mean prob. width prob. width prob. width prob width prob. width prob. width prob. width area discharge
(m) (m) (m/s) depth velocity RBT Fry RBT RBT CT CT CT CT CH CH CO CO Ins. Ins.(m) (m) (m/s) (m) Parr Parr fry fry parr parr (m) (m) (m) (sq. m) (cu. m/se
0.60 0.00 0.00 bc 0.5 0.0 0.0 0.1 0.1 0.0 0.0 1.0 0.5 0.0 0.0 0.0 0.0 0.2 0.1 0.0 0.0 0.0 0.01.5 0.12 0.00 bc 1.0 0.1 0.0 0.2 0.2 0.0 0.0 1.0 1.0 0.4 0.3 0.0 0.0 0.7 0.7 0.0 0.0 0.1 0.02.5 0.14 0.01 bc 1.0 0.1 0.0 0.5 0.5 0.0 0.0 1.0 1.0 0.5 0.5 0.0 0.0 0.8 0.8 0.0 0.0 0.1 0.03.5 0.21 0.11 bc 1.0 0.2 0.1 1.0 1.0 0.5 0.5 1.0 1.0 1.0 1.0 0.7 0.7 1.0 1.0 0.1 0.1 0.2 0.04.5 0.33 0.13 bc 1.0 0.3 0.1 0.8 0.8 0.7 0.7 0.9 0.9 1.0 1.0 0.7 0.7 1.0 1.0 0.1 0.1 0.3 0.05.5 0.50 0.17 bc 1.0 0.5 0.2 0.3 0.3 0.8 0.8 0.4 0.4 1.0 1.0 0.9 0.9 0.8 0.8 0.2 0.2 0.5 0.16.5 0.45 0.18 bc 1.0 0.5 0.2 0.4 0.4 0.8 0.8 0.5 0.5 1.0 1.0 0.9 0.9 0.8 0.8 0.2 0.2 0.5 0.17.5 0.41 0.29 bc 1.0 0.4 0.3 0.3 0.3 1.0 1.0 0.2 0.2 1.0 1.0 1.0 1.0 0.4 0.4 0.4 0.4 0.4 0.18.5 0.47 0.26 cb 1.0 0.5 0.3 0.3 0.3 1.0 1.0 0.3 0.3 1.0 1.0 1.0 1.0 0.5 0.5 0.3 0.3 0.5 0.19.5 0.42 0.20 bc 1.0 0.4 0.2 0.5 0.5 0.9 0.9 0.5 0.5 1.0 1.0 0.9 0.9 0.7 0.7 0.2 0.2 0.4 0.110.5 0.43 0.28 bg 1.0 0.4 0.3 0.3 0.3 1.0 1.0 0.3 0.3 1.0 1.0 1.0 1.0 0.4 0.4 0.4 0.4 0.4 0.111.5 0.42 0.26 bg 1.0 0.4 0.3 0.4 0.4 1.0 1.0 0.4 0.4 1.0 1.0 1.0 1.0 0.5 0.5 0.3 0.3 0.4 0.112.5 0.35 0.24 cb 1.0 0.4 0.2 0.6 0.6 1.0 1.0 0.8 0.8 1.0 1.0 1.0 1.0 0.6 0.6 0.3 0.3 0.4 0.113.5 0.38 0.24 bc 1.0 0.4 0.2 0.5 0.5 1.0 1.0 0.6 0.6 1.0 1.0 1.0 1.0 0.6 0.6 0.3 0.3 0.4 0.114.5 0.47 0.19 bc 1.0 0.5 0.2 0.3 0.3 0.9 0.9 0.4 0.4 1.0 1.0 0.9 0.9 0.8 0.8 0.2 0.2 0.5 0.115.5 0.41 0.20 cg 1.0 0.4 0.2 0.5 0.5 0.9 0.9 0.5 0.5 1.0 1.0 0.9 0.9 0.7 0.7 0.2 0.2 0.4 0.116.5 0.49 0.10 bc 1.0 0.5 0.1 0.3 0.3 0.6 0.6 0.4 0.4 1.0 1.0 0.6 0.6 1.0 1.0 0.1 0.1 0.5 0.017.5 0.13 0.24 cb 1.0 0.1 0.2 0.9 0.9 0.5 0.5 0.9 0.9 0.4 0.4 0.5 0.5 0.4 0.4 0.3 0.3 0.1 0.018.5 0.13 0.09 gc 1.0 0.1 0.1 1.0 1.0 0.2 0.2 1.0 1.0 0.4 0.4 0.3 0.3 0.7 0.7 0.1 0.1 0.1 0.019.5 0.23 0.10 bc 1.0 0.2 0.1 1.0 1.0 0.5 0.5 1.0 1.0 1.0 1.0 0.6 0.6 1.0 1.0 0.1 0.1 0.2 0.020.5 0.21 0.05 bc 1.0 0.2 0.1 0.9 0.9 0.2 0.2 1.0 1.0 1.0 1.0 0.3 0.3 1.0 1.0 0.1 0.1 0.2 0.021.5 0.11 0.00 bc 1.0 0.1 0.0 0.2 0.2 0.0 0.0 1.0 1.0 0.3 0.3 0.0 0.0 0.7 0.7 0.0 0.0 0.1 0.022.5 0.06 0.00 0.8 0.1 0.0 0.2 0.2 0.0 0.0 1.0 0.8 0.1 0.1 0.0 0.0 0.4 0.3 0.0 0.0 0.0 0.023.0 0.00 0.00 0.3 0.0 0.0 0.1 0.0 0.0 0.0 1.0 0.3 0.0 0.0 0.0 0.0 0.2 0.1 0.0 0.0 0.0 0.0
0.0 0.0 0.0 0.0 0.0 0.0 0.0 0.0 0.0 0.0 0.0 0.0 0.0 0.0 0.0 0.0 0.0 0.0 0.00.0 0.0 0.0 0.0 0.0 0.0 0.0 0.0 0.0 0.0 0.0 0.0 0.0 0.0 0.0 0.0 0.0 0.0 0.00.0 0.0 0.0 0.0 0.0 0.0 0.0 0.0 0.0 0.0 0.0 0.0 0.0 0.0 0.0 0.0 0.0 0.0 0.00.0 0.0 0.0 0.0 0.0 0.0 0.0 0.0 0.0 0.0 0.0 0.0 0.0 0.0 0.0 0.0 0.0 0.0 0.00.0 0.0 0.0 0.0 0.0 0.0 0.0 0.0 0.0 0.0 0.0 0.0 0.0 0.0 0.0 0.0 0.0 0.0 0.00.0 0.0 0.0 0.0 0.0 0.0 0.0 0.0 0.0 0.0 0.0 0.0 0.0 0.0 0.0 0.0 0.0 0.0 0.00.0 0.0 0.0 0.0 0.0 0.0 0.0 0.0 0.0 0.0 0.0 0.0 0.0 0.0 0.0 0.0 0.0 0.0 0.00.0 0.0 0.0 0.0 0.0 0.0 0.0 0.0 0.0 0.0 0.0 0.0 0.0 0.0 0.0 0.0 0.0 0.0 0.00.0 0.0 0.0 0.0 0.0 0.0 0.0 0.0 0.0 0.0 0.0 0.0 0.0 0.0 0.0 0.0 0.0 0.0 0.00.0 0.0 0.0 0.0 0.0 0.0 0.0 0.0 0.0 0.0 0.0 0.0 0.0 0.0 0.0 0.0 0.0 0.0 0.00.0 0.0 0.0 0.0 0.0 0.0 0.0 0.0 0.0 0.0 0.0 0.0 0.0 0.0 0.0 0.0 0.0 0.0 0.00.0 0.0 0.0 0.0 0.0 0.0 0.0 0.0 0.0 0.0 0.0 0.0 0.0 0.0 0.0 0.0 0.0 0.0 0.00.0 0.0 0.0 0.0 0.0 0.0 0.0 0.0 0.0 0.0 0.0 0.0 0.0 0.0 0.0 0.0 0.0 0.0 0.00.0 0.0 0.0 0.0 0.0 0.0 0.0 0.0 0.0 0.0 0.0 0.0 0.0 0.0 0.0 0.0 0.0 0.0 0.00.0 0.0 0.0 0.0 0.0 0.0 0.0 0.0 0.0 0.0 0.0 0.0 0.0 0.0 0.0 0.0 0.0 0.0 0.00.0 0.0 0.0 0.0 0.0 0.0 0.0 0.0 0.0 0.0 0.0 0.0 0.0 0.0 0.0 0.0 0.0 0.0 0.00.0 0.0 0.0 0.0 0.0 0.0 0.0 0.0 0.0 0.0 0.0 0.0 0.0 0.0 0.0 0.0 0.0 0.0 0.00.0 0.0 0.0 0.0 0.0 0.0 0.0 0.0 0.0 0.0 0.0 0.0 0.0 0.0 0.0 0.0 0.0 0.0 0.00.0 0.0 0.0 0.0 0.0 0.0 0.0 0.0 0.0 0.0 0.0 0.0 0.0 0.0 0.0 0.0 0.0 0.0 0.0
This spread sheet is brought to you by Poul Bech, Ron Ptolemy, and Rob Knight, B.C. Environment, Fisheries Section, May 1994. (Modified by Harlan Wright, British Columbia Conservation Foundation, January 2003, using Febuary 2001 WUP HSI curves and Generic Insect curves from Stalnaker and Arnette, 1976).
17
73.04
6468
5160
Englishman25-Sep-03discharged/s South Englishman
6880

Appendix B
Stage/discharge relationship for Morison Creek semi-permanent flow station.
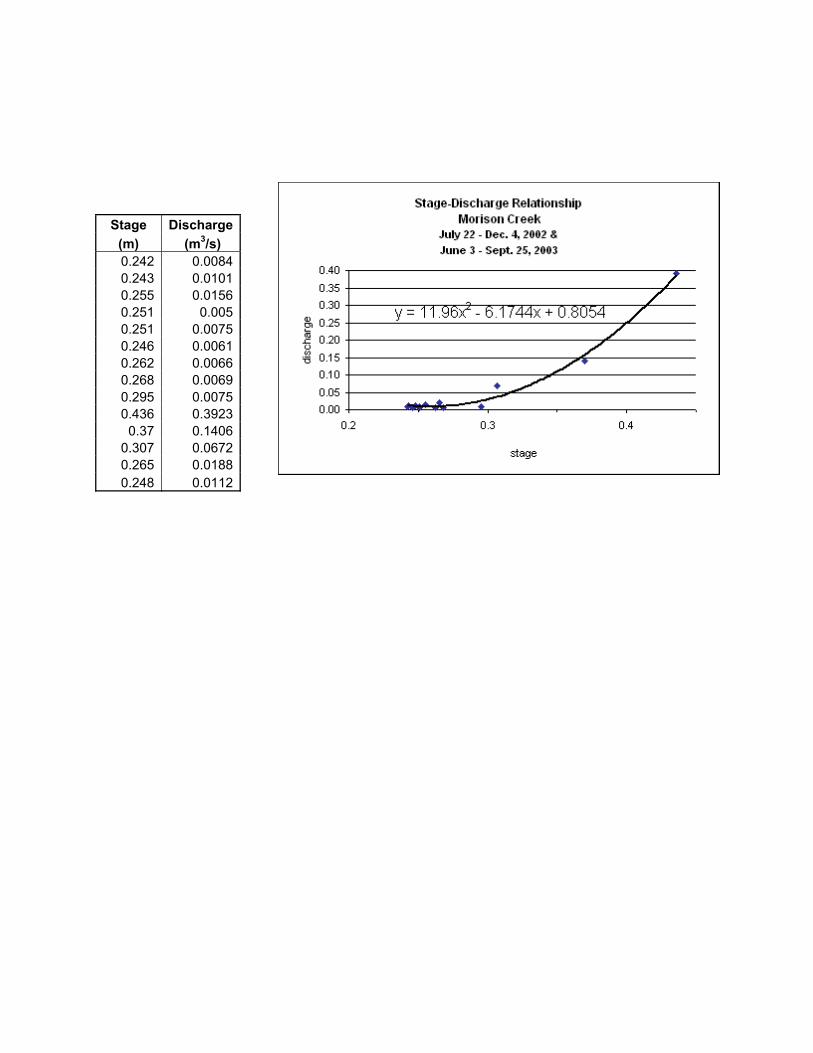
Stage Discharge (m) (m3/s) 0.242 0.0084 0.243 0.0101 0.255 0.0156 0.251 0.005 0.251 0.0075 0.246 0.0061 0.262 0.0066 0.268 0.0069 0.295 0.0075 0.436 0.3923
0.37 0.1406 0.307 0.0672 0.265 0.0188 0.248 0.0112