strategy workshops: agenda · pdf file1/12/2016 · this information is confidential...
TRANSCRIPT

This information is confidential and was prepared by Bain & Company solely for the use of our client; it is not to be relied on by any 3rd party without Bain's prior written consent 1SNGAgenda
TOPIC TIME FORUM LEAD
Mini Fair on Case for Change 15 mins Full Group Working Team
Why are we here?
• Recap on context
• Recap on case for change
15 mins Full Group Anita
An emerging shared vision
• Share methodology
• Share work in progress shared vision
15 mins Full GroupAngela / Fazlin
Break-out: What’s your perspective on the shared vision
• Individual reflection (What do you like / Don’t like / What is missing)
• Share reflections with the sub-group
• Distill into themes (dis)agreement
30 mins Sub-Group Facilitators
Coffee (& Mini Fair on case for change) 15 mins Full Group Working Team
Break-out: Imperatives to achieve the shared vision
• Each sub-group to cover one-two of six pillars of the vision
• Brainstorm for imperatives (building on 2016 Summit Output)
45 mins Sub-Group Facilitators
Gathering all thoughts
• Share key themes of (dis)agreement on shared vision
• Share summary of imperatives for shared vision pillars
30 mins Full GroupNCSS
Leaders
Closing
• What are the key next steps?15 mins Full Group
Chia Lin / Anita
Strategy Workshops: Agenda
1
2
6
8
7
3
4
5

© NCSS. All Rights Reserved
DEMAND
Demand increases as society continues to change at high pace…
Growing Population
Sin
gapore
Popula
tion
2000
4.0M
2015
5.5M
2030E
6.9M
Ageing Population
Senio
r S
upport
Ratio
(#R
esid
ents
20
-64 p
er
65+
)
2000
9 : 1
2015
5.7 : 1
2030E
2.1 : 1
More Diverse Population Mix
Singaporean & PRs Others
Sin
gapore
ans &
PR
s a
s
% o
f popula
tio
n
2000
81%2015
71%2030E
?%
Rising Unemployment
Unem
plo
ym
ent (%
)
Gin
i C
oeff
icie
nt
(befo
re t
ransfe
rs a
nd t
axes)
PoorRich
High & Rising
Inequality
2030E
?
2015
0.46
2000
0.44
In addition, needs are likely to become more complex difficult to address
Smaller Households
SG
avera
ge h
ousehold
siz
e, (#
of
people
)
2000
3.7
2030E
?
2015
3.4
2000
2.7%2015
1.9%
2030E
2.4%
Number of seniors with complex care needs set to rise
in Singapore: AIC
By Chan Luo Er, Channel NewsAsia | Posted 02 Jul 2016
Social needs will increase and become more complex, driven by socio-economic trends and increasing needs complexity
Physiological needs
Safety needs
Belongingness &
love needs
Esteem needs
Self-actualization
Self-
transcen
dencee.g. person in need& still want to give
e.g. ex-offender
e.g. has an absent parent, unwed mother
e.g. victim of violence
e.g. person withphysical disabilities
e.g. PWD seeking to realize life potentials
Sources: Department of Statistics Singapore; Euromonitor; Population White Paper 2013; Maslow, A.H. (1969),
“The farther reaches of human nature”, Journal of Transpersonal Psychology, 1(1), 1-9., NCSS QOL Study; Channel News Asia
Visible needs
Hidden needs
Waterline
ICEBERG OF NEEDS

© NCSS. All Rights Reserved
“Policies and services aimed at helping the poor should factor in
the weight that poverty has on a person’s cognitive function.”
Eldar Shafir, Professor of Psychology & Public Affairs,
Princeton University
27%39%
Organizations Working In Silos
High Concentration Of Resources
Dis
trib
utio
n o
f charitie
s a
nd
tota
l re
ceip
ts a
mount
(2014)
7% 87%
Receipts amount# of charities
$14.6B2,180 charities
Social Service Offices Help Clients
Navigate The Interface
Reduced Cognitive Bandwidth For
People With Needs
Avg Singaporean
IQ
Avg. Singaporean
in financial distress
103pt
13PTDECLINE
90pt
% respondents who believe that social service organizations
are successful or very successful (N=356)
Referring clients to other
VWOs or community agencies
to meet their other needs
Collaborating with
external partners to
make projects happen
Limited Visibility On Service Delivery
From Client Perspective
Many Programs & Organizations Make
Interface Complex For Clients
How can we increase transparency?
Source: Statistics Singapore
Singapore Social Service Landscape (#) = Number of programs
“There is a need for VWOs to offer a fuller range of services
to their clients.”
NCSS Sectoral Consultation Study 2016
Focus Group Discussion
Sources: Commissioner of Charities Annual Reports; Scarcity: Why Having Too Little Means So Much (2013); NCSS Sector
Consultation Study 2016
Disability
Services
(88)
CHAS
Clinics
(585)
Eldercare
Services
(121) Family Services
(47)
Childcare and
Student Care
Services
(1,654)
Social Service
Programmes
(829)
?
EXAMPLE
SERVICE INTERFACE
Service development & delivery do not take a holistic view of client needs. Interface between clients & services can be improved
Social Service Offices (Total 24)

© NCSS. All Rights Reserved
#7
Worl
d H
app
iness
Re
po
rt 2
01
6
Ra
nkin
gs, N
=1
57
Community resources seem to be under-
mobilized
GDP/ Capita
WHI:
Generosity
SPI:
Community
Safety Net
WGI:
Volunteered
Time
WGI:
Donate $
WHI: Social
Support
WGI: Helped
a Stranger
Australia
Volunteer rates below international benchmarks
Vo
lun
tee
rism
Ra
te (
%)
Volunteerism Rates*
Generosity Score
Donated Money
#1: Myanmar#2: Thailand#3: Indonesia…
#13: Australia#18: Malaysia#22: Hong Kong
#33: Singapore
#1: Myanmar#2: Thailand#3: Malta…
#7: Australia#11: Hong Kong#17: Malaysia
#18: Singapore
#1: Myanmar#2: Sri Lanka#3: Liberia…
#12: Australia#17: Malaysia
#42: Singapore#90: Hong Kong
25%
44%42%37%
31%
18%
Re
lative
pe
rfo
rma
nce
CA
F W
orld
Giv
ing
Ind
ex 2
01
5
Ra
nkin
gs, N
=1
45
CA
F W
orld
Giv
ing
Ind
ex 2
01
5
Ra
nkin
gs, N
=1
45
Note: Each bar on the scale represents 20% of
countries on the index; the bigger the area, the
better performing the country is
17%
Markets with similar wealth
score better on social metrics
Malaysia
Hong Kong
Singapore
Re
lative
pe
rfo
rma
nce
Re
lative
pe
rfo
rma
nce
Re
lative
pe
rfo
rma
nce
Indicates headroom for improvement
GDP/ Capita
WHI:
Generosity
SPI:
Community
Safety Net
WGI:
Volunteered
Time
WGI:
Donate $
WHI: Social
Support
WGI: Helped
a Stranger
GDP/ Capita
WHI:
Generosity
SPI:
Community
Safety Net
WGI:
Volunteered
Time
WGI:
Donate $
WHI: Social
Support
WGI: Helped
a Stranger
GDP/ Capita
WHI:
Generosity
SPI:
Community
Safety Net
WGI:
Volunteered
Time
WGI:
Donate $
WHI: Social
Support
WGI: Helped
a Stranger
*2014 data for all countries except Hong Kong and Canada, which are 2013 data
Sources: Department of Statistics Singapore; NVPC survey; MCYS; Australia Bureau of Statistics; US Bureau of Labor Statistics;
UK Institute for Volunteering Research; Statistics Canada; Giving in the Netherlands Report
% of population who had performed
volunteer work for an organization
(formal volunteering) at least once in
the previous 12 months
COMMUNITY
Community and Clients can be more actively engaged and empowered to help identify and solve social needs
#1#2
#3#13
#18 #33
#22#76
#1#2
#17#18
#11#3#12
#1
#2
#12
#17#42#90#3
#6
Volunteered Time

© NCSS. All Rights Reserved
18%15%
20052014
23%2010
Supply of resources might be more stretched going forward
Annualiz
ed r
eal
GD
P g
row
th (
%)
More Charities Competing For
Share Of Resources
# o
f S
ingapore
regis
tere
d c
haritie
s
7.6%
1985-2000 2000-2015
5.2%
2015-2030E
2.7%
Volu
nte
erism
rate
in S
G (
%)
Slowing GDP Growth
Stagnant Rates Of Volunteerism
Significantly more resources were made available over the last decade
2,2151,807
Government Public
Singapore Charities Australia & UK Charities
Government reliance can raise concerns over affordability
HEALTHCARE COMMUNITY DEV’T*EDUCATION
2005 2015 2005 2015 2005 2015
4X1.5X $9.2B
$2.3B
$7.9B
$12.1B$4.8B
$1.4B
3.4X
Gov't e
xpenditure
, S
$B
Adju
ste
d f
or
infla
tio
n
2005 2015
1.8X
$0.8B
$1.4B
Ta
x d
eductib
le d
onatio
n,
S$B
Adju
ste
d f
or
infla
tio
n
To
tal A
nnual R
eceip
ts
from
govern
ment
(%)
To
tal A
nnual R
eceip
ts b
y
from
govern
ment
(%)
2010 2014 2014 2014
45% 48%41%
34%
Note: Charities includes religious institutions
Sources: Ministry of Finance Singapore Analysis of Revenue and Expenditure; Commissioner of Charities Annual Reports;
Euromonitor; NVPC Individual Giving Survey 2014; Australian Charities Report 2014; NCVO UK Charity Sector
*Was referred to as “community development & sports” up to 2013, and “culture, community & youth” + “social & family development” from 2013
RESOURCES
Scarcity calls for diversification of resource providers and more systemic impact measurement of impact
© NCSS. All Rights Reserved
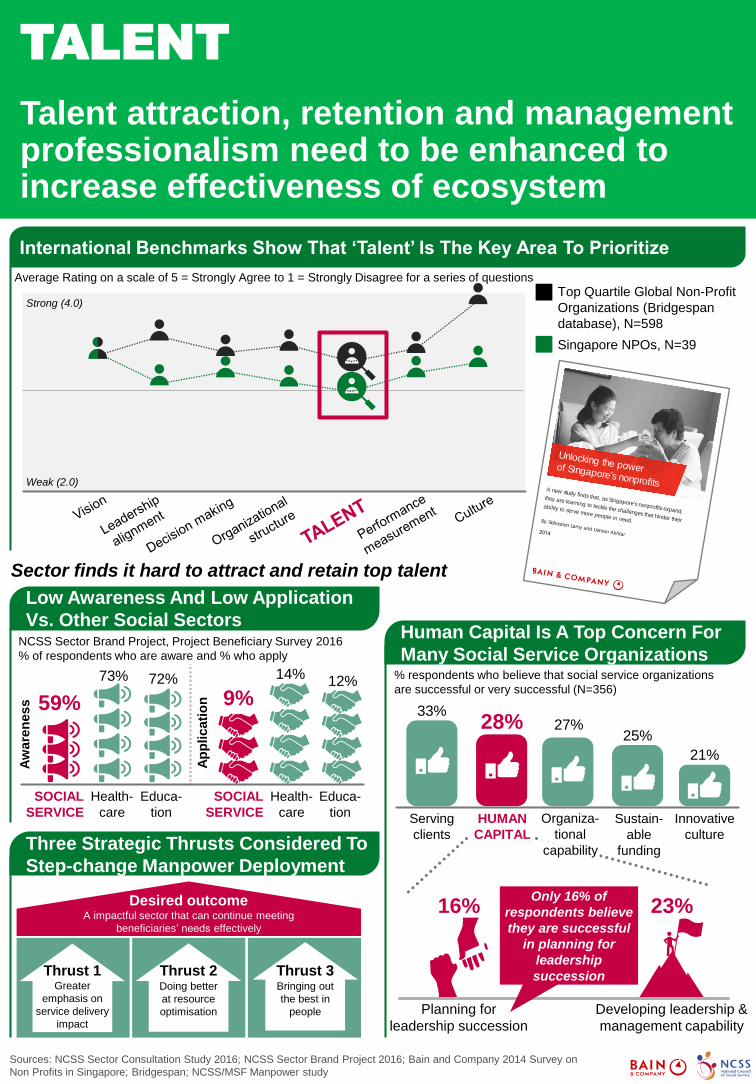
International Benchmarks Show That ‘Talent’ Is The Key Area To Prioritize
Sector finds it hard to attract and retain top talent
NCSS Sector Brand Project, Project Beneficiary Survey 2016
% of respondents who are aware and % who apply
SOCIAL
SERVICE
Health-
care
Educa-
tion
Aw
are
ness
Ap
plicati
on59%
73% 72%
9%
14%12%
Low Awareness And Low Application
Vs. Other Social SectorsHuman Capital Is A Top Concern For
Many Social Service Organizations% respondents who believe that social service organizations
are successful or very successful (N=356)
Serving
clients
HUMAN
CAPITAL
Sustain-
able
funding
Innovative
cultureThree Strategic Thrusts Considered To
Step-change Manpower Deployment
Desired outcomeA impactful sector that can continue meeting
beneficiaries’ needs effectively
Thrust 3Thrust 2Thrust 1Bringing out
the best in
people
Doing better
at resource
optimisation
Greater
emphasis on
service delivery
impact
23%16%
33%28%
25%27%
21%
Planning for
leadership succession
Developing leadership &
management capability
Average Rating on a scale of 5 = Strongly Agree to 1 = Strongly Disagree for a series of questions
Strong (4.0)
Weak (2.0)
SOCIAL
SERVICE
Health-
care
Educa-
tion
Top Quartile Global Non-Profit
Organizations (Bridgespan
database), N=598
Singapore NPOs, N=39
Sources: NCSS Sector Consultation Study 2016; NCSS Sector Brand Project 2016; Bain and Company 2014 Survey on
Non Profits in Singapore; Bridgespan; NCSS/MSF Manpower study
Only 16% of
respondents believe
they are successful
in planning for
leadership
succession
Organiza-
tional
capability
TALENT
Talent attraction, retention and management professionalism need to be enhanced to increase effectiveness of ecosystem
Unlocking the powerof Singapore’s nonprofits
ts expand,
A new study finds that, as Singapore’s nonprofi
they are learning to tackle the challenges that hinder their
ability to serve more people in need.By Sebastien Lamy and Usman Akhtar
© NCSS. All Rights Reserved
#6
#19
#1#2
#1
#2
#26
#4#8
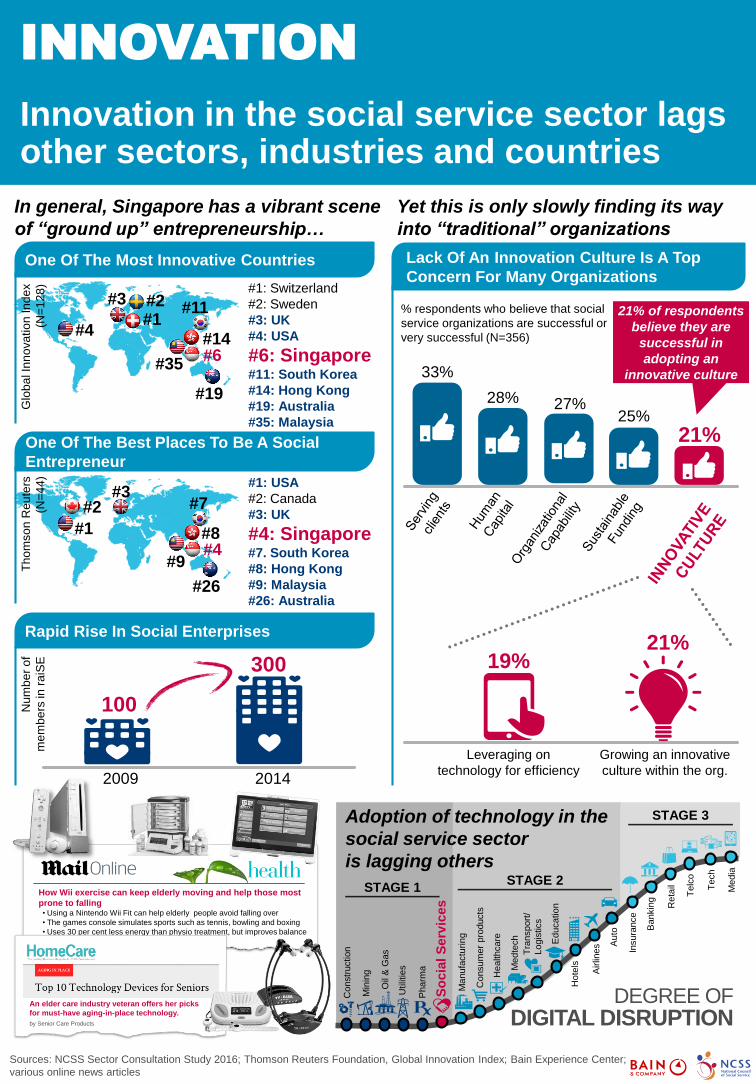
DIGITAL DISRUPTION
Constr
uction
Education
Media
Tech
Telc
o
Hote
ls
Insura
nce
Auto
Reta
il
Healthcare
Tra
nsport
/
Logis
tics
Medte
ch
Consum
er
pro
ducts
Utilit
ies
Manufa
ctu
ring
Airlin
es
Bankin
g
Min
ing
Oil
& G
as
Pharm
a
DEGREE OF
STAGE 1STAGE 2
STAGE 3
So
cia
l S
erv
ices
Adoption of technology in the
social service sector
is lagging others
2009 2014
300
100
27%
% respondents who believe that social
service organizations are successful or
very successful (N=356)
28%25%
21%
33%
Lack Of An Innovation Culture Is A Top
Concern For Many Organizations
Th
om
so
n R
eu
ters
(N=
44
)
One Of The Best Places To Be A Social
Entrepreneur
One Of The Most Innovative Countries
#1: USA
#2: Canada
#3: UK
#4: Singapore#7. South Korea
#8: Hong Kong
#9: Malaysia
#26: Australia
Glo
ba
l In
no
va
tio
n In
de
x
(N=
12
8) #1: Switzerland
#2: Sweden
#3: UK
#4: USA
#6: Singapore#11: South Korea
#14: Hong Kong
#19: Australia
#35: Malaysia
In general, Singapore has a vibrant scene
of “ground up” entrepreneurship…
Num
be
r o
f
me
mb
ers
in r
aiS
E
Rapid Rise In Social Enterprises
Yet this is only slowly finding its way
into “traditional” organizations
Leveraging on
technology for efficiency
Growing an innovative
culture within the org.
21%19%
How Wii exercise can keep elderly moving and help those most
prone to falling• Using a Nintendo Wii Fit can help elderly people avoid falling over
• The games console simulates sports such as tennis, bowling and boxing
• Uses 30 per cent less energy than physio treatment, but improves balance
An elder care industry veteran offers her picks
for must-have aging-in-place technology.
by Senior Care Products
21% of respondents
believe they are
successful in
adopting an
innovative culture
#4
#3
#9
#7
#3
#14
#11
#35
Sources: NCSS Sector Consultation Study 2016; Thomson Reuters Foundation, Global Innovation Index; Bain Experience Center;
various online news articles
INNOVATION
Innovation in the social service sector lags other sectors, industries and countries