strategy update: indicators, progress and lessons learned
TRANSCRIPT

www.gavi.org
UPDATE FROM THE SECRETARIAT, INCLUDING 2016-2020 STRATEGY, INDICATORS AND KPIs
GAVI BOARD MEETING
Seth Berkley
14 June 2017, Geneva

Second update on the 2016–2020 strategy
• Systematic, data-driven report on progress
• Based on new, ambitious framework
• Starting to bear fruit and strengthen our understanding
• Learning what works well and where we should revisit
Lessons on indicators discussed throughout
2 Board meeting
14-15 June 2017
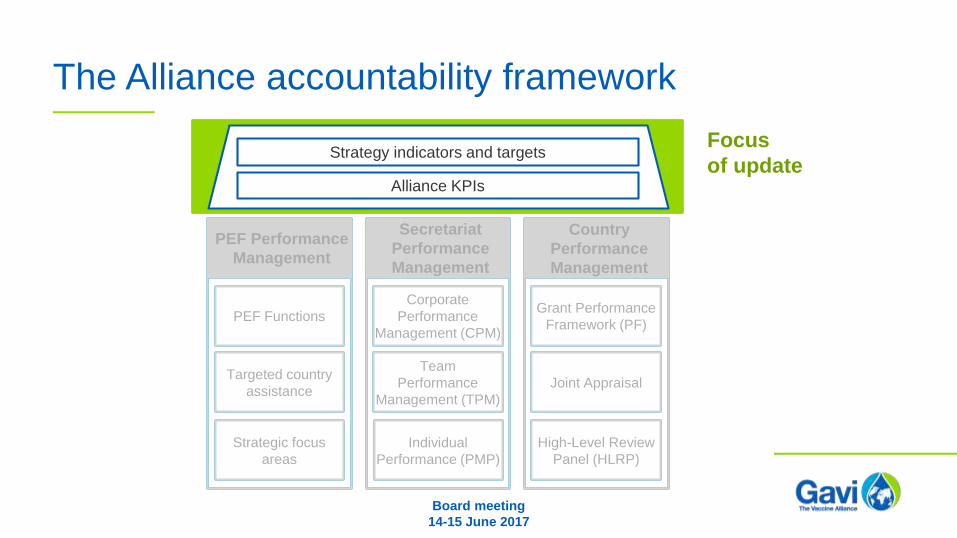
The Alliance accountability framework
Strategy indicators and targets
Alliance KPIs
Joint Appraisal
Country
Performance
Management
Secretariat
Performance
Management
Team
Performance
Management (TPM)
Individual
Performance (PMP)
PEF Functions
Targeted country
assistance
Strategic focus
areas
PEF Performance
Management
High-Level Review
Panel (HLRP)
Grant Performance
Framework (PF)
Corporate
Performance
Management (CPM)
Focus
of update
Joint Appraisal
Country
Performance
Management
Secretariat
Performance
Management
Team
Performance
Management (TPM)
Individual
Performance (PMP)
PEF Functions
Targeted country
assistance
Strategic focus
areas
PEF Performance
Management
High-Level Review
Panel (HLRP)
Grant Performance
Framework (PF)
Corporate
Performance
Management (CPM)
Board meeting
14-15 June 2017

2016–2020 INDICATORSMISSION PROGRESS
Board meeting
14-15 June 2017
2015 2017 2018 2019 2020
TARGETS
2016
Children immunised
300 million> 65 million
1
Future deaths averted
5-6 million> 1.2 million
2
Under-five mortality rate
58 per 1,00010% reduction in
rate from 2015
baseline by 2020
< 64 per 1,000
3
Future disability-adjusted life
years (DALYs) averted250 million
> 56 million
4
Vaccines sustained after Gavi support ends
100%100%
5
Projected on track,
based on assumed
continued improvement
over last report (latest
available data shown)
On track, based on data
available year to date
Estimate as of mid-2017: 100 million
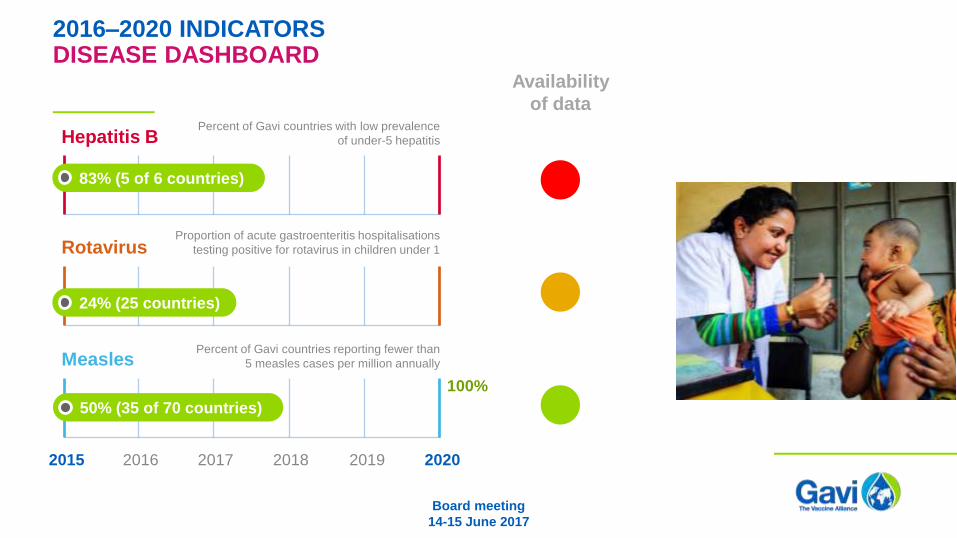
2016–2020 INDICATORSDISEASE DASHBOARD
Board meeting
14-15 June 2017
Hepatitis BPercent of Gavi countries with low prevalence
of under-5 hepatitis
83% (5 of 6 countries)
Rotavirus
24% (25 countries)
Proportion of acute gastroenteritis hospitalisations
testing positive for rotavirus in children under 1
Measles
100%
50% (35 of 70 countries)
2015 2017 2018 2019 20202016
Percent of Gavi countries reporting fewer than
5 measles cases per million annually
Availability
of data

2
3
4
5
Improve sustainability3 Shape the market4Accelerate vaccines1 Strengthen capacity2
2016–2020 INDICATORSSTRATEGY PROGRESS
1
EQUITY: GEOGRAPHIC DISTRIBUTION2016 DATA AVAILABLE Q3 2017
EQUITY: WEALTH DISTRIBUTION
EQUITY: EDUCATION
ROUTINE IMMUNISATION COVERAGE2016 DATA AVAILABLE Q3 2017
1
2
3
4
5
SUPPLY CHAIN PERFORMANCE2016 DATA AVAILABLE Q3 2017
DATA QUALITY
PENTA1 COVERAGE & DROP-OUT RATE2016 DATA AVAILABLE Q3 2017
INTEGRATED HEALTH SERVICE DELIVERY2016 DATA AVAILABLE Q3 2017
CIVIL SOCIETY ENGAGEMENT
2
3
4
1
COUNTRY INVESTMENT IN VACCINES2016 DATA AVAILABLE Q3 2017
COUNTRIES ON TRACK TO TRANSITION2016 DATA AVAILABLE Q3 2017
INSTITUTIONAL CAPACITY
CO-FINANCING COMMITMENTS
2
3
4
1
VACCINE PRICE REDUCTION
VACCINE INNOVATION
HEALTHY MARKET DYNAMICS
SUPPLY SECURITY
Measles-containing vaccine 1st dose
Percentage point
Pentavalent 1st dose
Pentavalent 3rd dose
MCV1
PP
Penta1
Penta3
CURRENT: +1PP PENTA3 86%
MCV1: 83%
PENTA3: 81%
MCV1: 78%
2015 VALUE 2020 TARGET
CURRENT: +1PP 63%31%
2015 VALUE 2020 TARGET
CURRENT: +1PP 26%16%
2015 VALUE 2020 TARGET
2020 TARGET
43%16%
2015 VALUE 2020 TARGET
36%26%
2015 VALUE 2020 TARGET
PENTA1: 91%
DROP-OUT: 3 PP
PENTA1: 87%
DROP-OUT: 6 PP
2015 VALUE 2020 TARGET
100%N/A
2015 VALUE 2020 TARGET
** Currently insufficient data to define target;
targets to be defined after provision of one full
year of PCA version 3.0 reports
1 Not published due to commercial sensitivity
35%
TARGET: 49% (2020)
30%
TARGET: 44% (2020)
49%
TARGET: 53% (2020)
100%
TARGET: 100% (2020)
9/11
TARGET: 11/11 (2020)
$19
TARGET: N/A1
3
TARGET: 10 (2020)
2/11
TARGET: 6/11 (2020)
ON TRACK
MODERATE DELAYS / CHALLENGES
SIGNIFICANT DELAYS / CHALLENGES
6
3
1
40%
TARGET: **
0%
TARGET: **PREV: 39%
PREV: 34%
PREV: 45%
75%63%
2015 VALUE 2020 TARGET
PREV: N/A
PREV: N/A
PREV: 85% PREV: 7/11
PREV: $20
PREV: 0
PREV: 1/11
BREADTH OF PROTECTION2016 DATA AVAILABLE Q3 2017
TO BE REPORTED Q3 20178

SG1Equity indicators
% of Gavi countries with: Data source
Geographic
equityAdministrative
data
>80% third dose pentavalent coverage in all districts
Wealth
equity
Surveys≤10% point difference in coverage between richest
and poorest quintile
Gender
equity
Surveys≤10% point difference in coverage between children of
mothers with no education vs secondary/higher education
• Limited number and timing of surveys available
• Quality of data
• Thresholds can mask important developmentsChallenges
MODERATE
CHALLENGES
Board meeting
14-15 June 2017

SG1Alliance work on equity
Equity mainstreamed in grant processes - key points:
• Where are the under-immunised children?
• What are the barriers to immunisation?
• How can Gavi support?
Improving sub-national data:
• Sub-national administrative coverage for PEF priority
countries reported this year
• First reporting of sub-national data through joint
reporting form
• Support to triangulation of sources at sub-national
level to strengthen decision-making
Coverage with the third
dose of pentavalent
vaccine, 2016
0 –
49%
50 –
79%
>=
80%Municipal level
ANGOLA
Board meeting
14-15 June 2017

SG1Vaccine introductions across strategy periods
Board meeting
14-15 June 2017
27
Gavi 4.0 (2016-20)
215
Gavi 2.0 (2006-10)
67
Gavi 1.0 (2001-5) Gavi 3.0 (2011-15)
Routine introductions
Vaccination campaigns
~270

SG1Target of 50 introductions in 2017
Board meeting
14-15 June 2017
49 71
45 24
68
27
2020
72
2015
139
2014
59
10~35
2019
~40
2018
~80
2017
51
14
2016
Forthcoming/
projected
Completed
Gap to projection
Introductions as of 12 June 2017
MODERATE
CHALLENGES
At risk
(13)
Target:
50

14 introductions in 2017 – majority are campaigns
Since January 2017:
5 routine introductions
9 campaigns/demos
Bolivia
HPV
Lesotho
Measles-rubella
Burundi
Measles-rubella
Uganda
Meningitis A
Ethiopia
Measles
CAR
Meningitis A
Côte d’Ivoire
Rotavirus
Burkina Faso
Meningitis A
Mali
Meningitis A
Meningitis A Cambodia
HPV
Measles-rubella
India
Measles-
rubella
Pneumococcal
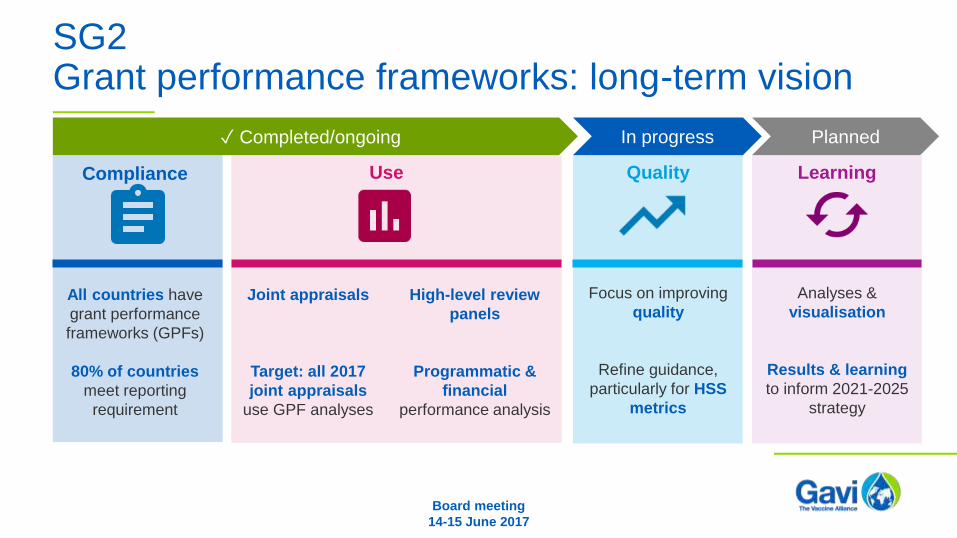
SG2Grant performance frameworks: long-term vision
✓ Completed/ongoing
All countries have
grant performance
frameworks (GPFs)
80% of countries
meet reporting
requirement
Compliance
Joint appraisals
Target: all 2017
joint appraisals
use GPF analyses
High-level review
panels
Programmatic &
financial
performance analysis
Use
Focus on improving
quality
Refine guidance,
particularly for HSS
metrics
In progress
Quality
Analyses &
visualisation
Results & learning
to inform 2021-2025
strategy
Planned
Learning
Board meeting
14-15 June 2017
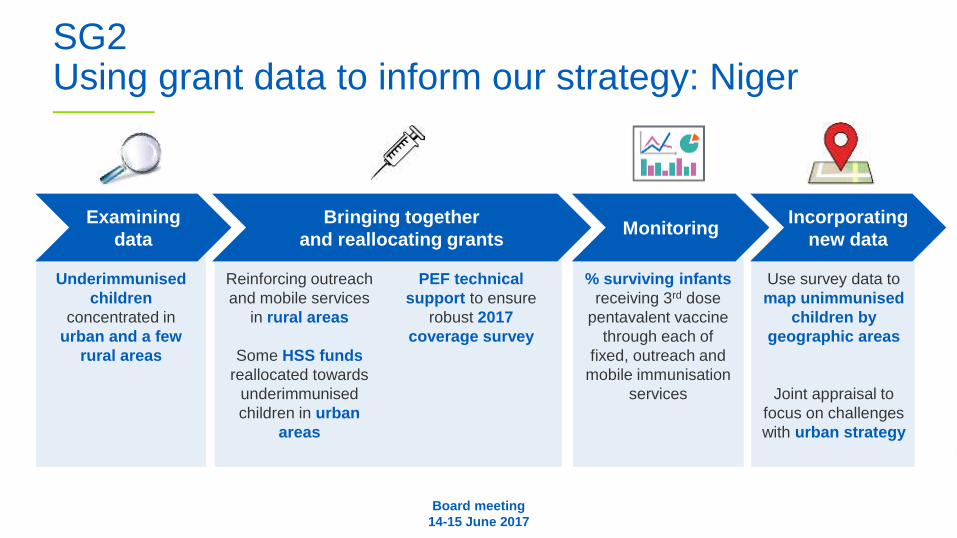
SG2Using grant data to inform our strategy: Niger
Examining
data
Bringing together
and reallocating grantsMonitoring
Incorporating
new data
Underimmunised
children
concentrated in
urban and a few
rural areas
Reinforcing outreach
and mobile services
in rural areas
Some HSS funds
reallocated towards
underimmunised
children in urban
areas
PEF technical
support to ensure
robust 2017
coverage survey
% surviving infants
receiving 3rd dose
pentavalent vaccine
through each of
fixed, outreach and
mobile immunisation
services
Use survey data to
map unimmunised
children by
geographic areas
Joint appraisal to
focus on challenges
with urban strategy
Board meeting
14-15 June 2017

SG2Supply chain strategy: progress
Board meeting
14-15 June 2017
20
20
de
live
rab
les
35 countries have
dedicated and
competent supply
chain leaders
All Gavi countries
implement comprehensive
supply chain management
plans
30-40 countries use
data to oversee
supply chain and
measure performance
40-50 countries have
improved cold chain
equipment
At least 10
countries have
done system
design
Leadership Continuous
improvement plansData for
management
Cold chain
equipment
System
design
On track
32/47 countries show
improvement in EVMs;
6 countries with EVMs
>80%
10 countries
started analyses;
7 countries
implementing
Applications from
42/51 eligible
countries
23 countries
started
implementation
SC leaders in 10
countries meet
competency
requirementsCu
rre
nt
sta
tus

SG3Transitioning countries
55 50 48 47 47 43 40
21161818 181717
2017
9
2021
12
2020
12
2019
9
2018
9
2016
5
2015
Fully Gavi-eligible
Accelerated transition
Fully self-financing
Bhutan
Honduras
Mongolia
Sri Lanka
Ukraine
4 more countries
transitioned
end 2016
Based on current projections
India
Lao PDR
Nigeria
Solomon Isl.
Ghana
Guyana
Indonesia
Kiribati
Moldova
Angola
Armenia
Azerbaijan
Bolivia
Congo Rep.
Cuba
Georgia
Timor-Leste
- Vietnam Nicaragua
PNG
Uzbekistan
Ghana
Zambia
ON TRACK
15 Board meeting
14-15 June 2017

SG3Co-financing
$36m
$64m
$91m
$113m$123m
2016201520122011
$121m
20142013
% of countries
not in arrears94% 87% 79% 75% 85% 92%
Pending
Payments
ON TRACK
As of 31 May 2017. Countries with co-financing requirements aligned to fiscal years, with waivers
and pending reconciliation of self-procurement amounts.
16 Board meeting
14-15 June 2017
Includes US$ 34m from
Kenya and Pakistan,
only due in June
$39m
$160m$20mSelf-financed
programmes
$39m
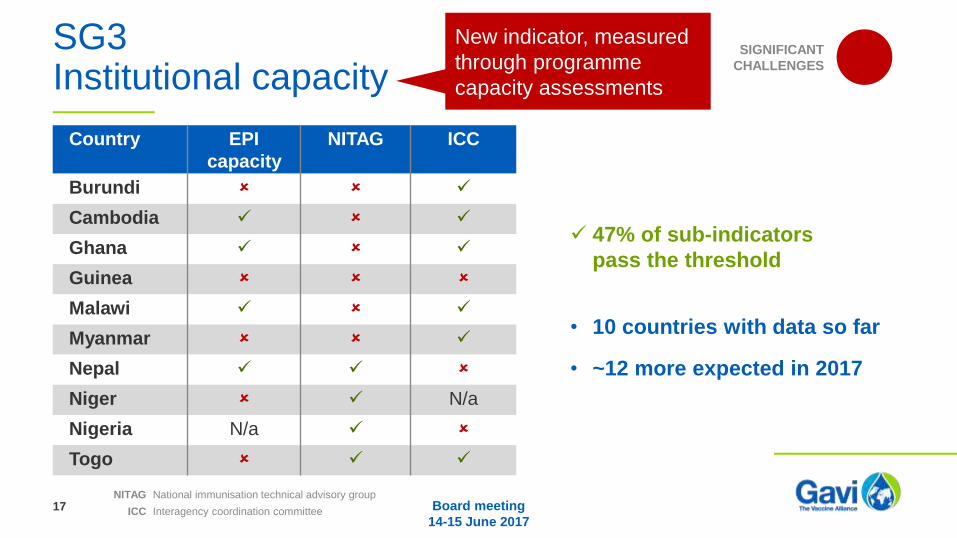
SG3Institutional capacity
Country EPI
capacity
NITAG ICC
Burundi
Cambodia
Ghana
Guinea
Malawi
Myanmar
Nepal
Niger N/a
Nigeria N/a
Togo
National immunisation technical advisory group
Interagency coordination committee
NITAG
ICC
SIGNIFICANT
CHALLENGES
New indicator, measured
through programme
capacity assessments
• 10 countries with data so far
• ~12 more expected in 2017
47% of sub-indicators
pass the threshold
17 Board meeting
14-15 June 2017

SG4Market shaping
97
20162015
11
Markets with
sufficient &
uninterrupted supply
2015
-5%
2016
$19$20
Average price to
fully vaccinate a
child*
30
20162015
10
Vaccines/products
with improved
characteristics
21
20162015
11
Markets with
moderate/high
market dynamics
* with pentavalent, rotavirus
and pneumococcal vaccines
ON TRACK
18 Board meeting
14-15 June 2017

No target; tracking trend over time
2015 baseline; value to be updated in Q3 following
improvements to data sources to be implemented
over 2017 JA season
†
*
Partners3
1
2
3
4
5
6
7
Governance4
1
Secretariat & partners1
2
3
4
5
6
Secretariat2
1
2
3
4
5
6
1
2
3
2016–2020 INDICATORSALLIANCE PROGRESSUPDATED: 25 April 2017
PARTNER GROUP
Health system strengthening
Targeted country assistance
Strategic focus area
Partners' engagement framework
Civil society organisation
HSS
TCA
SFA
PEF
CSO
ON TRACK
MODERATE DELAYS / CHALLENGES
SIGNIFICANT DELAYS / CHALLENGES
5
10
1
11.6 MONTHS
VACCINE INTRODUCTIONS
TARGET: 90% (2016)
63%
PREV: N/A
NEW VACCINE COVERAGE
TARGET: 90% (2016)
89%
PREV: N/A
MEASLES CAMPAIGN COVERAGE
TARGET: 90% (2016)
75%
PREV: N/A
SPEED OF CASH GRANT DISBURSEMENTS
TARGET: 9 MONTHS (2016)
11.6m
PREV: 13.7M
AUDITS ON TRACK
TARGET: 80% (2016)
56%
PREV: 30%
PROGRAMME FINANCE FORECAST
TARGET: +/- 10% (2016)
-18%
PREV: -11%
TARGET: 80% (2016)
PEFTCA ACTIVITIES ON TRACK
15%
PREV: 30%
DONOR ENGAGEMENT IN COUNTRY
TARGET: 100% (2016)
20%*
PREV: N/A
SECRETARIAT SUPPORT TO
GOVERNANCE
TARGET: N/A†
TO BE REPORTED AT JUNE BOARD
HSS PROPOSAL QUALITY
TARGET: N/A†
90%
PREV: N/A
HSS FUND UTILISATION
TARGET: N/A†
61%
PREV: 56%
HSS GRANT TARGETS
TARGET: 80% (2020)
45%
PREV: 31%
RISK MANAGEMENT PLAN PROGRESS
TARGET: 80% (2016)
93%
PREV: 90%
OPERATING EFFICIENCY
TARGET: N/A†
$293K
PREV: $233K
OPERATIONAL DEMAND FORECAST
TARGET: +/- 10% (2016)
-10%
PREV: N/A
CSO ENGAGEMENT
70%
TARGET: N/A
CSO
PREV: N/A
PLEDGE CONVERSION
80%
TARGET: 80% (2016)
DONORS
PREV: N/A
EVALUATION ALIGNMENT
TARGET: N/A†
DONORS
16 EVALUATIONS
PREV: N/A
COUNTRY REPORTING
TARGET: 75% (2016)
COUNTRIES
80%
PREV: 54%
BOARD ATTENDANCE
TARGET: 90% (2016)
81%
PREV: 85%
GENDER BALANCE
TARGET: 40-60% (2016)
33%
PREV: 37%
TRACKING TREND ONLY (NO TARGETS OR PERFORMANCE RANKING)6
SFA/PEF ACHIEVEMENTS
TARGET: 80% (2016)
PEF
PREV: N/A
71%
Gender balance now 36%
overall, 46% for the Board
2016 drivers of delays:
IPV, HPV, rotavirus
1 percentage
point from target
3 out of 4 countries
with surveys met target
Above target but limited
number reporting
Going down but
still above target
10/18 completed; another
6 close to completion
Caused by IPV and cash
programme delays
Nov 2016 reporting–
8 months after start
Nov 2016
reporting
Still reflects 2015
baseline from JAs
Small decrease since
last measurement
Board meeting
14-15 June 2017

www.gavi.org
THANK YOU