strategy outline - investors
TRANSCRIPT
Building a truly customer centric bank
Strategy Outline
27 February 2014

Introduction
Philip Hampton, Chairman

Agenda
Strategy Outline
Go-forward financial profile
Q&A
Conclusions
Ross McEwan
Nathan Bostock
Ross McEwan
Transforming the Bank –
implementation Simon McNamara
Philip Hampton

Our vision for a bank that earns your trust
Be reliable, consistent and simple to do business with
Earn our customers' trust and win more of their business
Generate reliable returns, positive organic cash flow and pay an ordinary dividend
Our ambition:
to be number one for customer service, trust and advocacy in each of our business areas by 2020
1

Where we are today
We have market leading franchises…
We have been pro-active in refocusing on where we have a competitive advantage…
We have made great progress in downsizing and risk reduction…
…but they are vulnerable if we don’t act
…but most of our businesses continue to generate sub-par returns
…but our cost base and organisational model still reflect our past ambition
2

We must invest in our customer franchises
#2 UK Retail current accounts
#1 UK Small Business Banking
#1 UK Wealth Management
#1 UK Mid Corporates
#1 UK Large Corporates, #4 in Europe
#1 UK Cash Management, #4 in Europe
Best Trade Finance Bank in UK and Western Europe
Focused international platform including strong US and Asian distribution networks
Strong capabilities in FX, DCM, Rates -Top 3 in UK, Top 10 in EMEA
#1 Northern Ireland
#3 Republic of Ireland
Customers’ expectations are rising and their needs are rapidly evolving
We make it too complicated for our customers to do business with us
Questions remain around our technology
Our reputation has been damaged by misconduct
Our market share trend is flat in most franchises and declining in some
We have market leading franchises… …but they are vulnerable if we don’t act
3

We must reduce cost and complexity further
740
-54%
20132007
~1,60013
16-18%
20132008
TPA
s, £
bn
Cos
ts, £
bn
Loan : deposit ratio 94%Short-term wholesale funding £32bnLiquidity Coverage Ratio 102%Net Stable Funding Ratio 122%
Siloed organisationInefficient and inconsistent support and control functionsMultiplicity of technology platformsFragmented processes
We have made great progress in downsizing and risk reduction…
…but our cost base and organisational model still reflect our past ambition
4
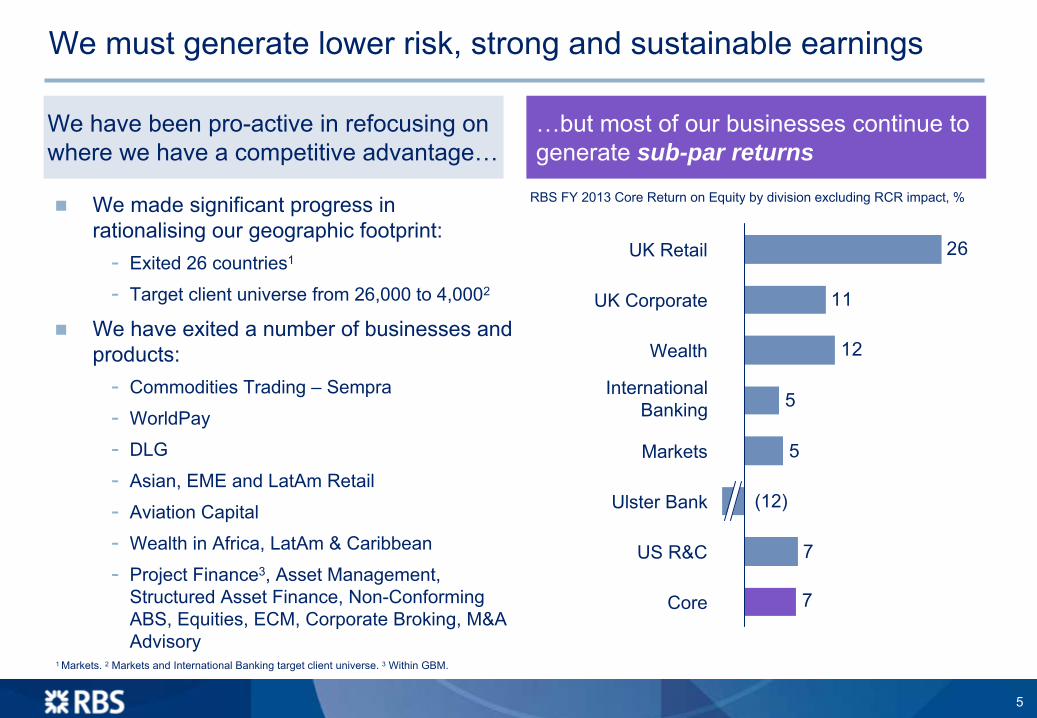
We must generate lower risk, strong and sustainable earnings
We have been pro-active in refocusing on where we have a competitive advantage…
…but most of our businesses continue to generate sub-par returns
International Banking
7
7
5
5
12
11
26
Core
US R&C
Ulster Bank
Markets
Wealth
UK Corporate
UK Retail
RBS FY 2013 Core Return on Equity by division excluding RCR impact, %We made significant progress in rationalising our geographic footprint:-
Exited 26 countries1
-
Target client universe from 26,000 to 4,0002
We have exited a number of businesses and products:-
Commodities Trading –
Sempra
-
WorldPay
-
DLG
-
Asian, EME and LatAm
Retail
-
Aviation Capital
-
Wealth in Africa, LatAm
& Caribbean
-
Project Finance3, Asset Management, Structured Asset Finance, Non-Conforming ABS, Equities, ECM, Corporate Broking, M&A Advisory
1 Markets. 2
Markets and International Banking target client universe. 3
Within GBM.
(12)
5

Our key priorities
Unquestioned capital strength
Empower our people
Organise around our customers
Intelligent deployment of technology
Fundamental overhaul of cost base
6

Our strategy: UK focused Retail & Commercial bank
UK banking market is among the most attractive globally: 5th highest income, 5th
largest profit pool
Focus on Retail & Commercial will result in a significantly lower risk profile and higher returns
….with emphasis on Retail & CommercialBusiness mix shift towards the UK…
Steady state1
~80%
~20%
Current
~60%
~40%
2008
~40%
~60%
Steady state1
~85%
~15%
Current
~80%
~20%
2008
~50%
~50%
With Markets and international capabilities to meet our clients’
needs, primarily focusing to support their UK and Western European operations
Illustrative split by total income
1
Steady state defined as 2018 to 2020. 2
Wholesale defined as GBM in 2008 and Markets for current and steady state
Illustrative split by RWAs R&CWholesale2UKNon-UK
7

Organised to best serve our customers’
needs
Personal & Business Banking
Commercial & Private Banking
Corporate & Institutional Banking
UK Commercial
UKMid
Corporate
High Net Worth
UKMass Retail
UK Small Business
UKAffluent
Ulster
UK Large Corporate
Int’l Large Corporate
Financial Institutions
From 7 Divisions to 3 businesses, each serving specific segments of customers with similar needs
Rebalancing from c.70% of our people in “back office” support and control roles to a majority in customer-facing roles, with remuneration of all staff linked to customer service
RWA Op. Profit RoE3
35% 50% 15+%
RWA Op. Profit RoE3
30% 30% 15+%
RWA Op. Profit RoE3
35% 20%~10%2
Markets
Steady state1 business profile Steady state1 business profile Steady state1 business profile
1
Steady state defined as 2018 to 2020. 2
7-8% medium-term target (2016/17). 3
Divisional return on equity target is based on 12% divisional RWAs, adjusted for capital deductions (expected loss, securitisations and pension deficit).
8
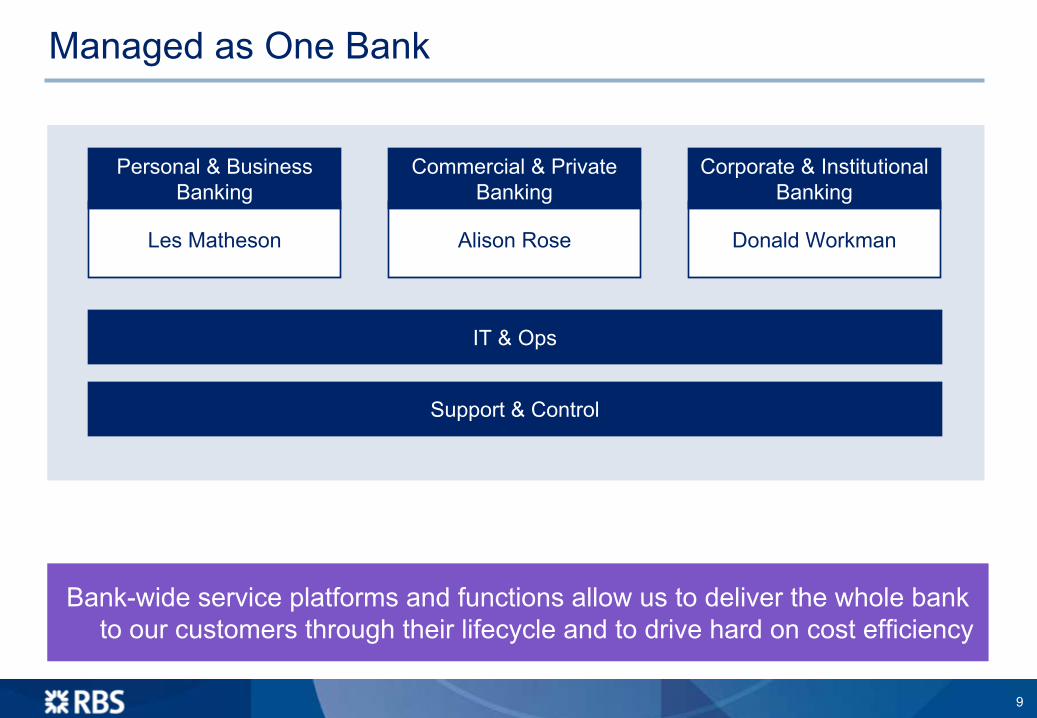
Managed as One Bank
Les Matheson
Personal & Business Banking
Alison Rose
Commercial & Private Banking
Donald Workman
Corporate & Institutional Banking
Support & Control
IT & Ops
Bank-wide service platforms and functions allow us to deliver the whole bank to our customers through their lifecycle and to drive hard on cost efficiency
9

Mortgage market share GB
Main Current account market
share GB
8%
18%
Differentiated service and extensive multi-channel distribution network, enabled by technology
Full range of simple services
Fair and transparent pricing
Market leading digital offering for Personal and Business customers
More Business Bankers in branches
Strong core brands
Best UK bank for Personal & Business customersPersonal & Business Banking combines all customers with retail-like needs: mass retail, affluent and small business owners, enabling a coherent and efficient service proposition
Our opportunitiesOur proposition
England & Wales Scotland
Meet more of existing customer needs
Improve customer service and advocacy
RBS UK Retail market share1
#2 #4
-16
2
Average2RBS
-10Market leader
6
27
Average2NatWest
5
Market leader
Customer NPS2
1
Market share of all main current accounts / Market share of all
mortgage accounts. GfK: FRS 6 month ending December 2013. Competitor ranking based on banking groups. 2
Customer NPS -
a measure of our main CA customers’
likelihood to recommend our current account service. Source: GfK: FRS 3 month ending December 2013. Market average compiled from
competitor scores in E&W (Barclays, Co-op, Halifax, HSBC, LTSB (incl
Lloyds Bank and TSB), Nationwide, NatWest, Santander) and Scotland (BoS, Clydesdale, LTSB (incl
Lloyds Bank and TSB), RBS, Santander).
10

We are the UK bank best able to support business customers throughout their entire lifecycle
We are implementing the recommendations from the review by Sir Andrew LargeExpanding our lending to SME businessesRemoving barriers, and speeding up decision makingWe have put Business Bankers back in branches
Encouraging new business statistics
SME franchise
We continue to invest in our leading SME franchise
Gross lending
New loan approvals
+21%vs. Q412
+12%vs. Q313
+39%vs. Q412
+14%vs. Q313
Personal & Business Banking Commercial & Private BankingConvenience of our extensive multi-channel distribution networkEasy access to Business Bankers in our branches
Dedicated relationship managementAccess to more sophisticated products and services
As businesses grow and their needs become more complex, our proposition changes with them
11

We will continue to transform Ulster BankUlster Gross Third Party Assets, £bn
We are committed to providing our Irish customers with a great everyday banking service
However, legacy asset reduction in RCR will materially reduce scale of future franchise
Evaluating options to address un-economic products, especially tracker mortgages
Need to rationalise resource allocation and infrastructure to serve a smaller business model
Connect Ulster NI better with UK Retail: Ulster wrapper, RBS/ NatWest capability
Reposition and reconfigure Ulster RoI as the Irish challenger bank to the systemic banks
45
~10-15
‘Future’
Ulster
~15-20~5
Tracker mortgages
~(10)
Transferred to RCR
~(15)
FY13
Northern Ireland
Republic of Ireland
12

Deepen relationships with internationally active Commercial clients though market leading FX and Trade propositions
Better connect Coutts to successful business owners / entrepreneurs
Dedicated relationship management
Full suite of market leading services
-
Lending
-
Transaction banking
-
Risk management
-
Wealth management
Strong brands FXMid-Corp lead relationships
16%
26%
Trade services and finance
12%
Market Leader in Commercial & Private Banking
RBS UK Corporate share / product penetration
#1 #2 #3
Commercial & Private Banking brings together our Commercial franchise with our Private Banking offering, allowing us to better connect Coutts with successful business owners
Our opportunitiesOur proposition
13

Opportunity to increase penetration of international products
Increased connectivity between Markets and Corporate Banking activities
Increased connectivity across the network
Our opportunitiesLeader in Sterling & Euro issuance, strong USD capabilities
Top 5 in core products1
Sustained #1 ranking in UK Private Placements
Broad country network across Europe, Asia and the US
Corporate & Institutional: the UK’s pre-eminent Corporate BankWe are aligning our Markets and international capabilities with our most sophisticated domestic and multinational clients’ needs, primarily focusing to support their UK and Western European operations
UK Large Corporate lead relationships
29%40%
International network
RBS product penetration and rank
#1 #4
Our proposition
Strong and focused product offering
Debt Financing: DCM, Structured Finance, Loans
Risk Management: Currencies, Rates
Transaction Services: International & Domestic Cash, Payments and Trade
1
European FX, £
DCM, £
Rates, International Cash Management and Trade Finance.
14
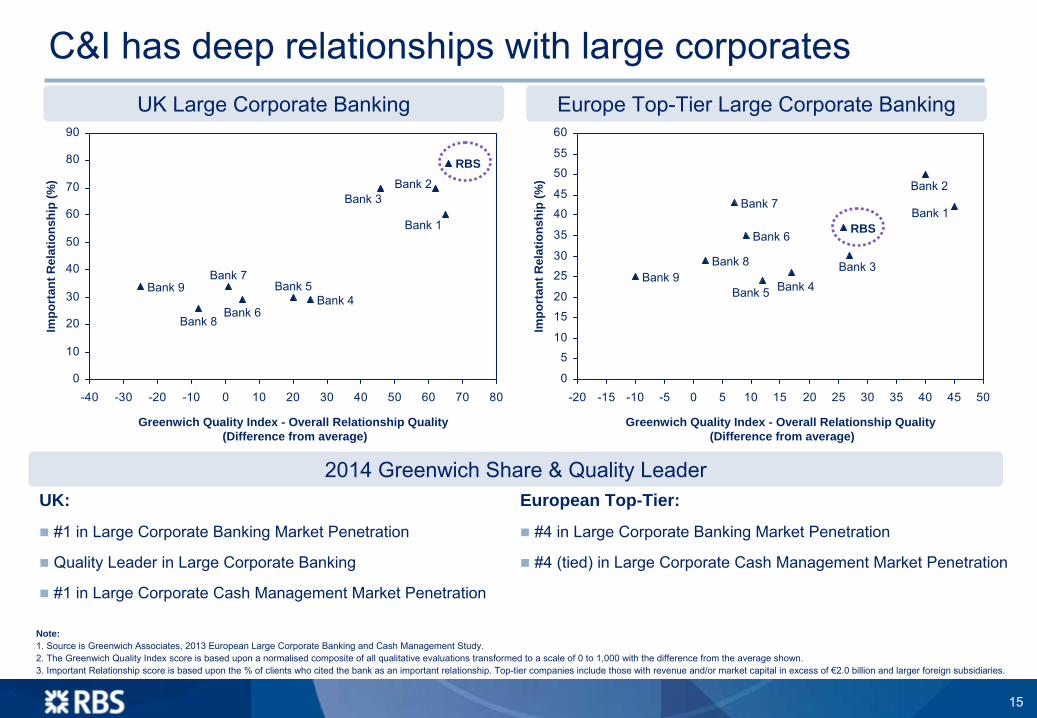
UK
Large Corporate Banking
UK:
#1 in Large Corporate Banking Market Penetration
Quality Leader in Large Corporate Banking
#1 in Large Corporate Cash Management Market Penetration
European Top-Tier:
#4 in Large Corporate Banking Market Penetration
#4 (tied) in Large Corporate Cash Management Market Penetration
2014 Greenwich Share & Quality Leader
Europe Top-Tier Large Corporate Banking
0
10
20
30
40
50
60
70
80
90
-40 -30 -20 -10 0 10 20 30 40 50 60 70 80
Bank 9
Bank 8
Bank 7
Bank 6
Bank 5Bank 4
Bank 3Bank 2
Bank 1
RBS
Impo
rtan
t Rel
atio
nshi
p (%
)
Greenwich Quality Index - Overall Relationship Quality(Difference from average)
0
5
10
15
20
25
30
35
4045
5055
60
-20 -15 -10 -5 0 5 10 15 20 25 30 35 40 45 50
Impo
rtan
t Rel
atio
nshi
p (%
)
Greenwich Quality Index - Overall Relationship Quality(Difference from average)
Bank 7
Bank 6
Bank 5 Bank 4
RBS
Bank 3
Bank 2
Bank 1
Bank 9Bank 8
Note:1. Source is Greenwich Associates, 2013 European Large Corporate
Banking and Cash Management Study.2. The Greenwich Quality Index score is based upon a normalised composite of all qualitative evaluations transformed to a scale of 0 to 1,000 with the difference from the average shown.3. Important Relationship score is based upon the % of clients who cited the bank as an important relationship. Top-tier companies include those with revenue and/or market capital in excess of €2.0 billion and larger foreign subsidiaries.
C&I has deep relationships with large corporates
15

Next chapter: we are embarking on a multi-year transformation
2014 2015-onwards
Immediate actions to improve customer focus and cost effectiveness
Implement new organisation structureStop low value add activitiesContinue to improve system resilienceSimplify product offeringProvide transparency on pricing/chargesIncrease penetration of online and mobile applications
Transformational changeInvestment in front-line customer propositionsFuture proof our technology infrastructureComplete fundamental end-to-end process re-design Implement ICB ring-fencing requirements
We will build a truly customer centric bank
Target costs ~£1bn lower by end-2014 Medium-term cost base target of ~£8bn
16
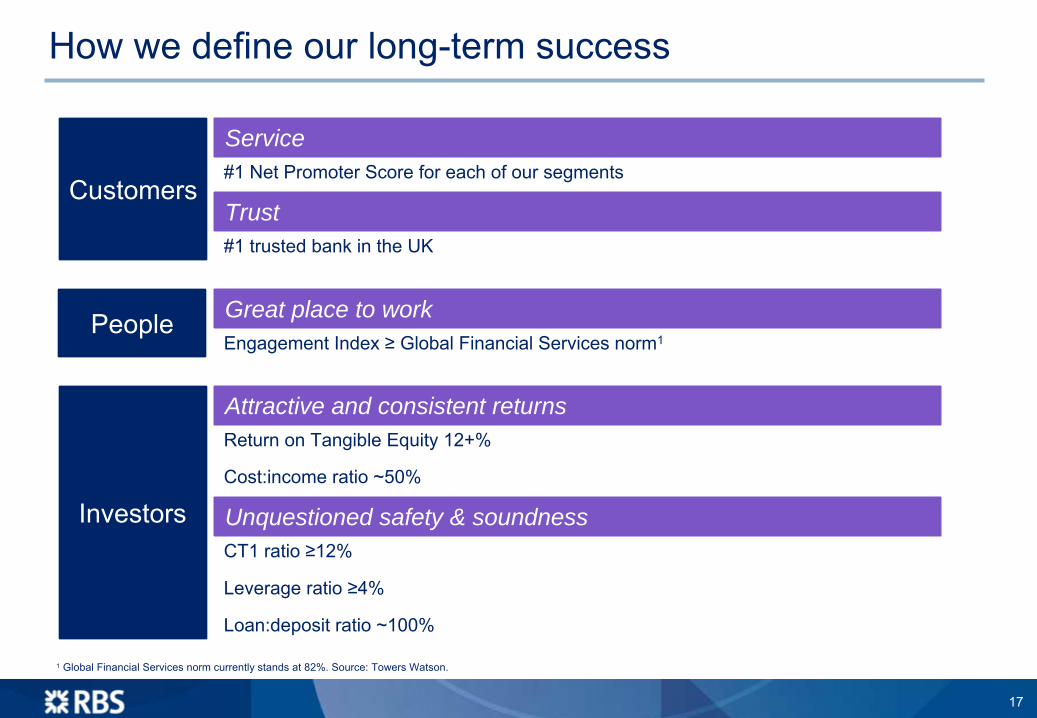
How we define our long-term success
#1 Net Promoter Score for each of our segmentsCustomers
#1 trusted bank in the UK
People
Return on Tangible Equity 12+%
InvestorsCost:income
ratio ~50%
CT1 ratio ≥12%
Leverage ratio ≥4%
Loan:deposit
ratio ~100%
Attractive and consistent returns
Unquestioned safety & soundness
Great place to work
Service
Trust
Engagement Index ≥
Global Financial Services norm1
1
Global Financial Services norm currently stands at 82%. Source: Towers Watson.
17
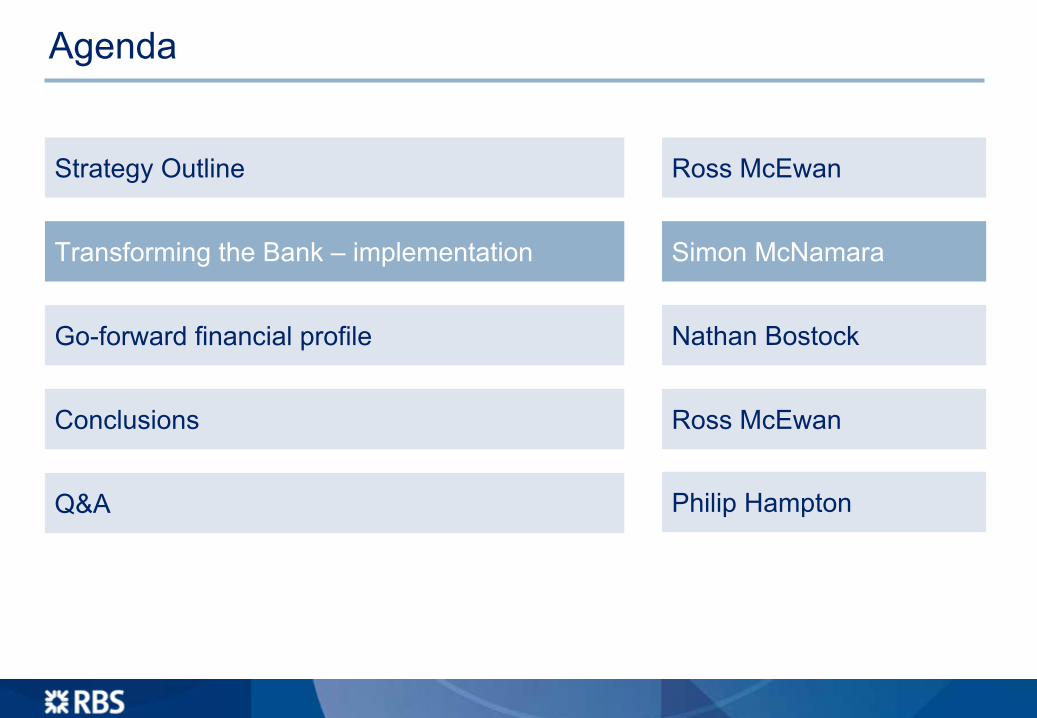
Agenda
Strategy Outline
Go-forward financial profile
Q&A
Conclusions
Ross McEwan
Nathan Bostock
Ross McEwan
Transforming the Bank –
implementation Simon McNamara
Philip Hampton

Multiple legacy systems running at sub-optimal cost Systems rationalised and simplified
Operationally complex services, primarily built around branches
A simple, multi-channel
bank with leading digital and self-service capabilities
Multiple hand-offs
for customers with failure/complaint at point of hand-off
More “One & Done”
service offerings supported by simpler joined up processes
Customer data held in various different systems
Consolidated information used smartly to provide improved customer experience
Where we are… Where we want to be…
Opportunity to deliver a differentiated IT & Ops capability that
enables us to serve our customers better
Ageing core systems Systems based on a target architecture with improved resilience
Transforming the Bank
18
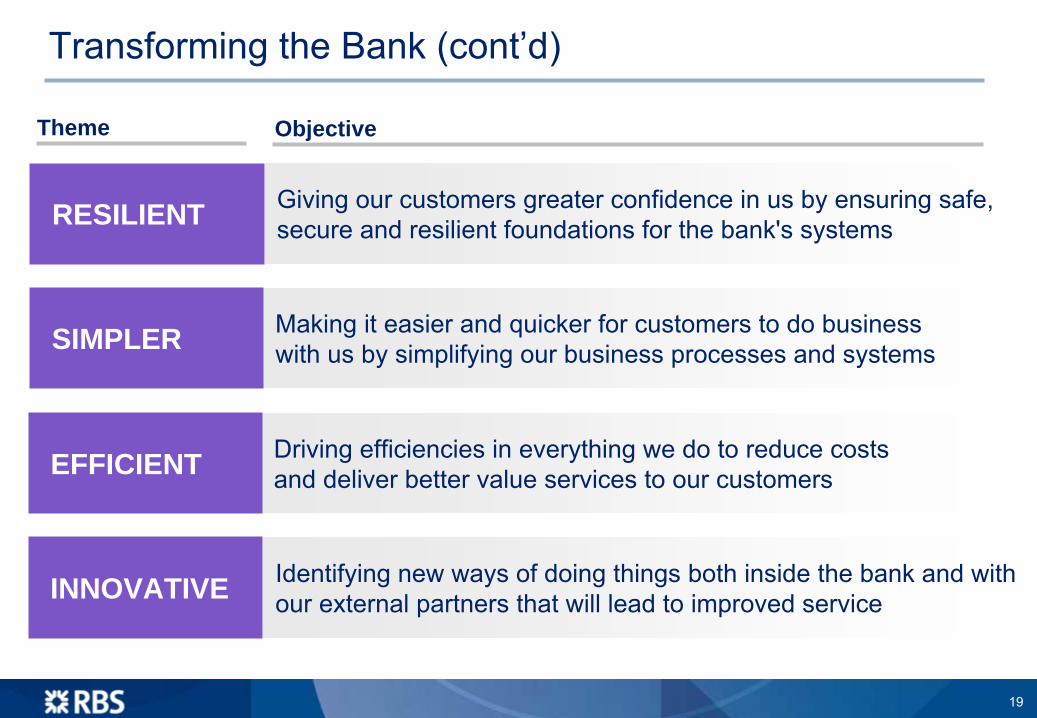
Giving our customers greater confidence in us by ensuring safe, secure and resilient foundations for the bank's systemsRESILIENT
Making it easier and
quicker
for customers to do business with us by simplifying our business processes and systemsSIMPLER
Driving efficiencies in everything we do to reduce costs and
deliver better value services to our customersEFFICIENT
Identifying new ways of doing things both inside the bank and with our external partners that will
lead to improved
serviceINNOVATIVE
Theme Objective
Transforming the Bank (cont’d)
19
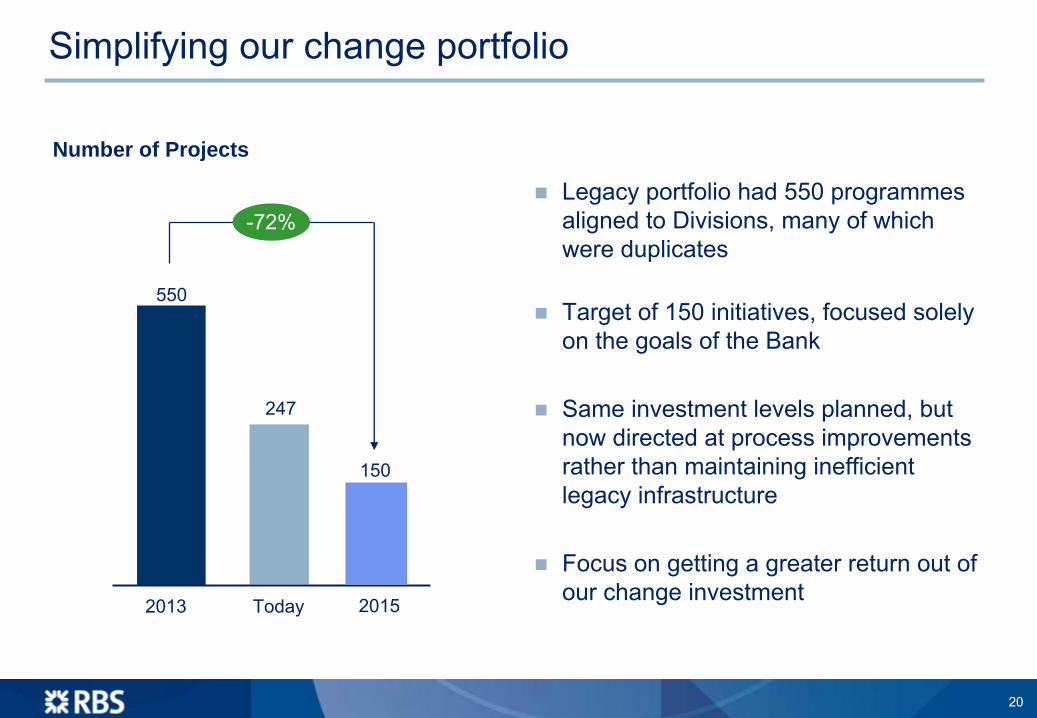
-72%
Today2013 2015
Number of Projects
Legacy portfolio had 550 programmes aligned to Divisions, many of which were duplicates
Target of 150 initiatives, focused solely on the goals of the Bank
Same investment levels planned, but now directed at process improvements rather than maintaining inefficient legacy infrastructure
Focus on getting a greater return out of our change investment
150
247
550
Simplifying our change portfolio
20

We are too complex
Propositions currently too complex for our customers
Initiatives already underway to simplify our most important customer propositions
Simplify our propositions and how we deliver
Credit card propositions109 Main UK Retail and Corporate call centres16
Manual payments processed annually7.8m Mortgage platforms5
Live websites1,133 Days to produce a mortgage offer17
Separate AML initiatives underway7 Postage spend annually£90m
Cash and coin centres10 Different retail
savings products36
21

By reducing the number of platforms in use we can focus on their resiliency and reduce the overhead in their ongoing management
1
Electronic payments, excluding ATM, POS, cheque and cash.
Reducing the number of platforms
>50% fewer platforms reducing
complexity, cost, error rates and
wasted front line effort
-80% -88%
Reducing the number of core banking systems
Reducing the number of payment systems1
~50
~10
~80
~10
Simplifying our technology estate
22
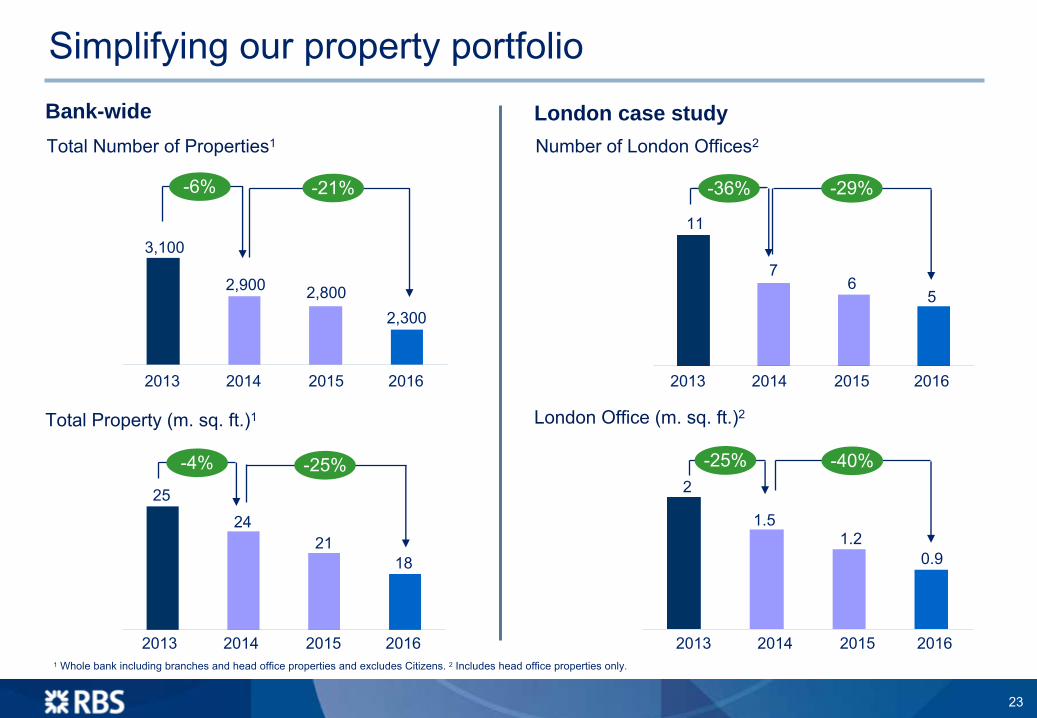
2013 2014 2015 2016
2013 2014 2015 2016
Number of London Offices2
London Office (m. sq. ft.)2
Total Number of Properties1
Total Property (m. sq. ft.)1
1
Whole bank including branches and head office properties and excludes Citizens. 2
Includes head office properties only.
2013 2014 2015 2016
2013 2014 2015 2016
Bank-wide London case study
-29%-36%
-40%-25%
-21%-6%
-25%-4%
2013 2014 2015 2016
2013 2014 2015 2016
2013 2014 2015 2016
2013 2014 2015 2016
2
1.51.2
0.9
11
76
5
25
2421
18
3,100
2,900 2,8002,300
Simplifying our property portfolio
23
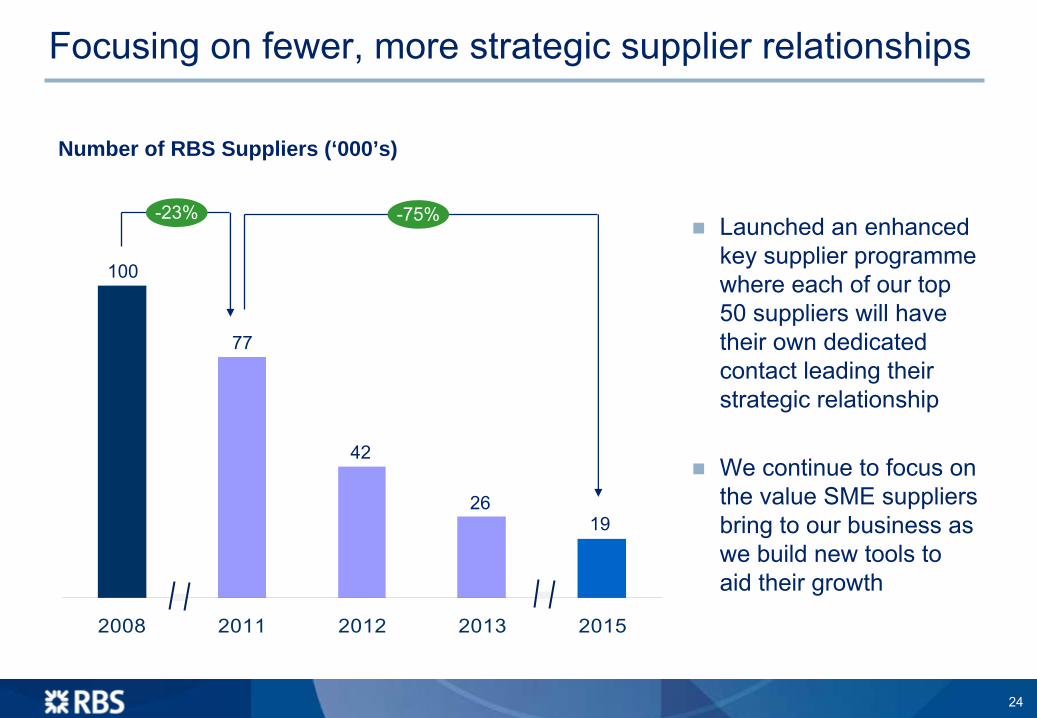
Launched an enhanced key supplier programme where each of our top 50 suppliers will have their own dedicated contact leading their strategic relationship
We continue to focus on the value SME suppliers bring to our business as we build new tools to aid their growth
2008 2011 2012 2013 2015
-23% -75%
Number of RBS Suppliers (‘000’s)
1926
42
77
100
Focusing on fewer, more strategic supplier relationships
24

Allows more of our customers to do more things when they want, meeting more of their needs at lower cost
2.9m
User Base
0.3m
2011
2013
Log-ins since launch
1.4bn
The only UK bank to offer app on Windows platform
Used in almost every country across the globe
2009
Building on our mobile and channel offering
25
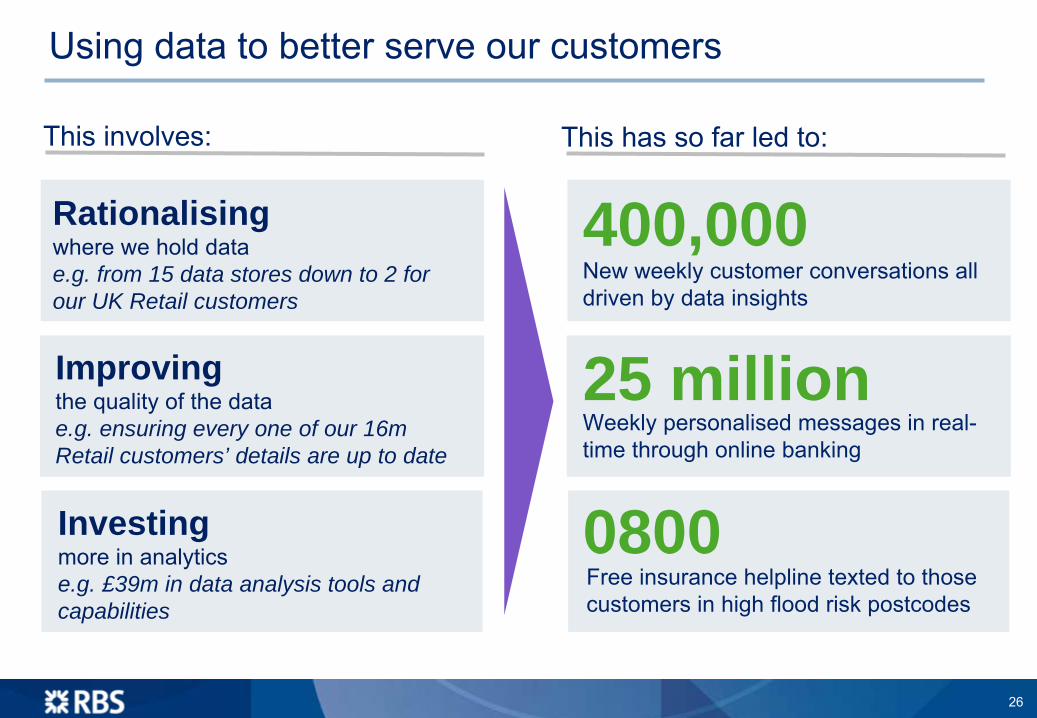
New weekly customer conversations all driven by data insights
400,000
25 million
0800
This has so far led to:
Weekly personalised messages in real- time through online banking
Free insurance helpline texted to those customers in high flood risk postcodes
This involves:
Rationalising where we hold data e.g. from 15 data stores down to 2 for our UK Retail customers
Improving the quality of the datae.g. ensuring every one of our 16m Retail customers’ details are up to date
Investing more in analytics e.g. £39m in data analysis tools and capabilities
Using data to better serve our customers
26

Three core areas of focus will ensure the safety of our systems,
reduce the number of incidents and minimise the impact of them on customers.
Batch processing will be simplified and fully recoverable in an incident
Automated, real-time dashboards, alerting us to issues
Critical IT processes will be re-engineered for safety and soundness
Implementation of enhanced Service Management process and risks controlled with advanced tools
Critical infrastructure will have proven resilience
Strengthen and remedy points of failure to improve recovery in the event of an incident
IT Resilience Critical ProcessesBatch Transformation
Safer technology infrastructure
27

Stop non-aligned in-flight/planned projectsAccelerate aligned in-flight projectsDefine and deploy enablers for new portfolioScope, plan and mobilise
2014Q1 Q2 Q3 Q4
2015 2016 2017 2018
DistributionSeamless multi-channel service for customers and staff; standard business processes
Simplification Rationalised technology base; many legacy applications decommissioned
Payments Bank-wide payments platform to support all segments, geographies and payments schemes
Data Common data platform for analysis and reporting; non-strategic data stores decommissioned
IT Resilience
Infrastructure & Workforce Enablement Our people working productively from any location
Delivering across the next five years
28

Agenda
Strategy Outline
Go-forward financial profile
Q&A
Conclusions
Ross McEwan
Nathan Bostock
Ross McEwan
Transforming the Bank –
implementation Simon McNamara
Philip Hampton

2013 Medium-term2
High level financial targets
1
Tangible equity based on CT1 ratio of 12%. 2
Medium-term defined as 2016/17. 3
Long-term defined as 2018 to 2020. 4
Includes bank levy, EU resolution fund and restructuring costs.
5
FLBIII CT1 ratio.
Long-term3
Return onTangible Equity1 ~9-11%Negative 12+%
Costs ~£8bn£13.3bn
Cost:income
ratio4 73% ~55%
~50%
CT1 ratio5 8.6% ≥12% ≥12%
Leverage ratio 3.5% 3.5-4% ≥4%
29
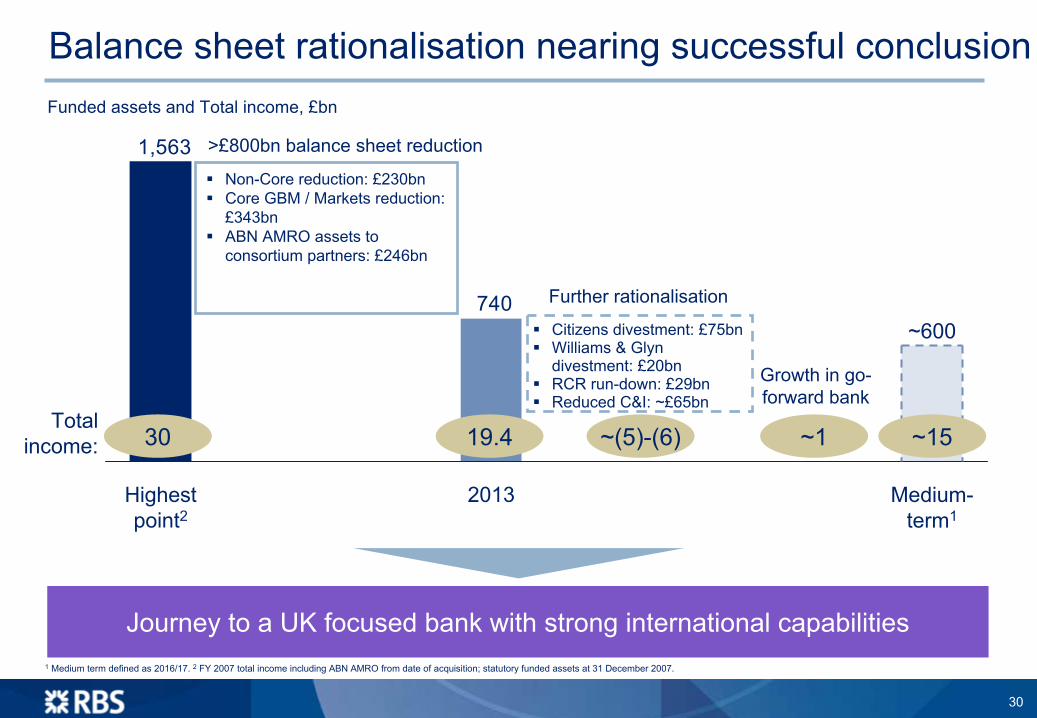
740
1,563
2013 Medium-
term1
~600
Highest point2
Funded assets and Total income, £bn
Non-Core reduction: £230bnCore GBM / Markets reduction: £343bnABN AMRO assets to consortium partners: £246bn
>£800bn balance sheet reduction
19.4Total
income: ~(5)-(6)30
Citizens divestment: £75bnWilliams & Glyn divestment: £20bnRCR run-down: £29bnReduced C&I: ~£65bn
Further rationalisation
Balance sheet rationalisation nearing successful conclusion
~15
Journey to a UK focused bank with strong international capabilities
~1
Growth in go-
forward bank
1
Medium term defined as 2016/17. 2
FY 2007 total income including ABN AMRO from date of acquisition; statutory funded assets at 31 December 2007.
30

~£2bn medium-term cost reductions
Significant reduction in Ulster
UK Corporate returning to cycle average
RCR run-down complete
2013 includes ~£2bn of Non-Core losses
Now we must focus on driving sustainable returns
~2.5%1
~3.0%
Medium-
term target3
~4.0%
Non-Core/ RCR run-down
~1.0% ~9-11%2
Lowerimpairments
Cost reduction2013 underlying RoTE
Return on Tangible Equity, %
1
Normalised Group Return on Tangible Equity –
Operating Profit ex. RCR less bank levy, EU resolution fund, amortisation of intangibles; taxed at 25% less preference dividends. 2
Tangible equity based on CT1 ratio of 12%. 3
Medium term defined as 2016/17.
31

And address the legacy cost base
~9% 73%1
Lower income due to asset reduction
2013Reduced costs
~ (6)%
2012
70%1
Cost : Income ratio, %
Costs have not fallen in line with asset reduction, leaving us inefficient and resulting in low returns
Future returns will be driven by leading customer service and efficiency
Down £1.3bn
Down £2.6bn
1
Includes bank levy and restructuring costs.
32

0.4
13.3
~8
Medium-
term targetEU resolution
fund, bank levy1
Targeted cost savings
~(2.2)
Disposals & run-off
~(3.1)
FY13
We will make our cost base fit for purposeOperating expenses, £bn
Our historic scale and complexity has led to inefficiency
We need to align our cost base to the new more focused and smaller operating model
Reductions to be delivered over a 4-year period
Long-term cost:income
ratio target: ~50%
>£5bn cost reduction
1
To be included in the cost base going forward.
33

Businesses
c.15%
c.35% c.15%
~£
(1.1)bn3
c.30% £13.3bn
~£
(0.8)bn
c.40%
IT & Ops
c.45% ~£8bn
c.20%
~£
(3.1)bn
~£
(0.3)bn
Functions
FunctionsStreamlining the back office to support customer franchises
Divestments/ run-downCitizens IPO, Williams & Glyn divestment and RCR run-down along with Markets and IB reshaping
Go-forward bank cost base focused on businesses, with significantly lower function costs1
Planned cost reductions, £bn
Sample initiatives
Delivering our strategy will further reduce costs by ~40%
We will continue to invest in the front line while simplifying how we operate1
Functions include Head Office and other overhead costs. 2
Restructuring costs. 3
Out of which ~£0.3bn is property related. 4
Of the total cost to achieve of ~£5.2bn, ~£1.3bn is property related.
FunctionsBusinessesIT & Ops Divestments/ run-down
2013 cost base
Divestments/ run-down
Medium-term cost base
~£2.8bn
~£2.4bn
Est. cost to achieve 2, 4Expected Savings
IT & OpsSubstantial investment in IT platforms and streamlining operational activities
BusinessesImprove customer proposition with focus on simplified service provision
~£5.3
bn
expe
cted s
aving
s
34

Restructuring costs explainedRestructuring costs, £bn
2014
~£2bnTotal restructuring costs ~£2bn
o/w incl. in previous guidance1
Incremental restructuring costs
~£1bn1
~£2bn~£1bn
2015 2016
~£0.2bn~£1bn
~£0.2bn~£1bn
2017 Total
~£5.2bn
~£4.2bn
Restructuring costs
~£0.6bno/w
cost of achieving asset reductions/ realisations –
Markets
~£3.6bn traditional restructuring costs o/w:
Attractive payback from restructuring
Of the ~£5.2bn restructuring costs, ~£1bn already committed in previous programmes
Restructuring costs to be fully allocated to appropriate businesses
~£2.4bn to reduce current cost base by ~£2bn~£1.2bn to reshape Markets and IB to support our franchise over the next 3 to 5 years
1
Relates to Citizens, Williams & Glyn, and balance of previous Markets restructuring.
35

Optimising our capital usage
300250200150100500
~10%15+%15+%
FLB3 RWAs
(£bn)
FLB3 RoE
Commercial and Private Banking
Corporate and Institutional Banking
Steady state1
RBS –
RoE
expectations and capital usage per division
Key elements of capital usage optimisation
~300
Future RBS shape
Loan growth
~30
Disposals
~(65)
RCR run-
down
~(45)
Markets and IB reduction
~(50)
2013
429FLB3 RWAs, £bn
1
2018 to 2020.
Within C&I steady state1
: (1) Markets RWAs
c.£45bn, Markets income ≤£2bn; (2) International Banking (IB) RWAs
c.£40bn, IB income c.£1.5bn
Personal and Business Banking
Steady state RoTE
target: 12+%
36

Building capital strengthFLB3 CT1 ratio, %
We continue to target an FLB3 CT1 ratio of 12% or beyond by the end of 2016
Citizens IPO and RCR run-down – key drivers; good progress being made
Citizens – plan to exit the business fully by the end of 2016
Williams & Glyn – expect to sell a majority stake by the end of 2016
≥12%
2016 target2013
8.6%
Citizens divestment
RCR capital release
Earnings
Williams & Glyn divestment
De-risking and divestments
Business and loan growth
Buffer for potential future dividends
Volatile items e.g. conduct and litigation costs
Key drivers Potential uses of capital
429 ~300RWAs
down ~30%
37

Our future profile will be lower risk
FLB3 RWAs, £bn NPLs
as % of Gross L&A Impairments as % L&A
429495
-13%
Steady state1
~300
20132012 End-2016
2.5-3.5%
2013
9.4%
0.4-0.6%
0.9%2
2013 2014 to 2016
Impairments consistently improving
NPLs
normalising with RCR run-down
Basel III RWAs
significantly reduced
RCR run-down is already starting to enhance our risk profile
Expect medium-term to improve stressed impairments by 40-50%
Targeting ‘undoubted’ capital strength e.g. CT1 ratio ≥12%, leverage ratio ≥4%1
2018 to 2020. 2
Excluding RCR impact.
38

From Q2 2014 we will move our reporting to the 3 businesses structure, RCR reported separatelyNo Below-the-Line items – except Own Credit Adjustments, Goodwill and DisposalsAll costs will be allocated to businesses providing a complete picture of performanceExpect restatements in Q2 2014. Q1 2014 divisional reporting to be on ‘old’ basis but with RCR reported separatelyInvestor Roundtables on New Businesses in 2014. Pencil in late Q2 for Personal & Business Banking and H2 for Commercial & Private as well as Corporate & Institutional Banking
New reporting structure
Group Centre, Treasury, IT & Ops –
fully allocated
Personal & Business Banking
Commercial& Private Banking
Corporate & Institutional
Banking
Capital Resolution
Group:-
RCR-
Citizens- W&G
Remaining Below-the-Line: Own Credit Adjustments, Goodwill and Disposals
Profit Before Tax
Operating Profit
39
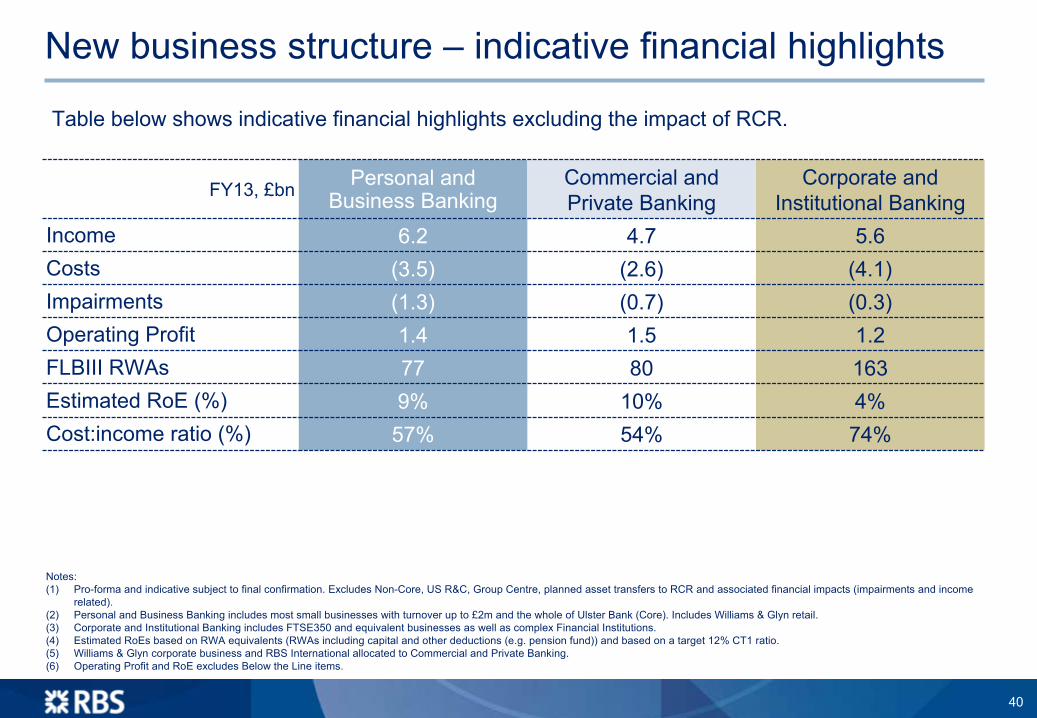
New business structure –
indicative financial highlights
Notes:(1)
Pro-forma and indicative subject to final confirmation. Excludes Non-Core, US R&C, Group Centre, planned asset transfers to RCR and associated financial impacts (impairments and income related).
(2)
Personal and Business Banking includes most small businesses with turnover up to £2m and the whole of Ulster Bank (Core). Includes Williams & Glyn
retail.(3)
Corporate and Institutional Banking includes FTSE350 and equivalent businesses as well as complex Financial Institutions.(4)
Estimated RoEs
based on RWA equivalents (RWAs
including capital and other deductions (e.g. pension fund)) and
based on a target 12% CT1 ratio.(5)
Williams & Glyn corporate business and RBS International allocated to Commercial and Private Banking.(6)
Operating Profit and RoE
excludes Below the Line items.
Table below shows indicative financial highlights excluding the impact of RCR.
FY13, £bn Personal and Business Banking
Commercial and Private Banking
Corporate and Institutional Banking
Income 6.2 4.7 5.6Costs (3.5) (2.6) (4.1)Impairments (1.3) (0.7) (0.3)Operating Profit 1.4 1.5 1.2FLBIII RWAs 77 80 163Estimated RoE
(%) 9% 10% 4%Cost:income
ratio (%) 57% 54% 74%
40

Future RBS profile designed to address ICB
Detailed plan to be finalised as regulatory rules become clear
Broadring-fence
Future regulation
Future RBS shape+
Details of ICB are still evolving and are subject to change
Our new structure is designed to be flexible and is broadly compliant with the current direction of travel
We expect majority of assets to be eligible for a broad ring-fence
Expect single point of entry approach for resolution planning
41

Outlook
Income2014 NIM stable to slightly upExpect some underlying ‘core’ loan growth
Costs2014 target c.£1bn reduction1
Medium-term reduction of absolute costs to ~£8bn
Restructuring costsRestructuring costs of ~£2bn in 2014, of which ~£1bn included in previous guidanceTotal incremental restructuring cost of ~£4.2bn
Cost:income
ratio2 Medium-term target: ~55%Long-term target: ~50%
Impairments Expect c.40-60bps as % of L&A 2014-16
Return on Tangible Equity3 Medium-term target: 9-11%Long-term target: 12+%
Note: Medium term defined as 2016/17. Long-term defined as 2018 to 2020.1
Based on 2013 operating expenses of £13.3bn. 2
Includes bank levy, EU resolution fund and restructuring costs.
3
Tangible equity based on CT1 ratio of 12%.
42

Agenda
Strategy Outline
Go-forward financial profile
Q&A
Conclusions
Ross McEwan
Nathan Bostock
Ross McEwan
Transforming the Bank –
implementation Simon McNamara
Philip Hampton

Our Investment Case
Market leading businesses in large, attractive markets
Attractive returns delivered medium-term
Lower risk, sustainable retail & commercial based earnings
Robust capital position, model capable of paying dividends
Continued transparency; track and report progress
43

Q&A
Certain sections in this document contain ‘forward-looking statements’
as that term is defined in the United States Private Securities
Litigation Reform Act of 1995, such as statements that include the words ‘expect’, ‘estimate’, ‘project’, ‘anticipate’, ‘believes’, ‘should’, ‘intend’, ‘plan’, ‘could’, ‘probability’, ‘risk’, ‘Value-at-Risk (VaR)’, ‘target’, ‘goal’, ‘objective’, ‘will’, ‘endeavour’, ‘outlook’, ‘optimistic’, ‘prospects’
and similar expressions or variations on such expressions.
In particular, this document includes forward-looking statements relating, but not limited to: the Group’s restructuring and new strategic plans, divestments, capitalisation, portfolios, net interest margin, capital ratios, liquidity, risk-weighted assets (RWAs), return on equity (ROE), profitability, cost:income
ratios, leverage and loan:deposit
ratios, funding and risk profile; discretionary coupon and dividend payments; implementation of legislation of ring-fencing and bail-in measures; sustainability targets; litigation, regulatory and governmental investigations; the Group’s future financial performance; the level and extent of future impairments and write-downs; and the Group’s exposure to political risks, including the referendum on Scottish independence, credit rating risk and to various types of market risks, such as interest rate risk, foreign exchange rate risk and commodity and equity price risk. These statements are based on current plans, estimates and projections, and are subject to inherent risks, uncertainties and other factors which could cause actual results to differ materially from the future results expressed or implied by such forward-looking statements. For example, certain market risk disclosures are dependent on choices about key model characteristics and assumptions and are subject to various limitations. By their nature, certain of the market risk disclosures are only estimates and, as a result, actual future gains and losses could differ materially from those that have been estimated.
Other factors that could cause actual results to differ materially from those estimated by the forward-looking statements contained in this document include, but are not limited to: global economic and financial market conditions and other geopolitical risks, and their impact on the financial industry in general and on the Group in particular; the ability to implement strategic plans on a timely basis, or at all, including the simplification of the Group’s structure, the divestment of Citizens Financial Group and the exiting of assets in RBS Capital Resolution as well as the disposal of certain other assets and businesses as announced or required as part of the State Aid restructuring plan; the achievement of capital and costs reduction targets; ineffective management of capital or changes to capital adequacy or liquidity requirements;
organisational restructuring in response to legislation and regulation in the United Kingdom (UK), the European Union (EU) and the United States (US); the implementation of
key legislation and regulation including the UK Financial Services (Banking Reform Act) 2013 and the proposed
EU Recovery and Resolution Directive; the ability to access sufficient sources of capital, liquidity and funding when required; deteriorations in borrower and counterparty credit quality; litigation, government and regulatory investigations including investigations relating to the setting of LIBOR and other interest rates and foreign exchange trading and rate setting activities; costs or exposures borne by the Group arising out of the origination or sale of mortgages or mortgage-backed securities in the US; the extent of future write-downs and impairment charges caused by depressed asset valuations; the value and effectiveness of any credit protection purchased by the Group; unanticipated turbulence in interest rates, yield curves, foreign
currency exchange rates, credit spreads, bond prices, commodity prices, equity prices and basis, volatility and correlation risks; changes in the credit ratings of the Group;
changes to the valuation of financial instruments recorded at fair value; competition and consolidation in the banking sector; the ability of the Group to attract or retain senior management or other key employees; regulatory or legal changes (including those requiring any restructuring of the Group’s operations) in the UK, the US and other countries in which the
Group operates or a change in UK Government policy; changes to regulatory requirements relating to capital and liquidity; changes to the monetary and interest rate policies of central banks and other governmental and regulatory bodies; changes in UK and foreign laws, regulations, accounting standards and taxes, including changes in regulatory capital regulations and liquidity requirements; impairments of goodwill; pension fund shortfalls; general operational risks; HM Treasury exercising influence over the operations of the Group; reputational risk; the conversion of the B Shares in accordance with their terms; limitations on, or additional requirements imposed on, the Group’s activities as a result of HM Treasury’s investment in the Group; and the success of the Group in managing the risks involved in the foregoing.
The forward-looking statements contained in this document speak only as of the date of this announcement, and the Group does not undertake to update any forward-looking statement to reflect events or circumstances after the date hereof or to reflect the occurrence of unanticipated events.
The information, statements and opinions contained in this document do not constitute a public offer under any applicable legislation or an offer to sell or solicitation of any offer to buy any securities or financial instruments or any advice or recommendation with respect to such securities or other financial instruments.
Forward Looking Statements