strategy for assessment of wwer steam generator tube integrity · pdf fileiaea-tecdoc-1577...
TRANSCRIPT

IAEA-TECDOC-1577
Strategy for Assessment of WWERSteam Generator Tube Integrity
Report prepared within the framework of theCoordinated Research Project on
Verification of WWER Steam Generator Tube Integrity
December 2007

IAEA-TECDOC-1577
Strategy for Assessment of WWERSteam Generator Tube Integrity
Report prepared within the framework of theCoordinated Research Project on
Verification of WWER Steam Generator Tube Integrity
December 2007

The originating Section of this publication in the IAEA was:
Nuclear Power Engineering Section International Atomic Energy Agency
Wagramer Strasse 5 P.O. Box 100
A-1400 Vienna, Austria
STRATEGY FOR ASSESSMENT OF WWER STEAM GENERATOR TUBE INTEGRITY IAEA, VIENNA, 2007 IAEA-TECDOC-1577
ISBN 978–92–0–110307–9 ISSN 1011–4289
© IAEA, 2007
Printed by the IAEA in Austria December 2007

FOREWORD
Steam generator heat exchanger tube degradations happen in WWER Nuclear Power Plant (NPP). The situation varies from country to country and from NPP to NPP. More severe degradation is observed in WWER-1000 NPPs than in case of WWER-440s. The reasons for these differences could be, among others, differences in heat exchanger tube material (chemical composition, microstructure, residual stresses), in thermal and mechanical loadings, as well as differences in water chemistry. However, WWER steam generators had not been designed for eddy current testing which is the usual testing method in steam generators of western PWRs. Moreover, their supplier provided neither adequate methodology and criteria nor equipment for planning and implementing In-Service Inspection (ISI). Consequently, WWER steam generator ISI infrastructure was established with delay. Even today, there are still big differences in the eddy current inspection strategy and practice as well as in the approach to steam generator heat exchanger tube structural integrity assessment (plugging criteria for defective tubes vary from 40 to 90 % wall thickness degradation). Recognizing this situation, the WWER operating countries expressed their need for a joint effort to develop methodology to establish reasonable commonly accepted integrity assessment criteria for the heat exchanger tubes. The IAEA’s programme related to steam generator life management is embedded into the systematic activity of its Technical Working Group on Life Management of Nuclear Power Plants (TWG-LMNPP). Under the advice of the TWG-LMNPP, an IAEA coordinated research project (CRP) on Verification of WWER Steam Generator Tube Integrity was launched in 2001. It was completed in 2005. Thirteen organizations involved in in-service inspection of steam generators in WWER operating countries participated: Croatia, Czech Republic, Finland, France, Hungary, Russian Federation, Slovakia, Spain, Ukraine, and the USA. The overall objective was to improve structural integrity assessment of steam generators of WWER-440/1000 NPPs. This TECDOC describes the main achievements of the CRP, that is, a proven approach to steam generator integrity assessment which consists in three critical elements: degradation assessment, condition monitoring, and operational assessment. This approach can provide assurance that the steam generators will continue to satisfy the appropriate performance criteria. Appreciation is expressed to all the organizations participating in the CRP for their valuable contributions and particular thanks are due to B. Nadinic, Organisation for Technology Development and Application, Ltd (Croatia) who was the main scientific investigator of the CRP. The IAEA officer responsible for this publication was H. Cheng of the Division of Nuclear Power.

EDITORIAL NOTE
The use of particular designations of countries or territories does not imply any judgement by the publisher, the IAEA, as to the legal status of such countries or territories, of their authorities and institutions or of the delimitation of their boundaries.
The mention of names of specific companies or products (whether or not indicated as registered) does not imply any intention to infringe proprietary rights, nor should it be construed as an endorsement or recommendation on the part of the IAEA.

CONTENTS
1. INTRODUCTION ............................................................................................................ 1
1.1. Background......................................................................................................... 1 1.2. CRP objectives ................................................................................................... 1 1.3. Organizations participating in the CRP .............................................................. 2
2. INTEGRITY ASSESSMENT OF WWER STEAM GENERATOR TUBES ................. 2
2.1. Historical overview............................................................................................. 2 2.2. Integrity assessment............................................................................................ 4
3. DEGRADATION ASSESSMENT................................................................................. 10
3.1. Purpose of degradation assessment .................................................................. 10 3.2. WWER steam generator degradation experience ............................................. 10
3.2.1. Tube damages related to manufacturing process .................................. 10 3.2.2. General (also called uniform) corrosion ............................................... 12 3.2.3. Pitting.................................................................................................... 14 3.2.4. Stress corrosion cracking (SCC)........................................................... 15 3.2.5. Combination of pitting and stress corrosion cracking .......................... 17
3.3. Identification of degradation mechanisms........................................................ 18 3.4. Eddy current probes used for degradation assessment ..................................... 32 3.5. Establishing relationship of burst pressure and accident leakage rate to
structural variable ............................................................................................. 48
4. PERFORMANCE CRITERIA ....................................................................................... 54
4.1. Structural performance criteria ......................................................................... 54 4.1.1. Deterministic structural performance criteria ....................................... 55 4.1.2. Probabilistic structural performance criteria......................................... 55
4.2. Operational leakage performance criteria......................................................... 55 4.3. Accident leakage criteria .................................................................................. 56
5. CONDITION MONITORING ....................................................................................... 57
5.1. Condition monitoring of structural integrity .................................................... 57 5.2. Condition monitoring of operational leakage................................................... 58 5.3. Condition monitoring of accident leakage........................................................ 59
6. OPERATIONAL ASSESSMENT.................................................................................. 60
6.1. Operational assessment of structural integrity.................................................. 60 6.2. Operational assessment of operational leakage ................................................ 62 6.3. Operational assessment of accident leakage..................................................... 62
7. LOADINGS WHICH HAVE TO BE CONSIDERED FOR CONDITION MONITORING AND OPERATIONAL ASSESSMENT ............................................. 62
8. TUBE PLUGGING CRITERIA ..................................................................................... 63
8.1. Deterministic calculation of tube plugging criteria .......................................... 63 8.2. Probabilistic justification of maintaining structural integrity of WWER
steam generator tubes ....................................................................................... 67

9. CONCLUSIONS ............................................................................................................ 70
APPENDIX EXAMPLE OF CONDITION MONITORING LIMIT DETERMINATION IN USA......................................................................... 73
REFERENCES......................................................................................................................... 81
GLOSSARY............................................................................................................................. 83
ABBREVIATIONS.................................................................................................................. 91
CONTRIBUTORS TO DRAFTING AND REVIEW ............................................................. 93

1. INTRODUCTION 1.1. Background WWER steam generator tubes have a number of important safety functions. These tubes are an integral part of the reactor coolant pressure boundary and, as such, are relied upon to maintain the primary system's pressure and inventory. As part of the reactor coolant pressure boundary, the steam generator tubes are unique in that they are also relied upon as a heat transfer surface between the primary and secondary systems such that residual heat can be removed from the primary system; the steam generator tubes are also relied upon to isolate the radioactive fission products in the primary coolant from the secondary system. In this technical document WWER tube integrity means that the tubes are capable of performing their intended safety functions consistent with the licensing basis, including applicable regulatory requirements. Concerns relating to the integrity of the tubing stem from the fact that the steam generator tubing is subject to a variety of corrosion and mechanically induced degradation mechanisms that happen throughout WWER units in all countries. These degradation mechanisms can impair tube integrity if they are not managed effectively. Present situation with management of WWER steam generator tube integrity in different countries as well as in different NPPs in the same country vary significantly. These variations are function of many parameters including the following:
The level of development of national regulations;
Availability of financial resources (for example to perform frequently needed nondestructive testing of steam generator tubes by the utility’s own personnel and own equipment or by buying complete services, etc.);
Availability of educated and adequately trained and experienced personnel for establishing optimal steam generator management program and implementing it;
Variations in information exchange opportunities. 1.2. CRP Objectives The overall objective of the CRP is to improve structural integrity assessment of steam generators of WWER-440/1000 nuclear power plants. The specific research objectives of the CRP are:
• to compare non-destructive (eddy current) testing results with destructive (mechanical, microstructural and microanalytical) testing results on the same steam generator tube samples with special attention to operational history data.
• to carry out strength and fracture mechanics calculations applying real data of non-destructive and destructive tests.
• to elaborate methodology for establishing reasonable plugging criteria. As many different approaches as well as practical measures exist among different Member States with WWER technology, their harmonization under IAEA guidance is helpful.
1

Some of the benefits derived from a harmonized approach are the following:
to assure a uniform and up to date approach to verification of WWER steam generator tube integrity and to educate steam generator management staff,
to raise the safety of operation by application of up to date approach to verification of WWER steam generator tube integrity,
to reduce number of emergency shutdowns.
1.3. Organizations participating in the CRP Thirteen organizations involved in In-Service Inspection of steam generators in WWER operating countries participated: Croatia, Czech Republic, Finland, France, Hungary, Russian Federation, Slovak Republic, Spain, Ukraine, and the USA. They are as follows:
1) Institute for Nuclear Technology, Steam Generator Department, Zagreb, Croatia
2) Nuclear Research Institute, Division of Integrity and Technical Engineering, Rez, Czech Republic
3) VTT Manufacturing Technology, Helsinki, Finland
4) Intercontrol, Eddy Current Inspection Department, Rungis, France
5) Paks Nuclear Power Plant, Paks, Hungary
6) University Of Veszprem, Department of Radiochemistry, Hungary
7) Ministry of the Russian Federation for Atomic Energy, Concern “ROSENERGOATOM”, Moscow, Russia
8) Gidropress OKB, Department 800, Podolsk, Russia
9) VNIIAES, Division of Materials Research, Moscow, Russia
10) VUJE VA a.s., Trnava, Slovakia
11) Tecnatom S.A., Steam Generator Integrity Division, Madrid, Spain
12) Non-Destructive Examination Training and Certification Facility, Kiev, Ukraine
13) Electric Power Research Institute, Nuclear Power Division, Palo Alto, California, the USA.
2. INTEGRITY ASSESSMENT OF WWER STEAM GENERATOR TUBES
2.1. Historical Overview Integrity assessment of steam generator tubes of WWER nuclear power plant was based, at the beginning, on the following leakage tests:
• Water under very high pressure on secondary side (Hydro test). Monitoring appearance of water on primary side; detection of leaking tubes.
• Water with tracer elements (for example fluorescent) on secondary side under pressure. Monitoring appearance of water with tracer on primary side using in some cases halogen lamps or other tools depending on the type of tracer.
2

• Bubble test. Water in collector, air under pressure on secondary side, bubbles show position of leaking tubes.
• Helium test. Helium pumped on secondary side and sniffing device(s) on primary side. After determination of leaking tubes such tubes on WWER steam generators were plugged with various types of plugs (welded and mechanical). Previous methods are still very popular and on some WWER nuclear power plants they are still the only methods used for integrity assessment of steam generator tubes. With development of eddy current examination techniques at the beginning of seventies, for use on PWR steam generators and at the end of seventies on WWER steam generators, integrity assessment was performed using eddy current testing method based on bobbin probes. Use of eddy current examination techniques allowed detection of tubes with degradation(s) of various sizes what is much better than results of leakage test(s) which can detect only tube(s) with through wall hole(s). In other words with eddy current method the degradations which can potentially leak before next examination can be detected and sized. At that moment the question of “repair (plugging) criteria” arises, because nuclear power plants have to answer on the following question: What is the size of the degradation which will not burst or leak over certain limit till the next examination? Because the eddy current method with bobbin coil is giving the depth of degradation as the main result of examination on some particular axial location in the tube, the first repair (plugging criteria) were related only on the depth of degradation. The first plugging criteria were calculated for PWR steam generators with:
• Inconel 600 tubes,
• tube diameters 3/4” and 7/8”,
• ASME safety factors,
• wastage degradation process,
• one fuel cycle to next examination. And 40% of tube wall thickness was established as the criteria. It is interesting that this number became so popular and it has been, and it is still using now worldwide, forgetting basic conditions which were used for its calculation. With time the eddy current techniques were developed and many advanced probes were used (starting at the end of eighties on PWR and at the end of nineties on WWER) for examination of steam generator tubes as rotating probes (cross wounded, pancake, plus point) as well as different array probes (8x1, 16x1, 32x1, X probe). These probes allowed the use of other parameters besides depth and voltage (results of bobbin probe use) like length and orientation.
3

More information about degradation allowed more accurate integrity assessment of steam generator tubes and the complete approach to this issue will be discussed in this report. 2.2. Integrity Assessment The essential elements of WWER steam generator integrity assessment are presented in Figure 1. Three critical elements, degradation assessment, condition monitoring, and operational assessment, provide assurance that the steam generators will continue to satisfy the appropriate performance criteria. In other words integrity assessment of WWER steam generator tubes involves a determination of their potential degradation during operation, leading to a series of decisions as to run, repair, or remove any given tube from service. So, each tube must satisfy a certain performance criteria during the operation, and if it does not, remedial action must be taken. Satisfaction of these criteria ensures tube integrity; namely, that the WWER steam generator tubes are capable of performing their safety functions consistent with the licensing basis.
4

Fig. 1. Integrity assessment process for WWER steam generator tubes.
Integrity assessment
complete n = n+1
Degradation assessment
Complete Operating Interval n, (OIn) and obtain inspection results
Evaluate structural and leakage integrity of steam generator tubes and internals
Determine cause and update input variables
to operational assessment for OIn+1
Assess and implement repair and/or reduce OIn+1
Predict degradation at end of OIn+1 and evaluate
structural and leakage integrity
Condition monitoring
performance criteria met?
Previous Operating Assessment
verified?
Operating Assessment performance
NOYES
NO
YES
YES
NO
5

Requirements and guidance for steam generator integrity assessments dictate the particular examinations that must be conducted and the NDT data that needs to be generated. The process which determines these parameters is called degradation assessment. In other words degradation assessment is a pre-planning step before the outage through which the condition of the steam generator must be determined in terms of existing degradation as well as potential for development of new degradation types. Degradation assessment leads to the selection of the necessary examination techniques as well as determination of sampling strategies for the planned examination campaign. Integrity assessment has to take place at each refueling outage and its aim is to ensure that the steam generator performance criteria are met. The two elements of integrity assessment which should be considered are condition monitoring and operational assessment. Condition monitoring is backward looking, in that its purpose is to confirm that adequate steam generator tube integrity has been maintained during the previous examination interval. Condition monitoring involves an evaluation of the as-found condition of the tubing relative to integrity performance criteria. The tubes should be inspected in accordance with the prevailing requirements/regulations. Structural and leakage integrity assessments are performed and results compared to their respective performance criteria. If satisfactory results are not achieved, causal analysis is performed and appropriate corrective action taken. The results of this analysis are factored into future degradation assessments, inspection plans, and operational assessments of the plant. Operational assessment differs from the condition monitoring assessment in that it is forward looking rather than backward looking. Its purpose is to demonstrate that the tube integrity performance criteria will be met throughout the next inspection interval. Integrity assessment of the steam generator secondary side is necessary to verify that tube safety functions are not jeopardized by foreign material or internals degradation. Figure 1 shows how steam generator integrity can be monitored and maintained. Examination results are to be evaluated with respect to the appropriate performance criteria. Condition monitoring results are to be evaluated with respect to the previous operational assessment. If this evaluation is successful, an assessment is made to show that integrity will be maintained throughout the next inspection interval between inspections. If performance criteria are not met during an outage, then the utility shall perform a causal analysis, report to the regulatory authority according to plant reporting requirements, and factor the results into the operational assessment strategy. The results of operational assessment determine the allowable run time for the upcoming examination interval. Integrity assessment must be performed using previously mentioned performance criteria that steam generator tubes must satisfy during their operation which are based on structural tube integrity, postulated accident leakage, and operational leakage. In general terms:
Steam generator shall retain structural integrity over the full range of normal operating conditions and design basis accidents. This includes retaining a margin against burst under normal operation and a margin against burst under design basis accident in accordance with regulations that govern a particular site (national, international, etc).
The accident-induced primary to secondary leakage rate is not to exceed allowed accident leakage in accordance with referenced regulation.
6

The operation primary to secondary leakage rate is not to exceed allowed operational leakage in accordance with referenced regulation.
The integrity assessment process involves a comparison of the structural capacity of the tube with a structural integrity performance criterion. Figure 2 shows how the structural capacity of the tube is represented by a burst pressure relationship that describes the burst pressure as a function of the structural variable. The structural variable is a flaw or some other NDE-measured tube parameter whose presence and severity affect the pressure under which the tube will burst. It has to be pointed out that it is extremely important that structural variable has to be of such type that it will be possible to establish a clear relationship between it and tube burst pressure.
Fig. 2. Relationship of burst pressure to structural variable.
Today the most common structural variables which can be monitored using eddy current examination method are the following:
• Depth of degradation (tube wall loss expressed in percentage of tube wall thickness. • Volume of degradation (proportional to the voltage of eddy current signal). • Length of degradation in axial or circumferential direction.
The burst pressure relationship to structural variable can either be a derived equation, where possible, or an experimentally determined correlation. The performance criteria, as represented by a burst pressure leads to a limiting value for the structural variable. This means that to satisfy the performance criteria, the tube shall not contain a flaw that exceeds the structural limit. Flaws which are smaller than the structural limit can, in principle, exist in the
7

tube without violating the performance criteria. The role of eddy current is to determine the structural variable so that it can be compared against the requirement for burst pressure. The relationship described by Figure 2 involves various uncertainties that must be accounted for. If the burst pressure relationship is derived from an equation, there would be no uncertainty in the equation itself. However, if the relationship is derived from experimental data, then the scatter of the data about the correlation curve determines a relational uncertainty. There are also uncertainties associated with material properties that need to be taken into account, where they exist. Eddy current measurement uncertainties will further act to lower the condition monitoring limit that can be used to arrive at the structural limit. Once these uncertainties are accounted for, at appropriate confidence levels, the condition monitoring limit is obtained. This limit represents the value of the structural variable below which the tube meets the condition monitoring structural criterion. To look forward in time and do operational assessment, growth of the structural variable, in addition to uncertainties must be considered. Figure 3 is a representation of the integrity assessment process and the role of eddy current in it. Looking at the time line, the first step before the end of an operation cycle is degradation assessment which is performed in preparation for condition monitoring. Presence of known flaws and potential for new degradations are among the many factors that are considered in selection of sampling strategies and appropriate eddy current techniques. Condition monitoring at the end of a just-completed operation cycle looks for growth of existing flaws and the onset of new ones to verify that the performance criteria has not been violated during the last cycle. The findings of condition monitoring also serve to verify the validity of the degradation assessment (see also Figure1). Operational assessment uses eddy current data from condition monitoring as input to establish the beginning of cycle (BOC) conditions and then adds the growth rate and other relevant considerations to determine the end of cycle (EOC) conditions. Prediction of EOC conditions then leads to decisions regarding cycle length and the specific run/repair/remove options for each tube. If condition monitoring at EOC shows that performance criteria have been violated, then it means that the previous operational assessment at BOC has been incorrect and its assumptions must be re-evaluated and changed as appropriate.
8

Time
Refueling Outage
BOC EOC BOC EOC
Fig. 3. Elements of integrity assessment process.
In the next chapters all steps in integrity assessment process of WWER steam generator tubes will be described and clarified in more details.
Previous Operation Cycle
Next Operating Cycle
Condition Monitoring
Was the performance criteria met during last
cycle?
• Determine EOC conditions
• Verify degradation assessment.
• Determine Flaw distributions
Operational Assessment Will the performance criteria be met during
next cycle?
• Predict EOC conditions based on BOC conditions and taking into account POD distributions
• Make decisions about inspection cycle length, and determine run/remove policy
9

3. DEGRADATION ASSESSMENT 3.1. Purpose of Degradation Assessment Prior to planned steam generator examinations, an assessment of existing degradation mechanisms has to be performed. The assessment shall address the reactor coolant pressure boundary within the steam generator, e.g., plugs and tubes. The assessment shall consider operating experience from other similar steam generators. The assessment shall also consider engineering analysis of the degradation mechanisms. The purpose of the degradation assessment is to identify degradation mechanisms and for each mechanism:
• choose NDT method and technique or techniques to test for degradation based on the probability of detection and sizing capability;
• establish the number of tubes to be inspected; • establish the exact location of tubes (section, row, column) to be inspected • establish of the part(s) of the tube for examination with advanced techniques • establish the structural limits; and • establish the flaw growth rate or a plan to establish the flaw growth rate.
The identification of these parameters allows nuclear power plants to establish the examination and plugging criteria before an outage. If a plant identifies a new degradation, or if the measured parameters change, such as growth rate, the plant may need to adjust examination variables to satisfy performance criteria. The assessment of potential degradation mechanisms affects both the inspection and structural assessment of the program. The inspection component dictates the technique’s capability, including detection probability, sizing capability, and measurement uncertainty. The structural assessment applies the information gathered from the examination with flaw growth rate projections to establish the plugging criteria and/or inspection cycle length. To conduct an effective inspection, the plant management should integrate the structural and inspection components. 3.2. WWER Steam Generator Degradation Experience Up to now the following degradation types have been found on WWER steam generator tubes: 3.2.1. Tube damages related to manufacturing process In some cases tube damages were found, which clearly resulted from mistakes in manufacturing process. The most famous examples are given on Figure 4 and 5 which were found in pulled tubes from Loviisa NPP.
10

Fig. 4. Tube damages regarding manufacturing process — Example 1.
The maximum depth of the flaws was about 6 % of the tube wall thickness. The conclusion of the metallurgical study was that these flaws were induced during the tube manufacture and during tube pickling. Two major and two minor indications were detected in the eddy current inspection.
11

Fig. 5. Tube damages regarding manufacturing process — Example 2.
3.2.2. General (also called uniform) corrosion The characteristic of general corrosion is that it is spread over the surface uniformly on the outer diameter of the tube. At the beginning it is shallow and does not represent serious threat to tube integrity, but with time it can reduce the thickness of tubes to significant extent. For
In the destructive examination a narrow inner surface flaw was detected (at the top). The length of the flaw was more than 151 mm. The flaw depth was 1.1 mm at the location of the indication classified as the deepest one (the cross section on the right). At the cross section the flaw was partially filled with oxide. At the cross section on the left the flaw depth was 0.9 mm and the flaw was filled with oxide. The conclusion of the metallurgical study was that this flaw was induced during the tube manufacturing. The origin of a narrow crack like branch at the bottom of the flaw could not be clarified.
12

more details about this type of corrosion see Figure 6a (surface appearance) and for the shape of wall thinning see Figure 6b.
Fig. 6(a). General corrosion on outer diameter — Surface appearance.
Fig. 6(b). General corrosion on outer diameter — Shape of wall thinning.
13

3.2.3. Pitting The pitting is the most common type of corrosion on WWER steam generator tubes. It appears on the outer diameter of the tube and both on the free span and under tube supports of steam generator tubes. Pitting can be found in the form of isolated pits but also it can be found in pit groups. On Figure 7(a) is given the surface appearance of one pit and on the Figure 7(b) is given the cross section of tube wall on the place of pit.
Fig. 7(a). Pitting-surface appearance.
Fig. 7(b). Pitting-cross section of tube wall.
14

3.2.4. Stress corrosion cracking (SCC) Stress corrosion cracking is generally considered to be the most complex of all corrosion types. Cracking can have a transgranular or intergranular morphology. Multiple variables affect stress corrosion cracking phenomena, such as stress level, alloy composition, microstructure, concentration of corrosive species, surface finish, micro-environmental surface effects, temperature, electrochemical potential, etc. see Figure 8. Further complications are initiation and propagation phases, and the observation that in some cases cracks initiate at the base of corrosion pits.
Fig. 8. Stress corrosion causes. One of the most important forms of stress corrosion that concerns the WWER steam generators is stress corrosion induced by chlorides. Chloride stress corrosion is a type of intergranular corrosion and occurs in austenitic stainless steel under tensile stress in the presence of oxygen, chloride ions, and high temperature. It is thought to start with chromium carbide deposits along grain boundaries that leave the metal open to corrosion. This form of corrosion is controlled by maintaining low chloride ion and oxygen content in the environment and use of low carbon steels. SCC cracks on WWER steam generator tubes are located under tube support plates, but also on the free span on the outer tube diameter (secondary side). Usually, most of the surface remains unattacked, but with fine cracks penetrating into the material. In the microstructure, these cracks can have an intergranular or a transgranular morphology. Macroscopically, SCC fractures have a brittle appearance as it is shown in Figure 9 and Figure 10.
15

Fig. 9. Stress corrosion cracking on Paks NPP tubes.
Fig. 10. Stress corrosion cracking on South Ukraine NPP tube.
16

3.2.5. Combination of pitting and stress corrosion cracking Very often various types of corrosion are mixing together on WWER. In most cases degradation starts with pitting and after some time the part of tube with pit experience additionally SCC, so at the end both types of corrosion appear on the same place. For details see Figure 11 and Figure 12.
Fig. 11. Stress corrosion associated with pitting (South Ukraine).
Fig. 12. Stress corrosion associated with pitting.
17

3.3. Identification of Degradation Mechanisms Identification of degradation mechanisms can be based on the following:
1. NDT data collected during emergency or regular outages. This data can be collected by different non-destructive methods such as eddy current and ultrasonic. For now, the most convenient examination techniques are those based on eddy current while other methods are mostly for information and are not widely accepted. Eddy current data gives information about location, volume, depth, length and width of the degradation suggesting what type of degradation is present (see for details chapter 3.4). Unfortunately, eddy current data can only suggest if degradation(s) is/are present but we can not completely rely on that. It is a good idea is to compare the eddy current data with similar data collected on other WWER nuclear power plants. The problem is that different WWER nuclear power plants have slightly different chemistry regimes, as well as different condenser cooling media (sea water, lake water, river water) which influence differently the chemistry of the secondary side.
2. Cutting tubes with indications from steam generator(s) is absolutely the best way of finding the kind of degradation(s) is/are present in the steam generators. Tubes with indications, once removed from service, give an opportunity to find out the following:
• The real flaw sizes which can be used for verification of NDT method used. If the differences between real flaw sizes and NDT flaw sizes are unacceptable, then the necessary changes in NDT technique, procedures or personnel has to be performed.
• Through the analysis of flaw pattern, content of deposits inside and around the flaw the causes of degradation mechanisms can be discovered and explained (for example presence of Cu ions can be recognized as the main driving force for degradation) so that adequate corrective actions can be taken to improve situation.
On Figure 13 the pictures of cut tube parts are given (Paks NPP). The second of these three tubes has eddy current indications of 90%.
Of course the problem of WWER steam generators is that usually the population of tubes which can be cut is small and restricted to the tubes from the first row and tube bundle periphery. In some cases (for example South Ukraine) tubes from old steam generators which are out of service can be used. But this has to be carefully justified taking into account service conditions of old steam generators in comparison with conditions of presently operating steam generators.
18

Fig. 13. Cut samples from first raw — Tubes from Paks NPP (WWER 440).
19
The methods and techniques used for examination of cut tube samples with the aim of finding their characteristics and causes of degradation are given in the following: Dimensional Measurements
• Length. The objective of measuring the lengths of tube samples is to help correlate flaw location with position in the steam generator, and to determine if any significant elongation occurred during removal of the tube samples. The lengths of tube samples are generally measured using normal scales, with the samples on a laboratory table.
• OD. The OD of tube samples is usually measured using normal micrometers.
Typically it is measured at four diameters, i.e., at 45° increments around the circumference. It is usually measured at the ends of each segment and at any location of interest, such as tube support plate (TSP) intersections.
• ID. The ID of tube sample is usually measured using normal ID micrometers. It can
also be measured using an ECT or strain gage profilometer. Typically, the ID is measured at 45° or 60° increments around the circumference (if a two point micrometer is used, measurements are typically at 45°; if a three point ID micrometer is used, measurements are typically at 60°). The ID is usually measured at the ends of each segment.
• Wall Thickness. The wall thickness is usually measured using micrometers. Typically,
the wall thickness is measured at four diameters, i.e., at 45° increments around the circumference. It is usually measured at the end of each segment.
• Pit and Wear Scar Depth. The depths of pit and wear scars can be measured using pin
micrometers. Holding the sample in a lathe to allow accurate positioning of the micrometer is helpful.
• Profile. The ID or OD profile of the tube at deformed locations, such as at dents or
expansion transitions, can be measured using a variety of profilometer types, including: stylus, ECT proximity gage and laser. The profile is often measured along axial lines at four to eight locations around the circumference, i.e., at 45° to 90° increments. A laser method is available that can provide a complete map of the ID surface. Similarly, a laser micrometer method can be used to obtain a record of the OD dimensions around the full circumference over the length of an area of interest.
Radiography (RT) Both double wall and single wall radiography are used to inspect removed tube sections. The advantages of radiography are that it provides a permanent visual record of the pattern of the degradation. The main disadvantage is that it is relatively insensitive to tight cracks. Radiographs are generally taken even if it is uncertain that whether the flaws will be able to be detected. Double wall radiography is generally performed using four rotations (e.g., at 0°, 45°, 90°, and 135°). It has been found to provide a useful record of crack patterns and pit patterns for relatively deep flaws. However, it is often unable to detect flaws such as intergranular attack (IGA) or outer diameter stress corrosion cracking (ODSCC) at TSP locations.
20

Single wall radiography, with a curved film inserted into the tube, provides increased sensitivity as compared to double wall radiography. It is able to identify SCC as shallow as 30% of wall. However, it requires use of more exposures, e.g., 12 to 36, to examine the full circumference. In addition, the brittleness of the film may pose a problem. An alternate technique is to use a “microfocus” X ray source located inside the tube and to take a 360° radiography of the entire circumference at one time. This has the advantages of reducing the number of exposures required and ensuring that flaws oriented perpendicular to the surface are detectable, regardless of location around the circumference. Eddy Current Test (ECT) General practice is to perform at least the same types of eddy current testing in the laboratory as were performed in-situ before tube section removal. Performance of additional eddy current testing should be considered under the following situations:
• Special eddy current testing in the laboratory may help to more precisely locate flaws for later destructive examination steps. For example, examination using OD point (pencil) probes may help to locate shallow OD flaws.
• It may be desirable to perform tests of additional or developmental techniques for which it would be desirable to obtain qualification data.
Liquid Penetrant (LP) Liquid penetrant methods provide a rapid method for detecting tight cracks, and are occasionally used to help identify crack locations and patterns. However, because they contaminate OD and fracture surfaces, they are not used if chemistry evaluations are planned (plastic straining of surfaces to open up cracks, e.g., by flattening, bending, stretching in tension, or swelling, and then examining surfaces using a stereo microscope provides equivalent sensitivity without involving contamination). When liquid penetrant is performed, the fluorescent penetrant method is generally used since it provides the greatest sensitivity to tight cracks. Visual Inspections Visual inspection of tube samples containing crack(s) with certain levels of magnification is always necessary to give basic information about crack as well as its surroundings. Visual inspections are also called macroscopic examination and on Figure 14 two pictures obtained by this type of examination are given.
For inspection of ID surfaces television and/or fiber optic inspections are sometimes helpful both for in situ and laboratory inspections of ID surfaces to provide a general understanding of the surface condition. However, visual inspections on that level of magnification and preparation of the surface will generally not be helpful in detecting tight cracks.
21

Fig. 14. Macro photographs of cracks found on Paks NPP WWER 440 steam generator tubes.
Tube axis
Tube axis
22

Chemical Analysis Techniques A large variety of techniques are available for measuring local variations in chemical composition of the tube material, corrosion products, and deposits on the tubing samples. Some of these methods are surface sensitive techniques that are primarily applicable to characterizing the fracture surfaces. Other techniques are used to measure composition distributions on cross sections.
• Energy dispersive X ray fluorescence spectroscopy (EDS). This is the most common method for local chemical analysis. EDS is based on X ray fluorescence resulting from bombardment of the sample with an electron beam. The energies of the X ray photons are measured by a solid state detector (energy dispersion) to identify the emitting atoms. EDS is usually performed in a SEM and is thus a relatively simple procedure when SEM examination of topography is to be performed. EDS analysis measures composition over a depth of 1.5 -2 .tm with a spatial resolution on the order of 1 rim. The technique will detect Na and heavier elements present in concentrations greater than approximately 0.1 atom %. Lighter elements present in higher concentrations are detectable with special equipment (i.e., windowless or diamond window detectors). EDS has relatively poor energy resolution, and therefore, some difficulties can be encountered in separating elements with closely spaced characteristic X ray lines (e.g., Pb, S, and Mo). The analysis is usually semi-quantitative, but reasonably accurate compositions can be obtained from smooth samples when similar reference standards are available. The technique is applied to both elemental mapping on cross sections and fracture surface analysis. However, because of the depth of analysis, it is not routinely sensitive to thin layers that may be important in intergranular fracture. (By use of special preparation and operating techniques, such as use of a grazing angle of incidence for the electron beam, it is sometimes possible to do meaningful EDS analysis of thin surface films, but other surface sensitive techniques such as AES and XPS are usually more appropriate for this purpose). EDS can be applied to identify the chemical constituents of scales and deposits. See example of EDS report on Figure 15.
Fig. 15. Typical EDS report of deposit (Paks NPP WWER 440).
• Electron microprobe (EPMA). Electron microprobe analysis is an X ray fluorescence
analysis technique that is very similar to EDS except that the X ray energies are determined by diffraction which separates the X ray spectrum by wavelength
23

(wavelength dispersion spectroscopy, WDS). Wavelength dispersive techniques have better resolution of photon energies than energy dispersive techniques. Therefore, more accurate quantitative analysis can be performed using the electron microprobe with WDS than with EDS. Electron microprobe analysis is usually applied to polished samples. Heavy elements (atomic number greater than 11) present in concentrations as low as 100 ppm are detectable by EPMA. Lighter elements (atomic number greater than 5) are detectable at higher concentrations. Spatial resolution for the EPMA is approximately 1 μm, and the analysis depth is also about 1 μm. Some SEMs are equipped for WDS as well as EDS.
• Auger electron spectroscopy (AES). In this technique, chemical composition
information is obtained from the energy levels of electrons emitted during decay of ionized surface atoms. In the Auger instrument, the atoms are ionized by a primary high energy electron beam. The main advantage of AES is that because of the low energies of Auger electrons they can escape from only the first few atom layers of the sample surface. Therefore, AES is uniquely suited for analyzing thin surface films and thin layers of segregation at grain boundaries that cause them to crack. Because of the extreme surface sensitivity of the method, surfaces can easily become contaminated with a layer which prevents meaningful analysis. The thin segregated layers of interest can also be easily removed by corrosive attack. AES works best when the surface to be analyzed can be created by fracturing the sample in the high vacuum chamber of the instrument. For investigation of IGSCC cracks, tight cracks should be opened up by bending the sample in the vacuum chamber of the instrument. AES has good spatial resolution. Insulating samples are often analyzed using grazing incidence of the exciting electron beam to reduce charging. This reduces the spatial resolution considerably.
AES is sensitive to all elements except hydrogen and helium, and surface composition is quantitative when standards are used. Composition profiling in depth can be performed by removing surface layers by sputtering. Quantitative accuracy is often lost by sputtering because of uncertainty in relative sputtering rates, and calibration using an appropriate standard is required to convert sputtering time to depth. Scanning Auger Microscopes (SAM) combine AES analysis with a scanned exciting electron beam (as in a SEM) to produce images and spatial resolution for the AES analysis. AES can be used in investigation of steam generator tube cracking to deduce the nature of the environment responsible for cracking. Depletion of chromium and enrichment of nickel on the crack surface is associated with cracking under caustic conditions. Chromium enrichment on the surface is associated with cracking under acid conditions. Comparison of composition depth profiles on crack surfaces from service induced cracking with those from crack surfaces formed under controlled laboratory conditions can provide more detailed information regarding the aggressive environment that caused the cracking.
• X ray photoelectron spectroscopy (XPS or ESCA). This technique obtains chemical
information from energy analysis of photoelectrons emitted from a sample excited by an X ray beam. Like AES, XPS is a surface sensitive technique because the electrons being emitted are low energy. XPS has good sensitivity to most elements. The energy levels of the photoelectrons analyzed for XPS can be shifted by chemical binding of
24

the atoms. Thus, XPS provides not only elemental information but also information that can be analyzed to determine how the element is chemically combined. Excitation for XPS is usually achieved by a relatively large X ray beam (2 mm diameter) so that the technique provides poor spatial resolution. However, focused XPS systems with a spot size of approximately 0.15 mm are available when greater spatial resolution is required. XPS is probably most suitable for analysis of surface films and scales.
• Mass spectrometry (SIMS, SSMS). There are several techniques for chemical analysis
that are based on mass spectrometry. In these techniques, ionized atoms (or molecules) are accelerated in an electric field and then separated by their mass to charge ratios by deflection in a magnetic field. The difference between secondary ion mass spectrometry (SIMS) and spark source mass spectrometry (SSMS) is in the way that the ions to be analyzed are produced. SIMS is a surface analysis technique in which the ions are produced by sputtering the sample with a primary ion beam (e.g., argon). For SSMS, the ions are produced by a spark discharge. These techniques can detect all chemical elements including hydrogen. Different isotopes of the same element can also be separated. SIMS is a surface sensitive technique, but composition vs. depth is obtained as the surface is sputtered away. SSMS produces ions from significant depths below the surface. The mass spectrometry techniques accurately measure the elemental composition of the ions produced by the process. However, SIMS yields only qualitative information about sample composition because of a large uncertainty about ion yield vs. sample composition for the ionization processes. There is less uncertainty about relative ion yields for SSMS so that this technique is suitable for semi-quantitative analysis. The primary advantage of mass spectrometry techniques over other methods is in their sensitivity to light elements and their high sensitivity to low concentrations (less than 1 ppm of a given element can be detected).
• X ray diffraction analysis (XRD). X ray diffraction (XRD) is used to determine the
crystal structure of materials. It is, therefore, used for identifying the chemical compounds present. XRD analysis is usually used in conjunction with elemental analysis (e.g., EDS) to determine not only what elements are present in a sample, but how they are combined. In XRD analysis, an X ray diffraction pattern, which contains crystal lattice dimension and atomic arrangement information, is produced by illuminating a polycrystalline (or powder) sample with a monochromatic X ray beam. For solid samples, the back scattered pattern is analyzed so that bulk samples can be measured. Information is obtained from depths up to approximately 100 μm. This technique is most applicable to determining the composition of corrosion product scales or thick deposits. XRD is capable of detecting compounds that are present in excess of about 5 weight percent of the sample. Loose particulate matter can be collected and analyzed in a powder X ray camera which records both the forward and back scattered X rays. Where magnetite is a constituent of the powder, magnetic separation can be used as a preliminary step to separate the powder so that analysis of the X ray diffraction pattern will be easier. If small single crystal particles are collected, XRD analysis can be performed by the rotating crystal method. This method provides the same information for single crystals as the powder methods give for polycrystalline solids or powders. Small individual particles removed from samples by
25

extraction replicas can also be analyzed by electron diffraction in a transmission electron microscope.
• Chromatography (IC). Ion chromatography (IC) is a widely used technique for
quantitatively measuring the concentrations of many anions and some cations. The basic procedure involves (1) continuously flowing an effluent through an ion exchange bed, introducing the sample into the effluent stream for a period of time so that sample ions displace effluent ions from the ion exchange bed, and monitoring the displacement of the sample ions by the continuing flow of effluent ions after the sample introduction is stopped. Different species will be displaced at different times, resulting in distinct bands of different ions moving through and out of the ion exchange column. These bands can be detected, e.g., by effects on conductivity.
• Optical atomic emission spectroscopy (OES). Optical atomic emission spectroscopy
(OES) uses the characteristic optical spectrum produced by an element as it decays from an excited state to its ground state to identify it and measure its concentration. The material to be sampled is vaporized in a source and the resulting optical emission is analyzed to determine the chemical composition. Four different emission sources are used: arc sources, spark sources, glow discharges, and flame sources. The first three methods utilize electrical currents and typically use samples obtained by machining or grinding, while the fourth (flame) utilizes chemical combustion with the sample in a solution form. Arc sources are used to determine concentrations of trace impurities. Spark source excitation permits rapid elemental analysis of metals and alloys. Glow discharge may be used to determine low concentrations of carbon, phosphorous and sulfur. Flame sources are mainly used to determine concentrations of alkali metals. Elements such as nitrogen, oxygen, hydrogen, halogens and noble gases are difficult or impossible to measure with OES.
• Inductively coupled plasma atomic emission spectroscopy (ICF-AES). Inductively
coupled plasma atomic emission spectroscopy (ICP-AES) is an analytical technique for determining elemental compositions. It can provide quantitative analysis for over 70 elements, with detection limits in the ppb to ppm range. It is used for determining the composition of metal alloys, including concentrations of trace impurities. It is also used for determining the composition of geologic materials, and thus should be useful for determining the composition of some deposits in steam generators. Samples are generally in liquid solution form. The samples are introduced into an argon plasma torch maintained using radiofrequency excitation where the sample material is heated to high temperatures, ionized and excited. The radiation given off by the excited atoms as they decay is analyzed to provide quantitative and qualitative analysis of the composition of the sample. ICP-AES cannot measure noble gases, and its sensitivity is poor for alkali elements. Halogens require use of a vacuum spectrometer and optics.
• Glow discharge optical spectroscopy (GDOS). Glow discharge optical spectroscopy
(GDOS) is one of the OES techniques. It has been widely used for examination of deposits on removed tube samples, especially by EDF. A glow discharge is a direct current low pressure discharge maintained in an argon buffer gas that is characterized by diffuse current and low temperature (as compared to arcs which are more localized and involve high temperatures). It operates at a pressure of a few torrs. The typical GDOS device utilizes a Grimm emission source which allows samples to be in planar form and rapidly changed. The sample is part of the cathode. The glow discharge is maintained between the sample and the end of a cylindrical anode that approaches the
26

sample surface. The area of the sample which is exposed to the glow discharge erodes slowly due to a sputtering effect and thus is sampled over time. Unless the tube section is flattened (which may be undesirable since it could result in spalling of deposits and oxides), performance of GDOS requires that a special device be made for each diameter tube to develop a flat surface to seal the GDOS device.
• Atomic absorption spectrometry (AAS). Atomic absorption spectrometry involves
passing a monochromatic light beam through a flame in which the sample has been atomized. Measurement of the amount of absorption of the light beam as it passes through the flame provides an indication of the concentration of the element which has an energy transition equivalent to the energy of the monochromatic light. The sample is normally introduced into the flame in a solution form. The technique permits quantitative analysis of approximately 70 elements. It cannot analyze noble gases, halogens, sulfur, carbon or nitrogen.
• Scanning Auger microscope (SAM). The scanning Auger microscope (SAM) is a
modification of an SEM that can allow more surface sensitive chemical analysis. It typically operates at a higher vacuum than a standard SEM. The SAM image is developed by collecting the Auger electrons generated by the electron beam. Auger electrons are electrons released as part of the decay process of an excited atom, and have specific energy levels characteristic of the element. Because of their low energy, Auger electrons effectively only come from the surface layer. Thus, measuring the intensity of Auger electrons of different energy levels allows the chemistry of the surface layer to be determined as it is scanned.
• Fourier transform - infrared spectroscopy (FT-IR) Fourier transform - infrared
spectroscopy (FT-IR) involves analyzing changes in the intensity of a transmitted or reflected infrared light as a function of the frequency of the beam. The technique has been applied to analysis of steam generator tube deposits, either directly on the tube or of removed deposits. A diffuse reflectance method is used to study deposits on the tube surface. To study removed deposits, a small amount of deposit is mulled (ground up) with a transparent compound such as KBr or CsI to form a thin film through which the infrared beam is passed. FT-JR is useful for analysis of organic compounds (e.g., oils, amides, organic acids, and metallic complexes) as well as inorganic compounds such as complex silicates, sulfates, and nitrates. The spectra are somewhat difficult to interpret, and require that reference libraries be available.
• Other Methods. The techniques described above are considered to be the ones most
applicable to analysis of steam generator tube samples, and should be sufficient for most investigations. However, there are a number of other electron and optical spectroscopy techniques that might be useful for specific special applications. There are also variations of the techniques discussed above (e.g., imaging techniques for SIMS) that can be applied to obtain additional information regarding chemical composition and distribution in tube samples, corrosion product scales, and deposits. Evaluation of which techniques should be applied must be made in terms of the specific objectives of removing the tube samples.
Structural and Microstructural Analysis Techniques There are three main methods used to characterize the metallography of materials:
27

Optical microscopy, Scanning electron microscopy, and Transmission electron microscopy.
• Optical microscopy. Optical microscopy uses visible light to provide a magnified image of the surface being examined. Basically to kinds of optical microscopy exist: the stereo microscopy and the optical microscopy using metallurgical microscope. Stereo microscopes are used for examination at low power (up to about 50 to 60 times) and are useful for general characterization of surfaces. They are typically used to examine tube OD surfaces upon initial receipt and after pressure testing. They are also used to examine OD and ID surfaces after plastic straining to identify flaws that have been opened up by the straining. This type of examination helps to identify areas with possible flaws that warrant more detailed examination, e.g., by SEM or optical metallography. Optical microscopy using metallurgical microscopes is the standard method for evaluating tube material microstructure and for determining the presence and depth of flaws. Magnifications up to about 1000 times can be used. As the magnification increases the flatness of the sample surface becomes of increasing importance since high power optical microscopes have limited depths of field. For this reason, the care taken in polishing of specimens becomes of increasing importance as the magnification increases.
A common sequence for optical microscopy is as follows:
• Cut the sample to the desired size. • If the sample is to be mounted in a plastic compound, first coat it with nickel (this
minimizes problems of rounding of the sample edge when in is polished). • Mount the sample in a suitable mounting compound, e.g., epoxy. • Grind and then polish the surface to be examined using increasingly finer
abrasives. This may be followed by electrolytic polishing. • Examine the unetched as-polished surface to detect and make a photographic
record of any flaws. • Acid etch the surface to bring out the microstructure and show the relationship of
the microstructure to the flaws. Examine the etched surface and make a photographic record.
• For some samples, etch the surface, e.g., using a dual Nital - phosphoric acid etch or a bromine methanol etch, to determine the extent of decoration of grain boundaries by carbides.
For example of micrographs obtained by optical microscopy see on Figure 16.
Fig. 16. Micrograph of crack from Paks NPP WWER 440 tube.
28

• Scanning electron microscopy (SEM). The scanning electron microscope (SEM) is the standard tool for examining the morphology of flaws and flaw surfaces. It is also used with electron and X ray spectroscopy instruments for surface chemical analysis. The SEM utilizes a focused beam of electrons that is scanned across the specimen surface under high vacuum. The intensity of secondary electrons that are released from the surface and reach a collector located to the side of the area being examined is measured. (When a high energy electron beam hits a surface, three types of electrons are released: low energy secondary electrons, slightly higher energy Auger electrons, and still higher energy back scattered electrons). The changes in intensity of the secondary electrons is affected by the geometry of the surface, and when developed on a cathode ray tube using a raster pattern keyed to that being used for the main electron beam on the sample, these changes in electron intensity develop a picture of the sample surface in much the same way that optical images are developed (e.g., light areas are high, deep areas are dark). SEMs can generally provide magnifications up to about 50,000 times, and resolve features down to about 5 nm under optimum conditions (about 40 times better magnification and resolution than available with optical microscopes). A more significant advantage of SEM over optical microscopy is its depth of field at high magnification which allows high resolution examination of rough fracture surfaces. See Figure 17 with SEM micrograph. Using an SEM to create a photo montage of a fracture surface at sufficient magnification to show ligaments and other microstructural features is an efficient means for mapping flaw depth vs. position.
29

Fig. 17. SEM micrograph of cracks from Paks NPP WWER 440 tubes.
• Transmission electron microscopy (TEM). The transmission electron microscope
(IBM) is a standard tool for investigating the microstructure of materials. A highly focused electron beam is passed through a thin foil of the material being investigated. The electrons that pass through the foil then pass through lenses that focus them on a viewing screen. Images can be formed using the transmitted beam (bright field image) and also using diffracted electrons (dark field images). The TEM can be used to examine microstructural features such as dislocation density, presence of precipitates and their location in grains or on boundaries, the crystal structure of different phases, and the chemistry of small areas (down to 30 nm in diameter). A major limitation is that the material examined must be thinned to about 100 nm to allow transmission of electrons which can be time consuming and difficult. In addition, each examination can be very time consuming.
• Scanning transmission electron microscopy (STEM). The scanning transmission
electron microscope (STEM) is essentially the same as a TEM except that the signal is not generated directly by the transmitted or diffracted electrons as in TEM but rather is generated by measuring the intensity of secondary electrons or of the transmitted and scattered electrons, and then displaying the intensity using a raster pattern correlated with that of the main electron beam. STEM has been used to examine detailed crack paths, e.g., whether cracks pass though or around carbides located at grain boundaries.
Measurement of Tensile Properties Tensile properties of tube materials should be determined from samples taken from portions of the tube away from areas of degradation and that have undergone as little deformation during the tube removal process as possible. Measured properties should include 0.2% offset
30

yield strength, tensile strength, elongation and reduction of area. If tube deformation occurred during removal, this should be noted on the test report, and it should be understood that some changes in mechanical properties probably occurred due to the deformation. Measurement of Hardness Microhardness surveys can help identify areas that have been hardened by cold work or which were not properly heat treated during fabrication. They can also help to quantify the degree of cold work and how it varies across the wall thickness, along the length, or around the circumference. Both the Vickers and Knoop hardness methods are used. Microhardness in some cases can help in explanation of causes of various degradation processes. Tests for Sensitization Electrochemical potential reactivation (EPR) tests are a standard way to measure the degree of sensitization of austenitic stainless steels when assessing their susceptibility to IGSCC in boiling water environments. In previous chapter a great number of various methods were described. Unfortunately for investigation of WWER pulled tubes the methods as well procedures for using particular method were not standardized which can lead to misunderstanding of obtained results. Special problems can appear during comparison of data from for example two nuclear power plants obtained using different methods or using different working procedures. In this direction significant efforts have to be engaged to raise the level of standardization and to establish common data base with ability of comparison. The practice from USA which can be also of interest for WWER steam generator tubes examinations briefly is the following:
• Procedures for characterization of degradation geometry: a) Visual observations b) Stereo microscopy c) SEM fractographic evaluations, d) Metallography
• Degradation evaluations:
a) Stereo microscopy b) Visual observations c) Low power macro photographs d) Burst testing to open and identify the dominant linked up macrocrack e) Determination of the dominant crack depth profile f) For eddy current response, detection and sizing considerations include
successive radial sections after the above steps To prevent corrosions with adequate remedial actions and to understand their mechanisms, it is very important to know what ingredients of the tube deposits which inhibit all corrosion processes are. For that purpose, the approach given in Table 1 is used in Hungary.
31

Table 1 Hungarian approach to tube deposit analysis
Analysis technique Parameter analyzed
Energy Dispersive X ray Analysis Deposit Surface Elemental Composition
X ray Diffraction Deposit Crystal Structure
Optical Microscopy Deposit Micro-morphology
Scanning Electron Microscopy Deposit Micro-morphology
3.4. Eddy Current Probes used for Degradation Assessment The most popular NDT method for inspection of WWER steam generator tubes is eddy current method. Eddy current method is based on appearance of eddy currents in the test object due to electromagnetic induction developed by alternating current flow in primary coil. Because of discontinuity in tube wall, the conductivity will change and affect the flow of eddy currents. Consequently, coil voltage and phase change will occur, providing determination of the size of flaw. For inspection of WWER steam generator tubes as well as collector material three main types of eddy current probes can be used:
• Standard bobbin probes • Rotating probes (pancake, cross wounded, plus point) • Array probes, (8x1, X probe)
The most common eddy current technique applied for steam generator examination is standard bobbin probe. Besides standard examination with bobbin coil probe, which provides limited amount of data concerning tube’s damages, nowadays other kinds of eddy current probes especially rotating have become also very popular. In many cases these new probes provide additional information about characteristics of degradation. Bobbin probes Bobbin probe (Figure 18) consists of two coils wounded on probe body, electrically connected opposite to each other. Volume and depth of detected indication may be determined by comparison of appropriate values with artificial flaws on calibration standards. Circumferential damage is hard to detect with bobbin probe because it is parallel to eddy current flow and causes negligible conductivity changes. Due to changes of fill factor (Figure 19), examination reliability is degraded in the area of tube diameter changes (dents, dings, expansion transition, etc.).
32

Fig. 18. Standard bobbin probe.
Fig. 19. Definition of bobbin probe fill factor. The bobbin coil technique is normally used for tube examination where volumetric and dominantly axial discontinuities are expected. Because of reliability and speed of data collection, the entire tube length is usually examined with a bobbin probe. Rotating probes
These probes utilize single or multiple coils mounted on probe body. Mounted coil(s) has a limited field of view so probe should be rotated to achieve complete inspection of the tube circumference. A typical rotating probe body is given on Figure 20. The coil is spring loaded riding the tube inner circumference in order to reduce lift-off effects. Common variants in
( )( )2
2
Ddff =
33

use include the single and two-coil rotating pancake coil and three-coil configuration which utilizes a pancake coil in conjunction with two directed coils or in recent time very popular “+point” probe.
Fig. 20. Rotating probe.
Rotating probe is applied for: • diagnostic purposes to infer flaw morphology and/or flaw orientation • confirming ambiguous bobbin coil indications • detecting circumferential cracking • examining regions of the tube where bobbin coil fill-factor effects are pronounced (inner
row U-bends, dented support plates or tube sheet intersections and expansion transitions) a) Rotating probe with “pancake” coil
Circular eddy current flow formed in the tube wall (Figure 21) provides equal sensitivity to axial and circumferential cracking, as well as sensitivity to volumetric tube wall degradation.
a) b)
Fig. 21. Circular eddy current flow.
Pancake coil mounted on probe head has a limited field of view, so inspection of tube is achieved by translating the probe body axially as the probe head is rotated. The coil describes a helical path with rotational and axial speeds coupled in order to ensure complete tube examination (Figure 22 a). To achieve complete overlap, the probe should not be translated axially by more than one half of its diameter during one rotation. An additional feature of rotating coil analysis is its diagnostic capability, which comes about
34

by the analysis of synchronized line-scan data. A linear discontinuity located within the tube wall will be passed once during each rotation of the probe (Figure 22 b). The coil output voltage from a given rotation is used to generate a line scan, which represents signal amplitude as a function of coil position around the tube circumference. Image formation in a two-dimensional cylindrical coordinate system is accomplished by plotting a series generation synchronized with probe rotation. This provides the reconstruction of an “image” in perspective format. Flaw presence is determined by recognized linear features present in the reconstructed image usually called “C-Scan”. Flaw measurement is performed by cutting this “C-Scan” with the plane and determination of the length and width of cross-section. Presentation of this cross section area is usually called “clip-plot”.
a) b)
Fig. 22. Forming of line-data scan and picture of two coil rotating probe.
b) Rotating probe with “+point” coil The plus point coil is a rotating probe involving the application of two tangential coils connected in a differential arrangement. This configuration utilizes one coil wound in an axial direction and one coil wound in a circumferential direction with the two coils set one on top the other. The magnetic fields of the individual coils induce eddy current flow in the inspection material at right angles to the primary magnetic field. This allows examination with enhanced capabilities for preferentially oriented flaws and promotes characterization of flaw type and orientation. The axial wound coil is sensitive to volumetric and circumferentially oriented flaws while circumferentially wound coil is sensitive to volumetric and axially oriented flaws. The differential arrangement aids in the suppression of coil lift-off and geometric variations such as dents and expansion transitions. This mutual canceling effect has the same advantages seen in other differential coil arrangements as the bobbin coil. The differential arrangement is also more thermally stable than the absolute arrangements. The response of the plus point coil is based upon flaw orientation and morphology. The two coils are wound in opposition which produces outputs opposite of one another (180 degrees out of phase). Volumetric flaws produce an output from both coils while directed flaws
35

typically produce an output only from the coil which is wound at right angles to the flaw direction.
The plus point coil has application for the examination of roll transition areas, support locations, tube bends and dented areas. Flaw types such as axial and circumferential OD SCC, volumetric IGA, pitting and fretting wear are applicable candidates for inspection. Plus point technology has proven to be very sensitive to cracks and may provide more reliable detection than the pancake coil, especially in areas with extraneous influences. The following Figure 23 presents a graphic detail of the plus point coil and its flaw detection characteristics.
Fig. 23. Orientation of the plus point probe coils. Array probes a) Standard array probes A standard array probe is a probe with multiple coils (mostly pancakes or plus point) distributed around the tube circumference. In such way composite array coil field provides complete circumferential coverage without need for probe rotation in such a way that each coil has the task to examine one stripe of tube internal surface. The idea of array probe is to obtain benefits of rotating probes with pull speeds comparable to a bobbin coil. Disadvantage is that failure of one coil causes a probe change because of incomplete coverage of tube circumference. Unfortunately standard array probes in practice did not reach neither speed of bobbin probes and its excellent depth measurement capabilities nor sensitivity of rotating probes, so they did not find application in WWER steam generators inspections. The only purpose for which they are used is profilometry of WWER tubes (profilometry means determination of tube ID on different section of tube using lift off effect). The most often used array probes are 8x1 and 16x1 design presented on Figure 24.
36

Fig. 24. Array probes 8x1 and 16x1. Applications of array probe are the following:
• in situation where bobbin coil reliability is degraded because of fill factor variations (dents, dings, tube expansions)
• detection of circumferential cracking; • determining the nature of wear under support structures (one or double sided)
b) Array probes with rotating magnetic field (multiplexed array probe)
This kind of probes is the latest technology achievement in inspection of steam generator tubes. They consist of standard bobbin probe and high resolution array probe (X® probe and Intelligent® probe). For details of X® probe see Figure 25.
Fig. 25. Array probe with rotating magnetic field (X® probe). Note: for inspection of WWER tubes with relatively small diameter high resolution 3x8 array is used. It is interesting that coils in array part of probe work in so called transmit receive mode which means that in particular order each coil transmit eddy current or receive it. In such way dynamically changing pattern of transmit and receive coils assure the full coverage of surface with eddy currents obtaining very good sensitivity on flaws. Because the whole scanning is based on electronic the extreme number of rotation can be achieved, up to 38000 rpm. For details of this interesting design see Figure 26.
37

This probe in parallel inspects steam generator tube with bobbin probe and with array probe with rotating magnetic field. Relatively enormous number of data channels and related data can be analyzed only with special software developed for this particular type of probe. This probe is favorable solution in cases where great number of indication exists and where plugging criteria are not connected entirely on depth of degradation but also on orientation or/and length of degradation. Using X probe in these cases the essential time can be saved because indications have to be scanned only once. From the other hand the price of this probe is very high (around 10 times price of bobbin probe or 4 times price of rotating probe) and durability is on the level of bobbin probes, so the cost benefit analysis is a must before making decision about its use.
Fig. 26. The work principle of X probe.
Axial flaw detection
Transmit from C1 to A1 to get first axial measurement
Transmit from C 1 to A2 to get second axial measurement from the same emitter
Circumferential flaw detection
Transmit from B1 to B3 to get 18 circumferential channels
Transmit from C1 to C3 to get 18 circumferential channels
38

Fig. 27. Data analysis screens.
Previously described eddy current probes give the same but also the different data about flaws found on WWER steam generator tubes. Brief overview of capabilities of different eddy current probes is given in the Table 2. Table 2 Advantages and disadvantages of bobbin and rotating probe techniques
EC Advantages Disadvantages
Bobbin
probe
• high speed of data collection • determining depth of damage
reliably • sensitive to axial cracks • durability of probes (up to 1000 half
tubes per probe) • accurate determination of flaw axial
location
• less sensible to circumferential cracks
• found damage can not be sized regarding length and width
• orientation of the crack can not be determined
• if there are more flaws on the same tube’s axial location it can not be distinguished
• can not reliably detect flaws on places with changing geometry (tube transition zone on the top of the tube sheet, dents, bulges)
Rotating
probe
• equally sensible to axial and circumferential flaws
• orientation of the flaw can be determined
• length and width of flaw can be measured
• possibility of detection more flaws in
• slow data acquisition so it is
impractical to inspection whole tube length.
• depth measurement is not reliable
39

EC Advantages Disadvantages the same tube’s axial location
• can reliably detect and measure flaws length and width on places with changing geometry (tube transition zone on the top of the tube sheet, dents, bulges) because coils are spring loaded and in contact with tube inner surface
• excellent visual presentation of flaws via C scan
Array probe
(standard)
• high speed data collection but not as bobbin coil
• orientation of the flaw can be determined
• length and width of flaw can be measured
• sensibility on axial and circumferential cracks
• possibility of detection more flaws in the same tube’s axial location if applicable
• good for profilometry
• probes are not durable for tubes with small diameters as on WWER very difficult to manufacture
• length and width of indication can be measured only with poor accuracy
• because the coils are not permanently in contact with tube inner surface poor detection capabilities in places with changing geometry (tube transition zone on the top of the tube sheet, dents, bulges)
Array probe with
rotating magnetic
field
• orientation of the crack can be determined
• length and width of flaw can be measured
• sensibility to axial and circumferential flaws
• possibility of detection more flaws in the same tube’s axial location if applicable
• good visual presentation of flaws • good for profilometry measurement
• still not so sensitive as plus point probe to small cracks especially in the places with changing geometry (tube transition zone on the top of the tube sheet, dents, bulges)
• very expensive • durability for WWER steam
generators still unknown • can be used only with eddy
current instruments from one vendor and only with one software
• data analysis can be still difficult
It has to be pointed out that on the basis of the previous table, bobbin probe because of its speed and simplicity of use, can be used for inspection of whole length of WWER steam generator tubes detecting indications as well as places with ambiguous signals.
40

After detection with bobbin probe, only the locations with indications or with ambiguous signals have to be examined with rotating probes which give more information about indications. This means that these two types of probes complement each other by giving more valuable information. So for that reason, the policy of using both types of probes as previously described is highly recommended. On next Figure 28 one interesting example of indication on tube which caused forced shutdown because of leakage are given. The presented data were obtained with bobbin and with rotating pancake coil probe. On these figures it is obvious that this indication is one axial flaw relatively long (around 25 mm long and 1.5 mm wide), thru wall, on location very near to second tube bend.
Fig. 28. Indication from steam generator tube which caused forced shutdown a) Bobbin probe strip chart and Lissajous presentation – primary channel.
(Primary channel is Ch#3 140 kHz, P1 is a mix channel)
41

b) Bobbin probe Lissajous presentation on different differential channels.
42

Rotating probe
a) Rotating probe strip chart and Lissajous presentation – primary channel.
b) Rotating probe C scan presentation.
43

One of the very important terms related to eddy current inspection of WWER steam generator tubes and operational assessment is the probability of detection. Probability of Detection (POD) is a measure of eddy current performance and is defined as the likelihood that an eddy current inspection system, consisting of both the technique and the analyst, will detect a flaw. POD may be expressed as a function of the severity of degradation. For this case, POD is typically calculated by comparing destructive examination results with the results of the eddy current inspection (found or missed). Several different approaches have been used to characterize detection capability, for illustrative purposes, a POD curve can be used to describe inspection system performance. This concept is depicted in Figure 29.
Fig. 29. Probability of detection curve. Ideal inspection performance is represented by a step function. For the step function, the POD= 0 for flaws of no interest and a POD=1 for flaws of “significance.” However, industry data indicates that the use of eddy current techniques will occasionally result in missed indications, including flaws of significance. Experience has shown that a technique’s capability is affected by the type and orientation of degradation. Detection capability can be further degraded by the presence of signal interferences such as supports and deposits. The integrity analysis must account for the lack of “ideal” performance. A typical method to determine the probability of detection for eddy current inspection of steam generators is to compare destructive examination results with the predictions of the eddy current examination. In some cases, the indication can be made artificially (EDM notches or/and artificial
44
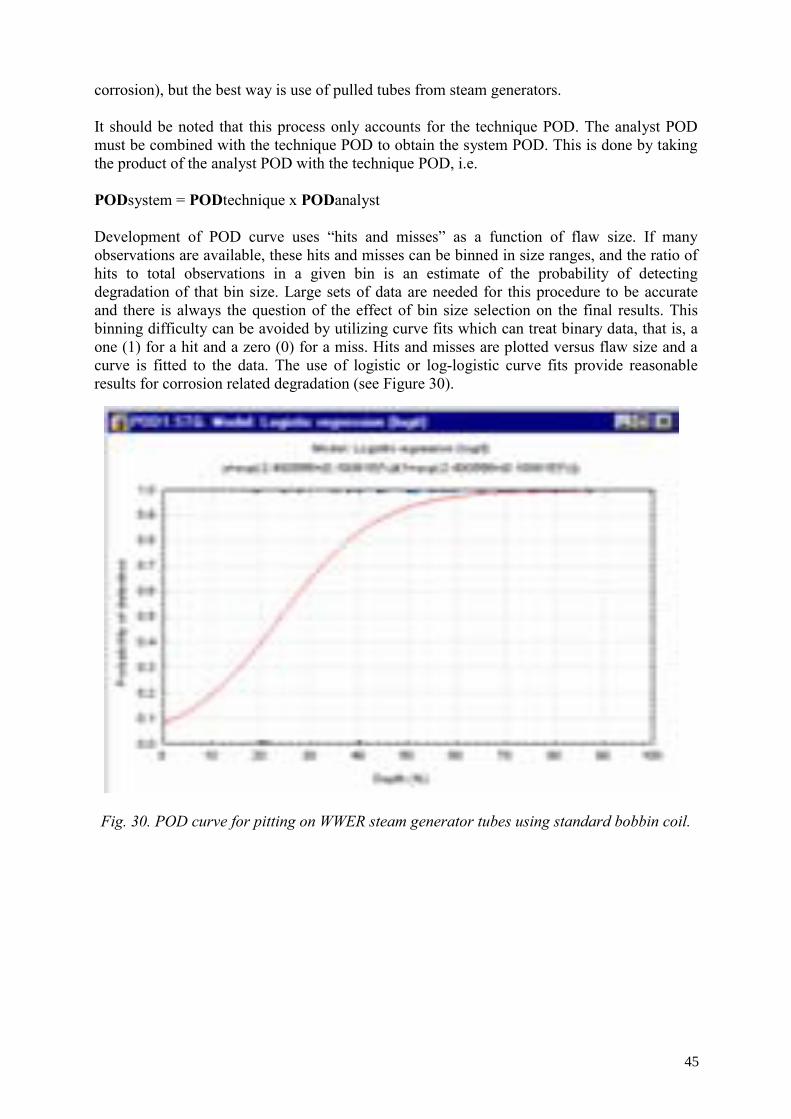
corrosion), but the best way is use of pulled tubes from steam generators. It should be noted that this process only accounts for the technique POD. The analyst POD must be combined with the technique POD to obtain the system POD. This is done by taking the product of the analyst POD with the technique POD, i.e. PODsystem = PODtechnique x PODanalyst Development of POD curve uses “hits and misses” as a function of flaw size. If many observations are available, these hits and misses can be binned in size ranges, and the ratio of hits to total observations in a given bin is an estimate of the probability of detecting degradation of that bin size. Large sets of data are needed for this procedure to be accurate and there is always the question of the effect of bin size selection on the final results. This binning difficulty can be avoided by utilizing curve fits which can treat binary data, that is, a one (1) for a hit and a zero (0) for a miss. Hits and misses are plotted versus flaw size and a curve is fitted to the data. The use of logistic or log-logistic curve fits provide reasonable results for corrosion related degradation (see Figure 30).
Fig. 30. POD curve for pitting on WWER steam generator tubes using standard bobbin coil.
45

A typical problem with this approach is the generation and availability of “misses.” Generally, tube pull data with undetected degradation is required. In praxis the combination of pulled tubes and tubes with artificial degradation are combining to construct relevant POD curve. POD curve is good for estimating how many indications of a particular size were not reported during inspection. For example, if we look at Figure 30 we can conclude that the number of indications with depths between 20% (POD=0.4) and 30% (POD=0.65) and average POD=0.5025 will not be detected in 49.75% of cases. It means we will find every second indication of that size caused by pitting. So if during the inspection 12 indications were found in the range of 20%-30%, one can assume that an additional 12 indications of that size may exist in the steam generator. Besides the term POD, the second important term related to eddy current inspection technique is the eddy current inspection system uncertainty. The eddy current system uncertainty is a combination of the uncertainty of the eddy current technique and the analyst variability in interpreting the signal. The analysis of eddy current sizing error is based on assessing the deviation of the eddy current measurement from the true flaw size. The usually used graph which represents uncertainty of measurement is the graph of the eddy current measurement as a function of the metallurgical measurement (see Figure 31, where two different companies perform measurement of the same tubes with artificial flaws made by VNIIAES institute).
ECdepth = 0,91Real + 3,3R2 = 0,64 - Company 2
ECdepth = 0,96Real + 2,1 (%)R2 = 0,53 - Company 1
0
10
20
30
40
50
60
70
80
90
100
30 40 50 60 70 80 90 100
Real depth, %
EC d
epth
, %
Fig. 31. Eddy current blind test results as a function of real flaw depth (tubes with artificial flaws, measurement performed by two independent companies
The eddy current technique uncertainty is characterized by the scatter about the regression line, which is assumed to be normally distributed with a constant standard deviation of σ.
46

The eddy current test data that is used to establish the estimate of uncertainty should be fairly uniformly distributed between the minimum and maximum sizes of interest. The technique performance test data should have a correlation coefficient which establishes with a 95% confidence that a correlation does statistically exist between the measured size and what is considered to be the actual size. Table 3 provides the minimum correlation coefficient for a given number of data points to achieve this level of confidence. For example, for a sizing data set of 18 points the correlation coefficient must be greater than 0.467. If the correlation coefficient is less than this, technical justification must be provided for using this data. Table 3 Minimum correlation coefficient for a given number of data points to achieve 95% level of confidence.
Sample size Correlation Coefficient (minimum
Sample size Correlation Coefficient (minimum
8 0.705 30 0.360
10 0.630 32 0.349
12 0.574 34 0.338
14 0.531 36 0.329
16 0.496 38 0.320
18 0.467 40 0.312
20 0.443 42 0.304
22 0.422 44 0.297
24 0.403 46 0.290
26 0.387 48 0.284
28 0.373 50 0.278
For condition monitoring and operational assessment, either the “statistical tolerance intervals” or “statistical tolerance limits” are used. The formulas for the two sided tolerance interval are:”
47

Ksx± where the value K depends on the sample size, N, the desired confidence level γ and the proportion (probability) of the population to be included within the tolerance , P. In determination of eddy current measurement tolerance the upper tolerance limit is used. For example if we determined that s (standard deviation) of differences between eddy current measurements and actual values for 20 flaws caused by pitting is 5%, with an average depth difference of 2%, then we can calculate the upper limit taking into account requested probability (for example 95% of population) and confidence level (for example 50%) is 2%+K5%=12.22 % because the K= 2.044. Note that any value of P and/or γ can be chosen to define an upper tolerance limit. 3.5. Establishing Relationship of Burst Pressure and Accident Leakage Rate to
Structural Variable
Determination of structural limit which assures structural integrity of tube during normal operation and under accidental conditions, taking into account safety factors, can be established depending on the available data in one of the following ways:
• Theoretical calculations (analytical method, numerical methods). As an example, on Figure 31, the results of theoretical calculations is given for WWER tube burst pressure as a function of flaw length and flaw depth. For more details see Appendix.
• Laboratory examination of tubes with relevant artificial degradation (artificial
degradation must include all shapes, sizes and depths which are similar to real situation in steam generator, artificial fast corrosion flaws are extremely useful for these purposes)
• Laboratory examination of pulled tubes with relevant natural degradation. See Figure
33.
48

0
10
20
30
40
50
60
70
80
90
100
0 5 10 15 20 25 30 35 40 45 50 55
Flaw length [mm]
Burs
t pre
ssur
e [M
pa]
20%40%60%80%
Fig. 32. Results of theoretical calculations for WWER tube burst pressure as a function of flaw length and flaw depth.
Fig. 33. Cutting tubes for removed steam generators for various investigations.
49

• Combination of all three previous methods. The best way for determination of burst pressure curve as a function of structural variable is to use several methods, and then through their comparison establish the most appropriate curve.
Every mentioned method for determination of structural variable has some advantages and disadvantages, which are briefly given in the Table 4. Table 4 Comparison of methods for determination of relationship between burst pressure and structural variable
Method Advantages Disadvantages Laboratory examination of tubes with relevant artificial degradation
1. Some sort of degradation mechanisms can be easily simulate on artificial way (thinning, wear, pitting) with EDM
2. Possibility of making really similar flaws regarding those from SG with artificial corrosion
3. Reliable results
1. It is not always possible to simulate real flaws especially in the cases of multiple flaw pattern (intergranular and transgranular SCC) even with use of artificial corrosion.
2. Can be expensive (depending of the scope of testing)
Laboratory examination of pulled tubes
1. Absolutely the most reliable data which can be obtained
1. Only tubes from the first row can be pulled out.
2. It is very difficult to collect representative sample with statistically significant number of flaws
3. Very expensive 4. High dozes for service
personnel Analytical method 1. Very cheap
Can be applied only on basic flaws like uniform material thinning, axial and circumferential flaws.
Numerical method 1. Cheap 2. Different shapes of flaws can be
easily modeled including multiple flaw patterns
3. Different conditions can be simulated simultaneously (pressures, temperatures, vibrations)
4. Great visual presentation (see Appendix 2)
It is not always possible to simulate real indication especially in the cases of multiple flaws pattern (intergranular and transgranular SCC)
The same approach has to be used for the determination of accident leakage rate versus tube integrity parameter. Regarding construction of curves based on laboratory tests, (empirical models) for both tubes with artificial flaws, as well as pulled tubes, the following issues have to be taken into consideration.
50

Development of empirical models should conform to principles of good statistical practice for purposes of establishing mean correlations and for quantifying the uncertainties associated with the mean correlation. Empirical correlations should reflect a statistically significant set of data so that uncertainties associated with the correlation can be quantified. Ideally, the data should be relatively uniform over the range of flaw sizes of interest. If the data set are relatively sparse over a portion of the flaw size range compared to another portion, standard statistical tests should be performed to ensure that the model parameters are not being unduly influenced by individual data in the sparsely populated portion of the flaw size range. Empirical correlations should be a reasonable fit of the data as evidenced by "goodness of fit" and residual analysis. Empirical models for burst pressure and leakage rate should explicitly account for data scatter and for model parameter (e.g., slope and intercept) uncertainties. Such models should involve a statistically significant correlation with flaw or indication size (e.g., a linear regression fit of the data can be shown valid at the P = 0.05 level). If such "significance of correlation" cannot be rigorously demonstrated for leakage rate models, the regression fit of the leak rate data as a function of flaw or indication size should be assumed to be a constant value. Empirical models for probability of leakage (POL), if used, should explicitly account for parameter uncertainty. On Figure 34 is given an example of POL curve.
0 2 4 6 8 10 12 14 16 18 20 22 24
Crack length (mm)
0.0
0.2
0.4
0.6
0.8
1.0
Pro
babi
lity
of le
akag
e P
OL
Fig. 34. Example of POL curve for the length of IGA/SCC cracks
For POL models, a number of functional forms may exhibit similar goodness-of-fit attributes; however, they may lead to significantly different results for a given flaw size. Thus, the functional form of the fit should be selected with care to ensure a conservative leakage assessment.
Each empirical model should be supported by a data management system that ensures data records are maintained, that all relevant data have been considered in the development of the model, and that models are periodically updated as additional relevant data become available.
51

When an empirical model for a specific flaw type is based on pulled tube or laboratory flaw data, the relevant data include all such data obtained for each plant and for the range of flaw sizes for which the empirical model will be applied. Test specimens should consist of pulled tube specimens, as practical, when the tube integrity parameter (e.g., burst strength, accident leakage rate) is being correlated with actual flaw size (e.g., flaw depth, flaw length, flaw volume). However, laboratory specimens (i.e., specimens with flaws induced in the laboratory by mechanical or chemical means simulating the flaw type of interest) may be used in lieu of or to supplement pulled tube specimens when the laboratory flaw can be expected to yield representative or conservative values of the tube integrity parameter for a given flaw size. Laboratory test systems, including the test apparatus, instrumentation, and procedures, for measuring burst pressure and leak rate must satisfy the requirements of referenced regulative (national, international). These systems should accommodate and permit measurement of as high a leak rate as may be practical, including leak rates that may be in the upper tail of the leak rate distribution for a given flaw size (e.g., length, voltage). The test systems should be evaluated for their accuracy, capabilities, and limitations as part of the test system qualification. The maximum and minimum measurable leak rates and the accuracy of the measured leak rates should be determined as a function of applied pressure. The maximum test pressure should be established, as well as available pressurization rates and the ability to hold reasonably constant pressure as a function of time. Attention should be paid to functional limitations that might impair the nominal measuring ranges, such as when the order of magnitude of the flow resistance of piping connections becomes comparable to that of the leaking section of the tube. It is useful to know the applied pressure at the flaw site as a function of leak rate when large leakage occurs. For example, the development or enlargement of through wall flaws during pressure testing can lead to large leak rates that prevent further pressurization. The pressure at the flaw location could then be significantly less than the pressure at the supply location. The actions necessary to produce a prototypic or conservative stress state at the flawed location, in terms of the stress components that have a dominant effect on burst at that location, should be considered in the application of a test system for a specific flaw type. The fact that primary membrane plus bending stress from sources other than the pressure differential across the tube may be present under the most limiting postulated accident plus SSE conditions should also be considered. This may be dealt with by including these loads as part of the test or by increasing the test pressure as necessary to produce a conservative test. Leakage rate data should be collected at temperature for the differential pressure loadings associated with the limiting postulated accident. Leakage tests at temperature should include pressure control to ensure single phase flow inside the tube prior to exiting through the flaw. The test pressure should be adjusted relative to the accident pressure value to account for pressure measurement uncertainty.
52

When it is not practical to perform hot temperature leak tests, room temperature leak rate testing may be performed as an alternative. However, the test pressure should be adjusted further as necessary to account for material property differences at temperature. In addition, thermal hydraulic adjustments to the leakage data should be performed to reflect at temperature conditions. Leakage tests, when it is not possible to reach and maintain the desired test pressure because of leakage through the flaw in excess of the test system capabilities, should not be treated as invalid tests. To do so would systematically exclude high leakage data from the data base, leading to a non-conservative bias in the empirical model. Burst testing may be performed at room temperature. Burst data and correlations should be adjusted as necessary to reflect material property values at temperature. Good example of construction of burst pressure versus EC indication depth function taking into account all previous mentioned consideration is given on Figure 33. Once when the burst pressure versus structural variable curve is established it can be directly used in the process of determination of plugging criteria, particularly for establishing structural integrity limit (see chapter 8 for details regarding plugging criteria, especially Figure 8.1-1). The way how the calculation has to be performed is as follows.
Notes:
• LLC98/99 means, that at probability level 0.98 99% of next (in a future) burst pressures will be above this line. • Downward arrows illustrate that the structural limit depends on the probability level and boundary conditions. For LLC95/95 and SG
operational condition (Δp = pprim – psec) the structural limit is 99% and for LLC98/99 and p=pprim (rupture of steam line) this limit is 82%.
Fig. 35. Burst test data and lower limit curves.
Let assume that in accordance with certain usually national regulations particular WWER tubes have to sustain differential pressure without bursting on the level of X times normal differential pressure between primary and secondary side or Y times differential pressure during accident conditions, whatever is higher. If we have burst pressure curve as a function
0
10
20
30
40
50
60
70
80
90
100
0 10 20 30 40 50 60 70 80 90 100
ECT indication [%]
Bur
st p
ress
ure
[Mpa
]
LLC98/99
LLC95/95
p=pprim
p=pprim-psec
53

of some structural variable (flaw depth or length or volume) then the process of establishing structural limit is presented on Figure 36. Tube burst pressure as a function of structural variable S YPa XPn Pa Pn SYa SXn Sa Sn Structural integrity Variable S
Fig. 36. Use of burst pressure curve for establishing structural limit.
S = Variable which is a measure of maintenance of structural integrity Sn = Value of variable S which keep structural integrity of tube
under pressure difference during normal operation Sa = Value of parameter S which keep structural integrity of tube
under pressure difference during accidental condition Pn= Pressure difference during normal operation Pa= Pressure difference during accident condition
SYa= Value of variable S which keep tube structural integrity during accidental condition with safety factor of Y
SXn= Value of variable S which keep tube structural integrity during normal operation with safety factor of X
Because in this example YPa>XPn, Sya will be used as a structural integrity limit.
Here has to be noted that calculation of loads on steam generator tubes is basically complex tasks because not only differential pressure has to be taken into account. Also the bending loads, thermal and seismic loads, etc. have to be evaluated and included in calculations of structural integrity limit in the cases where their magnitude is of significance.
4. PERFORMANCE CRITERIA
4.1. Structural Performance Criteria Structural performance criteria can be established through deterministic or probabilistic calculations. Usually it is a good idea that both types of criteria be determined and used for operational assessments as well as for condition monitoring.
54

4.1.1. Deterministic structural performance criteria The deterministic structural integrity performance criterion can be defined as follows: WWER steam generator tubing shall retain structural integrity over the full range of normal operating conditions (including start up, operation in the power range, hot standby, and cool-down and all anticipated transients included in the design specification) and design basis accidents. This includes retaining a safety factor against burst under normal steady state full power operation and a safety factor against burst under the limiting design basis accident in accordance with relevant regulations (for example national regulation or if it does not exist with international regulations (IAEA) or main designer recommendations). The structural performance criterion is based on ensuring that there is reasonable assurance that a steam generator tube will not burst during normal or postulated accident conditions. It has to be pointed out the tube integrity assessments has to take into account inputs variability and uncertainties with the aim to provide a conservative assessment of the condition of the tubing relative to the performance criteria. In addition to the use of safety factors, the integrity evaluation shall verify that the primary pressure stresses not exceed the yield strength for the full range of normal operating conditions as described in the performance criteria. Additionally, all appropriate loads contributing to combined primary plus secondary stress shall be evaluated so as to ensure that these loads do not significantly reduce the burst pressure for the full range of normal operating conditions including postulated accidents. 4.1.2. Probabilistic structural performance criteria Probabilistic structural performance criteria may be used as an alternative to the use of deterministic criteria. Usually for WWER steam generators such criteria do not exists either in national regulative or in the main designer documentation, so in this document the probabilistic criteria picked up from PWR steam generators are given. These values, of course, are only for reference and in the future they will need approval through adequate calculations and analysis with integrated specifics of WWER steam generator design and their operational experience. Proposed probabilistic criteria should not exceed the following:
1. The frequency of WWER steam generator tube bursts that occur as spontaneous, initiating events under normal operating conditions should not exceed 2.5x10⁻³ per reactor-year.
2. The conditional probability of burst of one or more tubes under postulated accident
conditions should not exceed 2.5x10⁻². 4.2. Operational Leakage Performance Criteria Operational leakage performance criteria are limit which is established for every nuclear power plant and it is part of their “Technical Specifications” document.
55

Operational leakage performance criteria are a matter of national regulation and can vary a lot from one country to the other. Here are three examples: Russian practice The operational leakage performance criterion is in accordance with main designer requirements. The reactor coolant system operational primary-to-secondary leakage through any one steam generator shall be limited to 4 kg per hour. In the case that leakage is constant on that level the nuclear power plant has 24 hours to go to shutdown. If the level of leakage is greater than 5 kg per hour nuclear power plant has to go immediately to shutdown. Hungarian practice These criteria can be much more complex. For example, the operational leakage performance criteria are the following: Reactor has to go to forced shutdown:
• If leak in one steam generator amounts to 5 dm3/h and more
• If radioactivity of blow down water of all steam generators by isotopes K-42 and Na-24 reaches 4000(Bq/ dm3)
• If radioactivity of water in one steam generator reached the value of 10 (Bq/ dm3)
• If radioactivity in water of main condenser reached value of 10 (Bq/ dm3) or tritium activity of 1000 (Bq/ dm3)
• If radioactivity in water of cool down system (main steam line, cooling system, feed water system) reached value of 10 (Bq/dm3) or tritium activity of 1000 (Bq/dm3)
Finish practice Reactor has to go to forced shutdown:
• If leak in one steam generator amounts to 2 l/h and more, and
• If leak in one steam generator is greater than 1 l/h the operational personnel has to start investigation about causes of leak.
4.3. Accident Leakage Criteria The accident-induced leakage performance criterion is:
The primary to secondary accident induced leakage rate for the limiting design basis accident, other than a steam generator tube rupture, shall not exceed the leakage rate assumed in the accident analysis in terms of total leakage rate for all steam generators and leakage rate for an individual steam generator. This limit for the USA is 226.8 l/h per steam generator during accident conditions. Presently no data of this kind is available for VVER 1000 steam generators. The pressure and temperature conditions used in the determination of the accident induced leakage rate shall be consistent with the conditions assumed in the accident analysis.
56

Primary-to-secondary leakage is a factor in the dose releases outside containment resulting from a limiting design basis accident. The potential primary-to-secondary leak rate during postulated design basis accidents must not exceed the offsite radiological dose consequences required by referenced regulation.
5. CONDITION MONITORING Condition monitoring involves monitoring and assessing the as found condition of the tubing relative to the tube integrity performance criteria. The as found condition refers to the condition of the tubes during a WWER steam generator inspection outage, prior to any plugging or repair of tubes. Failure of one or more tubes to satisfy the performance criteria may be indicative of programmatic deficiencies in the plant program for monitoring and maintaining steam generator tube integrity. For an unscheduled inspection that is due to primary-to-secondary leakage, the condition monitoring assessment need only address the flaw type that caused the leak provided the interval between scheduled inspections is not lengthened. However, it will be necessary to estimate the contribution of accident leakage from the other active flaw types, as determined from the most recent operational assessment for these flaw types, to demonstrate that performance criteria for accident leak rate is met. 5.1. Condition Monitoring of Structural Integrity Tube structural integrity may be monitored against the deterministic structural performance based on the results of in-service eddy current inspection for each flaw type. Tube structural integrity may be demonstrated by analysis for a given flaw type if the eddy current technique and eddy current personnel are validated for sizing with respect to that flaw type in accordance with referenced standards in the plant country. The analysis approach involves demonstrating that the most limiting flaws associated with each flaw type, as determined from in-service inspection, do not exceed the appropriate structural limit for each flaw type. Structural limit refers to the calculated maximum allowable flaw size consistent with the safety factor performance criteria. The analysis should account for all significant uncertainties so that an indication measured by in-service eddy current inspection to be at the structural limit satisfies the performance criteria with a probability of 0.95 evaluated at 50% confidence.
Conservative bounding models and assumptions should be employed to account for uncertainties not directly treated in the assessment. Potential significant sources of uncertainty include error or variability of eddy current indication size measurement, material properties, and structural models. Structural models (i.e., models relating burst pressure to actual flaw size or to measured indication size) may be empirical or analytical (i.e., idealized models based on engineering mechanics).
57

Empirical models quantify significant model uncertainties such as burst pressure data scatter and the parameter uncertainty of the empirical fit. Analytical models generally do not explicitly quantify uncertainties in the model estimates and, thus, should be developed to produce bounding estimates. The conservatism of analytical models should be confirmed by test. For certain flaw types, analytical approaches to demonstrating tube integrity may be inappropriate or inefficient because of an inability to size certain flaw dimensions, large error or variability associated with indication size measurements, or large uncertainties of the structural models. These difficulties may necessitate bounding approaches to ensure a conservative analysis, but they may lead to unrealistic (overly conservative) results. Other approaches are also possible, which may provide a more realistic assessment and may be used as an alternative to, or as a supplement to, the above analytical approach for a given flaw type to demonstrate structural integrity in accordance with the performance criteria, but they have to be first justified. Considerations for monitoring tube structural integrity against the probabilistic performance criteria should include the following for a given flaw type:
• Probabilistic approach should only be used when in-service inspection techniques and personnel are validated for detection and sizing in accordance with referenced regulations.
• The as-found frequency distribution of indications as a function of indication size should be established. The as-found distribution should be adjusted to consider the percentage of tube locations sampled to address the subject flaw type. The uncertainty of the as-found frequency distribution is characterized by consideration of indication size measurement error or variability.
• Empirical models for burst pressure as a function of flaw size or indication size should be established. These models for burst pressure or failure load should account for data scatter and model parameter uncertainties.
• The probability of burst calculation should account for uncertainties in indication size measurement error or variability, material properties, and in the burst pressure model with rigorous statistical analyses. Statistical sampling methods such as Monte Carlo have to be used.
• The frequency of burst and conditional probability of burst estimates should be expected (mean) value estimates.
The appendix gives one example of calculation of conditional monitoring limit determination thru wall axial flaws on Inconel 600 tubes. 5.2. Condition Monitoring of Operational Leakage Primary-to-secondary operational leakage monitoring is an important defence-in-depth measure that can assist plant operators in monitoring tube integrity during operation. Leakage monitoring also gives operators information needed to safely respond to situations in which tube integrity becomes impaired and significant tube leakage, rupture, or burst occurs. The objectives of leakage monitoring are (1) to provide clear, accurate, and timely information on operational leakage to allow timely remedial actions to be taken to prevent
58

tube rupture and burst and (2) to provide clear, accurate, and timely information to facilitate the mitigation of any tube rupture or burst event. Although leak-before-break cannot be totally relied upon for steam generator tubes, primary-to-secondary leakage monitoring can afford early detection and response to rapidly increasing leakage, thereby serving as an effective means for minimizing the incidence of SG tube rupture and burst. This can be achieved by having near real-time leakage information available to control room operators. Use of such monitoring capability, along with appropriate alarm set points and corresponding action levels, can help operators respond appropriately to a developing situation in a timely manner. The monitoring program should account for plant design, steam generator tube degradation, and previous leakage experience. 5.3. Condition Monitoring of Accident Leakage The potential primary-to-secondary leakage rate for the most limiting postulated design basis accident should be assessed, based on the as-found condition of the WWER steam generator tubing, to confirm that the performance criteria for accident-induced leakage were met immediately prior to the outage. The potential leak rate may be determined by analysis, based on the results of in-service eddy current inspection. The potential leak rate may be determined by analysis for a given flaw type provided the eddy current technique and eddy current personnel have been validated for sizing in accordance with referenced regulations. The potential accident-induced total leak rate should be an upper 95% quartile estimate (one-sided) evaluated at 50% confidence, based on quantitative consideration of uncertainties affecting the estimate. Conservative bounding models and assumptions should be employed to account for uncertainties not directly treated in the assessment. Key elements of a condition monitoring accident leakage assessment by analysis should include the following for each flaw type.
• The as-found frequency distribution of indications for each active flaw type is established as a function of indication size. The distribution should be adjusted statistically to consider the percentage of tubes sampled to address the subject flaw type.
• Models relating the magnitude of leakage rate as a function of actual flaw size or eddy
current indication size measurement for each flaw mechanism are established.
• The leakage calculation for each flaw and for total steam generator leakage rate is performed deterministically or probabilistically (e.g., with statistical sampling methods such as Monte Carlo), accounting for all significant uncertainties. Potential sources of uncertainty include eddy current indication size measurement error or variability, material properties, and leakage models. Leakage models may be empirical or analytical (i.e., idealized models based on engineering mechanics). Empirical models should quantify significant model uncertainties such as data scatter and the parameter uncertainty of the empirical fit. Analytical models generally do not
59

explicitly quantify uncertainties in the model estimates and, thus, should be developed to produce bounding estimates. The conservatism of analytical models should be confirmed by test.
6. OPERATIONAL ASSESSMENT
An operational assessment should be performed to demonstrate that the performance criteria will continue to be met until the next scheduled steam generator in-service inspection. The length of the operating cycle prior to the next scheduled inspection and the tube plugging or repair criteria should be adjusted as necessary to meet this objective. Generally it will be necessary to perform at least a preliminary assessment prior to performing tube plugging or repairs to ensure that the tube repair criteria being implemented are sufficient to support operation for the planned operating interval preceding to the next scheduled steam generator inspection. 6.1. Operational Assessment of Structural Integrity Reasonable assurance that tube structural integrity will continue to be adequately maintained is established by demonstrating that the projected condition of the most limiting tubes immediately prior to the next scheduled inspection satisfies the deterministic criteria for each flaw type. Conceptually, this involves demonstrating that the projected limiting flaw sizes or indication sizes do not exceed the appropriate "structural limit" for each degradation mechanism. Equivalently, this can involve demonstrating that the projected limiting flaws for each flaw type will exhibit burst-strength capacities. The assessment methodology should account for all significant uncertainties so that, should the most limiting projected flaw or indication size be at the calculated structural limit immediately prior to the next scheduled inspection, the flaw or indication satisfies the performance criteria with a probability of 0.95 evaluated at 95% confidence. The assessment methodology may be performed deterministically or probabilistically (e.g., with statistical sampling methods such as Monte Carlo). Conservative bounding models and assumptions should be employed to account for uncertainties not directly treated in the assessment. Potential sources of uncertainty include significant uncertainties associated with the projected limiting flaw or indication size, material properties, and structural model. General considerations for projecting the most limiting flaw sizes associated with each flaw type, including the uncertainty associated with these projections, include the following:
• The frequency distribution of indications left in service as a function of indication size
• The frequency distribution of indications (as a function of indication size) found during the most recent past inspection of tubes that were not repaired or plugged at that time and that are not being inspected during the current inspection
• The frequency distribution of flaw or indication growth rates as a function of indication size
• The rate and size distribution function of new indications as a function of time between inspections
60

• The probability distribution of eddy current sizing error or variability
• The level of sampling performed during the current inspection and date of last inspection for un-inspected tubes.
Note that the above considerations for projecting the limiting flaw or indication size are based on the premise that eddy current technique and personnel are validated for sizing for the subject flaw type. If this is not the case, alternative or conservative bounding approaches must be taken. The evaluation of the performance of the predictive methodology in projecting the maximum flaw or indication size should be based on the results of future in-service inspections and appropriate adjustments made to the methodology as necessary to ensure this objective is met. Structural models (i.e., models relating burst pressure to flaw or indication size) may be empirical or analytical (i.e., idealized models based on engineering mechanics). Empirical models should quantify significant model uncertainties such as burst pressure data scatter and the parameter uncertainty of the empirical fit. Analytical models generally do not explicitly quantify uncertainties in the model estimates and, thus, should be developed to produce bounding estimates. The conservatism of analytical models should be confirmed by test. For certain degradation mechanisms, operational assessment methodologies may be inefficient because of an inability to size certain flaw dimensions, large error or variability associated with flaw or indication size measurements, or large uncertainties of the structural models. These difficulties may necessitate bounding approaches to ensure a conservative analysis. However, the development of eddy current techniques with good probability of detection and sizing performance and more precise structural models is key to ensuring a realistic operational assessment and avoiding unnecessary corrective actions (including operational restrictions). Considerations for performing the operational assessment against the probabilistic performance criteria structural integrity should include the following for a given flaw type.
• The probabilistic approach should only be used when in-service inspection techniques and personnel are validated for detection and sizing.
• The calculation of the frequency distribution of flaws or indications should be by the size projected to exist immediately prior to the next scheduled inspection. The specific details for projecting the distribution of flaw or indication sizes are to be developed by licensees. The performance of the predictive methodology that projects a distribution that results in a conservative estimate of conditional probability of burst should be evaluated based on the results of future in-service inspections and appropriate adjustments made to the methodology as necessary to ensure this objective is met.
• The empirical burst pressure should be established as a function of flaw or indication size. These empirical models should account for data scatter and model parameter uncertainties.
• The projected distribution of flaw or indication sizes, the calculated frequency of burst, and the calculated conditional probability of burst during postulated accidents should include a rigorous statistical treatment of all significant sources of uncertainty
61

affecting the calculation, including growth rate, indication size measurement, and burst-pressure model. Statistical sampling methods such as Monte Carlo may be used.
• The frequency and conditional probability of burst should be evaluated at the one-sided, upper 95% confidence level.
6.2. Operational Assessment of Operational Leakage The same as described for condition monitoring in Section 5.2. 6.3. Operational Assessment of Accident Leakage The potential WWER steam generator primary-to-secondary leakage rate during the most limiting postulated accident (other than steam generator tube rupture) should be assessed relative to the performance criteria for accident leakage integrity, based on the frequency distribution of flaws or indications as a function of flaw or indication size projected to occur immediately prior to the next scheduled steam generator inspection outage. The calculated potential accident leakage rate should be an upper 95% quartile estimate (one-sided) evaluated at 95% confidence, based on quantitative consideration of uncertainties affecting the estimate. Conservative bounding models or assumptions should be employed to account for uncertainties not directly treated in the assessment. Considerations for establishing the magnitude of leakage for each flaw type as a function of flaw or indication size are the same as those identified in Section 5.3. For certain flaw types, operational assessment methodologies may be inefficient because of an inability to size certain flaw dimensions, large error or variability in the eddy current flaw or indication sizing measurements, or large uncertainties of the leakage models. These difficulties may necessitate bounding approaches to ensure a conservative analysis. However, the development of eddy current techniques with good POD and sizing performance and more precise structural models is a key to ensuring a realistic operational assessment and avoiding unnecessary corrective actions (including operational restrictions).
7. LOADINGS WHICH HAVE TO BE CONSIDERED FOR CONDITION MONITORING AND OPERATIONAL ASSESSMENT
For condition monitoring and operational assessment the following types of loadings should be considered:
1. Loadings associated with normal plant operation, including start up, operation in the power range, hot standby, cool down, as well as all anticipated transients (e.g., loss of electrical load, loss of offsite power) that are included in the design specifications for the plant.
2. Loadings and tube deformations imposed on the tube bundle during the most limiting
postulated design basis accidents. Dynamic loading considerations should be included in the evaluation. All major hydrodynamic and flow-induced forces should be considered.
62

The combination of loading conditions for the postulated accident conditions should be evaluated in accordance with the licensing basis and should include, but not necessarily be limited to, consideration of the following sources.
• Pressure differentials associated with loss of secondary system pressure • Loads caused by dynamic structural response of the steam generator
components and supports • Seismic loads • Dynamic loads for example during steam line break (SLB) • Others.
Some loads are to be reconsidered for each case because they can be neglected. For example if the circumferential cracks are not of interest, load which effect bending of tubes can be neglected.
8. TUBE PLUGGING CRITERIA 8.1. Deterministic Calculation of Tube Plugging Criteria The purpose of the plugging of WWER steam generator tubes is typically to remove degraded tubing from service, thereby redefining the reactor coolant pressure boundary. Unfortunately after eddy current inspection comparison of obtained results with the values derived from burst pressure/structural variable curve (see for details chapter 3.4) it is not possible to make conclusion whether or not tube structural integrity will be preserved up to the next outage or in some other time interval. This is possible only in the case if the obtained value is corrected by two important additional parameters, which are:
1. Measurement uncertainty of applied eddy current technique 2. Predicted progression to the next inspection (usually next outage) or some other
requested time interval. Taking into account previous parameters the general formula for determining plugging criteria which will assure maintenance of structural integrity in requested time interval can be written as given on Figure 37.
63

Fig. 37. Formula for determination of plugging criteria.
It should be noted that after making calculation of plugging criteria the obtained value is valid only for:
• Given condition from valid regulation • Particular degradation mechanism • Particular time interval to next ISI • Particular unit or steam generator • Particular EC equipment and EC personnel which is used up to current moment
The method on how to obtain Scritical and UECT were described in Sections 3.4 and 5.5 respectively. Next the precautions and advice on how to calculate ∆S are given. Flaw growth rates over the next inspection interval must be estimated for each flaw type for purposes of projecting flaw or indication sizes or size distributions expected to exist prior to the next scheduled inspection. The growth rate estimates can be based on in-service inspection results or on laboratory data and models. If the growth rate estimates are based on laboratory data and models, it should be shown that the test conditions for the laboratory tests are prototypical for the locations of interest or bound (i.e., are more aggressive) and for the conditions at the location of interest and that the models are conservative or bounding. The conditions that should be considered include primary and secondary water chemistry, crevice chemistry, residual and applied stresses, tube alloy microstructure, and operating temperature. The models may describe the flaw growth rates in terms of probability distributions provided that the model accounts for the upper tail of the measured or observed flaw growth rates.
64

If in-service inspection results are used, these growth rate estimates should be based on the in-service inspection results from the most recent inspection and the previous one or two inspections. The in-service inspection results for a given flaw type may be used where the eddy current techniques and personnel used to obtain these results were validated for sizing in accordance. Flaw growth rates should be evaluated on the basis of the change in indication size between inspections when there is a detectable indication during both inspections. These growth rates should be adjusted as necessary to reflect any increase or decrease in the length of the time interval between scheduled in-service inspections. For a given indication found during the latest inspection, the previous inspection results for the subject location should be evaluated, consistent with the eddy current data analysis procedure for the flaw type being evaluated. If the data analysis procedure employed during the previous inspection differ from those employed during the latest inspection, the previous data should be evaluated to the latest data analysis procedure. In addition, the previous data should be adjusted to compensate for differences in data acquisition procedures (including probes and equipment) to the extent there is a technical basis for doing so. When this is not possible, the locations of the indications (or a large sample of these locations) should be re-inspected using the previous data acquisition procedures so that results can be compared directly to the previous inspection results. It is desirable that the same analyst be used to evaluate the data from the latest and previous inspections for a given location for purposes of assessing incremental flaw growth. It is acceptable to supplement plant-specific growth data with applicable data from other units when plant-specific data is scarce for a given degradation mechanism. The data applied from other units should be consistent with or conservative with respect to available plant specific data regarding average and bounding growth rates. Other considerations concerning the applicability of data from other plants include, similarities in tube material microstructure and chemical composition, primary water chemistry in respect of ID indications, relevant design and manufacturing features (e.g., residual stress levels associated with tube expansions and bends), operating temperature, secondary water chemistry in respect of OD indications, chemical composition of tube deposits, thermal and hydraulic environment. It is acceptable to use a statistical model fit of the observed growth rate distribution to support operational assessments provided that the statistical model accounts for the upper tail of the observed distribution. When statistical sampling techniques are applied to the growth rate distribution (see real data for growth rate from one WWER 440 nuclear power plant on Figure 38), negative growth rate samples should be treated as zero growth rate (see Figure 39).
65

Fig. 38. Frequency distribution of depth progression (classes per 5%) recorded between two ISI’s on one WWER 440 nuclear power plant.
Fig. 39. Frequency distribution of depth progression (classes per 5%) recorded between two ISI’s on one WWER 440 nuclear power plant when minus values of progression were
replaced with zero progression.
Depth progression (%)
No
of in
dica
tion
0
5
10
15
20
25
30
35
-20 -15 -10 -5 0 5 10 15 20 25 30 35 40 45 50
Expected Normal Distribution
66

8.2. Probabilistic Justification of Maintaining Structural Integrity of WWER Steam Generator Tubes
After determination of all necessary parameters to maintain structural integrity of WWER steam generator tubes as described in previous paragraphs, one very significant question still remains. How does all this affect the safety of operation of nuclear power plant in normal and accident conditions from the probabilistic point of view? This can be estimated in two phases in the following manner based on the use of Monte Carlo method: Phase I - Determination of frequency distribution of structural integrity variable at the end of fuel cycle or in some cases multiple fuel cycles (SEOC). Process for determination of SEOC consists of the following steps:
1. Determination of frequency distribution of the structural integrity variable (depth, length, volume) or in other words indications at the beginning of the fuel cycle. The frequency distribution of indications as a function of indication size at the beginning of fuel cycle or cycles consists of two groups of indications. The first group consists of flaws found by in-service inspection that are being permitted to remain in service prior to plant restart and that may grow. The second group of indications consists of flaws that have not been detected by in-service inspection prior to plant restart. These indications have not been detected because either flaws are present but have not been detected by in-service inspection or flaws do not initiate until after plant restart. Failure of in-service inspection to detect flaws that are present can be due to either the subject tube has not been inspected at the flaw location or the tube has been inspected, but the flaw has not been detected because of eddy current technique or personnel limitations. Methodologies should be developed for each flaw type for estimation of frequency distribution of indications associated with the second group of indications (i.e., indications not detected during the current inspection). Estimations using these methodologies should be assessed versus the actual distribution of new indications found at the next inspection. These methodologies should be revised as necessary, based on the results of the comparative assessment. The estimated number and distributions of new indications should account for plant specific and applicable WWER steam generator experience and POD of applied eddy current inspection system.
2. Determination of distribution of progression of structural integrity variable between two successive inspections.
3. Determination of distribution of eddy current measurement uncertainties
4. Use of Monte Carlo computer program with the aim to establish distribution of structural integrity parameter at the end of the cycle (SEOC). Number of intervals for which Monte Carlo method is used can vary from 1000 to 100000, depending on the quality of the computer program as well as on the availability of high speed computer. In the text that follows this number will be called N.
The previous steps are demonstrated on Figure 40. Phase II - Determination of the probability that at the end of fuel cycle before next in-service inspection one or more indication will be equal or bigger in size than the value of structural limit defined by valid regulations (see seciton 3.5 for details).
67

After using Monte Carlo method we get N SEOC frequency distribution. Every one of these distributions represents results of eddy current inspection on next ISI or on ISI where the eddy current inspection is planned. These results have to be checked for the cases where:
Si ≥Scritical (i=1 or more) So the number of SEOC frequency distributions where the previous relation is valid divided by N gives us probability that our structural limit will be reached by degradation mechanism. If this number is too high in comparison with regulatory requirements or with international practice, the plugging criteria have to be changed or time interval to next eddy current inspection has to be reduced.
68

Fig. 40. Determination of frequency distribution of structural variable at the end of fuel cycle (SEOC). For demonstration purposes the results obtained on one real WWER 440 unit on previously described method is given in Figure 41 for various plugging criteria (30%, 40%, 50% 60%
Distribution of indications (represented by structural integrity variable like depth, length or volume) established with eddy
current inspection (without indications on tubes plugged before operation) (SBOC)
(SBOC) has to include also distribution of undiscovered indications (represented by structural integrity variable like depth,
length or volume) established using relevant POD curve.
Distribution of indications progression
(represented by structural
integrity variable like depth, length
or volume) established with
eddy current inspection on last
two ISI (∆S)
Frequency distribution of eddy current measurement uncertainties
(UEC)
=
+
Frequency distribution of structural variable at the end of
fuel cycle (SEOC)
Depth (%)
No
of in
dica
tions
0
20
40
60
80
100
120
140
160
10 20 30 40 50 60 70 80 90 100
5 7 9 11 13 15 17
0
4
8
12
16
20
24
-2 8 18 28 38 48
0
10
20
30
40
0 5 10 15 20 25
0
4
8
12
16
20
24
+
69

70% and 80%). The red circles describe average number of such indications obtained in 1000 simulations while blue and green circles describe maximum as well as minimum values. Such figure is an ideal tool for nuclear power management which has to decide which plugging criteria will be used. For this particular case it is obvious that plugging criteria up to 50% give small chance for reaching structural limit but for the use of higher plugging criteria this chance is very significant. For this particular case the use of plugging criteria up to 50% is advisable.
Fig. 41. Number of indications with depth greater than structural limit after interval of 1 year obtained by Monte Carlo method (1000 cases or intervals with EC inspections) on one
WWER 440 unit.
9. CONCLUSIONS
On the basis of the materials presented in previous sections the following conclusions are provided:
1. The general idea of proposed strategy in this document is to assure:
• Maintaining structural integrity of WWER steam generator tubes during normal operation and in accidental conditions enhancing operational safety and economy of operation.
• Establishing general methodology how previous goals can be achieved taking into account all relevant parameters and state of the art of non destructive techniques, methods of tube laboratory testing, statistical and analytical calculations related to fracture mechanics and stress strain determination, failure calculation, probability calculation, etc.
• Uniformity of general methodology for maintaining stream generator tube structure integrity between member states with WWER technology. The uniform methodology will assure prompt experience exchange and quicker
0
10
20
30
40
50
60
70
80
90
100
30 40 50 60 70 80
Plugging criteria Depth (%)
Num
ber o
f in
dica
tions
with
dep
th g
reat
er
than
Dep
th c
ritic
al
Av. valueMax. valueMin. value
70

improvement application of advanced technical solutions, inspection techniques, working procedures etc.
• Increasing knowledge related to maintaining structural integrity of WWER steam generator tubes which will have positive impact on decision making process related to operation of steam generators.
2. Advantages of this strategy in comparison with present WWER industry praxis are the
following:
• Less forced shutdowns due to steam generator tube leaks. • Better addressing of degradation processes which represents real danger to
structural integrity of tubes treating every type of degradation processes separately.
• Prompt addressing of new conditions in steam generator tubes and adopting general strategy to new conditions.
• In many cases smaller number of tubes for plugging without reducing safety level of operation.
• Increase in knowledge of steam generator tube behaviour related to degradation processes based on own research work but also based on sharing data and experience between WWER nuclear power plants.
• Ability of sharing data, research work, laboratory investigations and experience on the same platform between nuclear power plants on their common benefit.
3. Maintaining the structural integrity of steam generator tubes is a complex and
interdisciplinary task requiring involvement of different specialists such as: eddy current experts, material science experts, probabilistic calculation experts, statistical analysis experts, FEM and failure mechanics experts, chemistry control experts, etc. It is obvious certain level of expertise that need be available to utility.
4. Strategy for maintaining structural integrity of steam generator tubes has to be
established in the form of written program. The main parts of such program are given in Figure 2.1 and described in this document. Additionally, it has to be pointed out that in every program for keeping structural integrity of WWER steam generator tubes activities for discovering causes of degradation, as well as, measures for their partial or total mitigation have to be incorporated.
5. Maintaining structural integrity of WWER steam generator tubes is a dynamic process
which has to be performed at every outage taking into account the latest eddy current or any other new relevant information (for example from new pulled tube(s), forced shutdowns, operational events etc.). In other words, in accordance with terminology used in this document at every outage condition monitoring and operational assessment have to be performed. Based on the results of these actions the current structural integrity program has to be approved or changed.
6. The prerequisite for efficient structural integrity monitoring is the use of advanced
qualified eddy current inspection equipment, probes and inspection personnel. Without these an effective structural integrity monitoring is not possible. This means that every WWER nuclear power plan has to ensure that qualified equipment, probes and personnel are available for performance of regular inspections whose results are
71

input to structural integrity calculations. Use of non-qualified equipment, probes and personnel lead to poor quality data and results which consequently may lead to misinterpretation of real situation and ultimately jeopardize the nuclear power plant operation.
72

APPENDIX EXAMPLE OF CONDITION MONITORING LIMIT DETERMINATION IN USA
What follows is an example from a Western PWR with Alloy 600 TT tube material. Further details of the calculation and derivation of the formulas are in the SGMP Flaw Hand Book which is an EPRI Proprietary report. FREESPAN, THROUGH-WALL AXIAL CRACK This example considers a through-wall axial flaw in a straight leg (assume Alloy 600 thermally treated). Input Parameters
Tube Diameter (D) = 0.875 in.
Wall Thickness (t) = 0.050 in.
Tube Inner Radius (Ri) = 0.3875 in.
Tube Mean Radius (Rm) = 0.4125 in.
Material Strength (Sy + Su) = 137.56 ksi
Sigma Value for (Sy + Su), σ uy SS + = 6.3449 ksi
Pressure, 3 ΔPNOp/1.4 Pacc = 4.473 ksi (ΔPNop = 1491 psi)
NDE Technique Uncertainty in Length = 0.13 in. (from Technique Perf . Demo)
NDE Analyst Uncertainty = 0.06 in (from Analyst Qualifications)
Structural Limit
The SL from the EPRI SGMP Flaw Handbook is given by:
LSL =⎥⎥⎦
⎤
⎢⎢⎣
⎡⎟⎟⎠
⎞⎜⎜⎝
⎛−
+−− 06132.0
)(ln600.32418.2
tSSRP
tRuy
mBm (C-1)
= ( ) ⎥⎦
⎤⎢⎣
⎡⎟⎟⎠
⎞⎜⎜⎝
⎛−
××
−−× 06132.0050.056.137
4125.0473.4ln600.32418.2050.04125.0
= 0.492 in.
73

Condition Monitoring Limit Using Arithmetic Method
The CM limit from the EPRI SGMP Flaw Handbook is given by:
LCM = ( )
NDE
PMuy
mB
m Zb
bZtZSS
RP
btR
N
σσ
σ−
⎥⎥⎥⎥
⎦
⎤
⎢⎢⎢⎢
⎣
⎡ −+−+
2
1
3
ln1 (C-2)
where from the EPRI SGMP Flaw Handbook
b1 = 0.061319
b2 = 0.53648
b3 = -0.2778
Z is defined as the 95/50 tolerance factor and set equal to 1.645.
NDE uncertainty is defined as the square root sum of squares of the analyst and technique uncertainty:
NDEσ = 22ANALYSTTECHNIQUE σσ +
= 22 )06.0()13.0( +
= 0.143 in.
After plugging in the respective values:
LCM =
( )( ) 143.0645.1
53649.0
061319.0645.1050.03449.6645.156.137
4125.0473.4
ln2778.01050.04125.0 ×−
⎥⎥⎥⎥
⎦
⎤
⎢⎢⎢⎢
⎣
⎡ −+××−
×
×−NPσ
LCM = [ ] 235.0066.34268.0ln517.0 −+−NPσ
From EPRI SGMP Flaw Handbook,
NPσ = )RffRfRf(2RfRfR1s 323231321333
2322
2211 ++++++ (C-3)
s = 0.01715
R11 = 0.13643
R22 = 0.14081
R33 = 0.17452
74

R21 = - 0.13024
R31 = - 0.14613
R32 = 0.13181
f2 = tR
L2778.0b m3 ee
−λ =
f3 = tR
L2778.0
m
b2
m3 etR
L53648.0eb−
λ
⎟⎟⎠
⎞⎜⎜⎝
⎛=λ
Notice that since NPσ is a function of L by virtue of the expressions for f2 and f3, the above
two equations have to be solved iteratively. A spreadsheet was used for this purpose.
LCM = 0.143 in.
Condition Monitoring Limit Using Simplified Statistical Method
Simplified Statistical Method consists of doing a number of flaw length reduction calculations considering each uncertainty separately, and then combining them using the square root of the sum of the squares of each individual flaw length reduction to obtain the total maximum flaw length reduction.
Relational Uncertainty
In order to determine the flaw length reduction due to relational uncertainty, the material property and NDE uncertainties in Eq. C-2 are set equal to zero:
NP
L ε = ( )
⎥⎥⎥⎥
⎦
⎤
⎢⎢⎢⎢
⎣
⎡ −++
2
1
3
ln1b
bZtSS
RP
btR
NPuy
mB
m
σ
=
( )( )
⎥⎥⎥⎥
⎦
⎤
⎢⎢⎢⎢
⎣
⎡ −+××
×−53649.0
061319.0645.1050.056.137
4125.0473.4
ln2778.01050.04125.0
NPσ
= [ ]NPσ066.33857.0ln517.0 +−
Where
NPσ = )RffRfRf(2RfRfR1s 323231321333
2322
2211 ++++++
Again since NPσ is a function of L by virtue of the expressions for f2 and f3, the above two
equations have to be solved iteratively using a spreadsheet.
75

NP
L ε = 0.428 in.
NPε = 0.492 – 0.428 = 0.064 in.
Material Property Uncertainty In order to determine to determine the flaw length reduction due to material property uncertainty, the relational and NDE uncertainties in Eq. C-2 are set equal to zero:
m
L ε = ( )
⎥⎥⎥⎥
⎦
⎤
⎢⎢⎢⎢
⎣
⎡ −−+
2
1
3
ln1b
btZSS
RP
btR Muy
mB
m
σ
=
( )( )
⎥⎥⎥⎥
⎦
⎤
⎢⎢⎢⎢
⎣
⎡ −××−
×
×−53649.0
061319.0050.03449.6645.156.137
4125.0473.4
ln2778.01050.04125.0
= 0.440 in.
εm = 0.492 – 0.440 = 0.052 in.
NDE Uncertainty
In order to determine to determine the flaw length reduction due to NDE uncertainty, the relational and material property uncertainties in Eq. C-2 are set equal to zero:
NDE
Lε = ( )
NDEuy
mB
m Zb
btSS
RP
btR σ−
⎥⎥⎥⎥
⎦
⎤
⎢⎢⎢⎢
⎣
⎡ −+
2
1
3
ln1
=
( )( ) 143.0645.1
53649.0
061319.0050.056.137
4125.0473.4
ln2778.01050.04125.0 ×−
⎥⎥⎥⎥
⎦
⎤
⎢⎢⎢⎢
⎣
⎡ −××
×−
= 0.257 in.
εNDE = 0.492 – 0.257 = 0.235 in.
Therefore
CM Limit = LSL - 222 )()()( NDEmPNεεε ++ (C-4)
= 0.492 - 222 )235.0()052.0()064.0( ++
= 0.243 in.
76

Growth Growth is not considered for through wall cracks because tubes with through wall cracks must be repaired or plugged prior to returning the steam generator to service. Monte Carlo Analysis Although the prospect of performing a Monte Carlo analysis may at first seem daunting, in many situations it is the easiest approach to take. The availability of a spreadsheet program like Excel™ actually makes the simulation approach quite easy and straightforward. The Monte Carlo approach consists of simply simulating the distribution of the calculated burst pressures and finding the length that results in the ordered 5th percentile value, the lower 95th percentile, being equal to the criterion value. There are four random variables that need to be simulated in the Monte Carlo analysis. These are the technique and analyst uncertainty in the length measurement, the variation associated with the material properties, and the prediction error associated with the regression equation. The burst pressure, PB, is calculated many times using the following equation,
)( 3221
13
MMPtR
ZLb
mB ZSZebb
RtP
N
m
L
σ+⎥⎥⎦
⎤
⎢⎢⎣
⎡σ++=
σ+
(C-5)
where Z1 through Z3 are independent random values drawn from a standardized normal distribution. Note, use of the Student’s t distribution for the relation and material variations would be more precise, but is not necessary because of the large number of data used to establish the parameters being simulated. The simulated burst pressures are put in ascending order and the 95th percentile at 50% confidence is the 5th percentile value, i.e., for N simulations the 5th percentile is the value of the 0.05·N entry. A simple simulation of 1000 values, the length that makes the 100th ordered value equal to the critical value is the critical measured length. The procedure for performing a Monte Carlo analysis was programmed onto an Excel™ spreadsheet. For this example there are four variables for which uncertainties are simulated and the number of simulations was selected to be 1000. To perform the simulation, four arrays of 1000 random normal numbers each are generated. These are then arranged in random order and 1000 values of the burst pressure for a specified length are calculated using the first element of each array, then the second element of each array, etc. In the spreadsheet these are arranged in the order of calculation. The first column is used as an index and simply contains the ordered set of numbers, i, from 1 to 1000 corresponding to the rows of the arrays. To minimize the variance of the Monte Carlo results, and hence require fewer simulations, a technique known as Latin Hypercube simulation was employed. The process is applied to the generation of the arrays of random normal numbers. The random number generator in Excel is called RAND and returns a number between 0 and 1. This is treated at a cumulative probability value and the inverse of the normal distribution function is used to find a random normal deviate. In Excel the function is called NORMSINV. It returns a normal deviate, Z, given a cumulative probability as its argument. For example, if the random number, U, from RAND is 0.05, then NORMSINV (U) returns –1.645. This corresponds to the 5th percentile of the distribution being less than the mean value minus 1.645 times the standard deviation of
77

the distribution. To assure a proper distribution of the random numbers, they are stratified according to the number of simulations to be performed, i.e., the following formula is used in Excel to generate each of the arrays of N random numbers.
⎟⎠⎞
⎜⎝⎛ +−
=N
iZi()RAND1NORMSINV , (C-6)
where i ranges from 1 to N, 1000 for the example. For N of 1000, this means the first random number is uniformly distributed in the stratum between 0.000 and 0.001, the second between 0.001 and 0.002, until the last is randomly distributed between 0.999 and 1.000. Hence, the entire CDF is represented, but randomly distributed within each stratum. In order to assure a random combination of the individual arrays, they are sorted into a random order before use. The same end could be achieved by sorting the indices, the i’s, in random order before applying the above formula. It is noted that once the four independent arrays have been generated they can be saved for other use, i.e., they do not have to be recalculated for every simulation. The first two random normal distribution arrays are used to calculate 1000 random values of the length, Li, from a measured value of the length, LX, as,
1000,...,1 where, 21 =σ+σ+= iZZLL LAiLTiXi . (C-7)
The random lengths are then used with the third array of random normal numbers to calculate 1000 random values of the normalized burst pressure,
N
iPi
LgNi ZebbP σ321
3 ++= , (C-8)
Where
( )tSSRPP
uy
mBiNi += (C-9)
Finally, the random values of the normalized burst pressure are used to calculate 1000 random values of the burst pressure as,
( )MiMm
NiBi ZSRtPP σ+= 4 .
The array of burst pressures is then sorted in ascending order with the 100th value being the lower 5th percentile or a 95th percentile lower bound value. The calculation is repeated for several lengths until the length is found that returns the desired burst pressure as the 100th element in the sorted burst pressure array.
78

The performance of a Monte Carlo analysis versus the Arithmetic and Simplified Statistical analyses are illustrated in Figure C-1 for a wide range of burst pressures. It is noted that although the Monte Carlo analysis may seem more difficult, once the order of the columns in the spreadsheet are determined it is rather simple to do. Hence, the use of a commercial spreadsheet and the Monte Carlo simulation should certainly be considered as a preferred way to perform the analysis. In fact, once the random numbers are available, it is not much harder than the simplified analysis. �
Condition Monitoring Throughwall Crack Burst Acceptance LimitsUncertainties in Relation, Material Strength & Measurement
0.000
0.100
0.200
0.300
0.400
0.500
0.600
2.500 2.700 2.900 3.100 3.300 3.500 3.700 3.900 4.100 4.300 4.500
Primary-to-Secondary Pressure Difference, ΔP (ksi)
Cri
tical
TW
Cra
ck L
engt
h, L
(in.
)
Monte Carlo SimulationSimplified StatisticalArithmetic Analysis
(Sy + Su) / 2 = 68.78 ksiStd. Dev. = 3.172 ksi
95.0 %Probability at 50.0 % Confidence
7/8" diameter by 0.050" thick SG Tubes.
�
Fig. C-1. Burst pressure as a function of critical crack length for the three methods.
79


REFERENCES [1] BEHRAVESH, M., ALTO, P., “Role of NDE in in integrity assessment of steam
generator tubes”, Transactions of the 17th International Conference on Structural Mechanics in Reactor Technology (SMIRT 17) Prague, Czech Republic, August (2003).
[2] NEI 97-06 [Rev 1], “Steam Generator Programme Guidelines”, January (2001). [3] NUCLEAR REGULATORY COMMISSION, Draft 1074, “Steam Generator Tube
Integrity”, Office of the Nuclear Regulatory Research, U.S. NRC, Washington, DC, December (1998).
[4] ŠPLICHAL, K., BURDA, J., “WWER steam generator Tube Corrosion Damage and Methodology of Pulled Tube Assessments”, Nuclear Research Institute Rež plc. DITI – Nr. 302/116, February (2002).
[5] BODOK, K., DOCZI, M., TAKACS, G., OSZVALD, F., “Investigation of Defects on Steam Generator Heat Exchanger Tubes at Paks NPP”, Report for 2002-2003, IAEA Research Contract No. 11593/R1/RBF (2003).
[6] BODOK, K., DOCZI, M., TAKACS, G., OSZVALD, F., “Investigation of Defects on Steam Generator Heat Exchanger Tubes at Paks NPP”, Report for 2001-2002, IAEA Research Contract No. 11593/R1/RBF (2002).
[7] TRUNOV, N.B., “Assessment of SG Tubing Integrity”, Gidropress presentation on 1st CRP meeting, Vienna, 7-10 May (2001).
[8] BAKIROV, M.B., TRUNOVE, N.B., KORNIENKO, K.A., “Progress report on work carried out under Reseach Contract No. 11595/RO jointly by VNIIAES and OKB Gidropress” in period 2002-2003”, Gidropress presentation on 1st CRP meeting, Vienna, 7-10 May (2001).
[9] SPIEGEL, M.R., STEPHENS, L.J., “Schaum's Outline of Theory and Problems of Statistics”, 3d ed. New York: McGraw-Hill, See "Sampling Theory of Correlation" on page 317, and the solved problems on pages 336-337 (1999).
[10] STANIC, D., NADINIC, B., “Evaluation of WWER Steam Generator Tube Integrity by Application of FEM and FM principles”, Report for first year IAEA Research Contract No. 11590/R0/Regular Budget Fund (2002).
[11] STANIC, D., NADINIC, B., “Evaluation of WWER Steam Generator Tube Integrity by Application of FEM and FM principles”, Report for year 2003 IAEA Research Contract No. 11590/R0/Regular Budget Fund (2003).
[12] PAPP, L., “Sources of uncertainties for plugging criteria determination”, .Division of Integrity and Technical Engineering, Nuclear Research Institute Rez Plc, Czech Republic, presentation on 2nd CRP meeting (2002).
[13] ŠPLICHAL, K., HORAČEK, L., ŽDAREK, J., “Integrity assessment of WWER Type SG Tubes“, Nuclear Research Institute Rez. Plc, Division of Integrity and Technical Engineering, Czech Republic, presentation on 1st CRP meeting (2001).
[14] BAKIROV, M.B., “Offers on evolution of the research program of SG HET specimens with real operational defects” (2001).
[15] NUCLEAR REGULATORY COMMISSION, "An Approach for Using Probabilistic Risk Assessment in Risk-Informed Decisions on Plant-Specific Changes to the Licensing Basis," Regulatory Guide 1.174, Office of the Nuclear Regulatory Research, U.S. NRC, Washington, DC July (1998).
81


GLOSSARY
accident induced leakage: The primary-to-secondary leakage occurring during postulated accidents other than a steam generator tube rupture. This includes the primary-to-secondary leakage existing immediately prior to the accident plus additional primary-to-secondary leakage induced during the accident. active damage mechanism: A combination of one or more, new indications of degradation (≥ 20 % tube wall) and previous indications of degradation which display an average growth rate equal to or greater than 25 % of the repair limit per cycle in any one SG, or One or more new or previously identified indications of degradation, including cracks, which display a growth rate greater than or equal to the repair limit in one cycle of operation. bulge: A local increase (plastic deformation) in the tube diameter. burst: The gross structural failure of the tube wall. The condition typically corresponds to an unstable opening displacement (e.g., opening area increased in response to constant pressure) accompanied by ductile (plastic) tearing of the tube material at the ends of the degradation. chatter: Variations of the tube wall thickness. condition monitoring: A comparison of the as-found inspection results against the performance criteria for structural integrity and accident leakage. Condition monitoring assessment is performed at the conclusion of each operating cycle. condition monitoring limit: The limiting magnitude of a degradation measurement scale, such that the tube section satisfies the applicable performance criteria. critical area: An area of steam generator tubing which, on the basis of inspection results, engineering evaluation and related experience, is defined by the type of degradation, the cause of degradation, and the boundary of degradation.
83

defective tube: A tube that contains an indication which exceeds the repair limit. dent: A local reduction (plastic deformation) in the tube diameter due to a buildup of corrosion products (magnetite). degradation: A reportable indication 20% through wall or greater, or 50% of the repair limit for length-based or voltage-based criteria. degradation-specific repair criteria: Repair criteria developed for a specific degradation mechanism and/or location, e.g., degradation specific repair criteria for pitting at tube support plates. ding: A local reduction (plastic deformation) in the tube diameter caused by manufacturing, support plate shifting, vibration or other mechanical means. essential variables: The physical, mechanical, electrical or chemical, properties of the entire examination system which may vary or be varied and must to be controlled or kept constant to ensure an expected examination response. extraneous test variables: Signal sources such as denting, deposits, support structures, geometry changes and tubing essential variables which influence the test results. fatigue: Material failure resulting from the initiation and/or propagation of cracks due to cyclic loads. fill-factor: A measure of the degree to which a bobbin coil fills a tube. Specifically, the ratio of the square of bobbin coil outside diameter to the square of the tube inner diameter. intercrystalline corrosion: See intergranular corrosion. intercrystalline cracking: See intergranular cracking.
84

intergranular: Between crystals or grains. Also called intercrystalline. Contrast with transgranular.
intergranular attack (IGA): Corrosive attack of grain boundaries in materials with no preferential (stress-related) orientation. intergranular corrosion: Corrosion occurring preferentially at grain boundaries, usually with slight or negligible attack on the adjacent grains. Also called intercrystalline corrosion. intergranular cracking: Cracking or fracturing that occurs between the grains or crystals in a polycrystalline aggregate. Also called intercrystalline cracking. Contrast with transgranular cracking. intergranular fracture: Brittle fracture of a metal in which the fracture is between the grains, or crystals, that form the metal. Also called intercrystalline fracture. Contrast with transgranular fracture. intergranular stress-corrosion cracking (IGSCC): Stress-corrosion cracking in which the cracking occurs along grain boundaries. lift-off: The distance between a test coil and the test object surface. Variations in lift off cause variations in the output signal. limiting accident: An accident that results in the largest differential pressure across the steam generator tubes, normally a main steam line or main feedwater line break. lower tolerance limit: A value or event that would be expected to occur with a probability of P and confidence level of C. For example, a 90%/50% lower tolerance limit for material strength means a 50% confidence that ≥90% of the population of yield strengths are greater than the specified lower tolerance limit. magnetite: Carbon steel corrosion products.
85

multi-parameter eddy current: A signal processing method that vectorially combines multiple frequency eddy current data in order to suppress extraneous test variables. multiplexing: The time-sharing of an information source with a common output. NDE measurement parameter: A variable used to assess degradation severity, such as voltage, crack length, depth etc. non destructive testing (NDT): Examination of material without affecting its structural integrity. Sometimes, NDE is interchangeably used. normal operating pressure differential: The pressure differential across the tubing during normal full power operation. operational assessment: Forward looking prediction of the steam generator tube conditions that is used to ensure that the structural integrity and accident leakage performance criteria will not be exceeded during the next cycle. The operational assessment needs to consider factors such as NDE uncertainty, indication growth, and degradation-specific repair limits. operational assessment limit: The value of a degradation parameter such that a tube with greater degradation would not meet the performance criteria at the end of the next operating period. Also referred to as a repair limit. permeability: Condition where the test coil impedance changes due to a change in the tubing material’s inherent ability to conduct magnetic flux lines. performance criteria: Criteria to provide reasonable assurance that the steam generator tubing has adequate structural and leakage integrity such that it remains capable of sustaining the conditions of normal operation, including anticipated operational occurrences, design basis accidents, external events, and natural phenomena. pitting: Localized attack on tubing resulting from non-uniform corrosion rates caused by the formation of local corrosion cells.
86

pitting factor: Ratio of the depth of the deepest pit resulting from corrosion divided by the average penetration as calculated from weight loss. plastic deformation: The permanent (inelastic) distortion of metals under applied stresses that strain the material beyond its elastic limit. plasticity: The property that enables a material to undergo permanent deformation without rupture. pH: A measure of the acidity or alkalinity of a solution; the negative logarithm of the hydrogen-ion activity; it denotes the degree of acidity or basicity of a solution. At 25C (77F), 7.0 is the neutral value. Decreasing values below 7.0 indicate increasing acidity; increasing values above 7.0, increasing basicity. primary water stress corrosion cracking: Stress corrosion cracking on the reactor coolant side (inside) of steam generator tubes. probabilistic approach: An approach that uses probabilistic simulations, e.g., Monte Carlo simulations, to determine appropriate limits. Probability of Burst (POB): The relative frequency of gross structural failure of a steam generator tube under a postulated loading condition. probability of detection (POD): Probability of Detection (POD) is a measure of NDE performance and is defined as the likelihood that a NDE system will detect a flaw. POD may be expressed as a function of the severity of degradation. For this case, POD is typically calculated by comparing destructive examination results with the predictions of the eddy current inspection (found or missed). Alternatively, POD may be expressed as a fraction of the total population of flaws that would be detected by the NDE system. profilometry: A process by which a transverse cross-section of a tube diameter is determined.
87

repair limit (plugging criteria): Those NDE measured parameters at or beyond which the tube must be repaired or removed from service by plugging. It is also referred to as the operational assessment limit. steam generator degradation-specific management (SGDSM): The use of inspection and/or repair criteria developed for a specific degradation mechanism, e.g., outside diameter stress corrosion cracking at tube support plates. structural limit: The limiting degradation parameter such that a tube measured with such degradation, with no NDE uncertainty, will satisfy the performance criteria based on nominal tube material properties and dimensions, and the nominal predictions of a regression curve. sludge: An accumulation of magnetic particulate matter found on the secondary side of the steam generator in low flow areas. strain: The unit of change in the size or shape of a body due to force. Also known as nominal strain. stress: The intensity of the internally distributed forces or components of forces that resist a change in the volume or shape of a material that is or has been subjected to external forces. Stress is expressed in force per unit area and is calculated on the basis of the original dimensions of the cross section of the specimen. Stress can be either direct (tension or compression) or shear. See also residual stress. stress concentration factor (Kt): A multiplying factor for applied stress that allows for the presence of a structural discontinuity such as a notch or hole; Kt equals the ratio of the greatest stress in the region of the discontinuity to the nominal stress for the entire section. Also called theoretical stress concentration factor. stress-corrosion cracking (SCC): A cracking process that requires the simultaneous action of a corrodent and sustained tensile stress. This excludes corrosion-reduced sections that fail by fast fracture. It also excludes intercrystalline or transcrystalline corrosion, which can disintegrate an alloy without applied or residual stress. stress-intensity factor (K): A scaling factor, usually denoted by the symbol K, used in linear-elastic fracture mechanics to describe the intensification of applied stress at the tip of a crack of known size and shape. At
88

the onset of rapid crack propagation in any structure containing, a crack, the factor is called the critical stress-intensity factor, or the fracture toughness. Various subscripts are used to denote different loading conditions or fracture toughnesses: Kc Plane-stress fracture toughness. The value of stress intensity at which crack propagation becomes rapid in sections thinner than those in which plane-strain conditions prevail. KI Stress-intensity factor for a loading condition that displaced the crack faces in a direction normal to the crack plane (also known as the opening mode of deformation). KIc Plane-strain fracture toughness. The minimum value of Kc for any given material and condition, which is attained when rapid crack propagation in the opening mode is governed by plane-strain conditions. KId Dynamic fracture toughness. The fracture toughness determined under dynamic loading conditions; it is used as an approximation of KIc for very tough materials. KISCC. Threshold stress-intensity factor for stress-corrosion cracking. The critical plane-strain stress intensity at the onset of stress-corrosion cracking under specified conditions. KQ. Provisional value for plane-strain fracture toughness. Kth. Threshold stress intensity for stress-corrosion cracking. The critical stress intensity at the onset of stress-corrosion cracking under specified conditions. ∆K. The range of the stress-intensity factor during a fatigue cycle. stress-intensity factor range ∆K: In fatigue, the variation range in the stress-intensity factor in cycle, that is, Kmax-Kmin. stress corrosion cracking: Intergranular cracking of tubes which is a result of complex interactions between stress, environment and material. surface-riding coils: Eddy current coils that are mechanically loaded to ride the tube surface in order to reduce lift-off effects. transgranular: Through or across crystals or grains. Also called intracrystalline or transcrystalline. transgranular cracking: Cracking or fracturing that occurs through or across a crystal or grain. Also called transcrystalline cracking. Contrast with intergranular cracking.
89

transgranular fracture: Fracture through or across the crystals or grains of a metal. Also called transcrystalline fracture or intracrystalline fracture. Contrast with intergranular fracture. uniform corrosion: (1) A type of corrosion attack (deterioration) uniformly distributed over metal surface. (2) Corrosion that proceeds at approximately the same rate over a metal surface. Also called general corrosion. ultimate strength: The maximum stress (tensile. compressive, or shear) a material can sustain without fracture, determined by dividing maximum load by the original cross-sectional area of the specimen. Also called nominal strength or maximum strength. volumetric indications: Indications of volumetric wall loss when using rotating coil techniques indicative of general localized thinning, pitting and wear. wear: The loss of tube material caused by excessive rubbing of the tube against its support structure, a loose part or another tube.
90

ABBREVIATIONS
AAS atomic absorption spectrometry
AES Auger Electron Spectroscopy
BOC Beginning of Cycle
EC eddy current
EDM electric discharge machine
EDC energy dispersive X ray fluorescence spectroscopy
EPR electrochemical potential reactivation
EPRI Electric Power Research Institute (USA)
FT-IR Fourier Transform-Infrared Spectroscopy
GDOS glow discharge optical spectroscopy
IC ion chromatography
ICF-AES inductively coupled plasma atomic emission spectroscopy
ID internal diameter of tube
IGA inter Granular Attack
IGSCC inter Granular Stress Corrosion Cracking
ISI in service inspection
LOCA Loss of Coolant Accidenct
LP Liquid Penetrant
MSLB Main Steam Line Break
NDE Non Destructive Examination Testing
OD Outer Diameter of tube
OES Optical atomic Emission of Spectroscopy
POD Probability of Detection
PSI Pre Service Inspection
PWR Pressurized Water Reactor
RT Radiography Test
SAM Scanning Auger Microscope
SEM Scanning Electron Microscopy
SG Steam Generator
SGTR Steam Generator Tube Rupture
SIMS Secondary Ion Mass Spectrometry
SLB Steam Line Break
SSMS Spark Source Mass Spectrometry
STEM Scanning Transmission Electron Microscopy
91

TEM transmission electron microscopy
TSP tube support plate
UT ultrasonic test
WWER water water power reactor
XPS X ray photoelectron spectroscopy
XRD X ray diffraction
92

CONTRIBUTORS TO DRAFTING AND REVIEW
Bakirov, M. All-Russian Scientific Research Institute for Nuclear Power Plant
Operation, Russian Federation
Behravesh, M.M. Electric Power Research Institute, United States of America
Cheng, H. International Atomic Energy Agency
Hervas, J. TECNATOM S.A., Spain
Kadenko, I. Non-Destructive Examination Training and Certification Facility, Ukraine
Lahdenpera, K. VTT Tuotteet ja tuotanto, Finland
Levy, R. INTERCONTROLE, France
Makela, K. Fortum Power, Finland
Nadinic, B. Organization for Technology Development and Application HRID Limited, Croatia
Nemeth, Z. University of Veszprem, Hungary
Oszvald, F. Paks Nuclear Power Plant Company Limited, Hungary
Papp, L. Nuclear Research Institute Rez plc., Czech Republic
Plasek, J. VUJE, Slovakia
Rathgeb, W. IntelligeNDT GmbH, Germany
Trunov, N.B. State Enterprise "Experimental Design Bureau “GIDROPRESS”, Russian Federation
Zdarek, J. Nuclear Research Institute Rez plc., Czech Republic
93

First Research Coordination Meeting
Vienna, Austria: 7–10 May 2001
Second Research Coordination Meeting
Dubrovnik, Croatia: 13–15 November 2002
Consultants Meeting
Vienna, Austria: 14–16 November 2005
94