strategy fincycle 180731 - nedbank.co.za · the us, that no regulator monitored. all in all, there...
TRANSCRIPT

31 July 2018
TECHNICAL STRATEGY NOTE: EQUITIES
Neels HeynekeSenior StrategistTel : +27 11 535 [email protected]
Mehul DayaStrategy: Research AnalystTel : +27 11 295 [email protected]
31 July 2018
TECHNICAL STRATEGY NOTE: EQUITIES
NEELS HEYNEKESenior StrategistTel : +27 11 535 [email protected]
MEHUL DAYAStrategy: Research AnalystTel : +27 11 295 [email protected]
31 July 2018
TECHNICAL STRATEGY NOTE: EQUITIES
Neels HeynekeSenior StrategistTel : +27 11 535 [email protected]
Mehul DayaStrategy: Research AnalystTel : +27 11 295 [email protected]
31 JULY 2018
SPECIAL REPORT: THE US DOLLAR IS MORE IMPORTANT THAN YOU THINK
NEELS HEYNEKESenior StrategistTel : +27 11 535 [email protected]
MEHUL DAYAStrategistTel : +27 11 537 [email protected]

PAGE 2
EXECUTIVE SUMMARY
Defining the concept of Dollar Liquidity and why is it so important to financial markets: • As the barter system ended and the world started using money as a medium of exchange the question
arose “how much money needs to be in the system?”. A simplistic illustration, if there were 10 bushels of wheat and ten coins then every bushel was worth one coin. The demand or supply of wheat obviously had an effect on the price. If money supply increased more than this demand/supply dynamics it would cause the price of wheat to rise more than the demand for wheat. This is known as consumer inflation. The same concept is also true in the case of asset inflation, yet it’s drivers are misunderstood in the financial markets.
• After “The Great Inflation of the 1970’s”, Central Bank policies became very much focused on the outlook of consumer inflation, becoming a prominent feature of the economic landscape. As a result investment decisions also become centred around consumer inflation cycles.
• However, behind the inflationary cycle (disinflationary in-fact), there was secular growth in US Dollar monetary base. The extra-ordinary growth in base money and the evolution of credit creation has had a profound effect on asset prices – which is largely unappreciated in our opinion.
• The US Dollar as the world’s reserve currency plays a special role in this process.
• Feature chart: Astonishingly for us, there is a high correlation with causality in our opinion between every financial market cycle (VIX) and with the story count in which the world “DOLLAR LIQUIDITY” appears. This is another example of how the availability of US Dollars has a profound effect on financial markets.
FEATURE CHART: VIX AND WORD COUNT “DOLLAR LIQUIDITY”
Source: Bloomberg, News trend function.
0
0.02
0.04
0.06
0.08
0.1
0.12
0.14
0.16
0.18
10
20
30
40
50
60
1990 1994 1998 2002 2006 2010 2014 2018
VIX (LHS) Story count "DOLLAR LIQUIDITY" relative to all news stories (%)
Mexicancrisis
Asian & Russian crisis
9/11 &Nasdaq
GFC Subprime
PIIGS EMFragile5
Chinadevalue
• Bottom line: Should Global $-Liquidity and Global financial conditions fail to improve or even contract further we can expect a deflationary environment to materialise. In this environment we prefer to maintain defensive investment portfolios i.e. Cash over bond over equities.
• We cannot stress enough the importance of the 95 level on the US Dollar index. A confirmed break above this level will mark the beginning of the next risk-off phase. More importantly, it is not the value of the US Dollar Index per se that matters, but rather what it represents - i.e. expansion/contraction in the pool of money.
• South Africa : Given our concern regarding the outlook on global $-Liquidity and our inter-linkages with global capital markets we can not envisage a robust environment for asset returns and economic growth to materialize. For more on our investment recommendations see page 10.

PAGE 3
GLOBAL LIQUIDITY AND CREDIT CYCLE
• Below is our “financial markets outlook clock” which is a simplistic way to illustrate our view on global liquidity, credit cycle and implications for financial markets.
• We will only revise our arrow to “FINANCIAL CONDITIONS TIGHTEN” should the US Dollar index break above 95 index points on a sustainable basis and should our Global $-Liquidity indicators move into negative territory. They have merely slowed down in 1H18.
FINANCIAL CONDITIONS EASETERM PREMIUMS FALL
VOLATILITY FALLZAR AND BONDS STRENGTHENS
EQUITIES RISE
'carry off'CB hawkish
USD ↑
'carry on'CB dovish
USD ↓
FINANCIAL CONDITIONS TIGHTENTERM PREMIUMS RISE
VOLATILITY RISESZAR AND BONDS WEAKENS
EQUITIES FALL

PAGE 4
THE MOST IMPORTANT CHART IN THE WORLD- DOLLAR MONETARY BASE
Source: DS
Source: Financial Times
A PICTURE IS WORTH A THOUSAND WORDS, IN THIS CASE, ITS WORTH TRILLIONS OF USD IN GLOBAL TRADE
• A symbiotic economic relationship grew post the fall of theBerlin wall between the developed and developingeconomies with the rise of globalization. The US was amajor consumer of the world’s production and theconsequence was a $11 trillion cumulative trade deficitwith the rest of the world – during this period the world’sUSD monetary base grew from 4 to 16% of global GDP.
• A consequence of globalisation was disinflation whichallowed central banks to cut policy rates (discount factors).This helped stimulate economic growth and fuel assetprices. The destructive inflationary episode of the 1970’smeant monetary policy became focussed on consumerinflation targeting.
• This caused investors to became obsessed with themonetary policy cycle. The market did not appear to payattention to the extraordinary growth in the USD monetarybase instead focussing on measuring the price of money(CPI) and not the quantum. This is still the case today.What resulted was all asset classes out-performed GDP asthe rising tide of $-liquidity lifted all ships.
• Now that the USD monetary base or ‘tide of liquidity’ hasstarted to recede central banks are starting to play anactive role in controlling the quantum (via QE), and not justthe price of the monetary base (via policy rates) .
• We believe that with this shrinking USD monetary base itbecomes as important to understand liquidity, global flowsand the role the dollar plays as the reserve currency inorder to identify the right investment destination.
• The challenge for investment manager will be for investorsto identify the optimal asset class (beta) in a receding ‘tideof liquidity environment’.
STRATEGY
• The world order since WWII led by the US hegemony is indanger of breaking down. The trend in globalisation sincethe fall of the Berlin Wall is being threatened byprotectionist policies.
• The political consequences of this photo gets a lot ofcoverage, we however would like the point out theimportance of this photo with regards to the currentUSD-based monetary system that the world so heavilyrelies upon.
• The consensus is that the reversal of globalisation will beinflationary. We agree there can be an inflationary shockas tariffs and trade sanctions work through the system.
• We however believe the long-term outcome will bedeflationary especially for asset prices.
• In this report we will define the concept of dollarliquidity and its importance to financial markets.
0
2
4
6
8
10
12
14
16
18
0
10
20
30
40
50
60
70
1928 1938 1948 1958 1968 1978 1988 1998 2008 2018
World Trade vs Global $-liquidity
World Trade % Global GDP (LHS) Dollar liquidity % of Global GDP
WWII
Age of Protectionism
Start of Financialization & Asset inflation
10%
60%
4%
16%
Fall of Berlin Wall
Age of Protectionism II?
Start of Globalization
!!!

PAGE 5
WORLD RELIANCE ON USD AND USD DEBT VS NON-US ENTITIES
Source: Carmen Reinhart, BIS and IMF debt statistics
Source: DS*US cumulative trade deficit relative by Global trade volume adjusted for inflation
US TRADE BALANCE AS A RATIO OF GLOBAL TRADE
• Post WWII global trade took off and the importanceof the dollar grew, this accelerated in the late 1980s.Today 60% of the world’s countries are linked to thedollar. The US GDP share of the world economy hashowever declined from 27 to 18% over the sameperiod – remember the US is the only provider ofUSD base money.
• Should global growth become less synchronized theUS deficit will shrink. This will provide less USD intothe global financial system resulting in a shortage ofdollars. Tighter monetary policy from the Fed, ahigher Fed funds rate and shrinking of the Fed’sbalance sheet, will further slow down USD creation.
• The shrinking dollar monetary base will slow downthe credit creation process because the economy isso highly geared. This shrinking pool of dollars willcause the dollar to rise. The strengthening USDmeans higher offshore USD funding, this will hurtUSD indebted nations/corporations.
• In this environment i.e. tighter global financialconditions, the infamous carry-trade will comeunder pressure and the misallocation of credit willbe revealed. EM’s will be at the centre of themisallocation of credit.
STRATEGY
• As the world left the gold standard in 1971 and theUS dollar became the reserve currency, it becamethe responsibility of the US to supply the world withenough dollars for the global economy to grow i.e.Triffin Dilemma.
• The contraction in this ratio throughout history hasled to a number of busts. 1987 crash, Japanese bustin the late 1980’s, 1998 Asian crisis, Tech bubble,the Great Financial Crisis of 2007/8 and PIIGS crisisin 2011.
• The 2007/8 GFC stands out because the contraction$-Liquidity was so serve, the Fed had to get involvedto add USD M0 as the falling velocity of money andcollateral kept spiralling lower, creating a negativefeedback loop between financial markets and thereal economy.
• This ratio is now losing momentum again and if theUS trade deficit shrinks because of Trump’sprotectionist policies, USD creation will be a majorproblem.
• History has shown that this will have adisinflationary effect on the world’s economy andassets.
• The world at large and especially emerging marketsare very exposed to dollar creation because of theUSD debt the world has taken on since the GFC.
From 27 to 18%
From 28 to 60%
-100
0
100
200
300
400
1978 1983 1988 1993 1998 2003 2008 2013 2018US Trade Balance as a ratio of Global Trade $ (based to 100=1996)
Ample Global $-Liquidity
Shortage of Global $-Liquidity
Asian crisis
Subprime
Taper tantrum
China &Commodity boom
EM carry-trade?
Regan Fiscal plan
Fall of Berlin WallGlobalization

PAGE 6
FINANCIALISATION : GLOBAL EQUITY MARKET CAP AS % OF GLOBAL GDP
Source: Global Financial Data
Source: BIS, IMF
THE INVERTED DEBT PYRAMID, EVOLUTION OF MONEY CREATION
STRATEGY
• On top of the ballooning monetary base wementioned on page-4, the debt creation process wentthrough a major evolutionary process of its own andgearing in the system grew dramatically. Thefractional banking system has been around for 600years and banks traditionally lend out the samemoney 14 times. Just before the 2008 GFC globalbanks lent out the same money in excess of 40 times!
• The reason being, on top of the regulated bankingsector there was the shadow banking sector thatregulators failed to monitor. There was also theEurodollar system - the dollar banking system outsidethe US, that no regulator monitored. All in all, therewas more money and credit in the system thanregulators, economists and analysts were aware ofbecause it did not show up in consumer inflation. Theimportant question is where is this excessmoney/debt. The answer lies in asset inflation andhow asset prices managed to out-perform the realeconomy for 30-years.
• As regulators address the unregulated space andcentral banks (via QE) change the bottom of thepyramid, monitoring money supply has become muchmore complicated than monitoring the traditional M3.
• We cannot measure the pyramid real time. Butchanges to the base of the pyramid or dollar-liquidityhas a major effect on the credit creation process andthat we can measure. Hence all our research focussesaround the drivers of the dollar and dollar liquidity.
• As the US trade deficit fuelled the global monetarybase from 4 to 16% of global GDP, and the process ofFinancialisation began – the gap between the realeconomy and financial markets accelerated from thelate 1980’s accelerating up out of an 80-year old band.
• It is not just the global real economy that cannotafford a shrinking base of the money pyramid. Theindebted balance sheets of the world cannot affordthe asset deflation that will go hand in hand withshrinking money supply.
• In a volatile world where the growing US dollarmonetary base of the last 30-years is changing, webelieve investors should pay more attention to thesource of money, even in the context of the SouthAfrican investment industry.
Rise of Shadow banking
Derivatives
Shadow banking
Securitizations
$-debt Non-US entities
Broad moneyPowerMoney
2007 2018
$1600tn $544tn
$45tn $75tn
$100tn $58tn
$10tn $34tn
$58tn $75tn
$2-4tn $4T + $20T
Unregulated:“Shadows”
Regulated

PAGE 7
THE FINANCIAL CYCLE IN SA IS MORE IMPORTANT THAT YOU THINK
Source: SARB Financial Stability Review, BIS speech “Monetary policy in the grip of a pincer movement” Claudio Borio March 2018
Source: BIS, IMF
GLOBAL GDP, DEBT AND ASSET VALUES
• The Financial Cycle is not a uniquely advanced marketphenomenon , it also exists in South Africa. In fact itis larger and more disruptive than most people think– this is according to research from the SARB’sFinancial Stability Department.
• The business cycle is defined by the SA compositecoincident indicator (employment, manufacturing,production capacity etc.). The financial cycle isdefined by the co-movement of certain financialvariables (equity market prices , property prices andtotal credit etc.)
• The South African business cycle has stagnated inrecent quarters. More alarmingly, the financial cyclecontinues to be in a downward phase amid volatileglobal capital flows and the lack of credit demand inlocal economy. This raises the risk of a recession inSA over the next 6-12 months.
• Changes to the $-Liquidity environment have causedthe financial cycle to become more volatile which isproving to be challenging for policy markers and assetallocators.
• An important excerpt from a the BIS on financialstability: “A more balanced monetary policyframework would place less emphasis on near-terminflation and more on the financial cycle”.
STRATEGY
• The well known Business cycle and the less knownFinancial cycle:
• Most financial market participants tend to ignore orplace less importance on the financial cycle and itsimpact on the business cycle. We believe this is amistake for the following reason:
• There is a large amount of empirical evidence (BIS,LSE, IMF) suggesting that the financial cycle is largerand has a more meaningful impact on the businesscycle and asset prices. In a financial cycle upswingnew borrowing and rising asset prices boost economicgrowth, but over time an accumulation of unhealthydebt leaves the financial system more vulnerable to adownturn. Hence when the financial cycle turns andfinancial stress emerges, the economy faces a deeperrecession than usual. Examples of this: Asian Crisis,Tech bubble and the GFC of 2008/9.
• The GFC of 2008/9 exemplifies the severity of adownturn in a financial cycle as demonstrated by theresponse of authorities i.e. QE and zero interest ratepolicies.
• The next downturn in the financial cycle will be nodifferent to previous downturns. EM’s and SA arevulnerable if the global financial cycle moves intonegative territory. Misallocation of credit fuelled bythe unintended consequences of the CB’s actions willbe exposed.
-1.00
-0.50
0.00
0.50
1.00
1967 1972 1977 1982 1987 1992 1997 2002 2007 2012 2017 2022
y
Business Cycle downturns Business Cycle Financial Cycle

PAGE 8
GLOBAL $-LIQUIDITY: BROAD MONEY SUPPLY
Source: DS*Excess money supply of 30 largest economies relative to the US
Source: DS*US Dollar reserves accumulated by foreign central banks
GLOBAL $-LIQUIDITY: MONETARY BASE
• Our Global excess $-money supply indicator is broadmoney supply of the top 30 major economiesconverted into USDs relative to US M2 growth.
• When our indicator loses momentum it makes itdifficult and more expensive for the rest of the worldto borrows USDs offshore. The opposite is also true.
• Factors influencing our indicator and outlook:1. Changes to the size of the US Federal Reserve’s
balance sheet. Outlook : expected to shrinkfurther.
2. US Treasury cash balances. Outlook: expected tobe neutral.
3. Repatriation of USDs from the Eurodollarsystem. Outlook: expect this continue amid BEATlegislation.
4. Global growth and global trade generates USDs.Outlook: losing momentum as reflected by ourGlobal Velocity of Money indicator.
• Our Global excess $-money supply indicator remains ina downtrend which will make USD funding expensiveand tighten global liquidity conditions. Either globalgrowth must accelerate or some central bank muststimulate to reverse this trend
• We can expect a deflationary bust for financialmarkets led by a stronger dollar and a dollar shortagein the next 6-12 months.
STRATEGY
• The four important indicators we monitor todetermine changes in the $-Liquidity environment areas follows:
• Our Global Dollar M0-Liquidity indicator is measuredas narrow USD money supply in the form T-bills of thetop 30 major central banks of the world held at theUS Federal Reserve relative to US M0 in circulation.
• Typically the indicator would lose (gain) momentumor contract (expand) when the cost of USD fundingwould rise driven by changes to the Fed funds rateand the US trade balance.
• Since the 1980’s a slowdown or a contraction in ourindicator has exposed the misallocation of credit indifferent parts of the world/sectors.
• Our indicator has been in expansionary territory since2016, fuelling asset prices (EM’s in particular). Sincethe start of 2018 it has lost momentum, triggering arisk-off phase in financial markets. Our indicator isnow in equilibrium i.e. at the zero line.
• A slowdown in global growth, the US trade deficit notgrowing and the Fed continuing with its path towardstighter monetary policy will not bode well for USDcreation. Because of this we believe the downsiderisks to financial markets will remain and intensify.
-5
0
5
10
15
20
2008 2010 2012 2014 2016 2018yoy%
QE1 QE2
PIIGS Taper
Fragile 5
China
CB QT
-60
-40
-20
0
20
40
60
80
-30
-20
-10
0
10
20
30
40
1980 1985 1990 1995 2000 2005 2010 2015 2020
%%
GDL indicatorMSCI World (yoy%)
Asian Crisis Lehman Euro Crisis1987 crashLatAm S&L Mexico Nasdaq Fragile 5
PAGE 9
KING OF FINANCIAL MARKETS: US DOLLAR
Source: Reuters Metastock
Source: Reuters ,*Composite indicator that uses a number of variables - such as changes in money multipliers, changes in yield curves, corporate spreads and others
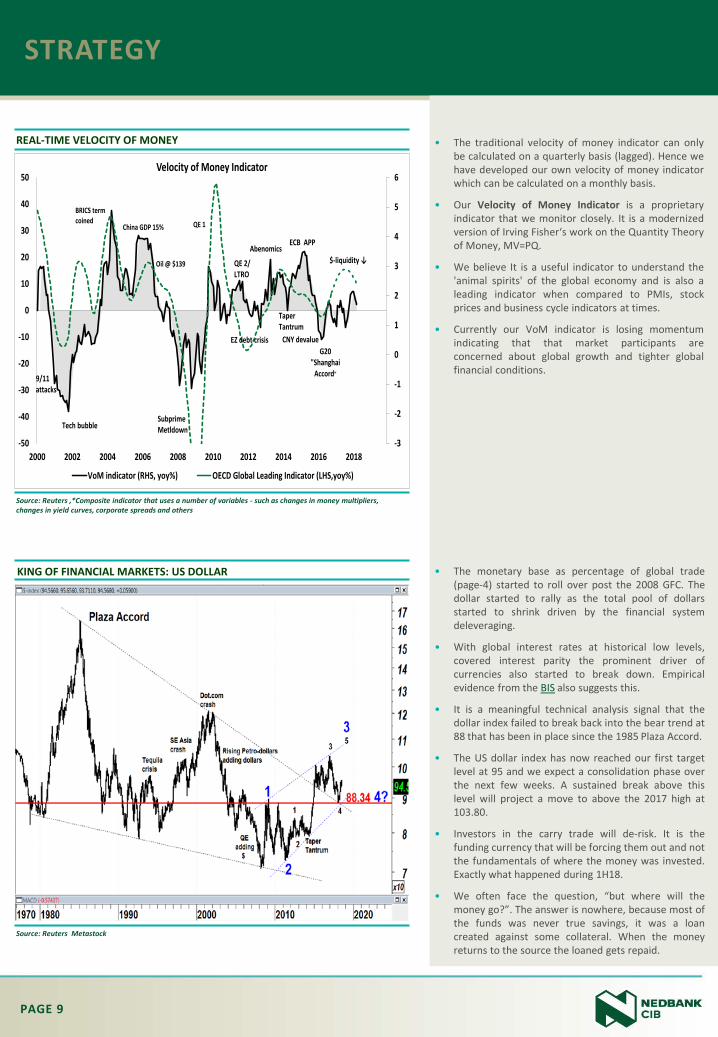
REAL-TIME VELOCITY OF MONEY
• The monetary base as percentage of global trade(page-4) started to roll over post the 2008 GFC. Thedollar started to rally as the total pool of dollarsstarted to shrink driven by the financial systemdeleveraging.
• With global interest rates at historical low levels,covered interest parity the prominent driver ofcurrencies also started to break down. Empiricalevidence from the BIS also suggests this.
• It is a meaningful technical analysis signal that thedollar index failed to break back into the bear trend at88 that has been in place since the 1985 Plaza Accord.
• The US dollar index has now reached our first targetlevel at 95 and we expect a consolidation phase overthe next few weeks. A sustained break above thislevel will project a move to above the 2017 high at103.80.
• Investors in the carry trade will de-risk. It is thefunding currency that will be forcing them out and notthe fundamentals of where the money was invested.Exactly what happened during 1H18.
• We often face the question, “but where will themoney go?”. The answer is nowhere, because most ofthe funds was never true savings, it was a loancreated against some collateral. When the moneyreturns to the source the loaned gets repaid.
STRATEGY
• The traditional velocity of money indicator can onlybe calculated on a quarterly basis (lagged). Hence wehave developed our own velocity of money indicatorwhich can be calculated on a monthly basis.
• Our Velocity of Money Indicator is a proprietaryindicator that we monitor closely. It is a modernizedversion of Irving Fisher‘s work on the Quantity Theoryof Money, MV=PQ.
• We believe It is a useful indicator to understand the'animal spirits' of the global economy and is also aleading indicator when compared to PMIs, stockprices and business cycle indicators at times.
• Currently our VoM indicator is losing momentumindicating that that market participants areconcerned about global growth and tighter globalfinancial conditions.
-3
-2
-1
0
1
2
3
4
5
6
-50
-40
-30
-20
-10
0
10
20
30
40
50
2000 2002 2004 2006 2008 2010 2012 2014 2016 2018
Velocity of Money Indicator
VoM indicator (RHS, yoy%) OECD Global Leading Indicator (LHS,yoy%)
Tech bubble
9/11attacks
Subprime Metldown
EZ debt crisis
Taper Tantrum
QE 1
QE 2/LTRO
Abenomics ECB APP
CNY devalue
$-liquidity ↓
China GDP 15%
BRICS term coined
Oil @ $139
G20"Shanghai
Accord"

PAGE 10
MARKET OUTLOOK
• Since the start of the year we have been warning that $-Liquidity will contract and a risk-off phase will materialise. This supports our bullish US Dollar view.
• The slowdown in Global $-Liquidity was due to tighter monetary policy actions by the Fed (shrinking of the balance sheet and rate hikes), the US treasury replenishing its ‘call account’ at the Fed draining $400 billion from the banking system, the slowdown in the Chinese credit cycle and a slowdown in global trade and petro-dollar balances.
• We reached our 95 target level on the USD Index and we must take the decision whether this was the entire bull move in the USD or is the current consolidation merely a pit-stop. This will help to determine our outlook for the rest of the year. We expect the US and financial markets in general to consolidate, which will continue during 3Q18.
• We conclude the world needs an injection of Global $-Liquidity soon to improve global financial conditions. If this fails to materialise we can expect global financial conditions to contract and the USD to appreciate. In this scenario, a stronger USD and rising offshore USD funding costs will lead to a risk-off phase. Dollar indebted countries, corporations and the carry-trades will be most impacted.
• Global flows (carry trade) will remain an important driver of financial markets.
• Our preference would be to use tactical rallies to build defensive positions in their portfolios:
• Currency: Overweight USD, accumulate below or close to R13.00
• Fixed Income: Underweight duration at 8.38% (10yr yield), we expect short-rates to remain unchanged and the long-end of the yield curve to steepen.
• Equity market: Overweight positions in non-cyclical/defensive rand hedge stocks. We prefer industrial rand hedge stocks (ex-NPN) over resources, over financials and other interest-rate sensitive sectors. We prefer platinum over gold stocks. Within the industrials index we expect BTI, CFR, MND, BID to out-perform the index, but MTN to under-perform. The Health care sector and REM are close to support.
• Overall asset allocation: Over the next 12-months we expect the local bond market to outperform the equity market. Cash holdings will remain attractive in this volatile environment.
PAGE 11
FINANCIAL CONDITIONS AND SA (USD) ASSET CLASSES
Source: DS
Source: Reuters
FINANCIAL CONDITIONS AND EM ASSET CLASSES
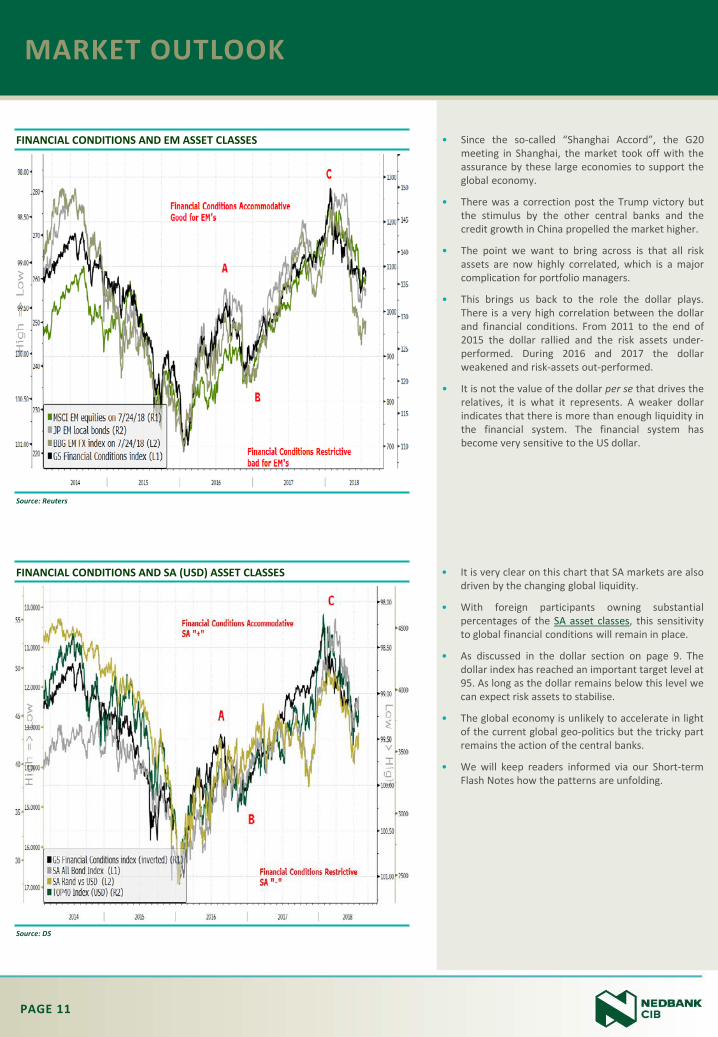
• It is very clear on this chart that SA markets are alsodriven by the changing global liquidity.
• With foreign participants owning substantialpercentages of the SA asset classes, this sensitivityto global financial conditions will remain in place.
• As discussed in the dollar section on page 9. Thedollar index has reached an important target level at95. As long as the dollar remains below this level wecan expect risk assets to stabilise.
• The global economy is unlikely to accelerate in lightof the current global geo-politics but the tricky partremains the action of the central banks.
• We will keep readers informed via our Short-termFlash Notes how the patterns are unfolding.
MARKET OUTLOOK
• Since the so-called “Shanghai Accord”, the G20meeting in Shanghai, the market took off with theassurance by these large economies to support theglobal economy.
• There was a correction post the Trump victory butthe stimulus by the other central banks and thecredit growth in China propelled the market higher.
• The point we want to bring across is that all riskassets are now highly correlated, which is a majorcomplication for portfolio managers.
• This brings us back to the role the dollar plays.There is a very high correlation between the dollarand financial conditions. From 2011 to the end of2015 the dollar rallied and the risk assets under-performed. During 2016 and 2017 the dollarweakened and risk-assets out-performed.
• It is not the value of the dollar per se that drives therelatives, it is what it represents. A weaker dollarindicates that there is more than enough liquidity inthe financial system. The financial system hasbecome very sensitive to the US dollar.

PAGE 12
THE RELATIVE OF DM/EM EQUITIES AND BONDS VS THE RAND
Source: DS
Source: National sources ,IIF , Strate. As of June 2018
FOREIGN OWNERSHIP OF EM ASSETS
• It is very evident post the 2008 financial crisis howthe value of the rand is being influenced by therelative performance of EM versus the advancedmarkets.
• According to our models the global flow of moneyand commodity prices are the major drivers of thevalue of the rand.
• These charts are now all testing resistance linesthrough the tops.
• The next few weeks will be challenging while theworld gathers information whether global financialconditions will stop contracting.
MARKET OUTLOOK
• EM’s have not only become very integrated throughglobal trade linkages (import/export channels) butalso through financial linkages amid the growth incapital markets.
• On average foreign investors own 25% of the localbond and equity market in the emerging marketscomplex. Most exposed are Indonesia, SouthAfrica, South Korea, Mexico, Brazil, Turkey,Hungary and Russia.
• Tighter global financial conditions i.e. rising cost ofoffshore USD funding will leave many EM’svulnerable to capital outflows from their respectivebond and equity markets.
• We are more concerned about the source of capital(cost of offshore USD’s) relative to the destinationof capital.
Local currency bonds Local equity market% of outstanding issuance % of market capitalization
Brazil 12 29Columbia 26 10Czech 35 21Hungary 17 47India 6 22Indonesia 39 52Malaysia 29 13Mexico 28 30Peru 39 6Poland 30 18Romania 18 9Russia 34 20South Africa 40 43S.Korea 11 40Thailand 15 19Turkey 22 20Average 25 25
Foreign ownership

PAGE 13
GLOBAL HEADWINDS WILL NOT BODE WELL FOR OUTLOOK ON THE RAND
Source: DS, PCA analysis from econometric model
Source: Reuters Metastock
USDZAR TESTED AN IMPORTANT RESISTANCE
• We estimate the fair value of the USDZAR by using acombination of PPP metrics. However, we alsoincorporate global liquidity metrics such as the carrytrade, commodity prices, and USD financialconditions.
• Our forecast for the USDZAR for the end of 2H18 isin the range of R13.20-14.00. Our bias is towards theupper-end of this range.
• After stress testing our model for an environment inwhich Global financial conditions become restrictiveand our $-Liquidity move into negative territory wearrive at a forecasted fair-value for the rand close toR14.20
• We expect the bulk of the move in the rand to comefrom weakening external liquidity conditions (i.e.the carry trade and commodity prices).
MARKET OUTLOOK
• It is ironic that two of the major political events inSouth Africa went hand in hand with a majorreversal in global liquidity.
• Minister Nene got fired as the under-performanceof the EM’s came to an end in late 2015. Thepolitical guard changed in early 2018 as the globalfinancial conditions started to tighten.
• The USDZAR is testing a major break-out level. Wehave indicated over the last several weeks that acorrection phase is likely to play out during 3Q18.
• The monthly MACD has however turned up and abreak above the June 2018 high at 14 will be a verynegative signal for the rand. This level is also the2001 high.
• A break above 14 will signal a move to above theJanuary 2016 high.
18%
39%30%
18% 19%
23%
16%
20%
22% 23%
32%
23%31%
32%34%
27% 22% 27% 28% 24%
0%
20%
40%
60%
80%
100%
15-Jan 15-Dec 17-Mar Jan-18 Current
Components of SA Rand FV modeland outlook.
Commodityprices
(-)
SA Eco's(+)
Error term(=)
Carry-trade(-)
Global forces
Local forces
Nene-gateEM rout Gordhan CR17 Carry-trade

PAGE 14
1H18 IS A PERFECT EXAMPLE OF HOW TIGHTER $-LIQUIDITY CAN BE NEGATIVE FOR SA BOND YIELDS
Source: DS, IIF
Source: Reuters Metastock
RSA 10YR YIELD, TESTED THE BULL SUPPORT LINE
• Our negative outlook on SA and EM debt/creditstems from external vulnerabilities. Currentoutstanding FX-denominated debt in EM’s (ex-financials) has climbed to a record high of $5.5trillion.
• A continued slowdown in global trade would weighon EM exporter’s FX revenues, with the strongerUSD making refinancing still harder for EMcorporates with high levels of FX debt
• Fortunately for SA, external debt levels relative toEM peers is low.
• SA external sectorial debt is as follows:– Non-financial corporates 15%, EM ave. 26%– Government 5%, EM ave. 6%– Financial sector 10%, EM ave. 19%– Households 0.4%, EM ave. 3%
• Unfortunately for SA, foreign ownership of localcurrency bonds is one the highest (as a percentageof GDP), leaving local interest rates vulnerable tothe external $-Liquidity conditions.
• Tighter global financial conditions are likely to putpressure on implied credit spreads (CDS) which willput upward pressure on SA bond yields. 1H18 is aperfect example of the impact the internationalenvironment has on SA bonds.
MARKET OUTLOOK
• The SA bond yield bottomed out as the countryjoined the CITI WGBI and remained in a bear trendwith the other EM’s until the end of 2015.
• SA bonds benefitted from the risk-on environmentduring 2016 and 2017 notwithstanding a verynegative local political environment.
• The bond market sold off with all the other riskassets in 2018 to test an important trend reversallevel.
• We do not expect the 10 year yield to trade below8.38% during the correction phase.
• If there is another risk-off phase there is a highprobability of the SA bond market breaking up outof the (blue) flag formation.
100
150
200
250
300
350
400
450
98
99
100
101
102
2014 2015 2016 2017 2018 2019
Global Financial Conditions Index (LHS) SA 5-yr CDS (RHS) EM 5-yr CDS (RHS)
Restrictive Global Financial Conditions
Accommadative Global Financial Conditions
2.54 2.95 2.50
2.021.87
3.50
3.80 3.903.10
8.368.72
9.10
0
1
2
3
4
5
6
7
8
9
10
2007 to current Latest Forecast
UST10y CDS Implied inflation SA 10y
Ave priorrisk-off phases

PAGE 15
JSE ALSH TOTAL RETURN AND RELATIVE TO ALL BOND SINCE 1987
Source: Reuters Metastock
Source: Reuters Metastock
JSE ALL SHARE, OUT OF LONG-TERM BULL BUT HAS NOT GIVEN A SELL SIGNAL
• The general consensus is that the equity market is ahedge against inflation.
• Ironically the SA equity market under-performed thebond market during the high inflation era of the late1980 and 1990’s.
• The start of the commodity cycle changed the trendand equities rallied away from bonds quitesubstantially.
• A break below the red dotted neckline will confirm asell signal which should trigger further equity under-performance.
• The equities gave up a lot of relative performanceduring 1H18.
MARKET OUTLOOK
• The equity market has been struggling to make anyheadway since the middle of 2014.
• During the risk-on phase of 2016-2017 the index hasfailed to break back into the original bull trend thathas been intact since 1976.
• As long as the JSE All Share remains above theprevious highs and the blue support line at 54867there is no reason to be overly concerned.
• The monthly MACD which has a pretty impressivetrack record however confirms a major loss ofbullish momentum.
• If the dollar accelerates again and the next risk-offphase starts we believe the equity will break down.As the foreign investors sell a weaker rand will notbe able to protect the rand price, it will just softenthe blow.

PAGE 16
‘FINAL STRAW THAT WILL BREAK THE CAMELS BACK’: RE-PRICING OF USD MONEY
Source: Bloomberg
Source: DS , EM asset class performance is TR of MSCI EM, TR Bloomberg Barclay EM sovereign index and TR BBGEM carry-trade index. DM asset class performance is TR of MSCI G10, TR of Barclay DM sovereign index and TR DB G10 carry-index.
• As the US Dollar is the currency of the world, US interest rates are the base of rate of the price of money in the world too.
• Without going into the technical discussion of thecomposition of interest rates, one needs tounderstand the importance of the term-premiumi.e. compensation that a investor demands in lightof credit-risk, term-risk, inflation volatility risk etc.
• The US term-premium has been falling for manydecades amid 1) the growing USD monetary base assurplus nations recycled their FX reserves back intothe US bond market i.e. Bernanke’s saving glut 2)because of the QE process by the Fed to compressrisk.
• A slowdown in global growth and tighter monetarypolicy by the Fed will slowdown USD creation and asa result the term-premium is likely to rise.Traditionally the nominal yield declines as the term-premium rises. The rising cost of USD fundingthrough the term-premium will not bode well forassets.
• To conclude: While we acknowledge theimportance of the demand/supply dynamics in thereal economy, we believe investors should paymore attention to the role money supply plays inthe return of assets.
EM RELATIVE TO G20 ASSET CLASSES AND $-LIQUIDITY
MARKET OUTLOOK
• Since the 1980’s there has been major cycles ofmoney flow moving in and out of emerging markets.We believe dollar liquidity played a major role inthese cycles stemming from commodities beingtraded in dollars.
• It was not just the Fed that bailed out the markets in2009. The big rally in EM’s post the GFC was on theback of the commodity run which was fuelled by theChinese ‘bail-out’. The rising commodity prices (andpetro-dollar balances) added many dollars to thefinancial system. Commodity prices peaked in 2011and fell until the end of 2015 and EM’s started tounder-perform. The rising liquidity that triggeredthe risk-on phase of 2016-2017 came from the risingoil price ($28 to 78) and the ECB flooding thesystem. This however came to an end in February2018.
• This relative chart warned in 1994 already thatemerging markets were slowing down although thecrisis only materialised in 1997/8. In 1998 EM’sespecially SE Asia had fixed exchange rates and theircurrencies could not buffer them against capitalout-flows. Most of these countries now havefloating currencies and reserves, but post 2008 theyhave taken on substantial USD debt putting them inthe same situation as in 1998.
• Hence our concern, if global liquidity does notimprove soon EM’s will be very vulnerable to majoroutflows again.
Link to Nedbank CIB Disclaimer
-20
-10
0
10
20
30
40
0.8
1.8
2.8
3.8
1987 1991 1995 1999 2003 2007 2011 2015 2019*EM vs DM asset-class performance $-Liquidity indicator (RHS,yoy$%)
↑ $-LiquidityEM outperform DM
↓ $-LiquidityEM underperform DM
Asian crisis: lots of LCY debt,fixed FX
EM crisis?lots of USD debt, floating FX