strategy and outlook
TRANSCRIPT

Understanding the energy fundamentals for a successful transition
Energy Landscape
In partnership with
Colette Lewiner
and

Our sustainable energy challenge
1Ensuring a reliable,
affordable, accessible energy supply for a
growing world population
2Protecting the planet and its inhabitants from the
adverse effect of greenhouse gas emissions and their impact
on climate change
September 2021 – Energy Landscape2

Energy must be reinvented
September 2021 – Energy Landscape3
Our societies must reconcile population growth and prosperity with massive reduction in CO2 emissions
• The world population is expected to reach ~ 10 billion in 2050
Sources: IEA World Energy Balance 2021, World Bank, United Nations
World population evolution and forecast
(billions of people)
0
5
10
1970 1995 2020 2045
2050
Forecast
2050
7.7
World GDP (G$) and primary energy demand (EJ)
• GDP and primary energy demand have increased in line with population
• And energy CO2 linked emissions have also gone up
0
300
600
50,000
100,000
1970 1995 2020
EJ
G$
GtCO2 emissions
linked to energy
15 22 33

Where does the energy supply come from?
80% of the world's energy supply relies on GHG* emitting fossil fuel resources
This dependance is not sustainable: increasing the share of other energy sources is key
Source: Capgemini Analysis
Coal Oil Gas Uranium Renewables
(Hydro, Solar, Wind, …)
Refined Liquid
ProductsElectricity
Heat
(and Cold)Hydrogen
Lighting Heating Mechanical
Commercial
Gas
Conversion to
primary energy
equivalent
(World energy
balances, …)
Information &
Communication
technologies
Primary energy - in nature
Secondary energy - transformation
Energy used - final
High-carbon sources Low-carbon sources
Biomass
September 2021 – Energy Landscape4 *GHG : Greenhouse gases
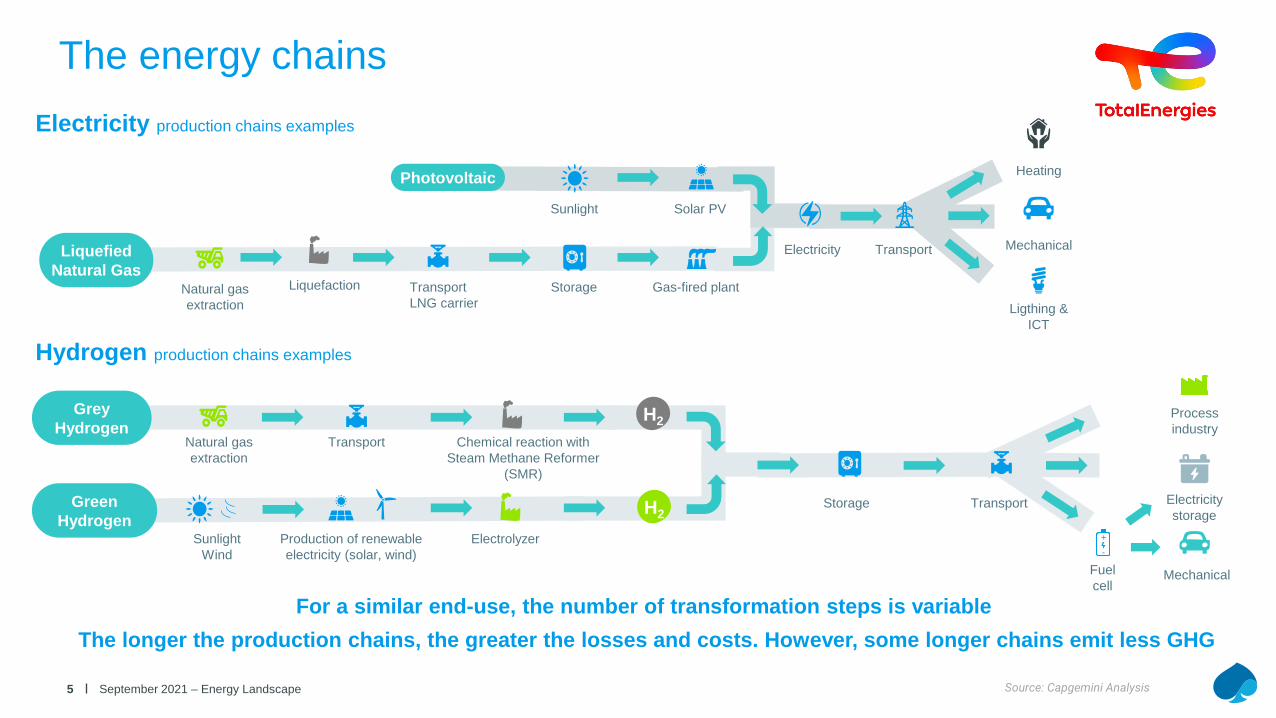
The energy chains
For a similar end-use, the number of transformation steps is variable
The longer the production chains, the greater the losses and costs. However, some longer chains emit less GHG
Heating
Ligthing &
ICT
Mechanical
H2
Natural gas
extraction
Transport Chemical reaction with
Steam Methane Reformer
(SMR)
H2
Production of renewable
electricity (solar, wind)
Electrolyzer
Process
industry
Electricity
storage
Grey
Hydrogen
Green
HydrogenStorage
Fuel
cellMechanical
Sunlight
Wind
Electricity
Natural gas
extraction
Transport
LNG carrier
Storage Gas-fired plant
Liquefied
Natural Gas
Photovoltaic
Sunlight Solar PV
Transport
Transport
Electricity production chains examples
Hydrogen production chains examples
+
-
Liquefaction
September 2021 – Energy Landscape5 Source: Capgemini Analysis

~ 75%
The more processing steps, the greater the energy lossesIllustratives vehicle performance yields
Electric vehicle is very efficient
Electrification is a major trend including transportation
Source: UK Transport & Environment, Comparison of the Overall Energy Efficiency for Internal Combustion Engine Vehicles and
Electric Vehicles - Aiman ALBATAYNEH, Mohammad N. ASSAF, Dariusz ALTERMAN, Mustafa JARADAT - 2020
Internal combustion engine
Battery electric vehicle
(direct charging)
Hydrogen fuel cell vehicle
~ 20%
Fuel production
efficiency Tank-to-wheel
~ 95% ~ 73%
~ 52% ~ 22%
Resulting
efficiency
~ 22%
~ 42%
~ 88%
Loss due to:
Engine efficiency
Loss due to:
Electrolysis
Loss due to:
Battery and AC/DC conversions
Loss due to:
H2 to electricity conversion
September 2021 – Energy Landscape6

0
15000
30000
20191990
30,000
Renewable sources
(hydro excluded)
CAGR
Fossil sources*
CAGR
Global electricity
production CAGR
+ 2.9% /year
15,000
~ 11,900
~ 26,900
0
4 400
Decarbonization under way : electricity the main enabler
Sources: IEA World Energy Balance 2021, World BankUnited Nations, IEA, World Total Energy Supply
• The power mix is highly variable across countries
Germany United States China
610 7 500
Low carbon electricity is at the core of numerous Net Zero carbon emissions oriented policies
Electricity production mix per country
(TWh)
Global electricity production mix (TWh)
Note: *Fossil sources include Coal, Gas and Oil.
570
France
Coal
Gas
Oil
Nuclear
Renewables
+ 9.7% /year
+ 2.9% /year
Hydro
September 2021 – Energy Landscape7

Power systems must adapt to intermittent renewables
The massive introduction of intermittent renewable energy has a systemic impact on electric network balance
Their intermittency needs mitigation : storage, intermediate load and peak load power plants & clients demand response
Peak load = a few hours a
day
Intermediate load =
Depends on the balancing
requirements
Base load = production at
every hour
Production
Means of production and role in the electrical system
• Electrical generation is composed of multiple means of
production with different roles
Daily average hourly production in France (2019)
Requirement: at any time
Consumption = Production
• Unbalancing:
weather, intermittency
(wind, solar, etc.),
demand.
• Balancing by:
peak load solutions,
storage, etc.
GW
Hours
Balancing
30
40
50
60
00:0
0
01:3
0
03:0
0
04:3
0
06:0
0
07:3
0
09:0
0
10:3
0
12:0
0
13:3
0
15:0
0
16:3
0
18:0
0
19:3
0
21:0
0
22:3
0
September 2021 – Energy Landscape8
Consumption
Source: Capgemini Analysis

Characteristics for comparing main energy sources
Oil Natural gas Intermittent renewables
Energy density (MJ / kg)Very high
(41-48)
High
(38-50)Low
Availibility/Abundance*60 years of consumption
(including shale oil)
80 years of consumption
(including shale gas)
Infinite (limited by
available space)
Predictibility/Reliability
Impacts on
electrical networksNo No
Yes, need for predictable energy
and storage
Externalities CO2/CH4 emissions CO2/CH4 emissions Rare metals resources, footprint
Corrective measuresBlending with green fuels, Carbon
Capture, Use and Storage (CCUS)
Blending with green gases, Carbon
Capture, Use and Storage (CCUS)N/A
Technology maturity
CostComparision can not be done since externalities are not taken into account: no carbon tax for fossil fuels and
not network additionnal cost related to intermittency for renewablesComparisons are not straightforward. Cost most include a price for carbon or GHG and for network
impact related to intermittency of renewables.
September 2021 – Energy Landscape9 Note: *Abundance is depending upon States sovereignty Source: Capgemini Analysis

The footprint is also to be considered
Acceptability issues of solar & wind due to their impact on territories and landscape must be
overcome
Source: van Zalk, John, Behrens, Paul, 2018, The Spatial Extent of Renewable and Non-Renewable Power Generation
Land use required to power a 100W flat TV screen by energy type
(m2)
296
Hydropower
37
Wind
14
Solar0.8
Coal
0.3
Nuclear
0.1
Natural gas
Wind-energy footprint
including turbine spacing
September 2021 – Energy Landscape10

0% 50% 100%
Where does the energy consumption come from ? (1/2)
When enough energy is available its consumption mix varies according to end use
Source: IEA World Energy Balances 2020
Residential
Transport
Energy is central to
human life
Mechanical
Lighting
Heating
Coal
Oil
Gas
Electricity
Others
Mobility
Communicate
Transform,
Produce
Heat, Light, Cook
Final energy consumption mix, OECD 2018
ICT
September 2021 – Energy Landscape11
Tertiary
Industry

Where does the energy demand come from ? (2/2)
For many countries, access to energy is paramount for their development:
Nearly 1 billion people do not have access to electricity today
• Energy demand increases at a different pace according
to the region
Source: IEA World Energy Balances 2020
• Developed countries are the main consumers of energy.
However, their consumption is decreasing while developing
countries consumption is increasing
0
300
600
0
300
600
0
300
600
Developing countries (non-OECD)Developed countries (OECD) Global
EJ
2000 2019
+ 3.4%/year(2000-2019)
+ 1.8%/year(2000-2019)
223 225 195
310
420
600
228
2010
380
2000 201920102000 20192010
535
September 2021 – Energy Landscape12
+ 0%/year(2000-2019)

People are not equal towards energy
Energy consumption per capita reflects both accessibility to energy sources and living standards
Necessity of a just and inclusive energy transition
Source: IEA (2021), Key World Energy Statistics 2021
22World average primary energy consumption
per capita in 2019 (MWh/capita)
United States
78Saudi Arabia
73France
42
China
28India
8Kenya
6
Energy consumption per Capita in 2019
MWh/Capita
September 2021 – Energy Landscape13
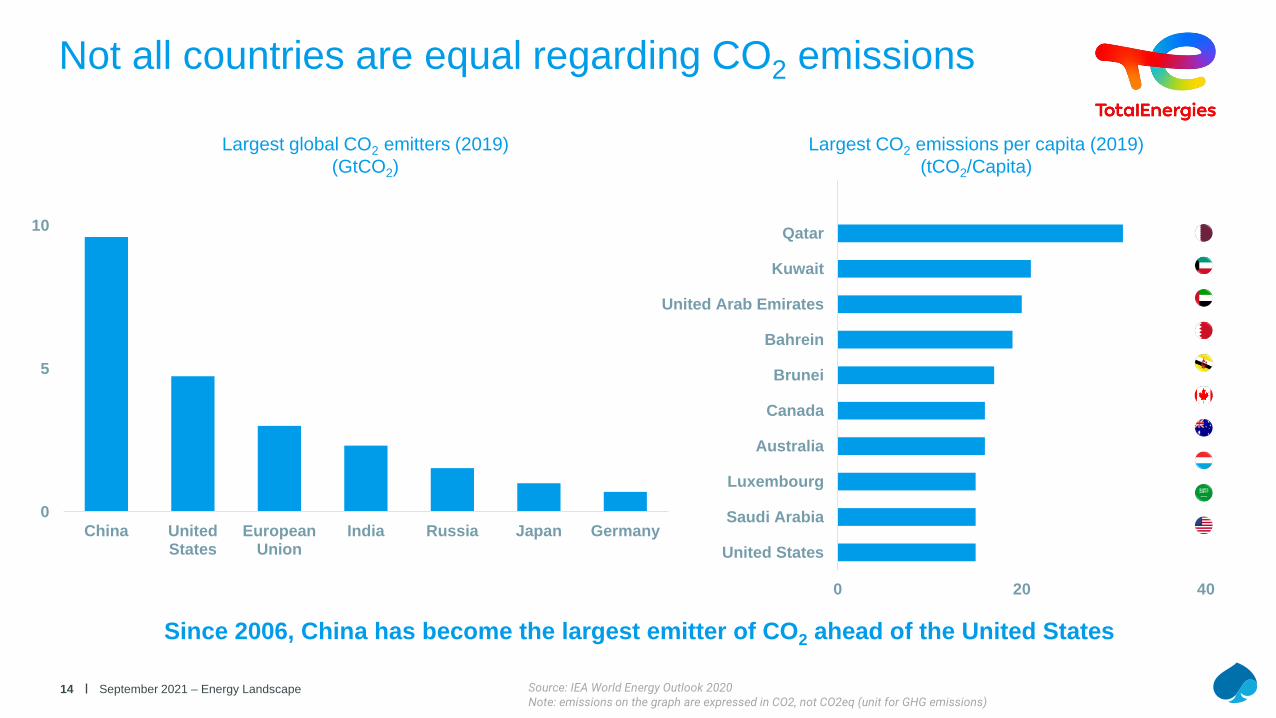
Not all countries are equal regarding CO2 emissions
September 2021 – Energy Landscape14 Source: IEA World Energy Outlook 2020Note: emissions on the graph are expressed in CO2, not CO2eq (unit for GHG emissions)
0
5
10
China UnitedStates
EuropeanUnion
India Russia Japan Germany
0 20 40
United States
Saudi Arabia
Luxembourg
Australia
Canada
Brunei
Bahrein
United Arab Emirates
Kuwait
Qatar
Largest CO2 emissions per capita (2019)
(tCO2/Capita)
Largest global CO2 emitters (2019)
(GtCO2)
Since 2006, China has become the largest emitter of CO2 ahead of the United States

Largest historical CO2 emitters worldwide
Developed countries have thrived without any constraints in GHG emissions
Developing and emerging countries will need help to grow without following the same path
Source: Who has contributed most to global CO2 emissions?, Our World in Data, Hannah Ritchie, 2019Note: emissions on the graph are expressed in CO2, not CO2eq (unit for GHG emissions)
Cumulative CO2 emissions over the period from 1971 to 2017
x%: global
cumulative
emissions
China200 billion tonnes CO2
13%
Canada2%
Japan62 billion
tonnes
CO2
4%
North America
Asia
Europe
Africa
South America
Oceania
September 2021 – Energy Landscape15
United States399 billion tonnes CO2
25%
European Union - 28353 billion tonnes CO2
22%
China200 billion tonnes CO2
13%
Canada2%
Mexico1.2%
Japan62 billion
tonnes
CO2
4%
India48 billion
tonnes CO2
3%
Russia101 billion tonnes CO2
6%
South Africa1.3%
Brazil0.9%
Australia1.1%

Decarbonization levers
AVOIDAVOID COMPENSATE INNOVATEREDUCE
September 2021 – Energy Landscape16

Appendix
September 2021 – Energy Landscape17

15%
23%
30%
7%
11%
14%
55* Gt CO2e
CO2 emissions by source in the world
(in Gt CO2)**
Fossil fuels are the main contributors to GHG emissions
The energy transition aims at radically changing the global energy mix in order to limit the GHG
emissions
Energy usages contributes up to 68% of GHG emissions*
Sources: GHG Emissions from fuel combustion IEA report and UNEP emissions Gap report 2019CO2 : Ministry of Ecological Transition - Key figures for climate 2021 - France, Europe and Global
Note: * GHG emissions are expressed in CO2eq, a unit created by the IPCC to aggregate emissions from all GHG (CO2, CH4, N2O, …)** excluding Land Use and Land Use Change and Forestry
The combustion of fossil fuels generates CO2 emissions
Global GHG emissions in 2018 by sector in CO2eq
Coal
combustion
Oil
combustion
Natural gas
combustionIndustrial processes
41%
30%
21%
8%Coal
Oil
Gas
Industry
Agriculture
Other
ENERGY
September 2021 – Energy Landscape18

Avoid
Increase energy
performance in all sectors
through proactive policies
Impact of a speed
reduction from 130 to
110 km/h on highways:
- A 15% reduction in fuel
consumption
- A fuel bill reduced by
7% on average
- A reduction of CO2
emissions around 20%
- For a 100 km journey,
a 8 minute longer
journey time
September 2021 – Energy Landscape19
Avoiding unnecessary
energy consumption
through energy efficiency
and responsible behavior
Source: Capgemini Analysis

Reduce: Decarbonization of the energy value chain
Decarbonize uses:
For instance: promote the electrification of
transportation and the use of biogas and
bioliquids
Changing the energy mix
Shift to minimum or no carbon energy
Decarbonize uses:
For instance: promote the electrification of
transportation and the use of biogas and
bioliquids
September 2021 – Energy Landscape20 Source: Capgemini Analysis

Compensate emissions
Preserve natural carbon
sinks (forests, peat,
oceans...) and develop
artificial carbon sinks
(CCUS)
Support actors in other
sectors/countries to offset
their own emissions that
cannot be avoided
3Robust auditing and
certification for carbon
offsetting
21
September 2021 – Energy Landscape21 Source: Capgemini Analysis
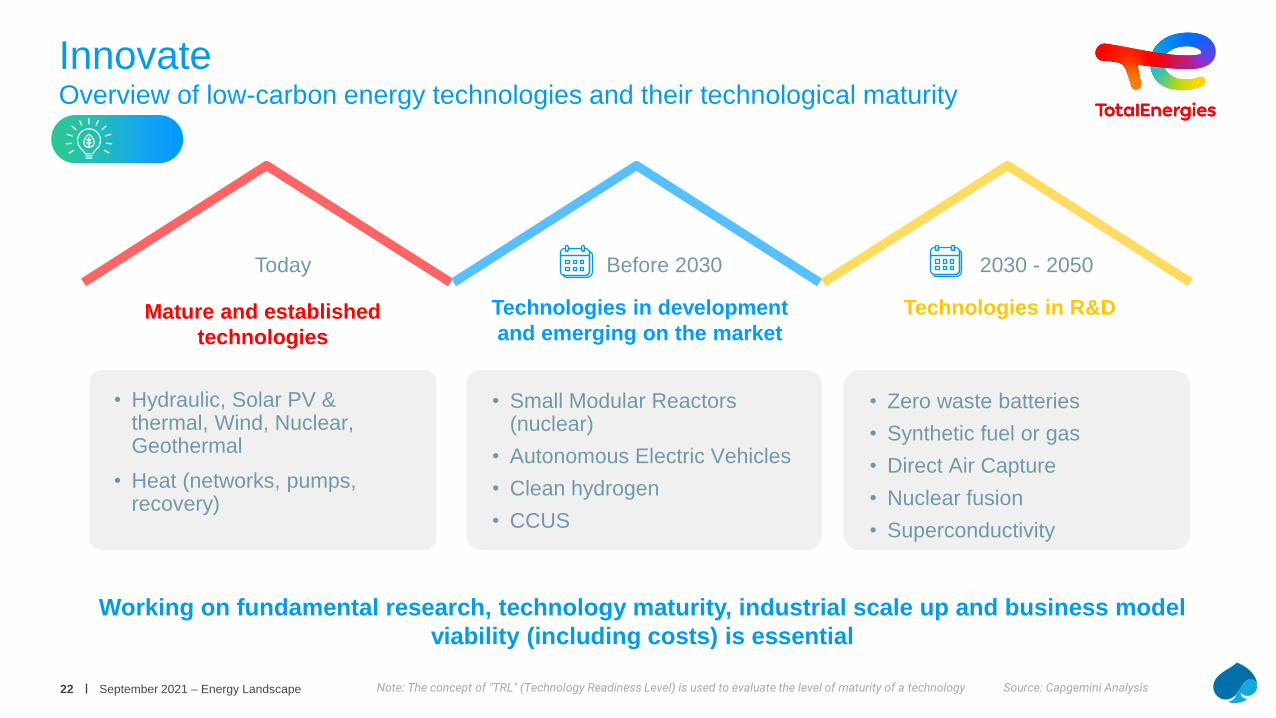
InnovateOverview of low-carbon energy technologies and their technological maturity
Working on fundamental research, technology maturity, industrial scale up and business model
viability (including costs) is essential
Note: The concept of "TRL" (Technology Readiness Level) is used to evaluate the level of maturity of a technology
• Hydraulic, Solar PV & thermal, Wind, Nuclear, Geothermal
• Heat (networks, pumps, recovery)
Mature and established
technologies
Technologies in development
and emerging on the market
Technologies in R&D
• Small Modular Reactors (nuclear)
• Autonomous Electric Vehicles
• Clean hydrogen
• CCUS
• Zero waste batteries
• Synthetic fuel or gas
• Direct Air Capture
• Nuclear fusion
• Superconductivity
Today Before 2030 2030 - 2050
September 2021 – Energy Landscape22 Source: Capgemini Analysis

We all have a role to play
Source: Capgemini AnalysisSeptember 2021 – Energy Landscape23
Government
Companies
Financial sector
Innovators &
Scientists
NGOs
Citizens
Carbon price, carbon neutrality policy and
investments, regulation, mandates, subsidies
and multilateral action
Reducing Direct and indirect GHG,
upstream/downstream value chain actions,
innovation scale up
Supporting the transition, Deploying ESG
strategies
Raising awareness and informing stakeholders
Progressing on fundamental research and
applications. Providing insights and concrete
solutions
Adapting behaviour and becoming informed,
seek for holistic based information

The entities in which TotalEnergies SE directly or indirectly owns a shareholding are separate and independent legal entities. The terms “TotalEnergies”, “TotalEnergies company” and “Company” used in this document are generic and used for convenience to designate TotalEnergies SE and the entities included in its scope of consolidation. Likewise, the words “we”, “us” and “our” may also be used to refer to these entities or their employees.
This document may contain forward-looking statements within the meaning of the Private Securities Litigation Reform Act of 1995,notably with respect to the financial condition, results of operations, business activities and industrial strategy of TotalEnergies. This document may also contain statements regarding the perspectives, objectives, areas of improvement and goals of TotalEnergies, including with respect to climate change and carbon neutrality (net zero emissions). For the definitions of non-financial performance indicators, refer to the latest TotalEnergies’s Universal Registration Document. An ambition expresses an outcome desired by TotalEnergies, it being specified that the means to be deployed do not depend solely on TotalEnergies. These forward-looking statements may generally be identified by the use of the future or conditional tense or forward-looking words such as “envisions”, “intends”, “anticipates”, “believes”, “considers”, “plans”, “expects”, “thinks”, “targets”, “aims” or similar terminology. Such forward-looking statements included in this document are based on economic data, estimates and assumptions prepared in a given economic, competitive and regulatory environment and considered to be reasonable by TotalEnergies as of the date of this document.
These forward-looking statements are not historical data and should not be interpreted as assurances that the perspectives, objectives or goals announced will be achieved. They may prove to be inaccurate in the future, and may evolve or be modified with a significant difference between the actual results and those initially estimated, due to the uncertainties notably related to the economic, financial, competitive and regulatory environment, or due to the occurrence of risk factors, such as, notably, the price fluctuations in crude oil and natural gas, the evolution of the demand and price of petroleum products, the changes in production results and reserves estimates, the ability to achieve cost reductions and operating efficiencies without unduly disrupting business operations, changes in laws andregulations including those related to the environment and climate, currency fluctuations, as well as economic and political developments, changes in market conditions, loss of market share and changes in consumer preferences, or pandemics such as the COVID-19 pandemic. Additionally, certain financial information is based on estimates particularly in the assessment of the recoverable value of assets and potential impairments of assets relating thereto.
Neither TotalEnergies nor any of its subsidiaries assumes any obligation to update publicly any forward-looking information or statement, objectives or trends contained in this document whether as a result of new information, future events or otherwise. The information on risk factors that could have a significant adverse effect on TotalEnergies’ business, financial condition, including its operating income and cash flow, reputation, outlook or the value of financial instruments issued by TotalEnergies is provided in the most recent version of the Universal Registration Document which is filed by TotalEnergies SE with the French Autorité des Marchés Financiers and the annual report on Form 20-F filed with the United States Securities and Exchange Commission (“SEC”).
Financial information by business segment is reported in accordance with the internal reporting system and shows internal segment information that is used to manage and measure the performance of TotalEnergies. In addition to IFRS measures, certain alternative performance indicators are presented, such as performance indicators excluding the adjustment items described below (adjustedoperating income, adjusted net operating income, adjusted net income), return on equity (ROE), return on average capital employed (ROACE), gearing ratio, operating cash flow before working capital changes, the shareholder rate of return. These indicators are meant to facilitate the analysis of the financial performance of TotalEnergies and the comparison of income between periods. They allow investors to track the measures used internally to manage and measure the performance of TotalEnergies.
These adjustment items include:
(i) Special items
Due to their unusual nature or particular significance, certain transactions qualified as "special items" are excluded from the business segment figures. In general, special items relate to transactions that are significant, infrequent or unusual. However, in certain instances, transactions such as restructuring costs or asset disposals, which are not considered to be representative of the normal course of business, may be qualified as special items although they may have occurred within prior years or are likely to occur again within the coming years.
(ii) Inventory valuation effect
The adjusted results of the Refining & Chemicals and Marketing & Services segments are presented according to the replacement cost method. This method is used to assess the segments’ performance and facilitate the comparability of the segments’ performance with those of its competitors.
In the replacement cost method, which approximates the LIFO (Last-In, First-Out) method, the variation of inventory values in the statement of income is, depending on the nature of the inventory, determined using either the month-end price differentials between one period and another or the average prices of the period rather than the historical value. The inventory valuation effect is the difference between the results according to the FIFO (First-In, First-Out) and the replacement cost.
(iii) Effect of changes in fair value
The effect of changes in fair value presented as an adjustment item reflects, for some transactions, differences between internal measures of performance used by TotalEnergies’ management and the accounting for these transactions under IFRS.
IFRS requires that trading inventories be recorded at their fair value using period-end spot prices. In order to best reflect the management of economic exposure through derivative transactions, internal indicators used to measure performance include valuations of trading inventories based on forward prices.
TotalEnergies, in its trading activities, enters into storage contracts, whose future effects are recorded at fair value in TotalEnergies’ internal economic performance. IFRS precludes recognition of this fair value effect.
Furthermore, TotalEnergies enters into derivative instruments to risk manage certain operational contracts or assets. Under IFRS, these derivatives are recorded at fair value while the underlying operational transactions are recorded as they occur. Internal indicators defer the fair value on derivatives to match with the transaction occurrence.
The adjusted results (adjusted operating income, adjusted net operating income, adjusted net income) are defined as replacement cost results, adjusted for special items, excluding the effect of changes in fair value.
Euro amounts presented for the fully adjusted-diluted earnings per share represent dollar amounts converted at the average euro-dollar (€-$) exchange rate for the applicable period and are not the result of financial statements prepared in euros.
Cautionary Note to U.S. Investors – The SEC permits oil and gas companies, in their filings with the SEC, to separately disclose proved, probable and possible reserves that a company has determined in accordance with SEC rules. We may use certain terms in this press release, such as “potential reserves” or “resources”, that the SEC’s guidelines strictly prohibit us from including in filings with the SEC. U.S. investors are urged to consider closely the disclosure in the Form 20-F of TotalEnergies, File N° 1-10888, available from us at 2, place Jean Millier – Arche Nord Coupole/Regnault - 92078 Paris-La Défense Cedex, France, or at our website totalenergies.com. You can also obtain this form from the SEC by calling 1-800-SEC-0330 or on the SEC’s website sec.gov.
September 2021 – Energy Landscape24

For more information go to
Corporate Communications
TOTALENERGIES SE
2, place Jean-Millier
92400 Courbevoie, France
Tel.: +33 (0)1 47 44 45 46
Share capital: €6,601,073,322.50
Registered in Nanterre: RCS 542 051 180