strategies to improve gene expression and targeting for
TRANSCRIPT

Strategies to improve gene expression and targeting for DNA vaccine development
A DISSERTATION SUBMITTED TO THE FACULTY OF THE GRADUATE SCHOOL
OF THE UNIVERSITY OF MINNESOTA BY
Nicole Elizabeth Skinner
IN PARTIAL FULFILLMENT OF THE REQUIREMENTS FOR THE DEGREE OF
DOCTOR OF PHILOSOPHY
Christopher A. Pennell, Ph.D., Advisor
October 2013

© Nicole Elizabeth Skinner 2013

i
Acknowledgements
I would first like to thank my advisor, Chris Pennell. He has been an excellent
mentor over the past four years: a patient teacher who has modeled rigorous and careful
scientific thought but who also gave me the space to develop independence as a
scientist. I am grateful for his encouragement and his enthusiasm for science. I would
also like to acknowledge past and present members of the lab and collaborators, in
particular Wynette Dietz, Mark Osborn, and Sara Hamilton, whose effort and expertise
were invaluable to the projects described in this thesis.
I very much appreciate the insight and guidance provided me by the members of
my thesis committee: Dave Masopust (chair), Tom Griffith, Tim Starr and Marc Jenkins.
Their input has both sharpened and broadened the way I’ve thought about my projects
and consequently made them better. I would also like to acknowledge the considerable
guidance I received in joint lab meetings with the Ohlfest lab and from John Ohlfest
directly. I continue to miss his drive and energy.
I am grateful to the MICaB graduate program for the training and support it has
provided me for the past 4 years. I would also like to acknowledge the Medical Scientist
Training Program for its continued support throughout my training. I appreciate the
advocacy and leadership of Yoji Shimizu, Tucker LeBien, and Peter Bitterman. I would
also like to thank Susan Shurson and Nick Berg for their support and for their uncanny
ability to solve all problems – big and small – that arise in the course of this program. In
addition, I am grateful to have received the Wilfred Wetzel graduate fellowship, the Dr.
Warren J. Warwick and Henrietta Holm Warwick fellowship, and the doctoral dissertation
fellowship during the course of my graduate training.

ii
Lastly, I would like to thank my family and friends for their encouragement and
support. In particular, I am grateful to my husband, Brian Skinner, for being patient
during times of stress and celebrating with me during times of success. He is a
wonderful person to talk to about science or not-science, whenever I need either.

iii
Dedication This dissertation is dedicated to my parents, Karen and David Fletcher, whose love and
support have made this achievement possible.

iv
Table of Contents
Acknowledgements i
Dedication iii
List of Figures v
List of Abbreviations vii
Chapter 1: Introduction 1
I. CD8+ T cell responses to infection 1
II. Vaccination 3
III. DNA vaccines 5
IV. Minicircle DNA 11
V. Targeted gene delivery 13
VI. Thesis statement 16
Chapter 2: Minicircle DNA is superior to plasmid DNA in eliciting 18 antigen-specific CD8+ T cell responses
Chapter 3: Prolonged antigen expression following minicircle vaccination 55 enhances protective immune responses
Chapter 4: Targeted delivery of nucleic acid to T cells using a TAT- 84 streptavidin fusion protein
Chapter 5: Conclusions 109
References 116
Appendix: Permissions 130

v
List of Figures
2.1 Minicircle derivation 41
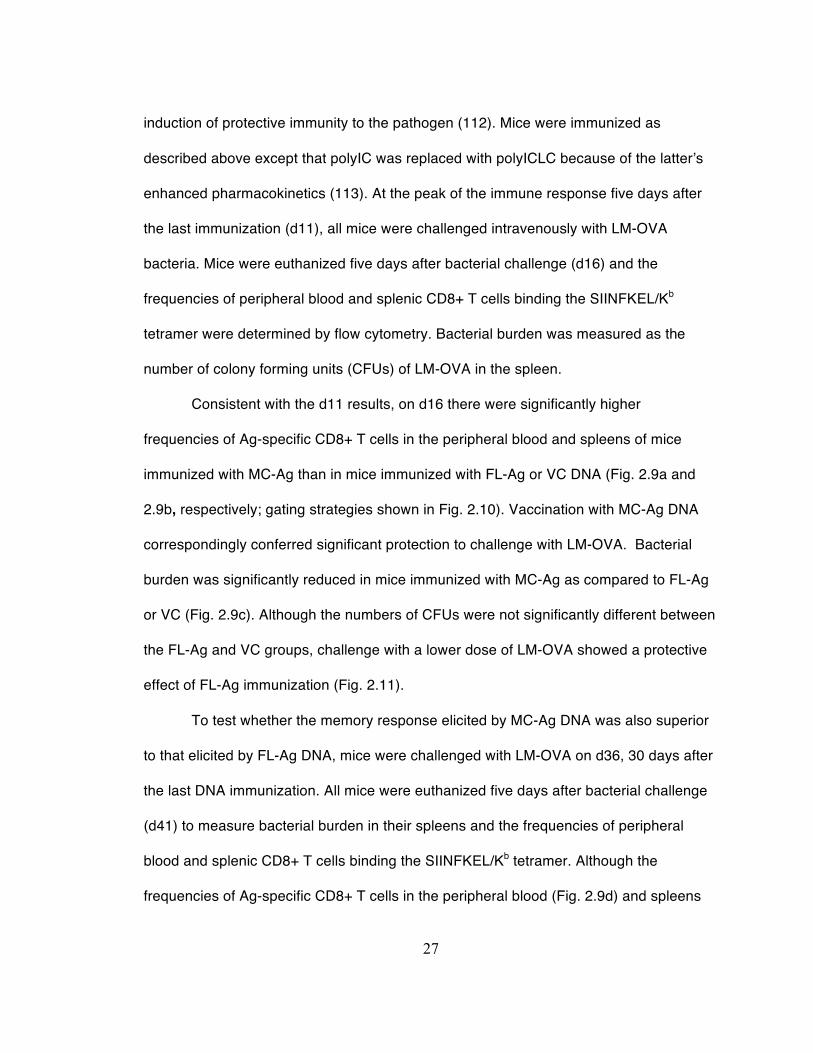
2.2 Enhanced expression of minicircle-encoded eff in vitro 42
2.3 Enhanced intensity and duration of minicircle-encoded eff expression 43 in the skin
2.4 Single letter amino acid sequence of Ag insert 44
2.5 Enhanced presentation of minicircle-encoded Ag by dendritic cells 45
2.6 Enhanced activation of Ag-specific CD8+ T cells in vivo following 47 immunization with MC-Ag
2.7 Enhanced cytolytic activity of Ag-specific CD8+ T cells following 48 immunization with MC-Ag
2.8 Enhanced expansion of endogenous Ag-specific CD8+ T cells in vivo 49 following immunization with MC-Ag
2.9 Enhanced protection from challenge with Listeria monocytogenes 51 following immunization with MC-Ag
2.10 Gating strategy for detecting Ag-specific CD8+ T cells in mice 53 challenged with LM-OVA
2.11 Protection against lower dose LM-OVA challenge elicited by MC-Ag 54 or FL-Ag immunization
3.1 DNA construct and experimental design 73
3.2 Duration of gene expression following immunization with MC CMV- 74 Ag.6
3.3 Truncating Ag expression before the peak immune response 75 induces early contraction
3.4 Duration of Ag expression affects proliferative capacity and 76 protection from infection
3.5 PD-1 expression following infection in mice with truncated Ag 78 expression
3.6 Markers of exhaustion following MC or protein immunization 79

vi
3.7 In vivo gene expression following immunization with different doses 81 of MC DNA in the ear
3.8 Immune responses following immunization with FL DNA yielding 82 similar peak expression levels as MC DNA
4.1 Schematic of TAT-SA delivery platform 101
4.2 TAT-SA can be produced and is functional 102
4.3 TAT-SA mediates uptake of siRNA into MOLT-13 cells via the 103 anti-CD7 antibody in a charge ratio-dependent manner
4.4 TAT-SA mediates binding and internalization of DNA into MOLT- 105 13 cells via the anti-CD7 antibody but not gene expression
4.5 TAT-SA pMHC tetramers bind to Ag-specific target cells 107
4.6 Absence of gene expression following FliC-specific TAT-SA 108 tetramer transfections of SM1 cells

vii
List of Abbreviations
Ag – antigen
AIM2 – absent in melanoma 2
APC – antigen presenting cell
B4F – biotin-4-fluorescein
BpA – bovine growth hormone polyadenylation signal
CFA – complete Freund’s adjuvant
CFSE – 5-(and-6)-carboxyfluorescein diacetate, succinimidyl ester
CMV – cytomegalovirus
CpG – cytosine-phosphate-guanine
CR – charge ratio
CTLA-4 – cytotoxic t-lymphocyte antigen 4
DAMP – damage-associated molecular pattern
DC – dendritic cell
DC-SIGN – dendritic cell-specific ICAM-3 grabbing non-integrin
DNA – deoxyribonucleic acid
dsDNA – double-stranded DNA
E. Coli – Escherichia coli
eff – enhanced firefly luciferase
EMSA – electrophoretic mobility shift assay
FasL – Fas ligand
FBS – fetal bovine serum

viii
FL – full-length
FL-Ag – full-length plasmid encoding the antigen cassette
FL-eff – full-length plasmid encoding enhanced firefly luciferase
GFP – green fluorescent protein
GVHD – graft-versus-host disease
HA2 – hemagglutinin 2
hUbC – human ubiquitin C promoter
ICAM3 – intracellular adhesion molecule 3
IFN-γ – interferon-gamma
IL – interleukin
IPTG – Isopropyl β-D-1-thiogalactopyranoside
KLRG1 – killer cell lectin-like receptor subfamily G member 1
LCMV – lymphocytic choriomeningitis virus
LCMV-Arm – Armstrong strain of the lymphocytic choriomeningitis virus
LCMV-cl-13 – clone 13 strain of the lymphocytic choriomeningitis virus
LM-OVA – Listeria monocytogenes bearing the ovalbumin antigen
LN – lymph node
Ln+dDC – langerin+ dermal dendritic cell
MC – minicircle
MC-Ag – minicircle DNA encoding the antigen cassette
MC-eff – minicircle DNA encoding enhanced firefly luciferase
MFI – median fluorescence intensity
MHC – major histocompatibility complex

ix
MR – molar ratio
NFAT – nuclear factor of activated T cells
OVA – ovalbumin
PAMP – pathogen-associated molecular pattern
PBS – phosphate buffered saline
PD-1 – programmed death 1
PD-L1 – programmed death ligand 1
PD-L2 – programmed death ligand 2
pDNA – plasmid DNA
PE – phycoerythrin
PerCP – Peridinin chlorophyll
pMHC – peptide:MHC complex
PPAA – poly(propylacrylic acid)
p/n – positive/negative charge ratio
P/S – penicillin/streptomycin antibiotic mixture
RLU – relative light units
SDS-PAGE – Sodium dodecyl sulfate polyacrylamide gel electrophoresis
SA – streptavidin
siRNA – small interfering ribonucleic acid
SS – secretion signal
TCR – T cell receptor
TLR – Toll-like receptor
TNF-α – tumor necrosis factor-alpha

x
TRAIL – TNF-related apoptosis-inducing ligand
VC – vector control plasmid
WT – wild-type

1
CHAPTER 1: Introduction
I. CD8+ T cell responses to infection
During an infection, CD8+ T cells respond in a well-characterized manner. Before
encountering antigen (Ag), naïve T cells circulate through secondary lymphatic tissue
(lymph nodes [LN] and spleen). Professional antigen presenting cells (APC), such as
dendritic cells (DCs), in these secondary lymphatic tissues present pathogen-derived
peptides to CD8+ T cells via class I major histocompatibility complexes (MHC) on their
cell surfaces. These peptides derive either from pathogenic proteins present within
infected APCs or from endocytosed extracellular proteins transported to the cytosol and
cross-presented on class I MHC.
If a CD8+ T cell encounters the specific peptide:MHC (pMHC) complex for which
its T cell receptor (TCR) is specific, it will become activated, but only if it receives
additional activating signals. Co-stimulatory ligands, such as CD80 and 86 are
upregulated on APCs in response to danger- or pathogen-associated molecular patterns
(DAMPs/PAMPs) or in the presence of CD4+ T cell help. Co-stimulatory ligands bind to
receptors on CD8+ T cells (CD28 in the case of CD80 and 86), delivering a necessary
second signal for T cell activation (1,2). In addition, a third signal, typically in the form of
interleukin-12 (IL-12) or tumor necrosis factor-α (TNF-α), is necessary to produce
functional effector T cells. In the absence of these cytokines, which are secreted by
APCs in response to DAMPs or PAMPs, T cells are deleted or become unresponsive to
Ag, a condition known as anergy (3).

2
Once a CD8+ T cell has become activated by a mature APC during an infection,
it undergoes massive clonal expansion and differentiates into an effector T cell capable
of killing infected cells. Effector CD8+ T cells migrate through tissues until encountering
infected cells that express their cognate Ags (4). When an effector CD8+ T cell detects a
cell expressing a pMHC I complex for which its TCR is specific, it can kill the target cell.
Killing results from the release of granules containing perforin, which forms pores in the
cell membrane and aids in the entry of granzymes, which are serine proteases also
present in the graunules. The proteases induce apoptosis by activating caspases in the
target cell (5). Effector CD8+ T cells also express the pro-apoptotic TNF receptor family
proteins Fas ligand (FasL) and TNF-related apoptosis-inducing ligand (TRAIL). Both
FasL and TRAIL induce apoptosis in targets via recruitment of caspases (6). In addition
to killing targets, CD8+ effectors secrete anti-microbial and pro-inflammatory cytokines
such as interferon (IFN)-γ and TNF-α, as well as IL-2, which promotes T cell proliferation
(4).
The net result of this process is a large expansion of effector CD8+ T cells which
occurs shortly after infection. Following pathogen eradication, this expansion phase is
followed by a rapid contraction phase, in which 90-95% of effector cells die by apoptosis
(4,7). The population that remains, although severely contracted, is larger than the
original naïve population and differentiates into a population of memory CD8+ T cells.
These memory cells persist long-term, sometimes for the lifetime of the animal, and are
marked by their ability to rapidly proliferate and re-acquire effector function upon re-
encounter with Ag (7,8). The kinetics of expansion and contraction following infection
appear to be largely pre-programmed. That is, after being driven by an initial period of

3
Ag exposure lasting at least 24 hours, the presence or absence of Ag does not affect the
timing of expansion and contraction (9-11).
It is important to note that in cases where pathogen burden is very high or the
infection persists, formation of conventional memory does not occur. Instead, the
contraction phase is followed by the emergence of a population of CD8+ T cells that
differ from traditional memory cells in several significant ways. They do not respond
robustly to encountered Ag. Their abilities to proliferate, secrete cytokines, and kill
targets are impaired. Rather than persisting due to homeostatic signaling from IL-7 and
IL-15 as memory cells do (12), they become Ag-dependent, requiring TCR stimulation
for survival. Such cells are said to be exhausted (13).
Thus, successful CD8+ T cell responses not only clear an infection, but also
generate a long-lived memory response capable of rapid eradication of the same
pathogen upon re-infection. However, the absence of adequate inflammatory stimuli
precludes the formation of such a response, resulting instead in anergy. Likewise, an
effective T cell response is also subverted by persistent infection leading to exhaustion.
II. Vaccination
The goal of vaccination is to generate a long-lived memory population in the
absence of illness to protect the host from infection in the future. Generating an effector
response from naïve T cells requires 1-2 weeks due to their low initial frequencies, on
the order of 15 – 1000 cells total in the body of a mouse (14-16). In contrast, generating
effector cells from memory cells requires a few days. It is this difference between weeks
and days that can determine whether an animal succumbs to a pathogen or eradicates it

4
(17,18). Thus, it is this difference that vaccines seek to exploit. To do so, they must
mimic a successful immune response to infection while minimizing danger and, ideally,
significant discomfort, to the host. A vaccine that too accurately mimics an infection may
offer little advantage over actually contracting the illness. However, a vaccine that is not
inflammatory enough may fail to generate a long-term, protective immune response. The
components and design of the vaccine determine how well it navigates this balance.
At its most basic level, a vaccine intended to activate CD8+ T cells must provide
the three essential signals: TCR stimulation, co-stimulation, and cytokine activation.
Different vaccine modalities provide these signals in different ways. Attenuated or killed
pathogens contain many of the native PAMPs of the infectious organism, thereby
activating APCs to upregulate co-stimulatory molecules and produce inflammatory
cytokines. Furthermore, since attenuated pathogens are capable of replication and
infection, they can prime CD8+ T cells in addition to stimulating production of neutralizing
antibody. However, attenuated strains can be difficult to produce and to store long-term,
as they must be kept viable. In addition, there is the risk of reversion to a virulent form of
the pathogen. Even without reversion, attenuated vaccines are not safe for use in
immunocompromised individuals (19,20).
Some vaccines use chemicals, heat, or radiation to inactivate or kill the
pathogen. These vaccines do not share the risks associated with live, attenuated
vaccines. However, they also stimulate weaker immune responses. While a killed virus
cannot cause disease, it also cannot replicate or infect cells. Thus, it generally requires
use of an added adjuvant and does not stimulate strong CD8+ T cell responses (19).

5
Subunit vaccines are protein vaccines composed of particular pathogen-
associated Ags given alongside an adjuvant. Similar to inactivated vaccines, subunit
vaccines often stimulate suboptimal immune responses and require multiple booster
immunizations. Furthermore, because the protein is present extracellularly, it does not
stimulate strong cellular (CD8+ T cell) responses. Instead, humoral, or antibody-
mediated, immune responses are generated, since they are stimulated by extraceullar
antigens. In addition, protein production can be time consuming and difficult (21,22).
Recombinant vector vaccines deliver DNA-encoded Ags in heterologous carriers,
often a viral vector although bacteria have been used as well. This approach mirrors a
natural infection but the infecting agent is designed to be safer than the pathogen
against which the host is being vaccinated. Vector vaccines, like attenuated vaccines,
contain intrinsic PAMPs and stimulate strong immune responses, both humoral and
cellular. However, as with attenuated vaccines, vector-based vaccines carry safety risks
and are particularly dangerous to the immunocompromised. In addition, vectors are
difficult to design and generally cannot be used again, either as a booster or a carrier for
a different vaccine. Following vaccination with a vector vaccine, neutralizing antibodies
to the vector are often generated that will prevent use of the same vector again (19,23).
DNA vaccines forgo the vector of recombinant vector vaccines and consist only
of DNA, generally in the form of circular, double-stranded plasmid DNA (pDNA) that
encodes chosen Ags. DNA vaccines are the focus of this thesis and are reviewed in
detail in the next section.
III. DNA vaccines
6
The discovery that naked DNA is taken up and expressed by mammalian cells
(24) led to interest in using DNA as a vaccine. In 1992, Tang and Johnston first reported
immune responses to a protein produced in situ by a DNA vaccine when they
demonstrated that pDNA encoding human growth hormone stimulated antibody
production in mice (25). Other reports from Margaret Lui, Harriet Robinson, and David
Wiener soon followed, showing that DNA vaccines could elicit protective immune
responses against viral and tumor Ags in small animal models (26-28). These findings
sparked tremendous interest in DNA vaccines.
The allure of DNA vaccines is related to the unique combination of advantages
they offer compared to other vaccine platforms. Firstly, they are safe. Like subunit
protein vaccines, they do not pose any risk of reversion and subsequent infection of the
host. Furthermore, they do not detectably integrate into genomic DNA and are therefore
not associated with an increased risk of malignancy (29,30). In addition, there was an
initial fear that DNA vaccines would stimulate autoimmune responses against DNA,
creating a Lupus-like pathology, but numerous human clinic trials have found no
evidence that this occurs (31).
Secondly, DNA vaccines afford a great deal of flexibility in vaccine design.
Generating and manipulating pDNA is straightforward and inexpensive. Simple cloning
techniques permit the easy addition, removal, or alteration of encoded genes. A single
vector can encode multiple Ag epitopes as well as reporter genes, cytokines, and/or
protein adjuvants (31,32). Producing such a protein would be a technically challenging
task and modifying it later could require an equally challenging effort.

7
The flexibility and ease of producing pDNA also make DNA vaccines increasingly
attractive as genome sequencing data are used more and more to produce vaccines, a
process known as reverse vaccinology (33). In particular, as algorithms for identifying
antigenic epitopes improve (34,35), obtaining sequencing data, determining epitopes
and encoding them in a DNA vaccine may offer a rapid way of generating vaccines
against emerging pathogens (36).
Thirdly, pDNA is stable at room temperature. This makes it easy to store for long
periods of time and easy to ship (32). Ease of shipment and storage, as well as the
relative affordability of producing pDNA vaccines, make them potentially valuable tools to
combat infectious disease throughout the world.
Lastly, because pDNA vaccines are taken up and expressed within mammalian
cells, they drive cellular, in addition to humoral, immune response (31,37). Generating a
safe, non-infectious vaccine that can elicit CD8+ T cell responses makes pDNA vaccines
both unique and particularly valuable among vaccine modalities.
Due to the promise of DNA vaccines, there has been a great deal of work
elucidating how they function and attempting to optimize them. Vaccine administration
has generally been in either muscle or skin. Work by Bins et al. (38) showed that delivery
to muscle yields significantly higher levels of gene expression but poorer immune
responses than immunization in the skin. This discrepancy likely results from the role of
skin as a barrier organ rich in APCs. Consequently, many groups deliver DNA vaccines
to the skin. Methods for delivery to the skin can be as simple as intradermal injection, but
also include scarification, bombarding the skin with DNA-coated particles using a gene

8
gun, using a mild current to the skin to create cellular pores via electroporation, and
tattooing (39).
Regardless of the technique, once DNA has been delivered it must be taken up
by cells in the skin. While certain delivery methods, such as scarification, deliver DNA
only to the epidermis, most methods deliver to the dermis as well. The mechanism by
which cells in the skin take up DNA is still incompletely understood. Endocytosis,
proteoglycan-dependent macropinocytosis, and receptor-mediated uptake have all been
proposed. Once in the cytosol, DNA must enter the nucleus rapidly before being
degraded by endogenous nucleases. The mechanism of nuclear entry is also not
understood, but DNA may gain entry via nuclear pore complexes, which enable
bidirectional movement of macromolecules across the nuclear envelope. Following entry
into the nucleus, pDNA genes are expressed using cell machinery (39,40).
Synthesized proteins elicit CD8+ T cell responses directly if the transfected cell is
an APC. In this case, the proteins are processed and presented on class I MHC. Due to
their relative abundance in the skin, however, it is much more likely for the transfected
cell to be a keratinocyte. Proteins produced by keratinocytes that are secreted or
released following cell death are taken up by APCs, processed and their derivative
peptides cross-presented on MHC class I molecules. Whether presenting or cross-
presenting Ag, APCs migrate to draining LN to prime naïve T cells (39).
The skin is home to a number of different APCs, particularly dendritic cells (DCs).
There are three main types of DCs present in the skin: Langerhans cells, which are
present in the epidermis, dermal DCs that express langerin (Ln+dDCs) and dermal DCs
that are langerin negative. Ln+dDCs rapidly migrate to draining LNs following

9
inflammatory stimuli and are capable of cross-presentation. Furthermore, ablation of this
DC subset markedly impairs CD8+ T cell responses in mice, indicating that these DCs
are critical for mediating the CD8+ T cell response following DNA vaccination (41).
The ability of DCs to migrate to draining LNs and cross-present, as well as the
ability to effectively prime naïve CD8+ T cells relies on the presence of inflammatory or
danger signals. These are necessary to fully license the DCs and permit the production
of signals 2 and 3 needed to produce effector T cells (42). However, an additional
advantage found with DNA vaccines is that they function in the absence of a
supplemental adjuvant. They have inherent adjuvanticity that mediates DC licensing.
The mechanism underlying this adjuvanticity has not been definitively determined. Many
of the delivery mechanisms induce damage in the skin, which may play an important
inflammatory role (39). In addition, pDNA contains unmethylated cytosine-phosphate-
guanosine nucleotide (CpG) sequences that bind to Toll-like receptor (TLR)-9. However,
TLR-9 knockout mice respond to DNA vaccines as well as wild-type (WT) mice (43). It
may be that DNA vaccines are stimulating inflammatory responses through alternative
pathways, perhaps via cytosolic sensors of double stranded DNA (dsDNA). Two such
sensors that have been recently identified are IFI16 and absent in melanoma (AIM2).
Both of these proteins are interferon-inducible dsDNA sensors that have been shown to
respond to microbial DNA (44,45).
Combining DNA vaccines with tradition adjuvants, such as aluminum salts,
lipopolysaccharide, liposomes, or polysaccharides, often generates improved immune
responses compared to immunization with DNA alone. However, improvements have
been generally modest, motivating researchers to investigate the use of protein immune

10
stimulants that can be encoded in the DNA vaccine. These genetic adjuvants include
cytokines, chemokines, co-stimulatory molecules, and signaling molecules. Of these,
cytokines and chemokines have been most thoroughly studied and have been found to
typically yield better immune responses than traditional adjuvants(46).
Based on the many advantages associated with pDNA vacccines and their early
successes in small animal models, they have been investigated in numerous clinical
trials. In fact, three DNA vaccines have been licensed for use in animals: one melanoma
vaccine for dogs (47), a West Nile virus vaccine for horses (48), and a vaccine against
infectious hematopoietic necrosis virus in salmonid fishes (49). In humans, there have
been clinical trials exploring pDNA vaccine use for a variety of tumors as well as
infectious diseases, including influenza (50,51), HIV (52,53), Hepatitis B and C (54,55),
Hantaan virus (56), Dengue (57), H5N1 avian influenza (58,59), SARS (60), malaria (61),
and Ebola virus (62). These trials have confirmed the safety and tolerability of DNA
vaccines in people. However, they also illustrate that DNA vaccines as currently
formulated generally fail to provide sufficiently protective immune responses in humans.
The failure of pDNA vaccines to translate effectively to use in humans stems from
one major obstacle: poor immunogenicity. Although pDNA vaccines elicit cellular and
humoral immune responses, those responses are generally too weak to provide
substantial protection in humans (63). A major contributor to the poor immunogenicity of
pDNA vaccines is insufficient Ag production. The reasons for insufficient Ag production
are likely two-fold. Firstly, while mammalian cells take up naked pDNA, they do so
inefficiently, leading to significant loss of DNA and low transfection rates (31). Secondly,
encoded Ags are expressed only transiently following transfection (64). This initial robust

11
expression rapidly declines, potentially leading to inadequate priming of T cells. Chapter
2 of this thesis explores a novel solution to this latter problem of transient transgene
expression by using minicircle (MC) DNA to circumvent the decay in gene expression
that occurs following vaccination with standard pDNA.
IV. Minicircle DNA
MC DNA is circularized DNA derived from conventional plasmid DNA (pDNA) via
removal of sequences required for propagation in bacteria. It contains only the
mammalian expression cassette and a 36 bp recombination scar; all bacterially-derived
elements, including the origin of replication and antibiotic resistance genes, are no
longer present. Compared to pDNA, MC DNA permits higher levels and more prolonged
duration of transgene expression in vivo (65). The smaller size of MC DNA compared to
its parental full-length (FL) plasmid likely increases transfection efficiency (66), thereby
improving expression. Prolonged transgene expression results from a decrease in
silencing (67).
When mammalian cells are transfected with pDNA they initially express the
transgene robustly. However, following this initial burst, expression rapidly wanes.
Histone modifications generating transcriptionally-repressive heterochromatin initially
form on the plasmid backbone, but spread in cis to cover the entire plasmid, including
the expression cassette. These histone modifications are responsible for the loss in
transgene expression following transfection with conventional pDNA. In the absence of a
bacterial backbone, no such heterochromatin forms, leading to the high and persistent
gene expression observed following transfection with MC DNA (67,68).
12
The elements on the plasmid backbone that serve as a nidus for initiation of the
formation of heterochromatin are unknown. Silencing is independent of CpG or
methylation status (69) and in fact, seems to be independent of any particular DNA
sequence. Instead, the critical factor appears to be the length of extragenic DNA. If the
length of DNA between the 5’ and 3’ ends of the transgene cassette is greater than 1 Kb,
silencing occurs; if it is smaller than 0.5 Kb, silencing does not occur. This is true
regardless of whether the extragenic DNA is of bacterial origin, mammalian origin, or is
comprised of random nucleotides. Furthermore, when 1 Kb of extragenic DNA was
moved into the 3’ untranslated region of the expression cassette, silencing no longer
occurred, showing that it is only the size of the extragenic DNA that determines whether
genes will be silenced (70). In MC DNA, the length of extragenic DNA is well below 0.5
Kb (36 bp, as mentioned above), thus accounting for the prolonged duration of
transgene expression.
MC DNA production has been optimized to make it nearly as straightforward as
standard pDNA preparation. Kay et al. modified a strain of Escherichia coli (E. coli) to
contain inducible copies of the ϕC31 integrase and I-SceI homing endonuclease. MC
DNA is produced from a parental FL pDNA that contains recognition sites for the I-SceI
endonuclease along the backbone and recognition sites for the integrase (termed attB
and attP sites) flanking the expression cassette. Upon induction with L-arabinose, the
integrase mediates recombination at the attB and attP sites, producing two circular
DNAs: one containing the expression cassette and another containing the backbone.
The backbone is linearized via digestion with the I-SceI endonuclease and subsequently
degraded by endogenous exonucleases. The remaining circular MC DNA is then purified

13
via standard pDNA preparation techniques with similar yields (71). Production of MC
DNA thus differs from production of pDNA only in the addition of an induction step and
the necessity of using a particular DNA backbone and producer strain of E. coli,
therefore making it a practically viable alternative to pDNA.
The prolonged transgene expression afforded by MC DNA has been employed in
several applications including gene therapy for the treatment of a lysosomal storage
disease (72), insulin production to treat type I diabetes (73), stable gene knockdown to
reduce cardiac damage following myocardial infarction (74), and production of adult
human induced pluripotent stem cells (75). Chapters 2 and 3 of this thesis explore a
novel use for MC DNA: as a vaccine. In addition, chapter 3 investigates the effect of
prolonged expression of a MC-encoded Ag on immune responses.
V. Targeted gene delivery
Most current methods of DNA administration involve significant uptake by non-
target cells, generally keratinocytes (dermal administration) or myocytes (intramuscular
administration), with secondary transfection of targets occurring suboptimally. The ability
to target genes is thus of considerable interest. For instance, as mentioned above, DNA
vaccine-encoded Ags need to be presented by APCs to prime CD8+ T cells, but the
majority of transfected cells are keratinocytes or myocytes. Ralph Steinman’s group
designed a DNA construct that encoded a fusion protein containing the Ag joined to a
single-chain Fv antibody specific for the DC endocytic receptor, DEC-205. Thus, protein
produced by myocytes after an intramuscular injection would be targeted for improved
uptake by DCs. They found that targeting their Ag significantly improved both T and B

14
cell responses and allowed for the generation of protective responses at a drastically
reduced dose of vaccine (76).
Other groups have looked at targeting DCs through other receptors, such as the
mannose receptor and the C-type lectin recptor, DC-specific intercellular adhesion
molecule 3 [ICAM3]-grabbing non-integrin (DC-SIGN). These studies have shown that
targeted DCs alone is not sufficient; their functionality must be modulated. If immature
DCs are targeted, tolerogenic immune responses develop. Therefore, receptor choice as
well as maturation agents are used to mediate DC maturation along with Ag delivery
(77).
In addition to DC targeting, there has been interest in modulating T cells to
improve vaccines. Antibodies against the negative regulatory proteins cytotoxic T
lymphocyte antigen-4 (CTLA-4) and programmed death-1 (PD-1) have shown great
success in overcoming tolerance in both infection and tumor settings (78-82). Both
CTLA-4 and PD-1 are proteins expressed by CD8+ T cells that inhibit T cell activation.
PD-1 binds to PD ligands 1 and 2 (PD-L1 and PD-L2), which are both found on APCs,
although PD-L1 is also found on many other tissues (83). CTLA-4 competes with CD28
for binding to the co-stimulatory molecules CD80 and 86 expressed by APCs. However,
unlike CD28, when CTLA-4 binds to CD80 or 86, it delivers an inhibitory signal to T cells
(84). By blocking PD-1 and CTLA-4, these antibodies allow CD8+ T cells to become
activated in otherwise tolerizing environments.
Similarly, T cell responses have been manipulated by the toxin-mediated deletion
of Ag-specific CD8+ T cells. This approach has used class I pMHC tetramers linked to
the saporin toxin (85). pMHC tetramers contain four biotinylated class I MHC molecules

15
bound to a target peptide and tetramerized via binding to the protein streptavidin (SA)
which contains four biotin binding sites. The tetrameric form of the protein increases the
avidity of the interaction between the tetramer and T cells (86). Following internalization
of the complex through the TCR, T cells were killed by the toxin. Death occurred in an
Ag-specific manner because only T cells bearing TCRs specific for the given pMHC
complex on the tetramer would bind and internalize it. T cell deletion was not used in a
vaccine setting, but rather as a therapy for T cell mediated disease, such as
autoimmunity and graft-versus-host-disease (87,88).
As summarized above, T cell surface markers have been blocked and T cells
have been deleted. However, to date, T cell modulation approaches have not involved
targeting of genes to T cells, as they have with DCs. Such an application would not
involve delivery of Ag directly to T cells, as they require interaction with Ag:MHC
complexes on APCs. However, more subtle alterations in function could conceivably be
achieved by delivering genes than by blocking cell surface markers or eliminating
populations of cells. For instance, while CTLA-4 and PD-1 antibodies have shown great
success in augmenting signal 2 for T cell activation in vaccination, attempts at
administering IL-12 to provide a strong third signal have been associated with serious
dose-limiting toxicities, including pulmonary edema, liver damage, gastrointestinal
toxicity and bone marrow suppression (89,90). However, if a plasmid encoding IL-12
were targeted to T cells, or to Ag-specific T cells, these side effects could potentially be
avoided.
Furthermore, as demonstrated by the work on Ag-specific T cell depletion, there
are many applications for T cell targeting beyond vaccine development that bear brief

16
mention. Autoimmunity, in which pathogenic T cells target healthy “self” tissues is a key
example. Allogeneic graft rejection and graft-versus-host-disease (GVHD) are caused by
destruction of donor graft tissue by host T cells or attack on recipient tissues by donor T
cells, respectively. On the other end of the spectrum, inappropriately tolerized T cells in
malignancy or exhausted T cells in chronic infection could benefit from delivery of genes
designed to re-activate these cells. The fourth chapter of this thesis explores a method
for targeted delivery of genes to T cells that would permit delivery to T cells in general as
well as Ag-specific T cells.
VI. Thesis Statement
This thesis examines strategies for improving DNA vaccines. Despite their many
advantages and the considerable promise shown in small animal models, poor
immunogenicity resulting from low transfection efficiency and transient transgene
expression limits the effectiveness of DNA vaccines in humans. Methods for
circumventing transient transgene expression as well as for directly manipulating T cell
responses are explored.
The next two chapters of this thesis (chapters 2 and 3) study the use of MC DNA
as a vaccine. In chapter 2, a MC DNA vaccine is shown to generate larger CD8+ T cell
responses and confer superior protection against an infectious challenge than a
conventional pDNA vaccine. Chapter 3 investigates the mechanism by which MC DNA
elicits superior CD8+ T cell responses. In particular, the role of prolonged Ag expression
is explored and found to be an important component of MC DNA vaccine efficacy.

17
Chapter 4 proposes a method for targeted gene delivery to T cells in general, or
to Ag-specific T cells. The targeting mechanism uses the SA platform modified with
positively charged peptides to enable binding to nucleic acid. Targeting is mediated by
addition of biotinylated targeting moieties, either an anti-CD7 antibody for targeting of T
cells or pMHC molecules for targeting of Ag-specific T cells. We find that such an
approach is promising, as it mediates uptake of both fluorescently labeled siRNA and
DNA. However, gene expression did not occur, indicating that further modifications to the
approach are needed before it can be used.

18
CHAPTER 2: Minicircle DNA is Superior to Plasmid DNA in Eliciting
Antigen-Specific CD8+ T Cell Responses
Reprinted from Molecular Therapy: Dietz, WM1, Skinner, NEB1, Hamilton, SE, Jund, MD,
Heitfeld, SM, Litterman, AJ, Hwu, P, Chen, ZY, Salazar, AM, Ohlfest, JR, Blazar, BR,
Pennell, CA, Osborn, MJ. (2013). Minicircle DNA is superior to plasmid DNA in eliciting
antigen-specific CD8+ T-cell responses. Molecular Therapy, doi:10.1038/mt.2013.85.
Copyright 2013 Nature Publishing Group.
1Both first authors made equal contributions to this work. Figures 2.8-2.11 were
generated by NEB Skinner.
INTRODUCTION
Plasmid DNA (pDNA) is an attractive platform for gene delivery in vivo because it
is a non-viral, non-integrating vector that is safe, inexpensive, stable and easily
manipulated (40). As such, it has been evaluated in hundreds of clinical trials (32,63).
Collectively these trials reveal that while pDNA has promise, the major challenge to its
widespread use for the prevention and treatment of human disease is poor protein
production in situ. This results from both low transfection efficiency and low transgene
expression.
Expression of the transgene cassette in pDNA vectors rapidly wanes because
transcriptionally repressive proteins are initially deposited on extragenic DNA, the

19
backbone pDNA located between the 5’ and 3’ ends of the transgene expression
cassette (64,65,67). Chromatin deposition is independent of the sequence, CpG content
and methylation status of the extragenic pDNA but is dependent on its length (68-70,91).
Chromatinization spreads in cis from the extragenic DNA to the transgene cassette,
silencing its expression. This results in a brief burst of protein production in situ followed
by its rapid loss.
MC DNA is similar to pDNA as both contain expression cassettes that permit
transgene products to be made at high levels shortly after delivery in vivo (92). They
differ in that MC DNA is devoid of essentially all prokaryotic sequence elements (e.g.
origin of replication and antibiotic-resistance genes). Removal of these backbone pDNA
sequences is achieved via site-specific recombination in E. coli prior to episomal DNA
isolation (71,93). The lack of these prokaryotic sequence elements also reduces MC size
relative to its parental Fl pDNA, leading to enhanced transfection efficiencies (66). The
net result is that compared to their FL pDNA counterparts, MCs transfect more cells and
permit sustained high level transgene expression upon delivery in vivo. Because of this,
we hypothesized that immune responses elicited by MC vaccines would be more potent
than responses to FL pDNA vaccines encoding the same Ags.
The two main routes for administering pDNA vaccines are intramuscular and
intradermal. The intradermal route is preferred because the skin is a barrier organ
relatively rich in immune sentinel cells that present Ag to the immune system (94,95).
Keratinocytes are critical for maintaining the immunological barrier function of the skin by
initiating inflammation via recognition of damage- and pathogen-associated molecular
patterns by pattern recognition receptors (96). Dermal dendritic cells similarly initiate

20
proinflammatory responses but they also can internalize and present Ag to B and T cells
(94). Intradermal delivery methods for DNA include injection with a hypodermic needle,
bombardment of the skin with DNA-coated gold particles ejected from a gene gun,
topical application, electroporation and tattooing (97-101). Tattooing has the advantage
of being relatively inexpensive and rapid, and the infliction of thousands of perforations
likely serves as an adjuvant. Work by the Haanen group demonstrated that pDNA
delivery to the skin via tattooing elicited more rapid and robust immune responses
specific for the pDNA-encoded Ags than did intramuscular delivery (38).
We used tattooing to deliver FL pDNA and their derivative MC vaccines
intradermally to mice. We found that the level, duration and immunogenicity of the MC
transgene-encoded proteins were all significantly greater than those elicited by the FL
pDNA vaccines, and that the primary and memory immune responses elicited by MC
vaccines conferred significant protection against bacterial infection in a model of
listeriosis. We discuss these results relative to future strategies involving pDNA-based
vaccines.
RESULTS
Efficient production of MC-based expression vectors.
We constructed two series of expression vectors. One encoded enhanced firefly
(eff) luciferase as a reporter to track expression. The other encoded a model peptide to
monitor Ag-specific T cell responses. We chose eff luciferase as a reporter because of
its sensitivity; mouse cells expressing eff luciferase emit > 100 times more light than
cells expressing standard firefly luciferase (102). The model peptide was the chicken

21
ovalbumin-derived peptide SIINFEKL (amino acid residues 257-264). When SIINFEKL is
bound by the mouse major histocompatibility class I molecule H-2Kb, it forms an Ag
recognized by mouse CD8+ T cells bearing the Va2/Vb5 OT-I transgenic TCR (103). Ag-
specific OT-I responses are easily tracked after these cells are adoptively transferred
into C57BL/6 (H-2b) recipients subsequently immunized with the SIINFEKL peptide plus
adjuvant (104). Responses of Ag-specific endogenous CD8+ T cells are also readily
tracked by flow cytometry using fluorophore-labeled SIINFEKL/Kb tetramers (86).
Expression of the eff and Ag genes is controlled by the human ubiquitin C (hUbC)
promoter, chosen because it efficiently drives transgene expression in many mouse
tissues including skin (105).
MC constructs encoding eff or Ag (MC-eff and MC-Ag, respectively) were
generated from FL pDNA precursors (Fig. 2.1a). Briefly, we cloned the hUbC-driven
expression cassettes between the φC31 integrase recognition sites attB and attP in
pMC.BESPX, the MC producer plasmid (71). Upstream of the attB site was a block of 32
tandem repeats of the I-SceI homing endonuclease recognition sequence (106). FL
pDNA was transformed into an E. coli strain (ZYCY10P3S2T) engineered to express
φC31 integrase and I-SceI endonuclease (71). Upon induction, φC31 integrase activity
generated the MC and circular plasmid backbone; the latter was subsequently degraded
by host bacterial exonucleases after linearization by the I-SceI endonuclease.
Densitometry analyses of ethidium bromide-stained agarose gels revealed that less than
2% of the parental FL-eff pDNA remained in the purified MC-eff preparations (Fig. 2.1b).
MC-Ag preparations were comparably pure (data not shown).
22
Enhanced expression of MC-encoded eff luciferase in vitro.
To determine if the expression levels or transfection efficiencies of MC-encoded
genes were enhanced as compared to FL plasmid-encoded genes, we transfected COS
cells transiently with equimolar amounts of MC-eff or FL-eff DNA. Two days later the
cells were analyzed by flow cytometry for intracellular luciferase expression (Fig. 2.2a).
On average approximately 14% of cells transfected with MC-eff expressed luciferase,
more than twice the frequency (6%) of luciferase-expressing cells transfected with an
equimolar amount of FL-eff (Fig. 2.2b). However, the median fluorescent intensities
(MFI) of the two luciferase-expressing populations were comparable (P = 0.65).
Together these data suggest that under the conditions used, the smaller MC-eff (3348
bp) is superior to the larger FL-eff (7262 bp) in transfection frequency but not in gene
expression level on a per cell basis as assessed two days post-transfection.
Enhanced expression of MC-encoded eff luciferase in skin.
Because our goal is to develop MC-based vaccines, we next determined the
intensity and duration of MC gene expression in vivo following intradermal delivery via
tattooing. Each mouse in the experimental cohort was tattooed on the left and right
thighs while lying supine with equimolar amounts of FL-eff and MC-eff DNA,
respectively. Mice in a separate cohort were tattooed with equimolar amounts of FL
pDNA lacking an expression cassette (empty vector control: VC). The mice were then
injected with saturating amounts of D-luciferin substrate on the indicated days and
imaged for bioluminescence (Fig. 2.3a). Expression peaked two to three days post-
delivery in both groups (Fig. 2.3b).

23
The groups differed, though, in that luciferase activity encoded by MC-eff was
consistently and significantly higher than that of FL-eff. Luciferase activity decayed to
background levels by day 42 in the FL-eff cohort but it remained detectable in the MC-eff
cohort throughout the 63-day observation period. It is noteworthy that the MC-eff
luciferase activity on day 63 was comparable to the FL-eff peak response on day 3. It
also took twice as long for luciferase activity to decay to levels significantly lower (P <
0.05; paired t test) than the peak response in MC-eff (56 days) versus FL-eff (28 days)
mice. Together these data indicate that luciferase expression in the skin persists
significantly longer and at significantly higher levels in mice tattooed with MC-eff relative
to FL-eff.
Enhanced presentation of MC-encoded Ag in vitro.
As a prelude to vaccination, we assessed Ag secretion and presentation in vitro
by transfecting a dendritic cell line, DC2.4 (H-2b haplotype) with equimolar amounts of
VC, FL-Ag or MC-Ag DNA. The Ag cassette encoded the chicken ovalbumin-derived
peptide SIINFEKL linked to a secretion sequence and a histidine tag (Supplementary
Fig. 2.4). Western blot analysis of transiently transfected COS cells revealed the Ag was
secreted (data not shown). To measure presentation of the SIINFEKL peptide, we
analyzed DC2.4 cells one, three and five days after transfection for reactivity with 25-
D1.16 (Fig. 2.5a). This monoclonal antibody specifically binds SIINFEKL only when
presented by H-2Kb(107). The frequency of cells bearing detectable SIINFEKL/H-2Kb
complexes was significantly higher and persisted longer in the MC-Ag transfectants as
compared to the FL-Ag transfectants (Fig. 2.5b). These MC-Ag transfectants also

24
expressed significantly higher levels of SIINFEKL/H-2Kb complexes than the FL-Ag
transfectants, as measured by MFI (Fig. 2.5c). This level of enhanced Ag expression in
the MC-Ag versus the FL-Ag transfectants on a per cell basis contrasts with the
comparable levels of eff expression level in the MC-eff and FL-eff transfectants noted
above. We speculate that the SIINFEKL/H-2Kb complexes on the cell surface have a
greater half-life than intracellular eff. An alternative, but not mutually exclusive, possibility
is that the Ag-transgene encoded protein containing the SIINFEKL peptide and the eff
protein are degraded at similar rates but the resultant pool of SIINFEKL peptides
provides a reservoir for prolonged presentation by H-2Kb.
Enhanced immunogenicity of MC-encoded Ag in vivo in an adoptive transfer
model.
To determine if the enhanced presentation of MC-encoded Ag observed in vitro
corresponded to increased immunogenicity in vivo, we adoptively transferred equal
numbers of CD8+ OT-I (Thy1.1+) cells into congenic C57BL/6 (Thy1.2+) mice and
tracked the OT-I cell responses following DNA immunization. One day after OT-I cell
adoptive transfers, recipients were tattooed with equimolar amounts of VC, FL-Ag or
MC-Ag DNA. At the peak of the response seven days later, flow cytometry was used to
identify OT-I cells by their expression of CD8 and the allelic marker Thy1.1. The
proliferative responses of OT-I cells, as measured by an increase in absolute OT-I cell
numbers, in MC-Ag immunized mice were significantly greater than the responses in
mice immunized with FL-Ag or VC. This was true in the spleen (Fig. 2.6a) and draining
LN (data not shown). To assess their functionality, OT-I cells from immunized mice were
25
stimulated briefly in vitro with cognate Ag (syngeneic H-2b splenocytes pulsed with
SIINFEKL peptide) and examined for IFN-γ expression. IFN-γ was expressed by
significantly more OT-I cells from mice immunized with MC-Ag than from mice
immunized with FL-Ag (Fig. 2.6b). Moreover, the levels of intracellular IFN-γ tended to
be higher in OT-I cells from MC-Ag immunized mice than in FL-Ag immunized mice
(MFIs of 370 versus 235, respectively).
To assess in vivo cytotoxicity, C57BL/6 mice were adoptively transferred with
OT-I cells and the next day immunized with equimolar amounts of VC, MC-Ag or FL-Ag
DNA via tattooing. One week later these mice were injected with equal numbers of
SIINFEKL-pulsed syngeneic splenocytes labeled with 5 μM 5-(and-6)-carboxyfluorescein
diacetate, succinimidyl ester (CFSEhigh) and unpulsed syngeneic splenocytes labeled
with 10-fold less CFSE (CFSElow). The loss of CFSEhigh (Ag-positive) relative to CFSElow
(Ag-negative) cells provided a measure of OT-I cytolytic activity in vivo (Fig. 2.7a) (108).
Ag-specific cytolytic activity in MC-Ag immunized mice was significantly greater than that
in FL-Ag immunized mice (Fig. 2.7b). OT-I cytolytic activity was comparable between
mice immunized with MC-Ag DNA and SIINFEKL peptide plus complete Freund’s
adjuvant (positive control; Fig. 2.7b). The latter is remarkable given the 3,700 molar
excess of peptide (52 nmol) relative to MC-Ag DNA (14 pmol), and that pDNA
transfection efficiencies in vivo are poor (101). Together these data indicate MC-Ag
immunization elicits a significantly greater OT-I response than does immunization with
FL-Ag pDNA.
Superior protection from a MC vaccine in model of listeriosis.

26
Vaccine efficacy is measured by the ability of endogenous Ag-specific immune
cells to protect a vaccinated animal from a subsequent pathogen challenge. To
determine if MC immunization enhanced the responses of endogenous Ag-specific
CD8+ T cells, we first tracked the frequencies of SIINFEKL/Kb tetramer-binding CD8+ T
cells in immunized C57BL/6 mice that had not been adoptively transferred with OT-I
cells. Bins et al. showed that three intradermal immunizations three days apart were
required for an optimal immune response to a pDNA-encoded Ag which peaked five
days after the third immunization (38). We replicated this immunization scheme by
tattooing mice three times, three days apart (on d0, d3, and d6) with equimolar amounts
of VC, MC-Ag or FL-Ag DNA. One day after each immunization, mice were injected
subcutaneously at the tattoo site with polyIC, a TLR 3 agonist that serves as an adjuvant
by eliciting type I interferons (109). The peak response in our immunized mice also
occurred five days after the third immunization (on d11), as measured by the frequencies
of SIINFEKL/Kb tetramer-binding CD8+ T cells in the peripheral blood taken over time
(data not shown). Mice immunized with MC-Ag had significantly higher frequencies of
tetramer-binding CD8+ T cells on d11 than mice immunized with either the FL-Ag or VC
pDNA (Fig. 2.8).
We next asked if vaccination with MC-Ag DNA protected mice from a challenge
of Listeria monocytogenes engineered to express the model Ag, chicken ovalbumin (LM-
OVA) (110). Listeria monocytogenes is a gram-positive intracellular bacterium that can
cause fatal listeriosis in neonates, pregnant women, and immunosuppressed individuals
(111). LM-OVA is particularly useful because it provides a well-defined T cell Ag (e.g.
SIINFEKL peptide presented by H-2Kb) and because CD8+ T cells are necessary for
27
induction of protective immunity to the pathogen (112). Mice were immunized as
described above except that polyIC was replaced with polyICLC because of the latter’s
enhanced pharmacokinetics (113). At the peak of the immune response five days after
the last immunization (d11), all mice were challenged intravenously with LM-OVA
bacteria. Mice were euthanized five days after bacterial challenge (d16) and the
frequencies of peripheral blood and splenic CD8+ T cells binding the SIINFKEL/Kb
tetramer were determined by flow cytometry. Bacterial burden was measured as the
number of colony forming units (CFUs) of LM-OVA in the spleen.
Consistent with the d11 results, on d16 there were significantly higher
frequencies of Ag-specific CD8+ T cells in the peripheral blood and spleens of mice
immunized with MC-Ag than in mice immunized with FL-Ag or VC DNA (Fig. 2.9a and
2.9b, respectively; gating strategies shown in Fig. 2.10). Vaccination with MC-Ag DNA
correspondingly conferred significant protection to challenge with LM-OVA. Bacterial
burden was significantly reduced in mice immunized with MC-Ag as compared to FL-Ag
or VC (Fig. 2.9c). Although the numbers of CFUs were not significantly different between
the FL-Ag and VC groups, challenge with a lower dose of LM-OVA showed a protective
effect of FL-Ag immunization (Fig. 2.11).
To test whether the memory response elicited by MC-Ag DNA was also superior
to that elicited by FL-Ag DNA, mice were challenged with LM-OVA on d36, 30 days after
the last DNA immunization. All mice were euthanized five days after bacterial challenge
(d41) to measure bacterial burden in their spleens and the frequencies of peripheral
blood and splenic CD8+ T cells binding the SIINFKEL/Kb tetramer. Although the
frequencies of Ag-specific CD8+ T cells in the peripheral blood (Fig. 2.9d) and spleens

28
(Fig. 2.9e) of mice immunized with MC-Ag, FL-Ag or VC DNA were not significantly
different, vaccination with MC-Ag DNA 30 days prior to LM-OVA challenge conferred
significant protection (Fig. 2.9f). We speculate that infection leads to priming of naïve
SIINFEKL-specific cells in all groups, which masks the proliferation of memory cells in
immunized mice. Together these data suggest vaccination with MC DNA encoding a
pathogen-associated Ag can provide protection from a subsequent challenge with the
corresponding pathogen.
DISCUSSION
Our data indicate MC DNAs delivered via tattooing are superior to their FL
counterparts in terms of the expression levels and duration, as well as the
immunogenicity, of the proteins they encode. The enhanced levels and duration of
protein expression we observe in the skin corroborate studies of MC DNA delivered to
various tissues via other routes for gene therapy (93,114,115). The novelty of our report
lies in the enhanced Ag-specific CD8+ T cell response to an epitope encoded by a MC
delivered intradermally. This enhanced response conferred significant protection to mice
challenged with Listeria monocytogenes expressing the MC-encoded Ag.
Standard pDNA has two components: the bacterial backbone required for
plasmid propagation in bacteria and the transcription cassette for expression in
mammalian cells. Removal of the bacterial backbone reduced the size of MC DNA
relative to pDNA by approximately 50%. pDNA size is inversely related to transfection
efficiency (66) and correspondingly, the transfection efficiency and expression levels of
MC are higher than pDNA levels (92,115,116). Accordingly we showed transfection of

29
cells in vitro with MC resulted in higher rates of gene transfer (Fig. 2.2a). This was also
true in vivo, as evidenced by the ≥ 10-fold levels of luciferase activity in mice tattooed
with MC-eff compared to FL-eff at all time points measured (Fig. 2.3b).
Similarly, the significantly higher frequencies of effector Ag-specific CD8+ T cells
measured five days following MC-Ag DNA immunization most likely reflected higher
transfection efficiencies relative to FL-Ag DNA. We speculate that the Ag provided by the
MC DNA and the adjuvant effect resulting from the thousands of needle pricks inflicted
by the tattoo device combine to produce a local microenvironment conducive for naïve
OT-I CD8+ T cell activation. It is unlikely anything other than inflammation induced by the
needle pricks serves as an adjuvant because the needles are sterile, the tattoo site is
wiped with ethanol to minimize introduction of skin commensals, and the DNA
preparations have exceedingly low endotoxin levels (≤ 0.1 pg/μg DNA). However, the
adjuvanticity of the needle pricks was insufficient to elicit significant numbers of
endogenous Ag-specific CD8+ T cells (data not shown), necessitating the use of
polyICLC. This need for a greater immunostimulatory microenvironment may reflect the
much lower precursor frequency of endogenous SIINFKEL/Kb specific CD8+ T cells
(100-200 cells/mouse) (14) as compared to the frequency of OT-I cells in adoptively
transferred mice.
Because the majority of cells transfected by tattooing pDNA are likely
keratinocytes (101), we included a secretory signal in the Ag expression cassette. Our
rationale was that secreted Ag by transfected cells could drain to the regional LN for
presentation or be internalized by resident APCs in the skin. These cells could then
migrate to the draining LN and cross-present SIINFKEL/Kb to naïve CD8+ T cells. This is

30
consistent with reports that dermal DCs are required to stimulate naïve CD8+ T cells
upon intradermal immunization with pDNA (117). Studies of pDNA-encoded Ags
delivered intradermally suggest, though, that transfection of Ag-presenting cells
themselves is the key event required to elicit specific CD8+ T cell responses. Ag
expression in keratinocytes failed to elicit specific CD8+ T cell responses upon
intradermal delivery of pDNA containing a K14 promoter, whereas Ag expression in
dermal DCs (via a CD11c promoter) did (41). Moreover, depletion of Ln+ dDCs ablated
the response of CD8+ T cells to Ag encoded by pDNA delivered intradermally,
suggesting that specific delivery of MC to dermal DCs should further enhance
immunogenicity upon tattooing. It remains to be determined if differential cellular uptake
of MC versus FL DNA impacts both the length of expression and the nature of the
immune response.
In addition to enhancing transfection efficiency, a second critical benefit to the
removal of the plasmid backbone elements relates to their role in gene silencing. We
have shown that the deposition of heterochromatin on the bacterial sequences causes
the loss of expression that is independent of DNA methylation, CpG content, immune
cell clearance, and plasmid copy number (68,69,72,91). More recent studies confirm
silencing is sequence independent but unexpectedly is dependent on sequence length
(70). Silencing requires the plasmid DNA separating the 5’ and 3’ ends of the transgene
expression cassette to be ≥ 1 kb; silencing does not occur when this extragenic DNA is <
0.5 kb. In our MC constructs, the extragenic DNA is < 40 bp. It remains unclear why
transgene silencing does not occur with shorter extragenic DNA.

31
The near complete absence of plasmid backbone elements most likely allowed
expression of the eff transgene encoded by MC DNA to persist throughout the duration
of the nine-week observation period. It is noteworthy that MC-eff expression at seven
weeks was comparable to that at one day. This was unexpected because 33-44% of
C57BL/6 keratinocytes are replaced weekly and keratinocytes are the predominant cell
type in the skin (118). Moreover, van den Berg et al. reported that 99% of human skin
cells transfected by pDNA delivered via tattooing were keratinocytes (101). The
persistence of eff luciferase expression we observe is consistent with the transfection of
longer-lived progenitor cells in the skin, such as hair follicle-associated dermal
precursors (119).
The duration of Ag expression following intradermal immunization with pDNA
affects CD8+ T cell responses to the encoded Ag (120). Hovav et al. reported that APC
activity slowly increased over a two-week period following injection of pDNA into the ear
pinnae of mice (121). Removal of the ear pinnae at various times post-immunization
diminished this activity and the resultant primary specific CD8+ T cell responses. These
data suggest a depot of Ag controls CD8+ T cell expansion at the level of Ag
presentation. A persistent Ag depot afforded by MC immunization arguably could permit
sustained CD8+ T cell responses through the initial activation of naïve CD8+ T cells and
the persistent reactivation of resultant memory cells or through modification of the
kinetics of memory CD8+ T cell differentiation, as Hovav et al. suggest (121). Our data
showing enhanced protection to LM-OVA challenge 30 days after immunization with MC-
Ag DNA is consistent with this possibility. Alternatively, higher Ag transgene expression
following MC-Ag DNA immunization could have generated greater numbers of Ag-

32
specific CD8+ T cells which in turn, yielded higher frequencies of Ag-specific memory
CD8+ T cells. Regardless, the combination of Ag and coadministered proinflammatory
cytokines/chemokine all encoded by MC might establish a long-lived immunostimulatory
microenvironment in the skin, leading to efficacious anti-pathogen and anti-tumor
immunity.
In conclusion we show for the first time the applicability of MC DNA to mediate
long-term expression of transgenes when delivered intradermally. Although the
immunogenicity of the MC-encoded Ags undoubtedly needs to be increased for the MC
platform to serve as a potent vaccine, this clinically relevant delivery method and the
inherent safety benefit of the non-integrating MC DNA represents a novel approach
toward DNA-based therapies.
MATERIALS AND METHODS
DNA constructs. The plasmid backbone for the FL constructs (pMC.BESPX.MCS1)
contains the requisite sequences for bacterial propagation (e.g. the pUC origin of
replication), the kanamycin-resistance gene, the φC31 integrase recognition sites attB
and attP, and a block of 32 tandem repeats of the recognition sequence for the I-SceI
homing endonuclease (71).
To generate the FL-eff construct, the eff gene was amplified from the pUltra
Bright eff luciferase+ plasmid(102) and inserted into a vector containing the bovine
growth hormone polyadenylation signal (BpA). The luciferase-BpA fragment was then
PCR amplified. In a parallel PCR reaction the hUbC promoter (a generous gift from
Michael Kyba, University of Minnesota, Minneapolis, MN) was amplified. The hUbC

33
amplicon contains a 5’ overlap region with the pMC.BESPX plasmid upstream of the
EcoRI site and an overlapping region with the eff 5’ sequence. The luciferase/BpA
amplicon contains an overlap region with the pMC.BESPX plasmid downstream of the
EcoRV site. The two PCR products and the EcoRI/EcoRV digested pMC.BESPX were
subjected to a one-step isothermal DNA assembly protocol allowing for seamless joining
of the overlapping fragments (122).
A similar strategy was utilized to generate the FL-Ag construct containing the
hUbC promoter-driven Ag cassette. The cassette encodes a signal sequence, a 10x
histidine tag, a linker and a region that includes the chicken ovalbumin-derived peptide
SIINFEKL (Fig. 2.4). It was amplified from a codon-optimized synthetic gene (GenScript,
Piscataway, NJ) and inserted upstream of BpA. Overlapping PCR products for cloning
hUbC-Ag-BpA were generated and isothermally assembled into pMC.BESPX.
Sequences of all amplifying primers are available upon request from the authors.
All PCR reactions were performed using Phusion® High-Fidelity DNA
Polymerase (New England BioLabs, Ipswich, MA) under the following conditions: 98°C x
30 seconds, followed by 35 cycles of 98°C x 10 seconds, 60°C x 30 seconds, and 72°C
x 120 seconds. Plasmids containing the eff or Ag cassettes were then transformed into
the ZYCY10P3S2T bacterial strain. ZYCY10P3S2T bears ten copies of the φC31
integrase gene, three copies of the I-SceI homing endonuclease gene, and the araE and
LacY arabinose transporter genes that constitutively express proteins importing
arabinose to induce φC31 integrase and I-SceI endonuclease expression (71). For FL
pDNA preparation, transformed bacteria were grown in LB-broth (Invitrogen, Carlsbad,
CA) supplemented with kanamycin. pDNA was isolated using the GenElute Endtoxin-

34
free Plasmid Maxiprep Kit (Sigma-Aldrich, St Louis, MO) according to the manufacturer’s
instructions. For MC generation, bacteria transformed with FL pDNA were grown
overnight in Terrific Broth supplemented with kanamycin (Invitrogen). The following day
MC induction media (fresh LB broth containing 0.04 volumes of 1N NaOH and 0.02% L-
arabinose (Sigma-Aldrich, St Louis, MO)) were added and the culture temperature was
decreased from 37˚C to 32˚C for 5-8 hours. The culture was centrifuged and MC DNA
was purified with the GenElute Endtoxin-free Plasmid Maxiprep Kit by increasing the
recommended volumes of buffers six-fold and using four columns. Following elution in
water, the DNA was concentrated to 4-6 μg/μl by ethanol precipitation, resuspended in
water and stored at -20°C.
Sequence analyses verified the genes encoded by the FL pDNAs and their
derivative MCs were identical. The amounts of residual FL pDNA in the MC DNA
preparations were evaluated by KpnI (FL pDNA) or StuI (MC DNA) restriction
endonuclease-mediated linearization, followed by agarose gel electrophoresis and DNA
visualization using ethidium bromide (Fig. 2.1b). For the GenElute Endtoxin-free Plasmid
Maxiprep Kits, the manufacturer defines “endotoxin-free” as ≤ 0.1 endotoxin unit/μg
DNA. The levels of endotoxin in MC and FL pDNA preparations were measured by the
ToxinSensor Chromogenic LAL Endotoxin Assay Kit (GenScript, Piscataway, NJ) and
were all found to be < 0.001 endotoxin unit/μg DNA (< 0.1 pg endotoxin/μg DNA).
Cell lines and transfections. COS cells were maintained in complete Dulbecco’s
modified Eagle’s medium (Invitrogen) supplemented with 10% fetal bovine serum
(Invitrogen) and DC2.4 cells were maintained in complete RPMI 1640 (Invitrogen)

35
supplemented with 10% fetal bovine serum at 37°C with 5% CO2. Adherent cells were
dissociated from tissue culture flasks with TrypLE Express (Invitrogen) and plated in 6
well tissue culture-treated plates (BD Biosciences, San Jose, CA) at equal numbers (2-5
x 105 cells) per well without antibiotics. Cells were transfected the next day using
Lipofectamine LTX with PLUS Reagent (Invitrogen) according to the manufacturer’s
protocol. COS cells were transfected with 2.5 μg (1.1 pmol) per well of MC-eff or
equimolar amounts of VC or FL-eFF and were harvested two days later for flow
cytometry analysis. DC2.4 cells were transfected with 2.6 μg (1.8 pmol) of MC-Ag per
well or equimolar amounts of VC or FL-Ag and were harvested one, three and five days
later for flow cytometry analysis.
Measurements of eff and Ag expression by flow cytometry. Staining for intracellular
eff luciferase in COS cells was carried out using the BD Cytofix/Cytoperm kit (BD
Biosciences) according to the manufacturer’s protocol. Fixed and permeabilized cells
were incubated with an anti-luciferase-FITC conjugate (Lifespan Biosciences, Seattle,
WA) for 20 minutes. The DC2.4 cells were analyzed for cell surface Ag presentation
using a 25-D1.16-APC conjugate (eBioscience, San Diego). 25-D1.16 is an antibody
specific for the SIINFEKL/H-2Kb complex (107). Cells were stained at 4°C for 30
minutes. Data were acquired on a BD FACSCalibur flow cytometer (BD Biosciences)
using BD CellQuest Pro software (BD Biosciences) and analyzed with FlowJo software
(Tree Star, Inc., Ashland, OR). Data are reported as the percentage and median
fluorescent intensity (MFI) of cells in a defined gated population.

36
Mice. Four to eight week old female C57BL/6 mice were purchased from the Jackson
Laboratory (Bar Harbor, ME) or the National Cancer Institute (Frederick, MD). C57BL/6-
Tg(TcraTcrb)1100Mjb/J (OT-I) Thy1.1+/Thy1.2+ mice were a generous gift from Dr.
Stephen Jameson at the University of Minnesota (Minneapolis, MN). All mice were
housed under specific pathogen free-conditions at the University of Minnesota
(Minneapolis). All animal procedures were carried out according to protocols approved
by the Institutional Animal Care and Use Committee.
OT-I adoptive cell transfer. All work was carried out under asceptic conditions using
sterile reagents. OT-I mice were euthanized and LNs were harvested. Single cell
suspensions were prepared and cells were washed in phosphate buffered saline (PBS)
supplemented with 2% (v/v) fetal bovine serum (Invitrogen). Cells were counted and
analyzed by flow cytometry to determine the percentage and number of OT-I cells with
the following antibody-fluorochrome conjugates: CD44-fluorescein isothiocyanate (FITC),
B220-phycoerythrin (PE), and CD8-allophycocyanin (APC) (eBioscience) and Thy1.1-
Peridinin Chlorophyll Protein Complex (PerCP) (BD Pharmingen, San Diego, CA). The
OT-I phenotype was B220-CD8+Thy1.1+. Additionally, the OT-I cells were CD44low,
indicating they were naïve at the time of transfer. To determine the cell count, PKH26
Reference Beads (Sigma-Aldrich) were mixed with cells; 5,000 bead events were
collected on the flow cytometer. The following equation was used to determine the
number of lymphocytes: # cells/ml = (# cells acquired x dilution factor of cells x # singlet
beads/ml) / (# beads acquired x dilution factor beads). Cell counts were verified
manually using a hemocytometer. Data were acquired on a BD FACSCalibur flow

37
cytometer (BD Biosciences) using BD CellQuest Pro software (BD Biosciences) and
analyzed with FlowJo software (Tree Star, Inc., Ashland, OR). Cells were washed in
PBS with 1% (v/v) fetal bovine serum and then in PBS before being resuspended at 106
cells/ml in PBS. 105 cells were transferred into each anesthetized mouse via retro-orbital
injection using 1ml tuberculin syringes and 27 gauge needles.
DNA immunizations. Mice were anesthetized and their inner hind legs were shaved
and wiped with 70% ethanol. Based on pilot experiments, mice were immunized with 20
μg of MC DNA in 10-15 μl volumes. This mass converts to 9.2 and 13.8 pmol for MC-
eFF and MC-Ag, respectively. Equimolar amounts of VC and the corresponding FL
pDNA samples were diluted in sterile water to the same volumes. All DNA was delivered
intradermally over an area of approximately 1 cm2 for 30 seconds using a Cheyenne
Hawk PU II tattoo device (Unimax Supply Co. Inc., New York, NY) set at 110 Hz using 9-
point needles adjusted to a depth of 0.5 mm. Mice were immunized once for adoptive
transfer experiments. For endogenous T cell tracking and LM-OVA challenge
experiments mice were immunized three times, three days apart and 10 μg of polyIC
(Sigma) or polyICLC (Oncovir) adjuvant were administered subcutaneously 24 hours
after each immunization in the same inner hind leg as the DNA.
Bioluminescence measured in vivo. Mice were imaged for bioluminescence using a
Xenogen IVIS Imaging System (Caliper Life Sciences, Hopkinton, MA). Animals were
imaged daily for 18 days and then weekly from days 21 to 63. Mice were injected
intraperitoneally with 100 μl of 30 mg/ml D-luciferin and anesthetized with isoflurane.

38
Bioluminescence was measured for 5 minutes. Data were analyzed using Living Image
2.5 Software (Caliper Life Sciences).
CD8+ T cell proliferation and function assays. Mice were adoptively transferred with
105 OT-I cells and the next day immunized with DNA using a tattoo device as described
above. Splenocytes and the draining inguinal lymph nodes were harvested seven days
later and analyzed by flow cytometry for percentages of OT-I cells. Functionality was
assessed by IFN-γ production following a brief exposure of cells to Ag in vitro.
Splenocytes were incubated with or without 1μM SIINFEKL for 4 hours at 37°C and then
examined for extracellular expression of CD8 and Thy1.1 (to identify OT-I cells) and
intracellular expression of IFN-γ using BD Cytofix/Cytoperm kit (BD Biosciences). Data
were acquired on a BD FACSCalibur flow cytometer (BD Biosciences) using BD
CellQuest Pro software (BD Biosciences) and analyzed with FlowJo software (Tree Star,
Inc., Ashland, OR).
In vivo cytotoxicity. C57BL/6 mice were adoptively transferred with 106 OT-I cells and
were immunized the next day with equimolar amounts of DNA using the tattoo device as
described above. Eight days later these mice were adoptively transferred with equal
numbers (107 each) of syngeneic splenocytes that had been pulsed or not with
SIINFEKL peptide (1 μg peptide per 2.5 x 10⁷ cells for one hour at 37˚C). To distinguish
these cells from one another and from host cells, peptide-pulsed and unpulsed
splenocytes were respectively labeled with 5 and 0.5 μM CFSE. Fourteen hours later,
the mice were euthanized and their splenocytes harvested and analyzed by flow

39
cytometry for percentages of CFSEhigh (peptide pulsed) and CFSElow (unpulsed control)
cells. The percent specific killing was determined using the following formula: [1-(ratio in
VC-immunized mouse/ratio in FL-Ag or MC-Ag-immunized mouse)] x 100 (108).
Endogenous T cell analysis. Peripheral blood samples taken from the facial vein and
single cell suspensions prepared from harvested spleens were incubated with CD44-
FITC, CD8-APC (eBioscience) and SIINFEKL/H-2Kb tetramer formed with streptavidin
coupled to PE. Splenocytes were counted manually using a hemocytometer. Data were
acquired on a BD FACSCalibur flow cytometer (BD Biosciences) using BD CellQuest Pro
software (BD Biosciences) and analyzed with FlowJo software (Tree Star, Inc., Ashland,
OR).
Infection with LM-OVA. Mice were infected with 4-6 x 10⁴ CFU intravenously in the tail
vein five days after the last immunization. Bacteria were grown in tryptic soy broth (TSB)
with 50 μg/ml of streptomycin to an absorbance at 600 nm of about 0.1. Actual numbers
of CFU injected were determined for each experiment by plate count. Five days
following infection, mice were bled from the facial vein, sacrificed, and their spleens
harvested. Half of the cells from each spleen were used for flow cytometric analysis and
the other half were serially diluted and plated on tryptic soy agar plates containing
streptomycin. Bacterial colonies were counted after plate incubation for 24 hours at 37
°C.

40
Statistical analysis. Data were graphed and analyzed using Prism v5.0c (GraphPad
Software, Inc., La Jolla, CA). Statistical analyses were performed by the unpaired two-
tailed Student’s t-test unless noted otherwise.

41
FIGURES
Fig. 2.1. Minicircle derivation. (a) Plasmid construct and minicircle generation. The expression cassette is cloned between the φC31 integrase recognition sites attB and attP in the minicircle producer plasmid pMC.BESPX, which also contains I-SceI homing endonuclease recognition sequences. Following transformation of the E. coli strain ZYCY10P3S2T with a full-length (FL) parental plasmid, φC31 integrase activity generates a minicircle (MC) containing the expression cassette and a circular plasmid backbone; the latter is subsequently degraded by host exonucleases following linearization by the I-SceI endonuclease. (b) Agarose gel electrophoresis analysis of linearized FL plasmid encoding eff (FL-eff) and its MC derivative (MC-eff). The arrow indicates residual FL plasmid in the purified MC-eff DNA preparation. Sizes of the DNA species are noted next to each band. eff, enhanced firefly luciferase; FL-eff, full-length plasmid encoding eff; I-SceI x32, 32 tandem repeats of the I-SceI homing endonuclease recognition sequence; Kanr, kanamycin resistance gene; MC-eff, minicircle encoding eff; mw, molecular weight standards; pUC, plasmid origin of replication.
42
Fig. 2.2. Enhanced expression of minicircle-encoded eff in vitro. COS cells were transiently transfected with equimolar amounts (1.1 pmol; 2.5 μg MC-eff) of each DNA species. A luciferase-specific antibody was used to determine the frequencies of luciferase-expressing cells 48 hours later. (a) Flow cytometric analysis of transfected COS cells. These are representative flow cytometry contour plots used to determine the frequencies of eff-positive COS cells shown in b. (b) Frequencies of luciferase-positive COS cell transfectants. Data are presented as means ± SEM (n = 3)(P** < 0.01) and represent three experiments. eff, enhanced firefly luciferase; FL-eff, full-length plasmid encoding eff; MC-Ag, minicircle encoding eff; VC, empty full-length plasmid vector control.

43
Fig. 2.3. Enhanced intensity and duration of minicircle-encoded eff expression in the skin. The ventral skin on both thighs of C57BL/6 mice was tattooed with equimolar (9.2 pmol; 20 μg eff-encoding minicircle DNA) amounts of empty full-length plasmid vector control (VC), full-length (FL-eff) plasmid encoding enhanced firefly (eff) luciferase, or the eff-encoding minicircle (MC-eff) derivative. (a) Xenogen IVIS imaging of in vivo luciferase activity four days post-gene delivery. FL-eff and MC-eff luciferase activities are shown on the left and right thighs, respectively, of the first four mice as they lie in the supine position. (b) Quantitative long-term in vivo luciferase expression. The data for the FL-eff and MC-eff cohorts are presented as the mean ± SEM (n = 4), corrected for background bioluminescence. Values for the VC cohort (n = 4) never exceeded background and are not shown. Luciferase activity in the FL-eff and MC-eff cohorts was significantly different (P < 0.05) on each day analyzed except the first day (P < 0.06). This is representative of two similar experiments. eff, enhanced firefly luciferase; FL-eff, full-length plasmid encoding eff; MC-eff, minicircle encoding eff; VC, empty full-length plasmid vector control.

44
Fig. 2.4. Single letter amino acid sequence of Ag insert. The signal sequence is underlined. The 10x histidine tag is italicized. The ovalbumin-derived SIINFEKL peptide is bold faced. The SIINFEKL epitope is embedded in a larger peptide to facilitate Ag processing.

45
Fig. 2.5. Enhanced presentation of minicircle-encoded Ag by dendritic cells. Cells from the C57BL/6-derived dendritic cell line DC2.4 were transiently transfected with equimolar (1.8 pmol; 2.8 μg MC-Ag) amounts of empty full-length plasmid vector control (VC), full-length plasmid encoding the chicken ovalbumin-derived peptide SIINFEKL, or the SIINFEKL-encoding minicircle derivative of the full-length plasmid. The latter two samples are respectively abbreviated FL-Ag and MC-Ag, as SIINFEKL presented by the MHC class I molecule H-2Kb is an Ag recognized by specific CD8+ T cells. Cells were analyzed by flow cytometry for presentation of SIINFEKL by H-2Kb, as determined by reactivity with the monoclonal antibody 25.D1-16. (a) Flow cytometric analysis of transfected DC2.4 cells. These are representative flow cytometry contour plots (day three) used to determine the frequencies of Ag-positive DC2.4 cells shown in b. (b) Frequencies of Ag-positive DC2.4 cells. Data are presented as the means ± SEM (n = 3)(P*** < 0.001) and represent three experiments. (c) Median fluorescent intensities (MFI) of Ag-positive DC2.4 cells. Data are presented as the MFI ± SD (n = 3)(P*** <

46
0.001) and represent three experiments. Ag, antigen (SIINFEKL/H-2Kb); FL-Ag, full-length plasmid encoding SIINFEKL; MC-Ag, minicircle-encoding SIINFEKL: VC, empty full-length plasmid vector control.

47
Fig. 2.6. Enhanced activation of Ag-specific CD8+ T cells in vivo following immunization with MC-Ag. C57BL/6 mice were adoptively transferred with OT-I cells and 24 hours later tattooed with equimolar (13.8 pmol; 20 μg MC-Ag) amounts of vector control (VC), full-length plasmid encoding SIINFEKL (FL-Ag), or the SIINFEKL-encoding minicircle derivative (MC-Ag). Mice were sacrificed one week later and their splenocytes analyzed by flow cytometry. (a) OT-I cell quantification. OT-I cells were identified by their expression of CD8 and Thy1.1 (CD57BL/6 endogneous CD8+ T cells express Thy1.2). (b) Frequencies of IFN-γ + OT-I cells. Splenocytes from adoptively transferred, immunized mice were incubated with or without SIINFEKL peptide in vitro before analysis by flow cytometry for intracellular IFN-γ expression. Data are presented as the means ± SEM (n = 3) and represent three experiments. (P* < 0.05). FL-Ag, full-length plasmid encoding SIINFEKL; MC-Ag, minicircle-encoding SIINFEKL; VC, empty full-length plasmid vector control.

48
Fig. 2.7. Enhanced cytolytic activity of Ag-specific CD8+ T cells following immunization with MC-Ag. C57BL/6 mice were adoptively transferred with OT-I cells and 24 hours later tattooed with equimolar (13.8 pmol; 20 μg MC-Ag) amounts of empty full-length plasmid vector control (VC), full-length plasmid encoding the SIINFEKL peptide (FL-Ag), or the SIINFEKL-encoding minicircle derivative (MC-Ag) of the full-length plasmid. Control mice were immunized subcutaneously with 50 μg SIINFEKL peptide emulsified in complete Freund’s adjuvant (CFA). Eight days later, mice were adoptively transferred with equal numbers of syngeneic splenocytes pulsed with SIINFEKL peptide (labeled with 5 μM CFSE) and unpulsed splenocytes (labeled with 0.5 μM CFSE). Mice were sacrificed 14 hours later and their splenocytes analyzed by flow cytometry for the frequencies of CFSElow (unpulsed) and CFSEhigh (peptide-pulsed) cells. (a) Representative histograms of CFSElow and CFSEhigh cells. The numbers show the frequencies of CFSElow and CFSEhigh cells in the CFSE+ populations in immunized mice. (b) Ag-specific in vivo cytolytic activity. The frequency of unpulsed cells (CFSElow) was divided by the frequency of peptide-pulsed cells (CFSEhigh) to determine the ratio of Ag-negative to Ag-positive target cells in each mouse. These ratios were then used to calculate the percent Ag-specific cytolytic activity by the equation: [1-(VC ratio/FL-Ag or MC-Ag ratio)] x 100]. Data are presented as means ± SEM (n = 5)(P* < 0.05;P** < 0.01) and represent three replicate experiments. CFA, complete Freund’s adjuvant; CFSE, 5-(and-6)-carboxyfluorescein diacetate, succinimidyl ester; FL-Ag, full-length plasmid encoding SIINFEKL; MC-Ag, minicircle encoding SIINFEKL; VC, empty full-length plasmid vector control.

49
Fig. 2.8. Enhanced expansion of endogenous Ag-specific CD8+ T cells in vivo following immunization with MC-Ag. C57BL/6 mice were immunized via tattooing three times, three days apart (d0, d3, and d6) with equimolar (13.8 pmol per immunization; 20 μg MC-Ag) amounts of vector control (VC), full-length plasmid encoding SIINFEKL (FL-Ag), or the SIINFEKL-encoding minicircle derivative (MC-Ag). Twenty-four hours after each immunization, mice were injected subcutaneously on the ventral portion of the tattooed thigh with 10 μg of polyIC. Five days following the last immunization (d11), the mice were bled via the facial vein. (a) Representative flow cytometry plots showing the gates set on CD8+ SIINFEKL/Kb tetramer-binding subsets of lymphocytes. Cells were identified by reactivity with anti-CD8-APC monoclonal antibody and SIINFEKL/Kb–PE tetramer. (b) Frequency of Ag-specific CD8+ T cells. Data are presented as the mean ± SEM (n = 5) (P* < 0.05; Kruskal-Wallis test corrected with a

50
Dunn’s multiple comparison test) and represent three experiments. FL-Ag, full-length plasmid encoding SIINFEKL; MC-Ag, minicircle-encoding SIINFEKL: VC, empty full-length plasmid vector control.

51
Fig. 2.9. Enhanced protection from challenge with Listeria monocytogenes following immunization with MC-Ag. C57BL/6 mice were immunized via tattooing three times, three days apart (d0, d3, and d6) with equimolar (13.8 pmol per immunization; 20 μg MC-Ag) amounts of vector control (VC), full-length plasmid encoding SIINFEKL (FL-Ag), or the SIINFEKL-encoding minicircle derivative (MC-Ag). Twenty-four hours after each immunization, mice were injected subcutaneously on the ventral portion of the tattooed thigh with 10 μg of polyICLC. Five or 30 days following the last immunization (d11 or d36), mice were infected with LM-OVA intravenously in the tail vein. Five days following infection (d16 or d41), mice were bled by the facial vein, sacrificed, and their spleens harvested. Ag-specific T cells were identified by staining with anti-CD8-APC and SIINFEKL/Kb-PE tetramer. Bacterial burden was measured as the number of Listeria colony-forming units (CFUs) in the spleen. Frequencies of Ag-specific CD8+ T cells in the peripheral blood and spleen on d16 (a,b) and d41 (d,e). Data are presented as the mean ± SEM (n = 10)(P* < 0.05; P** < 0.01; Kruskal-Wallis test corrected with a Dunn’s multiple comparison test) and represent three experiments. (c) Bacterial burden in the spleen on d16. Mice were infected intravenously with 6x10⁴ CFUs of LM-OVA on d11 and bacterial burden was measured five days later (d16). (P** < 0.01; Kruskal-Wallis test corrected with a Dunn’s multiple comparison test). (f) Bacterial burden in the spleen on d41. Mice were infected intravenously with 4x10⁴ CFUs of LM-OVA on d36 and bacterial burden was measured five days later (d41). Data are presented as the mean ± SEM (n = 10)(P* < 0.05; Kruskal-Wallis test corrected with

52
a Dunn’s multiple comparison test). These are pooled data from two experiments. FL-Ag, full-length plasmid encoding SIINFEKL; MC-Ag, minicircle-encoding SIINFEKL: VC, empty full-length plasmid vector control.

53
Fig. 2.10. Gating strategy for detecting Ag-specific CD8+ T cells in mice challenged with LM-OVA. Mice were immunized with equimolar amounts of MC-Ag, FL-Ag or VC DNA three times, three days apart (on d0, d3, d6). One day after each immunization, mice were injected subcutaneously with 10 μg polyICLC. Peripheral blood and spleens were harvested on d11 from LM-OVA challenged mice that were immunized with the indicated DNA. The contour plots below were generated from lymphocytes, based on their forward and side scatter profiles. The gate indicates cells binding the anti-CD8-APC antibody and SIINFEKL-Kb-PE tetramer.

54
Fig. 2.11. Protection against lower dose LM-OVA challenge elicited by MC-Ag or FL-Ag immunization. Mice were immunized with equimolar amounts of MC-Ag, FL-Ag or VC DNA three times, three days apart (on d0, d3, d6). One day after each immunization, mice were injected subcutaneously with 10 μg polyICLC. Five days after the last immunization (d11), each mouse was injected intravenously with 4.9x10⁴ LM-OVA bacteria. Five days later (d16), the mice were euthanized and bacterial burden was measured as the number of CFUs/spleen. Mice immunized with MC-Ag were significantly protected from LM-OVA challenge when compared to the VC control (P** < 0.01; Kruskal-Wallis test corrected with a Dunn’s multiple comparison test). There was a trend towards decreased bacterial burden among the FL-Ag immunized mice but the group’s mean bacterial burden was not significantly less than the burden in the VC cohort. LOD, limit of detection.
55
CHAPTER 3: Prolonged antigen expression following minicircle
vaccination enhances protective immune responses.
INTRODUCTION
DNA vaccines are promising for disease prevention and treatment due to their
safety, stability, affordability, and flexibility (32,40). However, suboptimal immune
responses to the proteins they encode limit their clinical effectiveness (31,123). In
chapter 2, we show that the immunogenicity of DNA vaccines is improved when using
MC DNA, which lacks a bacterial backbone and thus produces higher and more
prolonged levels of gene expression than conventional plasmids (64,65). Given that MC
DNA induces both higher peak levels of gene expression and more prolonged
expression than standard pDNA, it is unclear if the prolonged duration is a necessary or
even beneficial component of MC DNA vaccines.
There has been considerable interest in the effect of prolonged T cell stimulation
on immune responses. Work using lymphocytic choriomenengitis virus (LCMV) has
compared how immune responses differ following acute and chronic infections. Rapidly
cleared, acute infections mediated by the LCMV Armstrong (Arm) strain result in
prototypic CD8+ T cell responses: expansion of newly activated Ag-specific effectors
shortly after infection, rapid contraction, and the subsequent establishment of memory.
Cells in the memory phase are marked by their ability to quickly proliferate and regain
effector function upon Ag re-challenge (8,124).
Responses differ, however, in mice infected with LCMV clone 13 (cl-13). LCMV
cl-13 is derived from LCMV Arm and only differs from it by two amino acids. These two

56
amino acids, however, alter known T cell epitopes. In cl-13, the glycoprotein GP260 has
a Phe to Leu change and the L1079 polymerase protein has a Gln to Lys change. These
two differences in LCMV cl-13 produce a chronic infection lasting up to 3 months
(125,126). Chronic LCMV infection results in an expansion of effectors as well as a
contraction phase, but induction of conventional memory cells does not occur. Instead,
the Ag-specific CD8+ T cells that persist demonstrate an increasing impairment of their
ability to respond to Ag.
The degree of impairment is proportional to viremic load and duration of viremia
(13,126,127) and develops in characteristic stages. Functions such as IL-2 production,
ex vivo killing, and proliferative capacity are lost early. Next, cells lose the ability to
produce TNF, followed by an inability to produce sufficient quantities of IFN-γ or
degranulate. Eventually, T cells are physically deleted (13,124,126,128). This state of T
cell dysfunction in response to persistent Ag stimulation is known as exhaustion and is
associated with the characteristic expression of certain phenotypic markers. Among
many such markers identified, Wherry et al. (129) found that starting early in exhaustion
and continuing long-term, the marker PD-1 is upregulated on exhausted CD8+ T cells
while the marker killer cell lectin-like receptor subfamily G member 1 (KLRG1) and the
commonly used marker of Ag experience, CD44, are both downregulated.
Given these results as well as data showing that less than 48 hours of Ag
stimulation is needed to effectively prime immune responses (9,10,130), it could be
argued that prolonged Ag expression in a vaccine would be both unnecessary and
possibly deleterious to immune responses. However, it is important to distinguish
between a chronic infection in which the immune system is exposed to sustained Ag in

57
the context of a highly inflammatory milieu, and a vaccine occurring in the presence of
minimal or short-term inflammation. There has been a relative paucity of data
investigating the effect of Ag duration on CD8+ T cell responses in in the absence of
extensive inflammation.
To determine the effect of Ag duration on immune responses, Hovav et al. (121)
immunized mice on the ear with a DNA vaccine and then removed the ears at various
times points. They found that truncation of Ag expression before peak immune
responses resulted in an earlier and reduced expansion of effector CD8+ T cells followed
by an accelerated contraction phase. Despite the diminished priming, they observed that
equivalent numbers of memory cells were formed in mice with truncated Ag expression
and that these cells expanded more robustly upon challenge than mice without
truncation. However, due to the kinetics of their system, where peak CD8+ T cell
responses did not occur until three weeks after vaccination, these authors and others
investigating Ag duration (131) did not investigate the effect of truncating Ag expression
at time points past peak expansion, a system more analogous to chronic infections.
We take advantage of an immunization scheme designed by Bins et al. (38)
involving three immunizations three days apart that produces robust immune responses
that peak 11 days after the first of three DNA immunizations. In addition, by using MC
DNA, we investigate how prolonged Ag stimulation continuing well past the peak of an
immune response affects Ag-specific CD8+ T cells in the absence of infection. We found
that following MC vaccination, sustained Ag expression (as opposed to antigen
expression that was truncated 3, 8, 15, or 22 days post-immunization) improved the
ability of T cells to clear infection. We did not see evidence of exhaustion. Thus, we
58
demonstrate that prolonged duration of gene expression contributes to the enhanced
immunogenicity of MC vaccines, although enhanced peak levels of expression may
contribute as well. These findings have important implications for vaccine development.
RESULTS
DNA construct.
We constructed a vector (CMV-Ag.6) encoding three class I and three class II
MHC-restricted Ags driven by the cytomegalovirus (CMV) promoter (Fig. 3.1a). For these
experiments, we tracked Ag-specific T-cell responses to one of the three class I-
restricted Ags: the SIINFEKL peptide, derived from the chicken ovalbumin protein (amino
acid residues 257-264). SIINFEKL presented by H-2Kb is recognized by the OT-I
transgenic TCR(103). The construct also contains a Kozak consensus sequence for
initiation of translation, a secretion signal (SS) to ensure that transfected cells will
secrete Ag for uptake and cross-presentation by APCs, a 3X repeat of the sequence for
the FLAG protein affinity tag, and an encoded reporter protein followed by the bovine
growth hormone polyadenylation signal (BpA). The reporter, eff, is produced as a
separate protein due to its placement downstream of the tetraviridae T2A self-cleaving
peptide, which induces ribosomal skipping during translation (132). MC DNA was
produced from parental FL pDNA of this construct as described(71).
Gene expression following immunization and ear excision.
Before assessing the effect of truncating Ag expression on immune responses,
we first needed to establish the kinetics of gene expression. We immunized mice via
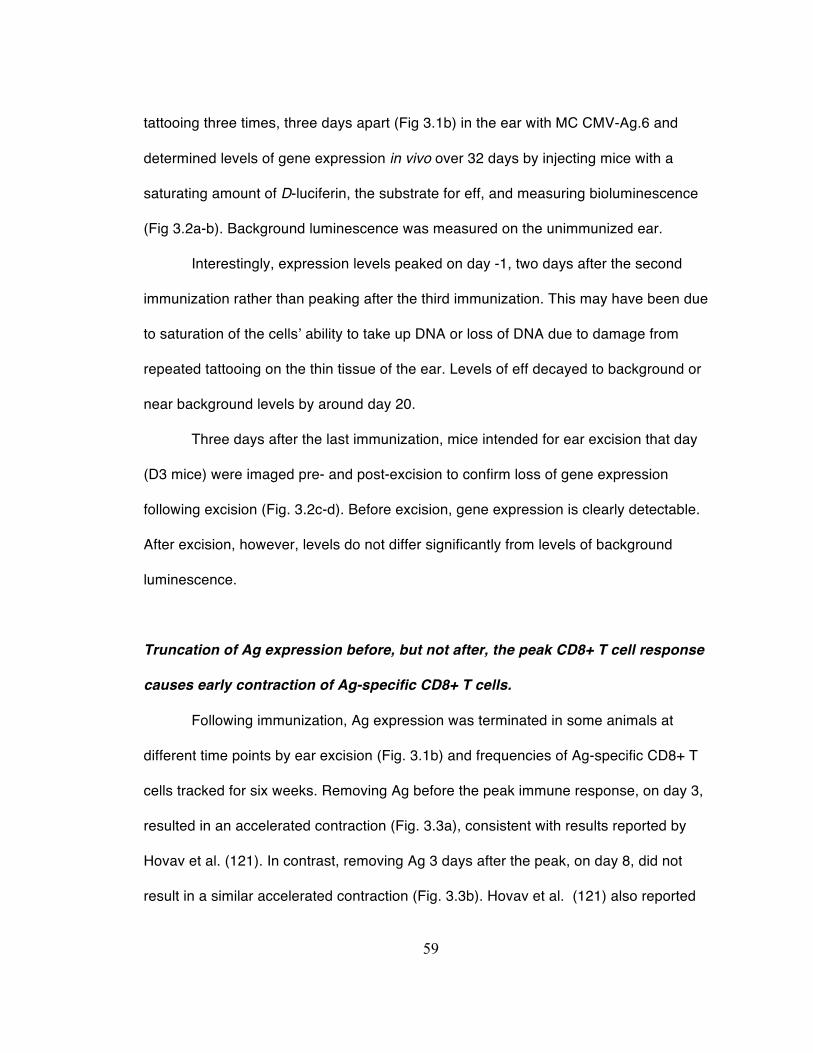
59
tattooing three times, three days apart (Fig 3.1b) in the ear with MC CMV-Ag.6 and
determined levels of gene expression in vivo over 32 days by injecting mice with a
saturating amount of D-luciferin, the substrate for eff, and measuring bioluminescence
(Fig 3.2a-b). Background luminescence was measured on the unimmunized ear.
Interestingly, expression levels peaked on day -1, two days after the second
immunization rather than peaking after the third immunization. This may have been due
to saturation of the cells’ ability to take up DNA or loss of DNA due to damage from
repeated tattooing on the thin tissue of the ear. Levels of eff decayed to background or
near background levels by around day 20.
Three days after the last immunization, mice intended for ear excision that day
(D3 mice) were imaged pre- and post-excision to confirm loss of gene expression
following excision (Fig. 3.2c-d). Before excision, gene expression is clearly detectable.
After excision, however, levels do not differ significantly from levels of background
luminescence.
Truncation of Ag expression before, but not after, the peak CD8+ T cell response
causes early contraction of Ag-specific CD8+ T cells.
Following immunization, Ag expression was terminated in some animals at
different time points by ear excision (Fig. 3.1b) and frequencies of Ag-specific CD8+ T
cells tracked for six weeks. Removing Ag before the peak immune response, on day 3,
resulted in an accelerated contraction (Fig. 3.3a), consistent with results reported by
Hovav et al. (121). In contrast, removing Ag 3 days after the peak, on day 8, did not
result in a similar accelerated contraction (Fig. 3.3b). Hovav et al. (121) also reported

60
that removal of Ag decreased the size of the contracted population. We did not see a
statistically significant difference in the frequency of Ag-specific CD8+ T cells between
D3 mice and any other group at day 42 (Fig. 3.3c). However, when we pooled data from
mice with ears removed later than D3, we observed a statistically significant decrease in
frequencies of Ag-specific CD8+ T cells in D3 mice compared to the mice with Ag
removed after the peak immune response (Fig. 3.3d).
Prolonged Ag expression is associated with increased proliferative capacity and
protection following infection.
We next assessed the ability of T cells to respond to infection with Listeria
monocytogenes bearing the ovalbumin protein (LM-OVA) after prolonged or shortened
Ag expression. We infected mice 42 days after the last immunization then, 5 days after
the infection, we analyzed peripheral blood and spleen-derived CD8+ T cells and
determined bacterial burden in the spleen (Fig. 3.1b). We detected fewer Ag-specific
CD8+ T cells in the peripheral blood (Fig. 3.4a) and spleens (Fig. 3.4b) of animals with
ears removed at day 3 following infection. In addition, frequencies of Ag-specific T cells
in the peripheral blood in mice with Ag removed at day 8 were lower in the peripheral
blood than in mice without Ag removed (Fig. 3.4a). Furthermore, we compared the fold
increase of Ag-specific CD8+ T cells in the blood from pre-infection on day 42 to post-
infection on day 47 and found that, in general, truncating Ag expression via ear excision
resulted in a decreased expansion of T cells (mean fold increase of 66.8) compared to
mice without ear excision (mean fold increase of 93.1) (Fig. 3.4c). In addition, when we
quantified bacterial burden in the spleens of mice, we found that ear excision at any time

61
point resulted in impaired clearance, while eight of ten mice without Ag excision showed
no detectable bacterial burden.
Truncation of Ag expression is associated with increased upregulation of PD-1
following infection.
Given the role of prolonged Ag expression during chronic infection in inducing
exhaustion of CD8+ T cells, we were interested in comparing PD-1 expression in mice
with and without early truncation of Ag expression. At day 42, before the infection, we
saw no difference in PD-1 expression between mice expressing Ag for different lengths
of time (Fig. 3.5a). However, five days after infection, ear excision was associated with a
subtle but statistically significant increase in PD-1 expression in the peripheral blood (for
all days except D22) (Fig. 3.5b) and the spleen (for all days) (Fig. 3.5c,d).
Long-term gene expression following MC immunization is not associated with
markers of exhaustion.
Since MC DNA is expressed for prolonged periods of time (Fig. 3.2a), we asked if
this long-term expression would increase markers of exhaustion compared to the short
burst of Ag associated with protein immunizations. Therefore, we immunized mice with
MC or VC DNA three times, three days apart on the leg and compared them to mice
immunized with four consecutive, subcutaneous injections of whole ovalbumin protein
(OVA) and the TLR-3 agonist, polyIC, as an adjuvant (133). The protein/adjuvant
immunization was timed based on pilot experiments so that the peak response would
coincide with the peak of the response in MC-immunized mice. At the peak response on

62
day 5 following the last immunization, OVA induced more Ag-specific CD8+ T cells than
MC, but the two groups contracted with similar kinetics to a similar baseline that was
significantly above values seen in the VC group (Fig. 3.6.a). At day 120 following the last
immunization, we stained peripheral blood lymphocytes for expression of PD-1 (Fig.
3.6b), KLRG1 (Fig. 3.6c) and CD44 (Fig 3.6d), comparing expression in MC-immunized
mice, OVA-immunized mice, and naïve CD8+ T cells from VC mice. There was no
significant difference between T cells in MC-immunized or OVA-immunized mice for any
of these markers.
FL immunizations yielding similar peak expression levels as MC produce similar
immunologic responses.
Previous work has shown that immunization with MC DNA results in more
protective immune responses than immunization with FL pDNA (134). We have primarily
investigated the role of duration of gene expression in mediating this effect, but MC DNA
also generally produces significantly higher peak levels of transgene expression (Fig.
2.3b), which could contribute to the efficacy of immune responses. When immunizing
with the CMV-Ag.6 construct in the ear, we seemed to have encountered a ceiling effect,
whereby the ability of the skin to take up our DNA was saturated and increasing the dose
of MC DNA had no effect on gene expression (Fig 3.7). When we immunized with FL
DNA in the ear, we observed a less dramatic difference between MC and FL peak levels
of gene expression (Fig 3.8a) than we had previously observed (Fig. 2.3b). In fact, at day
3, there was no statistical difference between the two curves. After that point, as
expected, FL expression rapidly declined to background levels while MC levels
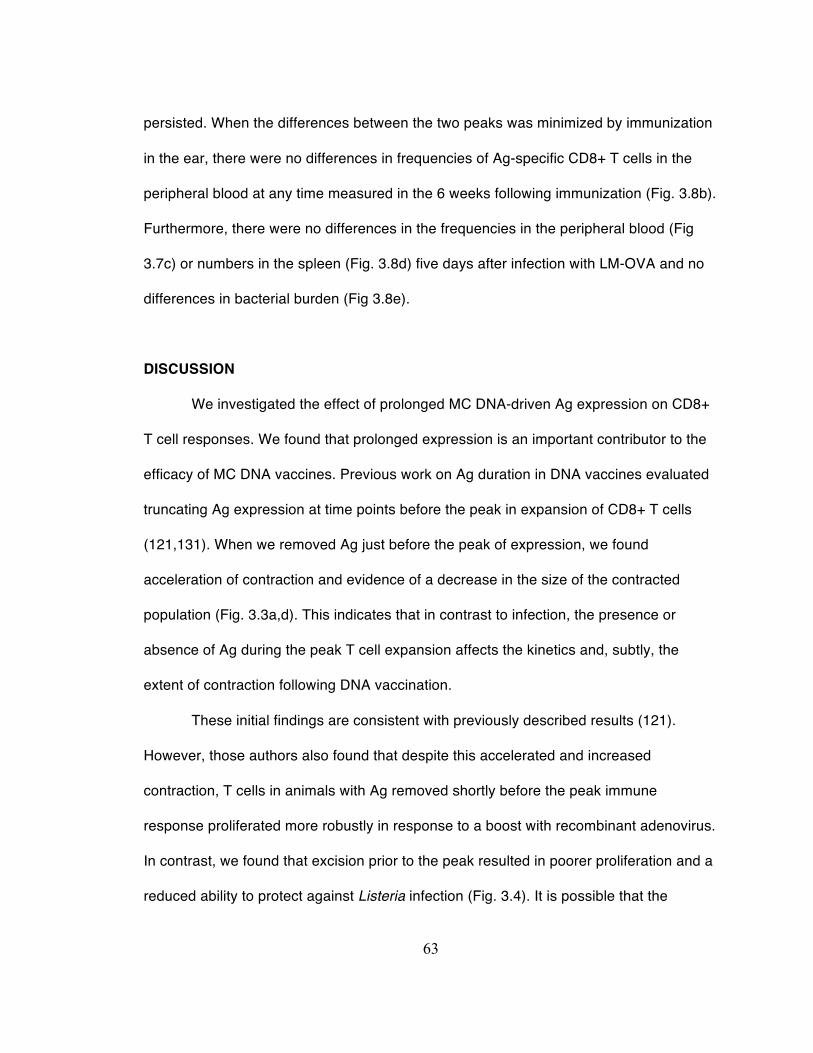
63
persisted. When the differences between the two peaks was minimized by immunization
in the ear, there were no differences in frequencies of Ag-specific CD8+ T cells in the
peripheral blood at any time measured in the 6 weeks following immunization (Fig. 3.8b).
Furthermore, there were no differences in the frequencies in the peripheral blood (Fig
3.7c) or numbers in the spleen (Fig. 3.8d) five days after infection with LM-OVA and no
differences in bacterial burden (Fig 3.8e).
DISCUSSION
We investigated the effect of prolonged MC DNA-driven Ag expression on CD8+
T cell responses. We found that prolonged expression is an important contributor to the
efficacy of MC DNA vaccines. Previous work on Ag duration in DNA vaccines evaluated
truncating Ag expression at time points before the peak in expansion of CD8+ T cells
(121,131). When we removed Ag just before the peak of expression, we found
acceleration of contraction and evidence of a decrease in the size of the contracted
population (Fig. 3.3a,d). This indicates that in contrast to infection, the presence or
absence of Ag during the peak T cell expansion affects the kinetics and, subtly, the
extent of contraction following DNA vaccination.
These initial findings are consistent with previously described results (121).
However, those authors also found that despite this accelerated and increased
contraction, T cells in animals with Ag removed shortly before the peak immune
response proliferated more robustly in response to a boost with recombinant adenovirus.
In contrast, we found that excision prior to the peak resulted in poorer proliferation and a
reduced ability to protect against Listeria infection (Fig. 3.4). It is possible that the

64
differences in our results arise from differences in the kinetics inherent in our
immunization schemes. In their system, prolonged Ag expression does not induce a
peak immune response for approximately three weeks, whereas we see a peak 5 days
after the last immunization (11 days after the first immunization). Perhaps when there is
a prolonged delay in producing a peak T cell response, truncating Ag expression to
induce a faster contraction provides a benefit not present when the peak response
naturally occurs sooner.
We were particularly interested in investigating the effect of Ag removal after the
peak response, a situation that has not been studied in a vaccine setting to our
knowledge. We found that excision at any time tested impaired the ability of animals to
clear an infection (Fig. 3.4d). Surprisingly, this was as true in the mice with Ag removed
at day 22 as those with Ag removed at day 3 or 8. By day 22 and later, the levels of gene
expression occurring with MC vaccination as detected by in vivo bioluminescence are
fairly low (Fig. 3.2a). Nevertheless, it appears that the gene expression that continues
after day 22 is significant, since without it, mice have a reduced ability to clear infection.
It is notable that when immunizing with FL DNA, levels of eff fall to background levels at
approximately day 20 (Fig 3.8a), yet the FL vaccine shows no diminished efficacy
compared to the MC vaccine (Fig. 3.8b-e). This may indicate the importance of even
minimal Ag expression. It is likely that when eff can no longer be detected, there is still
low level, residual gene expression. However, when the ear is excised, any Ag
expression occurring in the ear abruptly ends. The difference between very low levels of
gene expression and no gene expression may account for the difference that we see in
response to Listeria infection.

65
Given how short a time is necessary to prime an immune response, and given
that we are investigating effects occurring after the prime, it is surprising that the
continued presence of Ag should be important for generating an optimally protective
secondary response. The reason for this may be closely tied to levels of Ag encountered
by CD8+ T cells as well as levels of inflammation. In a plasmid or MC-based vaccine,
there is poor transfection of cells with DNA and no replication within the host (32). Thus,
levels and kinetics of Ag expression differ dramatically between these vaccines and
typical infections.
Furthermore, an infection is associated with levels of inflammation not
approached by standard vaccines. For instance, our vaccine did not encode an adjuvant
and was not administered with one. Our method of administration (tattooing) likely has
an adjuvant effect due to the production of many small perforations in the skin (101).
However, this effect is limited to the time of vaccine administration and likely is not as
inflammatory as a conventional infection. DNA vaccines themselves can function as
adjuvants by stimulating TLR-9, however this is only a minor effect as immune
responses to DNA vaccines in TLR-9 or MyD88 knockout mice were shown to be
indistinguishable from those in wild-type mice (43). The reduced inflammation associated
with DNA vaccines as well as the different kinetics of Ag expression may prime T cells
less optimally than an infection would. In that case, prolonging Ag expression may
compensate for the suboptimal prime, thereby improving immune responses when it is
present.
Similarly, we speculate that the lower levels of Ag and inflammation associated
with our vaccine explain why we saw no evidence of exhaustion with prolonged Ag

66
expression. As late as 120 days after vaccination, we detected no difference in markers
of exhaustion (PD-1, KLRG1, CD44) between MC-immunized mice and mice given a
standard protein/adjuvant immunization (Fig. 3.6b-d). Furthermore, proliferative capacity
is one of the functions lost early during exhaustion, however at 42 days after
immunization we observed robust proliferation in response to an infectious challenge
(Fig. 3.4a-c).
Interestingly, we observed an increased upregulation of PD-1 expression
following infection in mice with Ag expression truncated via ear excision (Fig. 3.5b-d).
This difference was noticeable only as a subtle shift in median fluorescence intensity
(MFI) relative to PD-1 MFI in mice with no ear excision. The significance of such an
increase, given its subtlety (Fig. 3.5d), is unclear. However, it is possible that the modest
increase in PD-1 is related to the reduced ability of Ag-specific CD8+ T cells in mice with
shortened Ag expression to proliferate or provide protection in response to infection with
Listeria (Fig. 3.4c-d). Further work is needed to elucidate by what mechanism truncating
Ag expression would induce such an upregulation. It is important to note that truncation
of Ag expression did not affect PD-1 levels prior to infectious challenge (Fig 3.5a) and is
therefore not likely indicative of exhaustion, which would be particularly surprising to see
in mice with decreased Ag expression. PD-1 levels normally increase immediately
following infection as a homeostatic mechanism (135,136). The increase in PD-1
observed in mice with excised ears appears to reflect an increased negative regulatory
response following challenge.
In this study, we have primarily focused on the role of prolonged Ag expression
resulting from MC vaccines on immune responses. However, as mentioned above, MC

67
DNA also typically produces increased peak levels of gene expression. When tattooing
in the ear, we obtained less striking differences in peak expression between MC and FL
than generally seen (65,134), while still maintaining differences in duration (Fig. 3.8a).
This was likely due to the inability of the thin tissue of the ear to take up an increasing
amount of DNA, leading to saturation of expression (Fig. 3.7). We predict that
immunizing at significantly lower doses or immunizing in the leg would have
recapitulated the difference seen between MC and FL in chapter 2 of this thesis.
However, under the present circumstances, we detected no differences in
frequencies or number of CD8+ T cells, or protection from infectious challenge (Fig.
3.8b-e). These data indicate that differences in peak expression, in addition to duration
of expression, are likely important in determining vaccine efficacy. Thus, it is probable
that both prolonged gene expression and increased gene expression contribute to the
success of MC DNA as a vaccine compared to pDNA. These findings are important for
the development of future vaccines and furthermore, provide valuable insight into how
CD8+ T cells respond to persistent Ag in a DNA vaccine setting.
MATERIALS AND METHODS
DNA constructs. The plasmid backbone for the FL constructs (pMC.BESPX.MCS1)
contains the requisite sequences for bacterial propagation (e.g., the pUC origin of
replication), the kanamycin-resistance gene, the φC31 integrase recognition sites attB
and attP, and a block of 32 tandem repeats of the recognition sequence for the I-SceI
homing endonuclease (71). To generate the FL CMV-Ag.6 construct, we used the
isothermal enzymatic DNA assembly strategy described by Gibson et al (122). Briefly,

68
60-nucleotide oligonucleotides were synthesized with 20-base
overlapping/complementary regions that together encoded the secretion signal, Ags, 3X
FLAG, and T2A sequences. The overlapping oligonucleotides were grouped into
fragments containing 8 oligonucleotides each and assembled via splice overlap
extension PCR using Phusion High-Fidelity DNA Polymerase and associated buffers
(New England Biolabs, Ipswich, MA). The resulting products were then cloned into pCR4
TOPO TA vectors (Invitrogen, Carlsbad, CA) via TA cloning, using Taq polymerase
(Invitrogen) to append a single deoxyadenosine to the 3’ end of the DNA sequences,
generating an overhang compatible with the pCR4 TOPO TA vector. These fragments
were then sequence verified, excised from the pCR4 TOPO TA vector via digestion with
the EcoRI restriction endonuclease (Invitrogen) and assembled together via PCR as
above. This product was likewise cloned into pCR4 TOPO TA and sequenced verified
before being excised and gel purified. The CMV promoter was amplified from the pJ603
vector (DNA2.0, Menlo Park, CA) and the eff gene and BpA signal were amplified as one
product from an existing construct, FL-eff (134). The internal fragment, the CMV
promoter, the eff-BpA sequence, and EcoRI-digested pMC.BESPX vector were
subjected to the one-step isothermal DNA assembly procedure (122), which takes
advantage of engineered overlaps between DNA fragments to generate a single,
seamlessly joined construct. Empty pMC.BESPX was used as a vector control.
For FL pDNA preparation, transformed Top10 bacteria (Invitrogen, Carlsbad, CA)
were grown in LB broth (Invitrogen) supplemented with kanamycin. pDNA was isolated
using the GenElute Endtoxin-free Plasmid Maxiprep Kit (Sigma- Aldrich, St Louis, MO)

69
according to the manufacturer’s instructions, then concentrated via ethanol precipitation
to 8-12 μg/μl, resuspended in water and stored −20°C.
To produce MC DNA from the parental FL construct, we transformed the
ZYCY10P3S2T bacterial strain with FL CMV-Ag.6. ZYCY10P3S2T contains ten copies
of the φC31 integrase gene, three copies of the I-SceI homing endonuclease gene(106),
and the araE and LacY arabinose transporter genes that constitutively express proteins
importing arabinose to induce φC31 integrase and I-SceI endonuclease expression. For
MC generation, bacteria transformed with FL pDNA were grown overnight in Terrific
Broth (Invitrogen) supplemented with kanamycin. The following day MC induction media
(fresh LB broth containing 0.04 volumes of 1 N NaOH and 0.02% L-arabinose (Sigma-
Aldrich, St Louis, MO)) was added and the culture temperature was decreased from
37°C to 32°C for 5–8 hours. The culture was then centrifuged and MC DNA was purified
with the PureLink HiPure Maxiprep Kit using buffers from the Purelink HiPure BAC Buffer
Kit (Invitrogen). Following elution in water, the DNA was concentrated to 4–6 μg/μl by
ethanol precipitation, resuspended in water and stored at −20°C.
Sequence analyses verified the genes encoded by the FL pDNA and its
derivative MC were identical. The amounts of residual FL pDNA in the MC DNA
preparations was evaluated by StuI (New England Biolabs) restriction endonuclease-
mediated linearization, followed by agarose gel electrophoresis and DNA visualization
using ethidium bromide.
Mice. Four- to eight-week-old, female C57BL/6 mice were purchased from the Jackson
Laboratory (Bar Harbor, ME) or the National Cancer Institute (Frederick, MD). All mice

70
were housed under specific pathogen free conditions at the University of Minnesota. All
animal procedures were carried out according to protocols approved by the Institutional
Animal Care and Use Committee.
Immunizations. For DNA immunizations, mice were anesthetized with
ketamine/xylazine and their right ears wiped with 70% ethanol before being immunized
with 30 μg DNA (13.5 pmol) in 15 μl sterile water. Equimolar amounts of VC and the
corresponding FL pDNA samples were diluted in sterile water to the same volumes. In
other experiments mice were immunized on the leg. They were first anesthetized with
ketamine/xylazine and their right inner hind leg shaved and wiped with 70% ethanol.
They were then immunized with 30 μg MC DNA or equimolar amounts of VC as above.
All DNA was delivered intradermally via tattooing over the ear pinna for 30 seconds
using a Cheyenne Hawk PU II tattoo device (Unimax Supply, New York, NY) set at 110
Hz using 9-point needles adjusted to a depth of 0.5 mm. Mice were immunized three
times, three days apart.
For protein immunizations, the vaccination scheme developed by Wick et al
(133), was followed. Briefly, mice were immunized with 100 μg whole ovalbumin protein
and 10 μg polyIC adjuvant in 150 total μl PBS subcuntaneously in the right leg.
Immunizations were administered for four consecutive days and timed so that the peak
of the primary response occurred simultaneously with the peak of the response resulting
from the DNA immunizations being compared. Both peaks occur five days after the last
immunization.

71
Ear pinna excision. For removal of the immunized ear, mice were anesthetized with
ketamine/xylazine and the immunized ear wiped with 70% ethanol. The pinna was then
removed using sterile scissors, with sparing of the cartilage. The area was then cleaned
again with 70% ethanol.
In vivo Bioluminescence. Mice were imaged for bioluminescence using a Xenogen
Spectrum Imaging System (Caliper Life Sciences, Hopkinton, MA). Animals were imaged
two days after the first and second immunization, three days after the last immunization,
then weekly thereafter until day 35. To image, mice were injected intraperitoneally with
100 μl of 30 mg/ml D-luciferin and anesthetized with isoflurane. Bioluminescence was
measured for 5 minutes. Data were analyzed using Living Image 2.5 Software (Caliper
Life Sciences).
Flow cytometric analysis. Peripheral blood samples taken from the facial vein and
single cell suspensions prepared from harvested spleens were incubated with CD8α-
AlexaFluor 700, CD62L-FITC, CD127-APC, PD-1-PE-Cy7, KLRG-1-eFluor 450
(eBiosciences, San Diego, CA), CD44 Horizon V500 (BD Biosciences, San Jose, CA),
and SIINFEKL/H-2Kb tetramer formed with SA coupled to PE. To determine the cell
count, PKH26 Reference Beads (Sigma-Aldrich) were mixed with cells and 5,000 bead
events were collected on the flow cytometer. The following equation was used to
determine the number of lymphocytes: Number of cells/ml = (number of cells acquired ×
dilution factor of cells × number of singlet beads/ml)/(number of beads acquired ×
dilution factor beads). Data were acquired on a BD LSR II flow cytometer (BD

72
Biosciences) using BD FACSDiva software (BD Biosciences) and analyzed with FlowJo
software (Tree Star, Ashland, OR).
Infection with LM-OVA. Mice were infected with ~6 × 10⁴ colony-forming units
intravenously in the tail vein six weeks after the last immunization. Bacteria were grown
in tryptic soy broth with 50 μg/ml of streptomycin to an absorbance at 600 nm of about
0.1. Actual numbers of colony-forming units injected were determined for each
experiment by plate count. Five days following infection, mice were bled from the facial
vein, killed, and their spleens harvested. Half of the cells from each spleen were used for
flow cytometric analysis and the other half were serially diluted and plated on tryptic soy
agar plates containing streptomycin. Bacterial colonies were counted after plate
incubation for 24 hours at 37 °C.
Statistical analysis. Data were graphed and analyzed using Prism v5.0c (GraphPad
Software, La Jolla, CA). Statistical analyses were performed using the Mann-Whitney
nonparametric T-test except where indicated.

73
FIGURES
Fig. 3.1. DNA construct and experimental design. (a) Schematic of elements in the CMV-Ag.6 vector. The construct contains the CMV promoter, the Kozak consensus sequence, a secretion signal (SS) to permit secretion of produced proteins, three class I MHC-restricted epitopes (the p14 epitope from LCMV, the melanoma-associated pmel epitope, and the ovalbumin-derived SIINFEKL epitope recognized by the OT-I transgenic TCR), three class II MHC restricted epitopes (the class II-restricted ovalbumin epitope, AAHAEINEA, recognized by the OT-II transgenic TCR, the TEα epitope from the alpha chain of the murine I-E class II MHC molecule, and the 2W1S epitope derived from alpha chain of the murine I-Ed MHC II molecule), three FLAG tag repeats, and the eff reporter separated by the T2A ribosomal skipping peptide. (b) Experimental design. Mice were immunized 3 times, 3 days apart, infected with LM-OVA 42 days after the last immunization, and sacrificed 5 days after infection. Some groups had the immunized ear removed on day 3, 8, 15, or 22 after the last immunization. Day 5 after the last immunization denotes the peak primary response.

74
Fig. 3.2. Duration of gene expression following immunization with MC CMV-Ag.6. Mice were immunized in the ear three times, three days apart with 30 μg MC DNA (13.5 pmol) and imaged in vivo for 35 days using the Xenogen Spectrum. (a) Xenogen Spectrum imaging of in vivo luciferase expression at the peak of expression, on day -1 (2 days after the second immunization) in mice immunized with MC CMV-Ag.6 on the right ear. The left ear represents background bioluminescence. (b) Kinetics of luciferase expression following immunization with MC CMV-Ag.6 in the absence of ear excision. Background levels were obtained by measuring luminescence in the unimmunized ear. Data are pooled from two similar experiments and are presented as mean ± SEM (n = 10) (**P < 0.01; ***P < 0.001). (c) Xenogen Spectrum imaging of luciferase expression in mice immunized with MC CMV-Ag.6 pre- (top) and post- (bottom) ear excision 3 days after the last immunization. (d) Quantification of bioluminescence before and after ear excision on day 3. Mice were imaged prior to ear excision and again the same day, after ear excision. Background levels were obtained by measuring luminescence in the unimmunized ear. Data are pooled from two similar experiments and are presented as mean ± SEM (n = 10) (**P < 0.01; Kruskal-Wallis test corrected with a Dunn’s multiple comparison test)

75
Fig. 3.3. Truncating Ag expression before the peak immune response induces early contraction. Mice were immunized in the ear three times, three days apart with 30 μg MC DNA (13.5 pmol). Certain groups had the immunized ear removed at 3, 8, 15, or 22 days following the last immunization. (a) Frequencies of Ag-specific CD8+ T cells in the peripheral blood from day 5 to day 42 following the last immunization in mice that had the immunized ear removed at day 3 (D3) and mice with no ear excision. Data are pooled from two similar experiments and are presented as mean ± SEM (n = 10) (*P < 0.05). (b) Frequencies of Ag-specific CD8+ T cells in the peripheral blood from day 5 to day 42 following the last immunization in mice that had the immunized ear removed at day 8 (D8) and mice with no ear excision. Data are pooled from two similar experiments and are presented as mean ± SEM (n = 10). (c) Frequencies of Ag-specific CD8+ T cells in the peripheral blood on day 42 after the last immunization in mice with ears removed on day 3 (D3), day 8 (D8), day 15 (D15), day 22 (D22) or in unexcised mice. Data are pooled from two similar experiments and are presented as mean ± SEM (n = 10) (ns = not significant). (d) Frequencies of Ag-specific CD8+ T cells from (c) with D8, D15, and D22 pooled together (later excision; n = 30) for comparison to day 3 (D3; n = 10). Data are pooled from two similar experiments and are presented as mean ± SEM. (*P < 0.05).
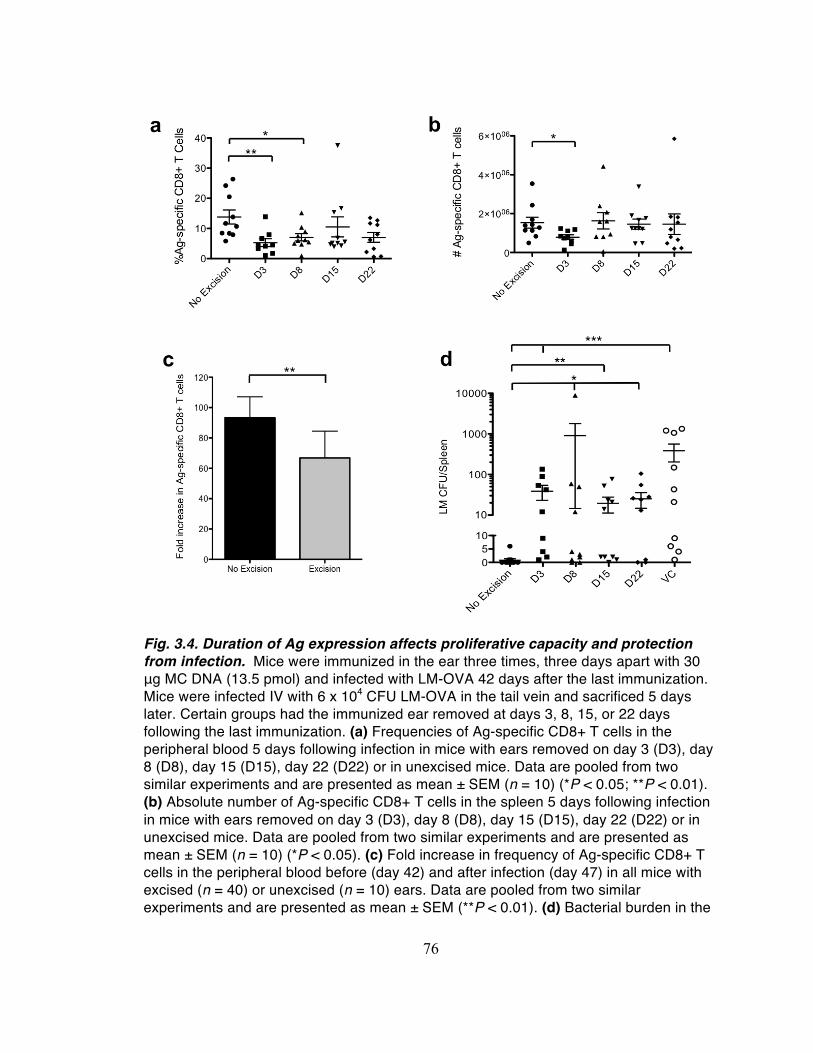
76
Fig. 3.4. Duration of Ag expression affects proliferative capacity and protection from infection. Mice were immunized in the ear three times, three days apart with 30 μg MC DNA (13.5 pmol) and infected with LM-OVA 42 days after the last immunization. Mice were infected IV with 6 x 10⁴ CFU LM-OVA in the tail vein and sacrificed 5 days later. Certain groups had the immunized ear removed at days 3, 8, 15, or 22 days following the last immunization. (a) Frequencies of Ag-specific CD8+ T cells in the peripheral blood 5 days following infection in mice with ears removed on day 3 (D3), day 8 (D8), day 15 (D15), day 22 (D22) or in unexcised mice. Data are pooled from two similar experiments and are presented as mean ± SEM (n = 10) (*P < 0.05; **P < 0.01). (b) Absolute number of Ag-specific CD8+ T cells in the spleen 5 days following infection in mice with ears removed on day 3 (D3), day 8 (D8), day 15 (D15), day 22 (D22) or in unexcised mice. Data are pooled from two similar experiments and are presented as mean ± SEM (n = 10) (*P < 0.05). (c) Fold increase in frequency of Ag-specific CD8+ T cells in the peripheral blood before (day 42) and after infection (day 47) in all mice with excised (n = 40) or unexcised (n = 10) ears. Data are pooled from two similar experiments and are presented as mean ± SEM (**P < 0.01). (d) Bacterial burden in the

77
spleen on day 47. Data are pooled from two similar experiments and are presented as mean ± SEM (n = 10) (*P < 0.05; **P < 0.01; ***P < 0.001).

78
Fig. 3.5. PD-1 expression following infection in mice with truncated Ag expression. Mice were immunized in the ear three times, three days apart with 30 μg MC DNA (13.5 pmol). Certain groups had the immunized ear removed at 3 (D3), 8 (D8), 15 (D15), or 22 (D22) days following the last immunization. All mice were infected IV with 6 x 10⁴ CFU LM-OVA 42 days after the last immunization and sacrificed 5 days later. Expression of PD-1 was assessed pre- and post-infection. (a) Median fluorescence intensity of PD-1 on Ag-specific CD8+ T cells in the peripheral blood pre-infection, 42 days after the last immunization. Data are pooled from two similar experiments and are presented as mean ± SEM (n = 10) (ns = not significant). (b) Median fluorescence intensity of PD-1 on Ag-specific CD8+ T cells in the peripheral blood 5 days after infection with LM-OVA. Data are pooled from two similar experiments and are presented as mean ± SEM (n = 10) (**P < 0.01; ***P < 0.001). (c) Median fluorescence intensity of PD-1 on Ag-specific CD8+ T cells in the spleen 5 days after infection with LM-OVA. Data are pooled from two similar experiments and are presented as mean ± SEM (n = 10) (***P < 0.001). (d) Representative histogram depicting PD-1 expression on Ag-specific CD8+ splenocytes of a mouse with Ag expression truncated on day 3 (D3; open, blue) and an unexcised mouse (shaded, red).
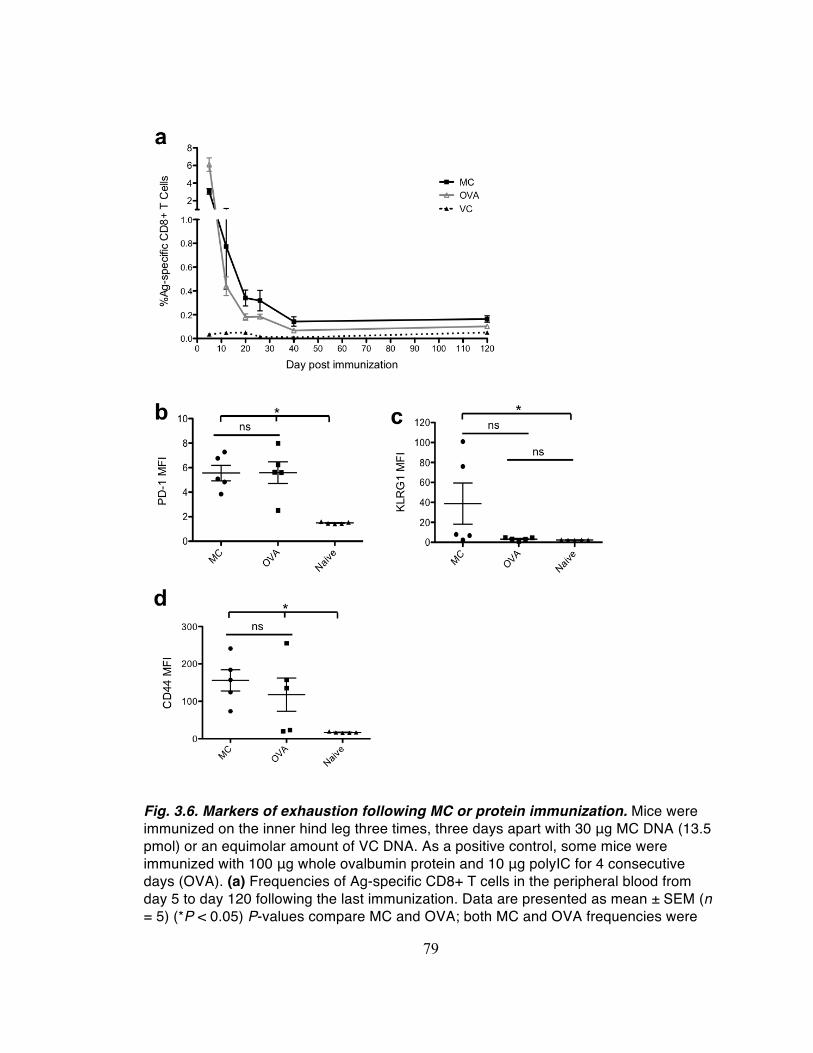
79
Fig. 3.6. Markers of exhaustion following MC or protein immunization. Mice were immunized on the inner hind leg three times, three days apart with 30 μg MC DNA (13.5 pmol) or an equimolar amount of VC DNA. As a positive control, some mice were immunized with 100 μg whole ovalbumin protein and 10 μg polyIC for 4 consecutive days (OVA). (a) Frequencies of Ag-specific CD8+ T cells in the peripheral blood from day 5 to day 120 following the last immunization. Data are presented as mean ± SEM (n = 5) (*P < 0.05) P-values compare MC and OVA; both MC and OVA frequencies were

80
significantly above VC on all days tested (P < 0.05). (b) Median fluorescence intensity of PD-1 on Ag-specific CD8+ T cells or naïve CD8+ T cells (defined as tetramer-/CD62Lhi/CD44lo) in the peripheral blood 120 days after the last immunization. Data are presented as mean ± SEM (n = 5) (*P < 0.05; ns = not significant). (c) Median fluorescence intensity of KLRG-1 on Ag-specific CD8+ T cells or naïve CD8+ T cells (defined as tetramer-/CD62Lhi/CD44lo) in the peripheral blood 120 days after the last immunization. Data are presented as mean ± SEM (n = 5) (*P < 0.05; ns = not significant). (d) Median fluorescence intensity of CD44 on Ag-specific CD8+ T cells or naïve CD8+ T cells (defined as tetramer-/CD62Lhi/CD44lo) in the peripheral blood 120 days after the last immunization. Data are presented as mean ± SEM (n = 5) (*P < 0.05; ns = not significant).

81
Fig. 3.7. In vivo gene expression following immunization with different doses of MC DNA in the ear. Mice were immunized in the ear three times, three days apart with the 30 μg (13.5 pmol) standard dose of MC DNA (MC-1X), a 50% reduced dose (15 μg, 6.75 pmol) of MC DNA (MC-0.5X), or a 5X increased dose (150 ug, 67.5 pmol) of MC DNA (MC-5X). In vivo bioluminescence was measured during and following immunizations and normalized to background levels in each mouse by subtracting luminescence in the unimmunized ear. Data are pooled for two similar experiments.
-5 0 5 10 15 20 25 30102
103
104
105
106
MC-0.5XMC-1XMC-5X
Day
Photons/cm2 /sec

82
Fig. 3.8. Immune responses following immunization with FL DNA yielding similar peak expression levels as MC DNA. Mice were immunized in the ear three times, three

83
days apart with 30 μg MC DNA (13.5 pmol) or an equimolar amount of FL or VC DNA. No ears were excised for these experiments. Mice were infected IV with 6 x 10⁴ CFU LM-OVA 42 days after the last immunization and sacrificed 5 days later. (a) In vivo bioluminescence during and following MC and FL immunization. Background levels were obtained by measuring luminescence in the unimmunized ear. Background levels for MC and FL mice did not significantly differ and were therefore combined. Data are pooled from two similar experiments and are presented as mean ± SEM (n = 10 for MC and FL; n = 20 for background). P-values compare MC to FL (*P < 0.05; **P < 0.01; ***P < 0.001). (b) Frequencies of Ag-specific CD8+ T cells in the peripheral blood from day 5 to day 42 following the last immunization in mice immunized with MC, FL, or VC DNA. Data are pooled from two similar experiments and are presented as mean ± SEM (n = 10). No significant differences exist between MC and FL on any day. Both MC and FL are significantly different from VC on all days (P < 0.05, P-values not shown). (c) Frequencies of Ag-specific CD8+ T cells in the peripheral blood 5 days following infection. Data are pooled from two similar experiments and are presented as mean ± SEM (n = 10) (***P < 0.001; ns = not significant; Kruskal-Wallis test corrected with a Dunn’s multiple comparison test). (d) Absolute number of Ag-specific CD8+ T cells in the spleen 5 days following infection. Data are pooled from two similar experiments and are presented as mean ± SEM (n = 10) (**P < 0.01; ns = not significant; Kruskal-Wallis test corrected with a Dunn’s multiple comparison test). (e) Bacterial burden in the spleen on day 47. Mice were infected IV with 6 x 10⁴ CFU LM-OVA in the tail vein and sacrificed 5 days later. Data are pooled from two similar experiments and are presented as mean ± SEM (n = 10) (**P < 0.01; ***P < 0.001; ns = not significant; Kruskal-Wallis test corrected with a Dunn’s multiple comparison test).

84
CHAPTER 4: Targeted delivery of nucleic acid to T cells using a TAT-
streptavidin fusion protein
INTRODUCTION
A method for specifically manipulating T cells would be immensely useful both in
the investigation and treatment of T cell-mediated disease. Although B cells can be
depleted using a monoclonal antibody against CD20, no analogous FDA-approved
reagent exists for T cell-specific depletion. Instead, current FDA-approved methods for
modulation of T cells generally involve systemic manipulation of IL-2, a necessary
cytokine for T cell survival and proliferation. For instance, both allogeneic graft rejection
and GVHD are T-cell mediated pathologies, treated via suppression of T cells using
calcineurin inhibitors such as tacrolimus or cyclosporine. Calcineurin inhibitors block IL-2
production by interfering with the transcription factor, nuclear factor of activated T cells
(NFAT). Conversely, metastatic melanoma and renal cell carcinoma can be treated with
administration of recombinant human IL-2 to stimulate anti-tumor T cell responses
(137,138).
These approaches are problematic because the methods of altering IL-2 are
often indirect and are thus accompanied by unwanted drug activities. For instance,
calcineurin inhibitors are associated with nephrotoxicity, thrombocytopenia,
hypertension, and hyperlipidemia, among other side effects (139-142). Furthermore, IL-2
has a complex and multifaceted role in the modification of immune responses. It does
not constitute a binary survival switch for T cells. Levels of IL-2 affect not just numbers of
T cells, but their phenotypes, functionality, and differentiation fates. In addition, IL-2

85
affects other lymphocytes; NK cell proliferation as well as B cell proliferation and
antibody production are influenced by IL-2 signaling (138). Thus, it is not surprising that
IL-2-related therapies are associated with a wide array of serious immune-related side
effects as well (143-146).
A reagent that targeted T cells in a more specific manner and allowed for both
depletion and modulation of T cell responses would have tremendous clinical utility.
Perhaps even more alluring than targeting all T cells would be targeting populations of
Ag-specific T cells. This would allow for deletion of pathogenic clones with sparing of
normal populations. Conversely, particular populations could be stimulated with growth
factors or cytokines to augment anti-microbial or anti-tumor responses. We propose
using the protein SA as a scaffold for targeting both T cells in general and Ag-specific
subpopulations of T cells.
SA is a tetrameric protein that has four high affinity binding sites for biotin (147).
Since biotin is a small molecule that can be easily appended to many other proteins, SA
is a versatile adaptor and promising potential delivery platform. For example, Albarran et
al. generated a SA-based delivery system that delivered a biotinylated cargo,
enzymatically-active alkaline phosphatase, non-specifically to cells in vitro. Entry into the
cells was achieved by modifying the SA so that each monomer had the basic 11-amino
acid sequence from the HIV-1 TAT peptide (YGRKKRRQRRR) appended to the amino
terminus (148). TAT has long been known to mediate intracellular uptake of a variety of
cargoes (149-152).
SA has also been used as the core of pMHC tetramers, which enable
identification of Ag-specific CD8+ or CD4+ T cell populations (86,153). pMHC tetramers

86
contain fluorophore-labeled SA bound to biotinylated class I or class II pMHC. The
pMHC interact specifically with TCRs, allowing for tracking of Ag-specific clones.
Following the advent of tetramers used for tracking T cells, groups have investigated
using pMHC tetramers to deplete Ag-specific T cell populations. The first successful
such attempt used class I pMHC tetramers conjugated to a radioactive particle (154).
Other groups took advantage of the fact that tetramers are internalized upon binding to
TCRs and used class I pMHC tetramers conjugated to the potent ribosome inactivating
toxin, saporin, to kill Ag-specific clones. The saporin fusion protein showed successful
specific killing of target CD8+ T cells in vitro and in vivo (85). Furthermore, the toxic
tetramer showed utility in treating mouse models of autoimmune diabetes (88), T-cell
induced choriomeningitis, and T-cell mediated hepatitis (87).
These advances are promising and exciting. However, one potential limitation to
using tetramer fusion proteins is a lack of versatility. Each new manipulation requires the
creation of an entirely novel protein that must be tested anew for the ability to bind
biotinylated targeting moieties and be internalized by T cells. Also, the protein must be
functional when fused to SA. This process is time-consuming and expensive. In contrast,
delivering DNA instead of protein would only require one delivery platform and would
enable the expression of any number of desired proteins. In addition, working with DNA
allows for a great degree of ease and flexibility. Simple cloning allows for the addition,
removal, or alteration or delivered genes. Furthermore, the use of tissue or cell-specific
promoters permits an additional level of specificity not afforded by protein-based
systems.

87
We investigate delivery of DNA specifically to T cells using a biotinylated anti-CD7
monoclonal antibody complexed to the TAT-SA fusion protein described by Albarran et
al (148). CD7 is a rapidly internalized marker found on most T cells (155,156). The TAT
peptide is highly cationic and thus binds DNA efficiently due to electrostatic interactions.
When bound to DNA, it can mediate non-specific uptake into cells via endocytosis (150).
However, when bound to DNA, efficient uptake is dependent on the charge ratio
resulting from the TAT/DNA complexes. Maximal non-specific uptake occurs when there
is a 5:1 positive/negative (p/n) charge ratio, likely because excess free TAT molecules
are necessary to mediate uptake (150). Thus, we anticipate that by controlling charge
ratio, this approach will allow for specific targeting using biotinylated targeting moieties,
such as anti-CD7.
We found that TAT-SA/αCD7 complexes deliver both siRNA and DNA to CD7+ T
cells but that delivered genes are not expressed. We also use TAT-SA to form class II
pMHC tetramers, but likewise fail to achieve production of encoded proteins. We discuss
possible obstacles to gene expression in these systems and propose potential solutions
that could enable further development of this promising technology.
RESULTS
TAT-SA production and functionality
Our approach is summarized in Fig. 4.1. It is important to note that plasmid DNA
(pDNA) is vastly larger and more charged than TAT-SA (Fig. 4.1b), such that uptake
likely involves coating of DNA with many TAT-SA molecules. Thus, finding a charge ratio

88
that allows for, at a minimum, neutralization of the negatively charged DNA, without
permitting non-specific uptake is an important consideration.
We produced the TAT-SA protein solubly in E. coli and, as expected, found its
monomeric size to be approximately 15 kDa, slightly larger than the WT core SA upon
which it was based(148,157) (Fig. 4.2a). For TAT-SA to effectively deliver DNA to
targeted cells, it must be bifunctional, capable of binding DNA via the TAT peptide and
capable of binding biotin. To assess DNA binding, we performed an electrophoretic
mobility shift assay (EMSA). When DNA and TAT-SA are complexed together at a 25-
fold molar excess of TAT-SA, there is a slight retardation in migration of DNA through
the agarose gel as determined by ethidium bromide staining. When TAT-SA is present at
a 50-fold molar excess, the ethidium bromide signal is lost entirely. Molar excesses of up
to 200 were assayed and showed a similar loss of signal (data not shown). This is likely
due to an inability of ethidium bromide to intercalate between base pairs of DNA
condensed onto the positively charged TAT peptides (158). In contrast, when DNA is
combined with as much as a 200-fold excess of WT SA there is no loss of ethidium
bromide signal and no retardation of DNA migration through the gel (Fig. 4.2b). Thus, the
addition of TAT to the SA molecule enables DNA binding.
To determine if TAT-SA was capable of binding biotin, we performed a quenching
assay using the molecule biotin-4-fluorescein (B4F), as previously described (159).
Unbound B4F fluoresces. However, upon binding to SA, B4F undergoes a
conformational change that results in loss of fluorescence. As seen in Fig. 4.2c, as the
concentration of SA (gray line) is increased (while maintaining a constant concentration
of B4F), fluorescence drops steadily until it reaches a baseline, background level.

89
Fluorescence quenching following incubation with TAT-SA (black line) follows an
identical trend. Thus, TAT-SA appears to bind biotin as well as WT SA.
TAT-SA mediates internalization of siRNA in a charge ratio-dependent manner
We next assessed the ability of TAT-SA to mediate targeted uptake of nucleic
acid in vitro into T cells via CD7. We used the human T cell line, MOLT-13, which highly
expresses CD7 (Fig. 4.3a). Given the much larger size of DNA to TAT-SA (Fig. 4.1b), we
initially investigated TAT-SA-mediated uptake of siRNA. We hypothesized that the
charge ratio formed by DNA/TAT-SA complexes would be important in mediating uptake
and were interested in examining this effect with the 21 bp siRNA. To test this, we
coated MOLT-13 cells in biotinylated anti-CD7 or isotype control antibodies, then
incubated them with complexes of TAT-SA, followed by Cy3-labeled siRNA. These
incubations were performed at 4˚C to prevent internalization. The TAT-SA was present
at either a 25X molar excess (leading to a positive charge ratio of 16.67) or at an
equimolar concentration, (yielding a negative charge ratio of 0.67). After a 4 hour
incubation at 37˚C, we found that the labeled siRNA was only present in cells coated
with the anti-CD7 antibody (not the isotype control antibody) and only when the TAT-SA
was present in excess of the siRNA (Fig. 4.3b,c).
TAT-SA mediates internalization of DNA via the anti-CD7 antibody, but not gene
expression
Since our primary interest is the targeted delivery of DNA, rather than siRNA, we
next assessed the ability of TAT-SA to mediate uptake of labeled DNA to MOLT-13 T

90
cells. For these experiments, we first formed TAT-SA/αCD7 dimers by combining a 2X
molar excess of biotinylated anti-CD7 antibody with TAT-SA. We chose to form dimers,
rather than tetramers, because we wanted to ensure that all antibody would be bound to
TAT-SA. We were concerned that free antibody would compete with TAT-SA/αCD7 for
binding to cells, and reasoned that given the high affinity of antibody-Ag interactions,
having two antibodies present on TAT-SA complexes would be sufficient for successful
binding.
We incubated TAT-SA/αCD7 dimers or TAT-SA alone with Cy5-labeled pDNA at
a charge ratio of 2 (p/n). We chose this charge ratio because the siRNA experiments
confirmed that negative charge ratios inhibit uptake, possibly due to repulsion of
negatively charged complexes by the negatively charged phospholipids on the cell
surface. However, we wanted a charge ratio low enough to minimize non-specific uptake
(150). As our plasmid, we used pmaxGFP, a 3,486 bp plasmid that robustly expresses
green fluorescent protein (GFP). To assess the ability of TAT-SA/αCD7 to bind to cells,
we incubated complexes with MOLT-13 cells at 4°C, a temperature that inhibits
internalization. We washed samples with DNAse and heparin, which degrade DNA and
cause dissociation of complexes from the cell surface, respectively, to ensure that the
Cy5 signal we were detecting derived from binding at the cell surface, rather than
internalization. We determined that both TAT-SA alone and TAT-SA/αCD7 bound to cell
surfaces when carrying labeled DNA. The DNAse/heparin treatment showed that at 4°C
there was minimal internalization of complexes, but slightly more internalization with
TAT-SA/αCD7, than with TAT-SA alone (Fig. 4.4a).

91
When this same experiment was carried out at 37°C to permit internalization,
however, differences between the TAT-SA and TAT-SA/αCD7 groups emerged (Fig.
4.4b). Without DNAse/heparin treatment, there was Cy5 signal in both groups, but
substantially more in the TAT-SA/αCD7 group. The TAT-SA/αCD7 samples treated with
DNAse/heparin showed no diminution of Cy5 signal, indicating that all of the complexes
were internalized and thus not exposed to the DNAse and heparin. However, the TAT-
SA samples treated with DNAse/heparin showed significant loss of Cy5 signal,
demonstrating that the majority of the signal seen was from DNA present on the cell
surface and not internalized. Thus, while TAT-SA and TAT-SA/αCD7 both bind to the cell
surface when carrying DNA, TAT-SA doesn’t mediate significant internalization, while
TAT-SA/αCD7 does. We postulate that TAT-SA binds to the cell surface via free TAT
arms, which are present given the excess of TAT-SA to DNA. However, the TAT is likely
unable to mediate significant non-specific internalization due to insufficient free TAT.
TAT-SA/αCD7, however, takes advantage of the specific anti-CD7/CD7 interaction to
mediate internalization, which likely accounts for the ability of these complexes to
achieve internalization of DNA.
We next wanted to determine if TAT-SA transfections could result in gene
expression. For these experiments we used unlabeled pDNA that either encoded GFP or
eff. For both experiments, DNA was complexed with TAT-SA or TAT-SA/αCD7 dimers at
a charge ratio of 2. MOLT-13 cells were then transfected with the TAT-SA or TAT-
SA/αCD7 complexes. In addition, a group of cells were transfected with lipofectamine as
a positive control. While lipofectamine transfection resulted in GFP or eff expression,

92
neither TAT-SA nor TAT-SA/αCD7 transfections resulted in any detectable gene
expression (Fig. 4.4c, 4.4d).
TAT-SA/pMHC tetramers are functional but do not mediate gene expression in Ag-
specific cells
Based on the success of pMHC tetramer toxins (85,87,88), we produced a TAT-
SA/pMHC tetramer for potential DNA delivery. We used the FliC pMHC II monomer, a
biotinylated I-Ab molecule presenting the FliC peptide (amino acids 427-441 of the
Salmonella flagellin protein (160)), to produce TAT-SA/pMHC tetramers. We tested the
ability of TAT-SA/pMHC tetramers to bind target cells in a competition assay with
conventional PE-labeled tetramers using splenocytes from the SM1 mouse, a TCR
transgenic mouse in which all CD4+ T cells are specific for FliC presented by I-Ab. We
stained SM1 splenocytes with SA-PE tetramer combined with increasing amounts of
TAT-SA tetramer, hypothesizing that the TAT-SA/pMHC tetramer would compete for
binding to SM1 cells, resulting in a loss of PE signal that would increase with the relative
concentration of TAT-SA tetramer. We found this to be the case, demonstrating that the
TAT-SA/pMHC tetramer bound target cells (Fig. 4.5).
We next assessed whether TAT-SA/pMHC tetramers could transfect Ag-specific
cells. We transfected SM1 cells, WT C57BL/6 cells (the majority of which would not be
specific for FliC/I-Ab), or an equal mixture of SM1 and WT cells with TAT-SA alone or
TAT-SA/pMHC tetramers complexed with pmaxGFP at a charge ratio of 2. We added
DNA alone to cells as a negative control and nucleofected cells with DNA as a positive
control. The SM1 cells expressed the congenic marker CD45.1 and could thereby be

93
distinguished from WT cells, which were negative for CD45.1. We detected no GFP
expression in cells treated with either TAT-SA or with TAT-SA/pMHC tetramers (Fig.4.6).
DISCUSSION
Targeted gene delivery to T cells, or to Ag-specific T cells, is an exciting concept
with widespread applicability to the study and treatment of human disease. We explore
using a bifunctional TAT-SA fusion protein to mediate targeted gene delivery to a human
leukemic T cell line and to Ag-specific mouse primary T cells. The TAT-SA approach is
attractive due to its extraordinary flexibility. Any targeting moiety could be used, provided
it is biotinylated (a straightforward chemical modification) and binds to an internalizable
receptor. T cells are not by any means the only cells that could potentially be targeted.
Furthermore, any plasmid or other nucleic acid could be delivered without requiring any
modification to the TAT-SA scaffold. This allows for gene silencing as well as the
potential delivery of encoded toxins, cytokines, growth factors, reporters, transcription
factors, or nearly any other proteins of interest. DNA vaccines could be delivered directly
to cells of interest, for instance.
We produced TAT-SA and show that it was indeed bifunctional, capable of
binding to both DNA and biotin (Fig. 4.2). We also found that TAT-SA/αCD7 mediated
uptake of both siRNA and pDNA into CD7+ T cells, while TAT-SA alone did not (Fig. 4.3,
4.4). Despite uptake of pDNA into CD7+ cells, we did not observe any gene expression.
We formed functional TAT-SA/pMHC tetramers (Fig. 4.5), but likewise achieved no gene
expression in Ag-specific T cells using these tetramers (Fig. 4.6).

94
It is interesting that TAT-SA alone appears capable of binding to cell surfaces
when complexed with DNA, but that it does not efficiently mediate internalization of that
DNA. We postulate that this may be related to the charge ratio (2, p/n) at which we
conducted those experiments. Ignatovoich et al. (150) found that non-specific uptake of
DNA into cells via TAT alone was dependent on charge ratio. In particular, free TAT
peptide was involved in mediating the internalization, requiring an excess of TAT and
thus a positive charge ratio. We reasoned that a similar phenomenon might occur with
TAT-SA and wanted to avoid the non-specific uptake associated with higher charge
ratios. However, we found that at negative charge ratios, we lost internalization of
nucleic acid (Fig. 4.3), possibly due to repulsion between complexes and negative
membrane phospholipids. Our data indicate that a charge ratio of 2 strikes an
appropriate balance, allowing for receptor-mediated internalization, but minimizing non-
specific uptake. Likely at this charge ratio, there is enough excess TAT to allow
complexes to adhere to cell surfaces, but not enough to mediate significant non-specific
internalization.
There are a number of possible reasons for poor gene expression despite robust
plasmid uptake. Once the complexes have been internalized, the DNA must escape from
the endosome into the cytosol and then enter the nucleus. Future studies are needed to
determine which of these steps TAT-SA-based delivery fails, so that appropriate steps
can be taken to overcome the obstacles present.
Studies using TAT-SA to deliver biotinylated cargo found that a large percentage
of the protein was sequestered in endosomes, a problem circumvented by addition of the
endosomal releasing polymer, poly(propylacrylic acid) (PPAA) to complexes (148,161).
95
This problem could also potentially be overcome by modifying the TAT to contain HA2, a
20 amino acid portion of the influenza hemagglutinin protein known to direct transport of
DNA out of endosomes (162). A TAT-HA2 fusion protein has already been shown to
enable enhanced escape from macropinosomes (163). If entry to the nucleus is
impaired, a nuclear localization signal could be appended to the TAT peptide to aid in
translocation (164). Additionally, more work could be done investigating the use of
siRNA, rather than pDNA, which has fewer barriers to functionality. In conclusion, using
TAT-SA for targeted gene delivery has exciting potential, but ultimately, more work is
needed before this technology becomes a reality.
MATERIALS AND METHODS
TAT-SA protein production and purification. Electrocompetent BL21(DE3) E. Coli
were transformed via electroporation with the pJExpress vector containing the TAT-SA
sequence. We produced TAT-SA solubly based on a protocol for soluble SA production
published by Gallizia et al (165). One liter of sterile TP media (20 g tryptone, 2 g
Na2HPO4, 1 g KH2PO4, 8 g NaCl, 15 g yeast extract in 1 L water) was seeded with 10 ml
overnight culture of TAT-SA-transformed BL21(DE3) and grown at 25°C with 250 rpm
shaking until the OD600 reached 0.8. Next, protein production was induced for 4 hours
using 0.4 mM isopropyl β-D-thiogalactopyranoside (IPTG). Cells were then pelleted,
resuspended in ice-cold water, and sonicated for 3-4 1 minute cycles (1 second on, 1
second off) on ice. Samples were then centrifuged at 16,000xg for 20 min. at 4°C and
the soluble fraction was saved and filtered through a 0.45 μm filter.
96
Filtered samples were affinity purified using a column containing iminobiotin
agarose (Pierce, Rockford, IL). The column was equilibrated in 50 mM ammonium
carbonate, 500 mM sodium chloride, pH 11 and TAT-SA was eluted in 50 mM
ammonium acetate, 500 mM sodium chloride, pH 4 before being immediately dialyzed
into PBS and stored at 4°C. Recombinant WT streptavidin was purchased from Sigma-
Aldrich (St. Louis, MO).
SDS-PAGE. Sodium dodecyl sulfate polyacrylamide gel electrophoresis (SDS-PAGE)
analysis of TAT-SA and commercial recombinant SA was performed. SDS and 2-
mercaptoethanol were added to samples and they were boiled for 5 minutes before
being loaded on a NuPAGE 4-12% Bis-Tris gradient gel (Invitrogen, Carlsbad, CA) and
run for 1 hour at 150 V. Gels were stained with SimplyBlue SafeStain (Invitrogen) for
protein visualization.
Electrophoretic mobility shift assay. A 0.7% agarose gel was pre-run at 93V for 1
hour at 4°C to remove any contaminants that might alter migration of TAT-SA/DNA
complexes. TAT-SA/DNA complexes were formed by incubation of 120 ng of the
pmaxGFP plasmid with TAT-SA or WT SA at variable molar ratios for 30 min. at 25°C.
Complexes were then electrophoresed on the pre-run gel at 93 V for 100 minutes at
25°C in the absence of loading dye. Following electrophoresis, gels were stained with 50
ml of 0.6 μg/ml ethidium bromide for 15 minutes and analyzed using a UV light box.

97
Biotin binding assay. Biotin binding was assessed using biotin-4-fluorescein, as
described by Kada et al (159). Varying concentrations of TAT-SA or WT SA were
combined with 5.15 ng B4F in 1 ml total volume of a buffer containing 100 mM NaCl, 50
mM NaH2PO4, 1 mM EDTA (pH 7.5 with NaOH) and 0.1 mg/ml BSA. From each sample,
300 μl aliquots were pipetted into a 96-well plate and incubated for 30 min. at 25°C
protected from light. Fluorescence was measured on a 96-well plate reader (485 nm
excitation wavelength, 525 emission wavelength).
MOLT-13 cell transfections. All work was completed using sterile reagents and
equipment. MOLT-13 is a human T cell acute lymphocytic leukemic cell line. These cells
were grown in RPMI 1640 supplemented with 10% fetal bovine serum (FBS) (Invitrogen)
and 5% penicillin/streptomycin (P/S) at 37°C with 5% CO2. During transfections, cells
were maintained in unsupplemented RPMI 1640 (no FBS or P/S).
For siRNA transfections, 1.5x10⁶ cells were suspended in 160 μl cold media in
FACS tubes and incubated with 1.6 μl biotinylated anti-CD7 or isotype control antibody
(biotinylated mouse IgG1, kappa) for 20 min. at 4°C, then washed with cold media. Cells
were then incubated with varying amounts of TAT-SA for 20 min. at 4°C, and washed
again. Finally, 100 pmol of Cy3-labeled GAPDH siRNA (Invitrogen) was added to the
cells, they were incubated at 4°C for 20 min., washed again with cold media, then plated
in a 6-well plate and placed at 37°C in a tissue culture incubator. Lipofectamine
(Invitrogen) transfections were carried out according to the manufacturer’s instructions
using 100 pmol siRNA. After a 4-hour incubation, cells were harvested and analyzed via
flow cytometry for uptake of Cy3-labeled siRNA on a BD FACSCalibur flow cytometer

98
using BD CellQuest Pro software (BD Biosciences, San Jose, CA) and FlowJo software
(Tree Star, Inc., Ashland, OR).
For transfections with Cy5-labeled DNA, the pmaxGFP plasmid (Lonza,
Allendale, NJ) was labeled using the Label IT Cy5 Labeling Kit (Mirus, Madison, WI),
following the manufacturer’s instructions. TAT-SA/αCD7 complexes were formed by
combining a 2X molar excess of biotinylated anti-CD7 antibody (eBiosciences, San
Diego, CA) with TAT-SA and incubating for 1 hour at 25°C followed by a 12-hour
incubation at 4°C. TAT-SA/αCD7 complexes or TAT-SA alone was then added to 1 μg
labeled DNA (at a charge ratio of 2) and incubated at 25°C for 45 min. Complexes were
added to 1.5x10⁶ cells in 200 μl RPMI 1640 and incubated at 4°C or 37°C for 4 hours.
Lipofectamine (Invitrogen) transfections were carried out according to the manufacturer’s
instructions using 1 μg DNA. After incubation, cells to be treated with DNAse/heparin
were then washed in 250 μl FACS buffer with 1.25 μl heparin three times, washed in
FACS buffer, and incubated in 250 μl FACS buffer with 2 μl DNAse for 10 min at 25°C.
All cells were then washed in FACS buffer and analyzed via flow cytometry for uptake of
Cy3-labeled siRNA on a BD FACSCalibur flow cytometer using BD CellQuest Pro
software (BD Biosciences) and FlowJo software (Tree Star, Inc.). Transfections to
determine GFP gene expression occurred as above except pmaxGFP was unlabeled,
cells were not treated with DNAse/heparin, and cells were incubated for 48 hours prior to
analysis.
Transfections assaying luciferase expression used a MC DNA encoding the eff
reporter. MC DNA is circular DNA that lacks a bacterial backbone and thus achieves
higher levels of transgene expression (65). It is explored in more detail in chapters 2 and

99
3 of this thesis. Briefly, to produce the MC-eff we amplified eff from the pUltra Bright eff
luciferase+ plasmid (generously provided by Patrick Hwu, MD Anderson Cancer Center
(Houston, TX) (102) and inserted it into a vector containing the hUbC promoter (kindly
provided by Michael Kyba, University of Minnesota, Minneapolis, MN). For MC
generation, bacteria transformed with parental pDNA were grown overnight in Terrific
Broth supplemented with kanamycin (Invitrogen). The following day MC induction media
(fresh LB broth containing 0.04 volumes of 1 N NaOH and 0.02% L-arabinose (Sigma-
Aldrich) were added and the culture temperature was decreased from 37°C to 32°C for
5–8 hours. The culture was centrifuged and MC DNA was purified with the PureLink
HiPure Maxiprep Kit using buffers from the Purelink HiPure BAC Buffer Kit (Invitrogen).
Transfections using MC-eff occurred just as for transfections with pmaxGFP. For
analysis of luciferase expression, the Luciferase Assay System (Promega, Madison, WI)
was used according to the manufacturer’s instructions.
Tetramer competition assay and mouse primary cell transfections. All work was
completed using sterile reagents and equipment. TAT-SA/pMHC tetramers were
preformed by combining 95 μl (1.9 mg, 61 μM biotin) FliC/I-Ab monomer (kindly provided
by Marc Jenkins, PhD, University of Minnesota, Minneapolis, MN) with 10 nM TAT-SA in
100 μl and incubating for 1 hour at 25°C and 12 hours at 4°C. For the competition
assay, splenocytes from a SM1 TCR transgenic mice (a generous gift from Stephen
McSorley, PhD, UC Davis, Davis, CA) were incubated with SA-PE tetramer (also a gift
from Dr. McSorley) and TAT-SA tetramer at varying concentrations, then analyzed by
flow cytometry for binding of the SA-PE tetramer.

100
For transfections, TAT-SA tetramers were formed as above, then incubated with
1 μg pmaxGFP (at a charge ratio of 2) for 30 min. at 25°C. Splenocytes were isolated
from a CD45.1+ SM1 mouse or a CD45.1- C57BL/6 mouse, single cell suspensions
prepared in RPMI 1640, and red blood cells lysed. DNA, DNA and TAT-SA, or DNA and
TAT-SA/pMHC tetramer were added to 3x10⁶ cells in 300 μl and incubated for 20 min. at
4°C. Cells were transferred to 2 ml RPMI 1640 with 10% FBS in a 6-well plate and
incubated at 37°C for 24 hours. Nucleofections were performed using the Amaxa Mouse
T Cell Nucleofector Kit (Lonza) according to the manufacturer’s instructions. Flow
cytometry was then performed to detect GFP+ cells using a BD FACSCalibur flow
cytometer with BD CellQuest Pro software (BD Biosciences). FlowJo software was used
for data analysis (Tree Star, Inc.).
Mice. Four to eight week old female C57BL/6 mice were purchased from the Jackson
Laboratory (Bar Harbor, ME) or the National Cancer Institute (Frederick, MD). All mice
were housed under specific pathogen free-conditions at the University of Minnesota
(Minneapolis). All animal procedures were carried out according to protocols approved
by the Institutional Animal Care and Use Committee.

101
FIGURES
Figure 4.1. Schematic of TAT-SA delivery platform. (a) TAT-SA (not drawn to scale) contains the tetrameric core SA with TAT peptides appended to each monomer but retains the ability to bind biotinylated targeting moieties. (b) Approximate representation of relative size of TAT-SA to plasmid DNA. A 3000 bp plasmid is approximately 40 times more massive than TAT-SA and 200 times more negatively charged than TAT-SA is positively charged.

102
Figure 4.2. TAT-SA can be produced and is functional. (a) Reducing SDS-PAGE analysis of TAT-SA (15 kDA) and WT recombinant core SA (13.2 kDA). (b) Agarose gel electrophoresis analysis of DNA (pmaxGFP) and TAT-SA complexes formed at the indicated molar (MR) and charge (CR) ratios. DNA incubated with WT SA was used as a negative control. (c) Fluorescence quenching of B4F in the presence of WT SA (gray line) or TAT-SA (black line). WT SA or TAT-SA were incubated at the indicated concentrations with 8 nM B4F and 0.1 mg/ml BSA for 30 min and fluorescence was measured (485 nm excitation wavelength, 525 nm emission wavelength). Samples were prepared in triplicate.

103
Figure 4.3. TAT-SA mediates uptake of siRNA into MOLT-13 cells via the anti-CD7 antibody in a charge ratio-dependent manner. (a) Histogram demonstrating CD7 expression on MOLT-13 cells. Cells were untreated (shaded), or treated with either a biotinylated anti-CD7 antibody (red, bold) or a biotinylated isotype control antibody (blue) followed by SA-PE. (b) Flow cytometric analysis of siRNA uptake. Cells were incubated with an anti-CD7 (left panel) or an isotype control (middle planel) antibody, followed by TAT-SA, then Cy3-labeled siRNA (25X excess of TAT-SA to siRNA) at 4°C to prevent internalization and enable formation of complexes at the cell surface. Cells were then incubated at 37°C for 4 hours and analyzed Cy3 expression by flow cytometry. Lipofectamine was used to transfect cells as a positive control (right panel). (c) Histograms showing Cy3 expression in MOLT-13 cells following transfections as in (b)

104
using TAT-SA and an anti-CD7 antibody (bold, red) or an isotype control antibody (blue) at a positive charge ratio (left panel) or a negative charge ratio (right panel).

105
Figure 4.4. TAT-SA mediates binding and internalization of DNA into MOLT-13 cells via the anti-CD7 antibody but not gene expression. (a) Binding of TAT-SA/αCD7 complexes to the cell surface. MOLT-13 cells were incubated with pre-formed TAT-SA/αCD7 dimers complexed with Cy5-labeled pmaxGFP plasmid (top row) or TAT-SA/DNA complexes without antibody (bottom row) at 4°C to prevent internalization. Samples were treated (right column) or untreated (left column) with DNAse and heparin to degrade and dissociate DNA on the cell surface. (b) Internalization of TAT-SA/αCD7 complexes. MOLT-13 cells were incubated with pre-formed TAT-SA/αCD7 dimers complexed with Cy5-labeled pmaxGFP plasmid (top row) or TAT-SA/DNA complexes without antibody (bottom row) at 37°C to enable internalization. Samples were treated (right column) or untreated (left column) with DNAse and heparin to degrade and dissociate DNA on the cell surface. (c) Flow cytometric analysis of GFP expression in MOLT-13 cells transfected with 1 μg pmaxGFP using lipofectamine as a positive control (left panel), TAT-SA/αCD7 preformed complexes (middle panel), or TAT-SA with no targeting antibody (right panel). (d) Luciferase expression in relative light units (RLU)

106
MOLT-13 cells transfected with 1 μg of luciferase-encoding DNA using lipofectamine, TAT-SA/αCD7 preformed complexes, or TAT-SA with no targeting antibody.

107
Figure 4.5. TAT-SA pMHC tetramers bind to Ag-specific target cells. (a) Gating strategy for detecting FliC-specific CD4+ T cells bound to SA-PE tetramer. Splenocytes from SM1 mice were stained with FliC SA-PE tetramer. Forward and side scatter parameters were used to gate on lymphocytes (left most plot). CD4+ T cells were determined to be gated lymphocytes that expressed CD4 but did not express CD11b, CD11c, B220, or class II MHC (middle plot). Tetramer+ cells were gated CD4+ T cells that were positive for PE (right most plot). (b) Flow cytometric analysis of TAT-SA competition for SA-PE tetramer binding to SM1 cells. The FliC-specific TAT-SA tetramer was combined with the SA-PE tetramer at the indicated molar ratios (TAT-SA tetramer : SA-PE tetramer) and incubated with freshly isolated SM1 splenocytes. (c) PE median fluorescence intensity from (b), normalized to the sample with no TAT-SA tetramer (MR = 0).

108
Figure 4.6. Absence of gene expression following FliC-specific TAT-SA tetramer transfections of SM1 cells. Flow cytometric analysis of GFP expression in splenocytes from SM1 or C57/BL6 mice transfected with 1 μg pmaxGFP using no transfection agent (DNA only, first column), nucleofection (second column), TAT-SA/pMHC tetramer (third column), or TAT-SA without a targeting moiety (fourth column). Transfected cells were splenocytes from CD45.1+ SM1 mice (first row), CD45.1- WT C57BL/6 mice (second row), or an equal mixture of SM1 and WT cells (third row).
109
CHAPTER 5: Conclusions
Since Edward Jenner first used scrapings from cowpox blisters to provide
protection against smallpox in the 1770s, vaccines have saved countless lives. The
knowledge that weakened or inactivated pathogens, and even pathogen-derived
particles, could be used to confer protective immunity spurred the development of
dozens of vaccines leading to the eventual eradication of smallpox from the globe and
the near eradication of polio. After clean drinking water and antibiotics, vaccination is
often cited as the most cost-effective and life-saving intervention in the history of
medicine (19,20).
Unfortunately, however, there are a number of pathogens for which developing
efficacious vaccines has been difficult: HIV, influenza, hepatitis C, tuberculosis, and
malaria, among others. For these diseases, more sophisticated approaches and a more
extensive understand of the biology of immune responses will be necessary to produce
an effective vaccine (20). To that end, this thesis has examined one promising
immunization approach, the use of DNA vaccines. In particular, we investigated a
method for improving the immunogenicity of DNA vaccines by prolonging and enhancing
Ag expression and studied the effect of prolonged Ag expression on immune responses.
In addition, we discussed a method for augmenting or manipulating T cell responses via
targeted DNA delivery.
The second chapter of this thesis demonstrated the use of MC DNA as a DNA
vaccine. MC DNA lacks nearly all extragenic DNA, thereby avoiding silencing and
resulting in enhanced and prolonged gene expression. Although MC DNA had been

110
shown to be effective in many experimental models, it had never before been tested as a
vaccine. An important distinction between the previous models using MC DNA and our
vaccine experiments is the ambiguity about whether prolonged Ag expression in a
vaccine would be beneficial for immune responses. Previous models involving gene
therapy or gene knockdown have rested on the certainty that prolonged gene expression
is optimal for successful therapy. However, when using MC DNA as a vaccine, the
situation was less clear. Prolonged Ag expression during chronic infections in both mice
and humans leads to exhausted CD8+ T cells, rather than protective memory cell
formation (13). Furthermore, studies using Listeria monocytogenes showed that for
successful priming of CD8+ T cell responses to occur, only 24 hours of exposure to Ag
was required (9).
We hypothesized that the situation with a MC DNA vaccine would differ from an
infection due to the lower levels of Ag and inflammation present in a vaccine compared
to an infection. Therefore, we predicted that immunizing with MC DNA would improve the
immunogenicity of DNA vaccines since poor Ag expression is known to occur following
DNA vaccination and MC DNA would generate increased levels of Ag. As other groups
had observed, we obtained significantly higher levels of gene expression and more
prolonged gene expression using MC DNA compared to FL DNA (Fig. 2.3). Furthermore,
consistent with our hypothesis, we found that MC DNA vaccination yielded significantly
increased frequencies of Ag-specific CD8+ T cells in the peripheral blood compared to
FL DNA vaccination (Fig. 2.8). In addition, immunization with MC DNA provided superior
protection following an infectious challenge with Listeria compared to FL DNA (Fig. 2.9).

111
The knowledge that MC DNA can be used to improve the immunogenicity of DNA
vaccines is valuable. Low immunogenicity has plagued DNA vaccines in clinical trials,
limiting their success despite the many advantages they have and the great promise
they have shown in preclinical models (31). MC DNA is nearly as straightforward and
easy to produce as standard pDNA (71), and therefore offers a simple way to circumvent
the low immunogenicity of DNA vaccines. However, it is perhaps more important to
understand why MC DNA generates superior CD8+ T cell responses so that these
mechanisms could potentially be more fully exploited in vaccine design.
The reduced size of MC DNA likely aids in vector uptake, increasing transfection
efficiency (66). However, the absence of a large extragenic portion also abolishes
transcriptional silencing mechanisms normally responsible for the rapid decline in gene
expression following transfection of pDNA into mammalian cells (64,67). These two
attributes together accounted for the increase in gene expression seen with MC DNA
transfection. However, the reason why the increase in gene expression seen with MC
DNA vaccines yielded a superior CD8+ T cell response compared to pDNA vaccines
was less clear, and was the subject of chapter 3 of this thesis.
As seen in Fig. 2.3, MC DNA vaccination yields both higher absolute levels of
gene expression and an increased duration of gene expression. We were interested in
whether the prolonged gene expression was necessary, or even beneficial, for the CD8+
T cell response generated by MC vaccines. By immunizing mice on the ear and excising
the ears at various time points, we regulated duration of Ag expression. We found that
the prolonged Ag expression associated with MC DNA vaccines is an important
component contributing to their efficacy. Removing the ear at any time point tested,

112
including 22 days after the last immunization, resulted in a diminished ability to clear
infection with Listeria (Fig. 3.4d). In animals with ears excised at later time points, such
as day 22, this effect did not appear to derive from a diminished pool of responders prior
to infection (Fig. 3.3c). Rather, the cells failed to proliferate as robustly following
challenge (Fig. 3.4 a-c), indicating a functional deficit. On-going experiments will
determine whether other functional deficits exist as well, such as a diminished ability to
secrete IFN-γ, TNF-α, or granzyme B.
It is unclear what advantage persistent Ag confers on CD8+ T cells in our model.
In chronic infection, persistent Ag induces exhaustion, rather than improving immune
responses. However, following DNA vaccination, there is significantly less Ag and
inflammation, which may account for the difference we see. Nevertheless, further
experiments would be needed to determine the role that Ag is playing in enhancing the
ability of T cells to respond to challenge. It would be important to know whether Ag
presentation was still occurring at the time of infection in mice without ear excision. It
may be that the presence of vaccine-encoded Ag in LN at the time of challenge allows
for more robust expansion upon infection.
Whether or not the effect we see is dependent on Ag being present at the time of
infection is a separate question from why prolonged Ag expression, either continuing
until the point of infection or merely lasting well past the prime but terminating before
challenge, is beneficial for the secondary response. As mentioned above, this is a novel
finding, not seen in infectious settings, where prolonged infection is detrimental.
Therefore, it may be that the prolonged Ag may compensate for weak or suboptimal Ag

113
stimulation early in priming, explaining why it would be beneficial in a weakly
immunogenic DNA vaccine setting as compared to an infection.
The finding that excision before the peak of the CD8+ T cell response leads to
early and more severe contraction (Fig. 3.3) is also interesting as it contradicts the
finding that only 24 hours of Ag stimulation pre-programs the kinetics of CD8+ T cell
expansion and contraction. We hypothesize that the difference in this case is also the
level of Ag expression and/or inflammation. The presence of high levels of Ag and
inflammation that occur during natural infection likely initiate a program of expansion and
contraction that weaker immunizations may be insufficient to initiate as fully. In those
cases then, there would be room for additional manipulation and augmentation of the
response after the early initiating stimulus. This indicates that one must use caution
when applying principles learned from infection experiments to vaccine experiments,
particularly vaccines not using pathogen. Our data provide support for the idea that low
immunogenicity can be overcome after the peak by continued Ag expression.
Of course, another solution would be to increase levels of Ag at the peak of
expression, which MC DNA also generally does due to its reduced size. When we
immunized with a FL vector that had similar levels of gene expression at the peak as
MC, we found no differences in frequencies of CD8+ T cells or protection against Listeria
(Fig. 3.8). This indicates that expression levels at the peak are likely also an important
contributor to the development of protective immune responses. Further work is needed
to delineate which approach, prolonged Ag expression or enhanced peak expression, is
better at augmenting CD8+ T cell responses.

114
Furthermore, it remains to be determined whether the difference seen in our
vaccination model and in infectious settings has to do specifically with levels of
inflammation, levels of Ag, kinetics of T cell exposure to Ag and/or inflammation, or some
combination of the above. It is possible that a vaccine generating high levels of Ag in the
presence of low levels of inflammation would yield results very different than a vaccine
that produced low levels of Ag and high levels of inflammation. Moreover, those results
might change if the Ag or inflammatory stimuli were introduced to the host rapidly or
slowly, over the course of weeks as can happen with certain DNA vaccine delivery
methods.
In addition to investigating methods of improving DNA vaccines by overcoming
transient transgene expression, this thesis explores a method for manipulating T cell
responses with the long-term goal of augmenting T cell responses to improve
vaccination. We found that while our TAT-SA construct mediated uptake of DNA, we
were unable to achieve gene expression (Fig.4.4, 4.6). Despite this setback, this
approach is a promising one worthy of further investigation. Gene targeting to DCs has
already been shown to improve the efficacy of DNA vaccines (77), but no one has yet
been able to test the effect of manipulating how T cells respond to Ag to generate
optimal immune responses. Such an approach would have applications not just in
vaccine development, but potentially in autoimmunity, graft rejection, GVHD, and cancer
therapy. To reach these goals, however, much work must be done.
For our system, initial experiments would be needed to determine at what stage
expression fails to occur: endosomal escape, entry to the nucleus, transcription, or
translation. Modifications to overcome the barrier or barriers preventing expression

115
would then need to be integrated into the platform. Transitioning a product that
functioned in vitro to one that functioned in vivo would potentially involve additional
modifications. However, it is promising that SA-based tetramer depletion approaches
have functioned in vivo (85,87,88).
The work in this thesis provides useful knowledge for the field of DNA vaccine
design. In it, we show that one of the major obstacles hindering the translation of DNA
vaccines to human use, poor immunogenicity, can be improved by using MC DNA
instead of pDNA. MC DNA retains the advantages of pDNA, including ease and
affordability, but drives stronger immune responses. Secondly, we demonstrate that the
prolonged Ag expression associated with MC DNA is a necessary component
contributing to its enhanced immunogenicity. This finding has important implications for
vaccine design in general, which has often focused on early Ag levels, but also provides
interesting insights into the nature of CD8+ T cell responses. Future avenues of research
could further explore the limits that determine when responses are pre-programmed and
when they are sensitive to on-going Ag expression, as well as differentiating the roles of
Ag and inflammation. Lastly, this work provides a potential method for targeted gene
delivery to T cells, a goal with a myriad of promising applications.

116
References
(1) Reis e Sousa C. Dendritic cells in a mature age. Nat Rev Immunol 2006 Jun;6(6):476-483.
(2) Macagno A, Napolitani G, Lanzavecchia A, Sallusto F. Duration, combination and timing: the signal integration model of dendritic cell activation. Trends Immunol 2007 May;28(5):227-233.
(3) Curtsinger JM, Mescher MF. Inflammatory cytokines as a third signal for T cell activation. Curr Opin Immunol 2010 Jun;22(3):333-340.
(4) Kaech SM, Cui W. Transcriptional control of effector and memory CD8+ T cell differentiation. Nat Rev Immunol 2012 Nov;12(11):749-761.
(5) Bots M, Medema JP. Granzymes at a glance. J Cell Sci 2006 Dec 15;119(Pt 24):5011-5014.
(6) Chavez-Galan L, Arenas-Del Angel MC, Zenteno E, Chavez R, Lascurain R. Cell death mechanisms induced by cytotoxic lymphocytes. Cell Mol Immunol 2009 Feb;6(1):15-25.
(7) Wherry EJ, Ahmed R. Memory CD8 T-cell differentiation during viral infection. J Virol 2004 Jun;78(11):5535-5545.
(8) Kaech SM, Wherry EJ, Ahmed R. Effector and memory T-cell differentiation: implications for vaccine development. Nat Rev Immunol 2002 Apr;2(4):251-262.
(9) Mercado R, Vijh S, Allen SE, Kerksiek K, Pilip IM, Pamer EG. Early programming of T cell populations responding to bacterial infection. J Immunol 2000 Dec 15;165(12):6833-6839.
(10) Kaech SM, Ahmed R. Memory CD8+ T cell differentiation: initial antigen encounter triggers a developmental program in naive cells. Nat Immunol 2001 May;2(5):415-422.
(11) van Stipdonk MJ, Lemmens EE, Schoenberger SP. Naive CTLs require a single brief period of antigenic stimulation for clonal expansion and differentiation. Nat Immunol 2001 May;2(5):423-429.
(12) Goldrath AW, Sivakumar PV, Glaccum M, Kennedy MK, Bevan MJ, Benoist C, et al. Cytokine requirements for acute and Basal homeostatic proliferation of naive and memory CD8+ T cells. J Exp Med 2002 Jun 17;195(12):1515-1522.
(13) Wherry EJ. T cell exhaustion. Nat Immunol 2011 Jun;12(6):492-499.

117
(14) Obar JJ, Khanna KM, Lefrancois L. Endogenous naive CD8+ T cell precursor frequency regulates primary and memory responses to infection. Immunity 2008 Jun;28(6):859-869.
(15) Kotturi MF, Scott I, Wolfe T, Peters B, Sidney J, Cheroutre H, et al. Naive precursor frequencies and MHC binding rather than the degree of epitope diversity shape CD8+ T cell immunodominance. J Immunol 2008 Aug 1;181(3):2124-2133.
(16) Haluszczak C, Akue AD, Hamilton SE, Johnson LD, Pujanauski L, Teodorovic L, et al. The antigen-specific CD8+ T cell repertoire in unimmunized mice includes memory phenotype cells bearing markers of homeostatic expansion. J Exp Med 2009 Feb 16;206(2):435-448.
(17) Esser MT, Marchese RD, Kierstead LS, Tussey LG, Wang F, Chirmule N, et al. Memory T cells and vaccines. Vaccine 2003 Jan 17;21(5-6):419-430.
(18) Obar JJ, Lefrancois L. Memory CD8+ T cell differentiation. Ann N Y Acad Sci 2010 Jan;1183:251-266.
(19) Plotkin SA. Vaccines: the fourth century. Clin Vaccine Immunol 2009 Dec;16(12):1709-1719.
(20) Pulendran B, Ahmed R. Immunological mechanisms of vaccination. Nat Immunol 2011 Jun;12(6):509-517.
(21) Moyle PM, Toth I. Modern subunit vaccines: development, components, and research opportunities. ChemMedChem 2013 Mar;8(3):360-376.
(22) Patronov A, Doytchinova I. T-cell epitope vaccine design by immunoinformatics. Open Biol 2013 Jan 8;3(1):120139.
(23) Saxena M, Van TT, Baird FJ, Coloe PJ, Smooker PM. Pre-existing immunity against vaccine vectors--friend or foe? Microbiology 2013 Jan;159(Pt 1):1-11.
(24) Wolff JA, Malone RW, Williams P, Chong W, Acsadi G, Jani A, et al. Direct gene transfer into mouse muscle in vivo. Science 1990 Mar 23;247(4949 Pt 1):1465-1468.
(25) Tang DC, DeVit M, Johnston SA. Genetic immunization is a simple method for eliciting an immune response. Nature 1992 Mar 12;356(6365):152-154.
(26) Robinson HL, Hunt LA, Webster RG. Protection against a lethal influenza virus challenge by immunization with a haemagglutinin-expressing plasmid DNA. Vaccine 1993;11(9):957-960.

118
(27) Montgomery DL, Shiver JW, Leander KR, Perry HC, Friedman A, Martinez D, et al. Heterologous and homologous protection against influenza A by DNA vaccination: optimization of DNA vectors. DNA Cell Biol 1993 Nov;12(9):777-783.
(28) Wang B, Ugen KE, Srikantan V, Agadjanyan MG, Dang K, Refaeli Y, et al. Gene inoculation generates immune responses against human immunodeficiency virus type 1. Proc Natl Acad Sci U S A 1993 May 1;90(9):4156-4160.
(29) Ledwith BJ, Manam S, Troilo PJ, Barnum AB, Pauley CJ, Griffiths TG,2nd, et al. Plasmid DNA vaccines: investigation of integration into host cellular DNA following intramuscular injection in mice. Intervirology 2000;43(4-6):258-272.
(30) Wang Z, Troilo PJ, Wang X, Griffiths TG, Pacchione SJ, Barnum AB, et al. Detection of integration of plasmid DNA into host genomic DNA following intramuscular injection and electroporation. Gene Ther 2004 Apr;11(8):711-721.
(31) Kutzler MA, Weiner DB. DNA vaccines: ready for prime time? Nat Rev Genet 2008 Oct;9(10):776-788.
(32) Abdulhaqq SA, Weiner DB. DNA vaccines: developing new strategies to enhance immune responses. Immunol Res 2008;42(1-3):219-232.
(33) Bambini S, Rappuoli R. The use of genomics in microbial vaccine development. Drug Discov Today 2009 Mar;14(5-6):252-260.
(34) He Y, Rappuoli R, De Groot AS, Chen RT. Emerging vaccine informatics. J Biomed Biotechnol 2010;2010:218590.
(35) Patronov A, Doytchinova I. T-cell epitope vaccine design by immunoinformatics. Open Biol 2013 Jan 8;3(1):120139.
(36) De Groot AS, Einck L, Moise L, Chambers M, Ballantyne J, Malone RW, et al. Making vaccines “on demand”: A potential solution for emerging pathogens and biodefense? Human vaccines & immunotherapeutics 2013;9(9).
(37) Liu MA. DNA vaccines: an historical perspective and view to the future. Immunol Rev 2011 Jan;239(1):62-84.
(38) Bins AD, Jorritsma A, Wolkers MC, Hung CF, Wu TC, Schumacher TN, et al. A rapid and potent DNA vaccination strategy defined by in vivo monitoring of antigen expression. Nat Med 2005 Aug;11(8):899-904.
(39) Elnekave M, Furmanov K, Hovav AH. Intradermal naked plasmid DNA immunization: mechanisms of action. Expert Rev Vaccines 2011 Aug;10(8):1169-1182.

119
(40) Faurez F, Dory D, Le Moigne V, Gravier R, Jestin A. Biosafety of DNA vaccines: New generation of DNA vectors and current knowledge on the fate of plasmids after injection. Vaccine 2010 May 21;28(23):3888-3895.
(41) Elnekave M, Furmanov K, Nudel I, Arizon M, Clausen BE, Hovav AH. Directly transfected langerin+ dermal dendritic cells potentiate CD8+ T cell responses following intradermal plasmid DNA immunization. J Immunol 2010 Sep 15;185(6):3463-3471.
(42) Iwasaki A, Medzhitov R. Toll-like receptor control of the adaptive immune responses. Nat Immunol 2004 Oct;5(10):987-995.
(43) Spies B, Hochrein H, Vabulas M, Huster K, Busch DH, Schmitz F, et al. Vaccination with plasmid DNA activates dendritic cells via Toll-like receptor 9 (TLR9) but functions in TLR9-deficient mice. J Immunol 2003 Dec 1;171(11):5908-5912.
(44) Hornung V, Ablasser A, Charrel-Dennis M, Bauernfeind F, Horvath G, Caffrey DR, et al. AIM2 recognizes cytosolic dsDNA and forms a caspase-1-activating inflammasome with ASC. Nature 2009 Mar 26;458(7237):514-518.
(45) Unterholzner L, Keating SE, Baran M, Horan KA, Jensen SB, Sharma S, et al. IFI16 is an innate immune sensor for intracellular DNA. Nat Immunol 2010 Nov;11(11):997-1004.
(46) Saade F, Petrovsky N. Technologies for enhanced efficacy of DNA vaccines. Expert Rev Vaccines 2012 Feb;11(2):189-209.
(47) Bergman PJ, McKnight J, Novosad A, Charney S, Farrelly J, Craft D, et al. Long-term survival of dogs with advanced malignant melanoma after DNA vaccination with xenogeneic human tyrosinase: a phase I trial. Clin Cancer Res 2003 Apr;9(4):1284-1290.
(48) Davis BS, Chang GJ, Cropp B, Roehrig JT, Martin DA, Mitchell CJ, et al. West Nile virus recombinant DNA vaccine protects mouse and horse from virus challenge and expresses in vitro a noninfectious recombinant antigen that can be used in enzyme-linked immunosorbent assays. J Virol 2001 May;75(9):4040-4047.
(49) Corbeil S, Lapatra SE, Anderson ED, Jones J, Vincent B, Hsu YL, et al. Evaluation of the protective immunogenicity of the N, P, M, NV and G proteins of infectious hematopoietic necrosis virus in rainbow trout oncorhynchus mykiss using DNA vaccines. Dis Aquat Organ 1999 Dec 22;39(1):29-36.
(50) Drape RJ, Macklin MD, Barr LJ, Jones S, Haynes JR, Dean HJ. Epidermal DNA vaccine for influenza is immunogenic in humans. Vaccine 2006 May 22;24(21):4475-4481.

120
(51) Jones S, Evans K, McElwaine-Johnn H, Sharpe M, Oxford J, Lambkin-Williams R, et al. DNA vaccination protects against an influenza challenge in a double-blind randomised placebo-controlled phase 1b clinical trial. Vaccine 2009 Apr 21;27(18):2506-2512.
(52) Kalams SA, Parker S, Jin X, Elizaga M, Metch B, Wang M, et al. Safety and immunogenicity of an HIV-1 gag DNA vaccine with or without IL-12 and/or IL-15 plasmid cytokine adjuvant in healthy, HIV-1 uninfected adults. PLoS One 2012;7(1):e29231.
(53) Kalams SA, Parker SD, Elizaga M, Metch B, Edupuganti S, Hural J, et al. Safety and Comparative Immunogenicity of an HIV-1 DNA Vaccine in Combination with Plasmid Interleukin 12 and Impact of Intramuscular Electroporation for Delivery. J Infect Dis 2013 Sep;208(5):818-829.
(54) Mancini-Bourgine M, Fontaine H, Brechot C, Pol S, Michel ML. Immunogenicity of a hepatitis B DNA vaccine administered to chronic HBV carriers. Vaccine 2006 May 22;24(21):4482-4489.
(55) Castellanos M, Cinza Z, Dorta Z, Veliz G, Vega H, Lorenzo I, et al. Immunization with a DNA vaccine candidate in chronic hepatitis C patients is safe, well tolerated and does not impair immune response induction after anti-hepatitis B vaccination. J Gene Med 2010;12(1):107 <last_page> 116.
(56) Boudreau EF, Josleyn M, Ullman D, Fisher D, Dalrymple L, Sellers-Myers K, et al. A Phase 1 clinical trial of Hantaan virus and Puumala virus M-segment DNA vaccines for hemorrhagic fever with renal syndrome. Vaccine 2012 Mar 2;30(11):1951-1958.
(57) Beckett CG, Tjaden J, Burgess T, Danko JR, Tamminga C, Simmons M, et al. Evaluation of a prototype dengue-1 DNA vaccine in a Phase 1 clinical trial. Vaccine 2011 Jan 29;29(5):960-968.
(58) Smith LR, Wloch MK, Ye M, Reyes LR, Boutsaboualoy S, Dunne CE, et al. Phase 1 clinical trials of the safety and immunogenicity of adjuvanted plasmid DNA vaccines encoding influenza A virus H5 hemagglutinin. Vaccine 2010 Mar 16;28(13):2565-2572.
(59) Ledgerwood JE, Hu Z, Gordon IJ, Yamshchikov G, Enama ME, Plummer S, et al. Influenza virus h5 DNA vaccination is immunogenic by intramuscular and intradermal routes in humans. Clin Vaccine Immunol 2012 Nov;19(11):1792-1797.
(60) Martin JE, Louder MK, Holman LA, Gordon IJ, Enama ME, Larkin BD, et al. A SARS DNA vaccine induces neutralizing antibody and cellular immune responses in healthy adults in a Phase I clinical trial. Vaccine 2008 Nov 25;26(50):6338-6343.
(61) Le TP, Coonan KM, Hedstrom RC, Charoenvit Y, Sedegah M, Epstein JE, et al. Safety, tolerability and humoral immune responses after intramuscular administration of
121
a malaria DNA vaccine to healthy adult volunteers. Vaccine 2000 Mar 17;18(18):1893-1901.
(62) Martin JE, Sullivan NJ, Enama ME, Gordon IJ, Roederer M, Koup RA, et al. A DNA vaccine for Ebola virus is safe and immunogenic in a phase I clinical trial. Clin Vaccine Immunol 2006 Nov;13(11):1267-1277.
(63) Ferraro B, Morrow MP, Hutnick NA, Shin TH, Lucke CE, Weiner DB. Clinical applications of DNA vaccines: current progress. Clin Infect Dis 2011 Aug 1;53(3):296-302.
(64) Chen ZY, He CY, Meuse L, Kay MA. Silencing of episomal transgene expression by plasmid bacterial DNA elements in vivo. Gene Ther 2004 May;11(10):856-864.
(65) Chen ZY, He CY, Ehrhardt A, Kay MA. Minicircle DNA vectors devoid of bacterial DNA result in persistent and high-level transgene expression in vivo. Mol Ther 2003 Sep;8(3):495-500.
(66) Molnar MJ, Gilbert R, Lu Y, Liu AB, Guo A, Larochelle N, et al. Factors influencing the efficacy, longevity, and safety of electroporation-assisted plasmid-based gene transfer into mouse muscles. Mol Ther 2004 Sep;10(3):447-455.
(67) Gracey Maniar LE, Maniar JM, Chen ZY, Lu J, Fire AZ, Kay MA. Minicircle DNA vectors achieve sustained expression reflected by active chromatin and transcriptional level. Mol Ther 2013 Jan;21(1):131-138.
(68) Riu E, Chen ZY, Xu H, He CY, Kay MA. Histone modifications are associated with the persistence or silencing of vector-mediated transgene expression in vivo. Mol Ther 2007 Jul;15(7):1348-1355.
(69) Chen ZY, Riu E, He CY, Xu H, Kay MA. Silencing of episomal transgene expression in liver by plasmid bacterial backbone DNA is independent of CpG methylation. Mol Ther 2008 Mar;16(3):548-556.
(70) Lu J, Zhang F, Xu S, Fire AZ, Kay MA. The extragenic spacer length between the 5' and 3' ends of the transgene expression cassette affects transgene silencing from plasmid-based vectors. Molecular Therapy 2013;20(11):2111-2119.
(71) Kay MA, He CY, Chen ZY. A robust system for production of minicircle DNA vectors. Nat Biotechnol 2010 Dec;28(12):1287-1289.
(72) Osborn MJ, McElmurry RT, Lees CJ, DeFeo AP, Chen ZY, Kay MA, et al. Minicircle DNA-based gene therapy coupled with immune modulation permits long-term expression of alpha-L-iduronidase in mice with mucopolysaccharidosis type I. Mol Ther 2011 Mar;19(3):450-460.

122
(73) Alam T, Wai P, Held D, Vakili ST, Forsberg E, Sollinger H. Correction of Diabetic Hyperglycemia and Amelioration of Metabolic Anomalies by Minicircle DNA Mediated Glucose-Dependent Hepatic Insulin Production. PLoS One 2013 Jun 27;8(6):e67515.
(74) Huang M, Nguyen P, Jia F, Hu S, Gong Y, de Almeida PE, et al. Double knockdown of prolyl hydroxylase and factor-inhibiting hypoxia-inducible factor with nonviral minicircle gene therapy enhances stem cell mobilization and angiogenesis after myocardial infarction. Circulation 2011 Sep 13;124(11 Suppl):S46-54.
(75) Narsinh KH, Jia F, Robbins RC, Kay MA, Longaker MT, Wu JC. Generation of adult human induced pluripotent stem cells using nonviral minicircle DNA vectors. Nat Protoc 2011 Jan;6(1):78-88.
(76) Nchinda G, Kuroiwa J, Oks M, Trumpfheller C, Park CG, Huang Y, et al. The efficacy of DNA vaccination is enhanced in mice by targeting the encoded protein to dendritic cells. J Clin Invest 2008;118(4):1427 <last_page> 1436.
(77) Tacken PJ, de Vries IJ, Torensma R, Figdor CG. Dendritic-cell immunotherapy: from ex vivo loading to in vivo targeting. Nat Rev Immunol 2007 Oct;7(10):790-802.
(78) Grosso JF, Jure-Kunkel MN. CTLA-4 blockade in tumor models: an overview of preclinical and translational research. Cancer Immun 2013;13:5.
(79) Duraiswamy J, Kaluza KM, Freeman GJ, Coukos G. Dual blockade of PD-1 and CTLA-4 combined with tumor vaccine effectively restores T-cell rejection function in tumors. Cancer Res 2013 Jun 15;73(12):3591-3603.
(80) Hurwitz AA, Foster BA, Kwon ED, Truong T, Choi EM, Greenberg NM, et al. Combination immunotherapy of primary prostate cancer in a transgenic mouse model using CTLA-4 blockade. Cancer Res 2000 May 1;60(9):2444-2448.
(81) Chang KC, Burnham CA, Compton SM, Rasche DP, Mazuski R, Smcdonough J, et al. Blockade ofthe negative co-stimulatory molecules PD-1 and CTLA-4 improves survival in primary and secondary fungal sepsis. Crit Care 2013 May 11;17(3):R85.
(82) Fuller MJ, Callendret B, Zhu B, Freeman GJ, Hasselschwert DL, Satterfield W, et al. Immunotherapy of chronic hepatitis C virus infection with antibodies against programmed cell death-1 (PD-1). Proc Natl Acad Sci U S A 2013 Aug 26.
(83) Riley JL. PD-1 signaling in primary T cells. Immunol Rev 2009 May;229(1):114-125.
(84) Rudd CE, Taylor A, Schneider H. CD28 and CTLA-4 coreceptor expression and signal transduction. Immunol Rev 2009 May;229(1):12-26.

123
(85) Hess PR, Barnes C, Woolard MD, Johnson MD, Cullen JM, Collins EJ, et al. Selective deletion of antigen-specific CD8+ T cells by MHC class I tetramers coupled to the type I ribosome-inactivating protein saporin. Blood 2007 Apr 15;109(8):3300-3307.
(86) Altman JD, Moss PAH, Goulder PJR, Barouch DH, McHeyzer-Williams MG, Bell JI, et al. Phenotypic Analysis of Antigen-Specific T Lymphocytes. Science 1996;274(5284):94-96.
(87) Penaloza-MacMaster P, Masopust D, Ahmed R. T-cell reconstitution without T-cell immunopathology in two models of T-cell-mediated tissue destruction. Immunology 2009 Oct;128(2):164-171.
(88) Vincent BG, Young EF, Buntzman AS, Stevens R, Kepler TB, Tisch RM, et al. Toxin-coupled MHC class I tetramers can specifically ablate autoreactive CD8+ T cells and delay diabetes in nonobese diabetic mice. J Immunol 2010 Apr 15;184(8):4196-4204.
(89) Leonard JP, Sherman ML, Fisher GL, Buchanan LJ, Larsen G, Atkins MB, et al. Effects of single-dose interleukin-12 exposure on interleukin-12-associated toxicity and interferon-gamma production. Blood 1997 Oct 1;90(7):2541-2548.
(90) Car BD, Eng VM, Lipman JM, Anderson TD. The toxicology of interleukin-12: a review. Toxicol Pathol 1999 Jan-Feb;27(1):58-63.
(91) Riu E, Grimm D, Huang Z, Kay MA. Increased maintenance and persistence of transgenes by excision of expression cassettes from plasmid sequences in vivo. Hum Gene Ther 2005 May;16(5):558-570.
(92) Darquet AM, Cameron B, Wils P, Scherman D, Crouzet J. A new DNA vehicle for nonviral gene delivery: supercoiled minicircle. Gene Ther 1997 Dec;4(12):1341-1349.
(93) Chen ZY. Improved production and purification of minicircle DNA vector free of plasmid bacterial sequences and capable of persistent transgene expression in vivo. Hum Gene Ther 2005;16(1):126.
(94) Nestle FO, Di Meglio P, Qin JZ, Nickoloff BJ. Skin immune sentinels in health and disease. Nat Rev Immunol 2009 Oct;9(10):679-691.
(95) Romani N, Clausen BE, Stoitzner P. Langerhans cells and more: langerin-expressing dendritic cell subsets in the skin. Immunol Rev 2010 Mar;234(1):120-141.
(96) de Koning HD, Rodijk-Olthuis D, van Vlijmen-Willems IM, Joosten LA, Netea MG, Schalkwijk J, et al. A comprehensive analysis of pattern recognition receptors in normal and inflamed human epidermis: upregulation of dectin-1 in psoriasis. J Invest Dermatol 2010 Nov;130(11):2611-2620.

124
(97) Barry MA, Johnston SA. Biological features of genetic immunization. Vaccine 1997 Jun;15(8):788-791.
(98) Kang MJ, Kim CK, Kim MY, Hwang TS, Kang SY, Kim WK, et al. Skin permeation, biodistribution, and expression of topically applied plasmid DNA. J Gene Med 2004 Nov;6(11):1238-1246.
(99) Meykadeh N, Mirmohammadsadegh A, Wang Z, Basner-Tschakarjan E, Hengge UR. Topical application of plasmid DNA to mouse and human skin. J Mol Med (Berl) 2005 Nov;83(11):897-903.
(100) Gothelf A, Eriksen J, Hojman P, Gehl J. Duration and level of transgene expression after gene electrotransfer to skin in mice. Gene Ther 2010 Jul;17(7):839-845.
(101) van den Berg JH, Nujien B, Beijnen JH, Vincent A, van Tinteren H, Kluge J, et al. Optimization of intradermal vaccination by DNA tattooing in human skin. Hum Gene Ther 2009 Mar;20(3):181-189.
(102) Rabinovich BA, Ye Y, Etto T, Chen JQ, Levitsky HI, Overwijk WW, et al. Visualizing fewer than 10 mouse T cells with an enhanced firefly luciferase in immunocompetent mouse models of cancer. Proc Natl Acad Sci U S A 2008 Sep 23;105(38):14342-14346.
(103) Hogquist KA, Jameson SC, Heath WR, Howard JL, Bevan MJ, Carbone FR. T cell receptor antagonist peptides induce positive selection. Cell 1994 Jan 14;76(1):17-27.
(104) Kearney ER, Pape KA, Loh DY, Jenkins MK. Visualization of peptide-specific T cell immunity and peripheral tolerance induction in vivo. Immunity 1994 Jul;1(4):327-339.
(105) Schorpp M, Jager R, Schellander K, Schenkel J, Wagner EF, Weiher H, et al. The human ubiquitin C promoter directs high ubiquitous expression of transgenes in mice. Nucleic Acids Res 1996 May 1;24(9):1787-1788.
(106) Bellaiche Y, Mogila V, Perrimon N. I-SceI endonuclease, a new tool for studying DNA double-strand break repair mechanisms in Drosophila. Genetics 1999 Jul;152(3):1037-1044.
(107) Porgador A, Yewdell JW, Deng Y, Bennink JR, Germain RN. Localization, quantitation, and in situ detection of specific peptide-MHC class I complexes using a monoclonal antibody. Immunity 1997 Jun;6(6):715-726.
(108) Ingulli E. Tracing tolerance and immunity in vivo by CFSE-labeling of administered cells. Methods Mol Biol 2007;380:365-376.
125
(109) Caskey M, Lefebvre F, Filali-Mouhim A, Cameron MJ, Goulet JP, Haddad EK, et al. Synthetic double-stranded RNA induces innate immune responses similar to a live viral vaccine in humans. J Exp Med 2011 Nov 21;208(12):2357-2366.
(110) Dudani R, Chapdelaine Y, Faassen Hv H, Smith DK, Shen H, Krishnan L, et al. Multiple mechanisms compensate to enhance tumor-protective CD8(+) T cell response in the long-term despite poor CD8(+) T cell priming initially: comparison between an acute versus a chronic intracellular bacterium expressing a model antigen. J Immunol 2002 Jun 1;168(11):5737-5745.
(111) Paul ML, Dwyer DE, Chow C, Robson J, Chambers I, Eagles G, et al. Listeriosis--a review of eighty-four cases. Med J Aust 1994 Apr 18;160(8):489-493.
(112) Kagi D, Ledermann B, Burki K, Hengartner H, Zinkernagel RM. CD8+ T cell-mediated protection against an intracellular bacterium by perforin-dependent cytotoxicity. Eur J Immunol 1994 Dec;24(12):3068-3072.
(113) Chirigos MA, Schlick E, Ruffmann R, Budzynski W, Sinibaldi P, Gruys E. Pharmacokinetic and therapeutic activity of polyinosinic-polycytidylic acid stabilized with poly-L-lysine in carboxymethylcellulose [poly(I,C)-LC]. Journal Biological Response Modifiers 1985;4(6):621-627.
(114) Stenler S, Andersson A, Simonson OE, Lundin KE, Chen ZY, Kay MA, et al. Gene transfer to mouse heart and skeletal muscles using a minicircle expressing human vascular endothelial growth factor. J Cardiovasc Pharmacol 2009 Jan;53(1):18-23.
(115) Zhang X, Epperly MW, Kay MA, Chen ZY, Dixon T, Franicola D, et al. Radioprotection in vitro and in vivo by minicircle plasmid carrying the human manganese superoxide dismutase transgene. Hum Gene Ther 2008 Aug;19(8):820-826.
(116) Darquet AM, Rangara R, Kreiss P, Schwartz B, Naimi S, Delaere P, et al. Minicircle: an improved DNA molecule for in vitro and in vivo gene transfer. Gene Ther 1999 Feb;6(2):209-218.
(117) Bedoui S, Davey GM, Lew AM, Heath WR. Equivalent stimulation of naive and memory CD8 T cells by DNA vaccination: a dendritic cell-dependent process. Immunol Cell Biol 2009 Mar-Apr;87(3):255-259.
(118) Hsieh EA, Chai CM, de Lumen BO, Neese RA, Hellerstein MK. Dynamics of keratinocytes in vivo using HO labeling: a sensitive marker of epidermal proliferation state. J Invest Dermatol 2004 Sep;123(3):530-536.
(119) Biernaskie J, Paris M, Morozova O, Fagan BM, Marra M, Pevny L, et al. SKPs derive from hair follicle precursors and exhibit properties of adult dermal stem cells. Cell Stem Cell 2009 Dec 4;5(6):610-623.

126
(120) Bins AD, Wolkers MC, van den Boom MD, Haanen JB, Schumacher TN. In vivo antigen stability affects DNA vaccine immunogenicity. J Immunol 2007 Aug 15;179(4):2126-2133.
(121) Hovav AH, Panas MW, Rahman S, Sircar P, Gillard G, Cayabyab MJ, et al. Duration of antigen expression in vivo following DNA immunization modifies the magnitude, contraction, and secondary responses of CD8+ T lymphocytes. J Immunol 2007 Nov 15;179(10):6725-6733.
(122) Gibson DG, Young L, Chuang RY, Venter JC, Hutchison CA,3rd, Smith HO. Enzymatic assembly of DNA molecules up to several hundred kilobases. Nat Methods 2009 May;6(5):343-345.
(123) Morrow MP, Weiner DB. DNA drugs come of age. Sci Am 2010 Jul;303(1):48-53.
(124) Shin H, Wherry EJ. CD8 T cell dysfunction during chronic viral infection. Curr Opin Immunol 2007 Aug;19(4):408-415.
(125) Ahmed R, Salmi A, Butler LD, Chiller JM, Oldstone MB. Selection of genetic variants of lymphocytic choriomeningitis virus in spleens of persistently infected mice. Role in suppression of cytotoxic T lymphocyte response and viral persistence. J Exp Med 1984 Aug 1;160(2):521-540.
(126) Wherry EJ, Blattman JN, Murali-Krishna K, van der Most R, Ahmed R. Viral persistence alters CD8 T-cell immunodominance and tissue distribution and results in distinct stages of functional impairment. J Virol 2003 Apr;77(8):4911-4927.
(127) Fuller MJ, Zajac AJ. Ablation of CD8 and CD4 T cell responses by high viral loads. J Immunol 2003 Jan 1;170(1):477-486.
(128) Moskophidis D, Lechner F, Pircher H, Zinkernagel RM. Virus persistence in acutely infected immunocompetent mice by exhaustion of antiviral cytotoxic effector T cells. Nature 1993 Apr 22;362(6422):758-761.
(129) Wherry EJ, Ha SJ, Kaech SM, Haining WN, Sarkar S, Kalia V, et al. Molecular signature of CD8+ T cell exhaustion during chronic viral infection. Immunity 2007 Oct;27(4):670-684.
(130) Badovinac VP, Porter BB, Harty JT. Programmed contraction of CD8(+) T cells after infection. Nat Immunol 2002 Jul;3(7):619-626.
(131) Radcliffe JN, Roddick JS, Stevenson FK, Thirdborough SM. Prolonged antigen expression following DNA vaccination impairs effector CD8+ T cell function and memory development. J Immunol 2007 Dec 15;179(12):8313-8321.

127
(132) Szymczak-Workman AL, Vignali KM, Vignali DA. Design and construction of 2A peptide-linked multicistronic vectors. Cold Spring Harb Protoc 2012 Feb 1;2012(2):199-204.
(133) Wick DA, Martin SD, Nelson BH, Webb JR. Profound CD8+ T cell immunity elicited by sequential daily immunization with exogenous antigen plus the TLR3 agonist poly(I:C). Vaccine 2011 Jan 29;29(5):984-993.
(134) Dietz WM, Skinner NEB, Hamilton SE, Jund MD, Heitfeld SM, Litterman AJ, et al. Minicircle DNA is Superior to Plasmid DNA in Eliciting Antigen-specific CD8+ T-cell Responses. Molecular Therapy 2013 05-21.
(135) Agata Y, Kawasaki A, Nishimura H, Ishida Y, Tsubata T, Yagita H, et al. Expression of the PD-1 antigen on the surface of stimulated mouse T and B lymphocytes. Int Immunol 1996 May;8(5):765-772.
(136) Freeman GJ, Long AJ, Iwai Y, Bourque K, Chernova T, Nishimura H, et al. Engagement of the PD-1 immunoinhibitory receptor by a novel B7 family member leads to negative regulation of lymphocyte activation. J Exp Med 2000 Oct 2;192(7):1027-1034.
(137) de Mare-Bredemeijer EL, Metselaar HJ. Optimization of the use of Calcineurin inhibitors in liver transplantation. Best Pract Res Clin Gastroenterol 2012;26(1):85-95.
(138) Liao W, Lin JX, Leonard WJ. Interleukin-2 at the crossroads of effector responses, tolerance, and immunotherapy. Immunity 2013 Jan 24;38(1):13-25.
(139) Curtis JJ. Hypertensinogenic mechanism of the calcineurin inhibitors. Curr Hypertens Rep 2002;4(5):377-380.
(140) Groth CG, Backman L, Morales JM, Calne R, Kreis H, Lang P, et al. Sirolimus (rapamycin)-based therapy in human renal transplantation: similar efficacy and different toxicity compared with cyclosporine. Sirolimus European Renal Transplant Study Group. Transplantation 1999 Apr 15;67(7):1036-1042.
(141) Margreiter R. Efficacy and safety of tacrolimus compared with ciclosporin microemulsion in renal transplantation: a randomised multicentre study. The Lancet 2002;359(9308):741-746.
(142) Nankivell BJ, Borrows RJ, Fung CL, O'Connell PJ, Chapman JR, Allen RD. Calcineurin inhibitor nephrotoxicity: longitudinal assessment by protocol histology. Transplantation 2004 Aug 27;78(4):557-565.
(143) Singh N. Infectious complications in organ transplant recipients with the use of calcineurin-inhibitor agent-based immunosuppressive regimens. Current Opinion in Infectious Diseases 2005;18(4):342-345.

128
(144) Maluccio M, Sharma V, Lagman M, Vyas S, Yang H, Li B, et al. Tacrolimus enhances transforming growth factor-beta1 expression and promotes tumor progression. Transplantation 2003 Aug 15;76(3):597-602.
(145) Siegel JP, Puri RK. Interleukin-2 toxicity. J Clin Oncol 1991 Apr;9(4):694-704.
(146) Thijs LG, Hack CE, Strack van Schijndel RJ, Nuijens JH, Wolbink GJ, Eerenberg-Belmer AJ, et al. Activation of the complement system during immunotherapy with recombinant IL-2. Relation to the development of side effects. J Immunol 1990 Mar 15;144(6):2419-2424.
(147) Thompson LD, Weber PC. Construction and expression of a synthetic streptavidin-encoding gene in Escherichia coli. Gene 1993 Dec 22;136(1-2):243-246.
(148) Albarran B, To R, Stayton PS. A TAT-streptavidin fusion protein directs uptake of biotinylated cargo into mammalian cells. Protein Eng Des Sel 2005 Mar;18(3):147-152.
(149) Lindsay MA. Peptide-mediated cell delivery: application in protein target validation. Curr Opin Pharmacol 2002 Oct;2(5):587-594.
(150) Ignatovich IA, Dizhe EB, Pavlotskaya AV, Akifiev BN, Burov SV, Orlov SV, et al. Complexes of plasmid DNA with basic domain 47-57 of the HIV-1 Tat protein are transferred to mammalian cells by endocytosis-mediated pathways. J Biol Chem 2003 Oct 24;278(43):42625-42636.
(151) Sandgren S, Cheng F, Belting M. Nuclear targeting of macromolecular polyanions by an HIV-Tat derived peptide. Role for cell-surface proteoglycans. J Biol Chem 2002 Oct 11;277(41):38877-38883.
(152) Fawell S, Seery J, Daikh Y, Moore C, Chen LL, Pepinsky B, et al. Tat-mediated delivery of heterologous proteins into cells. Proc Natl Acad Sci U S A 1994 Jan 18;91(2):664-668.
(153) Crawford F. Detection of antigen-specific T cells with multivalent soluble class II MHC covalent peptide complexes. Immunity 1998;8(6):675.
(154) Yuan RR, Wong P, McDevitt MR, Doubrovina E, Leiner I, Bornmann W, et al. Targeted deletion of T-cell clones using alpha-emitting suicide MHC tetramers. Blood 2004 Oct 15;104(8):2397-2402.
(155) Pauza ME, Doumbia SO, Pennell CA. Construction and characterization of human CD7-specific single-chain Fv immunotoxins. J Immunol 1997 Apr 1;158(7):3259-3269.
(156) Stillwell R, Bierer BE. T cell signal transduction and the role of CD7 in costimulation. Immunol Res 2001;24(1):31-52.

129
(157) Chilkoti A, Tan PH, Stayton PS. Site-directed mutagenesis studies of the high-affinity streptavidin-biotin complex: contributions of tryptophan residues 79, 108, and 120. Proc Natl Acad Sci U S A 1995 Feb 28;92(5):1754-1758.
(158) Dash PR, Toncheva V, Schacht E, Seymour LW. Synthetic polymers for vectorial delivery of DNA: characterisation of polymer-DNA complexes by photon correlation spectroscopy and stability to nuclease degradation and disruption by polyanions in vitro. J Controlled Release 1997;48(2-3):269-276.
(159) Kada G, Kaiser K, Falk H, Gruber HJ. Rapid estimation of avidin and streptavidin by fluorescence quenching or fluorescence polarization. Biochim Biophys Acta 1999 Mar 14;1427(1):44-48.
(160) McSorley SJ, Cookson BT, Jenkins MK. Characterization of CD4+ T cell responses during natural infection with Salmonella typhimurium. J Immunol 2000 Jan 15;164(2):986-993.
(161) Rinne J, Albarran B, Jylhava J, Ihalainen TO, Kankaanpaa P, Hytonen VP, et al. Internalization of novel non-viral vector TAT-streptavidin into human cells. BMC Biotechnol 2007 Jan 2;7:1.
(162) Cho YW, Kim JD, Park K. Polycation gene delivery systems: escape from endosomes to cytosol. J Pharm Pharmacol 2003 Jun;55(6):721-734.
(163) Wadia JS. Transducible TAT-HA fusogenic peptide enhances escape of TAT-fusion proteins after lipid raft macropinocytosis. Nat Med 2004;10(3):310.
(164) Zanta MA, Belguise-Valladier P, Behr JP. Gene delivery: a single nuclear localization signal peptide is sufficient to carry DNA to the cell nucleus. Proc Natl Acad Sci U S A 1999 Jan 5;96(1):91-96.
(165) Gallizia A, de Lalla C, Nardone E, Santambrogio P, Brandazza A, Sidoli A, et al. Production of a soluble and functional recombinant streptavidin in Escherichia coli. Protein Expr Purif 1998 Nov;14(2):192-196.

130
Appendix: Permissions [email protected] <[email protected]> Mon, Aug 19, 2013 at 4:52 AM To: Nicole Skinner <[email protected]>
Dear Nicole,
Thank you for contacting Nature Publishing Group. As an author, you have the right to use this manuscript and figures, as per the licence-‐to-‐publish you signed:
Ownership of copyright in the article remains with the Authors, and provided that, when reproducing the Contribution or extracts from it, the Authors acknowledge first and reference publication in the Journal, the Authors retain the following non-‐exclusive rights:
a) To reproduce the Contribution in whole or in part in any printed volume (book or thesis) of which they are the author(s).
b) They and any academic institution where they work at the time may reproduce the Contribution for the purpose of course teaching.
c) To post a copy of the Contribution as accepted for publication after peer review (in Word or Tex format) on the Authors’ own web site or institutional repository, or the Authors’ funding body’s designated archive, six months after publication of the printed or online edition of the Journal, provided that they also give a hyperlink from the Contribution to the Journals web site.
d) To reuse figures or tables created by them and contained in the Contribution in other works created by them.
Kind Regards,
Claire Smith
Permissions Assistant
nature publishing group The Macmillan Building 4 Crinan Street London N1 9XW e: [email protected]
p: + 44 207 014 4129