strategies, marketing and social research\! final reports 2006\!6584 kab - national litter...
TRANSCRIPT

Strategies, Marketing and Social Research
Head Office: 259 Glen Osmond Rd, Frewville SA 5063 Tel: 08 8433 0200 Fax: 08 8338 2360
[email protected] www.mcgregor.com.au
Queensland Principal Supporter: Australian Government
Supporters: Governments of NT, QLD, SA, TAS, VIC, WA
On behalf of: KABNA
Based on field surveys conducted in November 2006 Project No: 6584
Date: December 2006
T:\! FINAL REPORTS 2006\!6584 KAB - National Litter Count\Wave 3 - November 2006\6584 - KAB National Litter Count - Report - QLD - Wave 3.doc
CONTENTS Section 1 Introduction ........................................................................................ 1
Residential.............................................................................................................4 Beach ....................................................................................................................4 Industrial ................................................................................................................4 Car Park ................................................................................................................5 Shopping Centre ...................................................................................................5 Retail Strip/ Shops - Street Precinct .....................................................................5 Recreational Park..................................................................................................5 Highway.................................................................................................................5
Section 2 National Trends .................................................................................. 9
2.1 At A Glance...............................................................................................10
2.2 Total Litter Items .......................................................................................14 Number of Items..................................................................................................14 Volume ................................................................................................................19 Top Dozen...........................................................................................................25
2.3 Cigarette Butts ..........................................................................................27
2.4 Light Weight Plastic Shopping Type Carry Bags .......................................31
2.5 Dispersion of Litter Across Site Types.......................................................33 Key Identifiable Items..........................................................................................38
2.6 The Dirty Dozen ........................................................................................39
Section 3 State Summary ................................................................................. 40
3.1 At A Glance...............................................................................................41
3.2 Total Litter Items .......................................................................................45 Number of Items..................................................................................................45 Volume ................................................................................................................47
3.3 Cigarette butts...........................................................................................50 Number of items..................................................................................................50 Volume ................................................................................................................52
3.4 Plastic Litter ..............................................................................................53 Number of items..................................................................................................53 Volume ................................................................................................................53
3.5 Paper/paperboard Litter ............................................................................55 Number of items..................................................................................................55 Volume ................................................................................................................55
3.6 Metal Litter ................................................................................................57 Number of items..................................................................................................57 Volume ................................................................................................................57
T:\! FINAL REPORTS 2006\!6584 KAB - National Litter Count\Wave 3 - November 2006\6584 - KAB National Litter Count - Report - QLD - Wave 3.doc
3.7 Miscellaneous ...........................................................................................59 Number of items..................................................................................................59 Volume ................................................................................................................59
3.8 Glass Items...............................................................................................60 Number of items..................................................................................................60 Volume ................................................................................................................60
3.9 Dispersion of Litter Across Site Types.......................................................61 Number of items..................................................................................................61
3.10 Volumes....................................................................................................63 Drink Containers ...................................................................................................................65 Data Summary Number of Items ..........................................................................................68 Data Summary Volumes.......................................................................................................72 Appendix 1: Data Collection Form ........................................................................................76 For enquiries on this report please contact Zing Hai Tan, Peter Hine or Benjamin Selby.
- 1 -
Section 1 Introduction
- 2 -
This document has been prepared by McGregor Tan Research to report on the results of the
National Litter Index project and in particular Queensland results.
Background
1.1 The National Litter count was conducted in NSW, QLD, SA, TAS, VIC & WA
in November 2005 and the second Monitor was conducted in May 2006.
Litter counts were conducted at 76 sites within TAS and across 151 sites
within each of the other states.
1.2 The third wave has now been conducted during November 2006.
1.3 Wave 3 incorporated litter counts for ACT and NT at the same level as TAS
(76 sites are surveyed within each state).
1.4 Regular monitoring of the litter stream will establish a succinct picture of its
component parts – i.e. the various kinds of litter and its distribution across
different area types.
1.5 All litter items counted were detailed in 6 material type categories, those
being:
• Glass
• Metal
• Plastic
• Paper / paperboard
• Miscellaneous
• Cigarette butts
1.6 The litter was further analysed by 8 different site types. In total 151sites
were selected from each state across a variety of areas conforming to
similar guidelines across all states.

- 3 -
1.7 Tasmania, The Australian Capital Territory and The Northern Territory were
each surveyed at only 76 sites. Item counts and volume result for these
states have been multiplied by a scaling factor of 1.987 to facilitate inter-
state comparisons on commensurable figures.
1.8 The following table outlines the number of metropolitan and regional sites
sampled from ACT/ NT/ TAS compared with those sampled from other
states.
Count Site Type - Other States Compared to ACT/ NT/ TAS
Other States ACT/ NT/ TAS Metro Regional Total Metro Regional Total
Residential 21 5 26 11 2 13 Beach 10 6 16 5 3 8 Industrial 13 4 17 7 2 9 Car Park 19 4 23 9 2 11 Shopping Centre 12 2 14 6 1 7 Retail 10 5 15 5 3 8 Recreational Park 7 6 13 4 3 7 Highway 17 10 27 8 5 13 Total 109 42 151 55 21 76
Proportion of Site Types
Industrial11%
Shopping Centre9%
Retail10%
Recreational Park9%
Beach11%
Residential17%
Highw ay18%
Car Park15%

- 4 -
The Litter Monitoring Approach and Definitions
1.9 The following outlines the guidelines, protocols of the dimensions of the site
types.
1.10 Different site types will have different area coverage, generally conforming
to the following guidelines. Note: the application of these guidelines allows
flexibility to accommodate the topographical and geographical nature of the
relevant area being scoped. The critical issue is that the site area must be
clear and identifiable so that the area counted is consistent over time.
1.11 Note: the National Litter Index compares between representative sites in
each state rather than the full area or population of the state.
Residential
1.12 A street area approximately 150 metres in length, along both sides of the
road from the front of the properties on each side of that road extending to
the gutter including litter in the gutter.
Beach
1.13 An area of approximately 50 metres long and 10 metres wide, positioned on
one or across both sides of a jetty, boat ramp or main entry access point to
beach.
Industrial
1.14 A street area approximately 150 metres long within an industrial area, the
count area to be from the fence line or immediate front of the properties to
the gutter but not including litter in the gutter

- 5 -
Car Park
1.15 An area of approximately 30 by 50 metres in an open space public car park
at a point distant from the entrance to the car park.
Shopping Centre
1.16 An area approximately 50 metres long and 25 metres wide, directly outside
of the main shopping centre building and including one or across both sides
of a major entrance.
Retail Strip/ Shops - Street Precinct
1.17 An area approximately 150 metres long in front of a strip of shops,
extending from the front of the shops to the street gutter but not including
litter in the gutter.
Recreational Park
1.18 An area of approximately 40 by 50 metres in a park area which includes a
playground but which is not in the immediate vicinity of a shop or kiosk. The
areas should be within a frequently used park.
Highway
1.19 The count area commences from the region beginning at the edge of the
road, and extending out from the road to the nearest fence/ boundary or up
to a distance of 10 meters out from the road side if no such fence/ boundary
exists. Two such regions should be collected from, one on each side of the
road. Each region should extend for a length of approximately 200 meters
along the road.

- 6 -
Litter Categorisation
1.20 The following outlines the litter categorisations and assumptions used to
audit the designated sites.
A standard data collection form, was used when conducting the litter
counts. A copy of this form is provided in Appendix 1.
Litter items counted are described as specifically as possible including
brand names where visible. Litter by brand required additional
analysis and will be reported on at a later date
Auditors were trained to carefully analyse the litter to ensure that it is
properly identified before recording on the survey form. For example,
to determine whether an item is glass and not clear plastic, to
differentiate between fruit juice and fruit drink as these are recorded
on different sections of the form.
Other examples of how the count is conducted are - broken bottles
are counted as one bottle, a bag of dumped garbage is considered to
be one item of “illegal dumping” and scattered newspaper pages are
counted as one newspaper. While individual cigarette butts are
counted, where there are large volumes of cigarette butts an
estimated count is acceptable.
For the purpose of the Litter Count, all waste located within any count
site is litter apart from that properly disposed of in a waste receptacle.
Food is not considered to be litter.
Seasonal Fluctuations
1.21 Reviewing the quarterly data in South Australia, from November 1998
through to current, displays some seasonal factors impact on the level of
litter. It appears that May is in general the highest quarter, the drop
occurring from May to August, and incremental increases to November,
February and with the peak in May. This open up several hypotheses to
factors effecting littering levels.
- 7 -
Volumes
1.22 As part of the exercise an estimate of the volume of the litter counted in the
National Index has been made. We have been able to determine the
individual volumetric profile of specific item types through extensive
empirical and iterative observations and measurement of historical litter data
in SA. In order to reflect a more realistic scenario, the final volumetric
profiles formulated for each litter category item, took into account that a
certain proportion of items found would be crushed and weathered.
1.23 These profiles have then been extrapolated to calculate estimated volumes
of the national data based on the numbers of litter items per category. It
should be noted that the volumes are estimates only.
Methodology
1.24 On the 15th of November 2006, across South Australia, New South Wales,
Victoria, Western Australia, Tasmania and Queensland, McGregor Tan staff
counted litter in the same 151 (Tasmania 76) respective sites in each state
which had been counted in previous counts. Further The Northern Territory
and The Australian Capital Territory have been included for the first time,
with 76 sites in each Territory scoped prior to the count in November 2006
to fit the national site guidelines.
1.25 Many of the Auditors that completed the first count were involved in
subsequent counts. The Auditors were all trained in the correct counting
procedure before each litter count and were provided with a detailed site
description for each site type. Each site description contains the following
information:
• Location
• Classification
• Site Code
• Description and Features comprising text (describing visible features
for easy identification), photos and maps

- 8 -
• Litter Count Procedure (describing area for counting)
Note: the National Litter Index compares between representative sites in
each state rather than the full area or population of the state.
1.26 Auditors then used the comprehensive litter count forms to record the litter
found in the site area, in the appropriate category.
1.27 To enable meaningful comparisons with the other states in the national
trends section of the report, Tasmania, The Northern Territory and The
Australian Capital Territory, the 76 sites counted in each of these states and
territories have been re-weighted to an equivalence of 151 sites.

- 9 -
Section 2 National Trends

- 10 -
The following Executive Summary covers the findings of the Wave 3 litter count, as an overall
summary.
2.1 At A Glance
In general, there was a decrease in the level of litter items found in sites
around Australia. The decrease is reflected across the board but is
particularly pronounced in the cigarette butts material category. The ‘dirty
dozen’, represents 78% of the litter stream (down from 80% in Wave 2).
Over the two Waves, lollipop sticks and shopper dockets and related
shopping paper have gone out of the top dozen, being replaced by other
glass, and beer aluminium, all types all sizes.
Nationally, November litter is down 14% from May. This is in line with
seasonal patterns - but is still higher than in November 2005.
Highways remain the most significant catchment area with 32% of the
number of items found and 49% of the volume of litter. Car parks and
industrial sites remain major litter catchment areas.
In the current Wave, despite the decrease in the number of items, the
average estimated volume increased, totalling 2.126 cubic metres, up from
1.997 cubic metres in Wave 2. Illegal dumping remains the top item
contributing 31% to the total Wave 3 average volume of litter encountered
across all states and territories (the Wave 3 average totalling 0.653 cubic
metres up from the Wave 2 average of 0.428 cubic metres). Miscellaneous
33% (includes illegal dumping), plastic 31%, and paper 18%, litter comprise
the majority of the volume of litter in Wave 3.
Volume of data is up by 7% reflecting an increase in illegal dumping.
The following table shows each items movement from Wave 1 to Wave 3.

- 11 -
Number of Items by Item Type
National Average Wave 3 Average Wave 2 Average Wave 1Change from Wave 2
Type Litter Category Wave 3 Novemer 2006 Wave 2 May 2006 Wave 1 November 2005GLASS Plain water (carbonated or non-carb.), 1 litre+ 2 4 6 -2GLASS Plain water (carbonated or non-carb.), <1 litre 5 4 6 1GLASS Flav. water/soft drink (carbonated) 1 litre+ 2 6 2 -4GLASS Flav. water/soft drink (carbonated) <1 litre 15 20 17 -4GLASS Flav.wtr/fruit j. dr/sprts dr, (non-carb), 1 litre+ 3 5 2 -1GLASS Flav.wtr/fruit j. dr/sprts dr, (non-carb), <1 litre 8 14 10 -6GLASS Fruit juice, 1 litre or more 1 1 1 -1GLASS Fruit juice, < 1 litre 4 8 6 -3GLASS Wine cooler, all sizes 3 1 1 2GLASS Alcoholic sodas / spirit-based mixers, all sizes 20 16 25 4GLASS Cider/fruit based etc. 2 2 3 0GLASS Wine & spirit, all sizes 9 11 4 -2GLASS Beer, 750ml or more, all colours of glass 28 26 24 3GLASS Beer, < 750ml, all colours of glass 95 113 117 -18GLASS Other glass 263 169 65 94GLASS Total 461 398 291 63METAL Beer, aluminium, all types, all sizes 200 155 146 45METAL Alcoholic sodas & spirit-based mixers 95 77 66 18METAL Cider/fruit based etc. 6 2 1 4METAL Water, carbonated & flavoured/soft drink 152 119 130 33METAL Water, non-carbonated & flavoured, all sizes 3 4 3 0METAL Food cans (including pet food) 12 21 16 -9METAL Industrial cans - all types 4 3 5 0METAL Aerosols – pressure packs 5 10 7 -5METAL Metal bottle tops and can pull rings 479 529 344 -50METAL Metal pieces 134 115 113 19METAL Foil take away 40 79 70 -39METAL Other foil 246 210 184 36METAL Total 1376 1324 1084 51
- 12 -
National Average Wave 3 Average Wave 2 Average Wave 1Change from Wave 2
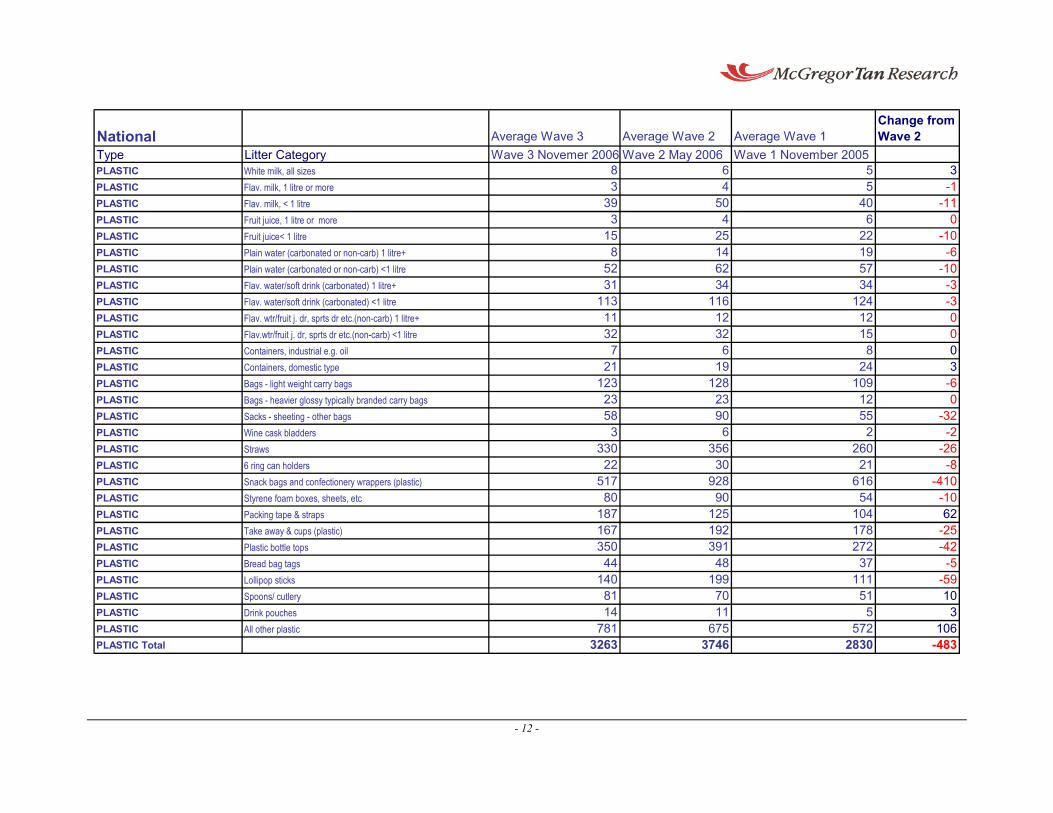
Type Litter Category Wave 3 Novemer 2006 Wave 2 May 2006 Wave 1 November 2005PLASTIC White milk, all sizes 8 6 5 3PLASTIC Flav. milk, 1 litre or more 3 4 5 -1PLASTIC Flav. milk, < 1 litre 39 50 40 -11PLASTIC Fruit juice, 1 litre or more 3 4 6 0PLASTIC Fruit juice< 1 litre 15 25 22 -10PLASTIC Plain water (carbonated or non-carb) 1 litre+ 8 14 19 -6PLASTIC Plain water (carbonated or non-carb) <1 litre 52 62 57 -10PLASTIC Flav. water/soft drink (carbonated) 1 litre+ 31 34 34 -3PLASTIC Flav. water/soft drink (carbonated) <1 litre 113 116 124 -3PLASTIC Flav. wtr/fruit j. dr, sprts dr etc.(non-carb) 1 litre+ 11 12 12 0PLASTIC Flav.wtr/fruit j. dr, sprts dr etc.(non-carb) <1 litre 32 32 15 0PLASTIC Containers, industrial e.g. oil 7 6 8 0PLASTIC Containers, domestic type 21 19 24 3PLASTIC Bags - light weight carry bags 123 128 109 -6PLASTIC Bags - heavier glossy typically branded carry bags 23 23 12 0PLASTIC Sacks - sheeting - other bags 58 90 55 -32PLASTIC Wine cask bladders 3 6 2 -2PLASTIC Straws 330 356 260 -26PLASTIC 6 ring can holders 22 30 21 -8PLASTIC Snack bags and confectionery wrappers (plastic) 517 928 616 -410PLASTIC Styrene foam boxes, sheets, etc 80 90 54 -10PLASTIC Packing tape & straps 187 125 104 62PLASTIC Take away & cups (plastic) 167 192 178 -25PLASTIC Plastic bottle tops 350 391 272 -42PLASTIC Bread bag tags 44 48 37 -5PLASTIC Lollipop sticks 140 199 111 -59PLASTIC Spoons/ cutlery 81 70 51 10PLASTIC Drink pouches 14 11 5 3PLASTIC All other plastic 781 675 572 106PLASTIC Total 3263 3746 2830 -483

- 13 -
National Average Wave 3 Average Wave 2 Average Wave 1Change from Wave 2
Type Litter Category Wave 3 Novemer 2006 Wave 2 May 2006 Wave 1 November 2005PAPER/PAPERBOARD Packages & boxes 121 122 127 -2PAPER/PAPERBOARD Cigarette packets 209 268 218 -59PAPER/PAPERBOARD Cartons, milk, plain (white) all sizes 9 8 5 1PAPER/PAPERBOARD Cartons, flavoured milk1 litre or more 3 5 8 -1PAPER/PAPERBOARD Cartons, flavoured milk< 1 litre 57 65 73 -8PAPER/PAPERBOARD Flav. water / fruit j. drink/ sports drink, (non-carb), 1 litre+ 2 4 2 -2PAPER/PAPERBOARD Flav. water/fruit j. drink/sports drink, non-carb, <1 litre 8 23 10 -15PAPER/PAPERBOARD Fruit juice, 1 litre or more 1 1 2 1PAPER/PAPERBOARD Cartons, fruit juice, < 1 litre 9 10 8 -1PAPER/PAPERBOARD Newspapers & magazines 75 81 75 -5PAPER/PAPERBOARD Junk mail / free circulars 123 107 91 16PAPER/PAPERBOARD Cups/take away containers (paper) 198 233 201 -35PAPER/PAPERBOARD Tickets, e.g. bus, ATM, vending machine etc. 137 185 142 -48PAPER/PAPERBOARD Ice cream wrappers 94 108 89 -13PAPER/PAPERBOARD Paper bags 121 148 111 -27PAPER/PAPERBOARD Shopper dockets & related shopping paper (eg, lists) 144 198 117 -54PAPER/PAPERBOARD Other paper (including tissues) 1327 1562 1200 -235PAPER/PAPERBOARD Total 2639 3126 2479 -487MISCELLANEOUS Tyres & pieces 60 41 41 19MISCELLANEOUS Clothing & materials 157 142 147 14MISCELLANEOUS Illegal dumping 27 18 17 9MISCELLANEOUS Syringes 6 1 0 5MISCELLANEOUS Ice cream sticks 94 97 76 -3MISCELLANEOUS Rubber pieces (not tyres) 110 103 87 7MISCELLANEOUS Condoms 3 3 2 0MISCELLANEOUS Construction materials 77 90 73 -13MISCELLANEOUS Disposable nappies 9 10 4 -1MISCELLANEOUS Other miscellaneous 96 132 103 -37MISCELLANEOUS Total 639 636 549 3CIGARETTE BUTTS Total Cigarette butts 7314 8965 6279 -1652
Grand Total 15691 18196 13512 -2505

- 14 -
2.2 Total Litter Items
Number of Items
Note: the National Litter Index compares between representative sites in
each state rather than the full area or population of the state.
In total, 105,484 litter items were counted in Wave 3 down from 109,175,
despite for the first time the Northern Territory and the Australian Capital
Territory also being included. The average per State was 15,691 (down from
18,196 in Wave 2). Cigarette butts accounted for almost half of the total
number of litter items with 48,698 counted (down from 53,791 in Wave 2),
an average of 7,314 per state (47%). Plastic was the next highest category
(21%, as in previous Waves) followed by paper/ paperboard (17%, as in
Wave 2).
Wave 3 Average Material Category of Items
Glass, 3% Metal, 9%
Plastic, 21%
Paper/ paperboard, 17%
Miscellaneous, 4%
Cigarette butts, 47%
The distribution of litter by material categories was relatively consistent, as
the graph overleaf outlines.

- 15 -
Average Distribution of Litter Items by Material Type
47% 21%
18%
17%
17%
8%
7%
9%
4%
3%
4%
2%
2%
3%
49%
46%
21%
21%
0% 10% 20% 30% 40% 50% 60% 70% 80% 90% 100%
Wave 1
Wave 2
Wave 3
Averages include weighted NT, ACT & TAS count
Cigarette butts Plastic Paper/ paperboards Metal Miscellaneous Glass
The graph below represents the proportion of items in each material type
across each state for Wave 3.
Total Average Number of Items by Material Type Wave 3
2%
6%
2%
3%
2%
2%
6%
2%
3%
7%
6%
12%
9%
8%
7%
11%
9%
9%
19%
19%
22%
22%
25%
25%
18%
18%
21%
18%
21%
13%
18%
18%
14%
19%
14%
17%
4%
4%
4%
5%
6%
4%
3%
3%
4% 47%
54%
44%
48%
42%
43%
47%
44%
50%
0% 10% 20% 30% 40% 50% 60% 70% 80% 90% 100%
WA
VIC
TAS
SA
QLD
NT
NSW
ACT
Average Wave 3
% of total litter items counted within each state
Glass Metal Plastic Paper/ paperboard Miscellaneous Cigarette butts

- 16 -
The number of litter items counted across each site is shown in the following
graph. As the graph shows, the average declined, and therefore only two
states recorded an increase, while two experiences significant reductions in
litter found at the states’ respective sites.
Victoria showed a slight increase in the number of items found at sites
within that state, whilst New South Wales and Queensland showed dramatic
reductions in the number litter items counted during Wave 3 compared to
Wave 2.
Total Litter Items
16217
22503
9976
15429
16633
14943
14391
15436
15691
15232
20414
10632
15889
25820
21188
18196
12919
13669
12787
13564
14014
14120
13512
0 5000 10000 15000 20000 25000 30000
WA
VIC
TAS
SA
QLD
NT
NSW
ACT
Average
Average includes a weighted NT, ACT & TAS count
Wave 3 Wave 2 Wave 1
The charts overleaf outline the material break down for each state. The first
graph represents the break down for Wave 1. Comparing the three charts, it
is evident the main decreases have been in cigarette butts, and to a lesser
extent, paper/ paperboard and plastic.

- 17 -
Items by MaterialState Comparison Wave 1
291
549
1084
2479
2830
6279
0
1000
2000
3000
4000
5000
6000
7000
8000
Cigarette butts Plastic Paper/ paperboards Metal Miscellaneous Glass
Average includes a weighted Tasmania count
WA
VIC
TAS
SA
QLD
NSW
Average Wave 1
Items by Material State Comparison Wave 2
3986361324
3126
3746
8965
0
2000
4000
6000
8000
10000
12000
14000
16000
Cigarette butts Plastic Paper/ paperboards Metal Miscellaneous Glass
WAVICTASSAQLDNSWAverage Wave 2
Items by Material State Comparison Wave 3
0
2000
4000
6000
8000
10000
12000
14000
16000
Cigarette butts Plastic Paper/ paperboard Metal Miscellaneous Glass
WAVICTASSAQLDNTNSWACTAverage Wave 3

- 18 -
Viewing the top dozen items shows the items most frequently not disposed
of correctly included cigarette butts, other paper (including tissues), all other
plastic, snack bags and confectionery wrappers, metal bottle tops and can
pull rings, plastic bottle tops, straws, other glass, other foil, cigarette
packets, beer aluminium all types all sizes, paper cups/ take away
containers.
Top Dozen Number of Litter Items
198
200
209
246
263
330
350
479
517
781
1327
7314
0 2000 4000 6000 8000 10000 12000
Cups/take away containers (paper)
Beer, aluminium, all types, all sizes
Cigarette packets
Other foil
Other glass
Straws
Plastic bottle tops
Metal bottle tops and can pull rings
Snack bags and confectionerywrappers (plastic)
All other plastic
Other paper (including tissues)
Cigarette butts
Items counted
Average Wave 3ACTNSWNTQLDSATASVICWA

- 19 -
Volume
The total volume average across all states for Wave 3 amounted to 2.126
cubic metres (compared to 1.977 m3 in Wave 2). The most voluminous of
the litter categories was miscellaneous accounting for a third (33%) of the
total volume. Illegal dumping is the main contributor in the miscellaneous
category, alone accounting for 31% of the Wave 3 average total volume.
Following, plastic accounted for 31%, paper/ paperboard 18%, metal 12%,
glass 6% of the total volume of the litter counted, and finally, cigarette butts
remained at less than 1%.
Wave 3 Average Volume by Material Type
Metal, 12%
Paper/ paperboards,
18%
Miscellaneous (mainly illegal
dumping), 33%
Glass, 6%
Plastic, 31%
Cigarette butts, <1%
The movement of the volume distribution of litter by material categories,
shows increases in miscellaneous (33%, compared to 25% in Wave 2),
plastic (31% compared to 24% in Wave 2), while paper/ paperboard has
decreased in the litter stream (18%, compared to 33% in Wave 2), as the
following graph outlines.

- 20 -
Average Distribution of Litter Volume by Material Type
21%
33%
18%
23%
25%
33%
38%
24%
31% 12% 6%
12%
12%
39%
7%
<1%
<1%
<1%
0% 10% 20% 30% 40% 50% 60% 70% 80% 90% 100%
Average Wave 1
Average Wave 2
Average Wave 3
Averages include a weighted NT, ACT & TAS count
Paper/ paperboards Miscellaneous (mainly illegal dumping) Plastic Metal Glass Cigarette butts
The graph overleaf represents the total volume of litter across each state for
each Wave.
Total Litter Volume by StateWave Comparison
2.006
1.833
1.114
1.678
1.436
3.541
1.935
2.039
1.933
0.925
1.891
1.993
3.082
1.977
2.406
2.479
1.142
3.206
1.536
1.470
3.145
1.625
2.126
0.000 0.500 1.000 1.500 2.000 2.500 3.000 3.500 4.000
WA
VIC
TAS (weighted)
SA
QLD
NT (weighted)
NSW
ACT (weighted)
Average
Average includes a weighted NT, ACT & TAS
count
m3
Wave 1 Wave 2 Wave 3

- 21 -
The graph below represents the proportion of volume items in each material
type across each state for Wave 3.

- 22 -
Wave 3 Average Volumes by Material Type
8%
7%
6%
2%
5%
8%
4%
6%
6%
14%
19%
14%
5%
13%
4%
17%
12%
21%
24%
16%
11%
26%
22%
14%
17%
18%
34%
18%
45%
21%
50%
25%
29%
45%
31%
22%
31%
18%
61%
6%
24%
49%
13%
33%
22%
<1%
<1%
<1%
<1%
<1%
<1%
<1%
<1%
<1%
0% 10% 20% 30% 40% 50% 60% 70% 80% 90% 100%
WA
VIC
TAS (weighted)
SA
QLD
NT (weighted)
NSW
ACT (weighted)
Average
% of total volume within each state
Glass Metal Paper/ paperboards Plastic Miscellaneous (mainly illegal dumping) Cigarette butts
- 23 -
The charts overleaf outline the litter volume material break down for each
state for each Wave. The first graph represents the break down for Wave 1
and so on. Comparing the charts, it is apparent that the average volume has
decreased for metal and glass litter, but has increased in miscellaneous,
plastic and paper/ paperboard.

- 24 -
Litter Volume by MaterialState Comparison Wave 1
0.000
0.124
0.227
0.3990.440
0.744
0.000
0.200
0.400
0.600
0.800
1.000
1.200
1.400
Plastic Miscellaneous Paper/ paperboards Metal Glass Cigarette butts
Average includes a weighted Tasmania count
m3
WA
VIC
TAS(weighted)SA
QLD
NSW
Average
Litter Volume by MaterialState Comparison Wave 2
0.2370.140
0.000
0.649
0.4850.466
0.000
0.200
0.400
0.600
0.800
1.000
1.200
1.400
1.600
1.800
Plastic Miscellaneous Paper/ paperboards Metal Glass Cigarette butts
Average includes a weighted Tasmania count
m3
WA
VIC
TAS(weighted)SA
QLD
NSW
AverageWave 2
Litter Volume by MaterialState Comparison Wave 3
0.6570.709
0.2570.117
0.000
0.385
0.000
0.200
0.400
0.600
0.800
1.000
1.200
1.400
1.600
1.800
2.000
Plastic Miscellaneous Paper/ paperboards Metal Glass Cigarette butts
Average includes a weighted NT, ACT & TAS count
m3
WA
VIC
TAS
SA
QLD
NT
NSW
ACT
Average

- 25 -
Top Dozen
The top dozen litter items in terms of volume again identified illegal dumping
as the main culprit. Six of these items are drink containers, two of these
items also feature in the top dozen litter items, being paper cups/take away
containers and cigarette packets.
The following table lists dirty dozen litter items by count and volume. Items
in red represent new entries to the list which were not present in the
previous Wave.
Top Dozen Litter Items Top Dozen Litter Items by VolumeCigarette butts Illegal dumpingOther paper (including tissues) Containers, domestic type (plastic)All other plastic Containers, industrial e.g. oil (plastic)Snack bags and confectionery wrappers (plastic) Cups/take away containers (paper)Metal bottle tops and can pull rings Newspapers & magazinesPlastic bottle tops Beer, aluminium, all types, all sizesStraws Flav. water/soft drink (carbonated) <1 litre (plastic)Other glass Water, carbonated & flavoured/soft drink (metal)Other foil Alcoholic sodas & spirit-based mixers (metal)Cigarette packets Flav. water/soft drink (carbonated) 1 litre+ (plastic)Beer, aluminium, all types, all sizes Beer, < 750ml, all colours of glassCups/take away containers (paper) Cigarette packets

- 26 -
Top Dozen Litter Items by VolumeWave 3
0.00 0.20 0.40 0.60 0.80 1.00 1.20 1.40 1.60 1.80 2.00
Cigarette packets
Beer, < 750ml, all coloursof glass
Flav. water/soft drink(carbonated) 1 litre+
(plastic)
Alcoholic sodas & spirit-based mixers (metal)
Water, carbonated &flavoured/soft drink
(metal)
Flav. water/soft drink(carbonated) <1 litre
(plastic)
Beer, aluminium, alltypes, all sizes
Newspapers &magazines
Cups/take awaycontainers (paper)
Containers, industrial e.g.oil (plastic)
Containers, domestictype (plastic)
Illegal dumping
Average includes a weighted NT, ACT &
TAS count
m3
Average
ACT
NSW
NT
QLD
SA
TAS
VIC
WA

- 27 -
2.3 Cigarette Butts
On average in Wave 3 almost half (47%, compared to 49% in Wave 2) of
the litter items counted were cigarette butts. Western Australia and South
Australia have the lowest proportion of cigarette butts in their litter stream
(43% and 42% respectively), whilst NT and NSW also show relatively low
proportions of cigarette butts within the litter stream (44% of the items
counted within each state were cigarette butts). However, the proportion of
total litter items represented by cigarette butts in ACT (54%) was higher
than for any other state.
Proportion of Cigarette butts in Litter Stream Wave 3
42%
53%
49%
38%
48%
48%
46%
53%
50%
42%
43%
52%
51%
49%
43%
47%
48%
42%
50%
44%
44%
54%
47%
0% 10% 20% 30% 40% 50% 60%
WA
VIC
TAS
SA
QLD
NT
NSW
ACT
Average
% of total litter items counted within each state
Cigarette butts Wave 1 Cigarette butts Wave 2 Cigarette butts Wave 3
The graph overleaf represents the distribution of cigarette butts across site
locations. This displays how the Australian Capital Territory, New South
Wales and the Northern Territory have a high proportion of their cigarette
butts counted at highways, whereas in Victoria and Western Australia, car
parks, retail and industrial sites are heavier in terms of butts.

- 28 -
Cigarette butts by Site Type Wave 3
12%
11%
27%
23%
25%
35%
35%
39%
17%
27%
25%
19%
26%
21%
19%
15%
13%
28%
27%
26%
21%
22%
4%
10%
4%
5%
8%
7%
5%
6%
5%
7%
6%
8%
2%
10%
6%
7%
2%
2%
2%
5%
5%
5%
19%
16%
11%
10%
14%
9%
5%
2%
13%
13%
11%
12%
9%
14%
11%
4%
19%
10%
15%
13%
10%
11%
17%
15%
9%
21%
19%
10%
11%
8%
16%
11%
14%
10%
10%
4%
3%
7%
3%
4%
2%
5%
6%
6%
0% 10% 20% 30% 40% 50% 60% 70% 80% 90% 100%
WA
VIC
TAS
SA
QLD
NT
NSW
ACT
Average Wave 1
Average Wave 2
Average Wave 3
% of total cigarette butts within each state
Highway Car Park Residential Beach Industrial Shopping Centre Retail Recreational Park

- 29 -
As the following graph demonstrates, the distribution of cigarette butts
across sites was similar to Wave 2.
Cigarette butts Dispersion by Site TypeWave Comparison
17%
27%
25%
26%
21%
13%
13%
11%
16%
11%
14%
13%
10%
11%
5%
7%
6%
5%
6%
6%
5%
5%
5%22%
0% 10% 20% 30% 40% 50% 60% 70% 80% 90% 100%
Average Wave 1
Average Wave 2
Average Wave 3
Averages include a weighted NT, ACT & TAS count
Highway Car Park Industrial RetailShopping Centre Residential Recreational Park Beach

- 30 -
The following graph shows, in real figures, the decrease in the number of
cigarette butts is most pronounced at highways. Car parks and industrial
have also decreased substantially.
Cigarette butts Dispersion by Site TypeWave Comparison
1091
2458
1836
1642
1853
826
1144
813
975
1024
1029
798
860
823
340
596
472
295
539
422
313
491
3391578
0 1000 2000 3000 4000 5000 6000 7000 8000 9000 10000
Average Wave 1
Average Wave 2
Average Wave 3
Averages include a weighted NT, ACT & TAS count
Highway Car Park Industrial RetailShopping Centre Residential Recreational Park Beach

- 31 -
2.4 Light Weight Plastic Shopping Type Carry Bags
The number of light weight plastic shopping type carry bags found in the
litter stream has overall marginally decreased. The following graph shows
that highways contain the largest number of these types of bags.
Bags - Number of Light Weight Plastic Shopping Type Carry Bag Itemsin the Litter Stream by Site Type
8 11 15 157 4 6
43
109
13 13 17 165 4 8
50
916 13
19
3 49
33
107
128
0
20
40
60
80
100
120
140
Residenti
al
Beach
Indus
trial
Car Park
Shopp
ing C
entre
Retail
Recreati
onal P
ark
Highway
Grand Tota
l
Average includes a weighted NT, ACT & TAS countAverage Wave 1 Average Wave 2 Average Wave 3
- 32 -
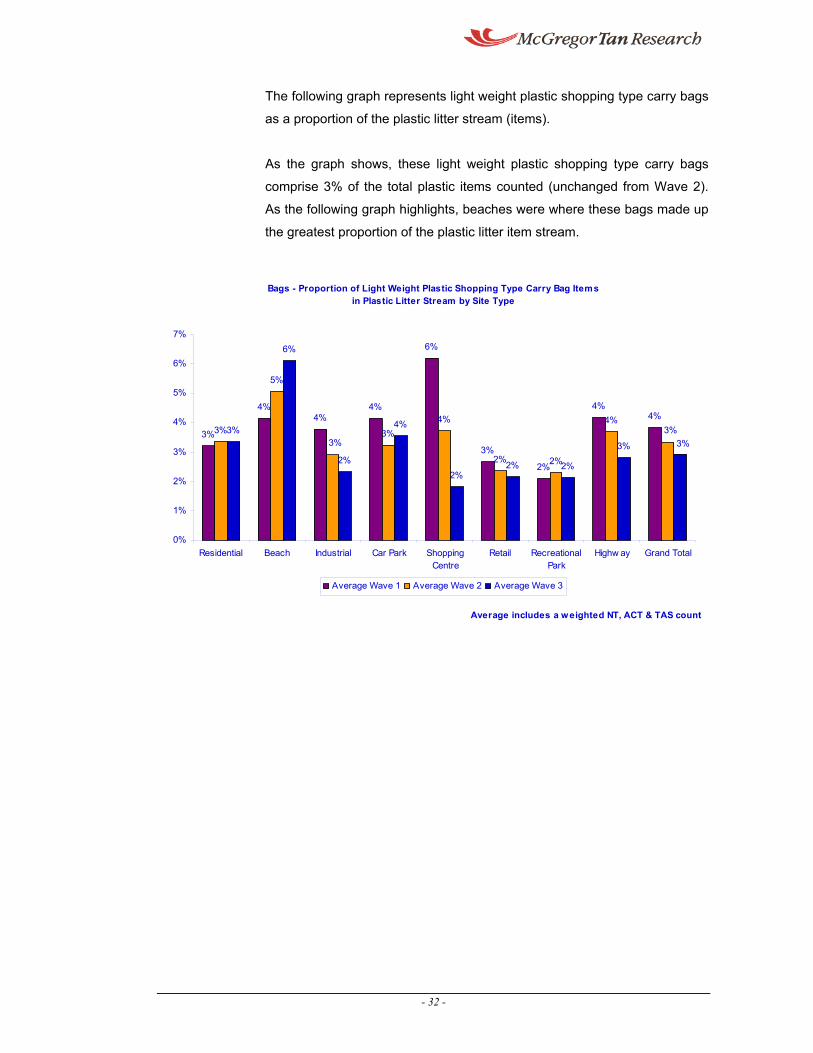
The following graph represents light weight plastic shopping type carry bags
as a proportion of the plastic litter stream (items).
As the graph shows, these light weight plastic shopping type carry bags
comprise 3% of the total plastic items counted (unchanged from Wave 2).
As the following graph highlights, beaches were where these bags made up
the greatest proportion of the plastic litter item stream.
Bags - Proportion of Light Weight Plastic Shopping Type Carry Bag Itemsin Plastic Litter Stream by Site Type
3%
4%4%
4%
6%
3%
2%
4%4%
3%
5%
3%4%
2% 2%
4%3%
6%
2%
4%
2%2% 2%
3%3%3%
3%
0%
1%
2%
3%
4%
5%
6%
7%
Residential Beach Industrial Car Park ShoppingCentre
Retail RecreationalPark
Highw ay Grand Total
Average includes a weighted NT, ACT & TAS count
Average Wave 1 Average Wave 2 Average Wave 3

- 33 -
2.5 Dispersion of Litter Across Site Types
The litter was counted across differing land areas, designed to capture a
good representation of areas throughout the state.
Highways formed the major catchment sites of the total litter stream,
containing 32% of all litter items, and 49% of the total volume of litter. The
average dispersion of litter amongst the varying site types in descending
order of contribution to the total litter stream, was as follows:
Highways (items 32%, volume 49%)
Car Park (17%, volume 13%)
Industrial (items 12%, volume 16%)
Retail (items 9%, volume 2%)
Residential (items 8%, volume 9%)
Shopping Centre (items 8%, volume 2%)
Recreational Park (items 7%, volume 4%)
Beach (items 6%, volume 5%)
As the following graphs illustrate, the dispersion of litter by site type is
relatively consistent over both the litter items and the litter volume across
Waves.
Proportion of Litter by Site Type
9%
3%
5%
4%
6%
7%
7%
10%
3%
2%
10%
8%
9%
11%
5%
4%
5%
6%
7%
6%
17%
7%
7%
9%
7%
8%
8%
9%
3%
2%
2%
8%
7%
8%
15%
12%
13%
13%
20%
18%
17%
11%
20%
19%
16%
15%
15%
12%
18%
47%
47%
49%
27%
30%
32%
2%
0% 10% 20% 30% 40% 50% 60% 70% 80% 90% 100%
Site dispersion
Total Volume Dispersion Average Wave 1
Total Volume Dispersion Average Wave 2
Total Volume Dispersion Average Wave 3
Total Litter Item Dispersion Wave 1
Total Litter Item Dispersion Wave 2
Total Litter Item Dispersion Wave 3
Averages include a w eighted NT, ACT & TAS count
Recreational Park Retail Beach Residential Shopping Centre Car Park Industrial Highway

- 34 -
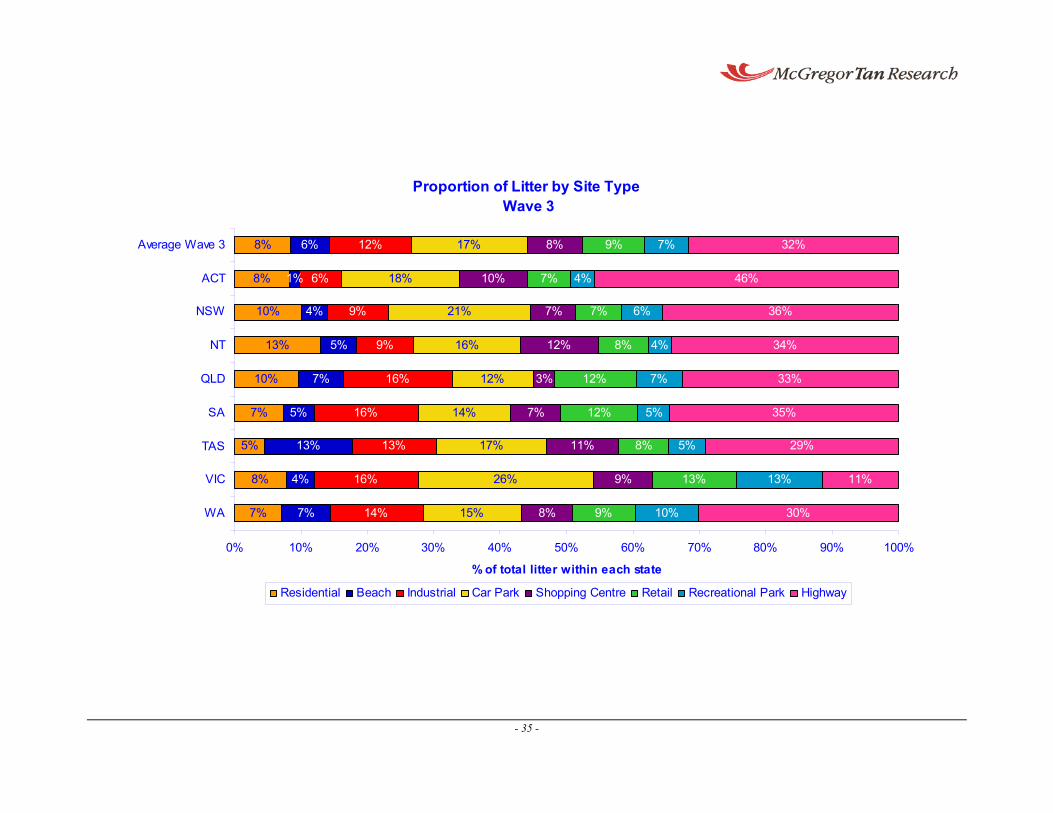
The following graph outlines the proportion of litter items by site type. There
are variations on a state to state basis. For example, Victoria has a smaller
proportion of its litter in highways, compared to the other states/ or the
average, however, it has a greater proportion found in car parks. On the
other hand, The Australian Capital Territory had a higher proportion of litter
found at highways, and a smaller proportion found at industrial sites.
- 35 -
Proportion of Litter by Site Type Wave 3
7%
8%
5%
7%
10%
13%
10%
8%
8%
7%
4%
13%
5%
7%
5%
4%
1%
6%
14%
16%
13%
16%
16%
9%
9%
6%
12%
15%
26%
17%
14%
12%
16%
21%
18%
17%
8%
9%
11%
7%
3%
12%
7%
10%
8%
9%
13%
8%
12%
12%
8%
7%
7%
9%
10%
13%
5%
5%
7%
4%
6%
4%
7%
30%
11%
29%
35%
33%
34%
36%
46%
32%
0% 10% 20% 30% 40% 50% 60% 70% 80% 90% 100%
WA
VIC
TAS
SA
QLD
NT
NSW
ACT
Average Wave 3
% of total litter within each state
Residential Beach Industrial Car Park Shopping Centre Retail Recreational Park Highway

- 36 -
The following graph outlines the proportion of litter volume by site type for
each state.

- 37 -
Proportion of Litter Volume by Site TypeWave 3
12%
8%
2%
4%
9%
19%
15%
8%
9%
3%
4%
9%
2%
5%
10%
5%
0%
5%
9%
17%
11%
28%
27%
6%
10%
17%
16%
6%
21%
19%
4%
4%
26%
26%
2%
13%
1%
4%
1%
3%
1%
2%
2%
0%
2%
3%
14%
3%
2%
2%
2%
2%
3%
4%
0%
5%
1%
5%
1%
3%
1%
2%
68%
49%
40%
59%
32%
30%
65%
47%
53%
0% 10% 20% 30% 40% 50% 60% 70% 80% 90% 100%
WA
VIC
TAS
SA
QLD
NT
NSW
ACT
Average Wave 3
% of litter volume within each state
Residential Beach Industrial Car Park Shopping Centre Retail Recreational Park Highway

- 38 -
Key Identifiable Items
Tracking several of the key offending items, it is apparent that a high
proportion of snack bags and confectionery wrappers are abandoned at
highways. Metal bottle tops and can pull rings are most prevalent in car
parks. Straws were mainly found at highways and car parks. Plastic bottle
tops were most commonly found at highways and car parks. The greatest
proportion of cigarette packets were found in highways. Several drink
container items were grouped into one category to analyse where these
items are located. The table below outlines these items. Drink containers
were found most prevalent at highways, industrial and car park locations.
Location of Common Litter Items Wave 3
0%
10%
20%
30%
40%
50%
60%
Residential Beach Industrial Car Park Shopping Centre Retail Recreational Park Highway
Snack bags and confectionery wrappers Metal bottle tops and can pull rings Straws Plastic bottle tops Cigarette packets Drink Containers
Res
iden
tial
Bea
ch
Indu
stria
l
Car
Par
k
Shop
ping
C
entr
e
Ret
ail
Rec
reat
iona
l Pa
rk
Hig
hway
Grand Total
1 Plain water (carbonated or non-carb.), <1 litre 0 0 1 2 0 0 0 1 52 Flav. water/soft drink (carbonated) <1 litre 0 0 3 2 0 0 1 8 153 Flav.wtr/fruit j. dr/sprts dr, (non-carb), <1 litre 1 0 1 3 0 0 0 3 84 Fruit juice, < 1 litre 0 1 1 1 0 0 1 1 45 Alcoholic sodas / spirit-based mixers, all sizes 2 1 2 4 0 1 1 10 206 Cider/fruit based etc. (glass) 0 0 0 0 0 0 0 2 27 Beer, < 750ml, all colours of glass 7 6 13 12 1 1 3 52 958 Beer, aluminium, all types, all sizes 12 14 31 38 5 10 11 78 2009 Cider/fruit based etc. (metal) 0 0 0 0 0 0 0 5 6
10 Water, carbonated & flavoured/soft drink 16 3 29 11 4 2 6 80 15211 Water, non-carbonated & flavoured, all sizes 0 0 0 1 0 0 0 1 312 Flav. milk, < 1 litre 1 1 6 2 1 1 0 27 3913 Fruit juice< 1 litre 2 1 2 1 0 1 1 6 1514 Plain water (carbonated or non-carb) <1 litre 4 3 11 7 1 1 3 22 5215 Flav. water/soft drink (carbonated) <1 litre 7 8 16 8 5 2 4 64 11316 Flav.wtr/fruit j. dr, sprts dr etc.(non-carb) <1 litre 3 1 7 5 1 1 3 12 3217 Cartons, flavoured milk< 1 litre 4 1 6 8 1 0 3 34 5718 Flav. water/fruit j. drink/sports drink, non-carb, <1 litre 1 0 1 0 0 0 0 5 819 Cartons, fruit juice, < 1 litre 1 0 0 1 0 0 1 4 9
Drink Containers 62 41 132 106 20 21 40 415 8367% 5% 16% 13% 2% 3% 5% 50% 100%

- 39 -
2.6 The Dirty Dozen
The average top dozen items accounted for 78% of the litter counted in
Wave 3, 80% in Wave 2 and 78% in Wave 1. Below is a brief ranked
comparison between the twelve most dirty litter items in 2006 and 2005
data.
Rank Top Dozen Litter Items Wave 3 2006 Top Dozen Litter Items Wave 2 2006 Top Dozen Wave 1 20051 Cigarette butts Cigarette butts Cigarette butts2 Other paper (including tissues) Other paper (including tissues) Other paper (including tissues)3 All other plastic Snack bags and confectionery wrappers (plastic) All other plastic 4 Snack bags and confectionery wrappers (plastic) All other plastic Snack bags and confectionery wrappers5 Metal bottle tops and can pull rings Metal bottle tops and can pull rings Metal bottle tops and can pull rings
6 Plastic bottle tops Plastic bottle tops Plastic bottle tops
7 Straws Straws Straws8 Other glass Cigarette packets Cigarette packets9 Other foil Cups/take away containers (paper) Other foil10 Cigarette packets Other foil Cups/take away containers (paper)11 Beer, aluminium, all types, all sizes Lollipop sticks Clothing & materials12 Cups/take away containers (paper) Shopper dockets & related shopping paper (eg, lists) Take away & cups (plastic)
*Note green text represents new items to the top dozen, while red text represents items that have subsequently dropped off the top dozen
Over the most recent two Waves, it is apparent that lollipop sticks (currently
18th) and shopper dockets and related shopping paper (e.g. lists) (currently
ranked 17th) are out of the top dozen and coming into the top dozen were
other glass and beer, aluminium, all types, all sizes (respectively these
items were previously ranked 15th and 16th in Wave 2).
However, cigarette butts clearly remain the major item, accounting for
almost half of all items in the litter stream.
In terms of sites types, highways remain the main site type, where there is
the most litter (32%, compared to 30% in Wave 2).

- 40 -
Section 3 State Summary

- 41 -
The following summary covers the findings of the Wave 3 litter count, conducted in QLD.
3.1 At A Glance
Queensland recorded an overall decrease in litter items, 16,633 down from
25,820. Main decreases were in the following categories:
• Cigarette butts 8,373, down from 13,525 items
• Plastic 3,233, down from 5,097 items
• Paper 3,007, down from 4,753 items
Three quarters (78%) of the litter found at retail sites was cigarette butts.
The top three site types overall for litter were:
• Highways (33%, volume 55%)
• Industrial (16%, volume 23%)
• Car park (12%, volume 5%)
• Retail (12%, volume 1%)
In the current Wave, there was 1.536 cubic metres of litter volume,
compared to 1.993 cubic metres in Wave 2. The main components of the
volume were plastic 50%, paper 26%. and metal 13%.
The following table shows each items movement from Wave 1 through to
Wave 3.
- 42 -
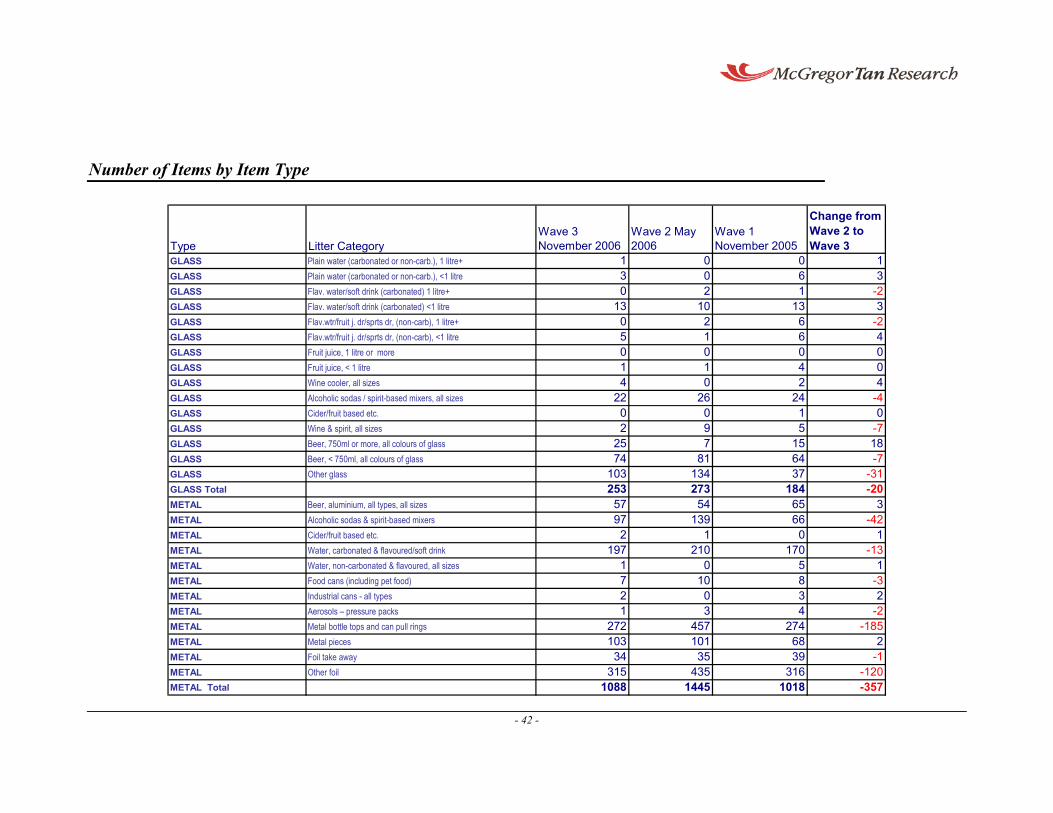
Number of Items by Item Type
Type Litter Category Wave 3 November 2006
Wave 2 May 2006
Wave 1 November 2005
Change from Wave 2 to Wave 3
GLASS Plain water (carbonated or non-carb.), 1 litre+ 1 0 0 1GLASS Plain water (carbonated or non-carb.), <1 litre 3 0 6 3GLASS Flav. water/soft drink (carbonated) 1 litre+ 0 2 1 -2GLASS Flav. water/soft drink (carbonated) <1 litre 13 10 13 3GLASS Flav.wtr/fruit j. dr/sprts dr, (non-carb), 1 litre+ 0 2 6 -2GLASS Flav.wtr/fruit j. dr/sprts dr, (non-carb), <1 litre 5 1 6 4GLASS Fruit juice, 1 litre or more 0 0 0 0GLASS Fruit juice, < 1 litre 1 1 4 0GLASS Wine cooler, all sizes 4 0 2 4GLASS Alcoholic sodas / spirit-based mixers, all sizes 22 26 24 -4GLASS Cider/fruit based etc. 0 0 1 0GLASS Wine & spirit, all sizes 2 9 5 -7GLASS Beer, 750ml or more, all colours of glass 25 7 15 18GLASS Beer, < 750ml, all colours of glass 74 81 64 -7GLASS Other glass 103 134 37 -31GLASS Total 253 273 184 -20METAL Beer, aluminium, all types, all sizes 57 54 65 3METAL Alcoholic sodas & spirit-based mixers 97 139 66 -42METAL Cider/fruit based etc. 2 1 0 1METAL Water, carbonated & flavoured/soft drink 197 210 170 -13METAL Water, non-carbonated & flavoured, all sizes 1 0 5 1METAL Food cans (including pet food) 7 10 8 -3METAL Industrial cans - all types 2 0 3 2METAL Aerosols – pressure packs 1 3 4 -2METAL Metal bottle tops and can pull rings 272 457 274 -185METAL Metal pieces 103 101 68 2METAL Foil take away 34 35 39 -1METAL Other foil 315 435 316 -120METAL Total 1088 1445 1018 -357

- 43 -
Type Litter Category Wave 3 November 2006
Wave 2 May 2006
Wave 1 November 2005
Change from Wave 2 to Wave 3
PLASTIC White milk, all sizes 6 7 6 -1PLASTIC Flav. milk, 1 litre or more 10 5 7 5PLASTIC Flav. milk, < 1 litre 97 135 100 -38PLASTIC Fruit juice, 1 litre or more 1 8 3 -7PLASTIC Fruit juice< 1 litre 16 48 38 -32PLASTIC Plain water (carbonated or non-carb) 1 litre+ 15 29 26 -14PLASTIC Plain water (carbonated or non-carb) <1 litre 68 69 58 -1PLASTIC Flav. water/soft drink (carbonated) 1 litre+ 42 62 43 -20PLASTIC Flav. water/soft drink (carbonated) <1 litre 139 191 100 -52PLASTIC Flav. wtr/fruit j. dr, sprts dr etc.(non-carb) 1 litre+ 10 8 15 2PLASTIC Flav.wtr/fruit j. dr, sprts dr etc.(non-carb) <1 litre 37 40 19 -3PLASTIC Containers, industrial e.g. oil 6 11 5 -5PLASTIC Containers, domestic type 26 25 23 1PLASTIC Bags - light weight plastic shopping type carry bags 60 76 56 -16PLASTIC Bags - heavier glossy typically branded carry bags 25 21 25 4PLASTIC Sacks - sheeting - other bags 67 161 84 -94PLASTIC Wine cask bladders 2 0 0 2PLASTIC Straws 287 363 304 -76PLASTIC 6 ring can holders 8 5 13 3PLASTIC Snack bags and confectionery wrappers (plastic) 530 1176 729 -646PLASTIC Styrene foam boxes, sheets, etc 91 160 63 -69PLASTIC Packing tape & straps 169 192 114 -23PLASTIC Take away & cups (plastic) 138 192 172 -54PLASTIC Plastic bottle tops 274 421 239 -147PLASTIC Bread bag tags 35 53 38 -18PLASTIC Lollipop sticks 84 134 123 -50PLASTIC Spoons/ cutlery 62 67 45 -5PLASTIC Drink pouches 9 1 6 8PLASTIC All other plastic 919 1437 687 -518PLASTIC Total 3233 5097 3141 -1864

- 44 -
Type Litter Category Wave 3 November 2006
Wave 2 May 2006
Wave 1 November 2005
Change from Wave 2 to Wave 3
PAPER/PAPERBOARD Packages & boxes 88 96 91 -8PAPER/PAPERBOARD Cigarette packets 197 247 197 -50PAPER/PAPERBOARD Cartons, milk, plain (white) all sizes 6 8 4 -2PAPER/PAPERBOARD Cartons, flavoured milk1 litre or more 0 3 4 -3PAPER/PAPERBOARD Cartons, flavoured milk< 1 litre 41 63 43 -22PAPER/PAPERBOARD Flav. water / fruit j. drink/ sports drink, (non-carb), 1 litre+ 0 1 1 -1PAPER/PAPERBOARD Flav. water/fruit j. drink/sports drink, non-carb, <1 litre 7 19 16 -12PAPER/PAPERBOARD Fruit juice, 1 litre or more 0 1 0 -1PAPER/PAPERBOARD Cartons, fruit juice, < 1 litre 6 8 8 -2PAPER/PAPERBOARD Newspapers & magazines 99 129 82 -30PAPER/PAPERBOARD Junk mail / free circulars 105 76 96 29PAPER/PAPERBOARD Cups/take away containers (paper) 228 316 173 -88PAPER/PAPERBOARD Tickets, e.g. bus, ATM, vending machine etc. 46 125 120 -79PAPER/PAPERBOARD Ice cream wrappers 66 143 134 -77PAPER/PAPERBOARD Paper bags 114 164 115 -50PAPER/PAPERBOARD Shopper dockets & related shopping paper (eg, lists) 93 216 87 -123PAPER/PAPERBOARD Other paper (including tissues) 1911 3138 1351 -1227PAPER/PAPERBOARD Total 3007 4753 2522 -1746MISCELLANEOUS Tyres & pieces 70 71 35 -1MISCELLANEOUS Clothing & materials 131 185 94 -54MISCELLANEOUS Illegal dumping 2 4 3 -2MISCELLANEOUS Syringes 1 0 0 1MISCELLANEOUS Ice cream sticks 60 60 65 0MISCELLANEOUS Rubber pieces (not tyres) 114 202 74 -88MISCELLANEOUS Condoms 2 1 1 1MISCELLANEOUS Construction materials 58 52 60 6MISCELLANEOUS Disposable nappies 3 1 2 2MISCELLANEOUS Other miscellaneous 238 151 55 87MISCELLANEOUS Total 679 727 389 -48CIGARETTE BUTTS Total Cigarette butts 8373 13525 6760 -5152
Grand Total 16633 25820 14014 -9187

- 45 -
3.2 Total Litter Items
Number of Items
In total, 16,633 litter items were counted in Wave 3, down significantly from
the 25,820 counted in Wave 2. Cigarette butts formed half (50%, down from
52% in Wave 2) of the number of litter items counted in Queensland. In the
litter stream there were also significant levels of plastic (19%, down from
20% in Wave 2) and paper/ paperboard (18% unchanged from Wave 2).
Proportion of Total Litter by Material Type
Glass2%
Metal7%
Plastic19%
Paper/ paperboard18%Miscellaneous
4%
Cigarette butts50%
The graph overleaf represents the litter items by material category. As the
graph displays, the decrease is most pronounced in cigarette butts.
Significant decreases are also seen in plastic and paper/ paperboard. Other
material categories recorded marginal decreases.

- 46 -
Comparison of Number of Items by Litter Category
1841018
31412522
389
6760
273
1445
5097 4753
727
13525
2531088
3233 3007
679
8373
0
2000
4000
6000
8000
10000
12000
14000
16000
GLASS To
tal
METAL Tota
l
PLASTIC
Total
PAPER/PAPERBOARD Tota
l
MISCELLANEOUS To
tal
CIGARETT
E BUTTS Total
Wave 1 Wave 2 Wave 3
Cigarette butts accounted for the largest proportion of litter items with 8,373
counted down from 13,525. The next highest individual items were other
paper (including tissues) 1,911 (down from 3,138 in Wave 2), all other
plastic 919 (down from 1,437 in Wave 2), snack bags and confectionery
wrappers 530 (down from 1,176 in Wave 2) and other foil 315 (down from
435 in Wave 2), as the graph displays.

- 47 -
Top 20 Litter Items Counted- Queensland-
101
76
164
202
185
192
191
192
210
247
316
151
457
421
363
435
1176
1437
3138
13525
103
105
114
114
131
138
139
169
197
197
228
238
272
274
287
315
530
919
1911
8373
68
96
115
74
94
172
100
114
170
197
173
55
274
239
304
316
729
687
1351
6760
0 2000 4000 6000 8000 10000 12000 14000
Metal pieces
Junk mail / free circulars
Paper bags
Rubber pieces (not tyres)
Clothing & materials
Take aw ay & cups (plastic)
Flav. w ater/soft drink (carbonated) <1 litre (plastic)
Packing tape & straps
Water, carbonated & f lavoured/soft drink (metal)
Cigarette packets
Cups/take aw ay containers (paper)
Other miscellaneous
Metal bottle tops and can pull rings
Plastic bottle tops
Straw s
Other foil
Snack bags and confectionery w rappers (plastic)
All other plastic
Other paper (including tissues)
Cigarette butts
Wave 1 Wave 2 Wave 3
Volume
The total volume of the litter counted in QLD amounted to 1.536 (down from
1.993 m3 in Wave 2). Half the volume of the litter was plastic (50%,
compared to 51% in Wave 2). Paper/ paperboard 26% (compared to 27% in
Wave 2), of the volume of the litter counted, followed by metal (13%,
compared to 11% in Wave 2), miscellaneous constituted 6% (compared to

- 48 -
7% in previous Waves), glass (5%, compared to 4% in Wave 2) and finally,
cigarette butts (remaining at less than 1%).
Proportion of Total Volume of Litter by Material Type
Plastic, 50%
Glass, 5%
Cigarette butts, <1%
Metal, 13%Paper/paperboard, 26%
Miscellaneous, 6%
The most voluminous items were:
• Containers, domestic type, 0.216 up from 0.208 m3 in Wave 2 (14%,
up from 10% of total volume)
• Cups/ take away containers (paper), 0.166 down from 0.230 m3 in
Wave 2 (11% down from 12% of total volume)
• Containers, industrial e.g. oil, 0.135, down from 0.247 m3 in Wave 2
(9%, down from 12% of total volume)
• Newspapers and magazines, 0.117, down from 0.152 m3 in Wave 2
(8% of total volume, as in Wave 2)

- 49 -
Top 20 Items by Volume
0.011
0.022
0.015
0.040
0.028
0.036
0.032
0.031
0.043
0.072
0.053
0.046
0.037
0.071
0.073
0.062
0.097
0.112
0.126
0.191
0.022
0.019
0.011
0.045
0.023
0.040
0.047
0.039
0.054
0.096
0.072
0.054
0.078
0.103
0.091
0.119
0.152
0.247
0.230
0.208
0.021
0.021
0.021
0.023
0.025
0.029
0.031
0.035
0.043
0.048
0.052
0.054
0.055
0.069
0.085
0.086
0.117
0.135
0.166
0.216
0.00 0.05 0.10 0.15 0.20 0.25 0.30
Flav.wtr/fruit j. dr, sprts dretc.(non-carb) <1 litre (plastic)
Construction materials
Flav. milk, 1 litre or more
Plain water (carbonated ornon-carb) 1 litre+ (plastic)
Beer, aluminium, all types, allsizes
Take away & cups (plastic)
Cartons, flavoured milk< 1litre
Beer, < 750ml, all colours ofglass
Cigarette packets
Illegal dumping
Flav. milk, < 1 litre (plastic)
Plain water (carbonated ornon-carb) <1 litre (plastic)
Alcoholic sodas & spirit-based mixers (metal)
Flav. water/soft drink(carbonated) 1 litre+ (plastic)
Water, carbonated &flavoured/soft drink (metal)
Flav. water/soft drink(carbonated) <1 litre (plastic)
Newspapers & magazines
Containers, industrial e.g. oil
Cups/take away containers(paper)
Containers, domestic type(plastic)
m3
Wave 1 Wave 2 Wave 3

- 50 -
3.3 Cigarette butts
Number of items
Half (50%, down from 52% in Wave 2) of the litter items counted were
cigarette butts. The number of cigarette butts that were counted reduced
substantially to 8,373 from 13,525 in Wave 2. This is above the Wave 3
national average number of cigarette butts counted (7,314 butts).
Of interest was the finding that 24 (down from 41) individual sites contained
100 cigarette butts or more 4,492, accounting for 54% of the total cigarette
butts.
The main site types to contain more than 100 cigarette butts were retail (6
sites accounting for 1,169 cigarette butts), highways (5 sites accounting for
1,169 cigarette butts), car park sites (4 sites accounting for 575 cigarette
butts), and beaches (3 sites accounting for 412 cigarette butts).
There were 3 sites that contained 300 cigarette butts or more accounting for
1,239 cigarette butts or 15% of all cigarette butts, one was a highway site
(402 butts), another a retail site (423 butts), and an industrial site (414
butts).
The proportion of cigarette butts as part of the litter streams across each
site varied. As the graph overleaf displays, shopping centre sites were
below the Monitor average, while all other sites recorded proportions above
the national Monitor average for Wave 3.

- 51 -
Proportion of Cigarette butts in the Site Type Litter Streams
35%
64%
81%77%
51%
45%41%
73%68%
54%52%
41%
56%
44%
63%
78%
53%
39%
34%34%31%
64%
40%
56%
40%
56%
64% 68%
38%38%
35%
41%
0%
10%
20%
30%
40%
50%
60%
70%
80%
90%
Residential Beach Industrial Car Park Shopping Centre Retail Recreational Park Highw ay
Average includes a weighted NT, ACT & TAS count
Cigarette proportion Wave 1 Cigarette proportion Wave 2
Cigarette proportion Wave 3 Wave 3 Average Proportion of cigarette butts across site types
The following graph shows the actual cigarette butt numbers found across
all site types. From here you can see the amount of butts found in highways
has dropped substantially from the high recorded in Wave 2.
Cigarette butts in the Site Type Litter Streams
523313
750
1398
455
1224
656
12751599
599
2124
1448
649
14491087
5595
1111
1567
392
1734
590
297
1200
623
0
1000
2000
3000
4000
5000
6000
Residential Beach Industrial Car Park ShoppingCentre
Retail RecreationalPark
Highway
Average includes a weighted NT, ACT & TAS count
Cigarette butts Wave 1 Cigarette butts Wave 2 Cigarette butts Wave 3
- 52 -
Volume
Despite cigarette butts being the most numerous litter item, butts again
accounted for less than 1% of the total volume of litter.

- 53 -
3.4 Plastic Litter
Number of items
A fifth (19%, down from 20% in Wave 2) of the litter items counted were
plastic (3,233, down from 5,097 items), which is below the Monitor average
(3,263 items).
The most common plastic litter items counted were:
• All other plastic, (919 items) 6% of the total litter counted, as in Wave
2)
• Snack bags and confectionery wrappers, (530 items) 3% of the total
litter counted (compared to 5% in Wave 2)
• Straws, (287 items) 2% of the total litter counted (compared to 1% in
Wave 2)
• Plastic bottle tops, (274 items) 2% of the total litter counted
(proportion remaining the same from previous Waves)
Volume
Plastic represented half of the volume of litter in the QLD litter stream 0.765
m3 (50%, compared to 51% in Wave 2).
The most voluminous items were:
• Containers, domestic type, 0.216 m3 (14%, compared to 10% of the
total volume in Wave 2)
• Containers, industrial e.g. oil, 0.135 m3 (9%, compared to 12% of the
total volume in Wave 2)

- 54 -
Plastic Total by Volume
0.002
0.006
0.020
0.013
0.025
0.011
0.015
0.040
0.036
0.053
0.046
0.071
0.062
0.112
0.191
0.006
0.009
0.026
0.015
0.013
0.022
0.011
0.045
0.040
0.072
0.054
0.103
0.119
0.247
0.208
0.003
0.004
0.009
0.013
0.017
0.021
0.021
0.023
0.029
0.052
0.054
0.069
0.086
0.135
0.216
0.000 0.050 0.100 0.150 0.200 0.250 0.300
Styrene foam boxes, sheets, etc
Confectionery w rappers (incl. chippackets)
Fruit juice< 1 litre
White milk, all sizes
Flav. w tr/fruit j. dr, sprts dr etc.(non-carb) 1 litre+
Flav.w tr/fruit j. dr, sprts dr etc.(non-carb) <1 litre
Flav. milk, 1 litre or more
Plain w ater (carbonated or non-carb)1 litre+
Take aw ay & cups
Flav. milk, < 1 litre
Plain w ater (carbonated or non-carb)<1 litre
Flav. w ater/soft drink (carbonated) 1litre+
Flav. w ater/soft drink (carbonated)<1 litre
Containers, industrial e.g. oil
Containers, domestic type
m3
Wave 1 Wave 2 Wave 3

- 55 -
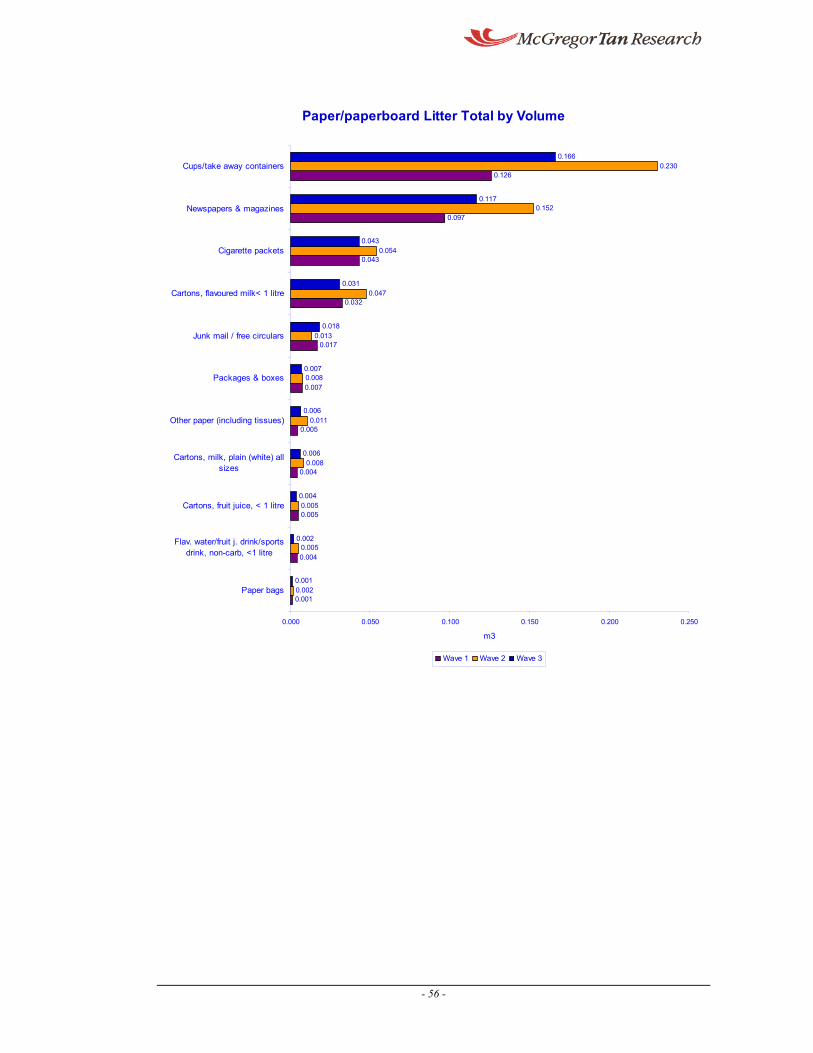
3.5 Paper/paperboard Litter
Number of items
Paper made up 18% (unchanged proportion from previous Waves) 3,007
items, above the Monitor average (2,639 items).
The most common paper/paperboard items included:
• Other paper (including tissues), 1,911 items (11%, compared to 12%
in Wave 2 of the total number of litter counted)
• Cups/take away containers 228 items (remained at 1% of the total
number of litter counted, as in Wave 2)
• Cigarette packets, 197 items (remained at 1% of the total number of
litter counted)
Volume
Paper accounted for 26% (compared to 27% in Wave 2) of the volume of
the litter in the QLD litter stream (0.402 m3). The most common items were:
• Cups/take away containers, 0.166 m3 (11%, compared to 12% of the
total volume)
• Newspapers & magazines, 0.117 m3 (8% of the total volume, as in
Wave 2)
• Cigarette packets, 0.043 m3 (3% of the total volume, unchanged
proportion from Wave 2)
- 56 -
Paper/paperboard Litter Total by Volume
0.001
0.004
0.005
0.004
0.005
0.007
0.017
0.032
0.043
0.097
0.126
0.002
0.005
0.005
0.008
0.011
0.008
0.013
0.047
0.054
0.152
0.230
0.001
0.002
0.004
0.006
0.006
0.007
0.018
0.031
0.043
0.117
0.166
0.000 0.050 0.100 0.150 0.200 0.250
Paper bags
Flav. water/fruit j. drink/sportsdrink, non-carb, <1 litre
Cartons, fruit juice, < 1 litre
Cartons, milk, plain (white) allsizes
Other paper (including tissues)
Packages & boxes
Junk mail / free circulars
Cartons, flavoured milk< 1 litre
Cigarette packets
Newspapers & magazines
Cups/take away containers
m3
Wave 1 Wave 2 Wave 3

- 57 -
3.6 Metal Litter
Number of items
Metal items constituted 7% (compared to 6% in Wave 2) of the litter stream
1,088 items, below the Monitor average (1,376 items).
The most common metal items were:
• Other foil, 315 items (remained at 2% of the total number of litter
counted)
• Metal bottle tops and can pull rings, 272 items (remained at 2% of the
total number of litter counted)
• Water, carbonated & flavoured/soft drink, 197 items (remained at 1%
of the total number of litter counted)
Volume
Metal accounted for 0.197 m3 (13%, compared to 11% in Wave 2) of the
volume of litter counted. The most voluminous of the metal litter items
included:
• Water, carbonated & flavoured/soft drink, 0.085 m3 (6%, compared to
5% of the total volume)
• Alcoholic sodas and spirit based mixers, 0.055 m3 (4% of the total
volume, as in Wave 2)

- 58 -
Metal Litter Total by Volume
0.001
0.001
0.004
0.014
0.018
0.028
0.037
0.073
0.002
0.001
0.005
0.000
0.016
0.023
0.078
0.091
0.001
0.001
0.003
0.009
0.016
0.025
0.055
0.085
0.000 0.010 0.020 0.030 0.040 0.050 0.060 0.070 0.080 0.090 0.100
Metal bottle tops and can pullrings
Metal pieces
Food cans (including pet food)
Industrial cans - all types
Foil take away
Beer, aluminium, all types, allsizes
Alcoholic sodas & spirit-basedmixers
Water, carbonated &flavoured/soft drink
m3
Wave 1 Wave 2 Wave 3

- 59 -
3.7 Miscellaneous
Number of items
Items classified as miscellaneous accounted for 4% of the litter stream (679
items), above the Monitor average (639 items).
The most common miscellaneous items were:
• Other miscellaneous, 238 items (1%, compared to less than 1% of the
total number of litter counted in Wave 2)
• Clothing & materials, 131 items (remaining at 1% of the total number
of litter counted)
• Rubber pieces not tyres, 114 items (remaining at 1% of the total
number of litter counted)
Volume
Miscellaneous litter accounted for 0.093 m3 (6%, compared to 7% of the
total volume in Wave 2) of the total volume of litter counted. The most
voluminous, was illegal dumping 0.048 m3 (3%, compared to 5% of the total
volume in Wave 2), as the graph displays.
Miscellaneous Litter Total by Volume
0.002
0.008
0.022
0.072
0.001
0.016
0.019
0.096
0.003
0.016
0.021
0.048
0.000 0.020 0.040 0.060 0.080 0.100 0.120
Disposable nappies
Tyres & pieces
Construction materials
Illegal dumping
m3
Wave 1 Wave 2 Wave 3

- 60 -
3.8 Glass Items
Number of items
Glass items again constituted just 2% of the litter stream in QLD (253
items), below the Monitor average (461 items).
The main glass item was:
• Other glass (103 items) (1% of the total number of litter items, as in
Wave 2)
Volume
The total volume of glass was 0.080 m3 (5%, compared to 4% of the total
volume in Wave 2) of the total litter stream. The most voluminous glass item
was clearly:
• Beer, less than 750ml, all colours of glass, 0.035 m3 (2% of the total
volume, unchanged from Wave 2)
Glass Litter Total by Volume
0.009
0.012
0.031
0.010
0.006
0.039
0.008
0.020
0.035
0.000 0.005 0.010 0.015 0.020 0.025 0.030 0.035 0.040 0.045
Alcoholic sodas / spirit-basedmixers, all sizes
Beer, 750ml or more, all coloursof glass
Beer, < 750ml, all colours ofglass
m3
Wave 1 Wave 2 Wave 3

- 61 -
3.9 Dispersion of Litter Across Site Types
Number of items
The litter was counted across differing land areas, designed to capture a
good representation of areas throughout the State.
Highways formed the major catchment sites of the total litter stream,
containing 33% of all litter items. The dispersion of litter amongst the varying
site types in descending order of contribution to the total litter stream, was
as follows:
• Highways (33%, compared to 42% in Wave 2)
• Industrial (16%, compared to 14% in Wave 2)
• Car Park (12%, compared to 11% in Wave 2)
• Retail (12%, compared to 9% in Wave 2)
• Residential (10%, compared to 9% in Wave 2)
• Recreational Park (7%, compared to 8% in Wave 2)
• Beach (7%, compared to 6% in Wave 2)
• Shopping Centre (3%, compared to 2% in Wave 2)
Litter by Site Type
Residential, 10%
Beach, 7%
Industrial, 16%
Car Park, 12%
Shopping Centre, 3%Retail, 12%Recreational Park,
7%
Highway, 33%
Comparing the proportion of sites to the amount of litter that was identified
in each site, shows that highways disproportionately contain a significant
amount of the litter in the total litter stream (see graph overleaf). Residential,

- 62 -
despite it’s strong representation in the number of sites counted (17% or 26
sites), contained just 10% of the total litter counted. Shopping centres were
also under represented in the litter stream, despite covering 9% of the sites,
these sites attributed to 3% of the total litter stream. The significant change
between the two waves, is clearly in the decrease in litter found counted at
highway sites.
Distribution of Litter by Site Type
18%
26%
42%
33%
11%
15%
14%
16%
15%
16%
11%
12%
17%
11%
9%
10%
10%
13%
9%
12%
9%
7%
2%
3%
9%
6%
8%
7%
11%
7%
6%
7%
0% 10% 20% 30% 40% 50% 60% 70% 80% 90% 100%
Site dispersion
Litter dispersion Wave 1
Litter dispersion Wave 2
Litter dispersion Wave 3
Highway Industrial Car Park Residential Retail Shopping Centre Recreational Park Beach

- 63 -
3.10 Volumes
More than half (55%, up from 53% in Wave 2) of the total volume of litter
was found in highway sites. Industrial sites accounted for 23% (compared to
27% in Wave 2) of the volume of litter and residential 9% (compared to 6%
in Wave 2) as the graph displays.
Proportion of Total Volume of Litter by Site Type
Residential, 9%
Beach, 2%
Industrial, 23%
Car park, 5%
Shopping centre, 1%
Retail, 1%
Recreational, 4%
Highway, 55%
There are few significant variances in the volume found at the various site
types.
Distribution of Litter Volume by Site Type Wave Comparison
51%
53%
55%
28%
27%
23%
8%
6%
9%
4%
4%
5%
0%
0%
5%
5%
2%
2%
2%
1%4%
2%
1%
0% 10% 20% 30% 40% 50% 60% 70% 80% 90% 100%
Volume dispersion Wave 1
Volume dispersion Wave 2
Volume dispersion Wave 3
Highway Industrial Residential Car Park Shopping Centre Beach Retail Recreational Park
`
When viewing the proportion of the volume of litter, in comparison to the
number of litter items in the site types, highways and industrial sites are
more voluminous, while shopping centre, retail, car parks and recreational
parks were smaller voluminous sites, as can be seen in the graph below.

- 64 -
Distribution of Litter Items and Volume by Site Type
18%
33%
55%
11%
16%
23%
15%
12%
5%
17%
10%
9%
10%
12%
9%
3%
11%
7%
2%1%
9%
7%
4%
0% 10% 20% 30% 40% 50% 60% 70% 80% 90% 100%
Site dispersion
Litter dispersion Wave 3
Volume dispersion Wave 3
Highway Industrial Car Park Residential Retail Shopping Centre Beach Recreational Park
`
- 65 -
Drink Containers

- 66 -
To enable meaningful comparisons with the other states in the following appendix, Tasmania,
The Northern Territory and The Australian Capital Territory have been almost doubled, i.e. 151
sites divided by 76 (the number of sites Tasmania had counted) totalling 1.987. It is then as if
each area had the 151 sites rather than the 76 counted.
Queensland had more than half of its drink containers counted at highways. Industrial were
also a significant catchment area for drink containers.
QUEENSLAND
Res
iden
tial
Bea
ch
Indu
stria
l
Car
Par
k
Shop
ping
C
entr
e
Ret
ail
Rec
reat
iona
l Pa
rk
Hig
hway
Grand Total
Glass 1 Plain water (carbonated or non-carb.), <1 litre 0 0 3 0 0 0 0 0 3
Glass 2 Flav. water/soft drink (carbonated) <1 litre 0 0 4 0 0 0 4 5 13
Glass 3 Flav.wtr/fruit j. dr/sprts dr, (non-carb), <1 litre 2 0 1 0 0 0 0 2 5
Glass 4 Fruit juice, < 1 litre 0 0 0 0 0 0 0 1 1
Glass 5 Alcoholic sodas / spirit-based mixers, all sizes 3 2 8 1 0 0 0 8 22
Glass 6 Cider/fruit based etc. (glass) 0 0 0 0 0 0 0 0 0
Glass 7 Beer, < 750ml, all colours of glass 6 8 13 5 1 1 0 40 74
Metal 8 Beer, aluminium, all types, all sizes 1 1 16 1 0 2 0 36 57
Metal 9 Cider/fruit based etc. (metal) 0 0 0 0 0 0 1 1 2
Metal 10 Water, carbonated & flavoured/soft drink 11 2 51 5 0 1 13 114 197
Metal 11 Water, non-carbonated & flavoured, all sizes 0 0 0 0 1 0 0 0 1
Plastic 12 Flav. milk, < 1 litre 3 2 23 1 1 1 1 65 97
Plastic 13 Fruit juice< 1 litre 3 0 4 1 1 0 1 6 16
Plastic 14 Plain water (carbonated or non-carb) <1 litre 5 4 19 2 0 0 6 32 68
Plastic 15 Flav. water/soft drink (carbonated) <1 litre 6 3 32 2 0 0 3 93 139
Plastic 16 Flav.wtr/fruit j. dr, sprts dr etc.(non-carb) <1 litre 5 1 9 5 1 1 3 12 37
Paper/ paperboard 17 Cartons, flavoured milk< 1 litre 3 1 12 0 0 0 0 25 41
Paper/ paperboard 18 Flav. water/fruit j. drink/sports drink, non-carb, <1 litre 1 0 1 0 0 0 0 5 7
Paper/ paperboard 19 Cartons, fruit juice, < 1 litre 0 0 1 1 0 0 0 4 6
Drink Containers 49 24 197 24 5 6 32 449 786
6% 3% 25% 3% 1% 1% 4% 57% 100%
Location of Drink Container Litter Items Queensland Wave 3
0%
10%
20%
30%
40%
50%
60%
70%
80%
90%
Residential Beach Industrial Car Park Shopping Centre Retail Recreational Park Highway

- 67 -
Location of Drink ContainersWave 3
0%
10%
20%
30%
40%
50%
60%
70%
80%
Residential Beach Industrial Car Park Shopping Centre Retail Recreational Park Highway
VICNSWSAWATASQLDNTACT
- 68 -
Data Summary Number of Items

- 69 -
QLD Wave 3 LITTER CATEGORY x SITE TYPE
RES
IDEN
TIA
L
BEA
CH
IND
UST
RIA
L
CA
R P
AR
K
SHO
PPIN
G C
ENTR
E
RET
AIL
REC
REA
TIO
NA
L PA
RK
HIG
HW
AY
METROPOLITAN
REGIONAL GRAND
TOTAL
TYPE LITTER TYPEGLASS Plain water (carbonated or non-carb.), 1 litre+ 0 0 0 0 0 0 1 0 1 0 1GLASS Plain water (carbonated or non-carb.), <1 litre 0 0 3 0 0 0 0 0 3 0 3GLASS Flav. water/soft drink (carbonated) 1 litre+ 0 0 0 0 0 0 0 0 0 0 0GLASS Flav. water/soft drink (carbonated) <1 litre 0 0 4 0 0 0 4 5 12 1 13GLASS Flav.wtr/fruit j. dr/sprts dr, (non-carb), 1 litre+ 0 0 0 0 0 0 0 0 0 0 0GLASS Flav.wtr/fruit j. dr/sprts dr, (non-carb), <1 litre 2 0 1 0 0 0 0 2 4 1 5GLASS Fruit juice, 1 litre or more 0 0 0 0 0 0 0 0 0 0 0GLASS Fruit juice, < 1 litre 0 0 0 0 0 0 0 1 1 0 1GLASS Wine cooler, all sizes 0 0 0 0 0 0 0 4 0 4 4GLASS Alcoholic sodas / spirit-based mixers, all sizes 3 2 8 1 0 0 0 8 22 0 22GLASS Cider/fruit based etc. 0 0 0 0 0 0 0 0 0 0 0GLASS Wine & spirit, all sizes 0 0 1 1 0 0 0 0 2 0 2GLASS Beer, 750ml or more, all colours of glass 0 2 2 0 0 0 0 21 5 20 25GLASS Beer, < 750ml, all colours of glass 6 8 13 5 1 1 0 40 50 24 74GLASS Other glass 17 3 18 16 0 2 8 39 83 20 103
GLASS Total 28 15 50 23 1 3 13 120 183 70 253
METAL Beer, aluminium, all types, all sizes 1 1 16 1 0 2 0 36 29 28 57METAL Alcoholic sodas & spirit-based mixers 1 9 12 3 0 1 4 67 58 39 97METAL Cider/fruit based etc. 0 0 0 0 0 0 1 1 1 1 2METAL Water, carbonated & flavoured/soft drink 11 2 51 5 0 1 13 114 112 85 197METAL Water, non-carbonated & flavoured, all sizes 0 0 0 0 1 0 0 0 1 0 1METAL Food cans (including pet food) 1 0 1 0 0 0 0 5 5 2 7METAL Industrial cans - all types 0 0 0 0 0 0 0 2 1 1 2METAL Aerosols – pressure packs 0 0 0 0 0 0 0 1 1 0 1METAL Metal bottle tops and can pull rings 21 15 29 75 1 13 50 68 186 86 272METAL Metal pieces 12 1 17 16 2 0 4 51 64 39 103METAL Foil take away 5 0 17 0 0 0 1 11 32 2 34METAL Other foil 49 30 88 26 13 13 19 77 265 50 315
METAL Total 101 58 231 126 17 30 92 433 755 333 1088
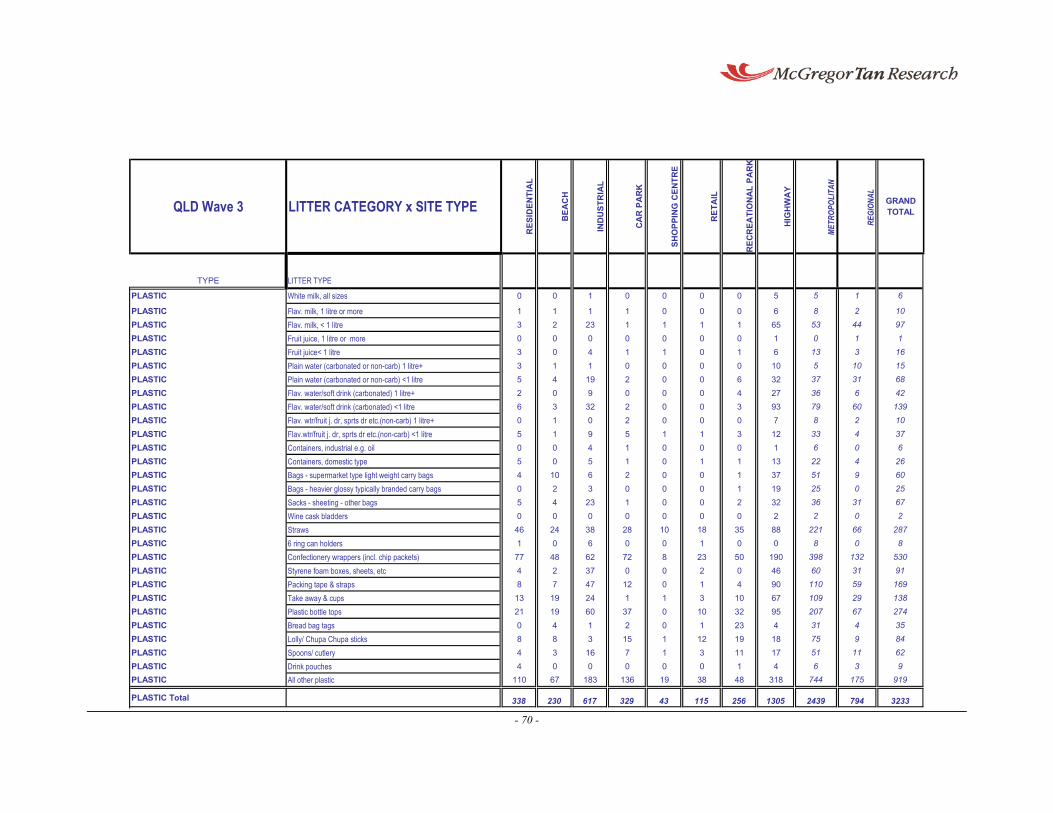
- 70 -
QLD Wave 3 LITTER CATEGORY x SITE TYPE
RES
IDEN
TIA
L
BEA
CH
IND
UST
RIA
L
CA
R P
AR
K
SHO
PPIN
G C
ENTR
E
RET
AIL
REC
REA
TIO
NA
L PA
RK
HIG
HW
AY
METROPOLITAN
REGIONAL GRAND
TOTAL
TYPE LITTER TYPE
PLASTIC White milk, all sizes 0 0 1 0 0 0 0 5 5 1 6
PLASTIC Flav. milk, 1 litre or more 1 1 1 1 0 0 0 6 8 2 10PLASTIC Flav. milk, < 1 litre 3 2 23 1 1 1 1 65 53 44 97PLASTIC Fruit juice, 1 litre or more 0 0 0 0 0 0 0 1 0 1 1PLASTIC Fruit juice< 1 litre 3 0 4 1 1 0 1 6 13 3 16PLASTIC Plain water (carbonated or non-carb) 1 litre+ 3 1 1 0 0 0 0 10 5 10 15PLASTIC Plain water (carbonated or non-carb) <1 litre 5 4 19 2 0 0 6 32 37 31 68PLASTIC Flav. water/soft drink (carbonated) 1 litre+ 2 0 9 0 0 0 4 27 36 6 42PLASTIC Flav. water/soft drink (carbonated) <1 litre 6 3 32 2 0 0 3 93 79 60 139PLASTIC Flav. wtr/fruit j. dr, sprts dr etc.(non-carb) 1 litre+ 0 1 0 2 0 0 0 7 8 2 10PLASTIC Flav.wtr/fruit j. dr, sprts dr etc.(non-carb) <1 litre 5 1 9 5 1 1 3 12 33 4 37PLASTIC Containers, industrial e.g. oil 0 0 4 1 0 0 0 1 6 0 6PLASTIC Containers, domestic type 5 0 5 1 0 1 1 13 22 4 26PLASTIC Bags - supermarket type light weight carry bags 4 10 6 2 0 0 1 37 51 9 60PLASTIC Bags - heavier glossy typically branded carry bags 0 2 3 0 0 0 1 19 25 0 25PLASTIC Sacks - sheeting - other bags 5 4 23 1 0 0 2 32 36 31 67PLASTIC Wine cask bladders 0 0 0 0 0 0 0 2 2 0 2PLASTIC Straws 46 24 38 28 10 18 35 88 221 66 287PLASTIC 6 ring can holders 1 0 6 0 0 1 0 0 8 0 8PLASTIC Confectionery wrappers (incl. chip packets) 77 48 62 72 8 23 50 190 398 132 530PLASTIC Styrene foam boxes, sheets, etc 4 2 37 0 0 2 0 46 60 31 91PLASTIC Packing tape & straps 8 7 47 12 0 1 4 90 110 59 169PLASTIC Take away & cups 13 19 24 1 1 3 10 67 109 29 138PLASTIC Plastic bottle tops 21 19 60 37 0 10 32 95 207 67 274PLASTIC Bread bag tags 0 4 1 2 0 1 23 4 31 4 35PLASTIC Lolly/ Chupa Chupa sticks 8 8 3 15 1 12 19 18 75 9 84PLASTIC Spoons/ cutlery 4 3 16 7 1 3 11 17 51 11 62PLASTIC Drink pouches 4 0 0 0 0 0 1 4 6 3 9PLASTIC All other plastic 110 67 183 136 19 38 48 318 744 175 919
PLASTIC Total 338 230 617 329 43 115 256 1305 2439 794 3233

- 71 -
QLD Wave 3 LITTER CATEGORY x SITE TYPE
RES
IDEN
TIA
L
BEA
CH
IND
UST
RIA
L
CA
R P
AR
K
SHO
PPIN
G C
ENTR
E
RET
AIL
REC
REA
TIO
NA
L PA
RK
HIG
HW
AY
METROPOLITAN
REGIONAL GRAND
TOTAL
TYPE LITTER TYPEPAPER/PAPERBOARD Packages & boxes 2 0 28 0 1 1 3 53 65 23 88PAPER/PAPERBOARD Cigarette packets 20 0 36 8 1 1 3 128 141 56 197PAPER/PAPERBOARD Cartons, milk, plain (white) all sizes 0 0 3 0 0 0 0 3 6 0 6PAPER/PAPERBOARD Cartons, flavoured milk1 litre or more 0 0 0 0 0 0 0 0 0 0 0PAPER/PAPERBOARD Cartons, flavoured milk< 1 litre 3 1 12 0 0 0 0 25 33 8 41PAPER/PAPERBOARD Flav. water / fruit j. drink/ sports drink, (non-carb), 1 litre+ 0 0 0 0 0 0 0 0 0 0 0PAPER/PAPERBOARD Flav. water/fruit j. drink/sports drink, non-carb, <1 litre 1 0 1 0 0 0 0 5 5 2 7PAPER/PAPERBOARD Fruit juice, 1 litre or more 0 0 0 0 0 0 0 0 0 0 0PAPER/PAPERBOARD Cartons, fruit juice, < 1 litre 0 0 1 1 0 0 0 4 6 0 6PAPER/PAPERBOARD Newspapers & magazines 22 1 24 1 0 3 0 48 89 10 99PAPER/PAPERBOARD Junk mail / free circulars 31 1 5 4 4 2 0 58 94 11 105PAPER/PAPERBOARD Cups/take away containers 14 3 25 17 6 0 5 158 196 32 228PAPER/PAPERBOARD Tickets, e.g. bus, ATM, vending machine etc. 12 0 4 4 4 5 3 14 33 13 46PAPER/PAPERBOARD Ice cream wrappers 12 12 9 0 1 5 5 22 47 19 66PAPER/PAPERBOARD Paper bags 5 3 45 9 1 4 4 43 87 27 114PAPER/PAPERBOARD Shopper dockets & related shopping paper (eg, lists) 20 5 5 13 11 18 4 17 65 28 93PAPER/PAPERBOARD Other paper (including tissues) 306 110 352 153 60 228 101 601 1567 344 1911
PAPER/PAPERBOARD Total 448 136 550 210 89 267 128 1179 2434 573 3007
MISCELLANEOUS Tyres & pieces 0 0 2 2 0 0 0 66 25 45 70MISCELLANEOUS Clothing & materials 5 13 29 3 2 4 7 68 88 43 131MISCELLANEOUS Illegal dumping 0 0 0 0 0 0 1 1 1 1 2MISCELLANEOUS Syringes 0 1 0 0 0 0 0 0 1 0 1MISCELLANEOUS Ice cream sticks 5 7 3 10 0 10 13 12 51 9 60MISCELLANEOUS Rubber pieces (not tyres) 5 8 16 28 0 4 9 44 64 50 114MISCELLANEOUS Condoms 0 0 2 0 0 0 0 0 2 0 2MISCELLANEOUS Construction materials 0 1 18 1 0 0 0 38 41 17 58MISCELLANEOUS Disposable nappies 0 1 0 1 0 0 0 1 3 0 3MISCELLANEOUS Other miscellaneous 20 15 19 29 85 12 14 44 213 25 238
MISCELLANEOUS Total 35 46 89 74 87 30 44 274 489 190 679
CIGARETTE BUTTS Total 656 623 1200 1275 297 1599 599 2124 6408 1965 8373
Grand Total 1606 1108 2737 2037 534 2044 1132 5435 12708 3925 16633

- 72 -
Data Summary Volumes

- 73 -
LITTER CATEGORY x SITE TYPE
RES
IDEN
TIA
L
BEA
CH
IND
UST
RIA
L
CA
R P
AR
K
SHO
PPIN
G C
ENTR
E
RET
AIL
REC
REA
TIO
NA
L PA
RK
HIG
HW
AY
METROPOLITAN
REGIONAL GRAND
TOTAL
TYPE LITTER TYPEGLASS Plain water (carbonated or non-carb.), 1 litre+ 0.000 0.000 0.000 0.000 0.000 0.000 0.001 0.000 0.001 0.000 0.001GLASS Plain water (carbonated or non-carb.), <1 litre 0.000 0.000 0.001 0.000 0.000 0.000 0.000 0.000 0.001 0.000 0.001GLASS Flav. water/soft drink (carbonated) 1 litre+ 0.000 0.000 0.000 0.000 0.000 0.000 0.000 0.000 0.000 0.000 0.000GLASS Flav. water/soft drink (carbonated) <1 litre 0.000 0.000 0.001 0.000 0.000 0.000 0.001 0.002 0.004 0.000 0.004GLASS Flav.wtr/fruit j. dr/sprts dr, (non-carb), 1 litre+ 0.000 0.000 0.000 0.000 0.000 0.000 0.000 0.000 0.000 0.000 0.000GLASS Flav.wtr/fruit j. dr/sprts dr, (non-carb), <1 litre 0.002 0.000 0.001 0.000 0.000 0.000 0.000 0.002 0.003 0.001 0.004GLASS Fruit juice, 1 litre or more 0.000 0.000 0.000 0.000 0.000 0.000 0.000 0.000 0.000 0.000 0.000GLASS Fruit juice, < 1 litre 0.000 0.000 0.000 0.000 0.000 0.000 0.000 0.000 0.000 0.000 0.000GLASS Wine cooler, all sizes 0.000 0.000 0.000 0.000 0.000 0.000 0.000 0.001 0.000 0.001 0.001GLASS Alcoholic sodas / spirit-based mixers, all sizes 0.001 0.001 0.003 0.000 0.000 0.000 0.000 0.003 0.008 0.000 0.008GLASS Cider/fruit based etc. 0.000 0.000 0.000 0.000 0.000 0.000 0.000 0.000 0.000 0.000 0.000GLASS Wine & spirit, all sizes 0.000 0.000 0.001 0.001 0.000 0.000 0.000 0.000 0.002 0.000 0.002GLASS Beer, 750ml or more, all colours of glass 0.000 0.002 0.002 0.000 0.000 0.000 0.000 0.017 0.004 0.016 0.020GLASS Beer, < 750ml, all colours of glass 0.003 0.004 0.006 0.002 0.000 0.000 0.000 0.019 0.024 0.012 0.035GLASS Other glass 0.000 0.000 0.000 0.000 0.000 0.000 0.000 0.001 0.002 0.000 0.002
GLASS Total 0.006 0.006 0.015 0.004 0.000 0.001 0.002 0.045 0.049 0.031 0.080
METAL Beer, aluminium, all types, all sizes 0.000 0.000 0.007 0.000 0.000 0.001 0.000 0.016 0.013 0.012 0.025METAL Alcoholic sodas & spirit-based mixers 0.001 0.005 0.007 0.002 0.000 0.001 0.002 0.038 0.033 0.022 0.055METAL Cider/fruit based etc. 0.000 0.000 0.000 0.000 0.000 0.000 0.000 0.000 0.000 0.000 0.001METAL Water, carbonated & flavoured/soft drink 0.005 0.001 0.022 0.002 0.000 0.000 0.006 0.049 0.048 0.037 0.085METAL Water, non-carbonated & flavoured, all sizes 0.000 0.000 0.000 0.000 0.000 0.000 0.000 0.000 0.000 0.000 0.000METAL Food cans (including pet food) 0.000 0.000 0.000 0.000 0.000 0.000 0.000 0.002 0.002 0.001 0.003METAL Industrial cans - all types 0.000 0.000 0.000 0.000 0.000 0.000 0.000 0.009 0.005 0.005 0.009METAL Aerosols – pressure packs 0.000 0.000 0.000 0.000 0.000 0.000 0.000 0.001 0.001 0.000 0.001METAL Metal bottle tops and can pull rings 0.000 0.000 0.000 0.000 0.000 0.000 0.000 0.000 0.001 0.000 0.001METAL Metal pieces 0.000 0.000 0.000 0.000 0.000 0.000 0.000 0.001 0.001 0.000 0.001METAL Foil take away 0.002 0.000 0.008 0.000 0.000 0.000 0.000 0.005 0.015 0.001 0.016METAL Other foil 0.000 0.000 0.000 0.000 0.000 0.000 0.000 0.000 0.000 0.000 0.000
METAL Total 0.009 0.006 0.044 0.005 0.000 0.002 0.009 0.121 0.118 0.078 0.197
QLD Wave 3 - Volumes m3

- 74 -
LITTER CATEGORY x SITE TYPE
RES
IDEN
TIA
L
BEA
CH
IND
UST
RIA
L
CA
R P
AR
K
SHO
PPIN
G C
ENTR
E
RET
AIL
REC
REA
TIO
NA
L PA
RK
HIG
HW
AY
METROPOLITAN
REGIONAL GRAND
TOTAL
TYPE LITTER TYPE
PLASTIC White milk, all sizes 0.000 0.000 0.002 0.000 0.000 0.000 0.000 0.011 0.011 0.002 0.013
PLASTIC Flav. milk, 1 litre or more 0.002 0.002 0.002 0.002 0.000 0.000 0.000 0.013 0.017 0.004 0.021PLASTIC Flav. milk, < 1 litre 0.002 0.001 0.012 0.001 0.001 0.001 0.001 0.035 0.028 0.023 0.052PLASTIC Fruit juice, 1 litre or more 0.000 0.000 0.000 0.000 0.000 0.000 0.000 0.002 0.000 0.002 0.002PLASTIC Fruit juice< 1 litre 0.002 0.000 0.002 0.001 0.001 0.000 0.001 0.003 0.007 0.002 0.009PLASTIC Plain water (carbonated or non-carb) 1 litre+ 0.005 0.002 0.002 0.000 0.000 0.000 0.000 0.015 0.008 0.015 0.023PLASTIC Plain water (carbonated or non-carb) <1 litre 0.004 0.003 0.015 0.002 0.000 0.000 0.005 0.025 0.029 0.024 0.054PLASTIC Flav. water/soft drink (carbonated) 1 litre+ 0.003 0.000 0.015 0.000 0.000 0.000 0.007 0.045 0.060 0.010 0.069PLASTIC Flav. water/soft drink (carbonated) <1 litre 0.004 0.002 0.020 0.001 0.000 0.000 0.002 0.058 0.049 0.037 0.086PLASTIC Flav. wtr/fruit j. dr, sprts dr etc.(non-carb) 1 litre+ 0.000 0.002 0.000 0.003 0.000 0.000 0.000 0.012 0.013 0.003 0.017PLASTIC Flav.wtr/fruit j. dr, sprts dr etc.(non-carb) <1 litre 0.003 0.001 0.005 0.003 0.001 0.001 0.002 0.007 0.018 0.002 0.021PLASTIC Containers, industrial e.g. oil 0.000 0.000 0.090 0.022 0.000 0.000 0.000 0.022 0.135 0.000 0.135PLASTIC Containers, domestic type 0.042 0.000 0.042 0.008 0.000 0.008 0.008 0.108 0.183 0.033 0.216PLASTIC Bags - light weight plastic shopping type carry bags 0.000 0.000 0.000 0.000 0.000 0.000 0.000 0.001 0.002 0.000 0.002PLASTIC Bags - heavier glossy typically branded carry bags 0.000 0.000 0.000 0.000 0.000 0.000 0.000 0.002 0.002 0.000 0.002PLASTIC Sacks - sheeting - other bags 0.000 0.000 0.000 0.000 0.000 0.000 0.000 0.000 0.000 0.000 0.000PLASTIC Wine cask bladders 0.000 0.000 0.000 0.000 0.000 0.000 0.000 0.001 0.001 0.000 0.001PLASTIC Straws 0.000 0.000 0.000 0.000 0.000 0.000 0.000 0.000 0.001 0.000 0.001PLASTIC 6 ring can holders 0.000 0.000 0.000 0.000 0.000 0.000 0.000 0.000 0.000 0.000 0.000PLASTIC Snack bags and confectionery wrappers 0.001 0.000 0.000 0.001 0.000 0.000 0.000 0.001 0.003 0.001 0.004PLASTIC Styrene foam boxes, sheets, etc 0.000 0.000 0.001 0.000 0.000 0.000 0.000 0.002 0.002 0.001 0.003PLASTIC Packing tape & straps 0.000 0.000 0.000 0.000 0.000 0.000 0.000 0.000 0.000 0.000 0.000PLASTIC Take away & cups 0.003 0.004 0.005 0.000 0.000 0.001 0.002 0.014 0.023 0.006 0.029PLASTIC Plastic bottle tops 0.000 0.000 0.000 0.000 0.000 0.000 0.000 0.001 0.002 0.001 0.002PLASTIC Bread bag tags 0.000 0.000 0.000 0.000 0.000 0.000 0.000 0.000 0.000 0.000 0.000PLASTIC Lollipop sticks 0.000 0.000 0.000 0.000 0.000 0.000 0.000 0.000 0.000 0.000 0.000PLASTIC Spoons/ cutlery 0.000 0.000 0.000 0.000 0.000 0.000 0.000 0.000 0.000 0.000 0.001PLASTIC Drink pouches 0.000 0.000 0.000 0.000 0.000 0.000 0.000 0.000 0.001 0.000 0.001PLASTIC All other plastic 0.000 0.000 0.000 0.000 0.000 0.000 0.000 0.000 0.001 0.000 0.001
PLASTIC Total 0.070 0.017 0.215 0.044 0.002 0.011 0.028 0.379 0.595 0.169 0.765
Wave 3 - Volumes m3

- 75 -
LITTER CATEGORY x SITE TYPE
RES
IDEN
TIA
L
BEA
CH
IND
UST
RIA
L
CA
R P
AR
K
SHO
PPIN
G C
ENTR
E
RET
AIL
REC
REA
TIO
NA
L PA
RK
HIG
HW
AY
METROPOLITAN
REGIONAL GRAND
TOTAL
TYPE LITTER TYPE
PAPER/PAPERBOARD Packages & boxes 0.000 0.000 0.002 0.000 0.000 0.000 0.000 0.004 0.005 0.002 0.007PAPER/PAPERBOARD Cigarette packets 0.004 0.000 0.008 0.002 0.000 0.000 0.001 0.028 0.031 0.012 0.043PAPER/PAPERBOARD Cartons, milk, plain (white) all sizes 0.000 0.000 0.003 0.000 0.000 0.000 0.000 0.003 0.006 0.000 0.006PAPER/PAPERBOARD Cartons, flavoured milk1 litre or more 0.000 0.000 0.000 0.000 0.000 0.000 0.000 0.000 0.000 0.000 0.000PAPER/PAPERBOARD Cartons, flavoured milk< 1 litre 0.002 0.001 0.009 0.000 0.000 0.000 0.000 0.019 0.025 0.006 0.031PAPER/PAPERBOARD Flav. water / fruit j. drink/ sports drink, (non-carb), 1 litre+ 0.000 0.000 0.000 0.000 0.000 0.000 0.000 0.000 0.000 0.000 0.000PAPER/PAPERBOARD Flav. water/fruit j. drink/sports drink, non-carb, <1 litre 0.000 0.000 0.000 0.000 0.000 0.000 0.000 0.001 0.001 0.001 0.002PAPER/PAPERBOARD Fruit juice, 1 litre or more 0.000 0.000 0.000 0.000 0.000 0.000 0.000 0.000 0.000 0.000 0.000PAPER/PAPERBOARD Cartons, fruit juice, < 1 litre 0.000 0.000 0.001 0.001 0.000 0.000 0.000 0.002 0.004 0.000 0.004PAPER/PAPERBOARD Newspapers & magazines 0.026 0.001 0.028 0.001 0.000 0.004 0.000 0.057 0.105 0.012 0.117PAPER/PAPERBOARD Junk mail / free circulars 0.005 0.000 0.001 0.001 0.001 0.000 0.000 0.010 0.016 0.002 0.018PAPER/PAPERBOARD Cups/take away containers 0.010 0.002 0.018 0.012 0.004 0.000 0.004 0.115 0.143 0.023 0.166PAPER/PAPERBOARD Tickets, e.g. bus, ATM, vending machine etc. 0.000 0.000 0.000 0.000 0.000 0.000 0.000 0.000 0.000 0.000 0.000PAPER/PAPERBOARD Ice cream wrappers 0.000 0.000 0.000 0.000 0.000 0.000 0.000 0.000 0.000 0.000 0.000PAPER/PAPERBOARD Paper bags 0.000 0.000 0.000 0.000 0.000 0.000 0.000 0.000 0.001 0.000 0.001PAPER/PAPERBOARD Shopper dockets & related shopping paper (eg, lists) 0.000 0.000 0.000 0.000 0.000 0.000 0.000 0.000 0.000 0.000 0.000PAPER/PAPERBOARD Other paper (including tissues) 0.001 0.000 0.001 0.001 0.000 0.001 0.000 0.002 0.005 0.001 0.006
PAPER/PAPERBOARD Total 0.050 0.005 0.072 0.017 0.006 0.005 0.005 0.242 0.343 0.059 0.402
MISCELLANEOUS Tyres & pieces 0.000 0.000 0.000 0.000 0.000 0.000 0.000 0.015 0.006 0.010 0.016MISCELLANEOUS Clothing & materials 0.000 0.000 0.000 0.000 0.000 0.000 0.000 0.001 0.001 0.001 0.002MISCELLANEOUS Illegal dumping 0.000 0.000 0.000 0.000 0.000 0.000 0.024 0.024 0.024 0.024 0.048MISCELLANEOUS Syringes 0.000 0.000 0.000 0.000 0.000 0.000 0.000 0.000 0.000 0.000 0.000MISCELLANEOUS Ice cream sticks 0.000 0.000 0.000 0.000 0.000 0.000 0.000 0.000 0.000 0.000 0.000MISCELLANEOUS Rubber pieces (not tyres) 0.000 0.000 0.000 0.000 0.000 0.000 0.000 0.000 0.000 0.000 0.000MISCELLANEOUS Condoms 0.000 0.000 0.000 0.000 0.000 0.000 0.000 0.000 0.000 0.000 0.000MISCELLANEOUS Construction materials 0.000 0.000 0.006 0.000 0.000 0.000 0.000 0.014 0.015 0.006 0.021MISCELLANEOUS Disposable nappies 0.000 0.001 0.000 0.001 0.000 0.000 0.000 0.001 0.003 0.000 0.003MISCELLANEOUS Other miscellaneous 0.000 0.000 0.000 0.000 0.001 0.000 0.000 0.001 0.003 0.000 0.003
MISCELLANEOUS Total 0.000 0.002 0.008 0.002 0.001 0.000 0.024 0.055 0.052 0.041 0.093
CIGARETTE BUTTS Total 0.000 0.000 0.000 0.000 0.000 0.000 0.000 0.000 0.000 0.000 0.00010
Grand Total 0.135 0.037 0.354 0.073 0.010 0.018 0.068 0.842 1.158 0.379 1.536
Wave 3 - Volumes m3

- 76 -
Appendix 1: Data Collection Form
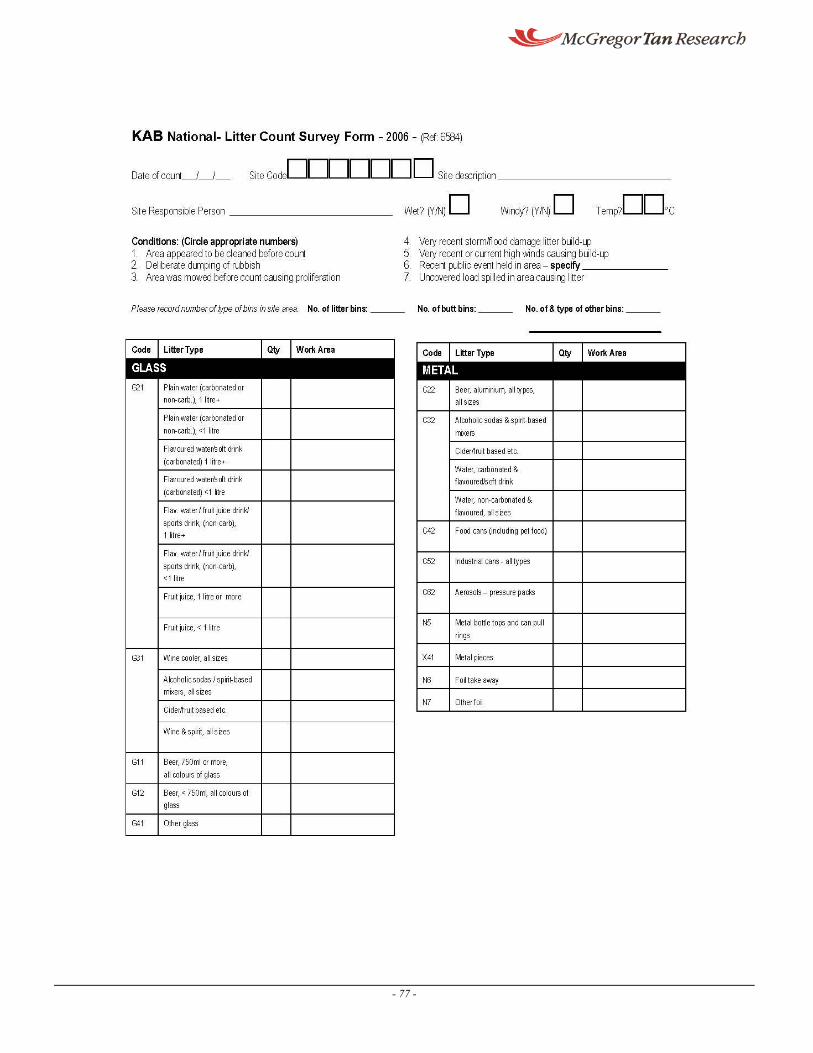
- 77 -

- 78 -