strategies for reducing industrial ... - schneider electric · building footprint consists of...
TRANSCRIPT

Executive summary Over 5% of the 3.35 Billion square foot US federal
government building footprint consists of “industrial
facilities” used for production or manufacturing. These
facilities are often inefficient and waste energy. The
inherent energy-related process problems are fixable
and solutions are affordable. However, a pragmatic
approach must be adopted to address the cultural,
technical, and financial challenges. This paper reviews
proven strategies for overcoming these obstacles.
by Robb Dussault, PEM and Colonel (retired) Douglas P. Wise

Strategies for Reducing Industrial Process Energy Waste in Federal Facilities
Schneider Electric White Paper Revision 0 Page 2
The federal government spends over $7 Billion each year1 on energy to power its facilities.
This energy feeds a huge footprint of 3.35 Billion square feet across nearly 400,000 diverse
buildings and helps ensure the mission effectiveness of over 100 agencies. By comparison,
Wal-Mart of America supports approximately 8,500 buildings representing a total of 589
Million square feet. According to the Government Accountability Office (GAO), much of the
federal portfolio reflects an infrastructure based on the business model and technological
environment of the 1950s2 and is therefore inefficient and costly to maintain.
In the domain of federal government facility energy management, low hanging fruit such as
office building lighting, HVAC, and domestic water systems have already been optimized. The
new frontier for further improvement will be blazed by agencies and departments prepared to
take on depots, maintenance facilities, and industrial sites. With an industrial facility footprint
of over 130 Million square feet and energy intensity as high as 100 times the average
commercial building, the potential for positive energy savings and accompanying greenhouse
gas emissions reductions in these buildings is significant.
Surprisingly, the greatest hurdle to achieving higher energy efficiency at these sites will not
be technical, but will be cultural and financial. To break down the built-in energy waste and
ease cost frustrations, strategies must involve three fundamental elements:
1. Tailored methods of measuring, monitoring and reporting energy use
2. Leveraging data as actionable intelligence to make decisions and predict outcomes
3. Innovative approaches to funding projects.
This paper identifies key drivers and common barriers to addressing energy waste within
federal facility industrial processes and offers proven strategies to reduce that waste without
sacrificing quality of output.
Recognition that opportunities exist to foster process energy consumption reduction in federal
industrial facilities is one issue. Successful deployment of an efficiency improvement program
is another question. Several fundamental barriers must be overcome in order to foster real
process energy management changes. Like most successful initiatives, it takes a top-down
approach that begins with awareness and which introduces elements that enable cultural
change as well as a shift from traditional financial and operational paradigms.
The paragraphs below identify common barriers and offer strategies for overcoming those
barriers.
Barrier: Organizational structures
Most energy managers come from a mechanical or facilities management background. They
may not have been given the authority to influence process change and may not have it
defined within their scope of work. Oftentimes energy and facilities managers report through
a different hierarchy than do process managers.
Strategy: Create visible inertia
If energy objectives are established at the highest leadership levels (as they often are), the
organization will need to create a sense of urgency that is felt at the plant level. The energy
manager can help this cause through visibility and reporting. Establishing easily understood
1 Presentation by Cynthia Vallina, OMB/EOB, “Managing Sustainability through OMB Scorecard”, GovEnergy 2011, Aug 2011
2 US Government Accountability Office High Risk Series: Federal Real Property Jan 1 2003.
Introduction
Overcoming program deployment barriers
“The new frontier for further improvement will be blazed by agencies and departments prepared to take on depots, maintenance facilities, and industrial sites.”
Strategies for Reducing Industrial Process Energy Waste in Federal Facilities
Schneider Electric White Paper Revision 0 Page 3
energy performance indicators (EnPIs), setting achievable objectives against these
indicators, and making progress visible helps build an energy “culture” that changes behavior.
Larger departments can standardize EnPIs across the enterprise to enable comparison
between facilities, creating a basis for cross-business challenges and best practice
exchange.
Barrier: ROI expectations
Manufacturing organizations are accustomed to capital equipment payback periods of 18 -24
months which can easily be demonstrated through increased production throughput or
reduction in labor hours. Rate of return on energy projects, in contrast, require special
considerations to be able to justify investments
Strategy: Link energy efficiency to gains in production efficiency
Process-related energy efficiency initiatives can be linked to overall gains in production
efficiency. Equipment that runs less often and at slower speeds, for example, will tend to
break down less and cause fewer unplanned work stoppages. Less usage implies less cost.
Process audits can determine if some machines are needlessly running at certain times of the
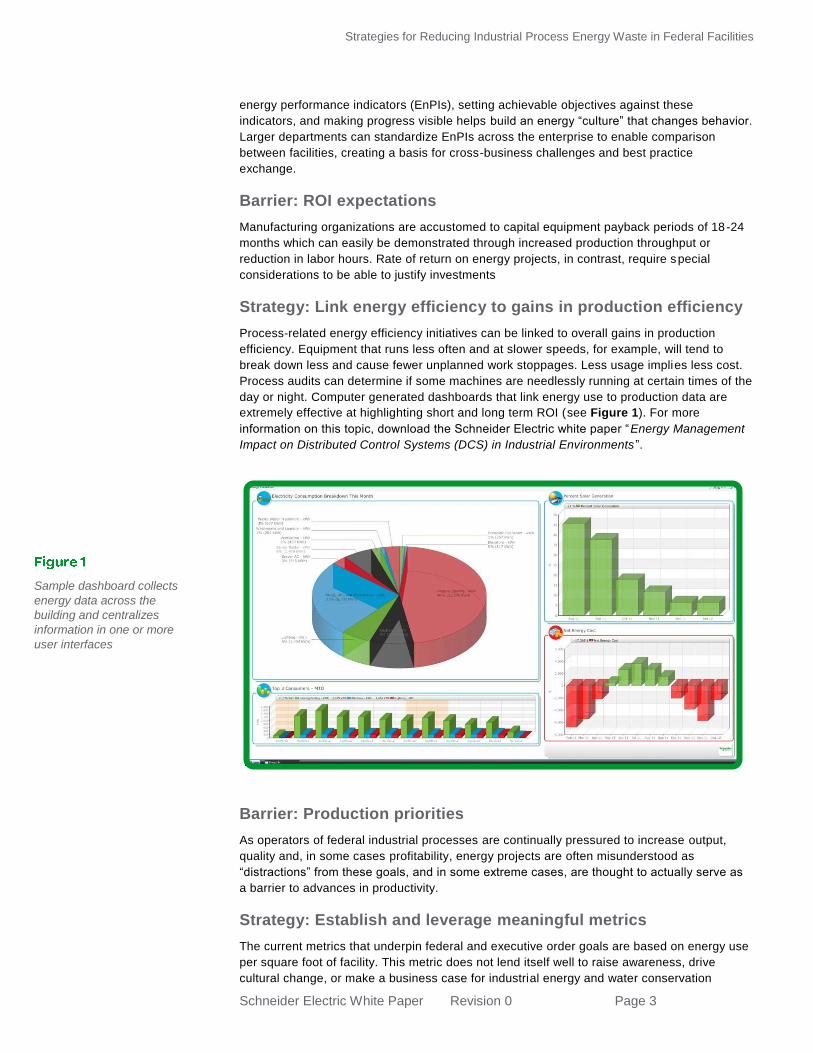
day or night. Computer generated dashboards that link energy use to production data are
extremely effective at highlighting short and long term ROI (see Figure 1). For more
information on this topic, download the Schneider Electric white paper “Energy Management
Impact on Distributed Control Systems (DCS) in Industrial Environments ”.
Barrier: Production priorities
As operators of federal industrial processes are continually pressured to increase output,
quality and, in some cases profitability, energy projects are often misunderstood as
“distractions” from these goals, and in some extreme cases, are thought to actually serve as
a barrier to advances in productivity.
Strategy: Establish and leverage meaningful metrics
The current metrics that underpin federal and executive order goals are based on energy use
per square foot of facility. This metric does not lend itself well to raise awareness, drive
cultural change, or make a business case for industrial energy and water conservation
Sample dashboard collects
energy data across the
building and centralizes
information in one or more
user interfaces

Strategies for Reducing Industrial Process Energy Waste in Federal Facilities
Schneider Electric White Paper Revision 0 Page 4
investment. A suggested metric to help focus industrial energy and water conservation efforts
is one that is based on dollar cost per unit of industrial output. This metric can help drive
conservation and efficiencies across all product lines within the industrial sector and help
substantiate many energy and water conservation projects.
Metrics such as KWh per widget, per gallon or per ton are how typical production materials
and labor are measured. The same concept applies to energy. Meter data and production
data, already available in Supervisory Control and Data Acquisition (SCADA) systems or
production databases, are linked together. In the composite processing operation example
depicted in Figure 2, energy is expressed in kWh per ton of material produced.
With the view in Figure 2, the energy manager can quickly and easily detect a problem which
would not normally be apparent using standard energy metrics. In the case of Figure 2, more
energy is being consumed, per ton of material produced, for the past 2 weeks than in weeks
prior. The site‟s overall energy may actually be lower over this time period because
production rates are lower, which would have normally prohibited this problem from being
detected until the end of the fiscal year. With the view in Figure 2, the problem is immediately
apparent. The energy manager can quickly diagnose issues using similar graphs to detect
energy use by raw material source, work crew, or any other process variable.
Barrier: Lack of visibility into process energy usage
As the old saying goes, “You can‟t manage what you don‟t measure.” Many sites lack proper
metering and visualization tools. Other sites or individual buildings may be metered, but they
lack the granularity necessary to pinpoint specific process inefficiencies within the larger
scale production.
Strategy: Meter and Audit
Data is required to substantiate the fact that energy and water conservation is needed. A
simple way to collect this data is to expand the implementation of facility audits and
installation of meters. Meter installation will allow the accurate collection of energy usage
within specific industrial areas to help determine opportunities with the highest ROI. This
Figure 2 Operational level dashboard
displaying energy in the
context of production output
Strategies for Reducing Industrial Process Energy Waste in Federal Facilities
Schneider Electric White Paper Revision 0 Page 5
includes audits and metering of major industrial processes. Focused industrial audits will
standardize identification of energy and water conservation opportunities.
Installing meters and providing operators and stakeholders with visibility into energy usage,
has proven to drive behavior change and can generate savings. This is attr ibuted to the
“Hawthorne Effect,” a phenomenon whereby individual behaviors may be altered as a result
of the individuals knowing that they are being studied. These savings quickly erode if the
individuals realize that the meter data is not being used. To maximize energy savings, the
meter data must be used to drive action.
Barrier: Budget constraints
Federal budgets operate at many levels and most have limitations and restrictions on how
much can be spent on facilities, infrastructure, and equipment. Under some circumstances,
leadership can interpret efforts to improve energy and water conservation as contradictory to
their mission of providing products to their customers (i.e., energy and water conservation
efforts will only slow down their throughput of mission-critical assets). In addition there is the
impact of sequestration, which, when enacted in March 2013 resulted in 7% across the board
cuts to federal discretionary funding (which represents approximately $85 Billion in fiscal year
2013 and a total of $1.1 Trillion if it remains in effect through 2021).
Strategy I: Institute a financial line item for energy waste
The financial controller, who is always interested in cost savings, should be enlisted as an
active supporter of energy reduction initiatives and not be viewed as a potential obstacle to
project deployment. A first joint step would be to establish a “line item” for energy waste
within the financial tracking reports. Use the overall efficiency metric from the energy
assessment and apply it to the energy budget. These budget entries should be divided into
two lines: Budget for Energy Used and the Budget for Energy Wasted. The Budget for Energy
Wasted provides not only accounting and management visibility, but becomes a mutual target
for reduction. The energy manager can then propose projects based on ROI standards that
are different from other investments.
Strategy II: Leverage private sector financing The challenge of launching energy initiatives within government organizations and agencies
can best be summarized in the phrase “It takes money to save money.” This paper presents
several strategies and techniques for reducing process energy waste, but most of these
solutions must somehow be funded.
A critical solution to address this issue, in this era of declining discretionary budgets, is to
pursue private sector financing. The federal government has identified several financing
mechanisms associated with infrastructure improvements to help alleviate the capital costs
that are often necessary to realize energy efficiencies. Energy Savings Performance
Contracts (ESPCs) are one such common vehicle. For more information on how these
contracts benefit energy efficiency initiatives, see the Schneider Electric white paper entitled
“Leveraging Performance Contracts to Reduce Process Energy Use in Federal Facilities” .
Utility Energy Service Contracts (UESCs), GSA Schedule 84, and ESPC ENABLE are also
vehicles that have been developed to support and encourage government based energy
efficiency initiatives.
Since the energy crisis of the 1970s, congress and presidents have recognized the need to
curtail energy costs of federal agencies. The goal has been to not only reduce the burden on
American taxpayers, but also to promote environmental stewardship, and to lead the nation
towards energy independence. Over the years, federal policy has continued to expand,
transform, and focus on conservation within federal facilities. Two main pieces of legislation
Key driver for change: Consumption targets
“The federal government has identified several financing mechanisms associated with infrastructure improvements to help alleviate the capital costs that are often necessary to realize energy efficiencies.”

Strategies for Reducing Industrial Process Energy Waste in Federal Facilities
Schneider Electric White Paper Revision 0 Page 6
drive energy and water conservation in federal facilities: the Energy Independence and
Security Act (EISA) of 2007 and Presidential Executive Order (EO) 13514. Table 1 below
highlights some of the key requirements of these two policies. For more information on these
and other policy drivers see the Schneider Electric white paper, “Enacting an Energy
Management Lifecycle Approach in Federal Facilities”.
Despite multiple efforts and projects, government facilities have only achieved 21% of the
EISA 2007 target as of 2012 (target is 30% by 2015). Over the past three years, most
government agencies have fallen well behind and are continuing to trail the 3% per year
improvement goal. Significant opportunities exist to conserve and realize additional monetary
benefit through process energy-related savings.
A large portion of federal facility energy consumption results from operation of non-real
property assets. This includes energy and water consumed by process energy (PE) assets,
which the American Society of Heating, Refrigerating and Air-Conditioning Engineers
(ASHRAE) defines as follows: “Energy consumed in support of manufacturing, industrial or
commercial processes not related to the comfort and amenities of building occupants.”3
Industrial facilities are a subset of process energy assets and are defined by the Federal Real
Property Council as “buildings specifically designed and primarily used for production or
manufacturing, such as the production or manufacture of ammunition, aircraft, ships,
vehicles, electronic equipment, fish production, chemicals, aluminum, and magnesium.”
Included are buildings that house utility plants or utility system components such as pump
stations or valves.4 The Federal Energy Management Program (FEMP) defines industrial
facilities or industrial energy (IE) as “High-intensity processes or mission-critical applications
that are not the traditional creature comforts of the building (e.g., heating, cooling, lighting,
domestic hot water, etc.).”5
Specific examples of industrial energy applications include assembly / disassembly, avionics
testing, engine testing, composite construction, chemical / parts cleaning, heat treatment,
painting / paint removal, plating, metal working, non-destructive inspection, foundries, welding
shops, controls / electronics testing and repair, loading, assembly, and packing of munitions.
3 ANSI/ASHRAE?IESNA Standard 90.1-2001 Energy Standard for Buildings Except Low-Rise Residential section 6.3.3.1.
4 FY2010 Federal Real Property Report, Appendix B – Predominant Use Categories and Definitions for Buildings
5 Federal Energy Management Program: http://www1.eere.energy.gov/femp/news/news_detail.html?news_id=11696
Goal EISA EO 13514
Reduce energy intensity (BTU / sq ft) vs. 2003
3% / yr (begin 2008)
30% by fiscal year 2015 -
Reduce industrial water intensity -
2% / yr vs. 2010 base
20% by fiscal year 2020
Increase building performance standard for new buildings and major renovations
Reduce fossil fuel use 50% by fiscal year 2015 and 100% by fiscal year 2030
New buildings in design beginning fiscal year 2020 must be net zero; Must meet federal high performance memorandum of understanding (MOU)
Reduce GHG Emissions -
By fiscal year 2020,
Scope 1& 2: 28%
Scope 3: 13%
Table 1 Federal government
energy and water
conservation targets
Strategies for Reducing Industrial Process Energy Waste in Federal Facilities
Schneider Electric White Paper Revision 0 Page 7
These environments are commonly found in US Navy shipyards and platform depots, the
Army‟s munitions, helicopter, and heavy vehicle / tank depots and arsenals, the US Air
Force‟s platform depots and wind tunnels; and the Department of Energy‟s industrial
complex, just to name a few.
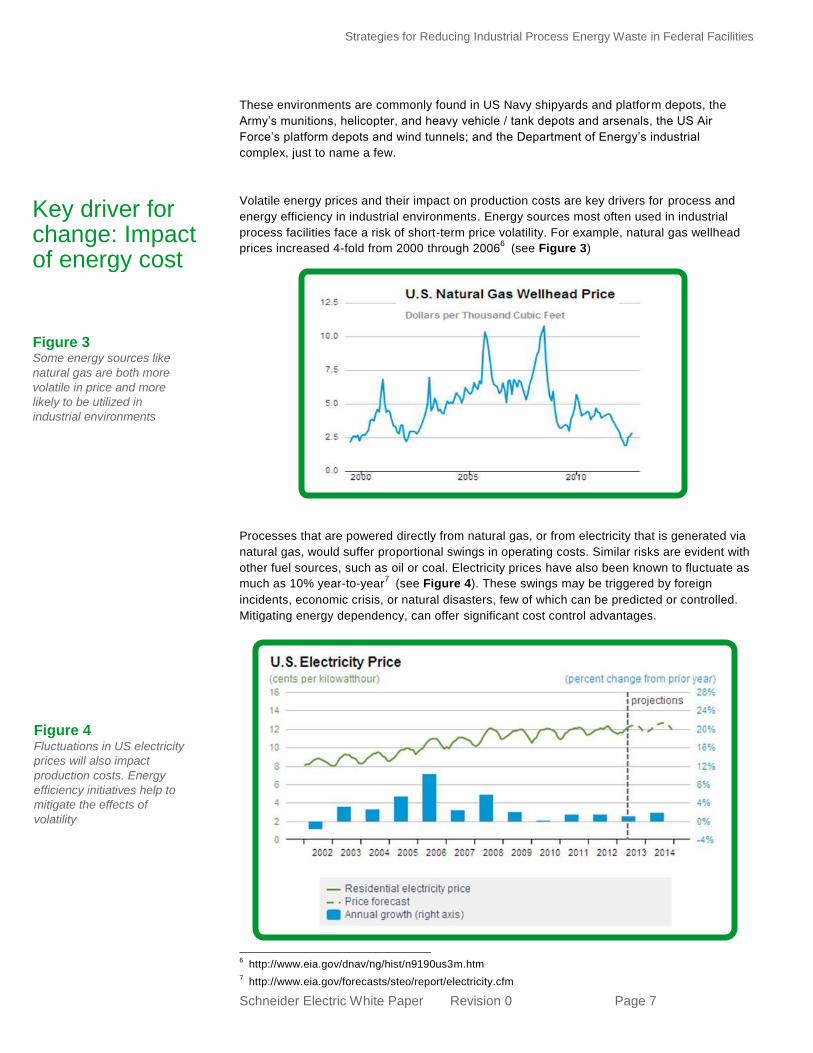
Volatile energy prices and their impact on production costs are key drivers for process and
energy efficiency in industrial environments. Energy sources most often used in industrial
process facilities face a risk of short-term price volatility. For example, natural gas wellhead
prices increased 4-fold from 2000 through 20066 (see Figure 3)
Processes that are powered directly from natural gas, or from electricity that is generated via
natural gas, would suffer proportional swings in operating costs. Similar risks are evident with
other fuel sources, such as oil or coal. Electricity prices have also been known to fluctuate as
much as 10% year-to-year7 (see Figure 4). These swings may be triggered by foreign
incidents, economic crisis, or natural disasters, few of which can be predicted or controlled.
Mitigating energy dependency, can offer significant cost control advantages.
6 http://www.eia.gov/dnav/ng/hist/n9190us3m.htm
7 http://www.eia.gov/forecasts/steo/report/electricity.cfm
Key driver for change: Impact of energy cost prices Figure 3 Some energy sources like
natural gas are both more
volatile in price and more
likely to be utilized in
industrial environments
Figure 4 Fluctuations in US electricity
prices will also impact
production costs. Energy
efficiency initiatives help to
mitigate the effects of
volatility

Strategies for Reducing Industrial Process Energy Waste in Federal Facilities
Schneider Electric White Paper Revision 0 Page 8
Energy costs can represent as much as 14% of production costs8. A significant
portion (80%) of energy used within surveyed government industrial facilities was found to be consumed by the production equipment, and not the facilities
9 (see
Figure 5).
The US Navy manages shipyards, dry-docks, and intermediate maintenance facilities across
the country. These facilities repair and maintain their ships, submarines, and Unmanned
Underwater Vehicles (UUV). They also oversee numerous armament, ordnance, vehicle
maintenance, and repair facilities. All of these facilities and industrial processes can cut costs
by implementing energy and water conservation improvements.
As an important first step, the US Navy completed an extensive analysis of their energy
consumption by category code and climate to establish benchmarks. As an outgrowth of this
assessment, it was discovered that 50% of their energy consumption fell within the domain of
maintenance facilities. The assessment also identified other facilities with high energy
reduction potential. These include metal fabrication, avionics, and painting / stripping facilities
(see Figure 6).
The US Army oversees a large industrial complex; 23 installations exist as part of the US
Army‟s organic industrial base, which includes 14 government-owned plants and 2 arsenals.
This industrial base includes energy-intensive processes, such as nitrocellulose production,
rubber products, and metal plating. The plants manufacture and repair ammunitions, and the
arsenals manufacture and repair ordnance material. Work completed at these locations
includes manufacturing, maintenance, and repair to gun tubes, gun mounts, other weapon-
related items, and repair and upgrades to US Army vehicles and tanks. In addition, numerous
tactical and equipment maintenance facilities (TEMFs) are operated by the US Army to
service and repair operations on different types of vehicle assets.
8
US Census, Annual Survey of Manufactures: General Statistics: Purchased Fuels and Electric Energy Used for Heat and Power by Industry Groups and Industries (http://factfinder2.census.gov/faces/nav/jsf/pages/searchresults.xhtml?refresh=t)
9 Energy Information Administration, “Manufacturing Energy Consumption Survey” End Uses of Fuel Consumption, Table 5.3, 2006 End Uses of Fuel consumption, 2010. For industry codes 327, 331, 332, 333, 335, 336. comparing "Direct Uses-Total Process" with a combination of "Direct Uses-Total Nonprocess" and "Conventional Boiler Use"
Examples of federal industrial processes
Figure 5 Electricity use in relevant
industrial facilities: Process
vs. non-process end use

Strategies for Reducing Industrial Process Energy Waste in Federal Facilities
Schneider Electric White Paper Revision 0 Page 9
Over 60% of these facilities and related infrastructure were built in the WWII era. Though this
industrial complex is well maintained, significant inefficiencies exist. Equipment is past its
useful life, and there are considerable opportunities to upgrade the industrial infrastructure
and to realize energy and water conservation savings.
The US Air Force‟s industrial complex includes three Air Logistics Complexes (ALCs), or
depots, that complete maintenance, repair, and upgrades to the various platforms in their
inventory. Other industrial facilities include some of the country‟s largest wind tunnels, hot
and cold-weather test facilities, and service and repair depots for vehicle assets. The three
ALCs consume over $90 Million in utilities annually with 60-80% of this load being process
energy and up to 50% of that directly tied to industrial energy use within the depots.
Unmetered consumption estimates of one of the ALC‟s industrial complexes reflects that 74%
of the electrical, 67% of the natural gas, 74% of the potable water, 83% of the steam, and
64% of the chilled water is consumed by industrial activities. In addition, the ALC produces
100% of the industrial waste water effluent.
A minor reduction of energy and water consumption in any of these areas greatly impacts the
base-load for the installation. As an example, a recent project at one ALC resulted in a $2.7
Million per year energy savings and 330,000 gallons per day water savings. As these
industrial complexes are major consumers of energy and water, their conservation efforts not
only significantly impact the installation‟s utility bills, but are also „needle movers‟ for federally
legislated and energy optimization goals.
Energy forecasting and predictive analytics
As contextual energy data is compiled, the data can be best leveraged by creating an energy
forecast model. Production throughput can be compiled with energy use to automatically build
a forecast dependent on future production schedules. Being able to accurately anticipate
future energy consumption enables the prediction of the peak demand. Energy procurement
contracts can then be adjusted to lower the peak demand threshold (represented by the solid
horizontal line in Figure 7), potentially reducing the cost of every kWh consumed.
Turning data into knowledge and action
Figure 6 Facilities such as painting
and stripping depots have
been targeted for energy and
process efficiency
improvement

Strategies for Reducing Industrial Process Energy Waste in Federal Facilities
Schneider Electric White Paper Revision 0 Page 10
Once the predictive model is established, the operational energy management system can
enable the detection and analysis of energy events. An energy event is a condition that
causes the actual energy to exceed the desired consumption level, even for an instant. The
energy management system captures not only the time and date of each event, but also all of
the relevant process variables associated with it. Within a short time, enough energy events
are captured to perform a meaningful analysis with tools such as the chart in Figure 8.
When analyzing Figure 8, it becomes clear that energy events in this particular
manufacturing process are most often correlated with a process condition known as “High mill
loading”. Further analysis, using similar tools perhaps in combination with a manufacturing
execution system (MES), may reveal that the mill is being loaded improperly by a specific
work crew, which has adopted an unconventional work habit. Without analysis tools such as
these, it would never be apparent that this practice is increasing real operating costs in the
form of energy consumption.
Figure 7 Control of peak demand
threshold based on energy
forecast
Figure 8 Pareto analysis of energy
events by cause

Strategies for Reducing Industrial Process Energy Waste in Federal Facilities
Schneider Electric White Paper Revision 0 Page 11
Implement five process demand functions
Traditional facilities-based energy management programs are easy to understand and
visualize. Lights can be seen, air leaks can be heard, and steam temperature can be sensed.
Energy efficiency for production systems, however, is more elusive, because automated tools
are required for gathering and analyzing data. These systems, however, are easy to deploy
and help to make energy consumption of process systems tangible and measureable.
The management of actions to control and reduce energy usage and cost within an industrial
process can be summarized as five process demand functions:
Energy Event Management: Detection and analysis of process changes that cause
consumption to exceed forecast
Peak Demand Management: Minimization of peak demand that triggers higher rates
Scheduled Demand Management: Reduction of costs by shifting demand to low cost
time periods
Idle State Management: Minimization of energy draw during idle process conditions
Demand/Response Management: Distribution of energy capacity back to the grid per
request in exchange for incentives
For more information, see the presentation “The Role of Dashboards in Managing the Energy
of Production Systems”, published for the Industrial Energy Technology Conference (IETC)
2013.10
Fine tune production and central utilities to reduce energy use
Visualization and interpretation of data across multiple levels of an organization represents a
best practice for maximizing production while minimizing energy use. Installation of such tools
can occur without radical changes in the existing process and without having to replace / or
retrofit existing equipment. The data analysis capability can also help to evaluate
opportunities to refine and retrofit existing processes and equipment in order to further reduce
energy consumption. This approach also helps streamline central utilities production and
distribution by right sizing and optimizing central systems that serve industrial processes such
as steam plants, chilled water plants, and compressed air plants.
10
http://eclipse.modicon.com/85256CBB0074C0EF/C7720116867B3CFD85256CBC0068AD59/EDA68E67455B57A485257BC70071FDBC/$File/Robb%20Dussault-The%20Role%20of%20Visualization%20Systems%20in%20Managing%20the%20Energy%20of%20Production%20Systems%20Final%20Paper%2003_28_13.pdf?OpenElement

Strategies for Reducing Industrial Process Energy Waste in Federal Facilities
Schneider Electric White Paper Revision 0 Page 12
Industrial energy initiatives are one of several types of process energy programs that are
leading a new wave of conservation measures. The challenges are real, but the strategies
and techniques to address these challenges are tested and proven. Process efficiency is a
largely untapped savings resource that aids in the effort to meet government department and
agency production, financial, and energy goals.
Prudent steps for launching an energy initiative include the following:
Identifying a trusted energy partner and advisor (recommended within1 month)
Assessing existing processes for potential energy waste reduction and efficiency
opportunities (within 3 months)
Soliciting qualified contractors for best-value proposals (within 6 months)
© 2
013
Sch
neid
er E
lectric
. All rig
hts
rese
rve
d.
© 2
013
Sch
neid
er E
lect
ric. A
ll rig
hts
res
erve
d.
Robb Dussault, PEM administers the Energy Management Solutions portfolio for Schneider
Electric‟s US Industry Business Unit. He has 20 years of experience in technology development,
application engineering, product/service management, global strategic account support and
commercial deployment for Industrial Automation and Energy Management systems. He holds a
B.S. in Electrical Engineering from the University of Massachusetts, a Master of Science in
Management from NC State University, and maintains a Professional Energy Management
Certification from the Institute of Energy Professionals. Colonel (retired) Douglas P. Wise , is a former US Air Force officer who has served in a wide range of civil engineering positions at base level, major command, and in the joint/combined environment and has extensive deployment experience. He holds a Bachelor of Science degree in Civil Engineering, Montana State University, Bozeman, MT, and a Master of Science degree in Engineering and Environmental Management, Air Force Institute of Technology, Wright-Patterson AFB, Ohio. *Acknowledgements
Special thanks to our additional white paper contributors: Ellen Kotzbauer, BEP, US Federal
Government Segment Manager, and Garrett Sloman, PE, CEM, Schneider Electric Technical
Writer
Conclusion
About the authors