strategies for managing heath plans through a challenging economy
TRANSCRIPT

Presented by:J. Richard Johnson
July 21, 2009
National Conference of State Legislatures
STRATEGIES FORMANAGING HEATH PLANS THROUGH A CHALLENGING ECONOMY
Fiscal and Financial Environment
Factors That Can Increase Health Plan Costs
Actions Health Plans Are Taking

The Underlying Inflation ProblemACTIVES AND RETIREES UNDER AGE 65
1 Based on 2009 Segal Health Plan Cost Trend Survey and U.S. Bureau of Labor Statistics.
02468
101214161820
1999 2000 2001 2002 2003 2004 2005 2006 2007 2008 2009
Annu
al Pe
rcen
tage
Incr
ease
Non-Network PPO POSHMO HD-PPO Rx RetailMedical Inflation Overall Inflation Workers Earnings
GAP
3
The Underlying Inflation Problem
119%
34%
29%0%
20%
40%
60%
80%
100%
120%
140%
1999 2000 2001 2002 2003 2004 2005 2006 2007 2008
Health Insurance Premiums Workers' Earnings Overall Inflation
Note: Due to a change in methods, the cumulative changes in the average family premium are somewhat different from those reported in previous versions of the Kaiser/HRET Survey of Employer-Sponsored Health Benefits. See the Survey Design and Methods Section for more information, available at http://www.kff.org/insurance/7790/index.cfm.
Source: Kaiser/HRET Survey of Employer-Sponsored Health Benefits, 2000-2008. Bureau of Labor Statistics, Consumer Price Index, U.S. City Average of Annual Inflation (April to April), 2000-2008; Bureau of Labor Statistics, Seasonally Adjusted Data from the Current Employment Statistics Survey, 2000-2008 (April to April).
CUMULATIVE CHANGES IN HEALTH INSURANCE PREMIUMS, INFLATION, AND WORKERS’ EARNINGS, 1999 – 2008
GAP

4
Cost Concerns
Note: The average worker contribution and the average employer contribution do not add to the average total premium due to rounding.Source: Kaiser/HRET Survey of Employer-Sponsored Health Benefits, 1999-2008.
$4,247
$9,325
$1,543$3,354
1999 2008
Employer ContributionWorker Contribution
$5,791
$12,680
120% Increase
119% Increase
AVERAGE HEALTH INSURANCE PREMIUMS AND WORKER CONTRIBUTIONS FOR FAMILY COVERAGE, 1999 – 2008
117% Increase
Health Benefit Funding
Only two sources of funds:• Employer subsidy• Employee premiums
and out-of-pocket costs
Cost levers• Hold down overall cost of
the plan– Size of the pie
• Shift cost to the members– Size of the pie slices
Employee Cost
Employer Cost

6
Impact of Falling Budgets
Falling budget revenue ultimately translates into staff reduction through:• Attrition• Reduction of hours worked • Layoffs• Reduction of services• Restructuring• Retirement patterns
Less People = Less Cost
But a reduced workforce could also mean higher costs…
Fiscal and Financial Environment
Factors That Can Increase Health Plan Costs
Actions Health Plans Are Taking

8
Factors That Can Increase Health Plan Costs
Increased enrollment of dependents• As spouses with other coverage lose jobs and benefit
coverage • Attempted enrollment of non-qualified “Dependents”
Increased COBRA coverage elections• As laid-off workers fail to find other work with health
benefits• To take advantage of the new COBRA federal subsidy
payments
9
Factors That Can Increase Health Plan Costs
Delayed retirement• As those eligible for retirement reconsider their ability to
pay for health coverage after they retire
Increased likelihood of stress-related disorders• Fear of job loss can trigger stress-related diseases and
increased mental health claims • Can cascade into increased overall sickness of the group• Increased number of disabilities will negatively impact the
disability program experience (both pre and post RIF)
10
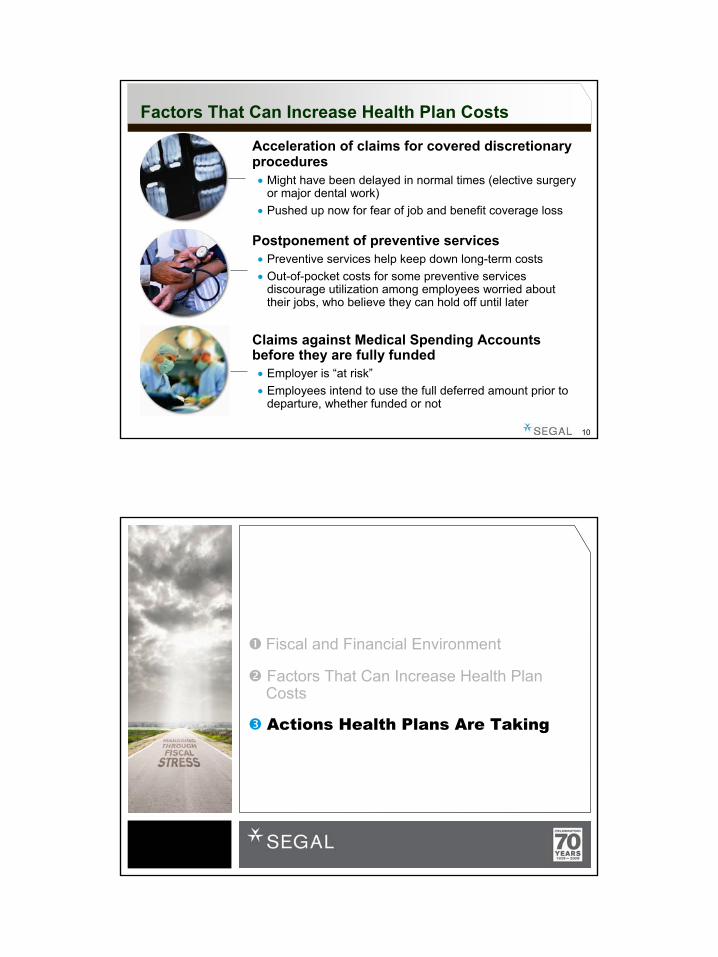
Factors That Can Increase Health Plan Costs
Claims against Medical Spending Accounts before they are fully funded• Employer is “at risk”• Employees intend to use the full deferred amount prior to
departure, whether funded or not
Postponement of preventive services • Preventive services help keep down long-term costs• Out-of-pocket costs for some preventive services
discourage utilization among employees worried about their jobs, who believe they can hold off until later
Acceleration of claims for covered discretionary procedures• Might have been delayed in normal times (elective surgery
or major dental work) • Pushed up now for fear of job and benefit coverage loss
Fiscal and Financial Environment
Factors That Can Increase Health Plan Costs
Actions Health Plans Are Taking

12
Actions Health Plans Are Taking
Redesign Health Benefit Plans
Adverse times externally are a good time to make plan changes internally
Identify benefit features that can be reduced or restructured without eliminating key coverage areas
Does the plan design promote and encourage preventive care and discourage unneeded care?
Can a lower-cost plan option help?
Number of States Offering Medical Plan Types
6
17
36
49
0 10 20 30 40 50
Indemnity
HDHP
HMO
PPO
Source: Segal State Survey 2009.

14
Actions Health Plans Are Taking continued
Review Cost-Sharing StrategyTrade fixed copayments for coinsurance so employees share in increasing costs automaticallyWhere possible, share premium cost increases proportionallyBe aware of limits on employees’ ability to absorb radical cost increases in years without pay increasesBalance cost shifting with need to provide a reasonable benefit levelIncent participants to cover spouse and dependents elsewhere
Portion of Monthly Premium Paid by Employee
0
5
10
15
20
25
0% 1-19% 20-39% 40-59% 60%+Employee Premium Share
Num
ber o
f Plan
s
PPO HMO HDHP Indemnity
Source: Segal State Survey 2009.

16
Actions Health Plans Are Taking continued
Enhance Wellness Programs
Even if they cost a bit more now, wellness programs can help hold plan costs down in the long-term
Target specific “high results” areas rather than broad general programs
Avoid the ROI argument, if possible, in favor of importance of keeping remaining work force healthy
16
17
Actions Health Plans Are Taking continued
Improve Case Management and Health Coaching Services
Help participants stay on appropriate therapies now that will help them avoid future health complications with greater plan costs
Target specific diseases and procedures with greatest potential for demonstrable effect
Where possible, use existing carriers as a contract add-on to avoid need for full procurements
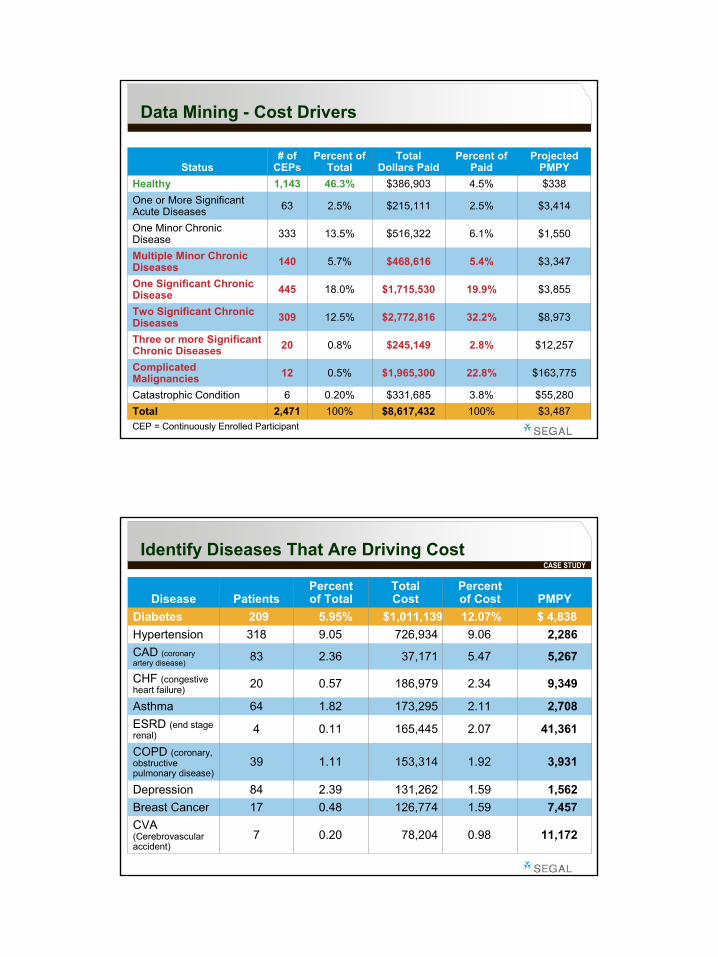
Data Mining - Cost Drivers
$3,487100%$8,617,432100%2,471Total$55,2803.8%$331,6850.20%6Catastrophic Condition
$163,77522.8%$1,965,3000.5%12Complicated Malignancies
$12,2572.8%$245,1490.8%20Three or more Significant Chronic Diseases
$8,97332.2%$2,772,81612.5%309Two Significant Chronic Diseases
$3,85519.9%$1,715,53018.0%445One Significant Chronic Disease
$3,3475.4%$468,6165.7%140Multiple Minor Chronic Diseases
$1,5506.1%$516,32213.5%333One Minor Chronic Disease
$3,4142.5%$215,1112.5%63One or More Significant Acute Diseases
$3384.5%$386,90346.3%1,143Healthy
Projected PMPY
Percent of Paid
Total Dollars Paid
Percent of Total
# of CEPsStatus
CEP = Continuously Enrolled Participant
Identify Diseases That Are Driving Cost
11,1720.9878,2040.207CVA (Cerebrovascular accident)
7,4571.59126,7740.4817Breast Cancer1,5621.59131,2622.3984Depression
3,9311.92153,3141.1139COPD (coronary, obstructive pulmonary disease)
41,3612.07165,4450.114ESRD (end stage renal)
2,7082.11173,2951.8264Asthma
9,3492.34186,9790.5720CHF (congestive heart failure)
5,2675.4737,1712.3683CAD (coronary artery disease)
2,2869.06726,9349.05318Hypertension$ 4,83812.07%$1,011,1395.95%209DiabetesPMPY
Percent of Cost
TotalCost
Percent of TotalPatientsDisease
CASE STUDY

20
Actions Health Plans Are Taking continued
Add Voluntary Benefits
Low/no-cost solution to providing ancillary and some core benefits
Convert some employer paid benefits to voluntary programs
Adds a new program, just when employer may be reeling under the cost of the existing plans
21
Actions Health Plans Are Taking continued
Capture the Temporary COBRA Subsidy
Take the federal temporary COBRA subsidy into account when dealing with involuntary terminations and layoffs
Set up process to identify terminations that qualify
Calculate effect on FICA taxes dueWork out plan for cross-crediting COBRA subsidy from FICA to health benefits

22
Actions Health Plans Are Taking continued
Conduct an Eligibility Audit
Hold costs down by ensuring that the plan is covering only eligible participants and dependents
Require proof of dependency for all new plan entrants, then progressively screen existing participants
Provide plenty of notice of eligibility policy enforcement and have a procedure for appeals and grievances to resolve difficult issues
8% to 12% dependent coverage reduction is typical
23
Actions Health Plans Are Taking continued
Manage Contractors and Vendors More TightlySimplify number of health plan optionsCreate a competitive environment for the remaining vendorsLink performance guarantees to plan costDemand savings guaranteesAuction visibility – barter access to your workforcePilot new programsEmbrace new technology to reduce waste and encourage personal responsibility for health costs

24
How Legislators and Staff Can Help
Learn more about your employee and retiree plans and what drives the cost increases
Take measured actions that support a strategy for cost containment
Be open to structural long-term changes to manage cost
Think of benefits as an integral part of total compensation
Keep in mind the interaction between state employee benefits and state-funded entitlement programs
Next . . .
Rick JohnsonSenior Vice [email protected]