strategic use of your employee engagement survey: … · strategic use of your employee engagement...
TRANSCRIPT
Strategic Use of Your Employee Engagement Survey: Move from Simple
Descriptives to Identifying Key Drivers, Action Planning, and Demonstrating ROI
Presented by:
Scott Mondore, Ph.D.
& Hannah Spell, Ph.D.
www.smdhr.com

Learning Objectives
1. Show business impact from employee surveys
2. Put actionable information in the hands of managers
3. Effectively present survey information to senior leaders
Presenter Bio’s
Scott Mondore, Ph.D.: Dr. Scott Mondore has over 15 years of experience in the areas of strategy, talent management, measurement, customer experience, and organizational development. He has internal and
consulting experience across a variety of industries. Scott holds a master's degree and doctorate in applied psychology from the University of Georgia. Before starting SMD, he served as East Region President for Morehead Associates, a healthcare HR company. Before joining Morehead, Scott worked as a Corporate Strategy Director at Maersk, Inc. He also worked as an Organizational Effectiveness Leader at UPS, focusing on employee assessment and measurement as well as working as a consultant to large and small organizations in both the private and public sector.
Scott is the co-author of “Investing in What Matters: Linking Employees to Business Outcomes” (SHRM, 2009) and “Business-Focused HR: 11 Processes to Drive Results” (SHRM, 2011). Scott is also an Adjunct Professor of Psychology at the University of Georgia, Fairleigh Dickinson University, and the University of North Carolina-Charlotte.
Hannah Spell, Ph.D.: Before joining SMD, she worked for the federal government, non-profit research grants, and State Farm conducting various research projects, performing advanced analytics around HR issues, and providing internal consulting services. She has experience with research programs, HR measurement and analytics, survey design and implementation, as well as action-planning and strategy. Hannah has published several articles on topics including mentoring in the workplace, developmental climate, and turnover. She holds a master’s degree and doctorate in Industrial/Organizational Psychology from the University of Georgia.
Agenda
• Current state of HR and employee engagement
• Building the right survey for your organization
• New Opportunities:
– Linking results to business outcomes
– Implementing business-focused action planning for front-line leaders
– Integrate survey data with performance management, succession planning, leadership development, and individual development
• Analyzing and presenting data at all levels
Applied Research and Trends
The Current State of HR & Engagement
Defining Employee Engagement
• There are as many definitions of employee engagement as there are consulting firms selling surveys and HR leaders in organizations
• Employee engagement is really not that different than what has been measured by employee surveys for the past 30 years
• The evolution has been driven more by survey vendors trying to enhance their value proposition than any breakthrough thinking
The Problem with Engagement
• No clear definition• No magic target number exists (what’s a good
number?)• No definitive study connecting engagement to
business outcomes• Front-line managers don’t understand it and find
little value in it• Why not just focus on actionable areas that drive
business results, instead of engagement scores?
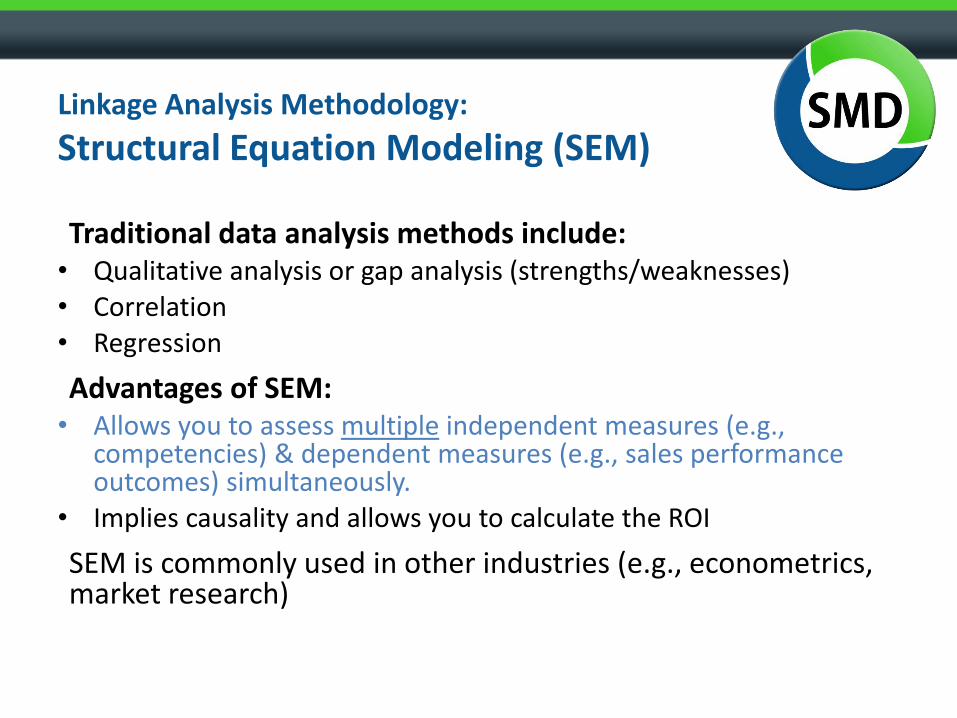
Linkage Analysis Methodology:
Structural Equation Modeling (SEM)
Traditional data analysis methods include:• Qualitative analysis or gap analysis (strengths/weaknesses)• Correlation• Regression
Advantages of SEM:• Allows you to assess multiple independent measures (e.g.,
competencies) & dependent measures (e.g., sales performance outcomes) simultaneously.
• Implies causality and allows you to calculate the ROI
SEM is commonly used in other industries (e.g., econometrics, market research)
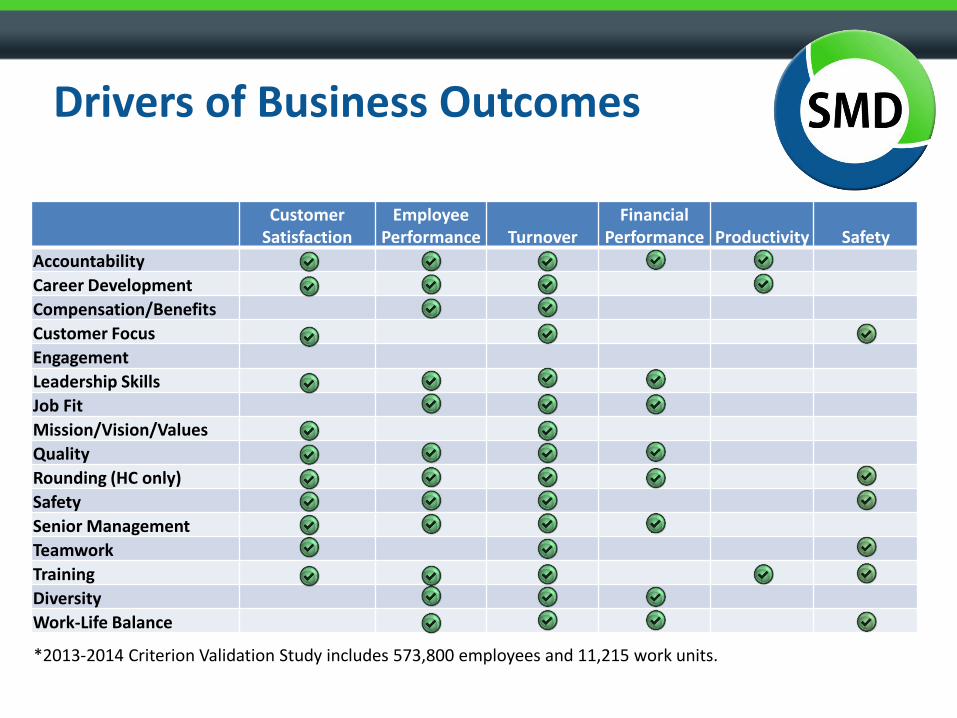
Drivers of Business Outcomes
Customer Satisfaction
Employee Performance Turnover
FinancialPerformance Productivity Safety
Accountability X X X X
Career Development X X v X
Compensation/Benefits
Customer Focus X X
Engagement
Leadership Skills X X X
Job Fit X
Mission/Vision/Values X X
Quality X X
Rounding (HC only) X X X X
Safety X X
Senior Management X X
Teamwork
Training X X X
Diversity X X
Work-Life Balance X X X
*2013-2014 Criterion Validation Study includes 573,800 employees and 11,215 work units.
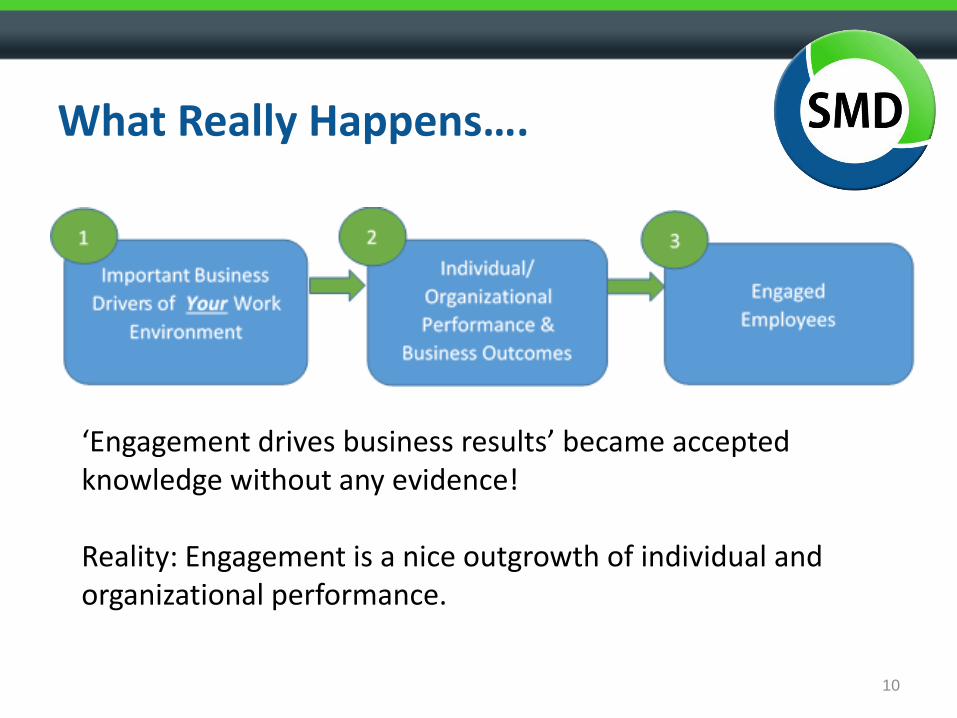
What Really Happens….
10
‘Engagement drives business results’ became accepted knowledge without any evidence!
Reality: Engagement is a nice outgrowth of individual and organizational performance.
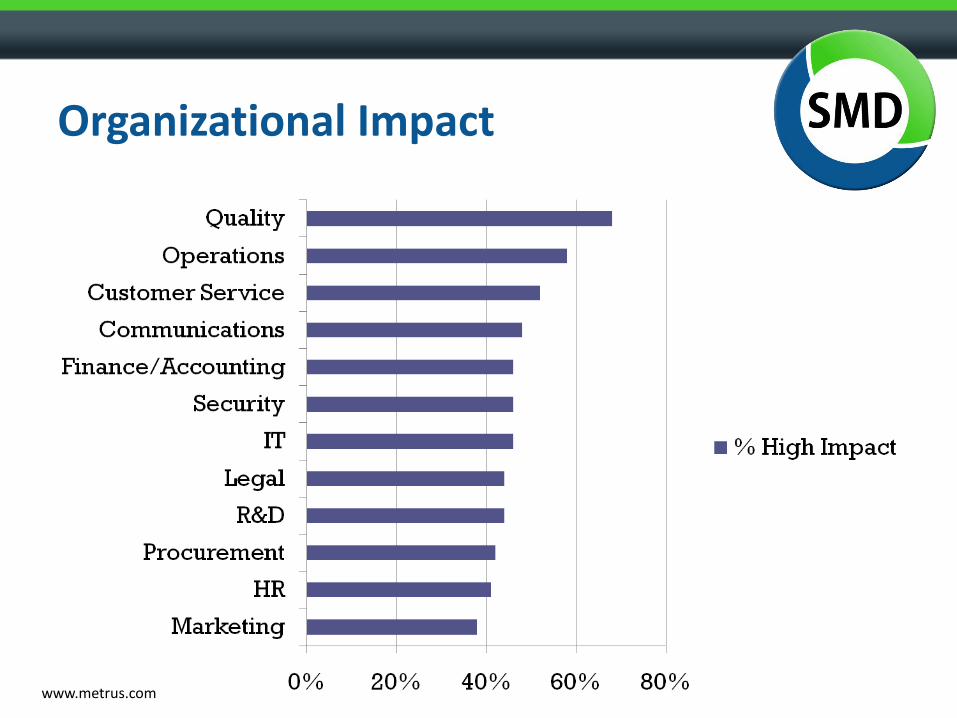
Organizational Impact
www.metrus.com
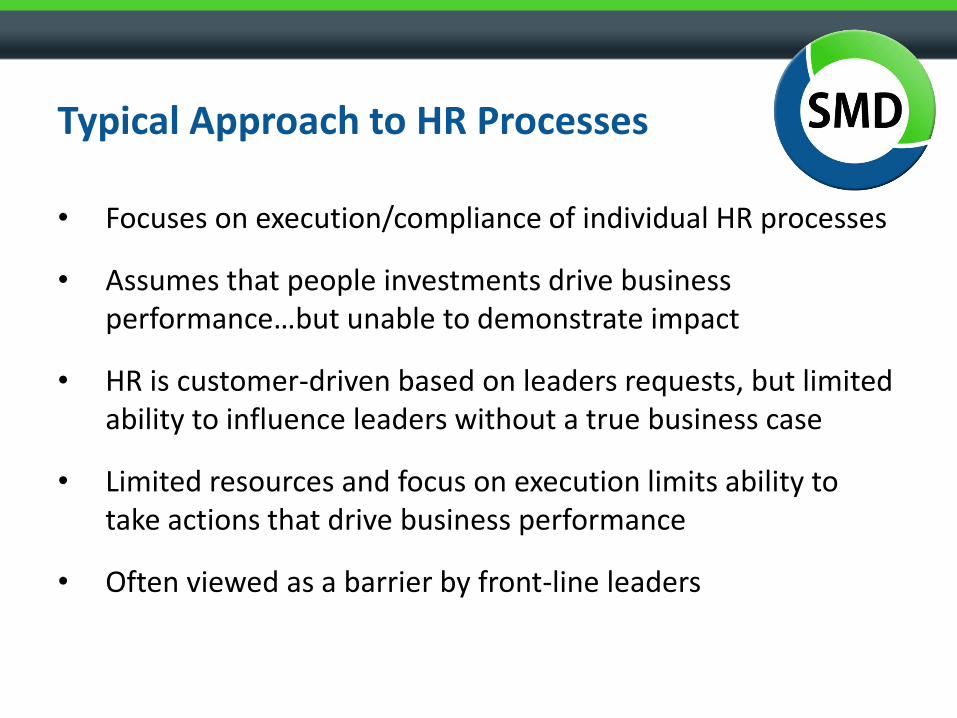
Typical Approach to HR Processes
• Focuses on execution/compliance of individual HR processes
• Assumes that people investments drive business performance…but unable to demonstrate impact
• HR is customer-driven based on leaders requests, but limited ability to influence leaders without a true business case
• Limited resources and focus on execution limits ability to take actions that drive business performance
• Often viewed as a barrier by front-line leaders
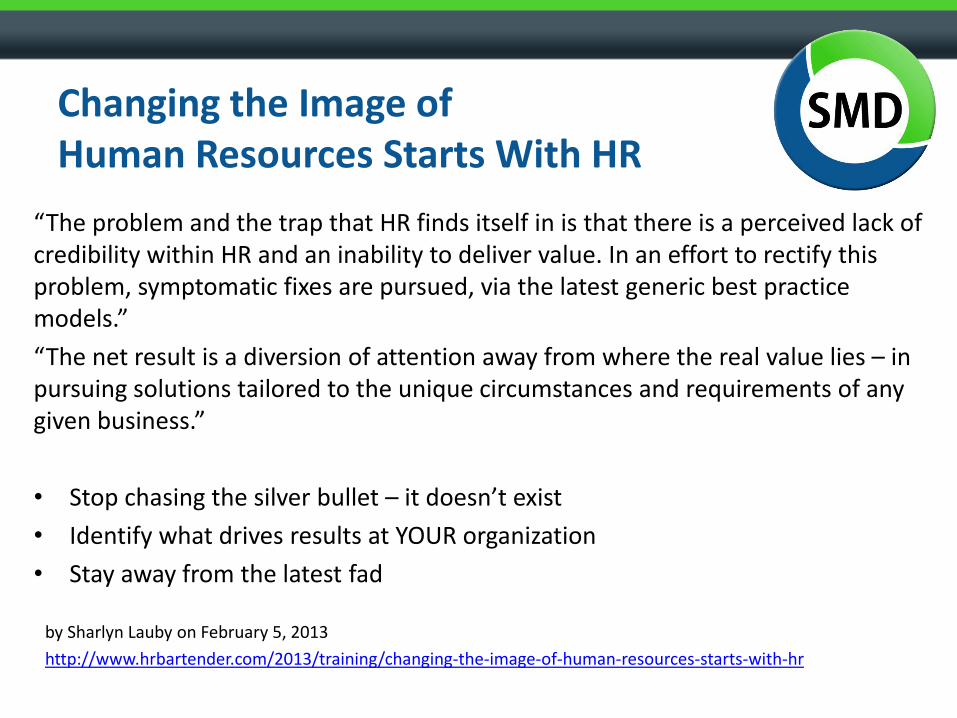
Changing the Image of Human Resources Starts With HR
“The problem and the trap that HR finds itself in is that there is a perceived lack of credibility within HR and an inability to deliver value. In an effort to rectify this problem, symptomatic fixes are pursued, via the latest generic best practice models.”
“The net result is a diversion of attention away from where the real value lies – in pursuing solutions tailored to the unique circumstances and requirements of any given business.”
• Stop chasing the silver bullet – it doesn’t exist
• Identify what drives results at YOUR organization
• Stay away from the latest fad
by Sharlyn Lauby on February 5, 2013
http://www.hrbartender.com/2013/training/changing-the-image-of-human-resources-starts-with-hr
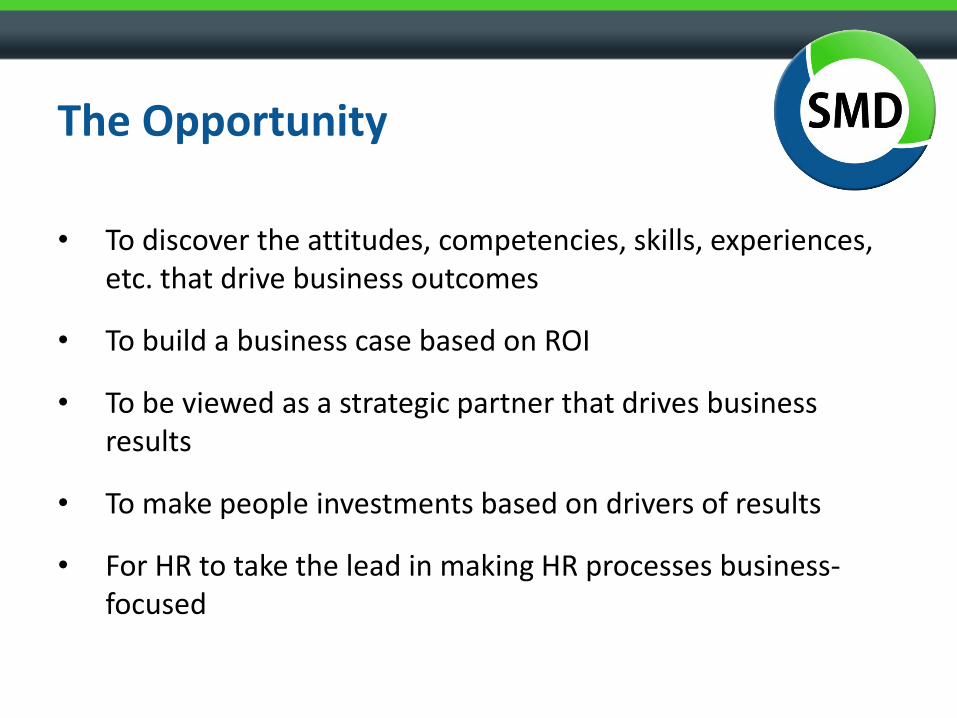
The Opportunity
• To discover the attitudes, competencies, skills, experiences, etc. that drive business outcomes
• To build a business case based on ROI
• To be viewed as a strategic partner that drives business results
• To make people investments based on drivers of results
• For HR to take the lead in making HR processes business-focused
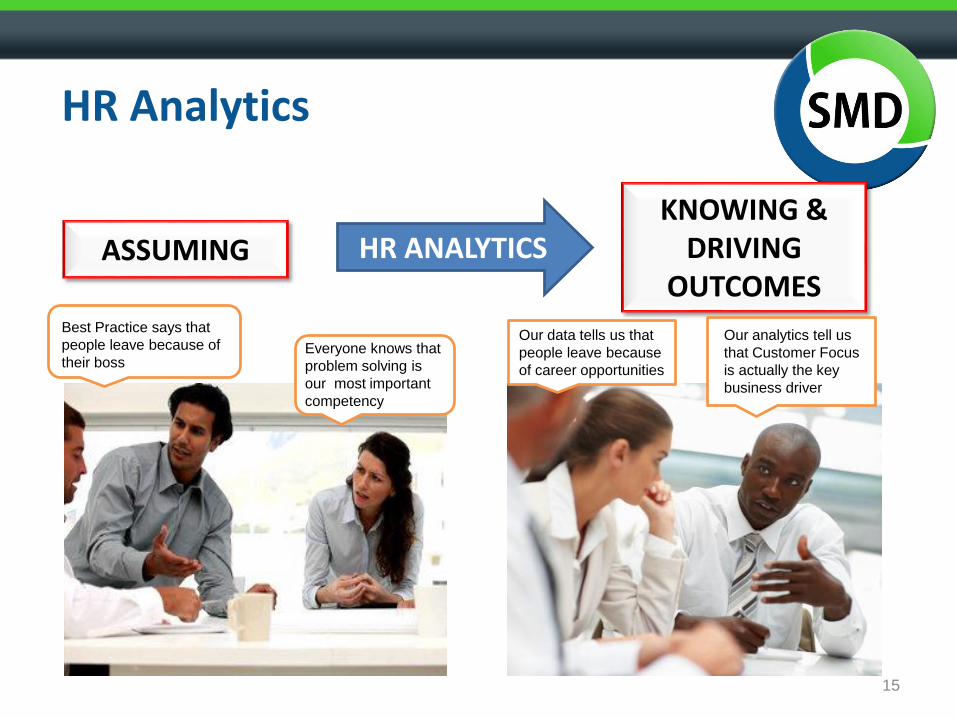
KNOWING & DRIVING
OUTCOMES
HR Analytics
15
ASSUMING
Best Practice says that
people leave because of
their bossEveryone knows that
problem solving is
our most important
competency
Our data tells us that
people leave because
of career opportunities
Our analytics tell us
that Customer Focus
is actually the key
business driver
HR ANALYTICS
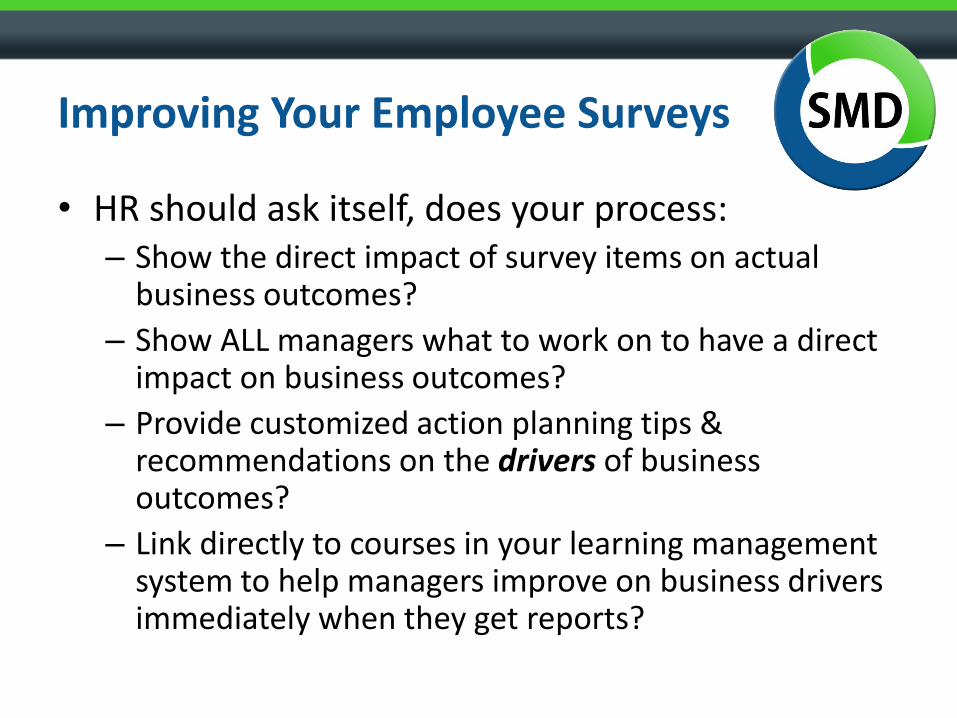
Improving Your Employee Surveys
• HR should ask itself, does your process:– Show the direct impact of survey items on actual
business outcomes?
– Show ALL managers what to work on to have a direct impact on business outcomes?
– Provide customized action planning tips & recommendations on the drivers of business outcomes?
– Link directly to courses in your learning management system to help managers improve on business drivers immediately when they get reports?
Building a Business-Focused Survey
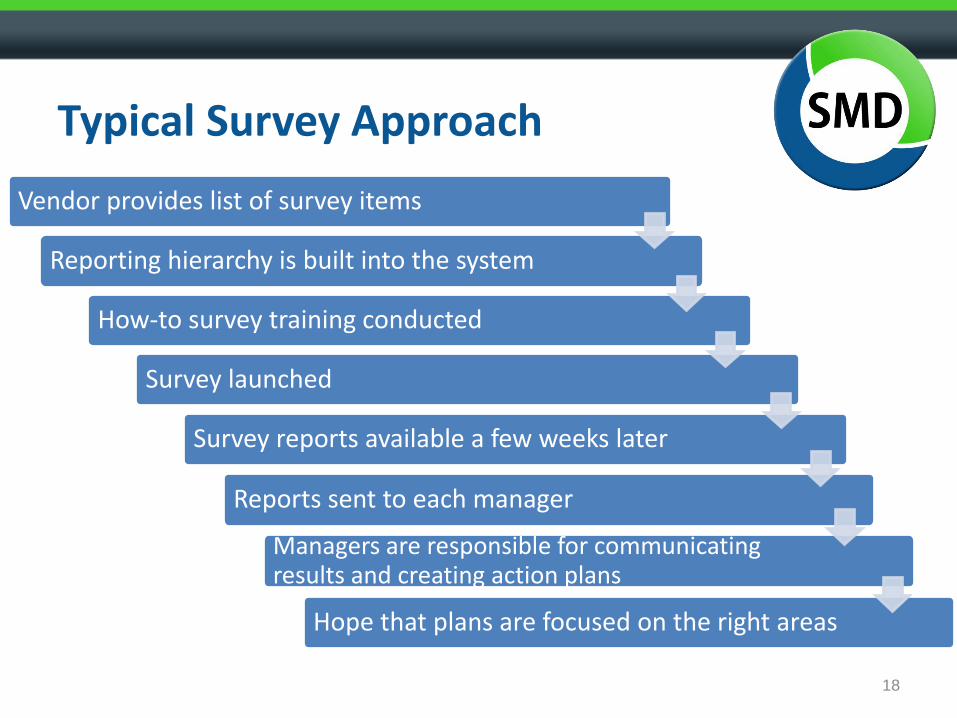
Typical Survey Approach
Vendor provides list of survey items
Reporting hierarchy is built into the system
How-to survey training conducted
Survey launched
Survey reports available a few weeks later
Reports sent to each manager
Managers are responsible for communicating results and creating action plans
Hope that plans are focused on the right areas
18
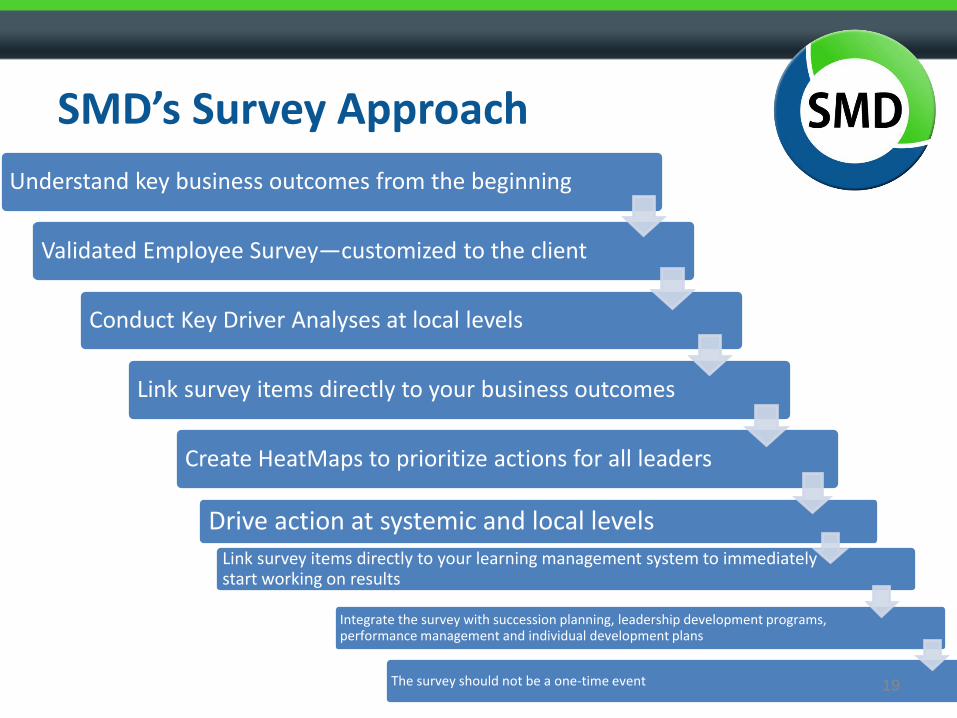
SMD’s Survey Approach
Understand key business outcomes from the beginning
Validated Employee Survey—customized to the client
Conduct Key Driver Analyses at local levels
Link survey items directly to your business outcomes
Create HeatMaps to prioritize actions for all leaders
Drive action at systemic and local levelsLink survey items directly to your learning management system to immediately start working on results
Integrate the survey with succession planning, leadership development programs, performance management and individual development plans
The survey should not be a one-time event 19
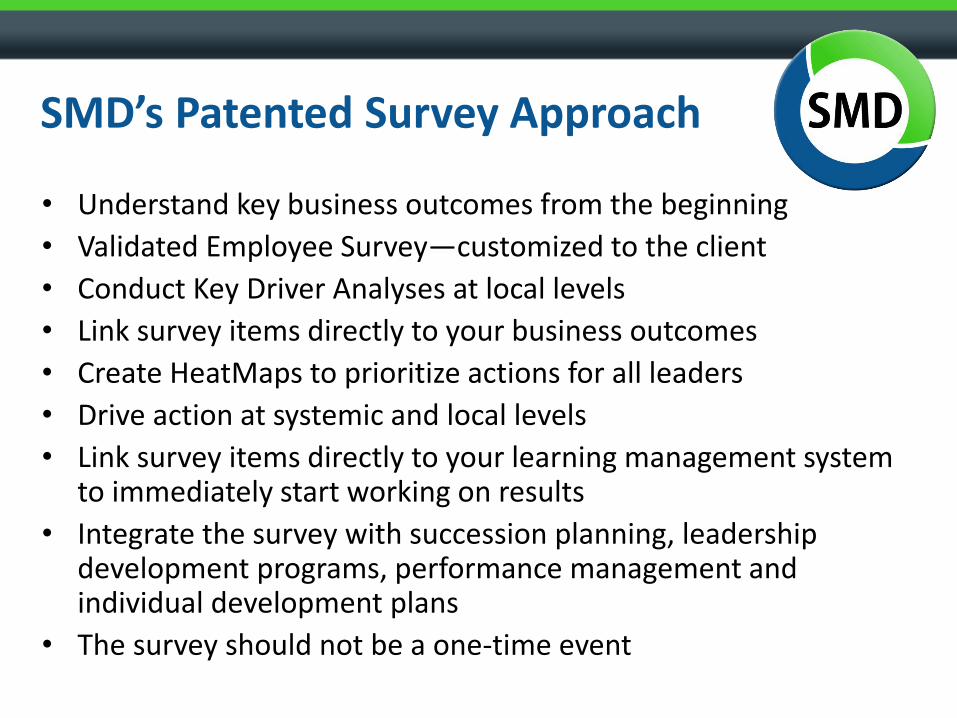
SMD’s Patented Survey Approach
• Understand key business outcomes from the beginning
• Validated Employee Survey—customized to the client
• Conduct Key Driver Analyses at local levels
• Link survey items directly to your business outcomes
• Create HeatMaps to prioritize actions for all leaders
• Drive action at systemic and local levels
• Link survey items directly to your learning management system to immediately start working on results
• Integrate the survey with succession planning, leadership development programs, performance management and individual development plans
• The survey should not be a one-time event
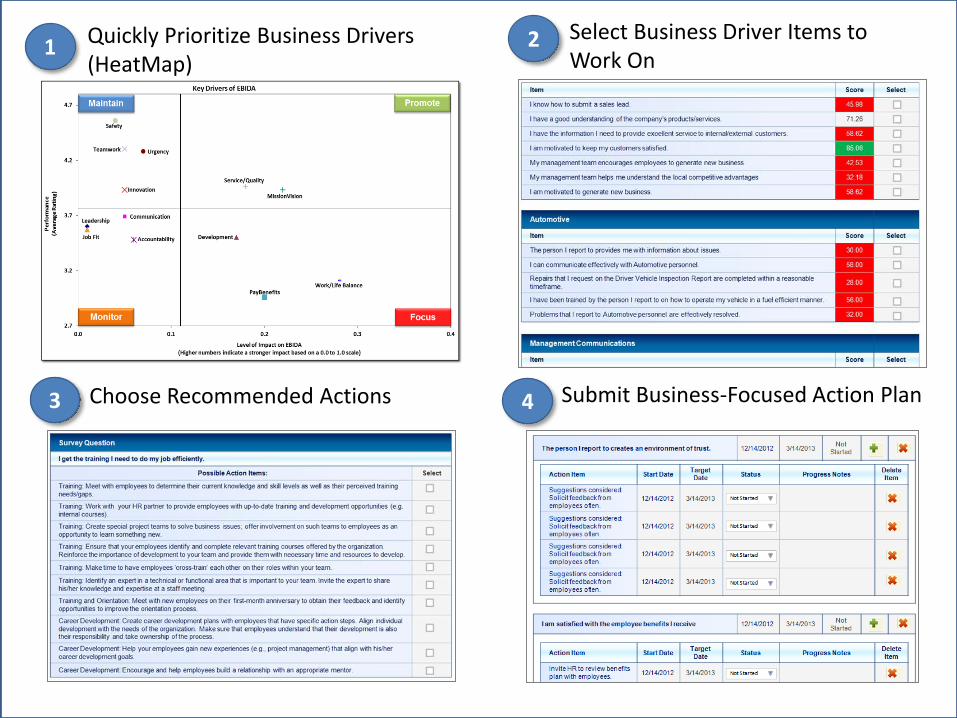
1 2
3 4
Quickly Prioritize Business Drivers(HeatMap)
Select Business Driver Items to Work On
Choose Recommended Actions Submit Business-Focused Action Plan
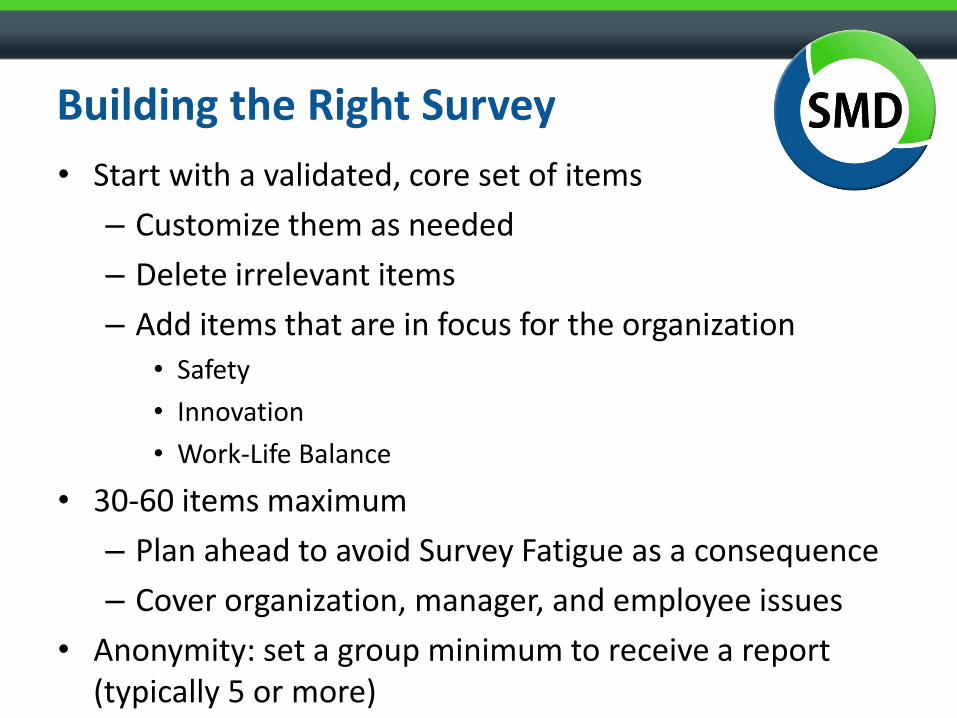
Building the Right Survey
• Start with a validated, core set of items
– Customize them as needed
– Delete irrelevant items
– Add items that are in focus for the organization
• Safety
• Innovation
• Work-Life Balance
• 30-60 items maximum
– Plan ahead to avoid Survey Fatigue as a consequence
– Cover organization, manager, and employee issues
• Anonymity: set a group minimum to receive a report (typically 5 or more)
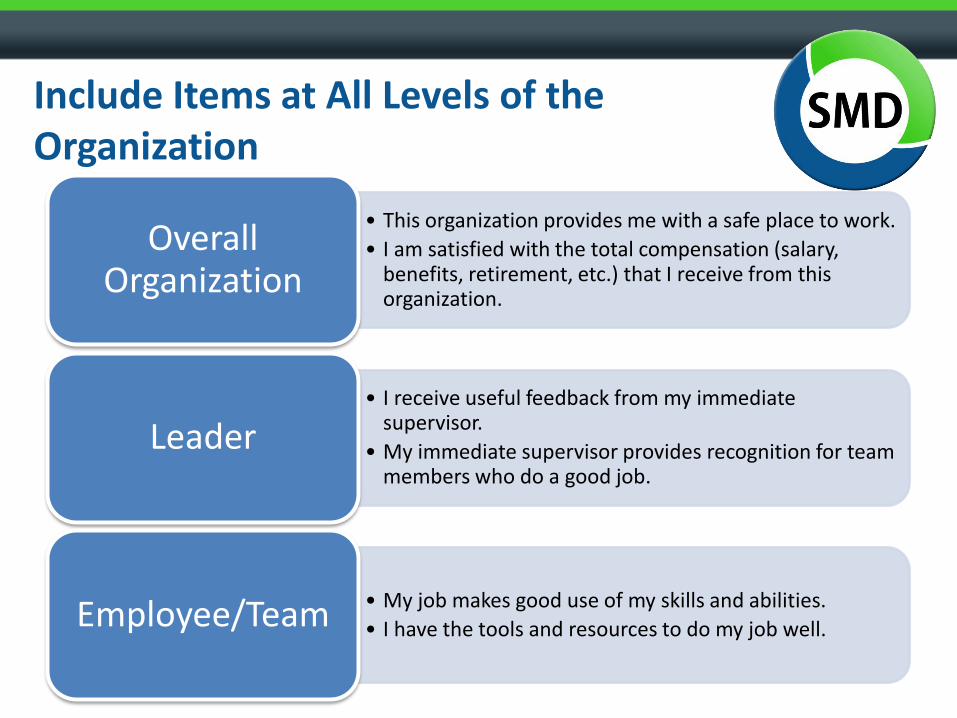
Include Items at All Levels of the Organization
• This organization provides me with a safe place to work.
• I am satisfied with the total compensation (salary, benefits, retirement, etc.) that I receive from this organization.
Overall Organization
• I receive useful feedback from my immediate supervisor.
• My immediate supervisor provides recognition for team members who do a good job.
Leader
• My job makes good use of my skills and abilities.
• I have the tools and resources to do my job well.Employee/Team
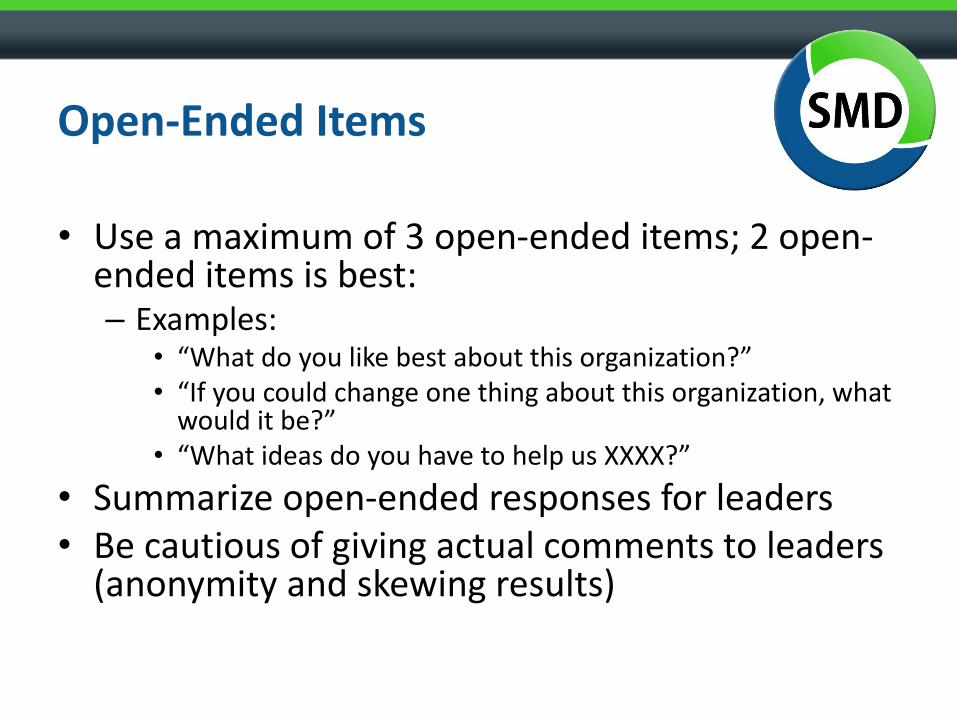
Open-Ended Items
• Use a maximum of 3 open-ended items; 2 open-ended items is best:– Examples:
• “What do you like best about this organization?”• “If you could change one thing about this organization, what
would it be?”• “What ideas do you have to help us XXXX?”
• Summarize open-ended responses for leaders• Be cautious of giving actual comments to leaders
(anonymity and skewing results)
Using Benchmark/Normative Data
• Key drivers of your business outcomes are still the primary focus of the survey
• Ask yourself two questions: 1) “How much higher than the benchmark do we need
to be to have a real competitive advantage?” 2) “How much lower than the benchmark do we need
to be to have a true competitive disadvantage?”
• Answer: NO ONE KNOWS! There is no way to say with certainty.
• Again, benchmarks were made important without any evidence of impact.
Practical Tips: Pre-Survey
• Set up organizational hierarchy well in advance
• Webinar Training for Managers: Overview of the Survey
• Local Survey Champions
• Reinforce anonymity/confidentiality
• Announcement Letter from the CEO
• Logistics for employees to participate (not everyone works at a computer)
• Prize raffle to enhance participation
• Set goal for participation—especially if it is your first survey
• Survey translations: use internal resources to save cost and increase accuracy
Practical Tips: During the Survey
• Define the key terms in the survey– Senior management: Consider the leaders of the organization;
the executive team.
• Maximum of 5-7 questions per screen page
• Help employees with any special needs
• Distribute work unit passwords/logins to local managers
• Send out multiple reminders
• Keep survey open for two weeks and add time if needed
• Send out participation reports every few days
Practical Tips: Post-Survey
• Get overall metric score to key leaders in one day• Get all results back in two weeks—maximum• Share high-level results with employees (CEO letter)• Provide executive overview presentation for senior
leaders• Have senior leaders create systemic interventions
based on key driver analyses• Provide local managers with reports and tools
agendas to conduct roll-out meetings• Post-survey training webinar for all managers on
how to read and analyze the reports
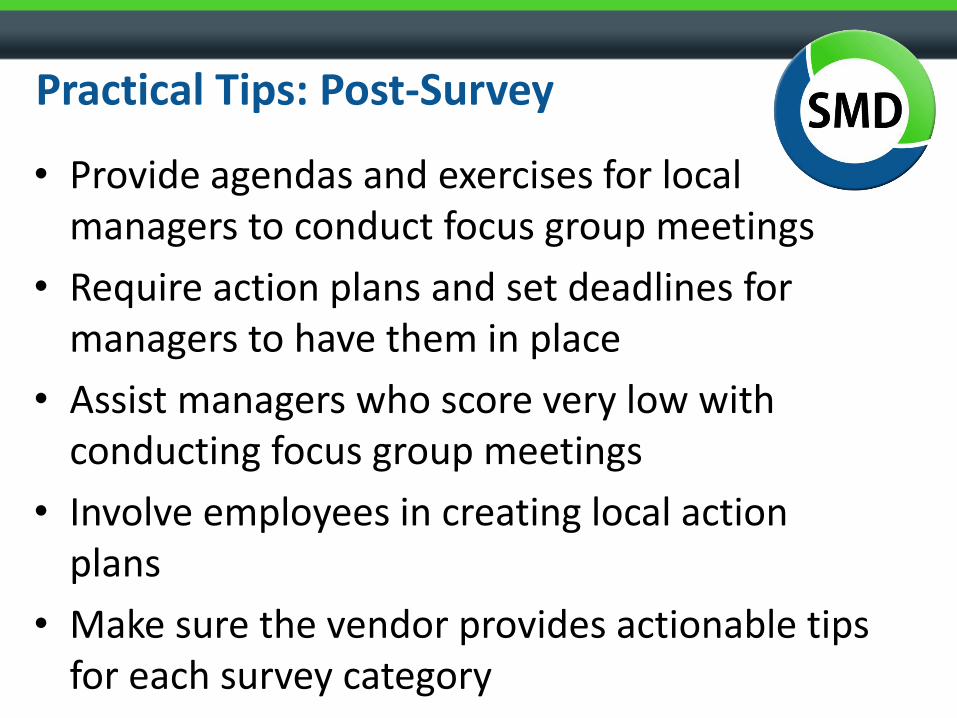
Practical Tips: Post-Survey
• Provide agendas and exercises for local managers to conduct focus group meetings
• Require action plans and set deadlines for managers to have them in place
• Assist managers who score very low with conducting focus group meetings
• Involve employees in creating local action plans
• Make sure the vendor provides actionable tips for each survey category
From analysis to action
Linking to Business Outcomes for Front-line Leaders
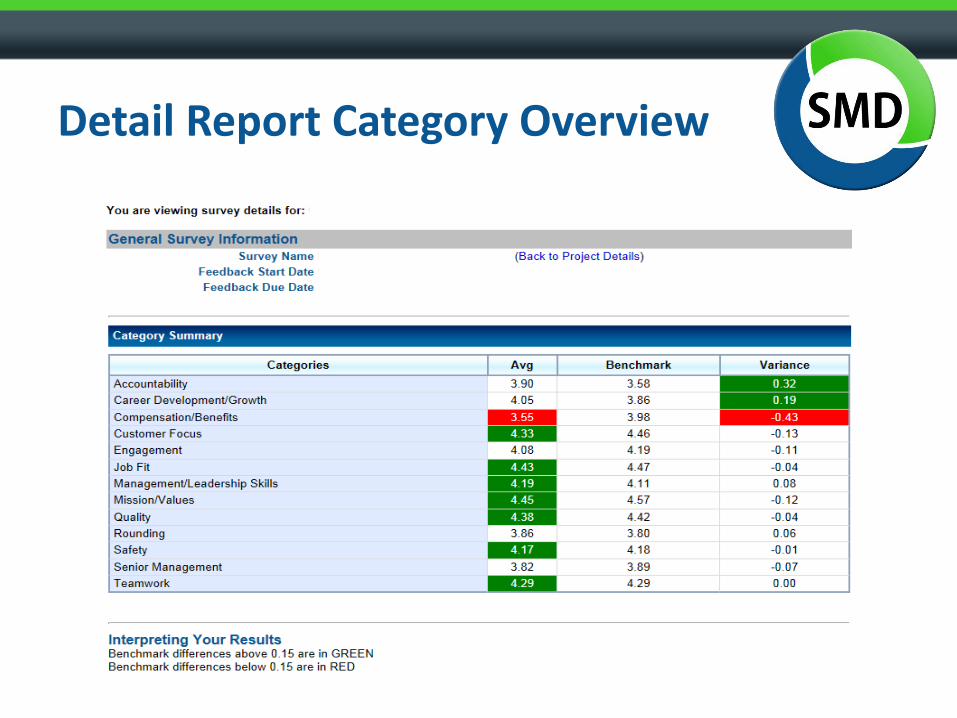
Detail Report Category Overview
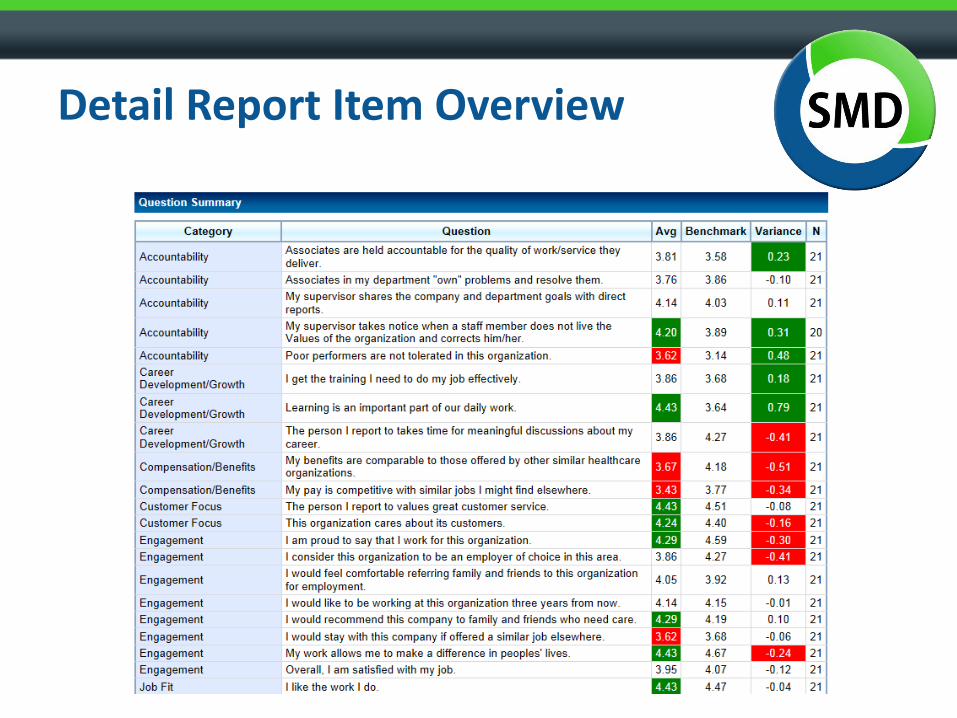
Detail Report Item Overview
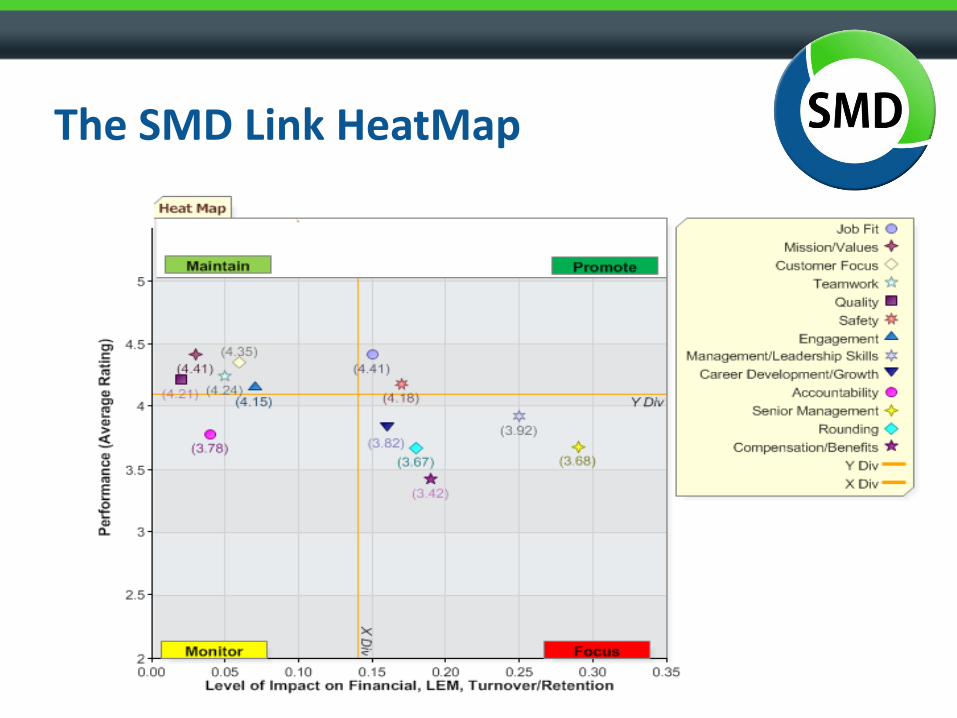
The SMD Link HeatMap

Guiding Principles for Action Planning
1. Focus on YOUR drivers of business outcomes
2. Keep it simple – focus on driving results and not sifting through reports
3. Identify drivers at systemic level, all the way down to front-line mangers
4. Move easily from prioritizing drivers of business outcomes to action planning
5. Provide customized tips that you want to deploy in your organization
6. Monitor compliance and analyze focus of action plans
7. Measure and report the impact of actions
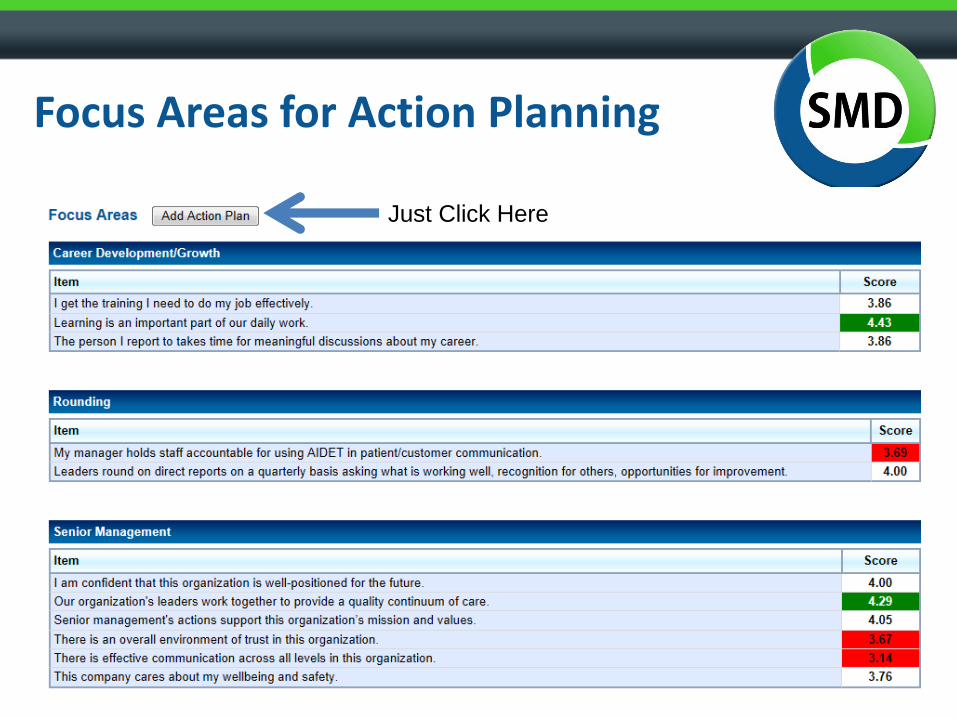
Focus Areas for Action Planning
Start an Action Plan
Just Click Here
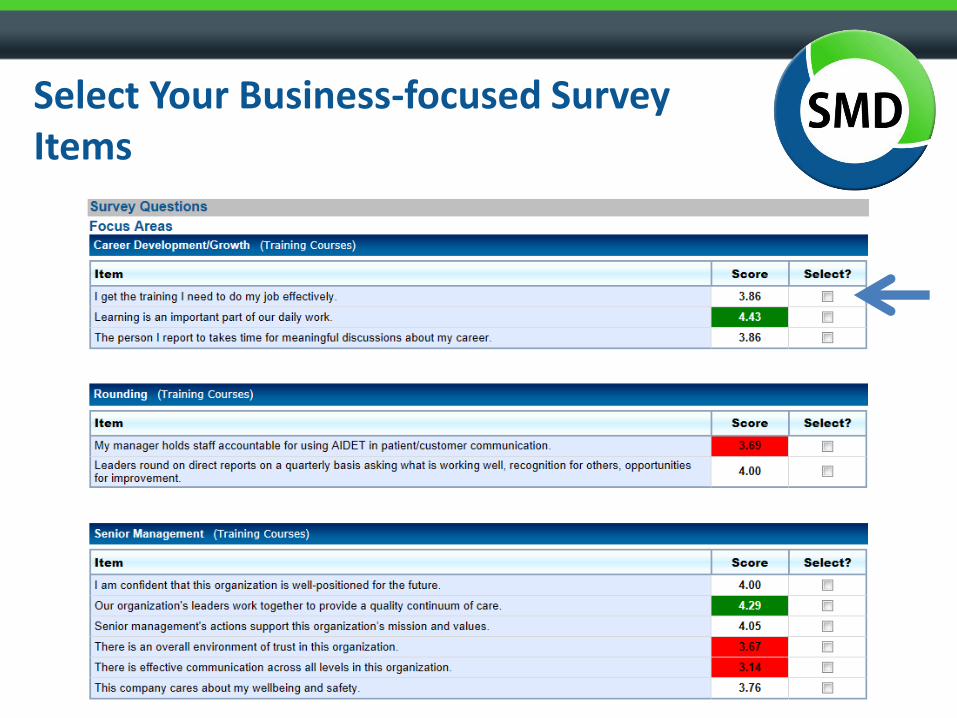
Select Your Business-focused Survey Items
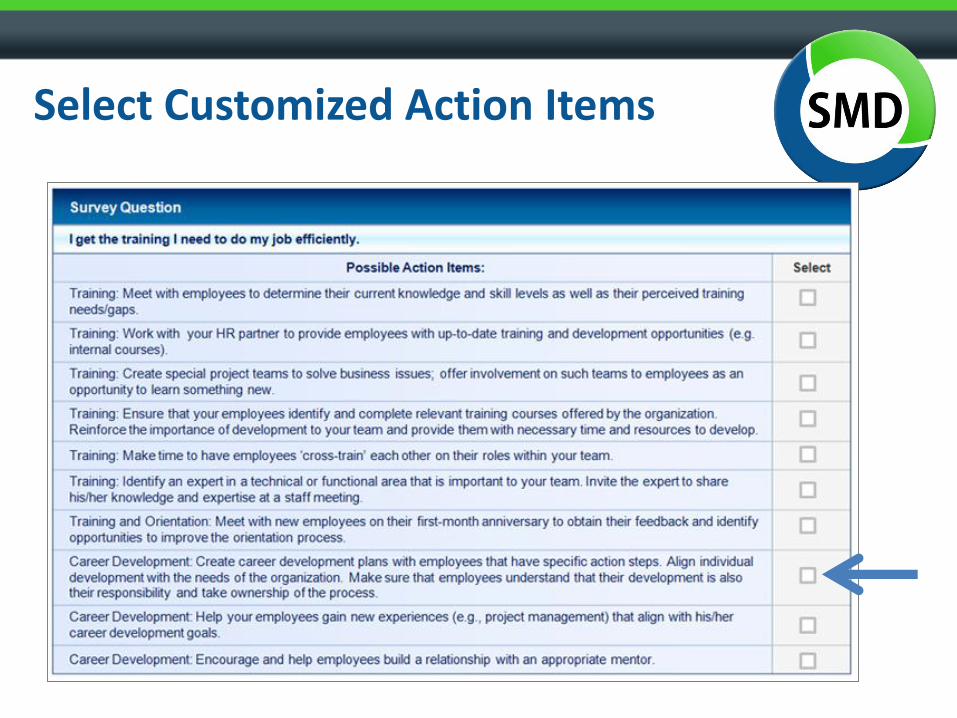
Select Customized Action Items
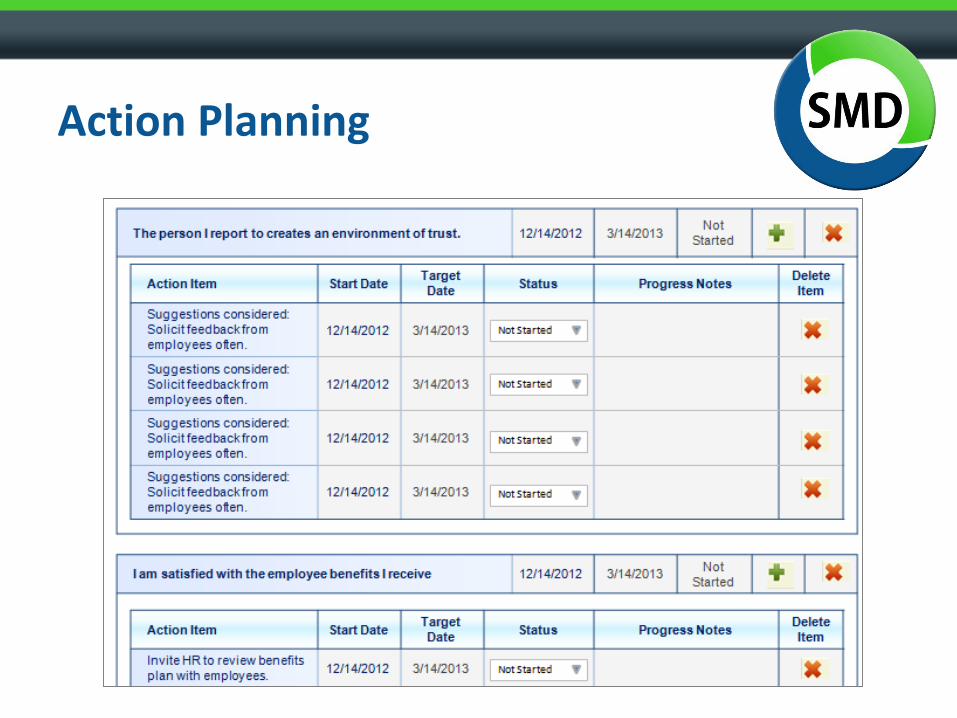
Action Planning

Ways to Report Data- Tell the Story
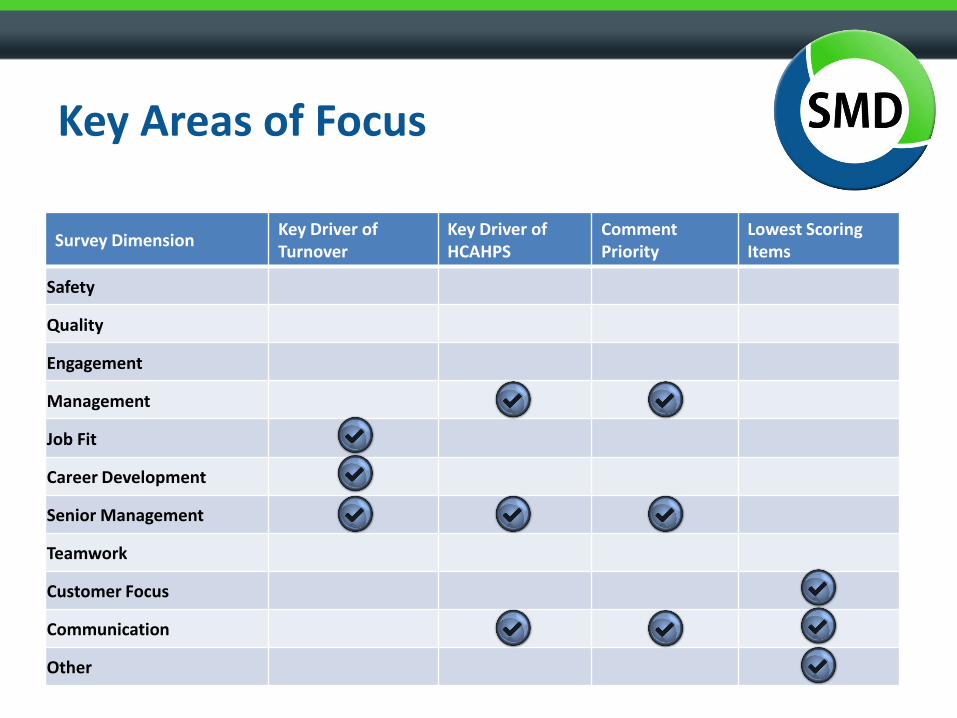
Key Areas of Focus
Survey DimensionKey Driver of Turnover
Key Driver of HCAHPS
CommentPriority
Lowest Scoring Items
Safety
Quality
Engagement
Management
Job Fit
Career Development
Senior Management
Teamwork
Customer Focus
Communication
Other
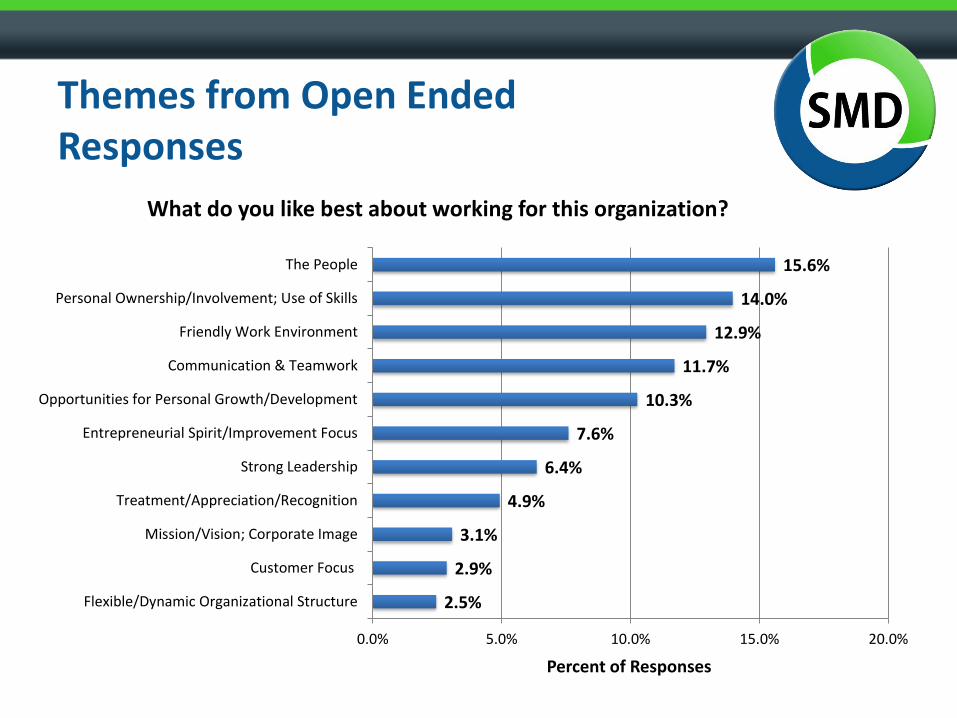
Themes from Open Ended Responses
2.5%
2.9%
3.1%
4.9%
6.4%
7.6%
10.3%
11.7%
12.9%
14.0%
15.6%
0.0% 5.0% 10.0% 15.0% 20.0%
Flexible/Dynamic Organizational Structure
Customer Focus
Mission/Vision; Corporate Image
Treatment/Appreciation/Recognition
Strong Leadership
Entrepreneurial Spirit/Improvement Focus
Opportunities for Personal Growth/Development
Communication & Teamwork
Friendly Work Environment
Personal Ownership/Involvement; Use of Skills
The People
Percent of Responses
What do you like best about working for this organization?
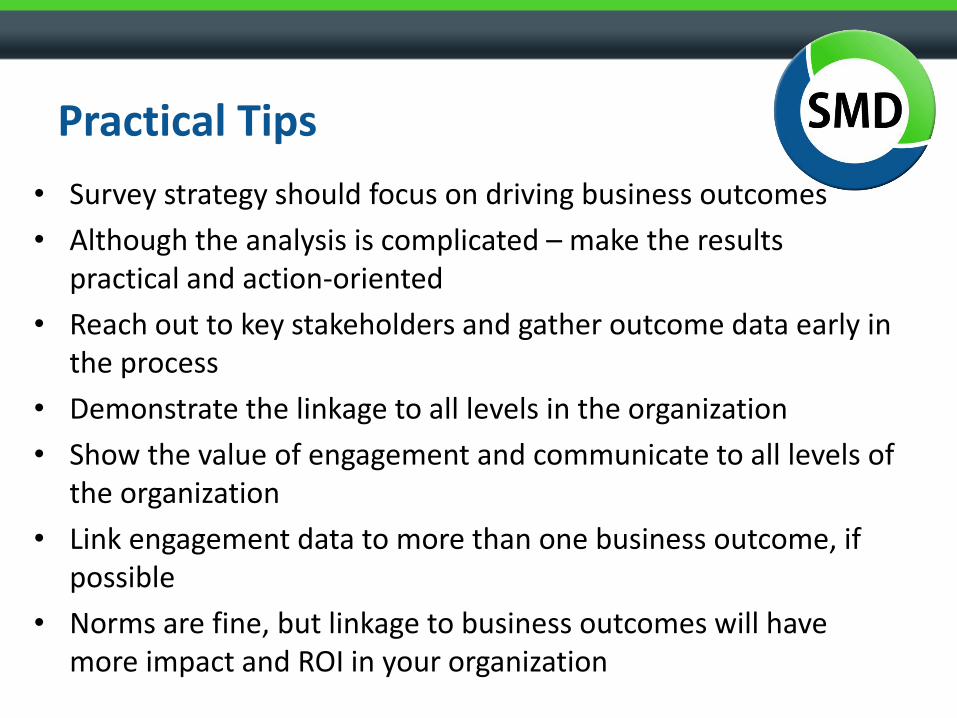
Practical Tips
• Survey strategy should focus on driving business outcomes
• Although the analysis is complicated – make the results practical and action-oriented
• Reach out to key stakeholders and gather outcome data early in the process
• Demonstrate the linkage to all levels in the organization
• Show the value of engagement and communicate to all levels of the organization
• Link engagement data to more than one business outcome, if possible
• Norms are fine, but linkage to business outcomes will have more impact and ROI in your organization
Case Studies
43
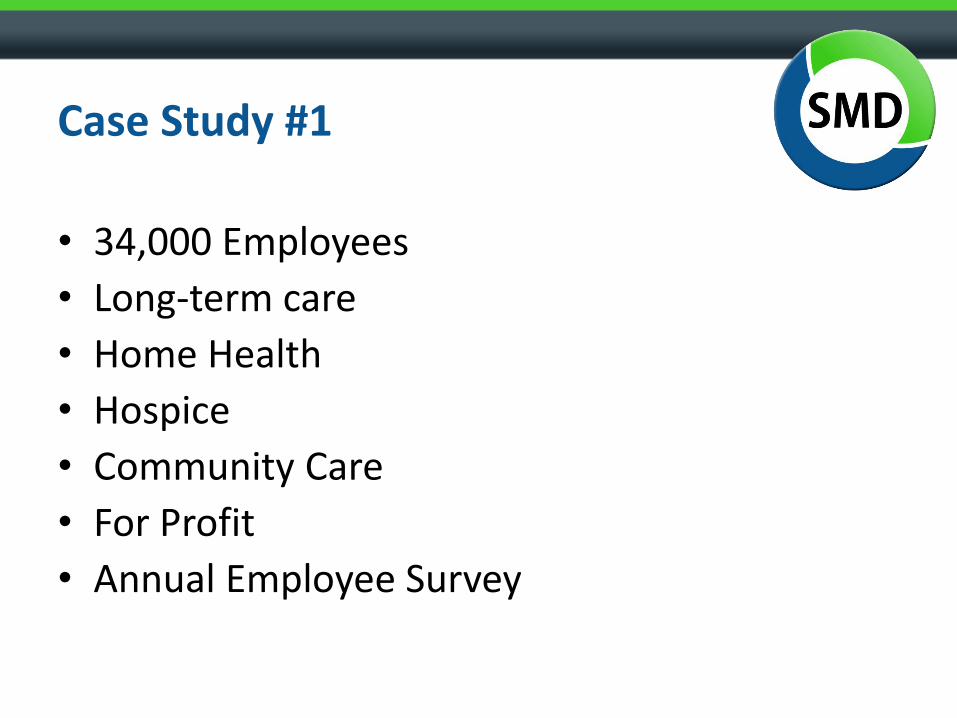
Case Study #1
• 34,000 Employees
• Long-term care
• Home Health
• Hospice
• Community Care
• For Profit
• Annual Employee Survey
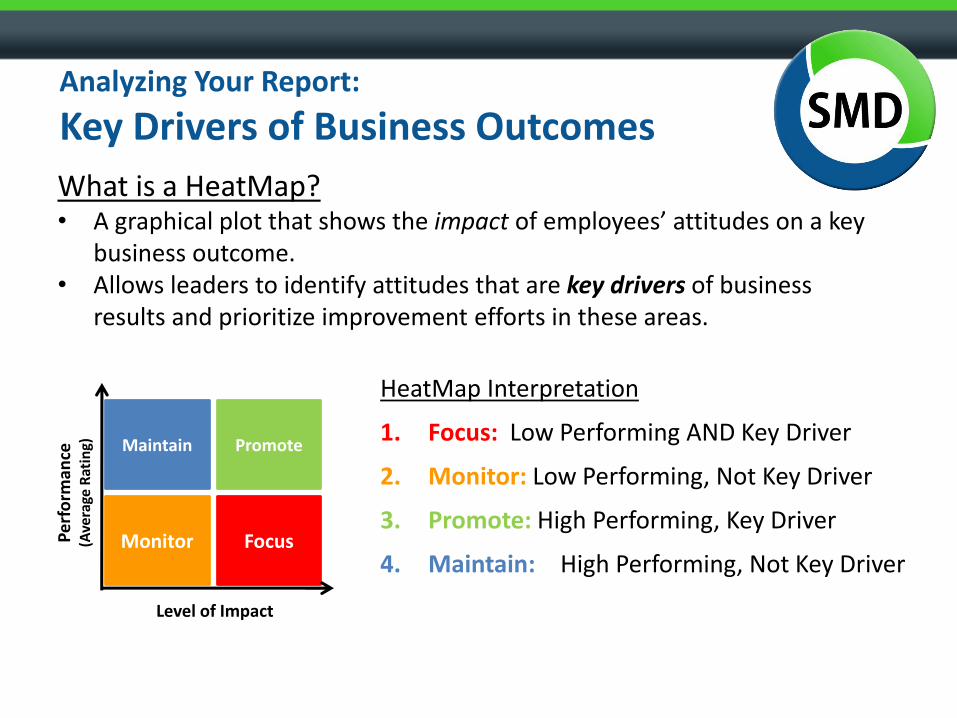
What is a HeatMap?• A graphical plot that shows the impact of employees’ attitudes on a key
business outcome.• Allows leaders to identify attitudes that are key drivers of business
results and prioritize improvement efforts in these areas.
Pe
rfo
rman
ce
(Ave
rage
Rat
ing)
Level of Impact
Maintain Promote
Monitor Focus
HeatMap Interpretation
1. Focus: Low Performing AND Key Driver
2. Monitor: Low Performing, Not Key Driver
3. Promote: High Performing, Key Driver
4. Maintain: High Performing, Not Key Driver
Analyzing Your Report:
Key Drivers of Business Outcomes
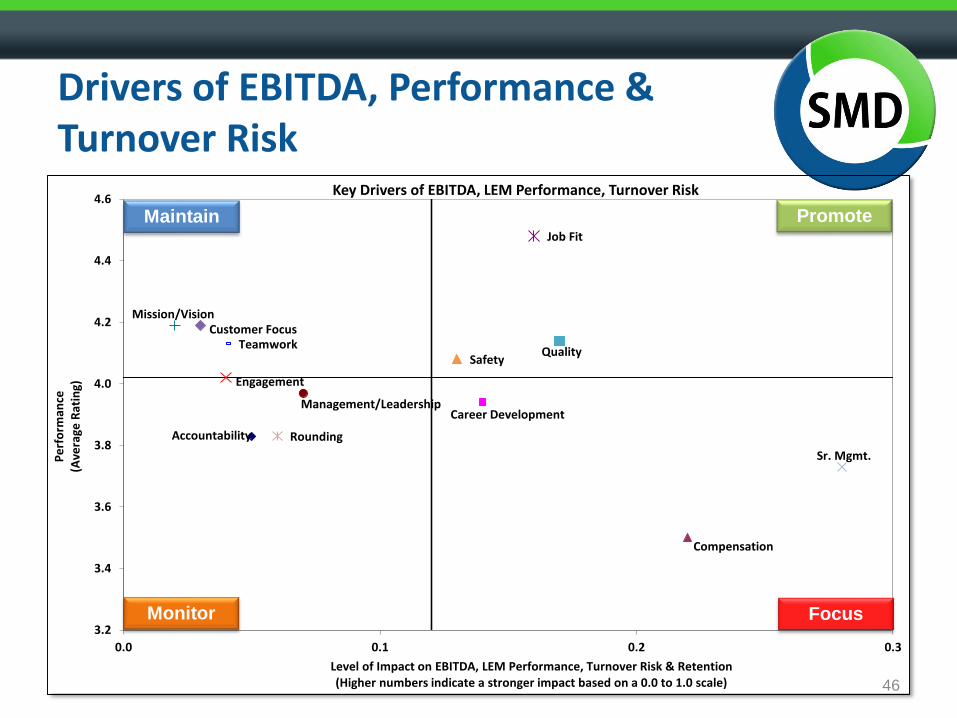
Drivers of EBITDA, Performance & Turnover Risk
46
Accountability
Career Development
Compensation
Engagement
Job Fit
Management/Leadership
Mission/Vision
TeamworkCustomer Focus
Quality Safety
Sr. Mgmt.
Rounding
3.2
3.4
3.6
3.8
4.0
4.2
4.4
4.6
0.0 0.1 0.2 0.3
Pe
rfo
rman
ce
(Ave
rage
Rat
ing)
Level of Impact on EBITDA, LEM Performance, Turnover Risk & Retention(Higher numbers indicate a stronger impact based on a 0.0 to 1.0 scale)
Key Drivers of EBITDA, LEM Performance, Turnover Risk
Maintain Promote
FocusMonitor
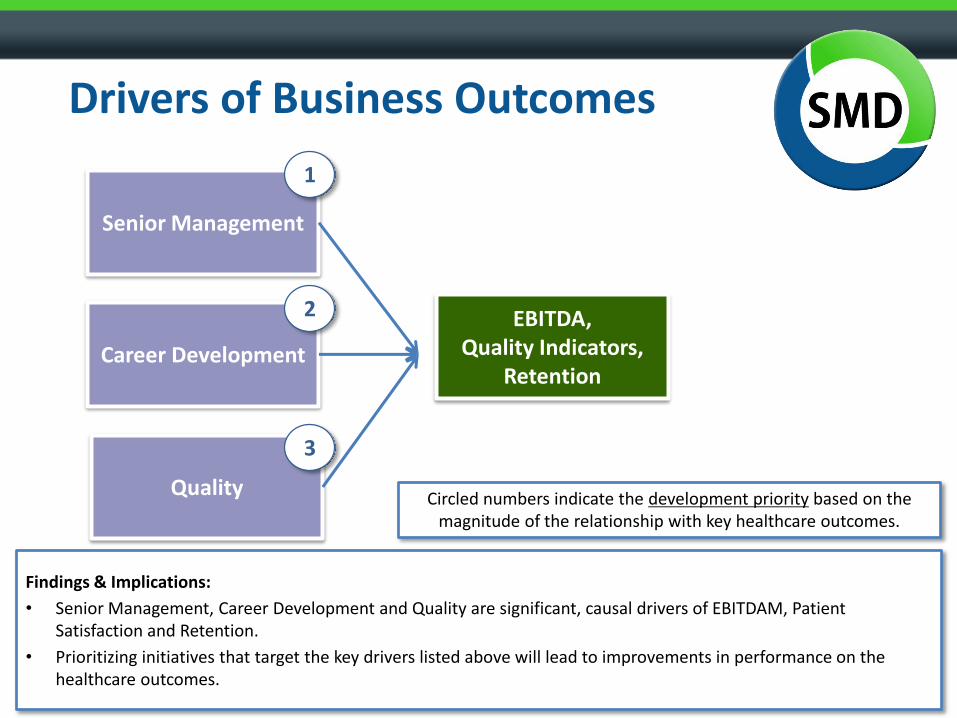
Drivers of Business Outcomes
Quality
Career Development
Senior Management
EBITDA, Quality Indicators,
Retention
1
2
3
Circled numbers indicate the development priority based on the magnitude of the relationship with key healthcare outcomes.
Findings & Implications:
• Senior Management, Career Development and Quality are significant, causal drivers of EBITDAM, Patient Satisfaction and Retention.
• Prioritizing initiatives that target the key drivers listed above will lead to improvements in performance on the healthcare outcomes.
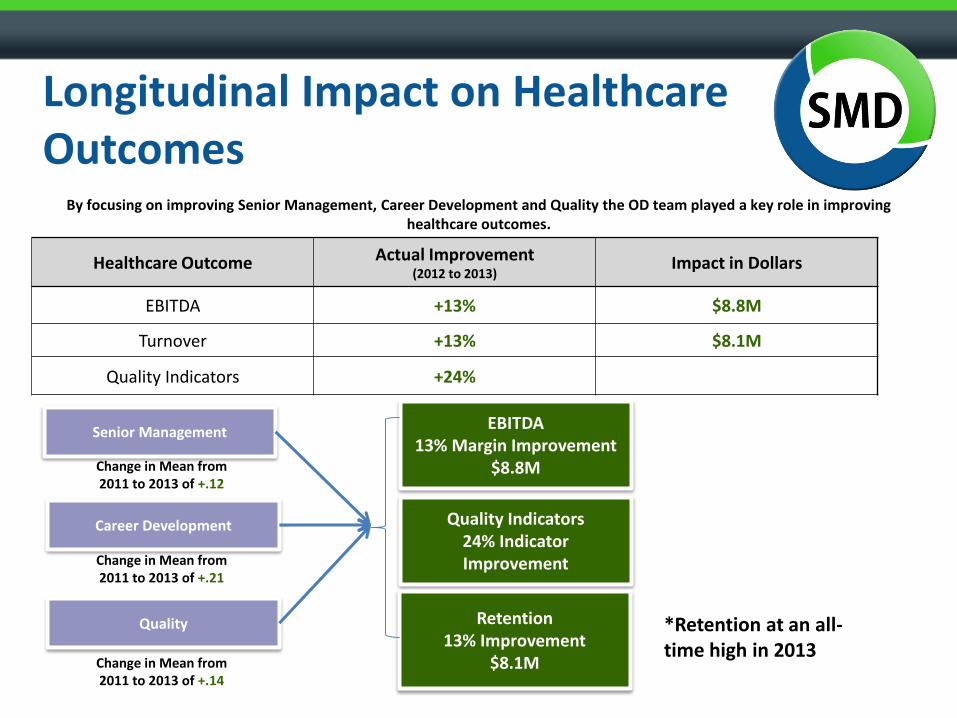
Longitudinal Impact on Healthcare Outcomes
Quality
Career Development
Senior ManagementEBITDA
13% Margin Improvement$8.8M
Quality Indicators24% Indicator Improvement
Change in Mean from2011 to 2013 of +.12
Change in Mean from2011 to 2013 of +.14
Change in Mean from2011 to 2013 of +.21
299Scripts 371 Scripts
2009 2011
Healthcare Outcome Actual Improvement (2012 to 2013)
Impact in Dollars
EBITDA +13% $8.8M
Turnover +13% $8.1M
Quality Indicators +24%
23% 24%
2009 2011
By focusing on improving Senior Management, Career Development and Quality the OD team played a key role in improving healthcare outcomes.
Retention13% Improvement
$8.1M
*Retention at an all-time high in 2013
What We Have Covered
• Driving business outcomes with employee surveys
• How to create the right survey instrument for your organization
• How to analyze survey data for maximum impact
• How to present data to managers to create action and make the process easy
• Driving impact at the individual and local level