strategic restructuring -...
TRANSCRIPT

STRATEGICRESTRUCTURINGAnnual Report 2018

www.majaal.com MajaalWarehouseCo MajaalWarehouse Majaal-Warehouse-Co.
www.firstbahrain.com FirstBahrain First-Bahrain-Real-Estate-Development-Co.
www.elmercadojanabiya.com www.elmercadovillage.com ElMercadoJ ElMercadoJ ElMercadoJ
Kuwait Office City Tower, 2nd Floor,Khaled Ibn Al Waleed St., Sharq. PO Box 64679, Shuwaikh (B) 70457, State of KuwaitT (+965) 22414902 F (+965) 22414903 E [email protected]
Bahrain Office Almoayyed Tower, Suite 501, Seef District, PO Box 75622, Manama, Kingdom of BahrainT (+973) 17567555 F (+973) 17567556 E [email protected]
His HighnessSheikh Sabah Al-Ahmad Al-Jaber Al-Sabah
Amir of the State of Kuwait
His MajestyKing Hamad bin Isa Al Khalifa
King of the Kingdom of Bahrain
His HighnessSheikh Nawaf Al-Ahmad Al-Jaber Al-Sabah
Crown Prince of the State of Kuwait
His Royal HighnessPrince Salman bin Hamad Al Khalifa
The Crown Prince and Deputy Supreme Commander and First Deputy Prime Minister
of the Kingdom of Bahrain
His HighnessSheikh Jaber Al-Mubarak Al-Hamad Al-Sabah
Prime Minister of the State of Kuwait
His Royal HighnessPrince Khalifa bin Salman Al Khalifa
The Prime Minister of the Kingdom of Bahrain

Annual Report 2018 | 54 | Strategic Restructuring
Contents6 Company Profile
8 Vision and Mission
10 Report of the Board of Directors
12 Diversified and Growing Portfolio
18 Board of Directors
20 Executive Management
22 Corporate Governance
27 Report of the Sharia Advisory Board
30 Report of the Independent Auditors
32 Consolidated Financial Statements

Annual Report 2018 | 76 | Strategic Restructuring
Company ProfileFirst Bahrain Real Estate Development Co. K.S.C. (First Bahrain) is an innovative real estate investment company, dedicated to achieving sustainable returns through collaborative relationships.
First Bahrain creates enduring value for all stakeholders with a demand-driven investment approach. Operating out of offices in Kuwait and Bahrain, the Company is strategically positioned to execute projects across the GCC.
Established in October 2004 in Kuwait as Baraq Al Khaleej Holding Company, with a paid-up capital of KD 1 million, the corporate name was later changed to First Bahrain Real Estate Development Company, and the paid-up capital was increased. In 2007, First Bahrain opened an office in the Kingdom of Bahrain. Since its inception, the Company has been guided by the principles of Islamic Sharia in all its daily operations and business interests.
The principal shareholders of First Bahrain are leading regional institutions and high-profile real estate investors, including Global Investment House – Client Accounts, Action Group Holdings Co., Wafra International Investments Co. – Client Accounts, Esterad Investment Co. KAMCO Investments – Client Accounts, and the General Retirement and Social Authority of the State of Qatar.
First Bahrain owns or holds rights to over 1,000,000 square feet of strategically located lands in the Kingdom of Bahrain.
The Company’s inaugural project, Majaal, is a flexible-use industrial facility designed to support Small-to-Medium-sized Enterprises (SMEs). The facility is located at the Bahrain Investment Wharf (BIW), within Salman Industrial City, near to both the new Khalifa bin Salman Port and the Bahrain International Airport. Comprised of seven buildings developed between 2009 and 2014, the complex is now operating at full occupancy, functioning as home to over 30 businesses representing a range of activities from FMCG distributors to small manufacturers.
The Company initiated a mixed-use development in Janabiya in 2015, completing the commercial phase in early 2016. El Mercado Janabiya, a neighbourhood market with an upscale outdoor experience, has identified a niche market within its catchment area, providing the community food and beverage options, important services and an anchor high-end grocer. Construction of the residential phase consisting of 42 stand-alone and semi-detached homes began in 2016 and was completed in 2018. El Mercado Village is now a thriving community with a growing number of residents as pre-sold homes were handed over and occupied by the new owners.
With the addition of commercial and residential developments to its portfolio of industrial properties, the Company has diversified its holdings and is looking towards building its portfolio of income generating assets as it pursues its new projects in Seef for which it will break ground in 2019.
Despite the negative economic shocks coming from lower oil prices, removal of subsidies and new taxes, the bold strategic restructuring the Company is now taking will set it up for a season of sustainable performance going forward as it grows its revenue across multiple sectors by converting its raw land holdings into robust income generating assets. Marked by entrepreneurial leadership, commitment and integrity, First Bahrain is actively putting its potential to work for benefit of all its stakeholders.

Annual Report 2018 | 98 | Strategic Restructuring
Our Vision
Our vision is to realise value potential.
Our Values
Our values drive our behaviour. First Bahrain’s four core values flow from who we are as people and shape who we are as a Company, enabling us to achieve our vision and mission. These values are also in rank order. If there is any conflict between two values, we choose conduct in line with the higher value.
Our MissionWith entrepreneurial vision and innovation, First Bahrain exists to initiate and orchestrate real estate developments which bring enduring value and sustainable prosperity to both our communities and to our shareholders, through partnerships and investments made in accordance with the principles of Sharia.
IntegrityWe are passionate and committed to our principles. Driven by Islamic values, we stand by our corporate social responsibilities. Our expertise and dedication enables us to transcend traditional ideas, and offer clients inspired and meaningful solutions.
PartnershipWe continue to build an international network of strategic alliances. These alliances share our vision of maximizing Return of Investment in accordance with the principles of Sharia. In working together with select partners, we develop a strong and secure support-structure and move forward with confidence and strength.
InnovationWe embrace creativity in a constantly changing environment and provide intelligent solutions to capitalise upon these developments. Through dynamic planning, we enhance stakeholder value, increase investor opportunity, and spearhead regional real estate growth to higher levels.
ProsperityOur understanding and insight into the real estate market is the driving force that enables us to ensure continued prosperity for all our shareholders. We have established an energetic culture that both demands and rewards excellence throughout every business venture.

Annual Report 2018 | 1110 | Strategic Restructuring
Report of the Board of DirectorsOn behalf of the Board of Directors, it is my duty to present this Annual Report and Consolidated Financial Statements of First Bahrain for the year ended 31 December 2018.
2018 has been a year of significant milestones in the history of the Company. El Mercado Village, our first residential project, concluded construction and we handed over 15 of these newly finished homes to their new owners by year end. In doing so, the Company achieved its first cash exit from the sale of developed property. In bringing this project to completion, we were the very first company in Bahrain to secure approval from the Real Estate Regulatory Authority (RERA) to release funds from off-plan sales which had been held in escrow during construction. We are very proud of our leadership and full compliance within this new legal framework intended to restore investor confidence within the local real estate market.
Supported by this major achievement, the Board approved commencement of a new commercial project on our land in Seef, activating this strategic property on which the Company was founded. This new investment will utilize 68.7% of the value of our dormant land bank, developing two of the four vacant plots into income generating commercial properties by the end of 2020. The first phase of the project is an outdoor, food & beverage and convenience-oriented retail centre. The development will offer a mix of casual dining restaurants, cafés, shopping, and services featuring terraced views and outdoor seating. Anchoring the combined development, the second phase will feature the first Jarir Bookstore in the Kingdom of Bahrain. One of the strongest and enduring home-grown brands from the Kingdom of Saudi Arabia, Jarir Bookstore now operates across the GCC and this built-to-suit facility
represents their ongoing commitment to regional expansion. Jarir Bookstore has made a long-term commitment which will serve as a major demand driver for the rest of our project, ensuring its long-term success. Construction for the commercial development in Seef will begin in early 2019.
The Company made these accomplishments in a particularly difficult macro-economic environment which tempers these positive results. Lack of arm’s length cash transactions over the past several years have led to a growing disparity in perceived land values. Having held our Seef land value constant since 2013 due to the lack of any tangible evidence indicating otherwise, the Board felt the time was right to take a more conservative view, considering the expected yields achievable when developing the land. Accordingly, a pair of independent reports indicated that the fair value of the Seef land should be reduced by 29% while they also reduced our leasehold industrial property by 12%. The resulting loss in the fair value of our investment property was KD (5,514,460), the primary driver in the KD (5,336,679) loss which we are reporting this year.
Acknowledging this value reduction is the first step of a strategic restructuring program which we have embarked on to move the Company forward.
Reviewing the rest of the performance for 2018, the Company was profitable on an operating basis, despite downward pressure in market rents and some tenant defaults that resulted in a 14.5% reduction in net rental income, our diversified
industrial and commercial portfolio produced us KD 1,116,656. Recognizing the sale of 15 villas, we added another KD 2,605,738 in revenue against the cost of sales of KD (2,401,263) for a net gain of KD 204,475. Operating costs were reduced by 8.7% thanks to a reduction of our financing expense.
Looking at the balance sheet, the 18.5% reduction in the value of investment property led to the contraction in the value of total assets to KD 30,554,392. Developing properties of KD 3,454,750 reflect the remaining homes which are in inventory and available for sale, hence their position within current assets. Thanks to the home sales, the net cash position of the Company improved by 79% over the year, ending with a quick ratio of 1.2, indicating that the Company is in a strong position to meet its current and expected obligations. The money gained from the remaining home sales will support a dividend payment to shareholders in the year ahead.
Overall debt decreased by 2% to a total value of KD 6,930,754 as the Company utilized facilities for construction of the homes while it also made payments towards its other Islamic finance obligations. At 34.1%, our debt to equity ratio is at a very healthy level with ample room for the expected KD 2.4 million in additional debt which the Company will take in 2019 to construct its Seef projects. The additional financing secured highlights the strength of our banking relationships and market confidence in our ability to continue the self-funding of our projects and the creation of new streams of revenue.
Development of the remaining Seef plots will be a priority in the years ahead as we convert all our dormant assets into active generators of revenue for the shareholders.
The Company will continue exploring means to realize cash exits from existing income generating properties to create liquidity for further expansion and dividends. During the year ahead, the Company expects to make its shares available for trading on the OTC market within Boursa Kuwait. It will also be exploring other means to gain liquidity through the capital markets. Wherever the Company invests, it will make sure we are adding value and contributing to the local community in keeping with its values.
Transitions and AcknowledgmentsThis past year managed a major transition in the life of the Company as our founding CEO, Amin Al Arrayed resigned to accept the leadership of Edamah, the real estate arm of the sovereign wealth fund of the Kingdom of Bahrain. On behalf of the Board, I extend to Amin our sincere appreciation for his eleven years of service and we wish him well in his new position of national responsibility.
As the year ended, the Board selected one of our own, Mr. Omar Al Temiemy to take the helm as the new Chief Executive. He has begun his assignment from the first of this new year. On the occasion of this transition, I would like to thank him for his insight and dedication he has provided the Board these past four years. I am confident that he will make a tangible and enduring impact as he leads the company
going forward. We enter this new era with great hope and expectation knowing that we have concluded a smooth leadership transition and that our new head has already been stewarding well the interests of our stakeholders these past four years. He will lead us well.
Looking to our national leadership, I extend my best wishes to H.H. Sheikh Sabah Al-Ahmad Al-Jaber Al-Sabah, the Amir of the State of Kuwait, to H.H. Sheikh Nawaf Al-Ahmad Al-Jaber Al-Sabah, the Crown Prince of the State of Kuwait, and to H.H. Sheikh Jaber Al-Mubarak Al-Hamad Al-Sabah, Prime Minister of the State of Kuwait, for their wise guidance and dedication to advancing the growth and development of the State of Kuwait.
In like manner, I am grateful for the faithful and well-considered leadership of H.M. the King Hamad bin Isa Al Khalifa, King of the Kingdom of Bahrain, H.R.H. the Crown Prince, Salman bin Hamad Al Khalifa, The Crown Prince and Deputy Supreme Commander and First Deputy Prime Minister of the Kingdom of Bahrain and H.R.H. the Prime Minister, Khalifa bin Salman Al Khalifa, the Prime Minister of the Kingdom of Bahrain. We celebrate with you the significant oil discovery this year and we share the hope for the economy of Kingdom of Bahrain which this represents.
Furthermore, I express appreciation to all governmental ministries, supervisory bodies, and regulatory authorities of both countries, for their constructive support and wise guidance.
To our shareholders, I sincerely appreciate your patience and trust as we go through this strategic restructuring process to position us for a new season of growth. It is my honour and privilege to continue to provide guidance and leadership to the Company. To our management and staff, I sincerely appreciate your faithful and professional service which has ensured a smooth and stable leadership transition. Your continued loyalty and commitment demonstrated through your diligent efforts to improve and develop the Company will be required to help us achieve this new era of sustainable performance. Keep up the hard work and together we will reap the rewards.
May Almighty Allah grant us all sustained prosperity and growth.
Waleed Ahmed AlkhajaChairman

Annual Report 2018 | 1312 | Strategic Restructuring
Diversified and Growing Portfolio
COMMERCIAL SECTOR 39%
Jarir Bookstore Location: Corner of Road 2819 and Road 4653Seef 346 Kingdom of Bahrain:
Jarir Bookstore is one of the strongest brands in the Kingdom of Saudi Arabia. This new big box retail project is being custom designed to meet the needs of the client who are making their first entry into the Bahrain market after successful expansions into Kuwait and other GCC countries.
Value: US$ 15.2 million
Leasable Area: 38,000 square feet
Start of Construction: Q3 2019
Expected Completion: Q4 2020
Seef Retail Project Location: Corner of Road 2819 and Road 4653Seef 346 Kingdom of Bahrain
The new Seef project is a retail centre designed to provide a mix of casual dining restaurants, cafés, shopping, and services featuring terraced views and outdoor seating.
Value: US$ 21.5 million
Leasable Area: 45,200 square feet
Start of Construction: Q1 2019
Expected Completion: Q2 2020

Annual Report 2018 | 1514 | Strategic Restructuring
RESIDENTIAL SECTOR 13%
El Mercado Village – 42-villa residential development Location: Avenue 79 Janabiya 575 Kingdom of Bahrain
The El Mercado Village project celebrated completion this year. Designed in a Spanish and Mediterranean style, the homes are complementary in style to the adjacent retail development. Project zoning is RHA (row houses) enabling the development of 34 semi-detached and 8 stand-alone villas.
The Company received a license to sell off-plan in January 2017 and established a project escrow account in full compliance with the new real estate laws designed to protect the interests of home buyers. The project was the first under this new escrow system to receive regulatory clearance to release the funds upon successful delivery of the pre-sold properties.
Funding for the project has been secured from Kuwait Finance House.
The occupants of the homes are now demand drivers for the businesses which locate within the retail centre. The two projects will benefit from each other’s success.
Value: US$ 11.4 million
Total Remaining Units: 27
Total Land Area: 109,900 square feet
Start of Construction: Q4 2016
Date of Completion: Q3 2018
Commencement of Handovers: Q3 2018
El Mercado Janabiya – a neighbourhood retail centre Location: Corner of Avenues 27 and 79 Janabiya, 575 Kingdom of Bahrain
El Mercado Janabiya is a neighbourhood retail centre designed to provide a mix of casual dining restaurants, cafés, shopping, and services supported by an anchor supermarket. Strong foot-traffic has been maintained through active marketing, social media and regular events.
The facility has 120 covered car parks at ground level. The majority of the shops are on an elevated, landscaped open air platform cooled with shading and water features.
The development sits on a 86,600 square foot plot in Block 575 of Janabiya.
Value: US$ 13.8 million
Average Occupancy at 31 December: 89%
Leasable Area: 50,408 square feet
Start of Construction: Q2 2015
Date of Completion: Q2 2016
Commencement of Operations: Q3 2016
Grand Opening: Q4 2016

Annual Report 2018 | 1716 | Strategic Restructuring
INDUSTRIAL SECTOR 37%
Majaal Warehouse at BIW Location: Bahrain Investment Wharf, Salman Industrial City, Kingdom of Bahrain
Majaal is a leading provider of industrial facilities for Small to Medium-sized Enterprises (SMEs), a market segment which constitutes the engine of growth for every economy. As developer and operator of these flexible multi-purpose facilities, Majaal seeks to facilitate the growth of business and industry in the markets we serve.
The first Majaal property is located at the Bahrain Investment Wharf (BIW) within the Salman Industrial City, providing easy access to Khalifa bin Salman Port and other major transport links in Bahrain. Majaal holds land covering over 717,000 square feet in this modern and private industrial development.
The initial three S-Type buildings became operational in February 2010. Each building is sub-dividable into units as small as 2,500 square feet. Three more S-Type buildings were added to our inventory in June 2013.
The centrepiece of the development at BIW, completed during 2014, is our M-Type building, offering 150,000 square feet of net leasable area sub-divisible into units of minimum space of 10,700 square feet. The building features raised floors with adjustable dock-levellers to cater for direct on and off loading of trucks along with a 12m structure height to facilitate maximum storage density.
Value: US$ 34.4 million
Average Occupancy at 31 December: 95%
Leasable Area: 405,000 square feet
Start of Construction: Q1 2009
Date of Completion: Q2 2014
LAND BANK 11%
Seef District – just north of Bahrain City Centre Location: Corner of Road 2819 and Road 4653 Seef 346 Kingdom of Bahrain
The Company’s two remaining plots in the new central business district hold strategic value and significant potential. Having stabilized in value since the 2008 global financial crisis, the real estate cycle is approaching the point at which the economics are favourable for development again.
The Company will study the results of its first two projects in Seef before determining the best complimentary use of the land to maximize value.
Value: US$ 10.3 million
Land Area 50,860 square feet
Residential Sector
13%
Commercial Sector
39%
Industrial Sector
37%
Land Bank
11%
Portfolio of Investment Properties

Annual Report 2018 | 1918 | Strategic Restructuring
Board of Directors
Mr. Waleed Ahmed AlkhajaChairman
Mr. Alkhaja is a seasoned leader with a long career in investments. He served for 19 years in the Investment Directorate of the Kingdom of Bahrain’s Ministry of Finance, before joining the Pension Fund Commission of Bahrain as Director of Investment and Executive Director of the SIO Asset Management Company. In 2013, he became the Managing Director of AMAK Property & Development, a family firm. He served two terms on the Board of Directors of Seef Properties, Batelco Group and Bahrain Tourism Co. He currently serves on the Board of Directors of Reef Real Estate Finance Co. and Gulf Educational Projects (Applied Science University). Mr. Alkhaja holds a Bachelor’s degree in Business Administration from North Texas State University.
Mr. Bader Ghanem Al GhanemDirector, Remuneration Committee Chairman
Mr. Al Ghanem is the Senior Vice President for Asset Management, GCC at Global Investment House in Kuwait where he manages a portfolio valued in excess of USD 1 Billion. Prior to joining Global in 2010, he worked for Kuwait Middle East Financial Investment Company (KMEFIC) and Kuwait Financial Centre (Markaz) where he held positions in asset management and futures trading. Mr. Al Ghanem holds a Bachelor of Science degree in Electrical Engineering along with a Bachelor of Arts degree in Economics from Boston University.
Mr. Abdulaziz Al HumaidhiVice Chairman
Mr. Al Humaidhi is the Deputy General Manager of Action Real Estate Company in Kuwait. A member of Action Real Estate Company since 2016, Mr. Al Humaidhi comes with over 13 years of extensive experience in private sector real estate. While at Ajial Real Estate & Entertainment Company, he managed the construction of Kuwait’s tallest skyscraper, the Al Hamra Tower. He also worked in the Chicago, USA with Stanley Consultants, Inc. He served on the Board of Directors for Al Masaken International Real Estate Development Company and previously served as Chairman of Al Hamra Cinema Company, and as a board member for both Ecovert FM Kuwait for General Trading and Contracting and Gulf Real Estate Company. He holds a Bachelor of Science degree in Civil Engineering from the Santa Clara University in California, USA.
Mr. Ahmad Mohammad Al AjlanDirector
Mr. Al Ajlan is a well-respected senior leader with extensive experience in real estate and investment management. Currently serving as the Chairman for Al-Jahra Cleaning Company, Mr. Al Ajlan has served on the Board of Directors of Qurain Petrochemical Industries Company and Zumorroda Leasing & Finance Company. He previously worked as the General Manager of Real Estate House Company, Vice President of Qurain Holding Company and General Manager of Pearl of Kuwait Real Estate Company. Earlier, he also served with the Kuwait Clearing Company, Kuwait Lube Oil Company and the Public Industrial Authority. Mr. Al Ajlan holds a Bachelor’s degree in Business Studies with an emphasis in Marketing from Kuwait University.
Mr. Sulaiman Mohammad Al FuraihDirector, Audit and Risk Management Committee Chairman
Mr. Al Furaih is the Vice President of Financial Analysis for Wafra International Investment Company in Kuwait, where he has risen through the ranks over a distinguished 13 years career with the firm. He also serves as the Chairman of the Board of Directors for Sanam Real Estate Company, Chairman of the Board of Directors for Marbil Yapi Construction - Turkey and Chairman of the Board of Directors for Fanan Real Estate Company. Mr. Al Furaih holds a Bachelor of Science degree in Accounting and Auditing from Kuwait University.
Mrs. Hanan Hassan AbdulghaniDirector
Mrs. Abdulghani is the Head of Direct Investments at Esterad Investment Company B.S.C. who brings with her more than 14 years of investment experience in the private equity and real estate sectors. She sits on the boards of several investee companies on behalf of Esterad Investment Company. Mrs. Abdulghani holds a Bachelor of Science degree in Banking and Finance from the University of Bahrain and is a CFA Charterholder.
Mr. Omar Faysal Al TemeimyDirector
Mr. Al Temeimy is the former Vice President in the Investment Banking Department at Global Investment House in Kuwait. A previous member of the Global Investment House team since 2003, Mr. Al Temeimy brings significant experience in investment analysis and management. He holds a Bachelor’s degree in Economics, with a specialization in Finance, from the International Islamic University of Malaysia and a Master of Business Administration from the Kuwait Maastricht Business School.

Annual Report 2018 | 2120 | Strategic Restructuring
Daniel TaylorChief Financial Officer
An entrepreneur and professional management accountant with a wealth of operational and management experience, Mr. Taylor leads the Finance and Operations teams, overseeing the planning and execution of the Company’s strategic objectives. Prior to joining First Bahrain, he was General Manager of New York Coffee, and General Manager of Mariner Technologies, where he was the chief architect of the GCC business news portal, TradeArabia.com. He serves as a member of the Board of Directors of the American Chamber of Commerce in Bahrain and Al Raja School, Bahrain. He earned his Master of Business Administration from the Kellstadt Graduate School of Business at DePaul University, Chicago, USA; and his Bachelor of Arts from the University of Virginia, USA. Mr. Taylor holds the designations FCMA and CGMA through the Chartered Institute of Management Accountants (CIMA) and the Association of International Certified Professional Accountants (AICPA).
Yasser Abu-LughodChief Development Officer
Mr. Abu-Lughod brings over 37 years of international project management and engineering experience to the First Bahrain team where he leads the Company’s developments from concept to construction to commissioning and beyond. Prior to joining First Bahrain, Mr. Abu-Lughod worked as senior project manager for Mace International where he managed the infrastructure design and construction phases for Bahrain Bay Development project. He also held several senior posts at VicRoads in Victoria, Australia and GHD Global where he played a key role in the success of infrastructure projects in Al Khore Qatar. Mr. Abu-Lughod holds a B.Sc. in Civil Engineering from University of Wisconsin, Milwaukee; USA. He is a Charted Professional Engineer and a member of the Institution of Engineers in Australia, a holder of the Project Management Professional certification (PMP) and a member of the Project Management Institute (PMI).
Executive Management
Annual Report 2018 | 2322 | Strategic Restructuring
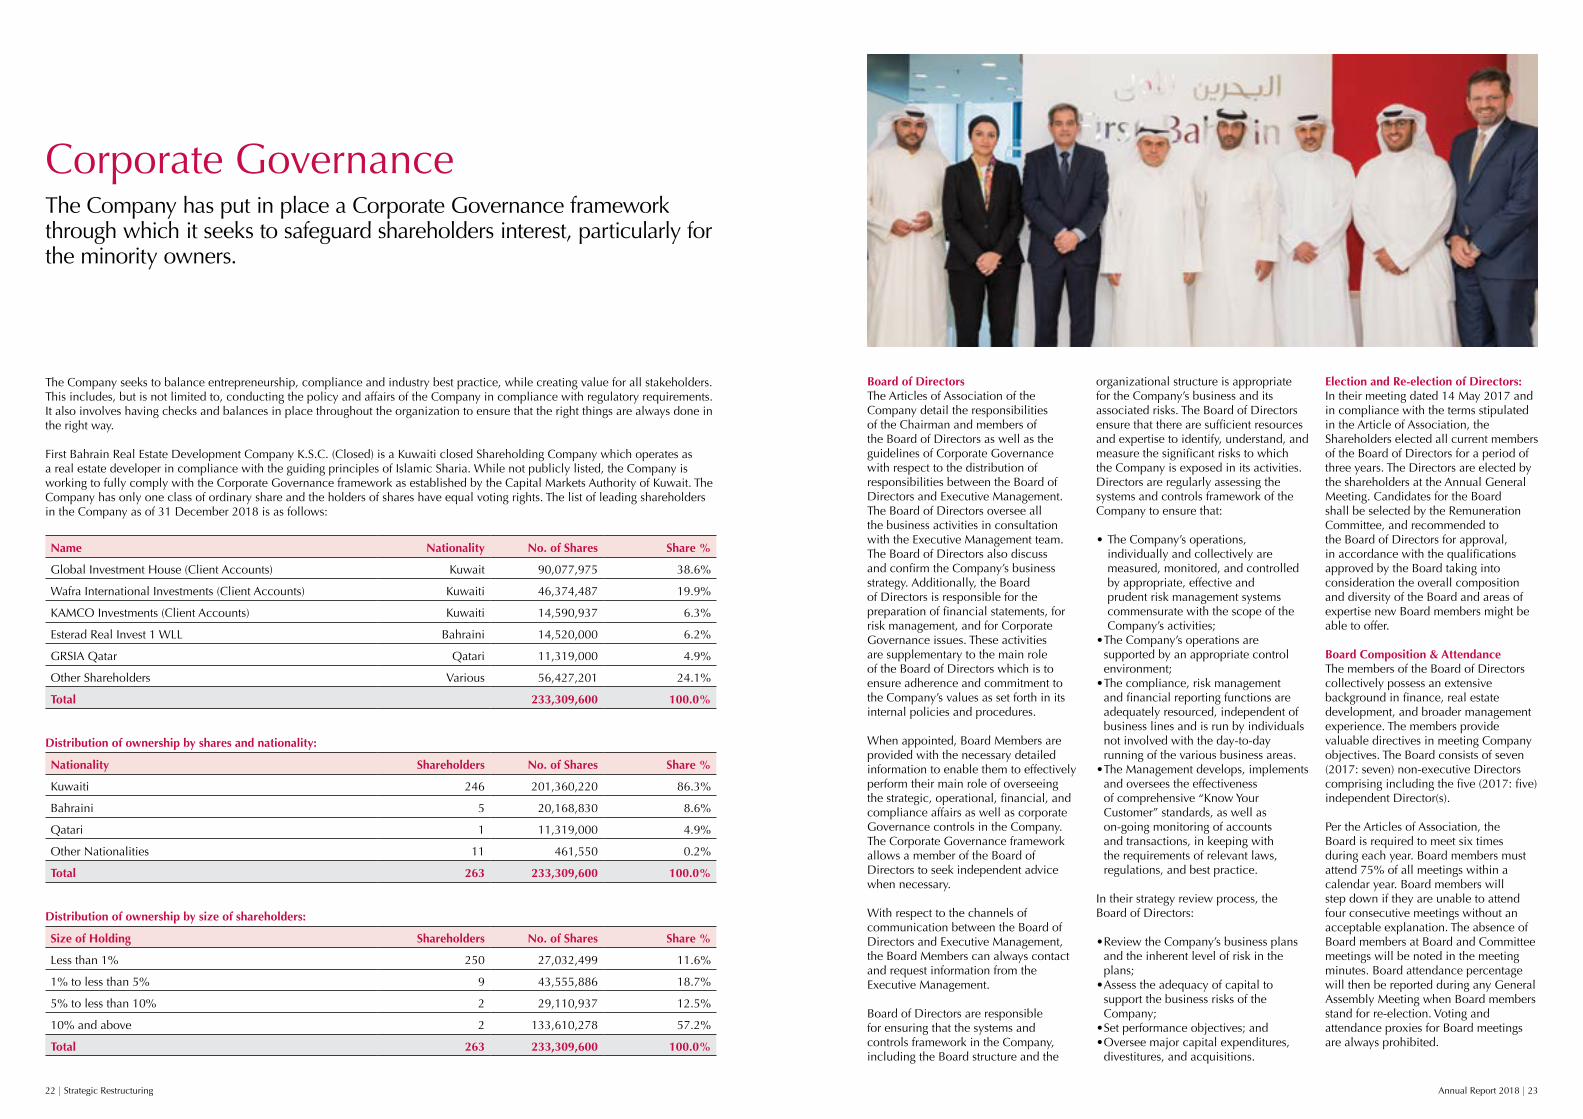
Corporate GovernanceThe Company has put in place a Corporate Governance framework through which it seeks to safeguard shareholders interest, particularly for the minority owners.
The Company seeks to balance entrepreneurship, compliance and industry best practice, while creating value for all stakeholders. This includes, but is not limited to, conducting the policy and affairs of the Company in compliance with regulatory requirements. It also involves having checks and balances in place throughout the organization to ensure that the right things are always done in the right way.
First Bahrain Real Estate Development Company K.S.C. (Closed) is a Kuwaiti closed Shareholding Company which operates as a real estate developer in compliance with the guiding principles of Islamic Sharia. While not publicly listed, the Company is working to fully comply with the Corporate Governance framework as established by the Capital Markets Authority of Kuwait. The Company has only one class of ordinary share and the holders of shares have equal voting rights. The list of leading shareholders in the Company as of 31 December 2018 is as follows:
Name Nationality No. of Shares Share %
Global Investment House (Client Accounts) Kuwait 90,077,975 38.6%
Wafra International Investments (Client Accounts) Kuwaiti 46,374,487 19.9%
KAMCO Investments (Client Accounts) Kuwaiti 14,590,937 6.3%
Esterad Real Invest 1 WLL Bahraini 14,520,000 6.2%
GRSIA Qatar Qatari 11,319,000 4.9%
Other Shareholders Various 56,427,201 24.1%
Total 233,309,600 100.0%
Distribution of ownership by shares and nationality:
Nationality Shareholders No. of Shares Share %
Kuwaiti 246 201,360,220 86.3%
Bahraini 5 20,168,830 8.6%
Qatari 1 11,319,000 4.9%
Other Nationalities 11 461,550 0.2%
Total 263 233,309,600 100.0%
Distribution of ownership by size of shareholders:
Size of Holding Shareholders No. of Shares Share %
Less than 1% 250 27,032,499 11.6%
1% to less than 5% 9 43,555,886 18.7%
5% to less than 10% 2 29,110,937 12.5%
10% and above 2 133,610,278 57.2%
Total 263 233,309,600 100.0%
Board of DirectorsThe Articles of Association of the Company detail the responsibilities of the Chairman and members of the Board of Directors as well as the guidelines of Corporate Governance with respect to the distribution of responsibilities between the Board of Directors and Executive Management. The Board of Directors oversee all the business activities in consultation with the Executive Management team. The Board of Directors also discuss and confirm the Company’s business strategy. Additionally, the Board of Directors is responsible for the preparation of financial statements, for risk management, and for Corporate Governance issues. These activities are supplementary to the main role of the Board of Directors which is to ensure adherence and commitment to the Company’s values as set forth in its internal policies and procedures.
When appointed, Board Members are provided with the necessary detailed information to enable them to effectively perform their main role of overseeing the strategic, operational, financial, and compliance affairs as well as corporate Governance controls in the Company. The Corporate Governance framework allows a member of the Board of Directors to seek independent advice when necessary.
With respect to the channels of communication between the Board of Directors and Executive Management, the Board Members can always contact and request information from the Executive Management.
Board of Directors are responsible for ensuring that the systems and controls framework in the Company, including the Board structure and the
organizational structure is appropriate for the Company’s business and its associated risks. The Board of Directors ensure that there are sufficient resources and expertise to identify, understand, and measure the significant risks to which the Company is exposed in its activities. Directors are regularly assessing the systems and controls framework of the Company to ensure that:
• The Company’s operations, individually and collectively are measured, monitored, and controlled by appropriate, effective and prudent risk management systems commensurate with the scope of the Company’s activities;
• The Company’s operations are supported by an appropriate control environment;
• The compliance, risk management and financial reporting functions are adequately resourced, independent of business lines and is run by individuals not involved with the day-to-day running of the various business areas.
• The Management develops, implements and oversees the effectiveness of comprehensive “Know Your Customer” standards, as well as on-going monitoring of accounts and transactions, in keeping with the requirements of relevant laws, regulations, and best practice.
In their strategy review process, the Board of Directors:
• Review the Company’s business plans and the inherent level of risk in the plans;
• Assess the adequacy of capital to support the business risks of the Company;
• Set performance objectives; and• Oversee major capital expenditures,
divestitures, and acquisitions.
Election and Re-election of Directors:In their meeting dated 14 May 2017 and in compliance with the terms stipulated in the Article of Association, the Shareholders elected all current members of the Board of Directors for a period of three years. The Directors are elected by the shareholders at the Annual General Meeting. Candidates for the Board shall be selected by the Remuneration Committee, and recommended to the Board of Directors for approval, in accordance with the qualifications approved by the Board taking into consideration the overall composition and diversity of the Board and areas of expertise new Board members might be able to offer.
Board Composition & AttendanceThe members of the Board of Directors collectively possess an extensive background in finance, real estate development, and broader management experience. The members provide valuable directives in meeting Company objectives. The Board consists of seven (2017: seven) non-executive Directors comprising including the five (2017: five) independent Director(s).
Per the Articles of Association, the Board is required to meet six times during each year. Board members must attend 75% of all meetings within a calendar year. Board members will step down if they are unable to attend four consecutive meetings without an acceptable explanation. The absence of Board members at Board and Committee meetings will be noted in the meeting minutes. Board attendance percentage will then be reported during any General Assembly Meeting when Board members stand for re-election. Voting and attendance proxies for Board meetings are always prohibited.

Annual Report 2018 | 2524 | Strategic Restructuring
Board & Committee Membership:
Director’s Name Membership Type PositionCommittee MembershipRemuneration
Audit & Risk Management
Waleed Ahmed Alkhaja Independent Chairman Member
Abdulaziz Abdulla Al Humaidhi Non-Independent Vice Chairman Member
Sulaiman Mohammad Al Furaih Non-independent Member Chairman
Bader Ghanem Al Ghanem Independent Member Chairman
Ahmad Mohammad Al Ajlan Independent Member Member
Hanan Hassan Abdulghani Non-independent Member Member
Omar Faysal Reehan Al Temiemy Independent Member Member
Board Meeting Attendance Record:
Meeting Date
2018
-1
1 Fe
b
2018
-2
21 M
ar
2018
-3
21 M
ar
2018
-4
14 M
ay
2018
-5
12 Ju
n
2018
-6
2 Ju
l
2018
-74
Oct
2018
- 818
Oct
2018
-97
Nov Attendance
Waleed Ahmed Alkhaja C C C C C C C C C 100%
Abdulaziz Abdulla Al Humaidhi P P P P P P P P P 100%
Sulaiman Mohammad Al Furaih A P P P P P P P P 89%
Bader Ghanem Al Ghanem P P P P P P P P P 100%
Ahmad Mohammad Al Ajlan P P P P P P P P P 100%
Hanan Hassan Abdulghani P P P P P P P P P 100%
Omar Faysal Reehan Al Temiemy P P P P P P P A P 89%
Board Committee Meetings Attendance Record:
Audit and Risk Management Committee
Meeting Date2018-1 20 Mar
2018-21 Jul
2018-3 3 Oct
Attendance
Sulaiman Mohammad Al Furaih C C C 100%
Ahmad Mohammad Al Ajlan P P P 100%
Hanan Hassan Abdulghani P P P 100%
Omar Faysal Reehan Al Temiemy P P P 100%
Remuneration Committee
Meeting Date2018-120 Mar
2018-22 Jul
2018-3 4 Oct Attendance
Bader Ghanem Al Ghanem C C C 100%
Waleed Ahmed Alkhaja P P P 100%
Abdulaziz Abdulla Al Humaidhi P P P 100%
P=Present A=AbsentProfiles of each of the members of the Board of Directors are included within this Annual Report.
Board CommitteesThe Board of Directors have established two subordinate Committees and have delegated specific powers to each committee as follows:
Audit & Risk Management Committee The primary purpose of the Audit & Risk Management Committee is to assist the Board of Directors in fulfilling its responsibilities by overseeing all audit (external, internal, and Sharia) related processes for the Company and its Subsidiaries and by reviewing the related financial information which will be provided to the shareholders, banks and other stakeholders, as well as the systems of internal controls which Management and the Board of Directors have established. The Committee must meet at least three times a year.
The Committee held three meetings during the fiscal year 2018.
Remuneration Committee The Remuneration Committee was established to align with best practice in Corporate Governance. As and when required by the Board, the Committee identifies persons qualified to become members of the Board, to serve as Chief Executive Officer (“CEO”) and or other officers of the Company. The appointment of the external and internal auditors, however, is the responsibility of the Audit & Risk Management Committee. The Committee can make recommendations to the Board including recommendations of candidates for the Board membership to be included by the Board on the agenda for the next AGM meeting, besides reviewing the Company’s remuneration policies for both the Executive Management and for the Board of Directors. Board remuneration shall be subject to approval by the shareholders in the AGM meetings. The Committee must meet at least twice a year.
The Committee held three meetings during the fiscal year 2018.
ManagementThe Board delegates authority for the day-to-day management of the Company to the Chief Executive Officer, who is supported by a qualified and experienced Executive Management team. Profiles of the Executive Management are included within this Annual Report.
Communication & DisclosureThe Company conducts all communications with its stakeholders in a professional, transparent, and timely manner. Communication channels include this annual report and the Annual General Meeting of the shareholders. Other communication channels include the website, social media, and regular announcements made to the local press. For the most current information regarding the Company, including relevant news along with current and historical financial reports, you are invited to regularly visit the Company website at www.firstbahrain.com.
Risk ManagementThe Company has developed a risk management framework that provides controls and ongoing management of the major risks inherent in the Company’s core business activities. The Board of Directors has the ultimate authority for setting the risk appetite, risk tolerance and associated parameters and limits, in which the Company operates. The Audit & Risk Management Committee is responsible for establishing, maintaining, and monitoring a risk-based approach to all business activities and management of the Company.
The main risks that the Company is exposed to are credit, liquidity, and market risk. The nature of these risks are further detailed in note 4 to the Consolidated Financial Statements.
Capital ManagementThe policy of the Board of Directors is to maintain a strong capital base in order to maintain investor, creditor and market confidence, as well as to provide for the future development of the Company. The Board of Directors seeks to maintain a balance between the higher returns and growth which may be possible with higher levels of borrowings and the advantages and security offered by a sound capital position.
Internal AuditInternal Audit provides an additional line of defence in risk management and internal controls. The role of internal audit is to provide independent and objective assurance that the process for identifying, evaluating and managing significant risks faced by the Company is appropriately and effectively applied.
Internal Audit reports on a semi-annual basis to the Board of Directors through the Audit & Risk Management Committee. The internal auditors report to the Audit & Risk Management Committee the results of periodic audits and obtains commitments from Management to take any remedial action required for any issues raised. The Bahrain office of global audit and advisory firm, Deloitte, serves as the Company’s internal auditors.

Annual Report 2018 | 2726 | Strategic Restructuring
Al Mashora & Al Raya Shari’ahAdvisory Board Report
27/03/2019
Final report of the Sharia Supervisory CommitteeFor the financial period of 01/01/2018 to 31/12/2018
To The First Bahrain Real Estate Development Co. KSCAllah’s peace, mercy and blessings be upon you
In accordance with the powers delegated to us by the members of the General Assembly of First Bahrain Real Estate Development and under the Company’s Articles of Association and the relevant regulatory directives, the Sharia Supervisory Committee submits its final report for the period from 01/01/2018 to 31/12/2018 It includes four items as follows:
First: The work of the Sharia Supervisory Committee
The Sharia Supervisory Committee carried out its work, which included examining the investment structures, contract forms, products, policies and procedures either directly or in coordination with the internal Sharia audit department in order to obtain all the information and explanations that it considered necessary to provide sufficient evidence and give reasonable assurance that the company did not violate the provisions of Islamic law in the light of the resolutions of the Sharia Supervisory Committee and the Sharia standards adopted by the Company and the decisions of the relevant regulatory bodies.
Second: Decisions of the Sharia Supervisory Committee
The Sharia Supervisory Committee of the Company responded to all the company’s inquiries and issued 13 decisions.
Three: The final opinion:
In our opinion, after examining all the clarifications and assurances we have obtained, we confirm that:
The contracts, operations and transactions concluded by the Company during the period from 01/01/2018 to 31/12/2018 were made entirely in accordance with the provisions of the Islamic Sharia.The responsibility to pay zakat falls on the shareholders.
Shari’ah Advisory Board:
Head of the ShariaSupervisory CommitteeProf. Dr. Abdul Aziz Al Qassar
Member of the ShariaSupervisory CommitteeD. Issa Zaki Issa
Member of the ShariaSupervisory CommitteeD. Ali Ibrahim Al Rashed

Annual Report 2018 | 2928 | Strategic Restructuring
Consolidated Financial Statements
30 Independent Auditor’s Report
32 Consolidated statement of financial position
33 Consolidated statement of comprehensive income
34 Consolidated statement of changes in equity
35 Consolidated statement of cash flows
36 Notes to the consolidated financial statements

Annual Report 2018 | 3130 | Strategic Restructuring
The Shareholders,First Bahrain Real Estate Development Company K.s.c. (Closed)
Report on the audit of the consolidated financial statements Our opinion In our opinion, the consolidated financial statements present fairly, in all material respects, the consolidated financial position of First Bahrain Real Estate Development Company K.S.C. (Closed) (“the Parent Company”) and its subsidiaries (together referred to as “the Group”) as at 31 December 2018, and its consolidated financial performance and its consolidated cash flows for the year then ended in accordance with International Financial Reporting Standards.
What we have audited• The Group’s consolidated financial statements comprise:• the consolidated statement of financial position as at 31
December 2018;• the consolidated statement of comprehensive income for the
year then ended;• the consolidated statement of changes in equity for the year
then ended;• the consolidated statement of cash flows for the year then
ended; and• the notes to the consolidated financial statements, which
include a summary of significant accounting policies.
Basis for opinion We conducted our audit in accordance with International Standards on Auditing (ISAs). Our responsibilities under those standards are further described in the Auditor’s responsibilities for the audit of the consolidated financial statements section of our report.We believe that the audit evidence we have obtained is sufficient and appropriate to provide a basis for our opinion.
IndependenceWe are independent of the Group in accordance with the International Ethics Standards Board for Accountants’ Code of Ethics for Professional Accountants (IESBA Code) and the ethical requirements that are relevant to our audit of the consolidated financial statements in the State of Kuwait. We have fulfilled our other ethical responsibilities in accordance with these requirements and the IESBA Code.
Other information Management is responsible for the other information. The other information comprises the report of the Board of Directors included in the Group’s annual report but does not include the consolidated financial statements and our auditor’s report thereon, which we obtained prior to the date of this auditor’s report, and the Group’s complete Annual Report, which is expected to be made available to us after that date.
Our opinion on the consolidated financial statements does not cover the other information and we do not and will not express any form of assurance conclusion thereon.
In connection with our audit of the consolidated financial statements, our responsibility is to read the other information identified above and, in doing so, consider whether the other information is materially inconsistent with the consolidated financial statements or our knowledge obtained in the audit, or otherwise appears to be materially misstated.If, based on the work we have performed on the other information that we obtained prior to the date of this auditor’s report, we conclude that there is a material misstatement of this other information, we are required to report that fact. We have nothing to report in this regard.
When we read the Group’s complete Annual report, if we conclude that there is a material misstatement therein, we are required to communicate the matter to those charged with governance.
Responsibilities of management and those charged with governance for the consolidated financial statementsManagement is responsible for the preparation and fair presentation of the consolidated financial statements in accordance with International Financial Reporting Standards, and for such internal control as management determines is necessary to enable the preparation of consolidated financial statements that are free from material misstatement, whether due to fraud or error. In preparing the consolidated financial statements, management is responsible for assessing the Group’s ability to continue as a going concern, disclosing, as applicable, matters related to going concern and using the going concern basis of accounting unless management either intends to liquidate the Group or to cease operations, or has no realistic alternative but to do so. Those charged with governance are responsible for overseeing the Group’s financial reporting process.
Auditor’s responsibilities for the audit of the consolidated financial statementsOur objectives are to obtain reasonable assurance about whether the consolidated financial statements as a whole are free from material misstatement, whether due to fraud or error, and to issue an auditor’s report that includes our opinion. Reasonable assurance is a high level of assurance, but is not a guarantee that an audit conducted in accordance with ISAs will always detect a material misstatement when it exists. Misstatements can arise from fraud or error and are considered material if, individually or in the aggregate, they could reasonably be expected to influence the economic decisions of users taken on the basis of these consolidated financial statements.
Independent Auditor’s Report
As part of an audit in accordance with ISAs, we exercise professional judgment and maintain professional scepticism throughout the audit. We also:
• Identify and assess the risks of material misstatement of the consolidated financial statements, whether due to fraud or error, design and perform audit procedures responsive to those risks, and obtain audit evidence that is sufficient and appropriate to provide a basis for our opinion. The risk of not detecting a material misstatement resulting from fraud is higher than for one resulting from error, as fraud may involve collusion, forgery, intentional omissions, misrepresentations, or the override of internal control.
• Obtain an understanding of internal control relevant to the audit in order to design audit procedures that are appropriate in the circumstances, but not for the purpose of expressing an opinion on the effectiveness of the Group’s internal control.
• Evaluate the appropriateness of accounting policies used and the reasonableness of accounting estimates and related disclosures made by management.
• Conclude on the appropriateness of management’s use of the going concern basis of accounting and, based on the audit evidence obtained, whether a material uncertainty exists related to events or conditions that may cast significant doubt on the Group’s ability to continue as a going concern. If we conclude that a material uncertainty exists, we are required to draw attention in our auditor’s report to the related disclosures in the consolidated financial statements or, if such disclosures are inadequate, to modify our opinion. Our conclusions are based on the audit evidence obtained up to the date of our auditor’s report. However, future events or conditions may cause the Group to cease to continue as a going concern.
• Evaluate the overall presentation, structure and content of the consolidated financial statements, including the disclosures, and whether the consolidated financial statements represent the underlying transactions and events in a manner that achieves fair presentation.
• Obtain sufficient appropriate audit evidence regarding the financial information of the entities or business activities within the Group to express an opinion on the consolidated financial statements. We are responsible for the direction, supervision and performance of the Group audit. We remain solely responsible for our audit opinion.
We communicate with those charged with governance regarding, among other matters, the planned scope and timing of the audit and significant audit findings, including any significant deficiencies in internal control that we identify during our audit.
Report on other legal and regulatory requirements In our opinion, proper books of accounts have been kept by the Parent Company and the consolidated financial statements, together with the contents of the board of directors’ report relating to these consolidated financial statements, are in accordance therewith. We further report that, we obtained all information and explanations that we required for the purpose of our audit and that the consolidated financial statements incorporate all information that is required by the Companies’ Law no. 1 of 2016, its executive bylaws and by the Parent Company’s memorandum of association; that an inventory was duly carried out and that, to the best of our knowledge and belief, no violations of the Companies’ Law no. 1 of 2016, its executive bylaws nor of the Parent Company’s memorandum of association have occurred during the year ended 31 December 2018 that might have had a material effect on the business of the Group or on its consolidated financial position.
Khalid Ebrahim Al-ShattiLicense No 175 APricewaterhouseCoopers (Al-Shatti & Co.)
28 March 2019Kuwait

Annual Report 2018 | 3332 | Strategic Restructuring
Consolidated statement of financial position
As of 31 December
Notes2018
KD2017
KD
Assets
Non-current assets
Investment properties 6 24,622,100 30,236,935
Furniture and equipment 131,009 130,812
24,753,109 30,367,747
Current assets
Developing properties 7 3,454,750 4,984,327
Trade and other receivables 8 846,155 469,203
Wekala deposits 9 521,623 -
Financial assets at fair value through profit or loss - 3,767
Cash and bank balances 10 978,755 837,654
5,801,283 6,294,951
Total assets 30,554,392 36,662,698
Equity and liabilities
Equity
Share capital 11 23,330,960 23,330,960
Statutory reserve 12 1,621,143 1,621,143
Foreign currency translation reserve 13 1,555,785 1,678,486
(Accumulated losses) / retained earnings (3,726,912) 1,663,829
Total equity 22,780,976 28,294,418
Liabilities
Non-current liabilities
Long-term Islamic finance payables 14 5,615,811 6,172,457
Trade and other payables 15 147,877 92,766
Employees’ end of service benefits 98,718 83,580
5,862,406 6,348,803
Current liabilities
Short-term Islamic finance payables 14 1,314,943 897,000
Trade and other payables 15 596,067 1,122,477
1,911,010 2,019,477
Total liabilities 7,773,416 8,368,280
Total equity and liabilities 30,554,392 36,662,698
Waleed Ahmed AlkhajaChairman
Abdulaziz Abdulla Al HumaidhiVice Chairman
Omar Faysal Reehan Altemiemy Chief Executive Officer
Consolidated statement of comprehensive income
As of 31 December
Notes2018
KD2017
KD
Income
Net rental income 16 1,154,610 1,305,338
Revenue from contracts with customers 17 2,605,738 22,812
Change in fair value of investment properties 6 (5,514,460) (175,814)
Impairment of developing properties 7 (148,212) -
Unrealised loss on financial assets at fair value through profit or loss (3,767) (796)
Provision no longer required - 2,227
Income from wekala deposits 7,320 13,901
Foreign exchange losses (1,886) (16,757)
Total (loss) / income (1,900,657) 1,150,911
Expenses
Cost of revenue from contracts with customers 7 (2,342,340) -
General, administrative and marketing expenses (312,122) (234,465)
Staff costs (399,399) (388,777)
Depreciation (30,214) (27,612)
Finance costs (351,947) (436,684)
Total expenses (3,436,022) (1,087,538)
(Loss) / profit before provisions for contribution to Kuwait Foundation for Advancement of Sciences (KFAS) and Zakat (5,336,679) 63,373
Contribution to KFAS - (570)
Zakat - (761)
(Loss) / profit for the year (5,336,679) 62,042
Basic and diluted (losses) / earnings per share (fils/share) 18 (22.87) 0.27
Other comprehensive income
Items that may be subsequently reclassified to profit or loss
Foreign currency translation differences for foreign operations (122,701) (399,984)
Other comprehensive loss for the year (122,701) (399,984)
Total comprehensive loss for the year (5,459,380) (337,942)
The accompanying notes set out on pages 8 to 42 form an integral part of these consolidated financial statements. The accompanying notes set out on pages 8 to 42 form an integral part of these consolidated financial statements.
For the year ended 31 December 2018 For the year ended 31 December 2018

Annual Report 2018 | 3534 | Strategic Restructuring
Sharecapital
KD
Statutoryreserve
KD
Foreign currency
translation reserve
KD
Retained earnings /
(accumulated loss)KD
Total equityKD
Balance at 1 January 2017 23,330,960 1,614,806 2,078,470 2,774,672 29,798,908
Profit for the year - - - 62,042 62,042
Other comprehensive loss for the year - - (399,984) - (399,984)
Total comprehensive loss for the year - - (399,984) 62,042 (337,942)
Transfer to statutory reserve - 6,337 - (6,337) -
Dividends distributed (note 1) - - - (1,166,548) (1,166,548)
Balance at 31 December 2017 23,330,960 1,621,143 1,678,486 1,663,829 28,294,418
Impact of adoption of IFRS 9 at 1 January 2018 (note 3.2) - - - (54,062) (54,062)
Restated total equity at 1 January 2018 23,330,960 1,621,143 1,678,486 1,609,767 28,240,356
Loss for the year - - - (5,336,679) (5,336,679)
Other comprehensive loss for the year - - (122,701) - (122,701)
Total comprehensive loss for the year - - (122,701) (5,336,679) (5,459,380)
Balance at 31 December 2018 23,330,960 1,621,143 1,555,785 (3,726,912) 22,780,976
For the year ended 31 December
Note 2018KD
2017KD
Cash flows from operating activities
(Loss) / profit for the year (5,336,679) 62,042
Adjustments for:
Depreciation 30,214 27,612
Unrealised loss on financial assets at fair value through profit or loss 3,767 796
Impairment charges for trade and other receivables 757 -
Write off of furniture and equipment - 1,087
Change in fair value of investment properties 6 5,514,460 175,814
Impairment of developing properties 7 148,212 -
Provision no longer required - (2,227)
Finance costs 351,947 436,684
Income from Wekala deposits (7,320) (13,901)
Provision for employees’ end of service benefits 41,711 12,776
Operating income before changes in working capital 747,069 700,683
Changes in working capital:
Developing properties 1,364,123 (1,972,639)
Trade and other receivables (430,225) (59,283)
Trade and other payables (471,299) 756,783
Cash generated from / (used in) operating activities 1,209,668 (574,456)
Employees’ end of service benefits paid during the year (26,297) -
Net cash generated from / (used in) operating activities 1,183,371 (574,456)
Cash flows from investing activities:
Additions to investment properties 6 (29,710) (10,628)
Purchase of furniture and equipment (30,839) (38,829)
Wekala deposits (521,623) -
Income from Wekala deposits received 7,320 13,901
Net cash used in investing activities (574,852) (35,556)
Cash flows from financing activities:
Proceeds from Islamic finance payables 805,000 2,054,896
Repayments of Islamic finance payables (893,860) (516,341)
Dividends paid - (1,166,548)
Finance costs paid (351,947) (436,684)
Net cash used in financing activities (440,807) (64,677)
Net increase / (decrease) in cash and cash equivalents 167,712 (674,689)
Net foreign exchange difference (26,611) (14,323)
Cash and cash equivalents at the beginning of the year 837,654 1,526,666
Cash and cash equivalents at the end of the year 10 978,755 837,654
Non-cash transactions
Investment properties - 2,525,264
Developing properties - (2,525,264)
Trade and other receivables (54,062) -
Consolidated statement of changes in equity
For the year ended 31 December 2018
The accompanying notes set out on pages 8 to 42 form an integral part of these consolidated financial statements.
The accompanying notes set out on pages 8 to 42 form an integral part of these consolidated financial statements.
Consolidated statementsof cash Flows
For the year ended 31 December 2018

Annual Report 2018 | 3736 | Strategic Restructuring
1. INCORPORATION AND ACTIVITIES
First Bahrain Real Estate Development Company K.S.C. (Closed) (“the Parent Company”) was incorporated as a Kuwait Shareholding Holding Company on 5 October 2004. The Parent Company has commercial registration Number 103837 dated 16 October 2004. The Parent Company is engaged in activities in accordance with Noble Islamic Sharia, which include:
• Trading, management and development of properties inside and outside Kuwait.• Owning, buying and selling of stocks and bonds of real estate companies inside and outside Kuwait.• Performing maintenance of properties, including mechanical, electro-mechanical, and air conditioning activities.• Performing real estate advisory services, feasibility studies and real estate appraisals.• Managing, operating and leasing hotels, clubs, residential buildings, touristic and health care resorts and providing support
services. • Organizing real estate exhibitions for the Parent Company’s real estate projects.
The registered head office of the Parent Company is P.O. Box 29295 Al-Safat 13153, State of Kuwait.
The Parent Company’s main office is at City Tower, 2nd Floor, Khaled Bin Al Waleed Street, Sharq, Kuwait.
The consolidated financial statements comprise the Parent Company and its directly owned subsidiaries (together referred to as “the Group”). A list of subsidiaries follows:
Name of the companyCountry of
incorporation
Percentage of ownership
2018
Percentage of ownership
2017 Principal activities
First Kuwait Al Seef Real Estate Development Company W.L.L. Kingdom of Bahrain 99.9% 99.9% Real estate and investment activities
FB Janabiya Residential Development Company W.L.L. Kingdom of Bahrain 99.8% 99.8% Real estate and investment activities
Majaal Warehouse Company W.L.L. Kingdom of Bahrain 99.8% 99.8% Real estate and investment activities
The Parent Company owns directly and indirectly 100% of its subsidiaries in accordance to share sale agreements.
The Parent Company indirectly owns Seef Hospitality Investment Company S.P.C in the Kingdom of Bahrain, which is a 100% subsidiary of First Kuwait Al Seef Real Estate Development Company W.L.L.
The total number of employees in the Group was 16 employees as at 31 December 2018 (31 December 2017: 17 employees).
The consolidated financial statements were authorized for issue by the Board of Directors 11 March 2019 and the shareholders have the power to amend these consolidated financial statements at the annual general assembly meeting.
The consolidated financial statements for the year ended 31 December 2017 were authorised for issue by the Board of Directors on 21 March 2018 and approved by the Annual General Assembly on 14 May 2018.
The Annual General Assembly held on 14 May 2018 decided not distribute dividends for the year ended 31 December 2017.
On 11 March 2019 the Board of Directors proposed not to distribute remuneration for the Parent Company’s Board of Directors for the year ended 31 December 2018 (2017: Nil), subject to the approval of the shareholders’ general assembly.
2. SUMMARY OF SIGNIFICANT ACCOUNTING POLICIES
The principal accounting policies applied in the preparation of these consolidated financial statements are set out below. These policies have been consistently applied to all the years presented, except for the adoption of the amendments and annual improvements to IFRSs, that are effective for annual reporting period starting from 1 January 2018.
2.1 Basis of preparationCompliance with IFRS The consolidated financial statements of the Group have been prepared in accordance with International Financial Reporting Standards (IFRS) and interpretations issued by the IFRS Interpretations Committee (IFRS IC) applicable to companies reporting under IFRS. The consolidated financial statements comply with IFRS as issued by the International Accounting Standards Board (IASB).
Historical cost convention The consolidated financial statements have been prepared on a historical cost basis, as modified for the revaluation of “investment properties” and “financial assets at fair value through profit or loss”.
2.1.1 Changes in accounting policies and disclosures(a) New and amended standards adopted by the GroupThe Group has applied the following standards and amendments for the first time for their annual reporting period commencing 1 January 2018:• IFRS 9 Financial Instruments• IFRS 15 Revenue from Contracts with Customers• Amendment to IAS 40, Investment Property
The Group had to change its accounting policies and make certain retrospective adjustments following the adoption of IFRS 9 and IFRS 15. This is disclosed in note 3. The Group adopted the amendments to IAS 40 using the prospective application method permitted by the standard. The Group has assessed the impact of the amendment to IAS 40 on the classification of existing property as at 1 January 2018 and has concluded that no reclassifications are required on adoption of the amendment.
(b) New standards, amendments and interpretations issued but not yet adopted by the Group: ‘IFRS 16 – Leases‘IFRS 16, Leases was issued in January 2016. For lessees, it will result in almost all leases being recognised on the consolidated statement of financial position, as the distinction between operating and finance leases will be removed. Under the new standard, an asset (the right to use the leased item) and a financial liability to pay rentals are recognised. The only exceptions are short-term and low-value leases. The accounting for lessors will not significantly change. The standard is effective for annual periods beginning on or after 1 January 2019 and earlier application is permitted.
The standard will affect primary the accounting for Group operating leases. However, the Group does not expect the new standard to have a significant impact on the Group’s consolidated statement of financial position and consolidated statement of comprehensive income.
However, the Group is currently assessing the impact of IFRS 16 on its current accounting policies.
The Group will apply the standard from its mandatory adoption date of 1 January 2019. The Group intends to apply the simplified transition approach and will not restate comparative amounts for the year prior to first adoption.
There are no other IFRS standards or IFRIC interpretations that are not yet effective that would be expected to have a material impact on the Group.
Notes to the consolidated financial statements
For the year ended 31 December 2018
Notes to the consolidated financial statements
For the year ended 31 December 2018

Annual Report 2018 | 3938 | Strategic Restructuring
2.2 Consolidation2.2.1 SubsidiariesSubsidiaries are all entities (including structured entities) over which the Group has control. The Group controls an entity when the Group is exposed to, or has rights to, variable returns from its involvement with the entity and has the ability to affect those returns through its power to direct the activities of the entity. Subsidiaries are fully consolidated from the date on which control is transferred to the Group. They are deconsolidated from the date that control ceases.
Intercompany transactions, balances and unrealised gains on transactions between Group companies are eliminated. Unrealised losses are also eliminated unless the transaction provides evidence of an impairment of the transferred asset. Accounting policies of subsidiaries have been changed where necessary to ensure consistency with the policies adopted by the Group.
2.2.2 Changes in ownership interests in subsidiaries without change of controlThe Group treats transactions with non-controlling interests that do not result in a loss of control as transactions with equity owners of the Group. A change in ownership interest results in an adjustment between the carrying amounts of the controlling and non-controlling interests to reflect their relative interests in the subsidiary. Any difference between the amount of the adjustment to non-controlling interests and any consideration paid or received is recognised in a separate reserve within equity attributable to owners of Parent Company.
When the Group ceases to consolidate or equity account for an investment because of a loss of control, joint control or significant influence, any retained interest in the entity is remeasured to its fair value with the change in carrying amount recognised in the consolidated statement of comprehensive income. This fair value becomes the initial carrying amount for the purposes of subsequently accounting for the retained interest as an associate, joint venture or financial asset. In addition, any amounts previously recognised in other comprehensive income in respect of that entity are accounted for as if the Group had directly disposed of the related assets or liabilities. This may mean that amounts previously recognised in other comprehensive income are reclassified the consolidated statement of comprehensive income.
2.2.3 Business combinationThe acquisition method of accounting is used to account for all business combinations, regardless of whether equity instruments or other assets are acquired. The consideration transferred for the acquisition of a subsidiary comprises the:
• fair values of the assets transferred • liabilities incurred to the former owners of the acquired business • equity interests issued by the Group • fair value of any asset or liability resulting from a contingent consideration arrangement, and • fair value of any pre-existing equity interest in the subsidiary.
Identifiable assets acquired and liabilities and contingent liabilities assumed in a business combination are, with limited exceptions, measured initially at their fair values at the acquisition date. The Group recognises any non-controlling interest in the acquired entity on an acquisition-by-acquisition basis either at fair value or at the non-controlling interest’s proportionate share of the acquired entity’s net identifiable assets. Acquisition-related costs are expensed as incurred.
The excess of the following items over the fair value of the net identifiable assets acquired is recorded as goodwill. If those amounts are less than the fair value of the net identifiable assets of the subsidiary acquired, the difference is recognised directly in the consolidated statement of comprehensive income as a bargain purchase:
• consideration transferred, • amount of any non-controlling interest in the acquired entity, and • acquisition-date fair value of any previous equity interest in the acquired entity.
Where settlement of any part of cash consideration is deferred, the amounts payable in the future are discounted to their present value as at the date of exchange. The discount rate used is the entity’s incremental borrowing rate, being the rate at which a similar borrowing could be obtained from an independent financier under comparable terms and conditions.
Contingent consideration is classified either as equity or a financial liability. Amounts classified as a financial liability are subsequently remeasured to fair value with changes in fair value recognised in consolidated statement of comprehensive income.
If the business combination is achieved in stages, the acquisition date carrying value of the acquirer’s previously held equity interest in the acquiree is remeasured to fair value at the acquisition date. Any gains or losses arising from such remeasurement are recognised in consolidated statement of comprehensive income.
2.3 Segment reporting Operating segments are reported in a manner consistent with the internal reporting provided to the chief operating decision-maker. The chief operating decision-maker, who is responsible for allocating resources and assessing performance of the operating segments, has been identified by the Parent Company’s Board of Directors.
2.4 Foreign currencies (a) Functional and presentation currencyItems included in the consolidated financial statements are measured in Bahraini Dinars (BD), which is the currency of the primary economic environment in which the Group operates (“the functional currency”). The consolidated financial statements are presented in Kuwaiti Dinars (KD), which is the Parent Company’s presentation currency and the presentation currency of the Group.
(b) Transactions and balancesForeign currency transactions are translated into the functional currency using the exchange rates prevailing at the dates of the transactions or valuation where items are re-measured. Foreign exchange gains and losses resulting from the settlement of such transactions and from the translation at year-end exchange rates of monetary assets and liabilities denominated in foreign currencies are recognised in the consolidated statement of comprehensive income.
Foreign exchange gains and losses are presented in the consolidated statement of comprehensive income on a net basis within income.
Non-monetary items that are measured at fair value in a foreign currency are translated using the exchange rates at the date when the fair value was determined. Translation differences on assets and liabilities carried at fair value are recognised in the consolidated statement of comprehensive income.
(c) Foreign operationsThe results and financial position of all foreign operations (none of which has the currency of a hyper-inflationary economy) that have a functional currency different from the presentation currency are translated into the presentation currency as follows:
i. Assets and liabilities for each financial position presented are translated at the closing rate at the date of that financial position;ii. Income and expenses for each statement of comprehensive income are translated at average exchange rates (unless this
average is not a reasonable approximation of the cumulative effect of the rates prevailing on the transaction dates, in which case income and expenses are translated at the rate on the dates of the transactions); and
iii. All resulting exchange differences are recognised in other comprehensive income.
2.5 Investment propertiesProperty that is held for long-term rental yields or for capital appreciation or both, and that is not occupied by the companies in the consolidated Group, is classified as investment property. Investment property also includes property that is being constructed or developed for future use as investment property.
Investment property is measured initially at its cost, including related transaction costs and where applicable borrowing costs.
After initial recognition, investment property is carried at fair value. Investment property under construction is measured at fair value if the fair value is considered to be reliably determinable. Investment properties under construction for which the fair value cannot be determined reliably, but for which the Group expects that the fair value of the property will be reliably determinable when construction is completed, are measured at cost less impairment until the fair value becomes reliably determinable or construction is completed - whichever is earlier. Fair value is based on active market prices, adjusted, if necessary, for differences in the nature, location or condition of the specific asset. If this information is not available, the Group uses alternative valuation methods, such as recent prices on less active markets or discounted cash flow projections.
Notes to the consolidated financial statements
For the year ended 31 December 2018
Notes to the consolidated financial statements
For the year ended 31 December 2018

Annual Report 2018 | 4140 | Strategic Restructuring
Valuations are performed as of the reporting date by professional valuers who hold recognised and relevant professional qualifications and have recent experience in the location and category of the investment property being valued. These valuations form the basis for the carrying amounts in the consolidated statement of financial position. Investment property that is being redeveloped for continuing use as investment property or for which the market has become less active continues to be measured at fair value.
The fair value of investment property reflects, among other things, rental income from current leases and other assumptions market participants would make when pricing the property under current market conditions.
Subsequent expenditure is capitalised to the asset’s carrying amount only when it is probable that future economic benefits associated with the expenditure will flow to the Group and the cost of the item can be measured reliably. All other repairs and maintenance costs are expensed when incurred. When part of an investment property is replaced, the carrying amount of the replaced part is derecognised.
Changes in fair values are recognised in the consolidated statement of comprehensive income under ‘change in fair value of investment properties’. Investment properties are derecognised when either they have been disposed of or when the investment property is permanently withdrawn from use and no future economic benefit is expected from its disposal. Gains or losses arising on the retirement or disposal of an investment property are recognised in the consolidated statement of comprehensive income. Where the Group disposes of a property at fair value in an arm’s length transaction, the carrying value immediately prior to the sale is adjusted to the transaction price, and the adjustment is recorded in the consolidated statement of comprehensive income.
2.6 Developing propertiesDeveloping properties are stated at the lower of cost and net realisable value. Net realisable value represents the estimated selling price for developing properties less all estimated costs of completion and costs necessary to make the sale.
2.7 Furniture and equipmentFurniture and equipment are stated at historical cost less accumulated depreciation and any accumulated impairment losses, if any.
Cost of an item of furniture and equipment includes its purchase price and any direct attributable costs. Cost includes the cost of replacing part of an existing furniture and equipment at the time that cost is incurred if the recognition criteria are met; and excludes the costs of day-to-day servicing of an item of furniture and equipment.
Subsequent costs are included in the asset’s carrying amount or recognised as a separate asset, as appropriate, only when it is probable that future economic benefits associated with the item will flow to the Group and the cost of the item can be measured reliably. The carrying amount of the replaced part is derecognised. All other repairs and maintenance are charged to the consolidated statement of comprehensive income during the financial period in which they are incurred.
Depreciation is calculated using the straight-line method to allocate their cost less residual values over their estimated useful lives, as follows:
Furniture and office equipment 5 years
Computers and electronics 3 years
Leasehold improvement 3 years
Fixtures 3-10 years
The assets’ residual values and useful lives are reviewed and adjusted if appropriate, at least at each financial year-end. An asset’s carrying amount is written down immediately to its recoverable amount if the asset’s carrying amount is greater than its estimated recoverable amount.
Gains and losses on disposals are determined by comparing proceeds with the carrying amounts and are recognised in the consolidated statement of comprehensive income.
2.8 Impairment of non-financial assetsAssets that are subject to depreciation are reviewed for impairment whenever events or changes in circumstances indicate that the carrying amount may not be recoverable. An impairment loss is recognised for the amount by which the asset’s carrying amount exceeds its recoverable amount. The recoverable amount is the higher of an asset’s fair value less costs to sell and value in use. For the purposes of assessing impairment, assets are computed at the lowest levels for which there are separately identifiable cash flows (cash-generating units). Prior impairments of non-financial assets that suffered impairment are reviewed for possible reversal of the impairment at each reporting date.
Notes to the consolidated financial statements
For the year ended 31 December 2018
Notes to the consolidated financial statements
For the year ended 31 December 2018

Annual Report 2018 | 4342 | Strategic Restructuring
2.9 Financial assets2.9.1 ClassificationFrom 1 January 2018, the Group classifies its financial assets in the following measurement categories:• those to be measured subsequently at fair value (either through OCI or through profit or loss), and• those to be measured at amortised cost.
The classification depends on the entity’s business model for managing the financial assets and the contractual terms of the cash flows.
For assets measured at fair value, gains and losses will either be recorded in profit or loss or OCI. The Group’s financial assets carried at amortised cost are as follows:
(a) Trade and other receivablesTrade and other receivables are recognised initially at fair value and subsequently are measured at amortised cost using the effective interest method, less impairment provision. The Group holds the trade and other receivables with the objective to collect the contractual cash flows.
(b) Cash and bank balances Cash and bank balances include cash on hand, deposits held at call with financial institutions, other short-term, highly liquid investments with original maturities of three months or less that are readily convertible into known amounts of cash and which are subject to an insignificant risk of change in value.
(c) Wekala depositsWekala deposits are held with reputable financial institutions with original maturity of more than 3 months which are subject to an insignificant risk of change in value.
2.9.2 Recognition and de-recognitionRegular purchases and sales of financial assets are recognised on the trade-date, the date on which the Group commits to purchase or sell the asset. Financial assets are derecognised when the rights to receive cash flows from the investments have expired or have been transferred and the Group has transferred substantially all risks and rewards of ownership.
2.9.3 Measurement At initial recognition, the Group measures a financial asset at its fair value plus, in the case of a financial asset not at fair value through profit or loss (FVPL), transaction costs that are directly attributable to the acquisition of the financial asset. Transaction costs of financial assets carried at FVPL are expensed in profit or loss.
Debt instrumentsSubsequent measurement of debt instruments depends on the Group’s business model for managing the asset and the cash flow characteristics of the asset. The measurement category into which the Group classifies its debt instruments:
• Amortised cost: Assets that are held for collection of contractual cash flows where those cash flows represent solely payments of principal and interest are measured at amortised cost. Interest income from these financial assets is included in finance income using the effective interest rate method. Any gain or loss arising on derecognition is recognised directly in profit or loss and presented in other gains (losses) together with foreign exchange gains and losses. Impairment losses are presented as a separate line item in the consolidated statement of profit or loss.
Equity instrumentsThe Group subsequently measures all equity investments at fair value. Changes in the fair value of financial assets at FVPL are recognised in the consolidated statement of income. Dividends from such investments continue to be recognised in the consolidated statement of income when the group’s right to receive payments is established.
2.9.4 Impairment of financial assets From 1 January 2018, the Group assesses on a forward looking basis the expected credit losses associated with its debt instruments carried at amortised cost. The impairment methodology applied depends on whether there has been a significant increase in credit risk. For trade receivables the Group applies the simplified approach permitted by IFRS 9, which requires expected lifetime losses to be recognised from initial recognition of the receivables, see note 4.1(b) for further details.
2.9.5 Accounting policies applied until 31 December 2017The Group has applied IFRS 9 retrospectively, but has elected not to restate comparative information. As a result, the comparative information provided continues to be accounted for in accordance with the Group’s previous accounting policy.
2.9.5.1 Classification until 31 December 2017The Group classifies its financial assets in the following categories: • Loans and receivables,• Financial assets at fair value through profit or loss,
The classification depends on the purpose for which the financial assets were acquired. Management determines the classification of its financial assets at initial recognition.
(a) Loans and receivablesLoans and receivables are non-derivative financial assets with fixed or determinable payments that are not quoted in an active market. They are included in current assets, except for maturities greater than 12 months after the end of the reporting period. These are classified as non-current assets. The Group’s loans and receivables comprise of “Cash and bank balances” and “Trade and other receivables” in the consolidated statement of financial position.
Cash and bank balancesIn the consolidated statements of financial position and cash flows, cash and bank balances include cash on hand, bank balances, deposits held with financial institutions, and any other short-term, highly liquid custodies with original maturities of three months or less that are readily convertible to known amounts of cash and which are subject to an insignificant risk of changes in value.
Trade and other receivablesTrade and other receivables are amount due from customers for goods sold or services rendered in the ordinary course of business. If collection is expected in one year or less (or in the normal operating cycle of the business if longer), they are classified as current assets. If not, they are presented as non-current assets.
(b) Financial assets at fair value through profit or lossFinancial assets at fair value through profit or loss are financial assets held for trading and those designated at fair value through profit or loss upon initial recognition. A financial asset is classified in this category if acquired principally for the purpose of selling in the short term. Financial assets designated upon initial recognition at fair value through profit or loss are designated at their initial recognition date and only if the criteria under IAS 39 is satisfied, derivatives are also categorised as held for trading unless they are designated as hedges. Financial assets at fair value through profit or loss are reported in a separate line item in the consolidated statement of financial position.
2.9.5.2 Recognition and de-recognitionRegular purchases and sales of financial assets are recognised on the trade-date, the date on which the Group commits to purchase or sell the asset. Financial assets are derecognised when the rights to receive cash flows from the investments have expired or have been transferred and the Group has transferred substantially all risks and rewards of ownership.
Notes to the consolidated financial statements
For the year ended 31 December 2018
Notes to the consolidated financial statements
For the year ended 31 December 2018

Annual Report 2018 | 4544 | Strategic Restructuring
2.9.5.3 Measurement Financial assets are initially recognized at fair value plus transaction costs for all financial assets not classified at fair value through profit or loss. Financial assets classified at fair value through profit or loss are initially recognized at fair value and transaction costs are expensed in the consolidated statement of income. Subsequently, financial assets at fair value through profit or loss are re-measured at fair value. Loans and receivables are subsequently carried at amortized cost using the effective interest rate method less any provision for impairment losses.
Gains and losses arising from changes in the fair value of the financial assets at fair value through profit or loss category are included in the consolidated statement of income in the period in which they arise.
2.9.5.4 Impairment of financial assets (a) Loans and receivablesThe Group assesses at the end of each reporting period whether there is objective evidence that a financial asset or group of financial assets is impaired. A financial asset or a group of financial assets is impaired and impairment losses are incurred only if there is objective evidence of impairment as a result of one or more events that occurred after the initial recognition of the asset (a “loss event”) and that loss event (or events) has an impact on the estimated future cash flows of the financial asset or group of financial assets that can be reliably estimated.
Evidence of impairment may include indications that the debtors or a group of debtors is experiencing significant financial difficulty, default or delinquency in interest or principal payments, the probability that they will enter bankruptcy or other financial reorganisation, and where observable data indicate that there is a measurable decrease in the estimated future cash flows, such as changes in arrears or economic conditions that correlate with defaults.
For loans and receivables category, the amount of the loss is measured as the difference between the asset’s carrying amount and the present value of estimated future cash flows (excluding future credit losses that have not been incurred) discounted at the financial asset’s original effective interest rate. The carrying amount of the asset is reduced and the amount of the loss is recognised in the consolidated statement of comprehensive income. As a practical expedient, the Group may measure impairment on the basis of an instrument’s fair value using an observable market price.
If, in a subsequent period, the amount of the impairment loss decreases and the decrease can be related objectively to an event occurring after the impairment was recognised (such as an improvement in the debtor’s credit rating), the reversal of the previously recognised impairment loss is recognised in the consolidated statement of comprehensive income.
2.10 Financial liabilities A financial liability is any liability that is a contractual obligation to deliver cash or another financial asset to another entity or to exchange financial assets or financial liabilities with another entity under conditions that are potentially unfavorable to the Group.
All financial liabilities are initially recognised at fair value less directly attributable transaction costs. After initial recognition, financial liabilities are measured at amortised cost using the effective interest method. The Group classifies its financial liabilities as “Trade and other payables” and “Islamic finance payables”.
A financial liability is derecognized when the obligation under the liability is discharged, cancelled or expired.
(a) Trade and other payablesTrade and other payables are obligations to pay for goods or services that have been acquired in the ordinary course of business from suppliers. Trade and other payables are classified as current liabilities if payment is due within one year or less (or in the normal operating cycle of the business if longer). If not, they are classified as non-current liabilities.
(b) Islamic finance payablesIslamic finance payables are initially recognised at fair value, net of transaction costs incurred. Islamic finance payables are subsequently measured at amortised cost. Any difference between the proceeds (net of transaction costs) and the redemption amount is recognised in consolidated statement of comprehensive income over the period of the Islamic finance payables using the effective interest method. Fees paid on the establishment of loan facilities are recognised as transaction costs of the loan to the extent that it is probable that some or all of the facility will be drawn down. In this case, the fee is deferred until the draw down occurs. To the extent there is no evidence that it is probable that some or all of the facility will be drawn down, the fee is capitalised as a prepayment for liquidity services and amortised over the period of the facility to which it relates.
Islamic finance payables are removed from the consolidated statement of financial position when the obligation specified in the contract is discharged, cancelled or expired. The difference between the carrying amount of a financial liability that has been extinguished or transferred to another party and the consideration paid, including any non-cash assets transferred or liabilities assumed, is recognised in consolidated statement of comprehensive income as other income.
Islamic finance payables are classified as current liabilities unless the Group has an unconditional right to defer settlement of the liability for at least 12 months after the reporting period.
2.11 Employees’ end of service benefitsThe Group is liable under Labor Laws’ in respective countries, to make payments to the employees for post-employment benefits through defined benefits plan. Such payment is made on a lump sum basis at the end of an employee’s service. This liability is unfunded and is computed as the amount payable as a result of involuntary termination of the Group’s employees on the reporting date. The Group expects this method to produce a reliable approximation of the present value of this obligation.
With respect to its national employees, the Parent Company makes contributions to Public Authority for Social Security calculated as a percentage of the employees’ salaries.
2.12 ProvisionsProvisions are recognised when the Group has a present legal or constructive obligation as a result of past events; it is probable that an outflow of resources will be required to settle the obligation; and the amount has been reliably estimated. Provisions are not recognised for future operating losses.
Where there are a number of similar obligations, the likelihood that an outflow will be required in settlement is determined by considering the class of obligations as a whole. A provision is recognised even if the likelihood of an outflow with respect to any one item included in the same class of obligations may be small.
Provisions are measured at the present value of the expenditures expected to be required to settle the obligation using a pre-tax rate that reflects current market assessments of the time value of money and the risks specific to the obligation. The increase in the provision due to passage of time is recognised as interest expense.
2.13 Offsetting of financial assets and liabilities Financial assets and financial liabilities are only offset and the net amount reported in the consolidated statement of financial position when there is a legal enforceable right to offset the recognized amounts and there is an intention to settle on a net basis or realize the asset and settle the liability simultaneously.
The legally enforceable right must not be contingent on future events and must be enforceable in the normal course of business and in the event of default, insolvency or bankruptcy of the Group or the counterparty.
2.14 Revenue recognitionRental incomeRental income from operating leases is recognised on a straight-line basis over the lease term. When the Group provides incentives to its tenants, the cost of the incentives is recognised over the lease term, on a straight-line basis, as a reduction of rental income.
Notes to the consolidated financial statements
For the year ended 31 December 2018
Notes to the consolidated financial statements
For the year ended 31 December 2018

Annual Report 2018 | 4746 | Strategic Restructuring
Sale of developed unitsRevenue on sale of developed units is recognised when control over the unit has been transferred to the customer, which is considered to be at a point in time, when the customer has taken possession of the unit along with compliance with all local regulatory requirements governing the real estate sale contracts.
The Group develops and sells residential properties. Revenue is recognised when control over the property has been transferred to the customer. The properties are handed over to customers upon full payment of the purchase price. Notice to customers to make final payment does not arise until connection of government services to the completed properties, including electricity and water. Legal title will not be transferred to customers until the relevant government authorities in Bahrain release title deeds upon completion the construction of the entire project. Therefore, revenue is recognised at a point in time when the legal title has passed to the customer. The revenue is measured at the transaction price agreed under the contract. In most cases, the consideration is due when government services are connected to the completed properties. While deferred payment terms may be agreed in rare circumstances, the deferral never exceeds twelve months. The transaction price is therefore not adjusted for the effects of a significant financing component.
Financing components The Group does not expect to have any contracts where the period between the transfer of the promised goods or services to the customer and payment by the customer exceeds one year. As a consequence, the Group does not adjust any of the transaction prices for the time value of money.
Revenue from services is recognised in the accounting period in which control of the services are passed to the customer, which is when the service is rendered. For certain service contracts, revenue is recognised based on the actual service provided to the end of the reporting period as a proportion of the total services to be provided because the customer receives and uses the benefits simultaneously.
2.15 Finance costs General and specific finance costs directly attributable to the acquisition, construction or production of qualifying assets, which are assets that necessarily take a substantial period of time to get ready for their intended use or sale, are added to the cost of those assets, until such time as the assets are substantially ready for their intended use or sale.
Investment income earned on the temporary investment of specific Islamic finance payable pending their expenditure on qualifying assets is deducted from the finance costs eligible for capitalisation. All other finance costs are recognised in the consolidated statement of comprehensive income in the period in which they are incurred.
2.16 LeasesWhere the Group is the lessor - operating lease
Lease income from operating leases where the Group is a lessor is recognised in the consolidated statement of comprehensive income on a straight-line basis over the lease term. The respective leased assets are included in the consolidated statement of financial position as investment properties.
Where the Group is the lessee - operating lease
Leases in which a significant portion of the risks and rewards of ownership are retained by the lessor are classified as operating leases. Payments made under operating leases (net of any incentives received from the lessor) are charged to the consolidated statement of comprehensive income on a straight-line basis over the period of the lease.
2.17 Dividends distributionProvision is made for the amount of any dividend declared, being appropriately authorised and no longer at the discretion of the entity, on or before the end of the reporting period but not distributed at the end of the reporting period.
2.18 Earnings per share(a) Basic earnings per share
Basic earnings per share is calculated by dividing: • the profit attributable to owners of the Parent Company, excluding any costs of servicing equity other than ordinary shares • by the weighted average number of ordinary shares outstanding during the financial year, adjusted for bonus elements in
ordinary shares issued during the year and excluding treasury shares.
3. CHANGES IN ACCOUNTING POLICIES
This note explains the impact of adoption IFRS 9 Financial Instruments and IFRS 15 Revenue from Contracts with Customers on the Group’s consolidated financial statements.
3.1 Impact on the financial statements As explained in note 3.2 below, IFRS 9 was generally adopted without restating comparative information. The reclassification and the adjustments arising from the new impairment rules are therefore recognised in the opening consolidated statement of financial position on 1 January 2018.
3.2 IFRS 9 Financial Instruments IFRS 9 replaces the provisions of IAS 39 that relate to the recognition, classification and measurement of financial assets and financial liabilities, derecognition of financial instruments, impairment of financial assets and hedge accounting.
The adoption of IFRS 9 Financial Instruments from 1 January 2018 resulted in changes in accounting policies and adjustments to the amounts recognised in the consolidated financial statements. In accordance with the transitional provisions in IFRS 9, the comparative figures have not been restated.
The total impact on the Group’s retained earnings as at 1 January 2018 is as follows:
Closing retained earnings at 31 December 2017 1,663,829
Change in accounting policies brought by IFRS 9:
Increase in provision for trade receivables (54,062)
Opening retained earnings on 1 January 2018 1,609,767
(i) Classification and measurementOn 1 January 2018 (the date of initial application of IFRS 9), the Group’s management has assessed which business models apply to the financial assets held by the Group and has classified its financial instruments into the appropriate IFRS 9 categories. The were no effects resulting from this reclassification.
(ii) Impairment of financial assetsThe Group was required to revise its impairment methodology under IFRS 9 for financial assets carried at amortised cost. The impact of the change in impairment methodology on the Group’s retained earnings and equity is disclosed in the table in note 3.2 above.
While bank balances, wekala deposits and other receivables are also subject to the impairment requirements of IFRS 9, the expected credit losses are immaterial.
For trade receivables, the Group applies the IFRS 9 simplified approach to measuring expected credit losses which uses a lifetime expected loss allowance for all trade receivables. This resulted in an increase of the impairment provision for trade receivables allowance on 1 January 2018 by KD 54,062. Note 4.1 (b) provides details about the calculation of the provision.
3.3 IFRS 15 Revenue from Contracts with CustomersIFRS 15 establishes a comprehensive framework for determining whether, how and when revenue is recognised. It replaced IAS 18 Revenues, IAS 11 Construction contracts and related interpretations. The Group has adopted IFRS 15 using the modified retrospective transition approach which means that the cumulative impact of the adoption will be recognised in retained earnings as of 1 January 2018 and that comparatives for 2017 will not be restated.
The Group adopted IFRS 15 which is in line with Group’s revenue recognition policy (note 2.14) and did not result in any material impact on the Group’s consolidated financial position.
Notes to the consolidated financial statements
For the year ended 31 December 2018
Notes to the consolidated financial statements
For the year ended 31 December 2018

Annual Report 2018 | 4948 | Strategic Restructuring
4. FINANCIAL RISK MANAGEMENT
4.1 Financial risk factorsThe Group’s activities may expose it to a variety of financial risks: market risk (including foreign currency risk and interest rate risk), credit risk and liquidity risk. The Group’s overall risk management programme focuses on the unpredictability of financial markets and seeks to minimise potential adverse effects on the Group’s financial performance. Risk management is carried out by the Group’s finance department as approved by Board of Directors.
(a) Market risk (i) Foreign currency risk The Group is exposed to foreign currency risk arising from various currency exposures. Foreign currency risk arises from future commercial transactions, recognised assets and liabilities. Foreign currency risk arises when future commercial transactions or recognised assets and liabilities are denominated in a currency that is not the Group’s functional currency.
Positions are monitored on a regular basis to ensure positions are maintained within established limits. The Group manages its foreign currency risk by regularly assessing current and expected foreign currency rate movements and Group’s foreign currency monetary assets and liabilities.
The Group’s net exposure denominated in foreign currencies is not significant.
(ii) Interest rate riskInterest rate risk is the risk that the fair value or future cash flows of financial instruments will fluctuate because of changes in market interest rates. Interest rate risk arises from the possibility that changes in interest rate will affect future profitability or the fair values of financial instruments. The Group’s interest rate risk is not signinficant as Wekala deposits and Islamic finance payables carry fixed rates.
The Group analyses its interest rate exposure on a dynamic basis. Various scenarios are simulated taking into consideration refinancing, renewal of existing positions and alternative financing. Based on these scenarios, the Group calculates the impact on its consolidated statement of comprehensive income and equity of a defined interest rate shift. For each simulation, the same interest rate shift is used for all currencies. Positions are monitored regularly to ensure positions are maintained within established limits. The Group does not have any off balance sheet financial instruments or derivatives which are used to manage the interest rate risk.
(b) Credit riskCredit risk is the risk one party to a financial instrument will cause a financial loss for the other party by failing to discharge an obligation. The Group has no significant concentrations of credit risk.
Credit risk arises from bank balances held at banks, wekala deposits and trade and other receivables.
Credit risk is managed on a group basis. The Group structures the levels of credit risk it accepts by placing limits on its exposure to a single counterparty, or groups of counterparties, and to geographical and industry segments. Such risks are subject to a quarterly or more frequent review.
The Group has policies in place to ensure rental contracts are entered into only with counterparties with an appropriate credit history, and monitors the credit quality of receivables on an ongoing basis. Cash balances are held only with financial institutions with a good credit rating. The Group has policies that limit the amount of credit exposure to any financial institution.
The Group’s maximum exposure to credit risk by class of financial asset is as follows:
As at 31 December
2018 2017
Trade receivables, net of provision for impairment (note 8) 779,046 383,795
Wekala deposits (note 9) 521,623 -
Bank balances (note 10) 978,755 837,150
2,279,424 1,220,945
The Group applies the IFRS 9 simplified approach to measuring expected credit losses which uses a lifetime expected loss allowance for all trade receivables.
The expected loss rates are based on the payment profiles of tenants over a period of 36 months before 31 December 2018 or 1 January 2018, respectively, and the corresponding historical credit losses experienced within this period. On that basis, the impairment provision as at 31 December 2018 and 1 January 2018 (on adoption of IFRS 9) was determined as follows for trade receivables:
Rental income receivables
31 December 2018 0-30 days 31-60 days 61-90 days 91 days above Total
Expected loss rate* 3.73% 0% 26.14% 38.45%
Gross carrying amount – Trade receivables 42,863 - 9,927 131,692 184,482
Life time expected credit loss allowance 1,597 - 2,595 50,632 54,819
1 January 2018
Expected loss rate* 4.21% 14.14% 22.71% 53.71%
Gross carrying amount – Trade receivables 35,014 20,605 10,154 88,200 153,973
Life time expected credit loss allowance 1,473 2,914 2,306 47,369 54,062
* The above expected loss rates are the average rates for the whole subsidiaries of the Group.
Notes to the consolidated financial statements
For the year ended 31 December 2018
Notes to the consolidated financial statements
For the year ended 31 December 2018

Annual Report 2018 | 5150 | Strategic Restructuring
The closing impairment provision for trade receivables as at 31 December 2018 reconcile to the opening impairment provision as follows:
Trade receivables
2018KD
2017KD
31 December – Calculated under IAS 39 - -
Amounts restated through opening retained earnings 54,062 -
Opening loss allowance as at 1 January 2018 – calculated under IFRS 9 54,062 -
Increase in loss allowance recognised in the profit or loss during the year 757 -
At 31 December 54,819 -
(c) Liquidity risk Liquidity risk is the risk that the Group will encounter difficulty in meeting commitments associated with financial liabilities, arises because of the possibility (which may often be remote) that the Group could be required to pay its liabilities earlier than expected.
Prudent liquidity risk management implies maintaining sufficient cash, the availability of funding through an adequate amount of committed credit facilities and the ability to close out market positions. The Group’s objective is to maintain a balance between continuity of funding and flexibility through use of Islamic finance payables. Management monitors rolling forecasts of the Group’s liquidity reserve (comprising the undrawn Islamic finance facilities) and bank balances and cash on the basis of expected cash flows. This is generally carried out at local level in the operating companies of the Group in accordance with practice and limits set by the Group. These limits vary by location to take into account the liquidity of the market in which the entity operates. In addition, the Group’s liquidity management policy involves projecting cash flows in major currencies and considering the level of liquid assets necessary to meet these, monitoring consolidated statement of financial position liquidity ratios against internal and external regulatory requirements and maintaining debt financing plans.
The maturity profile is monitored by the Group’s management to ensure adequate liquidity is maintained. A summary table with maturity of financial liabilities is presented below. The amounts disclosed in the below tables are the contractual undiscounted cash flows. Undiscounted cash flows in respect of balances due within 12 months equal their carrying amounts in the consolidated statement of financial position as the impact of discounting is not significant.
The maturity analysis of financial instruments at 31 December is as follows:
Contractual cash flows
Less thanone year
KD
From 1 to 2years
KD
From 2 to 3years
KD
More thanthree years
KDTotal
KDCarryingamount
31 December 2018
Liabilities
Islamic finance payables 1,314,943 1,452,089 1,735,481 2,993,283 7,495,796 6,930,754
Trade and other payables 596,067 147,877 - - 743,944 743,944
Total liabilities 1,911,010 1,599,966 1,735,481 2,993,283 8,239,740 7,674,698
Contractual cash flows
Less thanone year
KD
From 1 to 2years
KD
From 2 to 3years
KD
More thanthree years
KDTotal
KDCarryingamount
31 December 2017
Liabilities
Islamic finance payables 897,000 1,553,910 1,538,080 3,732,019 7,721,009 7,069,457
Trade and other payables 1,122,477 92,766 - - 1,215,243 1,215,243
Total liabilities 2,019,477 1,646,676 1,538,080 3,732,019 8,936,252 8,284,700
4.2 Financial instrumentsThe Group’s objectives when managing capital are to safeguard the Group’s ability to continue as a going concern in order to provide returns for shareholders and to maintain an optimal capital structure to reduce the cost of capital. In order to maintain or adjust the capital structure, the Group may adjust the amount of dividends paid to shareholders, increase capital or sell assets to reduce debt.
Consistent with others in the industry, the Group monitors capital on the basis of the gearing ratio. This ratio is calculated as net debt divided by total capital. Net debt is calculated by the Group as Islamic finance payables less cash and bank balances. Total capital is calculated as equity, as shown in the consolidated statement of financial position, plus net debt.
As at 31 December
2018KD
2017KD
Islamic finance payables 6,930,754 7,069,457
Less: cash and bank balances (1,580,628) (837,654)
Net debt 5,350,126 6,231,803
Total equity 22,780,976 28,294,418
Total capital 28,131,102 34,526,221
Gearing ratio 19% 18%
4.3 Fair value estimation
(a) Assets carried at amortised cost The fair value of the financial assets measured at amortised cost approximate their carrying amounts as at the reporting date.
(b) Assets carried at fair value The table below analyses financial instruments carried at fair value by valuation method. The different levels have been defined as follows:1. Quoted prices (unadjusted) in active markets for identical assets or liabilities (Level 1).2. Inputs other than quoted prices included within level 1 that are observable for the asset or liability, either directly (that is, as
prices) or indirectly (that is, derived from prices) (Level 2).3. Inputs for the asset or liability that are not based on observable market data (that is, unobservable inputs) (Level 3).
The following table presents the Group’s financial instruments that are measured at fair value on a recurring basis as at 31 December 2017.
31 December 2017Level 1
KDLevel 2
KDTotal
KD
Financial assets at fair value through profit or loss
Unquoted equity securities - 3,767 3,767
Total - 3,767 3,767
There were no transfers between levels during the year.
Notes to the consolidated financial statements
For the year ended 31 December 2018
Notes to the consolidated financial statements
For the year ended 31 December 2018

Annual Report 2018 | 5352 | Strategic Restructuring
5. CRITICAL ACCOUNTING ESTIMATES AND JUDGEMENTS
Estimates and judgements are continually evaluated and are based on historical experience and other factors, including expectations of future events that are believed to be reasonable under the circumstances.
The Group makes estimates and assumptions concerning the future. The resulting accounting estimates will, by definition, seldom equal the related actual results. The estimates and assumptions that have a significant risk of causing a material adjustment to the carrying amounts of assets and liabilities within the next financial year are addressed below.
(a) Valuations of investment propertiesThe determination at the fair value of investment property requires the use of estimates. These estimates are based on local market conditions existing at the reporting date.
In arriving at their estimates of market values as at 31 December 2018, the valuation consultants have applied their market knowledge and professional judgment to use an income approach and sales comparable approach to measure the value of the property. Therefore, in arriving at their estimates of market values for the undeveloped raw lands as at 31 December 2018, the valuers have not only relied solely on historic transactional comparables. In these circumstances, there is a greater degree of uncertainty than which exists in a more active market in estimating the market values of investment property.
Income approach is used to measure the value of the property through a discounted cash flow (DCF) analysis of the net operating income, presuming that the capital investment for the land and buildings is recovered in full over the period of the ground lease.
(b) Classification of real estate propertiesUpon acquisition of a real estate property, the Group classifies it into either of the following classifications based on the purpose for which the management will be using it:
(i) Investment properties The management classifies real estate property as an investment property if it is used to generate rental income, for capital appreciation, or for undetermined future use.
(ii) Developing propertiesThe management classifies real estate property as a developing properties if it is acquired with the intention of development.
(iii) Developing properties The Group develops and sells residential properties. Management has determined that revenue is recognised when control over the property has been transferred to the customer. Therefore, revenue is recognised at a point in time. Management considers that control passes when the customer has taken possession of the unit along with compliance with all local regulatory requirements governing the real estate sale contracts.
6. INVESTMENT PROPERTIES
As of 31 December
2018KD
2017KD
Balance at the beginning of the year 30,236,935 33,378,463
Transfers to developing properties (note 7) - (2,525,264)
Additions during the year 29,710 10,628
Change in fair value (5,514,460) (175,814)
Foreign currency translation differences (130,085) (451,078)
Balance at the end of the year 24,622,100 30,236,935
Investment properties represent land, industrial, and commercial properties acquired or constructed through the Group’s subsidiaries in the Kingdom of Bahrain.
LandLand represents approximately 15,312 square meters of land owned by First Kuwait Al Seef Real Estate Development Company W.L.L. (a subsidiary) with a carrying value amounted to KD 10,012,363 as at 31 December 2018 (31 December 2017: KD 14,142,341), located at Seef Area in the Kingdom of Bahrain.
The Board of Directors has approved projects on two of the plots covering a combined area of 10,587 square meters. These two projects are currently in the design and tendering stages. Once complete, these two developments are intended to be held to earn rental income and capital appreciation. The remaining two plots of a combined area of 4,725 square meters are currently held for undetermined future use. The Group has not concluded as to whether these two land plots will be held-for-capital appreciation or for development to earn rental income in the future.
Industrial propertiesThe properties consist of seven industrial buildings owned by Majaal Warehouse Company W.L.L. (a subsidiary) with a carrying value amounted to KD 10,471,769 as at 31 December 2018 (31 December 2017: KD 11,940,926), built across six industrial-zoned plots located at Bahrain Investment Wharf in the Kingdom of Bahrain and held on a leasehold basis through 21 May 2056 with an option to renew for an additional 25 years.
Notes to the consolidated financial statements
For the year ended 31 December 2018
Notes to the consolidated financial statements
For the year ended 31 December 2018

Annual Report 2018 | 5554 | Strategic Restructuring
Commercial propertiesThe properties consist of an area of 8,052 square meters owned by FB Janabiya Residential Development Company W.L.L. (a subsidiary) with a carrying value amounted to KD 4,137,968 as at 31 December 2018 (31 December 2017: KD 4,153,668). The subsidiary completed the construction of a neighborhood retail center, branded as El Mercado Janabiya, in March 2016.
Investment properties amounting to KD 14,609,737 (31 December 2017: KD 16,094,594) are pledged as securities against Islamic finance payable (note 14).
(i) Amounts recognised in the consolidated statement of comprehensive income for investment properties
For the year ended 31 December
2018KD
2017KD
Change in fair value of Investment properties (5,514,460) (175,814)
Net rental income 1,154,610 1,305,338
(ii) Measuring investment properties at fair value Investment properties are held for long-term rental yields and are not occupied by the Group, except for the land that is currently held for undetermined future use. The Group has not concluded as to whether the land plots will be held-for-capital appreciation or for development to earn rental income in the future. Investment properties are carried at fair value. Changes in fair values are presented in the consolidated statement of comprehensive income.
(iii) Fair value hierarchy The fair value of investment properties was determined by external, independent property valuers, having appropriate recognised professional qualifications and recent experience in the location and category of the property being valued. The independent valuers provide the fair value of the Group’s investment properties annually.
The fair value of the land, as measured by the independent valuers, is recognised as a separate asset held-for-capital appreciation or for development to earn rental income in the future.
The fair value of industrial and commercial properties, as measured by the independent valuers, is recognised as a separate asset to account for deferred rental income which is recognised due to the straight-line treatment of operating lease income less the costs of any free periods or incentives offered to secure new tenants, spread across the entire lease term.
Accordingly, the total fair value of the properties as measured by the independent valuers equals the investment property asset and deferred rental income.
The fair values of the Group’s investment properties are categorised into Level 2 and level 3 of the fair value hierarchy. There were no transfers between levels during the year.
(iv) Valuation techniques used to determine level 2 and level 3 fair valuesThe Group obtains independent valuations for its investment properties at least annually. At the end of each reporting period, the Group updates its assessment of the fair value of each property, taking into account the most recent independent valuations. The directors determine a property’s value within a range of reasonable fair value estimates.
The best evidence of fair value is current prices in an active market for similar properties. Where such information is not available, the Group consider information from a variety of sources including:
• current prices in an active market for properties of different nature or recent prices of similar properties in less active markets, adjusted to reflect those differences
• discounted cash flow projections based on reliable estimates of future cash flows• capitalised income projections based upon a property’s estimated net market income, and a capitalisation rate derived from an
analysis of market evidence.
All resulting fair value estimates for industrial and commercial properties are included in level 3 and the land held for undetermined future use is under level 2. The level 2 fair value of land held for undetermined future use has been derived using the sales comparison approach. The key inputs under this approach are the price per square meters from current year asking prices of comparable lots of land in the same area (location and size).
(v) Fair value measurements using significant unobservable inputs (level 3) The following table presents the changes in level 3 items for the years ended 31 December 2018 and 2017 for recurring fair value measurements:
For the year ended 31 December
2018KD
2017KD
At the beginning of the year 16,094,594 16,492,884
Change in fair value (1,423,961) (175,814)
Foreign currency translation differences (60,896) (222,476)
At the end of the year 14,609,737 16,094,594
Notes to the consolidated financial statements
For the year ended 31 December 2018
Notes to the consolidated financial statements
For the year ended 31 December 2018

Annual Report 2018 | 5756 | Strategic Restructuring
(vi) Valuation inputs and relationships to fair valueThe following table summarises the quantitative information about the significant inputs used in recurring level 2 and level 3 fair value measurements.
Description Valuation technique Fair value Significant inputs Interrelationship between key unobservable inputs and fair value measurement
Land Sales comparable approach Level 2 Price per square feet For every change of KD 1 per square feet, the investment properties value would be impacted by KD 140,756.
Industrial Properties
Income approach: the valuation model considers the present value of net operating income to be generated from the property, taking into account expected rental growth rate, occupancy rate, lease incentive costs such as rent-free periods and other costs not paid by tenants. The expected net operating income is discounted using risk adjusted discount rates. Among other factors, the discount rate estimation considers the quality of a building and its location (prime vs secondary), tenant credit quality and lease terms.
Level 3 • Expected annual market rental growth rate (2%-2.5%, weighted average 2.25%).
• Occupancy rate (98.7%-99.6%, weighted average 99.1%)
• Rent-free period (2 months period on new leases)
• Risk-adjusted discount rates (weighted average 10%).
• Property yield rate 10% - 10.5%.
The estimated fair value would increase (decrease) if: • expected market rental growth
were higher (lower),• the occupancy rate was higher
(lower);• Rent-free period was shorter
(longer); or • the risk-adjusted discount rate was
higher (lower).• Property yield rate was higher
(lower).
Commercial Properties
Income approach: the valuation model considers the present value of net operating income to be generated from the property, taking into account expected rental growth rate, occupancy rate, lease incentive costs such as rent-free periods and other costs not paid by tenants. The expected net operating income is discounted using risk-adjusted discount rates among other factors, the discount rate estimation considers the quality of a building and its location (prime vs secondary), tenant credit quality and lease terms.
Level 3 • Expected market rental growth rate (2%— 3%, weighted average 2.6%).
• Occupancy rate 97.6%.• Rent-free period (3 months period
on new leases).• Risk-adjusted discount rates
(Average 8%).• Property yield rate 9%.
The estimated fair value would increase (decrease) if:• expected market rental growth
were higher (lower);• the occupancy rate were higher
(lower);• rent-free periods were shorter
(longer); or• the risk-adjusted discount rate were
higher / (lower).• Property yield rate was higher
(lower).
7. DEVELOPING PROPERTIES
Developing properties represent residential properties owned by FB Janabiya Residential Development Company W.L.L. (a subsidiary). The properties consist of a 14,240 square meter master plot, which the subsidiary has subdivided into 42 plots on which it is constructing 42 villas, branded as the El Mercado Village. Construction of the villas began in October 2016. A license to sell off-plan was received on 10 January 2017. As of 31 December 2018, 15 villas were sold.
For the year ended 31 December
2018KD
2017KD
Balance at the beginning of the year 4,984,327 493,100
Transfer from investment properties (note 6) - 2,525,264
Additions during the year 1,037,140 1,972,639
Cost of units sold (2,401,263) -
Impairment of developing properties (148,212) -
Foreign currency translation differences (17,242) (6,676)
Balance at the end of the year 3,454,750 4,984,327
Developing properties amounting to KD 3,454,750 as at 31 December 2018 (31 December 2017: KD 4,984,327) are pledged as securities against Islamic finance payables (note 14).
8. TRADE AND OTHER RECEIVABLES
As at 31 December
2018KD
2017KD
Accrued rental income 184,482 153,973
Less: Write offs during the year (37,954) -
Less: Impairment provision (54,819) -
91,709 153,973
Receivables from sale of developing properties 509,883 -
Deferred rental receivables 177,454 229,822
Prepaid expenses 67,109 85,408
846,155 469,203
9. WEKALA DEPOSITS
As of 31 December
2018KD
2017KD
Short term Wekala deposits 521,623 -
521,623 -
Wekala deposits are placed with Islamic banks in the Kingdom of Bahrain. Wekala deposits carry effective average annual profit rate of 3%. Wekala deposits have original maturity of more than 3 months.
Notes to the consolidated financial statements
For the year ended 31 December 2018
Notes to the consolidated financial statements
For the year ended 31 December 2018

Annual Report 2018 | 5958 | Strategic Restructuring
10. CASH AND BANK BALANCES
As of 31 December
2018KD
2017KD
Cash on hand and at banks 537,340 341,156
Wekala deposits 120,375 402,752
Escrow Account - FBJ 321,040 93,746
978,755 837,654
Wekala deposits carry effective average annual profit rate of 3% (2017: 3%).
Restricted cashThe cash and bank balances disclosed above and in the consolidated statement of cash flows include escrow account amounted to KD 321,040 (31 December 2017: KD 93,746) which is held by a subsidiary. This balance is subject to regulatory restrictions and is therefore not available for general use by the other entities within the Group.
11. SHARE CAPITAL
The authorised, issued and paid share capital as at 31 December 2018 and 31 December 2017 is KD 23,330,960 consisting of 233,309,600 shares of 100 fils each.
12. STATUTORY RESERVE
As required by the Companies Law no. 1 of 2016, its executive regulations and the Parent Company’s memorandum of association, 10% of the profit for the year is to be transferred to statutory reserve after recovering accumulated losses. The Parent Company may resolve to discontinue such annual transfers when the reserve exceeds 50% of paid up share capital.
Only that part of the reserve in excess of 50% of paid up share capital is freely distributable. Distribution of the balance of the reserve is limited to the amount required to enable the distribution to shareholders of 5% of paid up share capital to be made in years when accumulated profits are not sufficient for the distributions to shareholders of that amount.
During the year, nothing has been transferred to statutory reserve due to incurred losses (2017: KD 6,337).
13. FOREIGN CURRENCY TRANSLATION RESERVE
Foreign currency translation reserve is recognized in other comprehensive income when the results and financial position of all foreign operations that have a functional currency different from the presentation currency are translated into the presentation currency as follows:
Assets and liabilities for each financial position presented are translated at the closing rate at the date of that financial position;Income and expenses for each statement of comprehensive income are translated at average exchange rates (unless this average is not a reasonable approximation of the cumulative effect of the rates prevailing on the transaction dates, in which case income and expenses are translated at the rate on the dates of the transactions); and All resulting exchange differences are recognised in other comprehensive income.
14. ISLAMIC FINANCE PAYABLES
Islamic finance payables represent various structures arranged through Islamic banks in the Kingdom of Bahrain. The combined average cost of the financing is 6.10 % (2017: 6.78%).
Islamic finance payables are secured over investment properties and developing properties with a carrying amount of KD 18,064,487 (31 December 2017: KD 21,078,921) (note 6 & 7).
For the year ended
2018KD
2017KD
Opening balance 7,069,457 5,606,809
Proceeds during the year 805,001 2,054,896
Repayments (893,860) (516,341)
Foreign currency translation differences (49,844) (75,907)
6,930,754 7,069,457
Long-term Islamic finance payables 5,615,811 6,172,457
Short-term Islamic finance payables 1,314,943 897,000
6,930,754 7,069,457
The carrying value of Islamic finance payables (current and non-current) approximates their fair value.
15. TRADE AND OTHER PAYABLES
As of 31 December
2018KD
2017KD
Trade payables 463,885 1,021,567
Accrued expenses 132,182 99,579
Retention payable 147,877 92,766
Due to KFAS and Zakat - 1,331
743,944 1,215,243
Long-term trade and other payables 147,877 92,766
Short-term trade and other payables 596,067 1,122,477
743,944 1,215,243
The carrying value of trade and other payables (current and non-current) approximates their fair value.
Notes to the consolidated financial statements
For the year ended 31 December 2018
Notes to the consolidated financial statements
For the year ended 31 December 2018

Annual Report 2018 | 6160 | Strategic Restructuring
16. NET RENTAL INCOME
Rental income is generated from properties developed by wholly owned subsidiaries Majaal Warehouse Company W.L.L. (MWC) and FB Janabiya Residential Development Company W.L.L. (FBJ). MWC operates seven industrial buildings occupied by a diverse mix of small to medium sized enterprises. FBJ is developing a neighbourhood retail centre, branded as El Mercado Janabiya. All of these rental properties are located within the Kingdom of Bahrain.
For the year ended 31 December
2018KD
2017KD
Industrial Properties
Occupancy rate 95% 94%
Total leasable area (square meters) 37,654 37,654
Gross rental revenue 1,119,513 1,166,850
Cost of revenue (196,498) (180,210)
Net industrial rental income 923,015 986,640
Commercial Properties
Occupancy rate 89% 100%
Total leasable area (square meters) 4,683 4,683
Gross rental revenue 342,104 462,775
Cost of revenue (110,509) (144,077)
Net commercial rental income 231,595 318,698
Total net rental income 1,154,610 1,305,338
17. REVENUE FROM CONTRACTS WITH CUSTOMERS
The breakdown of revenue is as follows:
For the year ended 31 December
2018KD
2017KD
Analysis of revenue by category
Revenue from sale of developing properties 2,605,738 -
Consultancy income - 22,812
Total revenue 2,605,738 22,812
Revenue recognised in relation to consultation services to tenants and third parties is recognized at a point in time.
18. BASIC AND DILUTED EARNINGS PER SHARE
Earnings per share is calculated by dividing the net (loss) / profit for the year by the weighted average number of shares outstanding during the year, as follows:
For the year ended 31 December
2018KD
2017KD
(Loss) / profit for the year (5,336,679) 62,042
Weighted average number of outstanding and paid shares 233,309,600 233,309,600
Basic and diluted (loss) / earnings per share (fils / share) (22.87) 0.27
There are no potential diluted shares.
19. RELATED PARTY TRANSACTIONS AND BALANCES
Related parties represent shareholders that have representation in the Parent Company’s Board of Directors and their close relatives, directors and key management personnel of the Parent Company, and entities controlled, jointly controlled or significantly influenced by such parties. All related party transactions are carried out on terms approved by Parent Company’s management and at an arm’s length term.
The related parties’ transactions included in the consolidated statement of comprehensive income are as follows:
For the year ended 31 December
Significant transactions included in the consolidated statement of comprehensive income 2018KD
2017KD
Key management compensation
Salaries and other short-term benefits 166,244 207,385
Post-employment benefits 12,100 11,265
178,344 218,650
Notes to the consolidated financial statements
For the year ended 31 December 2018
Notes to the consolidated financial statements
For the year ended 31 December 2018

62 | Strategic Restructuring
Notes to the consolidated financial statements
For the year ended 31 December 2018
20. SEGMENTS INFORMATION
The Board of Directors is the Group’s chief operating decision maker. Management has determined the operating segments based on the information reviewed by the Board of Directors for the purposes of allocating resources and assessing performance.
The Group is divided into divisions to manage its various activities. For the purposes of segment reporting, the Group’s management has classified the Group’s services into the following:
• Real estate operations: consisting of trading, developing, leasing and managing real estate and rental of investment properties. • Non-real estate operations: consisting of investment in various Islamic financial instruments, mainly unquoted funds and
wekala.
There are no inter-segment transactions. The following tables present assets, liabilities, income, and expenses information regarding the Group’s operating segments for the years ended 31 December 2018 and 31 December 2017 respectively.
Real estate activitiesKD
Non-real estate activities
KDTotal
KD
31 December 2018
Allocated income (1,907,977) 7,320 (1,900,657)
Allocated expenses (3,436,022) - (3,436,022)
Segment results (5,343,999) 7,320 (5,336,679)
Assets 29,912,395 641,997 30,554,392
Liabilities 7,773,416 - 7,773,416
Capital expenditure 1,051,871 - 1,051,871
Real estate activitiesKD
Non-real estate activities
KDTotal
KD
31 December 2017
Allocated income 1,137,806 13,105 1,150,911
Allocated expenses (1,088,869) - (1,088,869)
Segment results 48,937 13,105 62,042
Assets 36,256,179 406,519 36,662,698
Liabilities 8,368,280 - 8,368,280
Capital expenditure 2,022,096 - 2,022,096
21. PROPOSED DIVIDENDS
The board of directors proposed not to distribute dividends for the year ended 31 December 2018 (2017: Nil).