strategic recovery planning report - nj.gov
TRANSCRIPT

FINAL REPORT–REVISED PER PUBLIC OPEN HOUSE OF JULY 8, 2014: July 28, 2014
CITY OF PERTH AMBOY
THIS REPORT WAS PREPARED WITH A GRANT FROM THE NJ DEPARTMENT OF COMMUNITY AFFAIRS
POST SANDY RECOVERY PLANNING ASSISTANCE PROGRAM
Prepared By:
David G. Roberts, P.P., AICP, LLA, LEED AP ND Joseph J. Layton, P.P., AICP Daniel N. Bloch, P.P., AICP Michael Cassidy, P.E., M.C.R.P. MC Project No.: 13002154G
STRATEGIC RECOVERY PLANNING REPORT

Table of Contents Purpose ......................................................................................................................................................... 1
Impact and Needs Assessment ..................................................................................................................... 1
Community Profile .................................................................................................................................... 1
Overview ............................................................................................................................................... 1
Strengths and Opportunities ................................................................................................................. 2
Impact Assessments .................................................................................................................................. 2
Vulnerability of Public Land Uses and Infrastructure ............................................................................ 3
Vulnerability of Residential Land Uses .................................................................................................. 6
Vulnerability of Non-Residential Land Uses .......................................................................................... 8
Comparison to Vulnerability Assessment - Middlesex County Multi-Jurisdictional Hazard Mitigation
Plan 2010 ............................................................................................................................................ 10
New Jersey 2014 Hazard Mitigation Plan Flood Hazard Insurance Plan Claims ................................. 11
Strategic Recovery Action Plan ................................................................................................................... 14
Background Planning Documents ........................................................................................................... 14
Perth Amboy Redevelopment Plan – Focus 2000 ................................................................................ 14
Perth Amboy Master Plan (2003) ........................................................................................................ 15
Perth Amboy Business Improvement District Strategic Action Plan (2012) ........................................ 16
Perth Amboy Economic Growth Strategy (2012) ................................................................................ 16
Perth Amboy Master Plan Recreation Element (2013) ....................................................................... 16
Waterfront Recovery and Redevelopment Advisory Committee ........................................................ 17
Community Planning Assistance Program (NJAPA) ............................................................................ 17
Perth Amboy Bay City Transit District Strategy (2014) ....................................................................... 17
Background Land Use Regulatory Documents ........................................................................................ 17
Identification of Projects ......................................................................................................................... 18
Appendix ..................................................................................................................................................... 24

1 | P a g e
Purpose The New Jersey Department of Community Affairs (NJDCA) has established a Post Sandy Planning
Assistance Grant Program. The purpose of this program is to support long range planning for community
redevelopment in the municipalities and counties sustaining damage from Superstorm Sandy. The
Program provides grants to municipalities and counties to hire American Institute of Certified
Planners/New Jersey Board of Professional Planners (AICP/PP) licensed planners to address conditions
created or exacerbated by the storm, identify approaches to rebuilding that will be more resistant to
damage from future storm events, and encourage sustainable economic growth.
The first step in the grant process is the preparation of a Strategic Recovery Planning Report (SRPR). A
SRPR must be completed for municipalities and counties to be eligible for additional Post Sandy planning
assistance. The purpose of the SRPR is to evaluate the impacts of the disaster on relevant community
features. The evaluation can be broad or narrow but should focus on planning goals, strategies, and
priorities leading to actions that are most urgently needed for public safety and economic recovery. The
SRPR should serve as a guide for actions to be taken going forward not only to recover from the effects
of Superstorm Sandy but also to reduce vulnerabilities to future disasters. The following document
serves as the SRPR for the City of Perth Amboy, Middlesex County, NJ.
Impact and Needs Assessment
Community Profile
Overview Perth Amboy is known as the “City By The Bay”, being bordered by the Raritan Bay and River to the
south and the Arthur Kill to the east, which separates New Jersey from Staten Island. Perth Amboy was
first settled around 1683 by Scottish colonists. Perth Amboy was incorporated as one of New Jersey’s
initial 104 townships on February 21, 1798.
Perth Amboy served as a capital of the Province of New Jersey from 1686 until 1776. In 1684, Perth
Amboy became the capital of East Jersey and remained the capital until the union of East and West
Jersey in 1702. The Proprietary House, the home of William Franklin, the last Royal Governor of New
Jersey and estranged son of Benjamin Franklin, still stands in the waterfront area of the City. During the
colonial period and for a significant time thereafter, Perth Amboy was an important way-station for
travelers between New York City and Philadelphia, as it was the site of a ferry that crossed the Arthur
Kill to Tottenville, Staten Island. Regular service began in 1709. Many aspects of the historic waterfront
remain and City Hall is the oldest continuously used public building in the United States.
As of the 2010 United States Census, the City’s population was 50,814, reflecting an increase of 3,511
(+7.4%) from the 2000 Census, which had in turn increased by 5,336 (+12.7%) from the 41,967 counted
in the 1990 Census. The racial makeup of the City was 50.26% (25,541) White, 10.54% (5,358) Black or
African American, 1.10% (561) Native American, 1.69% (859) Asian, 0.05% (27) Pacific Islander, 30.77%
(15,634) from other races, and 5.58% (2,834) from two or more races. Hispanics or Latinos of any race
were 78.10% (39,685) of the population. The City’s Hispanic population was the second highest

2 | P a g e
percentage among municipalities in New Jersey as of the 2010 Census, ranked behind Union City with
84.7%.
In 2010, 27.3% of the population were under the age of 18, and 9.3% were 65 years of age or older. The
median age was 32.4 years. The Census Bureau’s 2006-2010 American Community Survey showed that
median household income was $47,696 and the median family income was $53,792. The per capita
income for the City was $20,162. About 16.3% of families and 19.4% of the population were below the
poverty line.
Strengths and Opportunities
The City’s Master Plan envisions a future where the Perth Amboy waterfront has become one of the
State’s premier destination points for dining, entertainment and recreation. The Perth Amboy Economic
Growth Strategy of 2012 has a vision for economic growth that includes establishing a regional center
for industry, developing an energized and vibrant downtown and a waterfront that is a regional
destination. The recently adopted Master Plan Recreation Element recognizes that the coastline along
Raritan Bay and the Arthur Kill is an important environmental habitat and marine habitat. The summary
of the Waterfront Recovery and Redevelopment Advisory Committee Report No. 1 concludes that
“Perth Amboy is poised to become a destination waterfront for much of the State. Rivaling Annapolis
and Newport, the essential ingredients already exist: a large consumer market, excellent transportation
network, a historic marine culture, a historic yacht club, and an attractive waterfront location with
underutilized and open space available.”
In summary, Perth Amboy has unique assets that can be built upon. Although Superstorm Sandy
damaged portions of the waterfront, including the waterfront promenade, the opportunity to rebuild a
more attractive and resilient waterfront can make the City’s future more secure from the threat of
future storm events, while enhancing economic development and redevelopment.
Impact Assessments
The topographic characteristics of Perth Amboy played a large role in limiting the extent of damage from
Superstorm Sandy. Most of the City is elevated far enough above sea level so that the storm surge
associated with Sandy only flooded the area immediately on the waterfront or on the blocks facing the
waterfront. An exception was the industrial and oil refinery area north of Route 440 at the northeastern
corner of the City which is low lying. Although this area was flooded, little damage was reported. Figure
8 shows the extent of the storm surge in purple and the location of substantial damage to public and
semi-public properties. Much of the damage sustained was to marina docks and piers and the
waterfront promenade. Substantial damage, including damage to fencing, lighting and pathway,
occurred along the riverwalk between the Victory Bridge and east to the Cornucopia Cruise Line.
Figure 9 shows the commercial and residential properties that received substantial damage from Sandy.
Note that these properties are all located adjacent to the Arthur Kill with almost all being located on
Front Street. A total of 5 commercial properties and 21 residential properties received substantial
damage. Among the commercial properties impacted were the Raritan Yacht Club, Seabra’s Armory
Restaurant, The Barge Restaurant and Bayside Creamery. Among the residential properties impacted all

3 | P a g e
were single-family structures on Front Street with the exception of a multi-family six story structure on
High Street.
Figure 1: Top image looking down Gordon Street shows the Barge restaurant in the foreground and Seabra's Armory in the background with the cupola circled in yellow. Bottom image shows Barge restaurant after the cupola was swept off its base by Sandy's surge.
Vulnerability of Public Land Uses and Infrastructure
The most significant impacts from Superstorm Sandy in Perth Amboy were to public properties. Over
two-thirds of the City marina was lost, which is a significant source of income for the City. The High
Street fishing pier was damaged as was the historic Ferry Slip Museum. Large sections of the waterfront
promenade were damaged with paver blocks washed away and railings destroyed or damaged.
Bulkheads were also damaged and amenities such as the Wall of Honor Monument were damaged and a
waterfront park gazebo was destroyed. Beaches also lost a significant amount of sand.

4 | P a g e
Figure 2: A view taken in February of 2014 from a pier at the Harborside Marina looking back to Front Street. The public marina was hit by a surge that swept over the protective wind wall and swept boats and gangways into the parking lot and street.
Figure 3: Much of the storm damage to public property was to sidewalks, bulkheads and railings along Perth Amboy’s waterfront parks. The views above were taken in February of 2014 and show that recovery is still in progress and much remains to be reconstructed.
The Second Street Sewerage Pumping Station, which conveys wastewater from Perth Amboy to the
Middlesex County Utilities Authority, was also damaged by the Sandy storm surge. According to the
December 2013 Second Street Pumping Station Hazard Mitigation Plan, the station was overcome by
the tidal surge from the Raritan Bay, which brought in approximately five feet of flood water into the
building. The surge damaged the station building, the pumps and motors, variable frequency drives,
electrical components, generators, the boiler, work areas and facilities, storage rooms and the
operations office. As a result, the station was non-operational for eight days following Superstorm
Sandy.
Perth Amboy is also served by the Runyon Wastewater Treatment Plant in Old Bridge Township. The
Runyon facility incurred damage from Hurricane Irene in 2011. The high winds and flooding caused

5 | P a g e
damage to the access road, Prickett’s Pond Spillway, and wells #7 and #8. Additionally, there were
downed power lines near pump house #7.
The City also experienced a city-wide power outage due to Superstorm Sandy. In most areas, power
went out around 7:30 p.m. on Monday, October 29th. Power was restored in some areas on Tuesday by
9 p.m. and other areas on Wednesday by 4 p.m. Some areas, such as the Waterfront and the Budapest
neighborhood, did not have power restored until Sunday, November 4th. The Budapest area is
connected to the Sewaren power grid and the power station in Sewaren was flooded. The water had to
be pumped out before repairs could be made to the system.
The power outages were due to fallen tree limbs on the overhead powerlines from the high winds.
Between 1 p.m. on Monday and 10 p.m. on Thursday, the City received 106 calls reporting downed
wires, as recorded by the City’s computer-aided dispatch (CAD) system. While many of the calls are
likely duplicate reports of the same incident, Figure 12 in the Appendix shows at least 50 individual
locations of downed lines throughout the entire City.
Based on U.S. Geological Survey rapid deployment gauges and high water marks, FEMA reports the
observed Sandy storm surge was 12 - 14 feet in Perth Amboy. Much of the land in the developed portion
of the City at low elevations and subject to the storm surge is public property, hence the extensive
damage to public facilities.
The table below summarizes FEMA eligible damages to various public parks and community facilities in
Perth Amboy. The damages to the “Perth Amboy Marina and Walkways” was $5,759,413.18, which is
67% of the total reported damages to public facilities in the City ($8,611,775.12). The second highest
cost to the City was for the installation of emergency protective measures to its battered waterfront,
which totaled $897,054.44 (1% of the total cost).
FEMA Eligible Damages to Public Property
Title Eligible Amount Project Fed Percent
Perth Amboy Damaged Facilities $17,997.32 90.00
Beach $57,901.64 90.00
Patterson Street Sewer $44,918.62 90.00
Parking Deck $50,000.00 90.00
Sidewalks and Curbs $17,912.20 90.00
Emergency Protective Measures $31,172.66 90.00
Debris Removal $191,641.64 90.00
2nd Street Sewage Pumping Station EPM $102,783.06 90.00
Emergency Protective Measures $897,054.44 90.00
2nd Street Sewage Pumping Station $350,064.24 90.00
Perth Amboy Marina and Walkways $5,759,413.83 90.00
2nd St. Sewage Pump Station EPM Temp Repairs $344,721.47 90.00
Ferry Slip $2,695.11 90.00
Port Authority Building $40,784.69 90.00
Bay View Park $590,138.90 90.00
Perth Amboy $112,575.30 90.00
Total $8,611,775.12

6 | P a g e
Vulnerability of Residential Land Uses
While the topography of the City protected much of its neighborhoods from the storm surge of 12 - 14
feet reported above, the City reported significant impacts to at least 21 residential properties. These
residential property damages were reported at High Street at the intersection with Water Street (Figure
4) and along Front Street (18 structures). All of the structures damaged are directly across the street
from waterfront parking lots or park lands, which lie at a low elevation adjacent to Raritan Bay or the
Arthur Kill. The parking lots and low lying parkland offer no protection to the nearby residential
structures from storm surges and accompanying wave action.
There was substantial damage to the Harbortown Terrace and Landings at Harborside buildings,
(although they did not report damages to FEMA as they submitted their claims through private
insurance instead). Garages and private cars were damaged at Landings, and the fire suppression system
was also down. There was flooding up to and around the area of the currently proposed new building in
Harbortown. The existing Harbortown buildings also sustained wind damage. In Landings, the southern
building, “Admiral”, sustained approximately $0.5 million in damages, including flooding of the entire
first floor and the garage. All electrical, fire suppression and elevators were completely ruined. All cars in
the garage were totaled. The building was evacuated for 3 days. The next phase for Harbortown has
been approved, and an agreement for public improvements along the waterfront has been reached (but
the design is not final). The next phase for the Landings at Harborside is currently under site plan review.
Figure 4: The partially subgrade units of this apartment building at 44 High Street were flooded during Sandy.

7 | P a g e
Figure 5: Top image, taken from Bing.com shows post-Sandy erosion along the embankment of Bayview Park. Middle and bottom show Google street images of two ends of Front Street showing dramatic change in elevation between Front Street and Water Street at the top of the hill. Top image is near the Raritan Yacht Club and lower image is near Bayview Park and the Harborside Marina.
8 | P a g e
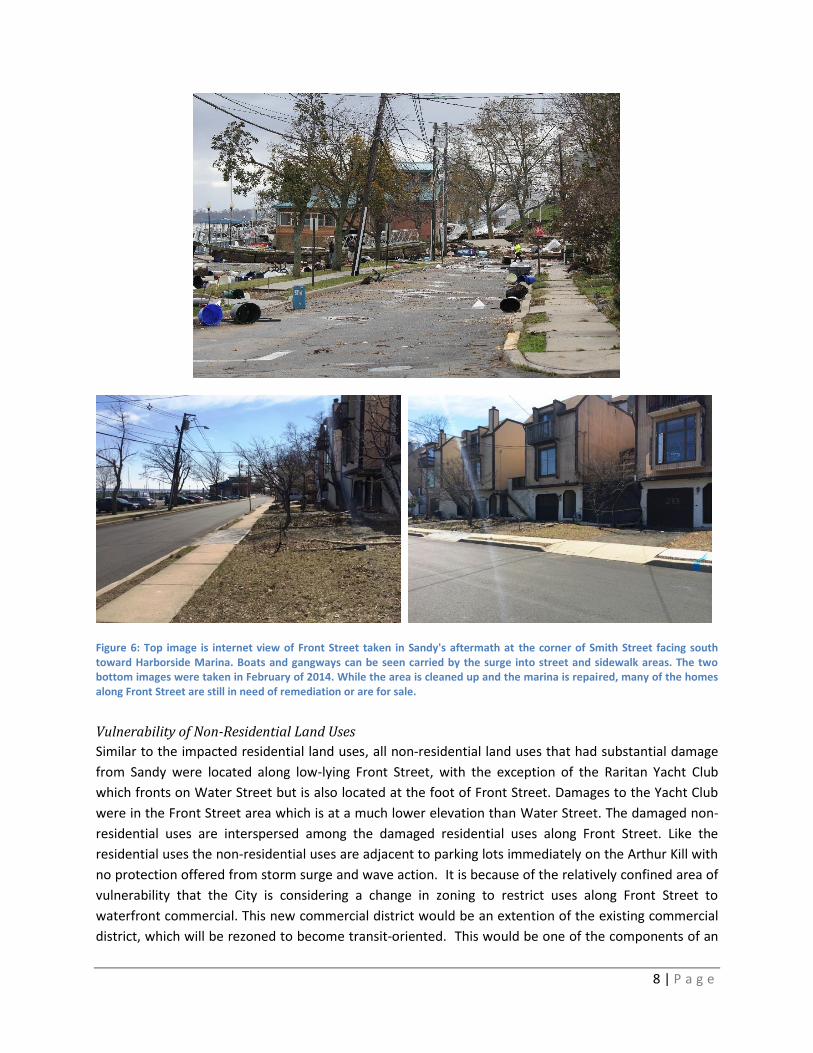
Figure 6: Top image is internet view of Front Street taken in Sandy's aftermath at the corner of Smith Street facing south toward Harborside Marina. Boats and gangways can be seen carried by the surge into street and sidewalk areas. The two bottom images were taken in February of 2014. While the area is cleaned up and the marina is repaired, many of the homes along Front Street are still in need of remediation or are for sale.
Vulnerability of Non-Residential Land Uses
Similar to the impacted residential land uses, all non-residential land uses that had substantial damage
from Sandy were located along low-lying Front Street, with the exception of the Raritan Yacht Club
which fronts on Water Street but is also located at the foot of Front Street. Damages to the Yacht Club
were in the Front Street area which is at a much lower elevation than Water Street. The damaged non-
residential uses are interspersed among the damaged residential uses along Front Street. Like the
residential uses the non-residential uses are adjacent to parking lots immediately on the Arthur Kill with
no protection offered from storm surge and wave action. It is because of the relatively confined area of
vulnerability that the City is considering a change in zoning to restrict uses along Front Street to
waterfront commercial. This new commercial district would be an extention of the existing commercial
district, which will be rezoned to become transit-oriented. This would be one of the components of an

9 | P a g e
overall study of the City’s zoning that would be one of the “preparedness” projects recommended in this
SRPR.
Figure 7: Top images from Google show the wreckage at the Raritan Yacht Club after Sandy struck on October 29, 2012.
Images below, taken in February of 2014, shows the famous Yacht Club has having largely recovered.
The Cornucopia Cruise Line, located at 401
Riverview Drive, incurred damages to the dock
and walkways, and five storage containers in the
parking lot (storing furniture, engine parts,
pumps and other items needed for the four
vessels), causing between $500,000 and
$600,000 in damage from Sandy. Fortunately,
the four yachts were not damaged as they were
relocated before the storm to another site
further up the Raritan River where they were
better protected from the surge. The damages
did not qualify for any disaster recovery relief
and the owner of the cruise line bore the cost of
repairs and replacement out of pocket and
through insurance. Figure 8: Aerial image of Cornucopia Cruise Line site dated November 3, 2012

10 | P a g e
Comparison to Vulnerability Assessment - Middlesex County Multi-Jurisdictional Hazard Mitigation
Plan 2010
The City of Perth Amboy participated in the development of the County’s Multi-Jurisdictional Hazard
Mitigation Plan with the Middlesex County Office of Emergency Management in 2010. On October 30,
2000, the President signed into law the Disaster Mitigation Act of 2000 which established a requirement
that in order to remain eligible for federal disaster assistance and grant funds, local and state
governments must develop and adopt hazard mitigation plans (HMPs). Hazard mitigation involves
identifying and taking actions to lessen the effects of natural hazards on jurisdictions and their populace.
This Middlesex County Plan focuses on six hazards with the highest potential for damaging physical
assets, people and operations in the County. These hazards are: floods, straight-line winds, winter
weather, earthquake/geological, hazardous materials release from fixed sites and transportation, and
tornadoes. These hazards were further examined to determine the extent of the risk and to start to
identify potential projects.
The flooding associated with storm surges is the greatest hazard posed to Perth Amboy, as evidenced by
Superstorm Sandy. Storm Surge is defined as the onshore rush of sea water caused by the high winds
that are associated with a landfalling hurricane or tropical cyclone and secondarily by the low pressure
of the storm. This advancing surge combines with the normal tides to create the hurricane storm tide,
which can increase the mean water level 15 feet or more. In addition, wind driven waves are
superimposed on the storm tide. This rise in water level can cause severe flooding in coastal areas,
particularly when the storm tide coincides with the normal high tides (Source: NOAA).
Storm Surge (Source: NOAA)
According to the HMP, one tool used to evaluate the threat from storm surge is the Sea, Lake and
Overland Surges from Hurricanes (SLOSH) Model. SLOSH is a computerized model run by the National
Hurricane Center (NHC) to estimate storm surge heights and winds resulting from historical,
hypothetical, or predicted hurricanes. The storm surge heights predicted by the SLOSH Model as
reported in the HMP vary from 6.7 ft. to 17.4 ft. depending on the strength of the hurricane (Categories
1 through 4). The storm surge observed in Perth Amboy of 12-14 ft. with Sandy was equivalent to that
predicted by SLOSH for a Category 2 (10.0 ft.) or Category 3 (13.8 ft.) hurricane. Although Superstorm
Sandy was a Category 1 or less storm, the storm surge was higher than would normally be expected

11 | P a g e
probably due to its slow movement and uncharacteristic approach angle to the coast. Whereas most
hurricanes and other coastal storms move in a south to north direction, Sandy turned and approached
the coast from east to west making a direct hit on the New Jersey coast.
The Middlesex HMP reported that in Middlesex County there has been no property damage, death or
injuries due to storm surge between 1950 and 2007. From the historical data the HMP indicates that
the impact on life and property in the future will most likely be low. A review of FEMA data indicates
however, that at least one property on Water Street has been the source of frequent flood claims which
may or may not be related to storm surge.
The HMP utilized two risk estimate methods to estimate the flood risk in Middlesex County. The first
method is to estimate the flood risk using estimates of total acreage and value of structures in FEMA -
identified flood zones. The total value of the assets in each flood zone is then multiplied by the
probability of flooding. The second risk assessment method is based on an analysis of National Flood
Insurance Program (NFIP) data on repetitive flood loss and severe repetitive loss (SRL) properties. The
NFIP defines repetitive loss properties as those that have submitted at least two insurance claims of
more than $1,000 in a ten-year period. As of March, 2008, Middlesex County had 202 such properties,
based on a query of the FEMA Bureaunet NFIP interface. Of these, 191 properties were residential and
11 were non-residential.
Of the residential properties with repetitive losses one was on Water Street in Perth Amboy with 9
claims totaling $51,897 over a ten year period. The source of the flooding is not identified in this analysis
but it is likely that the source is the Arthur Kill. Of the non-residential properties in Middlesex County
with repetitive losses there was also one in Perth Amboy on Kelsey Avenue with 7 claims totaling
$257,475. Kelsey Avenue is well inland from the Arthur Kill and Raritan Bay but adjacent to Spa Spring
Creek which is likely the source of flooding and the flooding is not due to storm surge.
The HMP also evaluated the risk to public facilities from FEMA Public Assistance Program Project
Worksheets. The HMP reviewed the data from two Presidentially-declared disasters in Middlesex
County; Hurricane Floyd in 1999 and severe storms in April 2007. These worksheets show the amount
of public assistance that each public applicant applied for as a result of these two disasters. The data
showed that Perth Amboy applied for $190,550 (combination of the two storms) with the categories of
aid sought as follows:
Emergency Protective Measures - $40,986 Permanent Repair Work, Public Buildings - $125,850 Permanent Repair Work, Utilities - $1,750 Permanent Repair Work, Parks and Recreation Facilities - $21,962 While these two storms did not produce a storm surge they indicate that public buildings, public parks and utilities are vulnerable to flooding impacts which was the case with Sandy.
New Jersey 2014 Hazard Mitigation Plan Flood Hazard Insurance Plan Claims
The State of New Jersey recently adopted a new Hazard Mitigation Plan, which updated the last revision
of 2011 in the three year cycle required by FEMA. The tables below from the new HMP summarize the
12 | P a g e
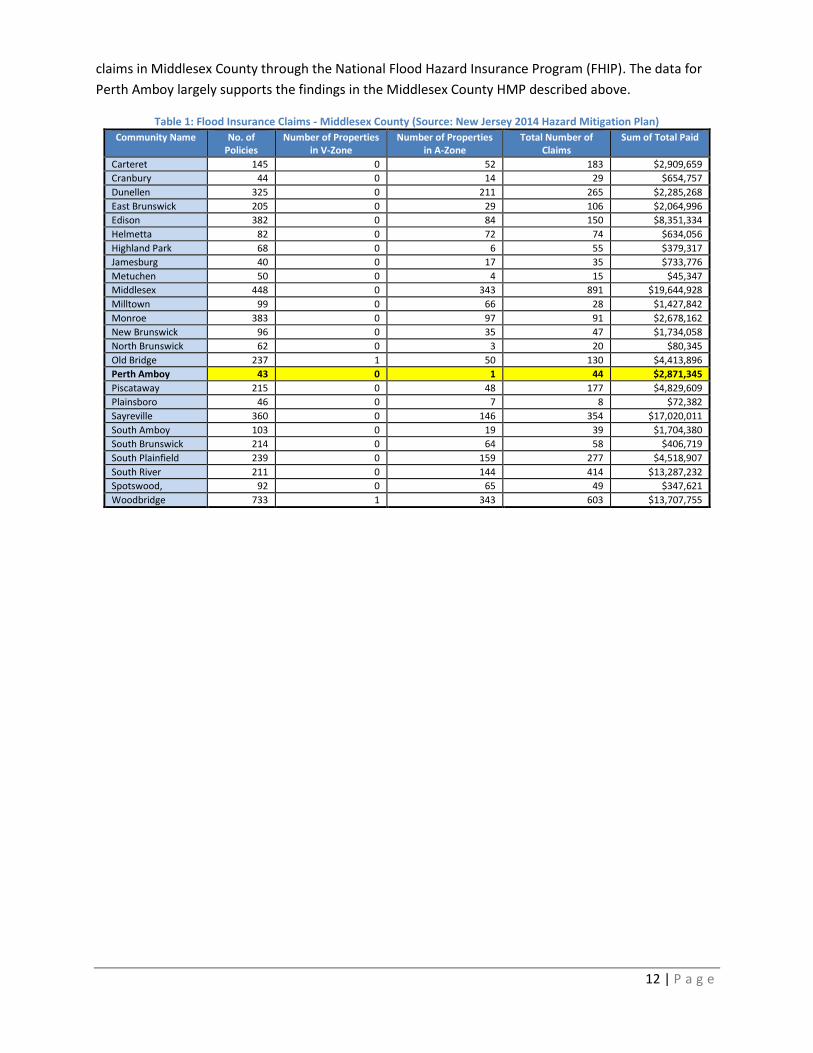
claims in Middlesex County through the National Flood Hazard Insurance Program (FHIP). The data for
Perth Amboy largely supports the findings in the Middlesex County HMP described above.
Table 1: Flood Insurance Claims - Middlesex County (Source: New Jersey 2014 Hazard Mitigation Plan)
Community Name No. of Policies
Number of Properties in V-Zone
Number of Properties in A-Zone
Total Number of Claims
Sum of Total Paid
Carteret 145 0 52 183 $2,909,659
Cranbury 44 0 14 29 $654,757
Dunellen 325 0 211 265 $2,285,268
East Brunswick 205 0 29 106 $2,064,996
Edison 382 0 84 150 $8,351,334
Helmetta 82 0 72 74 $634,056
Highland Park 68 0 6 55 $379,317
Jamesburg 40 0 17 35 $733,776
Metuchen 50 0 4 15 $45,347
Middlesex 448 0 343 891 $19,644,928
Milltown 99 0 66 28 $1,427,842
Monroe 383 0 97 91 $2,678,162
New Brunswick 96 0 35 47 $1,734,058
North Brunswick 62 0 3 20 $80,345
Old Bridge 237 1 50 130 $4,413,896
Perth Amboy 43 0 1 44 $2,871,345
Piscataway 215 0 48 177 $4,829,609
Plainsboro 46 0 7 8 $72,382
Sayreville 360 0 146 354 $17,020,011
South Amboy 103 0 19 39 $1,704,380
South Brunswick 214 0 64 58 $406,719
South Plainfield 239 0 159 277 $4,518,907
South River 211 0 144 414 $13,287,232
Spotswood, 92 0 65 49 $347,621
Woodbridge 733 1 343 603 $13,707,755

13 | P a g e
Table 2: Middlesex County Repetitive Losses (Source: New Jersey 2014 Hazard Mitigation Plan)
Community Name Occupancy Number of Repetitive
Loss Properties
Sum of Total Paid
Carteret 2-4 Family 13 $613,128
Non Residential 1 $15,344
Single Family 21 $1,135,829
Cranbury Single Family 1 $32,850
Dunellen 2-4 Family 5 $133,220
Single Family 34 $1,520,768
East Brunswick Non Residential 2 $193,000
Single Family 17 $1,220,695
Edison Non Residential 2 $371,505
Other Residential 6 $1,137,083
Single Family 7 $328,977
Helmetta 2-4 Family 1 $76,718
Single Family 14 $384,527
Highland Park Single Family 8 $306,247
Jamesburg Non Residential 1 $26,368
Single Family 2 $63,617
Middlesex 2-4 Family 7 $425,704
Assumed Condo 1 $1,402,000
Non Residential 10 $3,976,844
Other Residential 7 $1,125,029
Milltown Single Family 143 $9,280,451
Monroe Single Family 4 $330,637
New Brunswick Non Residential 3 $536,932
Other Residential 2 $357,406
North Brunswick Single Family 1 $12,599
Old Bridge Non Residential 1 $146,312
Single Family 10 $1,073,750
Perth Amboy 2-4 Family 1 $132,565
Non Residential 2 $1,215,582
Single Family 1 $63,509
Piscataway Non Residential 1 $128,174
Other Residential 15 $1,662,775
Single Family 19 $1,228,193
Sayreville 2-4 Family 3 $244,957
Assumed Condo 2 $680,047
Non Residential 4 $1,860,412
Single Family 53 $6,638,859
South Amboy Single Family 2 $37,922
South Brunswick Single Family 5 $86,087
South Plainfield 2-4 Family 3 $103,131
Non Residential 3 $1,042,742
Single Family 39 $1,892,627
South River 2-4 Family 15 $1,381,330
Non Residential 5 $704,406
Other Residential 2 $971,447
Single Family 60 $4,762,774
Spotswood Single Family 3 $58,308
Woodbridge 2-4 Family 6 $321,852
Assumed Condo 1 $1,099,120
Non Residential 2 $243,581
Other Residential 2 $715,334
Single Family 61 $3,250,543

14 | P a g e
Strategic Recovery Action Plan
Background Planning Documents
Perth Amboy Redevelopment Plan – Focus 2000
Focus 2000, the City’s Redevelopment Plan was created as a blueprint of the city’s long term
redevelopment goals. The Redevelopment Area is divided into three sub-areas:
1. South Redevelopment Area 1 – predominately retail, commercial and light industrial expansion
district.
2. East Redevelopment Area 2 – predominately mixed-use, residential.
3. North Redevelopment Area 3 – light industrial, warehouse and distribution.
The Redevelopment Plan does not include any goals, objectives, or policies that would support
municipal planning needs related to future storm mitigation or post storm recovery. Given that much of
the redevelopment area is along the waterfront, and portions of “Landings at Harborside” and
Harbortown were impacted by Sandy, there is good reason to update the redevelopment plan to
incorporate resiliency best practices.
While the City engaged in the long process of implementing the Focus 2000 Redevelopment Plan, it has
been emphasizing in recent years the importance of its rail connection on the North Jersey Coast Line to
Newark, Hoboken and Manhattan. While the train station area was not directly impacted by Superstorm
Sandy, it is linked along Smith Street to the Tottenville (Staten Island) ferry slip. Both the train station
and ferry slip are historically significant buildings. The Perth Amboy-Tottenville ferry was active until the
construction of the Outerbridge Crossing in 1928, which eventually caused the ferry to cease operations
by 1963. However, the building was restored in 1998 and is now a museum. The City is currently talking
with Staten Island officials about reopening the ferry service further north along the Arthur Kill. If that
were to become a reality, there would be an opportunity to “reinvent” Smith Street as a multi-modal
connector for bicycles, pedestrians and shuttle bus between the train station and ferry terminal. As the
ferry terminal is in a vulnerable area to future storm surge, this potential link to the train station should
be further explored in future planning, such as a Resiliency Element in the Master Plan, a new
Circulation Element of the Master Plan, and amendments to the Focus 2000 Redevelopment Plan,
among others.

15 | P a g e
Figure 9: This Bing birds eye image shows the link along Smith Street between the Perth Amboy Train Station and the ferry slip. Restoration of ferry service and linking to the train station via new "complete street" improvements to Smith Street will reinforce the importance of mobility in future planning for resiliency.
Perth Amboy Master Plan (2003)
The Perth Amboy Planning Board adopted the Master Plan in January 2003. The Plan includes a set of
goals and objectives that are intended to help achieve the City’s vision. The Master Plan includes the
following elements: Land Use Plan, Housing Plan, Fair Share Plan, Circulation Plan, Community Facilities
Plan, Recreation and Open Space Plan, Utility Plan, Recycling Plan, and Economic Plan.
The Master Plan envisions a future where the Perth Amboy waterfront has become one of the State’s
premier destination points for dining, entertainment and recreation; where new residential, commercial
and mixed-use neighborhoods have replaced the City’s underutilized properties; where existing
residential neighborhoods are protected, strengthened, and revitalized; where the City’s downtown and
commercial corridors are a key component of Perth Amboy’s economic engine, providing opportunities
for local and regional shopping; where new light industrial, office and research facilities provide
employment opportunities and an increased tax base for the City; where Perth Amboy’s parks and open

16 | P a g e
spaces provide a wide range of recreation opportunities for all of the City’s residents; where access to
the City has increased with new roads, ferry service, pedestrian and bicycle routes, and improvements
to its mass transit system; where a “smart growth” approach to planning ensures that the City’s
infrastructure, public facilities, and services continue to meet the needs of the City’s growing and
diverse population; and where the City’s ethnic diversity and multicultural heritage are increasingly
recognized as both a source of pride and a valuable resource in Perth Amboy’s new renaissance.
The Conservation Plan Element notes that the City has few areas where flooding occurs. Along the
waterfront, the existence of high velocity wave zones exists, and there are other areas within the 100
and 500-year flood plains, all of which can be expected to flood under extreme conditions. The Master
Plan includes a Flood Insurance Rate Map, which is based on FEMA mapping from 1994.
Perth Amboy Business Improvement District Strategic Action Plan (2012)
This Capital Improvements Strategic Action Plan is intended to identify and prioritize improvements to
the physical and “experiential” aspects of the Perth Amboy Business Improvement District. This
document is not intended to be comprehensive or complete, but rather a first step in documenting and
tracking these capital improvements. The Perth Amboy Business Improvement District’s goal is to
provide improvements and services to the business community located within the boundaries of the
Urban Enterprise Zone. The UEZ and BID boundaries span nearly 2 miles along Smith Street and include
a variety of use areas, each with distinct character, clientele and needs. The BID includes the Gateway
Corridor, Local Zone, Downtown Zone, and Waterfront Zone. The 2012 BID Strategic Action Plan does
not include any goals, objectives, or policies that would support municipal planning needs related to
future storm mitigation or post storm recovery.
Perth Amboy Economic Growth Strategy (2012)
The Economic Growth Strategy was prepared for the City of Perth Amboy to develop a strategy that
reflects the community’s vision for the future economic growth of the City. Perth Amboy has a vision for
economic growth that includes establishing a regional center of 21st Century industry, including
renewable energy; developing an energized and vibrant downtown and waterfront that are regional
destinations; and building a skilled workforce that is attractive to businesses. The actionable strategy is
divided into three phases: short-term actions, mid-term-actions, and long-term actions. While the
Economic Growth Strategy recommends revitalizing the waterfront economy, there are no other goals,
objectives, or policies that would support municipal planning needs related to future storm mitigation or
post storm recovery.
Perth Amboy Master Plan Recreation Element (2013)
The Perth Amboy Master Plan Recreation Element was prepared post-Sandy with the assistance of the
NJDCA Local Planning Services. The objective of the Recreation Element is to provide an inventory of
existing recreation facilities and their condition, consider community input and make recommendations
to protect and strengthen the recreation facilities and programs available to the citizens of Perth
Amboy. The plan notes that Super Storm Sandy and Hurricane Irene caused extensive damage to the
parks along the waterfront, which may give Perth Amboy the opportunity to take a holistic approach to
prioritizing and addressing funding, maintenance, use and future enhancements and acquisitions. The
impacts of past and future storms are considered in the plan.
17 | P a g e
Waterfront Recovery and Redevelopment Advisory Committee
In response to the impact of Sandy, the City created the Waterfront Recovery and Redevelopment
Advisory Committee in January 2013. The Committee’s mission is to study and prioritize projects needed
to stabilize, replace, enhance and restore facilities and infrastructure destroyed by Sandy. The Advisory
Committee held weekly meetings and issued its first report in March 2013. The report makes numerous
recommendations concerning the reconstruction and future use of the waterfront area. The Committee
recognizes that the City’s coastline along the Raritan Bay and Arthur Kill is an important environmental
habitat and valuable marine resource. The report emphasizes that all activities, development and
expansion should be planned to maximize sustainability, minimize environmental impacts and aim
towards the recovery and growth of natural habitats and improved water quality. The Committee
recognized that limited funds are available making it virtually impossible to simultaneously accomplish
everything that is needed. Accordingly, it was a challenge to prioritize immediate objectives with the
understanding that the restoration and protection from future damage of the Perth Amboy’s Waterfront
and the reconstruction of Harborside Marina is essential to the vibrancy of the City and is a key
component of its economic vitality. With that in mind the primary priority is the restoration of the
seawalls and revetments, the municipal marina and Bayview Park. The full list of projects identified by
the Committee is in the next section of this report (Identification of Projects).
Community Planning Assistance Program (NJAPA)
Perth Amboy took advantage of the New Jersey Chapter of the American Planning Association’s
Community Planning Assistance Program (CPAP) which resulted in a report entitled “Comments on Draft
Concept Plan for Response to Sandy Damage,” dated March 12, 2013. This report recommends that the
waterfront bikeway should connect on both ends to other bikeways throughout the City and should
create an interconnected system of bike paths that enable users to safely travel throughout the City and
beyond. The report also recommends that the City consult with a bike/pedestrian expert to evaluate the
feasibility of combining bicycle and pedestrian use into one multi-use trail where space is limited.
Perth Amboy Bay City Transit District Strategy (2014)
New Jersey Transit, as part of the “Together North Jersey” USHUD-funded regional planning effort,
launched a Local Demonstration Project with the City of Perth Amboy. The goal of the project, which
built on the 2012 Perth Amboy Economic Growth Strategy, was to develop a Station Area Plan for the
transit village area included within a half-mile radius of the Perth Amboy Train Station. The focus of the
project was to redevelop the Train Station Area, adaptively reuse upper levels of older commercial
buildings, proactively capitalize on the existing ethnic niche market and food offerings, rezone
downtown, connect downtown to the waterfront, and modernize parking regulations and management.
The final plan has yet to be released.
Background Land Use Regulatory Documents
The principal land use regulatory documents in Perth Amboy are the City’s Zoning Ordinance and the
Focus 2000 Redevelopment Plan. Neither of those documents anticipated the impact of Superstorm
Sandy. The City has also not faced the crush of permit applications common in many impacted towns
for property owners seeking to elevate or reconstruct their homes. Instead it appears to be the case that
the handful of impacted residential property owners along Front Street have chosen to either remediate
18 | P a g e
or put their properties up for sale. The Perth Amboy City Code contains Chapter 195, “Disasters and
Emergencies”, which gives the Mayor emergency powers to regulate curfews for pedestrian and
vehicular use of public “streets, ways and places”, the closing of businesses dispensing alcoholic
beverages and the sales of gasoline. Chapter 231 of the City Code, entitled “Flood Damage Prevention”
addresses the flood hazard regulations of FEMA and NJDEP. The ordinance was originally adopted by the
City Council on November 20, 1979 and was amended in its entirety on August 4, 1987, March 14, 2007
and June 29, 2010. The ordinance has not been amended since Superstorm Sandy and refers to
“Community Panel No. 340272”, a report entitled “Flood Insurance Study, Middlesex County, New
Jersey”, dated July 6, 2010 and Flood Insurance Rate Map for Middlesex County, dated July 6, 2010.
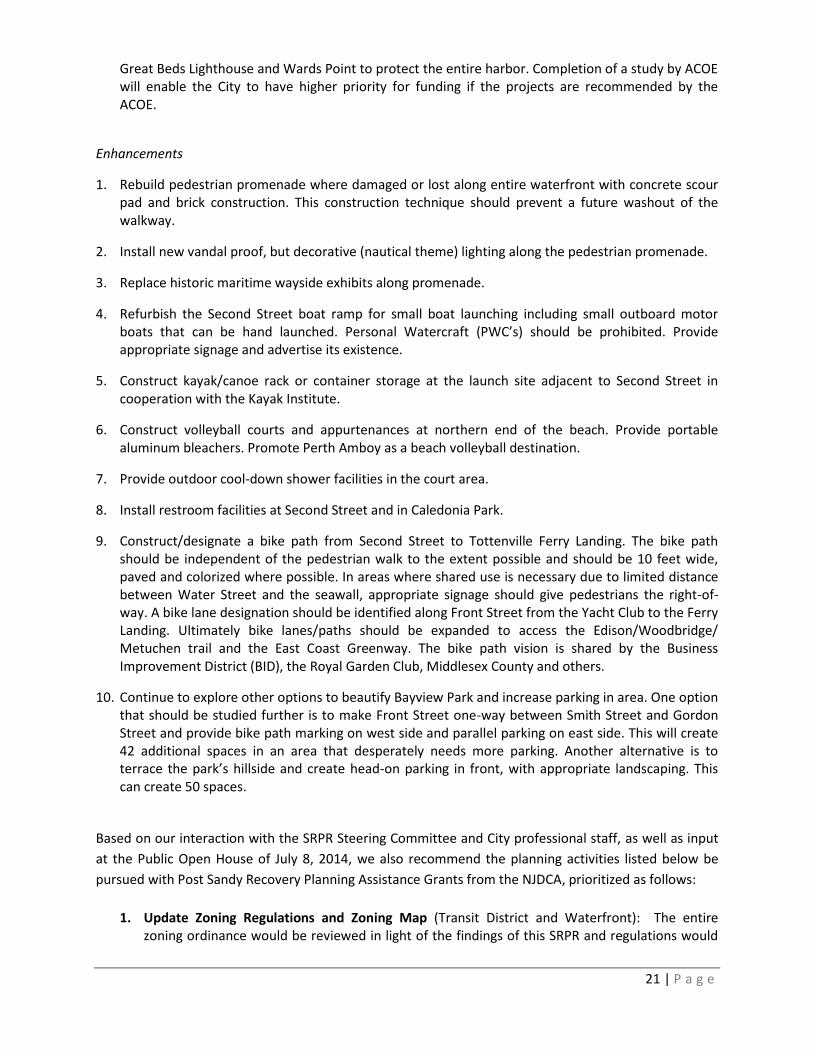
Figure 10 shows the special flood hazard areas for Perth Amboy that are reflective of the 2010 Flood
Insurance Rate Map for Middlesex County. Figure 11 shows the Advisory Base Flood Elevations for Perth
Amboy released by FEMA in 2013. The special flood hazard areas cover much more of the City and the
newly introduced areas subject to “moderate wave action” are quite extensive in the northern industrial
area. Figure 12 shows the Preliminary Flood Hazard Map released by FEMA in 2014 and indicates an
adjustment that reduces the areas shown as “A” Zones with moderate wave action and “V” zones.
Finally, the City Code contains Chapter 420, entitled “Waterfront Ordinance”, which regulates the threat
of debris liable to be washed into navigable water and also regulates the condition of wharfs, piers,
bulkheads, jetties, etc. to prevent them from becoming nuisances. This ordinance would be a logical
place to add standards requiring that floating docks, gangways, boats and other floating items be
secured upon declaration of a state of emergency under Chapter 195 or other trigger.
Clearly, the City’s ordinances are in need of updating to reconcile the final FIRMs when they are released
by FEMA.
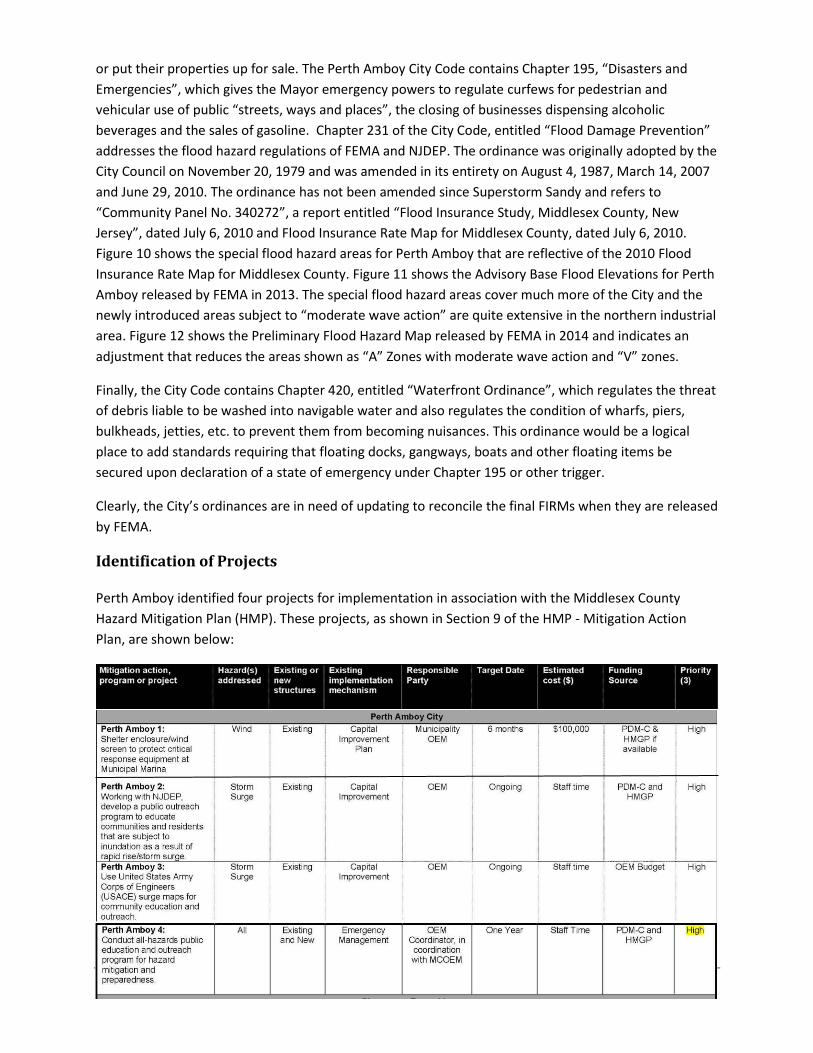
Identification of Projects
Perth Amboy identified four projects for implementation in association with the Middlesex County
Hazard Mitigation Plan (HMP). These projects, as shown in Section 9 of the HMP - Mitigation Action
Plan, are shown below:

19 | P a g e
The Perth Amboy Waterfront Recovery and Redevelopment Advisory Committee has been working since
Superstorm Sandy to assess the storm damage and develop a strategy for recovery. The Committee has
proposed a number of projects. They can be categorized as Hazard Mitigation, Preparedness or
Enhancement projects as follows:
Hazard Mitigation
A. Seawall and Revetments 1. Rebuild the revetment system with cap and wave wall between Second Street and High Street.
This wall should be at least 2.5 feet above the existing grade. Consideration should be given to increasing the height in lower areas for added storm protection. The existing revetment in this area is practically non-existent and is needed to protect the adjacent walkway and property.
2. A slide gate should be installed in the new wall at the High Street pier to be closed before an anticipated storm surge.
3. A 12” high railing should be installed on top of the wall to bring the height to 42” above grade. The rail should be designed to minimize obstruction of the view, be aesthetically pleasing and maintenance free.
4. Construct new seawall and revetment from High Street to the new Lewis Street revetment.
5. Construct new seawall and revetment from Lewis Street to the Raritan Yacht Club with a bulkhead and return wall at the Yacht Club to protect that property. This should include stairs to Bayard Beach from the Yacht Club yard.
6. Construct new 42” high corrosion resistant railing on top of the seawall between Lewis Street and the Yacht Club.
7. Construct a concrete retaining/wave protection wall on the west side of the promenade from Lewis Street to the Yacht Club. Build to new FEMA 100 year flood elevation. Height varies between elevations 18-20 feet above MSL. This is needed to protect the slope from being washed out during major storms.
8. Raise existing revetment two feet along parking lot between the Raritan Yacht Club and the Harborside Marina and between marina and Tottenville Ferry Dock. Consider increasing the height further in more flood prone areas.
B. Ferry Slip to Landings Development
1. Repair seawall drainage ports with adequate flap gates. Consider Duckbill (red valves) valves.
2. Construct a reinforced 300 foot ± earthen berm to elevation 17 between end of seawall and high ground to the north of Landings.
C. Fishing Pier and Marina
1. Salvage and reconstruct the existing docks at the north end of the marina to make as many available as possible for the 2013 boating season. The committee realizes that some of this work is progressing but have noted it here to emphasize its importance.

20 | P a g e
2. Reconstruct floating docks at the marina. Consider aluminum docks and steel piles. Piles should be topped at elevation 22 feet above MSL. The south side should take precedence and be completed for the spring 2014 season. Revenues from slip rentals plus the surplus that was available from the Perth Amboy Port Authority should be able to finance this project in just a few years. The north side also needs to be rebuilt with new docks and higher piles.
3. Repair marina wave screen decking and stringers.
4. Replace the security cameras lost during Superstorm Sandy.
5. Repair ramp on north side of Seabra Restaurant.
6. Replace the former South extension of the south fishing pier.
D. Bayview Park and Front Street
Sandy seriously eroded Bayview Park’s hillside. Temporary stabilization has been constructed. Construct wave wall above and behind the stone wall to prevent washout of the slope. Terrace the hill with appropriate plantings and landscaping.
E. Second Street Pump Station
1. Install dry-pit submersible pumps that will not be damaged if flooded.
2. Raise electrical equipment and VFD’s above flood elevation.
3. Install bulkhead entrance doors and storm shutters on windows that can be shut if storm surge expected.
4. Move emergency generator to higher ground (possibly off-site) and run feed to pump station.
5. Consider relocating pump station to higher ground.
F. Beach
1. Install dune grass and dune fencing from Second Street to High Street.
2. Construct Tee groins with revetment on the seaward end of the jetties to retain additional sand.
Preparedness
1. Maintain area at Landings between Front Street and the seawall as public open space.
2. Set up Waterfront Improvement Charity for donations. Allow public to sponsor benches and commemorative paving bricks with name engraved for a donation.
3. Change zoning on west side of Front Street between Raritan Yacht Club yard and Gordon Street, perhaps even to Bayview Park, to commercial use in order to expand commercial and restaurant use in the area. Post Sandy issues potentially affecting rebuilding of residences include raising building elevations to new FEMA elevations, zoning height restrictions and the high cost of flood insurance.
4. Request Congress to fund an Army Corps of Engineers (ACOE) Reconnaissance and Feasibility Study for protection of Perth Amboy’s waterfront. This study should include a breakwater in the vicinity of
21 | P a g e
Great Beds Lighthouse and Wards Point to protect the entire harbor. Completion of a study by ACOE will enable the City to have higher priority for funding if the projects are recommended by the ACOE.
Enhancements
1. Rebuild pedestrian promenade where damaged or lost along entire waterfront with concrete scour pad and brick construction. This construction technique should prevent a future washout of the walkway.
2. Install new vandal proof, but decorative (nautical theme) lighting along the pedestrian promenade.
3. Replace historic maritime wayside exhibits along promenade.
4. Refurbish the Second Street boat ramp for small boat launching including small outboard motor boats that can be hand launched. Personal Watercraft (PWC’s) should be prohibited. Provide appropriate signage and advertise its existence.
5. Construct kayak/canoe rack or container storage at the launch site adjacent to Second Street in cooperation with the Kayak Institute.
6. Construct volleyball courts and appurtenances at northern end of the beach. Provide portable aluminum bleachers. Promote Perth Amboy as a beach volleyball destination.
7. Provide outdoor cool-down shower facilities in the court area.
8. Install restroom facilities at Second Street and in Caledonia Park.
9. Construct/designate a bike path from Second Street to Tottenville Ferry Landing. The bike path should be independent of the pedestrian walk to the extent possible and should be 10 feet wide, paved and colorized where possible. In areas where shared use is necessary due to limited distance between Water Street and the seawall, appropriate signage should give pedestrians the right-of-way. A bike lane designation should be identified along Front Street from the Yacht Club to the Ferry Landing. Ultimately bike lanes/paths should be expanded to access the Edison/Woodbridge/ Metuchen trail and the East Coast Greenway. The bike path vision is shared by the Business Improvement District (BID), the Royal Garden Club, Middlesex County and others.
10. Continue to explore other options to beautify Bayview Park and increase parking in area. One option that should be studied further is to make Front Street one-way between Smith Street and Gordon Street and provide bike path marking on west side and parallel parking on east side. This will create 42 additional spaces in an area that desperately needs more parking. Another alternative is to terrace the park’s hillside and create head-on parking in front, with appropriate landscaping. This can create 50 spaces.
Based on our interaction with the SRPR Steering Committee and City professional staff, as well as input
at the Public Open House of July 8, 2014, we also recommend the planning activities listed below be
pursued with Post Sandy Recovery Planning Assistance Grants from the NJDCA, prioritized as follows:
1. Update Zoning Regulations and Zoning Map (Transit District and Waterfront): The entire
zoning ordinance would be reviewed in light of the findings of this SRPR and regulations would

22 | P a g e
be amended to advance the goals and objectives of this SRPR and the Community Resiliency Element proposed in Project 2 below. The Zoning Map would be amended to advance the recommendations for rezoning of Front Street to a waterfront commercial zone and to reinforce the proposed reactivation of ferry service at the Tottenville ferry slip and the Complete Street corridor along Smith Street between the ferry slip and the historic Perth Amboy Train Station.
2. Update Redevelopment Plan: The redevelopment area covered by the existing redevelopment plan is extensive and includes much of the City’s waterfront areas impacted by Sandy. It also includes large brownfield properties that have yet to be redeveloped and which are vulnerable to flooding; thereby further threatening the environmental health of the Arthur Kill, Raritan River and Raritan Bay. During this process the inclusion in the redevelopment plan area of the proposed Transit District and the application of “complete street” design improvements to Smith Street between the train station and ferry slip could be explored, perhaps under an Area In Need of Rehabilitation designation.
3. City Hazard Management and Mitigation Plan (inclusive of feasibility study for a breakwater as a mitigation project.): The development of a hazard management and mitigation plan specific to Perth Amboy would provide a formal, adopted document to contain all of the recommendations of the Perth Amboy Waterfront Recovery and Redevelopment Advisory Committee, as well as the breakwater feasibility study recommended as an outcome of the public open house and additional projects that emerge during the other planning activities outlined in the SRPR
4. Community Resiliency Element – Master Plan: The Perth Amboy Master Plan would be supplemented with a new Community Resiliency Element that would incorporate the dual role of the City’s public waterfront as providing both recreation and protection from future storm events. The new Element would also address the issue of separating combined storm/sanitary infrastructure, sustainable Best Practices for stormwater management and principles such as LEED for Neighborhood Development for improving and sustaining complete and connected neighborhoods and furthering the use of transit and reduction of Vehicle Miles Traveled (VMT).
5. Post Disaster Recovery Capital Improvement Plan: The plan for paying for capital improvements related to recovery should be emphasized above conventional capital improvement projects. Such capital improvements could include roadway re-design and installation of improvements, separation of storm and sanitary lines in vulnerable locations, elevation or hardening of public facilities such as pumping stations, power substations, installation of backup power, etc. In Perth Amboy such capital improvements could include improvements to bulkheads, construction of a dune along the City’s beach, installation of check valves, etc.
6. Update Chapters 231 (Flood Hazard Prevention”) and 420 (“Waterfront Development”) to address new flood maps and regulations for securing floating docks, gangways, etc., as well as required practices for securing boats (moorings, elevated piles, etc.).
7. Neighborhood Plans (Front Street, Train Station Area), including coordination with update to Circulation Element of Master Plan: Areas of the City such as the neighborhood along Water Street on the high side and Front Street on the low side would receive more detailed attention in the relationship between residential and non-residential uses, public open space, access to the waterfront and hazard mitigation.
8. Design Code (incorporate into zoning and redevelopment plan): While there has not yet been a crush of re-construction activity in Perth Amboy as in other storm-impacted communities, there

23 | P a g e
are a number of properties in flood prone areas that will need to deal with changes in the flood hazard regulations, flood insurance impacts and higher Base Flood Elevations. Specific design standards to deal with future building and re-building and to insure more resilient redevelopment projects should be developed and incorporated into the zoning ordinance and redevelopment plan.
The matrix below provides a summary of the projects described above.
Table 3: PERTH AMBOY POST DISASTER RECOVERY PLANNING IMPLEMENTATION MATRIX
Recovery Project Responsible
Entity
Duration Recovery Value
TYPE Community Need
Feasible Sustainable
1. 14.
Update Zoning Regulations and Zoning Map (Transit District and Waterfront)
City, NJDCA Grant Short Term Preparedness
High High High
2.
Prepare new Redevelopment Plan to address redevelopment areas along Waterfront and near transit.
City, NJDCA Grant Short Term Preparedness
High High High
3.
City Hazard Management and Mitigation Plan (inclusive of feasibility study for breakwater)
City, NJDCA Grant Short Term Preparedness
High High High
4. 15.
Community Resiliency Element – Master Plan (including update to Circulation Plan Element)
City, NJDCA Grant Short Term Preparedness
High High High
5. Post Disaster Recovery Capital Improvement Plan
City, NJDCA Grant Short Term Preparedness
High High Mod
6.
Update Chapters 231 (Flood Hazard
Prevention”) and 420 (“Waterfront
Ordinance”) to address new flood
maps and regulations for securing
boats, floating docks, gangways, etc.
City , NJDCA Grant Short Term Preparedness
Mod High Mod
7. 16.
Neighborhood Plans (Front Street, Train Station Area), including coordination with update to Circulation Element of Master Plan
City, NJDCA Grant Short Term Preparedness
High High Mod
8. 17.
Design Code (incorporate into zoning and redevelopment plan)
City, NJDCA Grant Short Term Preparedness
Mod High High

24 | P a g e
Appendix

Figure 10: Map showing areas of public property impacted by Superstorm Sandy.

Figure 11: Map showing private properties damaged in Sandy. Yellow outlined lots represent residential properties and red outlined lots represent non-residential properties.
SITE # BLOCK LOT ADDRESS OWNER
C1 53 7 273 Front St. Wolff Enterprises, Inc.
C2 50 5 211 Front St. Rosengarten, Barry
C3 50 1.01 201 Front Street Nickolas, George/Vosinas, Alexandros
C4 51 1 206 Front St. Seabra Brothers II
C5 27 9 160 Water St. Raritan Yacht Club
R1 53 10.1 287 Front St. Chen, Wei & Ngai, Chiu Mei
R2 53 10.09 285 Front St. Krueckeberg, Lenore S.
R3 53 10.08 283 Front St. Law, San San
R4 53 10.07 281 Front St. Mattoon, Craig
R5 53 10.06 279 Front St. Otlowski, George J. Jr. & Judith A.
R6 53 9.02 277 Front St. Almasi, Stephen & Rose
R7 53 8.02 275 Front St. Helsel, Fred
R8 53 4 271 Front St. Wolff, James C. & Barbara A.
R9 53 3.04 269 Front Street Hacker, Ronald & Rebecca
R10 53 3.03 267 Front Street Giles, William & Emma
R11 53 3.02 265 Front Street Persaud, Nadira & Tilka
R12 53 3.01 263 Front Street Wolff, John & Lillian
R13 50 9 217 Front St. Bonilla, George O. & Mary E.
R14 50 8 215 Front St. Selby, Wm. C. & Mary
R15 27 21 195 Front St. Godoy, Michael
R16 27 22 191 Front St. Godoy, Michael
R17 27 23.03 189 Front St. Helsel, Fredric
R18 27 23.02 187 Front St. Lloyd, Christopher T.
R19 1 1 40 High St. Mv Assoc. E&W C/O Kriegman & Smith
R20 135 2-19 Front St. Landings At Harborside, LLC
R21 353 Multiple Harbortown Blvd. Harbortown Terrace, LLC

Figure 12: Map showing wind damage throughout Perth Amboy.
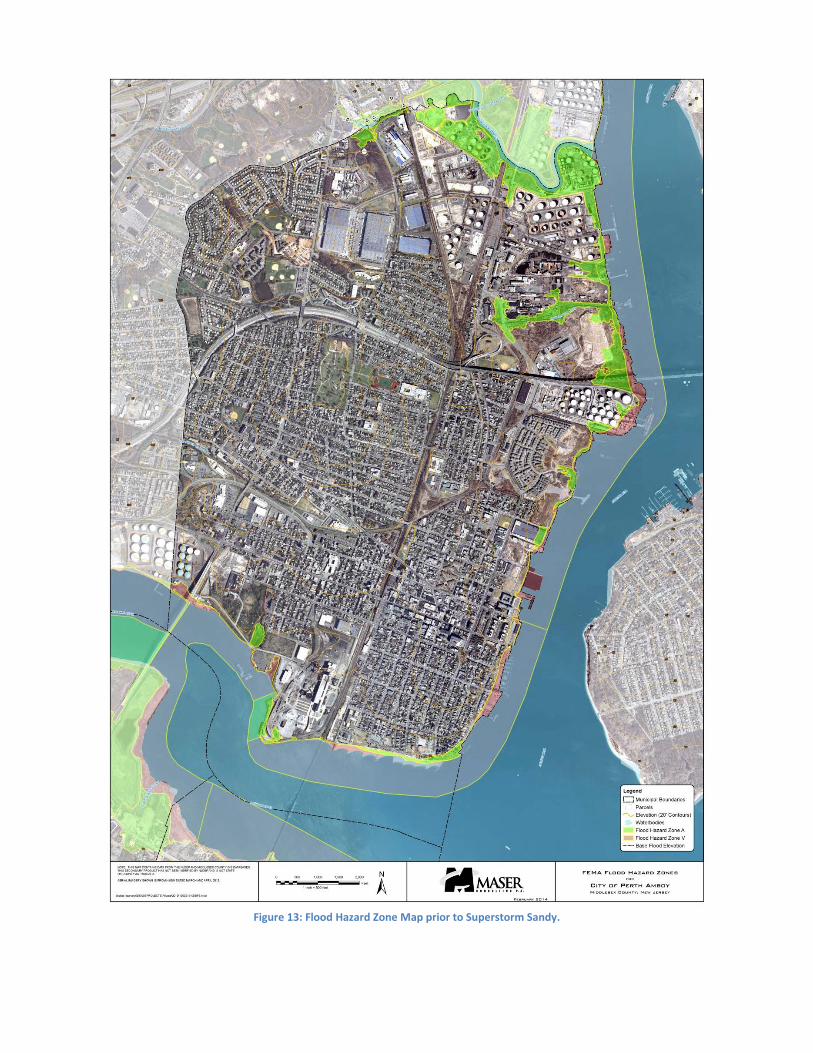
Figure 13: Flood Hazard Zone Map prior to Superstorm Sandy.
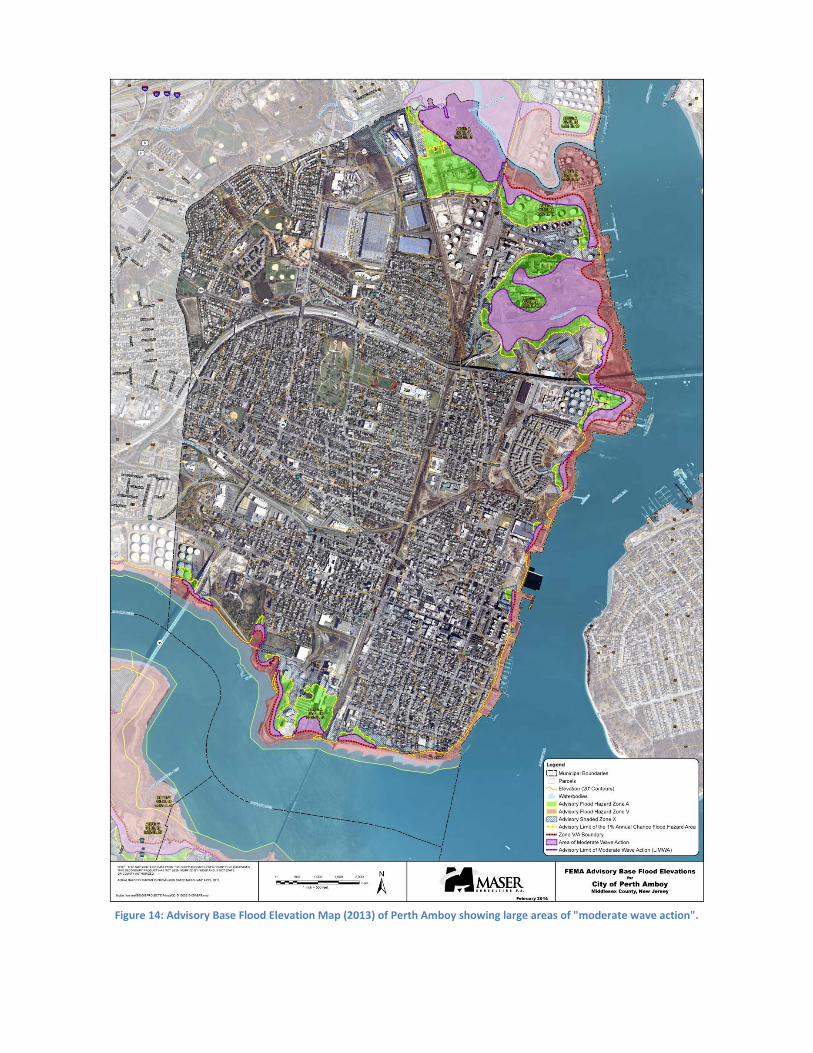
Figure 14: Advisory Base Flood Elevation Map (2013) of Perth Amboy showing large areas of "moderate wave action".
Figure 15: Preliminary Flood Hazard Map (2014), showing reduced "V" and areas of "moderate wave action".