strategic planning for dsm in a community-owned utility presented by shu-sun kwan & ed arguello...
TRANSCRIPT

Strategic Planning for DSM in a Strategic Planning for DSM in a Community-owned UtilityCommunity-owned Utility
Presented by Shu-Sun Kwan & Ed Arguello
Colorado Springs Utilities2005 APPA Engineering & Operations Conference
Memphis, TNApril 19, 2005

Strategic Planning for DSM Strategic Planning for DSM in in
a Community-owned Utilitya Community-owned UtilityDisclaimer
The research findings and DSM strategies discussed are based upon circumstances that may be unique to Springs Utilities and may not be representative of nor applicable to other customer populations, and that personal opinions expressed are those of the presenters and are not necessarily those of Springs Utilities management or directors.
What is DSM?What is DSM?
DSM = Demand Side Management Utility activities to encourage customers to
modify their level and pattern of electricity usage in ways that will produce desired changes in utility’s load shape
Benefits of DSMBenefits of DSM Utility
Contribute as an alternative resource to meet customer electricity demand
Defer future generation additions Improve plant utilization efficiency
Customers Provide choices to better manage energy use Reduce electricity bills
Environment Contribute to energy conservation Reduce emissions and impacts to environment

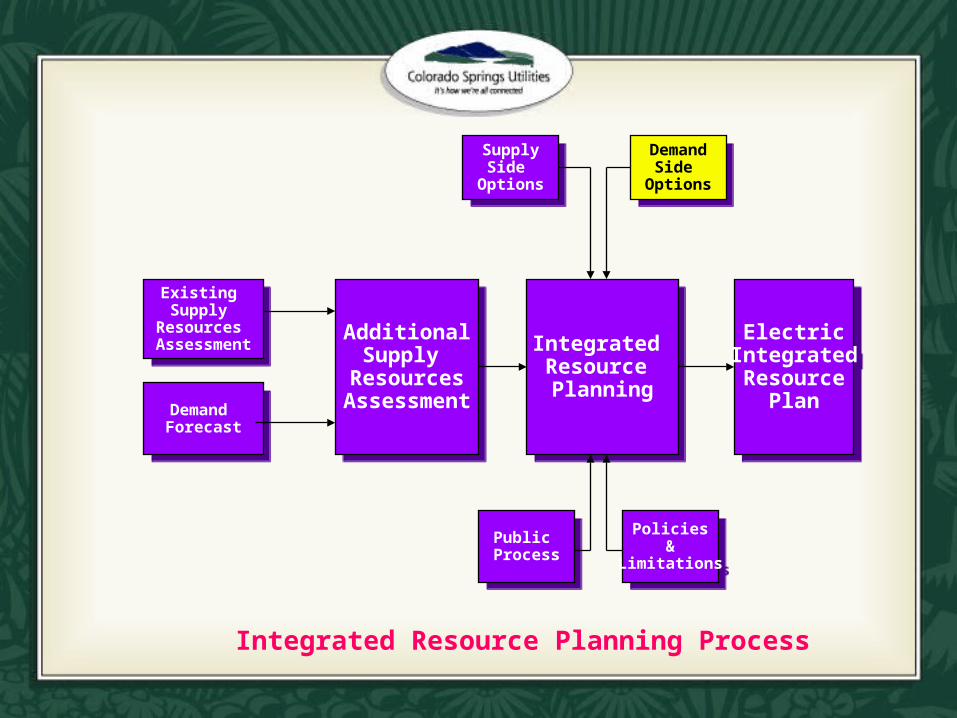
DSM as Part of the DSM as Part of the Integrated Resource PlanIntegrated Resource Plan
Existing Supply
Resources Assessment
Existing Supply
Resources Assessment
Demand Forecast
Demand Forecast
AdditionalSupply
ResourcesAssessment
AdditionalSupply
ResourcesAssessment
Integrated Resource Planning
Integrated Resource Planning
ElectricIntegratedResource
Plan
ElectricIntegratedResource
Plan
SupplySide
Options
SupplySide
Options
DemandSide
Options
DemandSide
Options
Public Process
Public Process
Policies&
Limitations
Policies&
Limitations
Integrated Resource Planning Process

Public Process Inputs (1)Public Process Inputs (1) Community values demonstrate the following priorities (1)
Price, (2) Power Supply and (3) Environmental consideration People generally support renewable energy and DSM but
cost is a deciding factor in overall acceptance Different opinions exist between who should pay for
renewable energy and DSM programs – those that use it, or all ratepayers
Customers feel it is of equal importance to invest in renewable sources and to develop programs to help customers use less electricity (DSM)
Overall, customers favor renewable energy and DSM, but support decreases when price is added as a factor

Public Process Inputs (2)Public Process Inputs (2) 65% of residential customers want to include
renewable energy in our supply mix, even if it costs more than other supply options 66% of our customers feel the additional cost for
renewable energy and DSM (if there was incremental cost) should be charged to all customers through utility rates
The majority (slightly more than 50%) of residential customers would be willing to pay $1 - $2 more per month to increase or double DSM programs and renewable energy sources from current levels

Scenario Grid OptionsScenario Grid OptionsPartial General Public Preference
Parti
al G
ener
al P
ublic
Pre
fere
nce
General Public Preference is to Rates Low
Current DSM Modest ModerateModerate to Aggressive
Aggressive
Re
fere
nc
e
Ca
se Coal-2014
Coal-2019Coal-2023
Coal-2015Coal-2020Coal-2024
Coal-2016Coal-2020
Coal-2018Coal-2023
Coal-2020
Lo
w
3 MW Small Hydro-20065MW Wind-2006
Coal-2014Coal-2019Coal-2023
3 MW Small Hydro-20065MW Wind-2006
Coal-2015Coal-2020Coal-2024
3 MW Small Hydro-20065MW Wind-2006
Coal-2016Coal-2021
3 MW Small Hydro-20065MW Wind-2006
Coal-2018Coal-2023
3 MW Small Hydro-20065MW Wind-2006
Coal-2020
Me
diu
m
3MW Small Hydro-200610MW Wind-2006
13MW Med Hydro-2011Coal-2015Coal-2019Coal-2024
3MW Small Hydro-200610MW Wind-2006
13MW Med Hydro-2011Coal-2016Coal-2020
3MW Small Hydro-200610MW Wind-2006
13MW Med Hydro-2011Coal-2016Coal-2021
3MW Small Hydro-200610MW Wind-2006
13MW Med Hydro-2011Coal-2019Coal-2023
3MW Small Hydro-200610MW Wind-2006
13MW Med Hydro-2011Coal-2021
Hig
h
3MW Small Hydro-200625MW Wind-2006
1MW PV-20077MW Biomass-2011
13MW Med Hydro-20111MW PV-2011
Coal-2015Coal-2020Gas-2024
3MW Small Hydro-200625MW Wind-2006
1MW PV-20077MW Biomass-2011
13MW Med Hydro-20111MW PV-2011
Coal-2016Coal-2021
3MW Small Hydro-200625MW Wind-2006
1MW PV-20077MW Biomass-2011
13MW Med Hydro-20111MW PV-2011
Coal-2017Coal-2021
3MW Small Hydro-200625MW Wind-2006
1MW PV-20077MW Biomass-2011
13MW Med Hydro-20111MW PV-2011
Coal-2019Coal-2023
3MW Small Hydro-200625MW Wind-2006
1MW PV-20077MW Biomass-2011
13MW Med Hydro-20111MW PV-2011
Coal-2021
DEMAND SIDE MANAGEMENT OPTIONS
RE
NE
WA
BL
ES

Resource Situation – Summer PeakResource Situation – Summer PeakRecommended CaseRecommended Case
Recommended Case - April 2004 Load Forecast Revised(Megawatts)
0
200
400
600
800
1000
1200
1400
1600
2005
2006
2007
2008
2009
2010
2011
2012
2013
2014
2015
2016
2017
2018
2019
2020
2021
2022
2023
2024
Pe
ak
De
ma
nd
Plu
s R
es
erv
es
(M
W)
Nixon Drake Western Hydro Wind Solar PV CT's Birdsall New Coal FRPower Purchase Needed DSM Surplus
ExistingResources
Nixon - coal
Drake - coal
Springs - hydro
Birdsall & Turbines - natural gas
Front Range contracted - natural gas
Surplus (blue)
Need (red)
Need (red):
149 MW in 2020
New Wind(dark green)
New Hydro(aqua)
WAPA - hydro
DSM

$2,335
$2,340
$2,345
$2,350
$2,355
$2,360
$2,365
$2,370
$2,375
$2,380
$2,385
Current DSM Modest Moderate Moderate to Aggr Aggressive
Demand Side Management Options
To
tal
Su
pp
ly C
os
t ($
mil
lio
ns
)
Current Renewables Low Renewables Medium Renewables High Renewables
Present Value of Supply Cost Present Value of Supply Cost in Million Dollarsin Million Dollars
Reference Case Lowest Supply Cost
Present Value of Supply Cost over 20 Years
Recommended Strategy

$35.5
$36.0
$36.5
$37.0
$37.5
$38.0
$38.5
$39.0
$39.5
$2,350 $2,355 $2,360 $2,365 $2,370 $2,375 $2,380 $2,385
PV of Total Supply Cost ($ millions)
Le
ve
lize
d P
er
Un
it S
up
ply
Co
st
($/M
Wh
)
Black = Current DSM LevelBlue = Modest DSM Level
Green = Moderate DSM LevelRed = Moderate to Aggr DSM Level
Purple = Aggressive DSM Level
Lowest Total Supply Cost
Lowest Per Unit Supply Cost
Reference Case
Recommended Strategy
Levelized Supply Per Unit Cost vs. Present Value Levelized Supply Per Unit Cost vs. Present Value
of Supply Costsof Supply Costs
Base - Current DSM & Renewables: $36.10/MWh
Better
Better
Circle (●) = Current Renewable LevelTriangle (▲) = Low Renewable Level
X (Ж) = Medium Renewable LevelDiamond (◊) = High Renewable Level

SituationAnalysis
SituationAnalysis DSM
Objectives
DSMObjectives DSM
Strategies
DSMStrategies
MarketStrategies
MarketStrategies
DSMTarget
Scenarios
DSMTarget
Scenarios
ProgramOptions
ProgramOptions
EIRPProcess
EIRPProcess DSM
Targets
DSMTargets
OptionsScreening
&Prioritization
OptionsScreening
&Prioritization
ProgramDesign
ProgramDesign Launch
LaunchEvaluation
Evaluation
Economic &Environmental
ImpactAnalysis
Economic &Environmental
ImpactAnalysis
BenchmarkInformation
BenchmarkInformation
DSM Strategic Planning Process

Strategic Plan ComponentsStrategic Plan Components Situation Analysis DSM Objectives & Strategies Market Strategies Program Categories & Options Program Screening Criteria Economic & Environmental Modeling DSM Target Scenarios Measurement & Verification

Situation AnalysisSituation Analysis
High demand growth Declining load factors High spot market prices Increasing natural gas prices Community values on energy conservation

DSM ObjectivesDSM Objectives
Contribute to improved system reliability of power supply
Contribute to mitigate price volatility and associated risks
Help customers use electricity more efficiently
Contribute to environmental responsibilities

DSM StrategiesDSM Strategies
Load Management Peak clipping Peak shifting Valley filling
Energy Reduction Energy efficiency Energy conservation
Market StrategiesMarket Strategies
Detailed load research required for detailed analysis by segment
Current data indicates focus should be on the following segments Residential Commercial Industrial

DSM Program CategoriesDSM Program Categories Financial Incentives
Utility provides financial incentives to change behavior to use more efficient technologies and/or reduce peak load
Rates Rate structure provides incentives or penalties to change behavior
Regulatory Utility champions and shapes various regulatory changes to shape
behavior Market Transformation
Utility forms strategic partnerships to influence manufacturers, distributors and local business to stock EE products.
Research, Development and Demonstration Utility champions new technologies through demonstration projects
Customer Education Utility promotes the awareness and benefits of DSM programs
Low-Income Program Utility offers incentives to low income customers for EE installations
Utility Facility Energy Management Utility leverage its own facilities to demonstrate the use of energy
efficient systems/technologies

Program Prioritization Program Prioritization Screening CriteriaScreening Criteria
Technical Feasibility Costs & Cost Effectiveness Amount of Savings (Energy & Demand) Environmental Contribution Ends and Executive Limitations Level of Efforts

Economic & Environmental Economic & Environmental ModelingModeling
Economic It compares the benefits and costs of DSM
programs Benefits (e.g. avoided supply costs for generation,
T&D, O&M and energy) Costs (e.g. program administration costs, and
participant costs) Cost effective if benefits are greater than costs TRC test

Economic & Environmental Economic & Environmental ModelingModeling
Environmental Green-house gases (CO2, CH4, etc.)
Sulfur dioxide Nitrogen oxides Particulates Mercury

DSM Target ScenariosDSM Target Scenarios Developed 6 Scenarios for Consideration
* Modest but not trivial * Moderate
* Moderate to Aggressive * Aggressive
* Ramp up to “Moderate to Aggressive” in 3 years
* Ramp up to “Aggressive” in 3 years
Based on National Benchmarking Data Considers:
Energy and demand savings Load factor improvement Program costs Avoided Costs Potential Rate Impacts
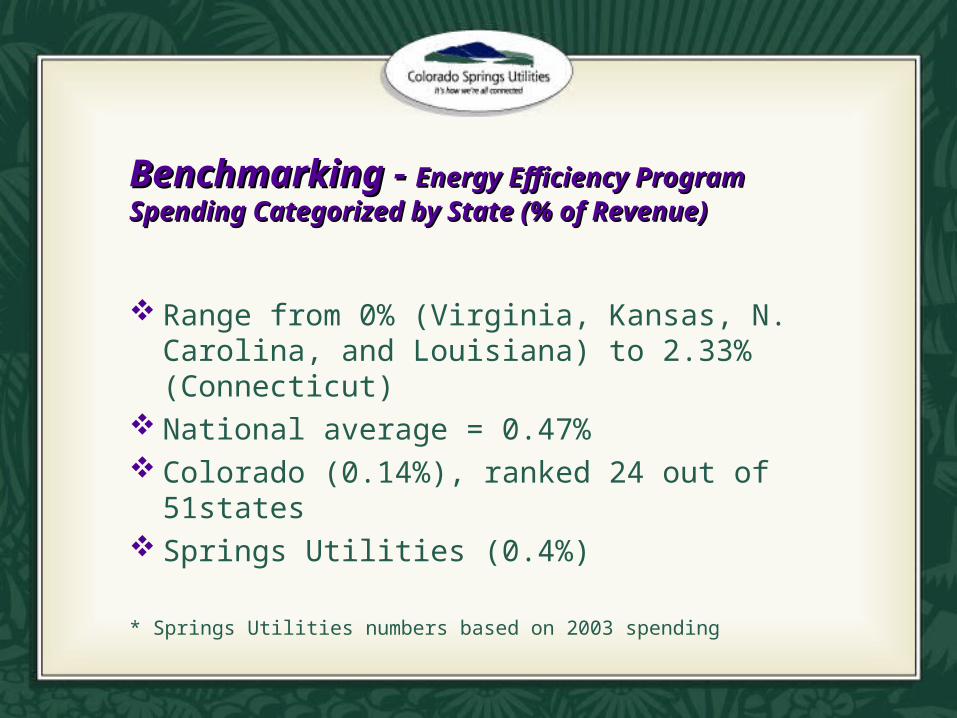
Benchmarking - Benchmarking - Energy Efficiency Program Energy Efficiency Program Spending Categorized by State (% of Revenue)Spending Categorized by State (% of Revenue)
Range from 0% (Virginia, Kansas, N. Carolina, and Louisiana) to 2.33% (Connecticut)
National average = 0.47% Colorado (0.14%), ranked 24 out of 51states Springs Utilities (0.4%)
* Springs Utilities numbers based on 2003 spending

BenchmarkingBenchmarking - - Energy Efficiency Program Energy Efficiency Program Spending Categorized by State (per Capita)Spending Categorized by State (per Capita)
Range from $0 (Virginia, Kansas) to $19.48 per capita (Connecticut)
National average = $3.88 per capita Colorado ($0.81), ranked 27 out of 51states Springs Utilities ($2.5, estimated figure)
* Springs Utilities numbers based on 2003 spending

BenchmarkingBenchmarking - Energy Efficiency Program Savings - Energy Efficiency Program Savings (cumulative) Categorized by State (savings as % of Sales)(cumulative) Categorized by State (savings as % of Sales)
Range from 0% (Kansas) to 6.79%
(Connecticut) National average = 1.66% Colorado (1.15%), ranked 23 out of 51 states Springs Utilities (0.43%)
* Springs Utilities numbers based on 2000-2003 savings and 2003 sales
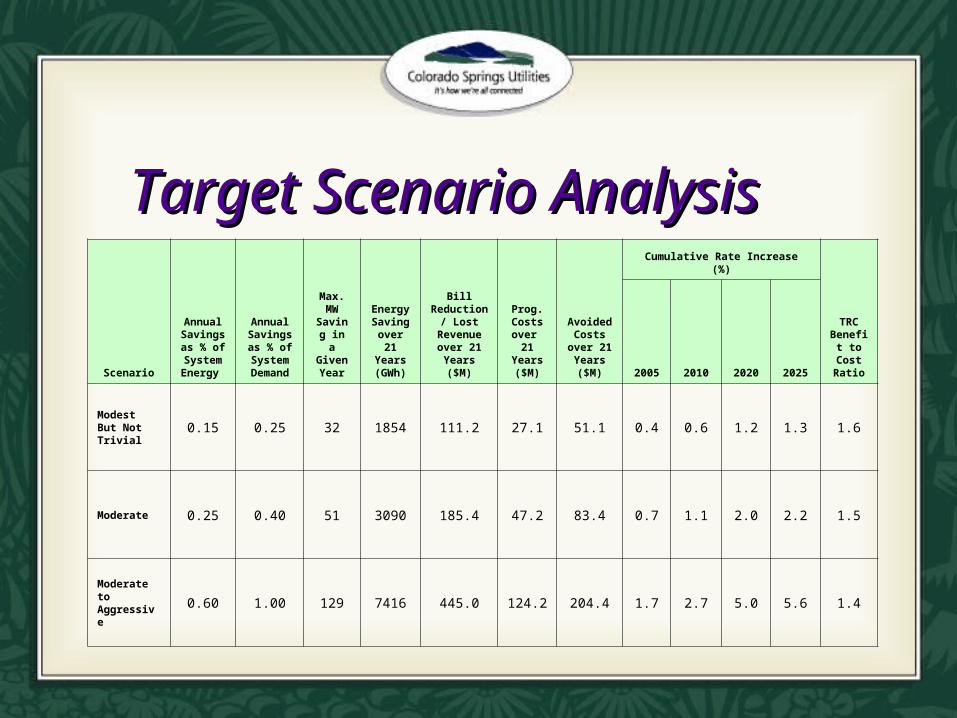
Target Scenario AnalysisTarget Scenario Analysis
Scenario
Annual Savings as % of System Energy
Annual Savings as % of System Demand
Max. MW
Saving in a
Given Year
Energy Saving over 21 Years (GWh)
Bill Reduction
/ Lost Revenue over 21
Years ($M)
Prog. Costs over
21 Years ($M)
Avoided Costs
over 21 Years ($M)
Cumulative Rate Increase (%)
TRC Benefit to Cost Ratio2005 2010 2020 2025
Modest But Not Trivial 0.15 0.25 32 1854 111.2 27.1 51.1 0.4 0.6 1.2 1.3 1.6
Moderate 0.25 0.40 51 3090 185.4 47.2 83.4 0.7 1.1 2.0 2.2 1.5
Moderate to Aggressive 0.60 1.00 129 7416 445.0 124.2 204.4 1.7 2.7 5.0 5.6 1.4

Target Scenario AnalysisTarget Scenario Analysis
Scenario
Annual Savings as % of System Energy
Annual Savings as % of System Demand
Max. MW
Saving in a
Given Year
Energy Saving
over 21
Years (GWh)
Bill Reduction
/ Lost Revenue over 21 Years ($M)
Prog. Costs over
21 Years ($M)
Avoided Costs
over 21 Years ($M)
Cumulative Rate Increase (%)
TRC Benefit to Cost Ratio2005 2010 2020 2025
Aggressive 1.00 1.50 193 12360 741.6 211.6 322.8 3.0 4.9 9.0 10.0 1.3
Ramp Up to "Moderate to Aggressive" in 3 Years
From 0.15 to 0.6 in 3 years
From 0.25 to 1.0 in 3 years
129 7096 425.8 115.4 190.1 0.4 2.4 5.0 5.6 1.4
Ramp Up to "Aggressive" in 3 Years
From 0.15 to 1.0 in 3 years
From 0.25 to 1.5 in 3
years
193 11755 705.3 194.5 297.5 0.4 4.3 8.9 9.9 1.3
Measurement & VerificationMeasurement & Verification
Engineering Approach Measurement Approach Utility Billing Data Analysis Approach

Next StepsNext Steps
Implement scenario approved by Board Reduce system energy and demand by 0.25%
and 0.4% per year respectively Conduct customer load study