strategic planning committee agenda and notice of special meeting
TRANSCRIPT

Strategic Planning Committee Agenda and Notice of Special Meeting
Monday June 3, 2013, 2:00 p.m. to 4:00 p.m. 39 Woodland St., Room 123, Hartford, CT 06105
1. Approval of April 11, 2013 Minutes
2. Finalize distinct missions of the Connecticut Community Colleges, Charter Oak State College, and
the Connecticut State Universities
3. Finalize revisions to the Connecticut State Colleges and Universities Mission Statement
4. Finalize metrics for the Strategic Plan
5. UPDATES
a) Working groups for goals
b) Plan for future development
c) Enrollment management project update

STAFF REPORT STRATEGIC PLANNING COMMITTEE
ITEM Adoption of Mission Statements for the Connecticut State Universities, the Connecticut Community Colleges, and Charter Oak State College
RECOMMENDED MOTION FOR THE BOARD WHEREAS Section 10a-1c of the Connecticut General Statutes require the Board of Regents
for Higher Education to develop and implement a plan for maintaining the distinct missions of the Connecticut State University System, the regional community-technical college system and Charter Oak State College, and
WHEREAS The Board of Regents for Higher Education on December 20, 2011 adopted a plan to preserve these distinct missions that included feedback from the Council of Presidents, the Faculty Advisory Committee and the Student Advisory Committee, and
WHEREAS Draft mission statements were received from the Council of Presidents on June 18, 2012, and
WHEREAS Draft mission statements were received from the Faculty Advisory Committee on April 24, 2013, and
WHEREAS Feedback from the full Student Advisory Committee was received during its meeting of November 30, 2012 and from an ad hoc Committee for Strategic Planning of the Student Advisory Committee on April 12, 2013, be it
RESOLVED: That the Board of Regents for Higher Education adopt the following mission statements: Connecticut Community Colleges As part of the Connecticut State Colleges and Universities ConnSCU system, the twelve Connecticut Community Colleges share a mission to make excellent higher education and lifelong learning affordable and accessible. Through unique and comprehensive degree and certificate programs, non-credit life-long learning opportunities and job skills training programs, they advance student aspirations to earn career-oriented degrees and certificates and to pursue their further education. The Colleges nurture student learning and success to transform students and equip them to contribute to the economic, intellectual, civic, cultural and social well-being of their communities. In doing so, the Colleges support the state, its businesses and other enterprises and its citizens with a skilled, well-trained and educated workforce. Charter Oak State College As part of the Connecticut State Colleges and Universities ConnSCU system, Charter Oak State College, the state’s only public, online, degree-granting institution, provides affordable, diverse and alternative opportunities for adults to

STAFF REPORT STRATEGIC PLANNING COMMITTEE
earn undergraduate and graduate degrees and certificates. The College’s mission is to validate learning acquired through traditional and non-traditional experiences, including its own courses. The college rigorously upholds standards of high quality and seeks to inspire adults with the self-enrichment potential of non-traditional higher education.
Connecticut State Universities As part of the Connecticut State Colleges and Universities ConnSCU system, the four Connecticut State Universities offer exemplary and affordable undergraduate and graduate instruction leading to degrees in the liberal arts, sciences, fine arts, applied fields, and professional disciplines. They advance and extend knowledge, learning and culture while preparing students to enter the workforce and to contribute to the civic life of Connecticut’s communities. Through a variety of living and learning environments, the Universities ensure access and diversity to meet the needs of a broad range of students. They support an atmosphere of inter-campus learning, the exploration of technological and global influences and the application of knowledge to promote economic growth and social justice.
BACKGROUND AND RATIONALE Public Act 11-48 that established the Board of Regents for Higher Education included a provision to preserve the distinctive missions of the constituent units. This language is now a part of Section 10a-1c of the Connecticut General Statutes:
Sec. 10a-1c. Plan for maintaining distinct missions of Connecticut State University System, regional community-technical college system and Charter Oak State College. Report. The Board of Regents for Higher Education shall develop and implement, not later than December 1, 2011, a plan for maintaining the distinct missions of the Connecticut State University System, the regional community-technical college system and Charter Oak State College and report on such plan to the joint standing committees of the General Assembly having cognizance of matters relating to higher education and appropriations in accordance with the provisions of section 11-4a not later than January 1, 2012, and annually thereafter.
To address this requirement, the Board adopted on December 20, 2011 a plan to preserve these missions. The plan included the BOR staff providing a compilation of existing mission statements and a matrix of common issues raised across statements to the Councils of Presidents, the Student Advisory Committee and the Faculty Advisory Committee in early spring 2012. Each group was to have completed a draft of the three mission statements by June 1, 2012, with approval by the Board envisioned in October 2012.
Draft mission statements from the Council of Presidents were received on June 18, 2012. The Faculty Advisory Committee discussed mission statements on November 16, 2012, December 14, 2012, January 11, 2013, February 12, 2013, March 15, 2013, and April 12, 2013. The faculty Advisory Committee delivered its draft of the three mission statements along with a suggested set of revisions to the ConnSCU mission statement to BOR management on April 24, 2013.

STAFF REPORT STRATEGIC PLANNING COMMITTEE
The Student Advisory Committee discussed this issue at its meeting on November 30, 2012. Co-Chair Michael Fraser established an ad hoc Committee for Strategic Planning of the Student Advisory Committee which met with Braden Hosch and Tom Clark who facilitated a discussion on April 12, 2013 to elicit feedback.
Revisions of the statements from the Council of Presidents were drafted with input from Chairman Lerer and re-presented to the Faculty Advisory Council on April 12, 2013 and the Council of Presidents on April 15, 2013. The final versions that appear in the resolution incorporate this feedback from all three groups as well as the formal statements submitted by the FAC on April 24, 2013.
DRAFT MISSION STATEMENTS FROM THE COUNCIL OF PRESIDENTS Received June 18, 2012
Connecticut State Universities Mission Statement The four Connecticut State Universities that are part of the Connecticut State Colleges and Universities (ConnSCU) system offer exemplary undergraduate and graduate instruction leading to degrees in the liberal arts, sciences, fine arts, applied fields, and professional disciplines. They advance and extend knowledge, learning and culture while preparing students to enter the workforce and to contribute to the civic life of Connecticut’s diverse communities. To ensure access and diversity and to meet the needs of a broad range of students, the schools provide varying living and learning environments, from rural residential campuses to urban locations and online instruction. With state-of-the-art facilities and exceptional faculty, the four Connecticut State Universities support an atmosphere of inter-campus learning, the exploration of technological and global influences and the application of knowledge to promote economic growth and social justice.
Connecticut Community Colleges Mission Statement The twelve comprehensive Connecticut Community Colleges that are part of the Connecticut State Colleges and Universities (ConnSCU) system share a mission to make excellent higher education and lifelong learning affordable and accessible to all Connecticut citizens. The colleges enrich the intellectual, civic, cultural and social environments of the communities they serve through a wide range of credit transfer and career programs leading to associate degrees and certificates and non-credit life-long learning opportunities and job skills training programs. The colleges support the economic growth of the state and its citizens through programs and partnerships that supply business and industry with a skilled, well-trained work force. All of the colleges offer an array of programs and support services that nurture student success.
Charter Oak State College Mission Statement Charter Oak State College, the state’s only public, online, degree-granting institution, and part of the Connecticut State Colleges and Universities (ConnSCU) system, provides diverse and alternative opportunities for adults to earn undergraduate and graduate degrees and certificates. Relying on the judgment of professional educators, Charter Oak State College validates learning acquired through examinations, independent study, work experience, non-collegiate-sponsored instruction, technology-mediated learning, and traditional study, including through Charter Oak State College’s own courses. In all of its activities, the college rigorously upholds standards of high quality and seeks to inspire adults with the self-enrichment potential of non-traditional higher education.

STAFF REPORT STRATEGIC PLANNING COMMITTEE
DRAFT MISSION STATEMENTS FROM THE FACULTY ADVISORY COMMITTEE Received April 24, 2013
ConnSCU System Mission (49 words) Connecticut State Colleges and Universities contribute to the creation of knowledge and the economic and cultural growth of the state of Connecticut by providing rigorous, innovative and affordable programs in learning environments that transform students and facilitate an increasing number of students to achieve their personal and career goals.
Connecticut State Universities Mission Statement (112 words) As part of the Connecticut State Colleges and Universities (ConnSCU) system, the four Connecticut State Universities offer exemplary undergraduate and graduate instruction leading to degrees in the liberal arts, sciences, fine arts, applied fields, and professional disciplines. They advance and extend knowledge, learning, and culture while preparing students to enter the workforce and to contribute to the civic life of Connecticut's communities. Through a variety of living and learning environments, the Universities ensure access and diversity to meet the needs of a broad range of students. They support an atmosphere of inter-campus learning, the exploration of technological and global influences and the application of knowledge to promote economic growth and social justice.
Community Colleges Mission Statement (104 words) As part of the Connecticut State Colleges and Universities (ConnSCU) system, the twelve Connecticut Community Colleges share a mission to make excellent higher education and lifelong learning affordable and accessible. Through unique and comprehensive programs, they advance student aspirations to earn career-oriented degrees and certificates and to pursue their education at other institutions. Nurturing student learning and success produces transformational experiences for many students that contribute to the economic, intellectual, civic, cultural and social well-being of their communities. In doing so, the Connecticut Community Colleges support the state, its businesses and other enterprises and its citizens with a skilled, well-trained and educated work force.
Charter Oak State College Mission Statement (77 words) As part of the Connecticut State Colleges and Universities (ConnSCU) system, Charter Oak State College, the state’s only public, online, degree-granting institution, will provide diverse and alternative opportunities for adults to earn undergraduate and graduate degrees and certificates. The College’s mission is to validate learning acquired through traditional and non-traditional experiences, including its own courses. The college rigorously upholds standards of high quality and seeks to inspire adults with the self-enrichment potential of non-traditional higher education.
FEEDBACK FROM AD HOC COMMITTEE FOR STRATEGIC PLANNING OF THE STUDENT ADVISORY COMMITTEE Meeting on April 12, 2013
The SAC Subcommittee held a meeting at 39 Woodland Street to review the missions as well as to discuss a way to develop a mission for the SAC as a group. Discussion was facilitated by Braden Hosch and Tom Clark. The Subcommittee had intended to bring their recommendations to the full SAC, but a subsequent meeting has not been held. The feedback generated in the meeting has been integrated into the proposed mission statements. Comments refer to original

STAFF REPORT STRATEGIC PLANNING COMMITTEE
statements drafted by the Council of Presidents. As an overarching comment, the group wanted to see the word “affordable” in each statement.
Connecticut Community Colleges • Sentence 1. Delete the final four words: “to make excellent higher education and lifelong
learning affordable and accessible to all Connecticut citizens.” The deletion was requested to indicate service to include undocumented students and students from other states.
• Sentence 2. Delete the phrase “will strive to” to indicate the colleges actually facilitate student aspirations and promote student-centeredness; they don’t just try to.
• Sentence 3. Capitalize “Colleges” and use present tense for “will enrich”
Charter Oak State College • Sentence 1. Add the word “affordable”
Connecticut State Universities • Sentence 1. Add the word “affordable” • Sentence 3. Delete “and diversity” because “diverse communities appears already in the
previous sentence.
06/03/13 – BOR-Strategic Planning Committee
STAFF REPORT STRATEGIC PLANNING COMMITTEE
ITEM Revisions to the Connecticut State Colleges and Universities Mission Statement
RECOMMENDED MOTION FOR THE BOARD WHEREAS Elements of a strategic plan that include a Vision for Connecticut, a Vision for the
Connecticut State Colleges and Universities, a Mission Statement, and five Goal statements were adopted on September 25, 2013, and
WHEREAS The President of the Board was directed to discuss the vision, mission and goals (VMG) with the Faculty Advisory Committee, the Student Advisory Committee, the Council of Presidents and other stakeholders, and
WHEREAS Feedback has been received about these elements of the Strategic Plan and reviewed by the Strategic Planning Committee, be it
RESOLVED: That the Board of Regents for Higher Education approve modifications to the Mission Statement for the Connecticut State Colleges and Universities to read as follows: Connecticut State Colleges and Universities contribute to the creation of knowledge and the economic growth of the state of Connecticut by providing affordable, innovative, and rigorous programs. Our learning environments transform students and facilitate an ever increasing number of individuals to achieve their personal and career goals.
BACKGROUND The Board began a strategic planning process in April 2012 and adopted a Vision for Connecticut, a Vision for the Connecticut State Colleges and Universities, a Mission Statement, and five Goal statements on September 25. In addition, three related directives were also issued:
1. Discuss the vision, mission and goals (VMG) with the Faculty Advisory Committee, the Student Advisory Committee, the Council of Presidents and other stakeholders; and
2. Form a working group to develop strategic indicators for each of the five goals; and 3. Form five working groups (one for each of the above ConnSCU goal area s) to identify
the high level strategies that drive success on that goal.
Feedback received in these discussions resulted in a number of suggestions for adjustment to the language of the mission statement.

STAFF REPORT STRATEGIC PLANNING COMMITTEE
RATIONALE The originally adopted mission statement is:
Connecticut State Colleges and Universities provide affordable, innovative and rigorous programs in settings that permit an ever increasing number of students to achieve their personal and career goals as well as contribute to the economic growth of the state of Connecticut.
Dr. René Lerer, Chair of the Strategic Planning Committee, met with Faculty Advisory Committee members Dr. Stephen Adair (Co-Chair) and Prof. Mary Jean Thornton on April 5, 2013 to discuss concerns raised by the Faculty Advisory Committee in communications from late 2012 and early 2013.
The Faculty Advisory Committee on April 24, 2013 provided a formal suggestion for adjustments to the mission.
Connecticut State Colleges and Universities contribute to the creation of knowledge and the economic and cultural growth of the state of Connecticut by providing rigorous, innovative and affordable programs in learning environments that transform students and facilitate an increasing number of students to achieve their personal and career goals
The new statement adopts a significant number of the modifications recommended by the Faculty Advisory Committee:
Connecticut State Colleges and Universities contribute to the creation of knowledge and the economic growth of the state of Connecticut by providing affordable, innovative and rigorous programs. Our learning environments transform students and facilitate an ever increasing number of individuals to achieve their personal and career goals
06/03/13 – BOR-Strategic Planning Committee
STAFF REPORT STRATEGIC PLANNING COMMITTEE
ITEM Metrics to monitor progress on goals of the Strategic Plan
RECOMMENDED MOTION FOR THE BOARD WHEREAS Elements of a strategic plan that include a Vision for Connecticut, a Vision for the
Connecticut State Colleges and Universities, a Mission Statement, and five Goal statements were adopted on September 25, 2012, and
WHEREAS The President of the Board was directed to form a working group to develop strategic indicators for each of the five goals, and
WHEREAS The working group issued a report recommending a set of metrics and a communication plan for structured comment, and
WHEREAS 159 faculty, staff, and student leaders were invited to comment on metrics and provide feedback, and this feedback has been incorporated into recommendations from the working group, be it
RESOLVED: That the metrics presented in Attachment A are adopted to monitor progress on goals of the Strategic Plan, and be it further
RESOLVED: That the President, in consultation with faculty and staff, prepare a report about ways to monitor (1) student learning, with special attention to the Transfer and Articulation Policy; (2) credit completion and grade-point averages of first-time students and/or all students; (3) post-graduation outcomes, including employment, earnings, and further study; and (4) overall out-of-pocket costs per student, and be it further
RESOLVED: That the President of the Board of Regents may establish technical definitions and make technical adjustments to these metrics as needed and report such definitions and adjustments to the Board, and be it further
RESOLVED: That performance on these metrics at the institution level and constituent unit level shall be benchmarked against groups of similar institutions determined by the President of the Board of Regents in consultation with the president of each institution.

STAFF REPORT STRATEGIC PLANNING COMMITTEE
ATTACHMENT A – METRICS RECOMMENDED FOR ADOPTION
Goal 1: A Successful First Year Increase the number of students who successfully complete a first year of college
1.1 One-year retention rate of first-time degree- or certificate-seeking students 1.1.1 Entering full-time 1.1.2 Entering part-time
1.2 First-time students completing college-level English and math within one year 1.2.1 Number 1.2.2 Percent
Goal 2: Student Success Graduate more students with the knowledge and skills to achieve their life and career goal
2.1 Undergraduate completions per 100 undergraduate degree-seeking full-time equivalent
enrollment 2.2 Graduate completions per 100 full-time equivalent graduate enrollment 2.3 Transfers from 2-year institutions to 4-year institutions per 100 full-time equivalent
enrollment 2.4 Graduation rate of full-time, first-time degree- or certificate-seeking students
2.4.1 150% normal time for 4-year institutions 2.4.2 200% of normal time for 2-year institutions
2.5 Average time (years) to degree for students entering full-time 2.5.1 First-time students 2.5.2 Transfer students
Goal 3: Affordability and Sustainability Maximize access to higher education by making attendance affordable and our institutions financially sustainable
3.1 Nonfederal government appropriations 3.1.1 per completion 3.1.2 per full-time equivalent enrollment
3.2 Education and related expenses 3.2.1 Per completion 3.2.2 Per full-time equivalent enrollment
3.3 Instructional expenditures as a percent of education and related expenses 3.4 Total annual voluntary support per full-time equivalent enrollment 3.5 Percent of tuition and required fees not covered by grant aid

STAFF REPORT STRATEGIC PLANNING COMMITTEE
Goal 4: Innovation and Economic Growth Create educational environments that cultivate innovation and prepare students for successful careers in a fast changing world.
4.1 Percent of seniors who worked on a research project with a faculty member outside of course or program requirements
4.2 Total research expenditures per full-time faculty 4.3 Completions in fields with high workforce demand
4.3.1 Science, Technology, Engineering & Math (STEM) 4.3.2 Health 4.3.3 Education
4.4 Campus-level annual report on innovation
Goal 5: Equity Eliminate achievement disparities among different ethnic/racial, economic, and gender groups.
Disaggregate by:
5.1 Race/ethnicity 5.1.1 Asian and Native Hawaiian or Pacific Islander 5.1.2 Black or African American 5.1.3 Hispanic or Latino 5.1.4 White
5.2 Gender 5.2.1 Men 5.2.2 Women
5.3 Socioeconomic Status – Pell Recipients
06/03/13 – BOR-Strategic Planning Committee
STAFF REPORT STRATEGIC PLANNING COMMITTEE
BACKGROUND AND RATIONALE The Board began a strategic planning process in April 2012 and adopted a Vision for Connecticut, a Vision for the Connecticut State Colleges and Universities, a Mission Statement, and five Goal statements on September 25. In addition, three related directives were also issued:
1. Discuss the vision, mission and goals (VMG) with the Faculty Advisory Committee, the Student Advisory Committee, the Council of Presidents and other stakeholders; and
2. Form a working group to develop strategic indicators for each of the five goals; and 3. Form five working groups (one for each of the above ConnSCU goal area s) to identify
the high level strategies that drive success on that goal.
The metrics work group met three times: November 19, December 12, and February 27. At the first meeting, the group reviewed 13 accountability measures approved by the Higher Education Coordinating Council in November 2012 because of their close alignment with the strategic plan. The group also proposed 81 additional indicators for consideration. These indicators were placed into an online survey tool, and group members were asked to rate each indicator. This list was ranked and returned to the group to focus discussion in the December and February meetings. The group arrived at three to five recommended metrics for goals 1-4 and six disaggregations for goal 5.
Principles used to guide consideration of metrics were that metrics should:
• Be meaningful – provide a limited number of high-level information points to decision makers
• Be indicative – show progress but not necessarily exhaustive; may not provide full diagnostics
• Be valid – measure what claimed to represent • Be reliable – provide consistent results over time, have consistent definitions that allow
for independent measurement or validation • Have readily available comparative data • Provide information for which the value is equal to or greater than the cost for collection • Be sensitive to institutional actions – actions taken by institutions must be able to affect
the metric
A full report of recommendations was provided to the Strategic Planning Committee for review in April 2013. The Strategic Planning Committee identified three additional items of interest:
• employment outcomes, earnings, and future study of graduates (Goal 2 – Student Success)
• fundraising per full-time equivalent enrollment (Goal 3 – Affordability and Sustainability)
• an annual report on innovation on campus (Goal 4 – Innovation and Economic Growth)
The metrics group’s recommended metrics plus these three additional metrics were forwarded to 159 individuals in the following groups for comment: the Student Advisory Committee, the

STAFF REPORT STRATEGIC PLANNING COMMITTEE
Faculty Advisory Committee, faculty and college senate leaders, campus presidents, campus academic officers, campus student affairs officers, campus finance officers, and central office executive staff. Twenty-four people entered their names into the survey, and 13 of them offered comments or suggested additional or alternative metrics.
Based on this feedback, a list of metrics for monitoring progress on the strategic plan has been refined. Principles for metric selection were considered in this refinement and some proposed metrics which are undeveloped, untested, or may not provide valid and reliable results from which decisions could be made were removed from the final list. The recommended resolution, however, calls for further study of four areas of interest and importance for possible inclusion in the future. These areas are:
(1) student learning, with special attention to the Transfer and Articulation Policy (2) credit completion and grade-point averages of first-time students and/or all
students (3) post-graduation outcomes, including employment, earnings, and further study (4) overall out-of-pocket costs per student
It is likely that in the course of generating the first set of data for the metrics that some technical definitions may need to be refined. The recommended resolution allows for the President of the Board of Regents to establish such technical definitions and refinements as necessary.
Finally, a process to identify groups of comparison institutions was initiated in April 2013. The original plan had included Board approval of these comparison group lists. Both the timing of this process and the need to allow for occasional revision of these lists has prompted a recommendation to place authority for the approval of the comparison group with the President of the Board of Regents in consultation with campus presidents.
Strategic Plan MetricsWork Group
Report of the
April 2013

Strategic Plan Metrics Work Group Report (April 2013) Page 1
Strategic Plan Metrics Work Group Report
On September 25, 2012 the Connecticut Board of Regents for Higher Education (BOR) adopted several components of a strategic plan including a Vision for Connecticut, a Vision for the Connecticut State Colleges and Universities (ConnSCU), a mission for ConnSCU, and five goals. The Board also resolved to form a working group to develop strategic indicators for each of the five goals.1
Following a review of the goals of the plan, data about the state colleges and universities, and principles for metrics selection, the group proposed 3-5 metrics for each goal, factors to be considered in the selection of comparison institutions, and a plan for communication. This report details these recommendations.
Members
Peter Bachiochi, Professor of Psychology, Eastern CSU Robert Baer, Dean of Students, Norwalk CC David England, Dean of Inst Effectiveness, Tunxis CC Gena Glickman, President, Manchester CC Oz Griebel, President & Chief Executive Officer, Metro Hartford Alliance Dorsey Kendrick, President, Gateway CC Marianne Kennedy, Provost, Southern CSU Ed Klonoski, President, Charter Oak State College Brian Donohue Lynch, Professor of Anthropology & Sociology, Quinebaug Valley CC Barbara McCarthy, Academic Dean, Asnuntuck CC Jack Miller, President, Central CSU Jay Morris, Vice President of Education & Institute of Excellence, Yale New Haven Hospital Wilfredo Nieves, President, Capital CC Michael Pascetta, SVP, Chief Financial & Administrative Officer, Women's Health USA Tom Phillips, President & Chief Executive Officer, Capital Workforce Partners Paul Reis, Chief Financial Officer, Western CSU Leonora Valvo, Chief Executive Officer, eTouches
Board of Regents and Management/Staff Participants: René Lerer, Chair of the BOR Strategic Planning Committee and Executive Chairman Dennis Murphy, Interim Chief of Staff, BOR and Deputy Commission of Labor Braden Hosch, Director of Policy and Research and Interim Director of Academic Affairs, BOR Annmarie Davis, Office of Policy and Research, BOR
1 Board of Regents for Higher Education (2012). Meeting minutes from September 25, 2012. Retrieved March 20, 2013 from http://www.ct.edu/images/uploads/BOR_092512_MINUTES.pdf#page=5.

Strategic Plan Metrics Work Group Report (April 2013) Page 2
Principles for Selection of Metrics
During the first meeting, the group reviewed principles for selection of metrics. These metrics are intended to serve as high level indicators for the BOR to monitor progress on established goals. These principles were that metrics should:
• Be meaningful – provide a limited number of high-level information points to decision makers • Be indicative – show progress but not necessarily exhaustive; may not provide full diagnostics • Be valid – measure what claimed to represent • Be reliable – provide consistent results over time, have consistent definitions that allow for
independent measurement or validation • Have readily available comparative data • Provide information for which the value is equal to or greater than the cost for collection • Be sensitive to institutional actions – actions taken by institutions must be able to affect the
metric Process
The group met three times: November 19, December 12, and February 27. At the first meeting, the group reviewed 13 accountability measures approved by the Higher Education Coordinating Council in November 2012 because of their close alignment with the strategic plan. The group also proposed 81 additional indicators for consideration. These indicators were placed into an online survey tool, and group members were asked to rate each indicator. This list was ranked and returned to the group to focus discussion in the December and February meetings. The group arrived at three to five recommended metrics for goals 1-4 and six disaggregations for goal 5.
Recommended metrics
Goal 1: A Successful First Year Increase the number of students who successfully complete a first year of college
• Percent of full-time, first-time degree- or certificate-seeking students retained one year • Percent of part-time, first-time degree- or certificate-seeking students retained one year • Number of first-time degree- or certificate-seeking students completing college-level English and
math within one year • Percent of first-time degree- or certificate-seeking students completing college-level English and
math within one year
Goal 2: Student Success Graduate more students with the knowledge and skills to achieve their life and career goal
• Undergraduate completions per 100 undergraduate degree-seeking FTE enrollment • Graduate student completions per 100 FTE graduate enrollment • Transfers from 2-year institutions to 4-year institutions per 100 FTE • Graduation rate of full-time, first-time degree- or certificate-seeking students (150% normal time
for 4-year institutions, 200% of normal time for 2-year institutions) • Average time (years) to degree for students entering full-time (disaggregated by first-time /
transfer)
Strategic Plan Metrics Work Group Report (April 2013) Page 3
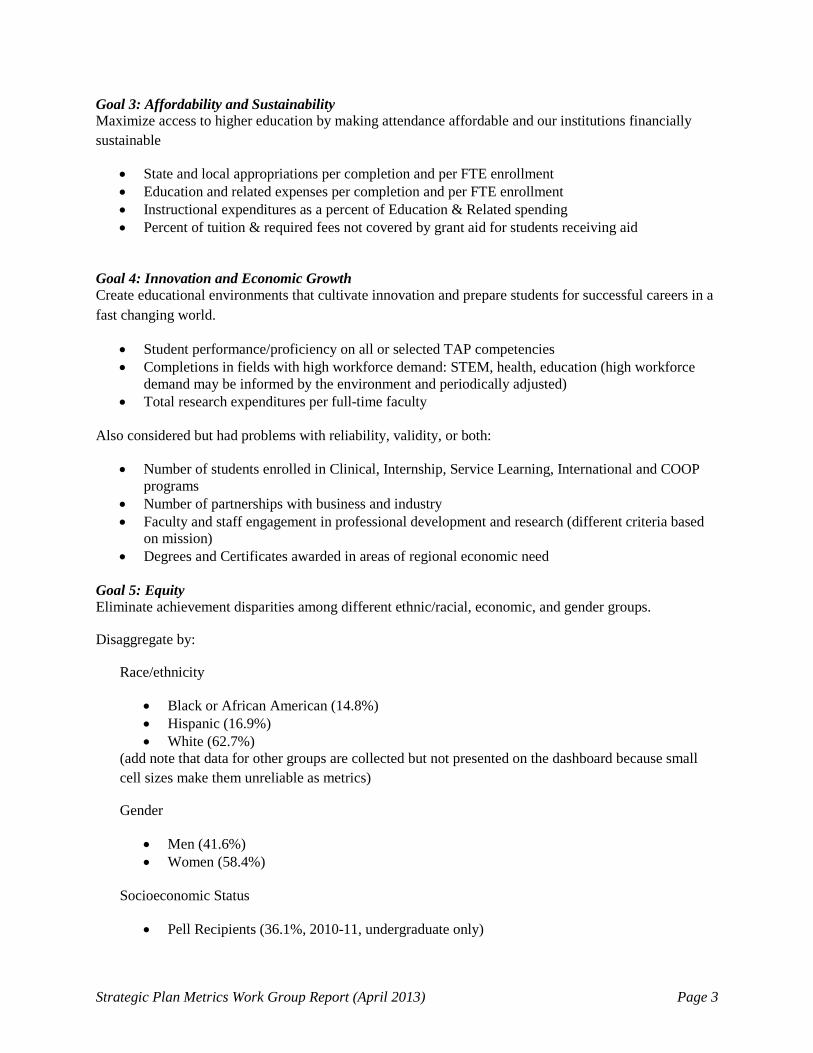
Goal 3: Affordability and Sustainability Maximize access to higher education by making attendance affordable and our institutions financially sustainable
• State and local appropriations per completion and per FTE enrollment • Education and related expenses per completion and per FTE enrollment • Instructional expenditures as a percent of Education & Related spending • Percent of tuition & required fees not covered by grant aid for students receiving aid
Goal 4: Innovation and Economic Growth Create educational environments that cultivate innovation and prepare students for successful careers in a fast changing world.
• Student performance/proficiency on all or selected TAP competencies • Completions in fields with high workforce demand: STEM, health, education (high workforce
demand may be informed by the environment and periodically adjusted) • Total research expenditures per full-time faculty
Also considered but had problems with reliability, validity, or both:
• Number of students enrolled in Clinical, Internship, Service Learning, International and COOP programs
• Number of partnerships with business and industry • Faculty and staff engagement in professional development and research (different criteria based
on mission) • Degrees and Certificates awarded in areas of regional economic need
Goal 5: Equity Eliminate achievement disparities among different ethnic/racial, economic, and gender groups.
Disaggregate by:
Race/ethnicity
• Black or African American (14.8%) • Hispanic (16.9%) • White (62.7%)
(add note that data for other groups are collected but not presented on the dashboard because small cell sizes make them unreliable as metrics)
Gender
• Men (41.6%) • Women (58.4%)
Socioeconomic Status
• Pell Recipients (36.1%, 2010-11, undergraduate only)

Strategic Plan Metrics Work Group Report (April 2013) Page 4
Characteristics for Consideration in Generating Comparison Groups
Student characteristics: • Race/Ethnicity • Socioeconomic status (percent of Pell recipients) • Age (traditional vs. non-traditional) • Residential/commuter mix • Undergraduate/graduate mix • Full-time/part-time mix
Institutional characteristics:
• Governance • Location • Cost • Size • Funding structure (state vs. local funding) • Mission (comprehensive/technical) • Carnegie Classification • Urban/Suburban/Rural • Level of degree offerings • Multi-campus vs. single structure • Full-time/part-time faculty mix
Recommended plan for communication
Metrics should be valid, reliable, and have benchmark data available.

Strategic Plan Metrics Work Group Report (March 2013) Page 5
Matrix of Goals and Metrics
Goal and Metrics Main Metric
Goal 5: Equity Eliminate achievement disparities among different ethnic/racial, economic, and gender groups.
Race/Ethnicity Gender Socioeconomic Status
Black or African
American
Hispanic White Men Women Pell Recipients
Goal 1: A Successful First Year Increase the number of students who successfully complete a first year of college
Percent of full-time, first-time degree- or certificate-seeking students retained one year
X X X X X X X
Percent of part-time, first-time degree- or certificate-seeking students retained one year
X X X X X X X
Number of first-time degree- or certificate-seeking students completing college-level English and math within one year
X X X X X X X
Percent of first-time degree- or certificate-seeking students completing college-level English and math within one year
X X X X X X X
Goal 2: Student Success Graduate more students with the knowledge and skills to achieve their life and career goal
Undergraduate completions per 100 undergraduate degree-seeking FTE enrollment
X X X X X X
Graduate student completions per 100 FTE graduate enrollment X X X X X X
Transfers from 2-year institutions to 4-year institutions per 100 FTE
X X X X X X X
Graduation rate of full-time, first-time degree- or certificate-seeking students (150% normal time for 4-year institutions, 200% of normal time for 2-year institutions)
X X X X X X X
Average time (years) to degree for students entering full-time (disaggregated by first-time / transfer)
X X X X X X X

Strategic Plan Metrics Work Group Report (March 2013) Page 6
Goal and Metrics Main Metric
Goal 5: Equity Eliminate achievement disparities among different ethnic/racial, economic, and gender groups.
Race/Ethnicity Gender Socioeconomic Status
Black or African
American
Hispanic White Men Women Pell Recipients
Goal 3: Affordability and Sustainability
Maximize access to higher education by making attendance affordable and our institutions financially sustainable
State and local appropriations per completion and per FTE enrollment
X
Education and related expenses per completion and per FTE enrollment
X
Instructional expenditures as a percent of Education & Related spending
X
Percent of tuition & required fees not covered by grant aid for students with demonstrated need
X X X X X X X
Goal 4: Innovation and Economic Growth
Create educational environments that cultivate innovation and prepare students for successful careers in a fast changing world.
Student performance/proficiency on all or selected TAP competencies
X X X X X X X
Completions in fields with high workforce demand: STEM, health, education (high workforce demand may be informed by the environment and periodically adjusted)
X X X X X X X
Total research expenditures per full-time faculty X

Page 1 of 4
BOR Strategic Plan Metrics Workgroup Meeting Notes – November 19, 2012 Present: Peter Bachiochi (ECSU), Robert Baer (Norwalk CC), David England (Tunxis CC),
Gena Glickman (Manchester CC), Oz Griebel (Metro Hartford Alliance), Braden Hosch (BOR), Ed Klonoski (Charter Oak State College), René Lerer (BOR), Barbara McCarthy (Asnuntuck CC), Jack Miller (CCSU), Jay Morris (Yale-New Haven Hospital), Dennis Murphy (BOR), Wilfredo Nieves (Capital CC), Michael Pascetta (Women’s Health USA), Tom Phillips (Capital Workforce Partners), Paul Reis (WCSU), Leonora Valvo (eTouches)
Phone: Dorsey Kendrick (Gateway CC), and Brian Donohue-Lynch (Quinebaug Valley CC) Unable to attend: Marianne Kennedy (SCSU), Ralph Tyler (Housatonic CC) R. Lerer welcomed everyone. Introductions were made. Opening Remarks R. Lerer gave a brief explanation of the formation of the Strategic Planning Committee and how they were tasked to come up with a 5-year strategic plan based on the mission and vision of ConnSCU and the State. The BOR Strategic Planning Committee consists of Regents René Lerer (Chair), Nicholas Donofrio, Matt Fleury, Merle Harris, and Michael Pollard. The goal of the workgroup is to gel as a group, identify key indicators to be measured, develop high level metrics, review and clean up the metrics, reconstruct/redistribute metrics, and then reconvene in December. Background Information B. Hosch provided background information via handouts and a PowerPoint presentation, which included information and charts regarding state trends, increase in student charges, CT high school grads, CSU grad student headcount/enrollment, ConnSCU fall headcounts 1993-2011, Charter Oak enrollment, and completion rates. Questions/Comments J. Miller stated that his CFO and others have had similar discussions about the tasks at hand for the workgroup. R. Lerer responded that in order to have a financial plan, one must have a strategic plan and that they need to link this strategy. Via phone, B. Donohue-Lynch stated that there are certainly differences between the various institutions’ goals and strategies which are unique to local economies and demographics. This will be a challenge for community colleges versus universities. R. Lerer responded that we are charged by the Governor and Legislature to have a successful program and we need a statewide approach.

Page 2 of 4
Metrics Workgroup Goals Identify metrics to arrive at established goals. What are we going to measure? We are orienting everyone to the process. We need to review strategy framework – mission, vision, goals. We need to determine the appropriateness of the metrics and indicators for ConnSCU. Propose others to the group. B. Hosch went over the following: Terminology Definitions for the following were discussed - Vision, mission, goals/outcomes, measure, metrics, and targets.
Principles Must be meaningful, indicative, valid, reliable, have comparative data, have valuable information, be sensitive. Workgroup Guidelines Sept. 15 – meeting of Strategic Planning Committee November 19 – First meeting of Strategic Plan Workgroup December xx – Define metrics December/January – Redefine/Reconstruct January 17 – Present to Board of Regents Vision & Mission O. Griebel emphasized that analytical skills are highly needed for Connecticut to be a globally competitive entity and workforce with a value to its students. Initial Discussion of Metrics on Five Goals Goal # 1 – A Successful First Year
Identify what credits are – towards grad?
Are transfer students being counted? Charter Oak is 100% transfer students. Perhaps remove the language “1st academic year”.
For this indicator metric should disaggregate populations by entry status (first-time/transfer) and enrollment status (full-time/part-time)
Where do we fall within all other states?
Retention/# who completes first semester
Pre-College characteristics
Measures – attendance, mid-term grades, use these to get student from semester to semester
FLIP CHART NOTES – Goal #1
Persistence rate (retention?)
# who complete first semester
What is definition of success? Grade? “Cs”? “Ds” aren’t transferrable. This is more an institution question.
Should students declare a major at the end of their first year?

Page 3 of 4
Not getting into GRADES but emphasizing COMPENTENCIES (see goal #2)
We want students to pass successfully – Passing is a “D”. Should it be “C” or better to graduate?
Quality of student success – will they be able to participate in a global unprecedented market?
Goal # 2 – Student Success
Employable/Self-sufficient – Is employment/earnings after graduation measurable?
Knowledge and skills – need something beyond just good grades. Need to graduate being job ready and able to hit the ground running. The TAP standard is fuzzier than just being workforce ready. Students train for jobs that don’t yet exist and/or they graduate into jobs which have obsolete technology for which they just learned.
Distinction between a student with a focused track versus a less focused track
Goal # 3 – Affordability and Sustainability
“Bend the trend” to control costs
Median household income differs from town to town
State framework metrics of revenue and expenditures derive from Delta Cost Project
o State and local appropriations per completion and per 100 FTE enrollment
o Education and related expenses per completion and per FTE enrollment
o Instructional expenditures as a percent of Education & Related spending
FLIP CHART NOTES – Goal #2
Average time and average credits to credential – what is average time to reach goals? Is this helpful?
Allow flexibility to students /offerings
Competencies
FLIP CHART NOTES – Goal #3
% of student need not covered by grants
Per capita debt on graduation
Foundation support for tuition/cost
Increase in Tuition/Fees versus inflation

Page 4 of 4
Goal # 4 – Innovation and Economic Growth
Who looks at/measures future trends, high-work demand?
Business partnerships are a good measure
Internships Goal # 5 – Equity
Achievement gap -- Disaggregate on basis of race/ethnicity, gender, and socioeconomic status where possible.
Life goals/Good citizen? No – Has to be quantifiable.
A copy of what was discussed will be distributed. We would like to come up with ways to provide tools to students for workplace and life. Any comments/thoughts are to be sent to Braden Hosch ([email protected]) We will reconvene in December. Thank you to all who participated! The meeting adjourned at 4:05 p.m. Respectfully submitted, Annie Davis Executive Assistant BOR – Office of Policy and Research
FLIP CHART NOTES – Goal #4
# of employer input opportunities of program development
Move to straight competencies
Alternate degree paths
Measure placements in STEM, health, education
FLIP CHART NOTES – Goal #5
% of enrollment of groups

Page 1 of 5
BOR Strategic Plan Metrics Workgroup Meeting Notes – December 12, 2012 Present: Peter Bachiochi (ECSU), Robert Baer (Norwalk CC), David England (Tunxis CC),
Gena Glickman (Manchester CC), Braden Hosch (BOR), Marianne Kennedy (SCSU), Ed Klonoski (Charter Oak State College), Rene Lerer (BOR), Barbara McCarthy (Asnuntuck CC), Jack Miller (CCSU), Jay Morris (Yale-New Haven Hospital), Wilfredo Nieves (Capital CC), Tom Phillips (Capital Workforce Partners), Paul Reis (WCSU)
Phone In: Dorsey Kendrick (Gateway CC), Brian Donohue Lynch (Quinebaug Valley CC), and
Michael Pascetta (Women’s Health USA) Absent: Oz Griebel (Metro Hartford Alliance), Dennis Murphy (BOR), Lenora Valvo
(eTouches) Braden Hosch welcomed everyone. The meeting started at 9:02 a.m. Review and Approve Meeting Notes The meeting notes were approved unanimously. Recap from November Meeting R. Lerer welcomed everyone and thanked them for attending. He stated that he thought that the November meeting went well. He affirmed there are differences in each environment and these will be acknowledged, but the Board has some need to aggregate to a state level. With goals, we are accountable to the state and accountable to an overall budget. Today’s goal is to reach a level of agreement in the key metrics. W. Nieves indicated that at least on metric should address non-credit programs. President Glickman stated that the metrics should be separated by segment and that some metrics weren’t clear in their meaning. Review of Metrics Survey – Identify Items to Shelve B. Hosch gave an overview of the principles for metrics selection. The timeframe, generally speaking, is on an annual cycle. We need a way to report trends. For now we will identify metrics, and then we will determine the timeframe. B. Hosch reviewed indicator ratings and goals. There was concern that perhaps the same question was asked three different ways. There should be three tiers – community colleges, state universities, and Charter Oak. R. Lerer reiterated that we must learn to “step out of the box” and ask does this benefit the system and the state. J. Miller stated that he is already witnessing negativity from his faculty. There should be a limited set of metrics that the BOR deems appropriate and important, and then the institutions can pick the additional metrics that apply to them.

Page 2 of 5
Discussion of Items to Forward to Strategic Planning Committee Goals and Metrics Review in the order in which they were discussed: Goal #5 Equity – Eliminate achievement disparities among different ethnic/racial, economic, and gender groups. It was agreed to remove the disaggregation by age -- though interesting it shouldn’t be a strategic focus. Both race/ethnicity and gender are critical measures. The low proportion of students identified as Asian (3.3%) and Native Hawaiian or Other Pacific Islanders (0.2%) make disaggregation by these categories impracticable. Decision: Monitor equity by disaggregating metrics by the following breakdowns:
Race/ethnicity:
- Black or African American (14.8%) - Hispanic (16.9%) - White (62.7%)
(add note for why other groups are not included) Gender:
- Men (41.6%) - Women (58.4%)
Socioeconomic Status: - Pell Recipients (36.1%, 2010-11, undergraduate only)
(percentages refer to fall 2012 headcount enrollment distribution across all 17 institutions to offer a general indication of proportions, although institutional proportions vary) Goal #1 A Successful First Year – Increase the number of students who successfully complete a first year of college. Discussion revolved around a number of questions:
- How does one define success? - What is the “first year” of college? - Should success be defined in reference to a student’s goals?
R. Lerer reiterated that there has to be a metric for the system. We have to determine if we are successful as a state, this must be presentable to the state. B. Hosch stated that for today let’s aim for 1 to 3 metrics per goal to build a framework. We can reaffirm what additional items can be added per institution. P. Bachiochi stated that the Faculty Advisory Committee wants to be involved in the metrics; however, they don’t want to develop them. The BOR should

Page 3 of 5
determine what they want to see for performance – the state has the right to determine what is right and what is important. Decision: Monitor first-year success through the following four metrics:
- Percent of full-time, first-time degree- or certificate-seeking students retained one year - Percent of part-time, first-time degree- or certificate-seeking students retained one year - Number of first-time degree- or certificate-seeking students completing college-level
English and math within one year - Percent of first-time degree- or certificate-seeking students completing college-level
English and math within one year Goal #3 Affordability and Sustainability – Maximize access to higher education by making attendance affordable and our institutions financially stable. There was general agreement on financial metrics, with the group selecting the top three rated items for institutional sustainability; these metrics derive from the Delta Cost Project. The group also endorsed construction of a metric for affordability about the percent of need not covered by grants. Decision: Monitor affordability and sustainability through the following metrics:
- State and local appropriations per completion and per FTE enrollment - Education and related expenses per completion and per FTE enrollment - Instructional expenditures as a percent of Education & Related spending - Percent of tuition & required fees not covered by grant aid
Goal #4 Innovation and Economic Growth – Create educational environments that cultivate innovation and prepare students for successful careers in a fast changing world. The group did not reach agreement about how to monitor progress on the goal for innovation and economic growth. Questions considered:
- How do we measure innovative and creative students – the entrepreneurial and “thinking” students?
- Competencies should be included, but how? - What is the number of high-level students involved in innovative/learning emporiums,
involved in research? - Because innovation is by definition new, how do we establish criteria for measuring it?
No Decision Was Reached:

Page 4 of 5
The group will re-visit this goal in January. Metrics receiving the most attention:
- Number of students enrolled in high impact educational practices (e.g. Clinical, Internship, Service Learning, International, research with faculty, and COOP programs)
- Faculty and staff engagement in professional development and research (different criteria based on mission)
- Number of partnerships with business and industry - Number of partnerships with K-12 - Total research expenditures per full-time faculty - Number/percentage of students involved in research with faculty
Goal #2 Student Success – Graduate more students with the knowledge and skills to achieve their life and career goals. There was no time to review metrics associated with this goal. The group will review this in January. Characteristics for Consideration in Generating Comparison Groups B. Hosch distributed a plan to identify comparison groups. This plan calls for identification of characteristics to be considered when selecting comparison institutions, weighting of the list by presidents and other groups, generation of initial lists from IPEDS data, review of lists, and approval of lists by the BOR strategic planning committee. The group proposed consideration of the following characteristics:
Student characteristics: o Race/Ethnicity o Socioeconomic status (percent of Pell recipients) o Age (traditional vs. non-traditional) o Residential/commuter mix o Undergraduate/graduate mix o Full-time/part-time mix
Institutional characteristics o Governance o Location o Cost o Size o Funding structure (state vs. local funding) o Mission (comprehensive/technical) o Carnegie Classification o Urban/Suburban/Rural o Level of degree offerings o Multi-campus vs. single structure o Full-time/part-time faculty mix

Page 5 of 5
We will rate these and finalize a list by the January meeting (TBD). Wrap-Up A process to present these should be developed. President Glickman offered that some facilitation of discussion should occur in breakout sessions in an open environment. Institutions should understand they are still independent, still have their own missions, strategic plans, and goals as well as their own corresponding metrics to monitor their success. Nevertheless, there must be some common ground where the Board has established priorities, and the process going forward should preserve progress to date, while maintaining some flexibility around metrics. Even going forward, metrics may remain “tweakable.” B. Hosch stated that we would be in touch to determine the date/time of the January meeting. The meeting adjourned at 11:15 a.m. Respectfully submitted,
Annie Davis
Annie Davis BOR – Office of Policy and Research

Page 1 of 3
BOR Strategic Plan Metrics Workgroup Meeting Notes – February 27, 2013 Present: Peter Bachiochi (ECSU), David England (Tunxis CC), Gena Glickman (Manchester
CC), Oz Griebel (Metro Hartford Alliance), Braden Hosch (BOR), Marianne Kennedy (SCSU), Ed Klonoski (Charter Oak State College), Brian Donohue Lynch (Quinebaug Valley CC), Barbara McCarthy (Asnuntuck CC), Jack Miller (CCSU), Jay Morris (Yale-New Haven Hospital), Wilfredo Nieves (Capital CC), Paul Reis (WCSU)
Phone In: Dorsey Kendrick (Gateway CC), Leonora Valvo (eTouches) Absent: Robert Baer (Norwalk CC), René Lerer (BOR), Tom Phillips (Capital Workforce
Partners) The meeting started at 10:00 a.m. B. Hosch welcomed everyone and provided an overview of the meeting agenda: 1) review and approval of draft meeting notes, 2) identify metrics for Goals 4 and 2, and 3) discuss the roll out of our recommendations to the Board. Review and Approve Meeting Notes of 12/12/12
The group agreed to remove the disaggregation by age.
The group discussed feedback about a preliminary decision not to include Asian as a disaggregation. Discussion indicated that the number remained too small to meet the criterion for reliability but the group recommended adding a note that these figures are tracked.
The group confirmed that metrics for a successful first-year should be limited to first-time students and so would not apply to Charter Oak.
A discussion ensued regarding college readiness and how it differs from success. Is there a difference between 1st time and transfer students as it applies to success/career path?
Because cost of attendance budgets are not calculated in a uniform way, the group modified an affordability indicator under Goal #3 to replace need covered by financial aid to Percent of tuition and fees not covered by grant aid for students receiving aid
On a motion made by Ed Klonoski, seconded by David England, the meeting notes were approved unanimously.

Page 2 of 3
Discussion of High-Level Metrics Goal #4 – Innovation and Economic Growth – Create educational environments that cultivate innovation and prepare students for successful careers in a fast changing world. Maximize access to higher education by making attendance affordable and our institutions financially sustainable. Group discussion identified disparate interpretations of innovation and the difficulties of measuring this. O. Griebel stated that, from a business perspective, innovation should be based on the job, job growth, projections. B. Lynch stated that, from a community college perspective, that innovation is hard to define – while there is value at the academic level it is difficult to fund “pioneering” programs. D. Kendrick concurred. She adamantly encourages entrepreneurship, innovation, and creativity. Collaboration and partnerships are key. It would be beneficial to have our institutions meet with the business sector to allow them to define their needs. We need to create and promote an environment that will allow us to work collectively with the business sector and other institutions. What is the skill set for a “fast changing world”? Ensuing discussion coalesced around the notion that student abilities and competencies were the foundation of cultivating innovation and that the competencies identified in the Transfer and Articulation Framework should serve as the basis for measuring this. These competencies are also closely aligned with student success. Recommended indicators:
Student performance/proficiency on all or selected TAP competencies
Completions in fields with high workforce demand: STEM, health, education (high workforce demand may be informed by the environment and periodically adjusted)
Total research expenditures per full-time faculty Also considered but had problems with reliability, validity, or both:
Number of students enrolled in Clinical, Internship, Service Learning, International and COOP programs
Number of partnerships with business and industry
Faculty and staff engagement in professional development and research (different criteria based on mission)
Degrees and Certificates awarded in areas of regional economic need
Goal #2 – Student Success – Graduate more students with the knowledge and skills to achieve their life and career goal. After much discussion regarding quantitative/qualitative measures, TAP competencies, the counting of transfer students, completion rates, measuring outstanding debt, the inclusion of non-credit activity, the inclusion of certified learning, the inclusion of grad students, internships, the following was agreed upon: Recommended indicators:
Undergraduate completions per 100 undergraduate degree-seeking FTE enrollment
Graduate student completions per 100 FTE graduate enrollment
Transfers from 2-year institutions to 4-year institutions per 100 FTE
Graduation rate of full-time, first-time degree- or certificate-seeking students (150% normal time for 4-year institutions, 200% of normal time for 2-year institutions)
Page 3 of 3
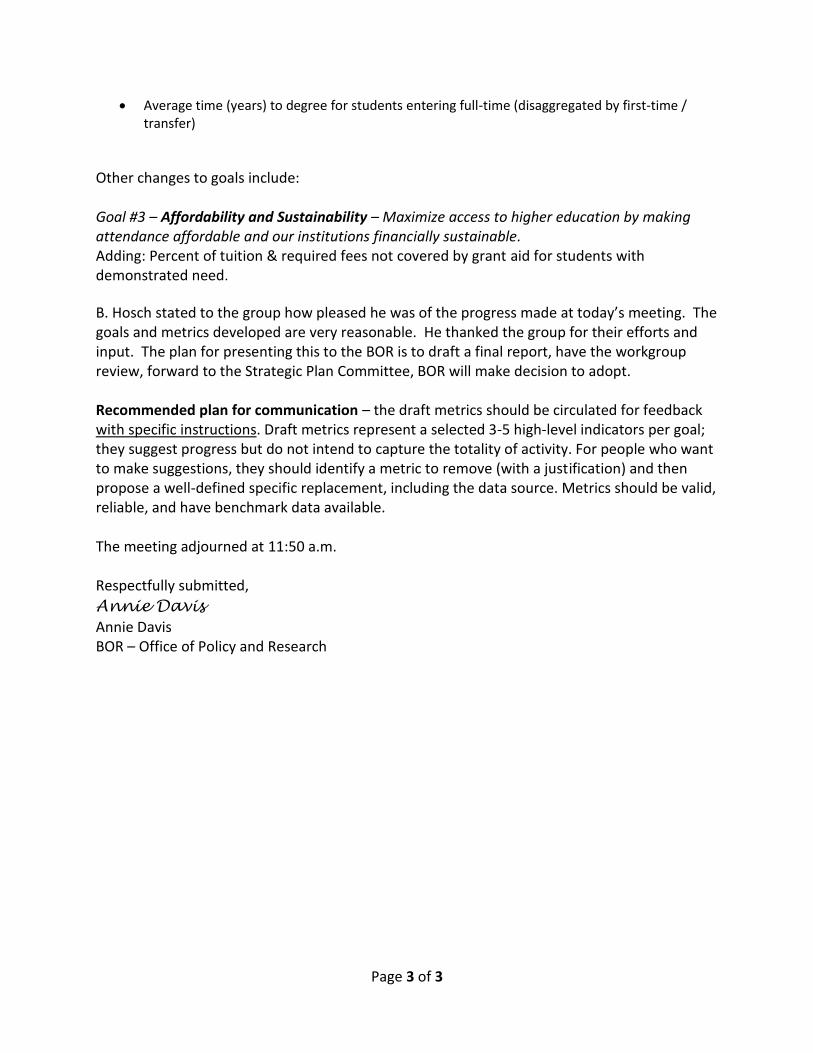
Average time (years) to degree for students entering full-time (disaggregated by first-time / transfer)
Other changes to goals include: Goal #3 – Affordability and Sustainability – Maximize access to higher education by making attendance affordable and our institutions financially sustainable. Adding: Percent of tuition & required fees not covered by grant aid for students with demonstrated need.
B. Hosch stated to the group how pleased he was of the progress made at today’s meeting. The goals and metrics developed are very reasonable. He thanked the group for their efforts and input. The plan for presenting this to the BOR is to draft a final report, have the workgroup review, forward to the Strategic Plan Committee, BOR will make decision to adopt. Recommended plan for communication – the draft metrics should be circulated for feedback with specific instructions. Draft metrics represent a selected 3-5 high-level indicators per goal; they suggest progress but do not intend to capture the totality of activity. For people who want to make suggestions, they should identify a metric to remove (with a justification) and then propose a well-defined specific replacement, including the data source. Metrics should be valid, reliable, and have benchmark data available. The meeting adjourned at 11:50 a.m. Respectfully submitted,
Annie Davis
Annie Davis BOR – Office of Policy and Research

Report on Strategic Plan Metrics Feedback May 26, 2012
Overview The Connecticut Board of Regents for Higher Education adopted elements of a strategic plan in fall 2012 that included a vision for Connecticut, a vision for ConnSCU, a mission statement, and five goals. During the winter and spring a group of campus leaders, community and business leaders and faculty considered and recommended high-level metrics for how progress on these goals could be monitored. A preliminary review of their report by the Board’s Strategic Planning Committee has indicated general acceptance of the proposed metrics as strong and valuable. The Committee also suggested inclusion of the following:
• employment outcomes, earnings, and future study of graduates (Goal 2 – Student Success) • fundraising per full-time equivalent enrollment (Goal 3 – Affordability and Sustainability) • an annual report on innovation on campus (Goal 4 – Innovation and Economic Growth)
Based on a recommendation from the metrics work group, the SPC directed the metrics be circulated about student, faculty and campus leaders for comment. The comment period was from May 6 to May 13, 2013. The following groups were invited to review these metrics and offer ideas about alternative metrics for measuring progress on the goals:
• Student Advisory Committee • Faculty Advisory Committee • Faculty and College Senate Leaders • Campus Presidents • Campus Academic Officers • Campus Student Affairs Officers • Campus Finance Officers • Central Office Executive Staff
A total of 159 people were invited to provide feedback, and 24 individuals entered their names and email addresses, although eleven of these respondents did not offer any proposed metrics or comments.
Strategic Plan Metrics Feedback p. 1

Summary of Metrics Feedback by Goal Goal 1 – A Successful First Year
a. All of the above [metrics for Goal 1] must be analyzed in relation to student preparation for college (SAT scores, High School GPAs)
b. Increase in percent of each full-time, first-time degree- or certificate-seeking students retained for one year
c. Number of credits completed toward graduation requirement
d. Number of part-time and/or non-matriculated students who complete college-level Math in two semesters.
e. Number of part-time and/or non-matriculated students who complete college-level English in two semesters
f. Percent of Full or part time first degree students that obtain a minimum of a cumulative 2.0 GPA at the end of their first year.
g. Percent of full-time, first-time degree- or certificate-seeking students who transfer to another ConnSCU or UCONN to continue their studies after successfully completing a first year of college
h. Percent of part-time, non-degree or certificate-seeking students retained for one year
i. Should be looking at successfully completing vs completing? There should be separately written metrics for Math and English since students may not take both Math and English in the same semester/year [CRITIQUE OF: Number of first-time degree- or certificate-seeking students completing college-level English and math within one year]
Goal 2 – Student Success
a. Average annual salary one year after graduation benchmarked to mark survey for new employees in the field
b. Four-year graduation rate of full-time, first-time degree- or certificate-seeking students
c. Graduation rate of students who transferred to CSU campuses after AA/AS degrees at a ConnSCU campus;
d. Percent increase in graduation rate of full-time, first-time degree- or certificate-seeking students (150% normal time for 4-year institutions, 200% of normal time for 2-year institutions)
e. Percent of graduates employed. (some fields do not require additional study-this data could be misleading)[MODIFICATION OF: Percent of graduates employed, pursuing further study 3 quarters after graduation]
f. Percent of graduates in an appropriate field for their discipline.(Wages vary by discipline and time in career--data may be misleading) [MODIFICATION OF: Average wages of employed graduates 3 quarters after graduation]
g. Percent of graduates pursuing further graduate studies.
h. Percent of students graduating community colleges receiving community college scholarship
Strategic Plan Metrics Feedback p. 2

funds to continue to universities.
i. Should this be broken out by degree level? [MODIFICATION OF: Average wages of employed graduates 3 quarters after graduation]
j. Student success should be measured against investment in student success supports (FYE, Faculty, Tutors)
k. Successful transfer to a new university should also be measured as part of student success. For example, we offer no engineering, but our students may be well prepared to transfer to good engineering programs.
l. What is the benchmark? Labor market conditions will influence measure. [CRITIQUE OF: Average wages of employed graduates 3 quarters after graduation]
Goal 3 – Affordability and Sustainability
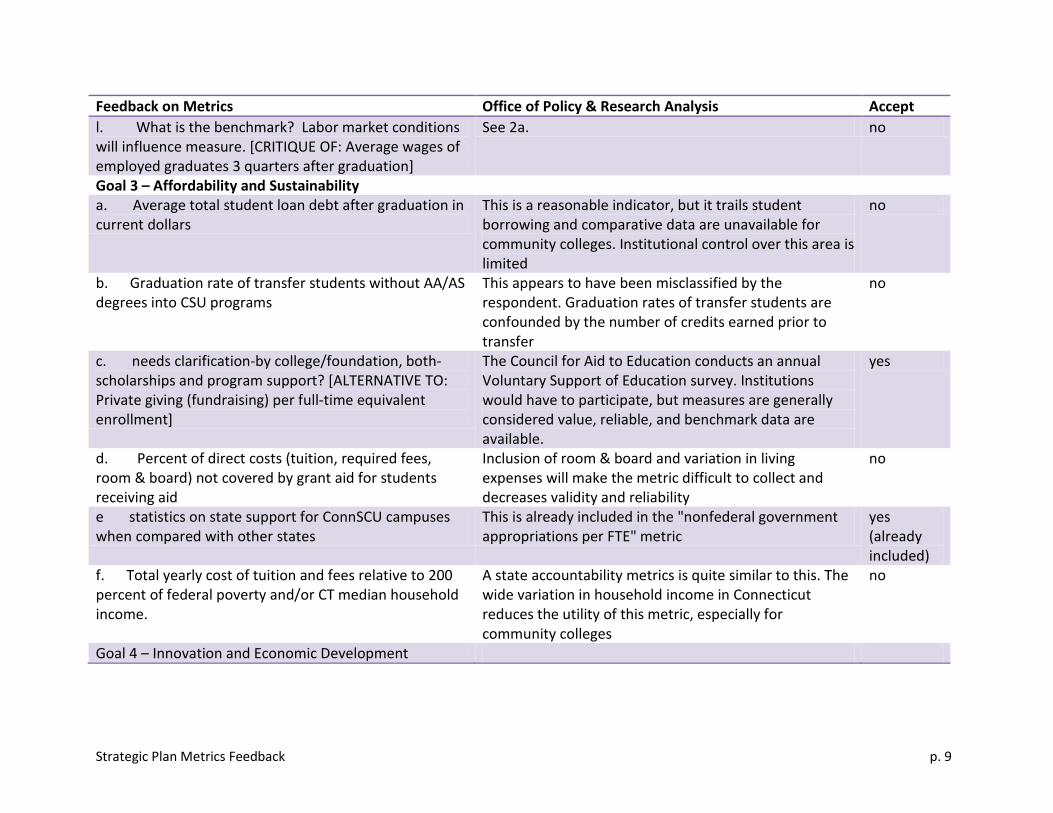
a. Average total student loan debt after graduation in current dollars
b. Graduation rate of transfer students without AA/AS degrees into CSU programs
c. needs clarification-by college/foundation, both-scholarships and program support? [ALTERNATIVE TO: Private giving (fundraising) per full-time equivalent enrollment]
d. Percent of direct costs (tuition, required fees, room & board) not covered by grant aid for students receiving aid
e. statistics on state support for ConnSCU campuses when compared with other states
f. Total yearly cost of tuition and fees relative to 200 percent of federal poverty and/or CT median household income.
Goal 4 – Innovation and Economic Development
a. Are valid and reliable measures developed? Measures depend on quality of students recruited [CRITIQUE OF: Student performance/proficiency on all or selected TAP competencies]
b. Is this a metric or a qualitative listing? Qualitative listings are likely most valuable here. [COMMENT ON: Annual report about innovation on campus]
c. Number of books and/or peer-reviewed publications.
d. Placement activity by college into such fields by percentage of students that graduate
e. Professional development expenditures per FT Faculty Member. ( CC institutions do not have research expenditures but pd expenditures play a large role in meeting this goal)
f. Statistics on undergraduate research initiatives
g. Student performance on TAP competencies is not a good metric as it does not really speak to the goal. The TAP sets a common gen ed core with some basic competencies that prepares a student to be a better learner and citizen, but I am not sure that it can be related to Innovation or Economic Growth, especially when I consider the other metrics listed.
h. The number of people that complete non-credit workforce development courses.
i. The number of students that transition from a non-credit program into a credit course of study.
Strategic Plan Metrics Feedback p. 3

j. This metric should also include transfers into high workforce demand fields and non-credit certificate completions in these high workforce demand fields. (CC students in these fields often transfer without completing their degree. The important role that non-credit training plays in preparing people for these fields should not be left out) [ALTERNATIVE TO: Completions in fields with high workforce demand: STEM, health, education (high workforce demand may be informed by the environment and periodically adjusted)]
k. Number of Student-faculty research grant projects.
l. Number of students participating in a research experience [ALTERNATIVE TO: Total research expenditures per full-time faculty]
Goal 5 - Equity
a. Asian
b. First generation college students
c. First in family students
d. First-generation students
e. Immigrants, non-traditional students - over 25 years old
f. Indian
g. Race/ethnicity: Asian
h. Race/ethnicity: Asian;
i. Race/ethnicity: Native American
j. Socioeconomic Status: First Generation Students
General Comments For # 4 Innovation and Economic Growth, I think the first metric, Student performance on TAP competencies is not a good metric as it does not really speak to the goal. The TAP sets a common gen ed core with some basic competencies that prepares a student to be a better learner and citizen, but I am not sure that it can be related to Innovation or Economic Growth, especially when I consider the other metrics listed.
The other metric, Research Expenditures per faculty seems to be too narrowly defined. In the current economic crisis, funds are limited at all levels, including federal grant funds. Also, several faculty (at least at CCSU) have research funds, but these support the faculty and not necessarily the student. In some cases, the research is done off campus and even out of the country. The goal seems to target ""students"". Perhaps something that better measures student research/creative activity would be better? Or looking at student-faculty research projects? Number of students participating in an
Strategic Plan Metrics Feedback p. 4

internship, research experience? Number of students presenting at a local/regional/national conference?
- State University Faculty Member
Contributions to Connecticut Economy and Quality of Life
- State University Administrator
Rigorous is included in the mission, but not in the strategic goals.
- State University Faculty Member
The metrics do not take into account transfer students. All of the ConnSCU institutions receive transfer students. This population of students is not counted in any of the metrics. At NWCC 13% of our incoming students are transfer students and will not be counted toward any of the retention, graduation or completion rates. Transfer students and their success should be addressed in the metrics.
- Community College Faculty Member
Strategic Plan Metrics Feedback p. 5

Analysis of Feedback The Office of Policy and Research analyzed feedback in the context of the principles for metrics selection used by the metrics work group. These principles were that metrics should be meaningful – provide a limited number of high-level information points to decision makers be indicative – show progress but not necessarily exhaustive; may not provide full diagnostics; be valid – measure what claimed to represent; be reliable – provide consistent results over time, have consistent definitions that allow for independent measurement or validation; have readily available comparative data; provide information for which the value is equal to or greater than the cost for collection; be sensitive to institutional actions – actions taken by institutions must be able to affect the metric. The Office of Policy and Research made recommendations for accepting or otherwise integrating this feedback into the measurement plan.
Feedback on Metrics Office of Policy & Research Analysis Accept Goal 1 – A Successful First Year a. All of the above [metrics for Goal 1] must be analyzed in relation to student preparation for college (SAT scores, High School GPAs)
Seeks to lay out research controls for a study of validity; selection of appropriate comparison groups should apply some measure of control for student characteristics
no
b. Increase in percent of each full-time, first-time degree- or certificate-seeking students retained for one year
embeds target inside of metric no
c. Number of credits completed toward graduation requirement
CCA reports pct of FT FT of 24 credits in first academic year
no
d. Number of part-time and/or non-matriculated students who complete college-level Math in two semesters.
metric proposed by work group is largely the same; students not continuously enrolled are at risk not to complete
no
e. Number of part-time and/or non-matriculated students who complete college-level English in two semesters
metric proposed by work group is largely the same; students not continuously enrolled are at risk not to complete
no
f. Percent of Full or part time first degree students that obtain a minimum of a cumulative 2.0 GPA at the end of their first year.
This is an interesting suggestion and bears consideration. The metrics group rejected grade-based measures on the grounds that grade inflation would result
maybe (add to further study list)
Strategic Plan Metrics Feedback p. 6

Feedback on Metrics Office of Policy & Research Analysis Accept g. Percent of full-time, first-time degree- or certificate-seeking students who transfer to another ConnSCU or UCONN to continue their studies after successfully completing a first year of college
Transfers are measured in Goal 2 no
h. Percent of part-time, non-degree or certificate-seeking students retained for one year
This is attempting to capture a population for whom retention would likely not be a goal for enrollment
no
i. Should be looking at successfully completing vs completing? There should be separately written metrics for Math and English since students may not take both Math and English in the same semester/year [CRITIQUE OF: Number of first-time degree- or certificate-seeking students completing college-level English and math within one year]
Successfully completing should be defined in the technical definitions. Placing emphasis on completion of college-level English and math in the first year will better positions students to succeed in subsequent college courses.
no
Goal 2 – Student Success a. Average annual salary one year after graduation benchmarked to mark survey for new employees in the field
This is one of several critiques of employment measures. Employment measures appear to track the economic more than measure institutional effectiveness and several other factors including partial quarter earning, limited sample size, and lack of occupation coding undermine the validity and reliability of these figures
Yes (remove metric)
b. Four-year graduation rate of full-time, first-time degree- or certificate-seeking students
This is not a weak measure but including both the 150%/200% graduation rates and the 100% (four-year graduation rate is likely too much detail at the Board level.
no
c. Graduation rate of students who transferred to CSU campuses after AA/AS degrees at a ConnSCU campus;
Graduation rates of trasnfer students are significantly affected by the number of credits earned prior to transfer; the statistical controls required have not been developed and would likely reduce practical validity
no
Strategic Plan Metrics Feedback p. 7

Feedback on Metrics Office of Policy & Research Analysis Accept d. Percent increase in graduation rate of full-time, first-time degree- or certificate-seeking students (150% normal time for 4-year institutions, 200% of normal time for 2-year institutions)
embeds the target inside of the metric no
e. Percent of graduates employed. (some fields do not require additional study-this data could be misleading)[MODIFICATION OF: Percent of graduates employed, pursuing further study 3 quarters after graduation]
See 2a. yes (remove metric)
f. Percent of graduates in an appropriate field for their discipline.(Wages vary by discipline and time in career--data may be misleading) [MODIFICATION OF: Average wages of employed graduates 3 quarters after graduation]
See 2a. yes (remove metric)
g. Percent of graduates pursuing further graduate studies.
This is a potentially interesting metric, but research with National Student Clearinghosue data is needed to confirm validity and reliability
no
h. Percent of students graduating community colleges receiving community college scholarship funds to continue to universities.
This suggestion has issues with validity, reliability, and comparative data
no
i. Should this be broken out by degree level? [MODIFICATION OF: Average wages of employed graduates 3 quarters after graduation]
See 2a. When developed the measures should be broken out by undergraduate/graduate
no
j. Student success should be measured against investment in student success supports (FYE, Faculty, Tutors)
This comment suggests a research agenda but does not offer a metric
no
k. Successful transfer to a new university should also be measured as part of student success. For example, we offer no engineering, but our students may be well prepared to transfer to good engineering programs.
Transfers are measured in Goal 2 yes (already included)
Strategic Plan Metrics Feedback p. 8
Feedback on Metrics Office of Policy & Research Analysis Accept l. What is the benchmark? Labor market conditions will influence measure. [CRITIQUE OF: Average wages of employed graduates 3 quarters after graduation]
See 2a. no
Goal 3 – Affordability and Sustainability a. Average total student loan debt after graduation in current dollars
This is a reasonable indicator, but it trails student borrowing and comparative data are unavailable for community colleges. Institutional control over this area is limited
no
b. Graduation rate of transfer students without AA/AS degrees into CSU programs
This appears to have been misclassified by the respondent. Graduation rates of transfer students are confounded by the number of credits earned prior to transfer
no
c. needs clarification-by college/foundation, both-scholarships and program support? [ALTERNATIVE TO: Private giving (fundraising) per full-time equivalent enrollment]
The Council for Aid to Education conducts an annual Voluntary Support of Education survey. Institutions would have to participate, but measures are generally considered value, reliable, and benchmark data are available.
yes
d. Percent of direct costs (tuition, required fees, room & board) not covered by grant aid for students receiving aid
Inclusion of room & board and variation in living expenses will make the metric difficult to collect and decreases validity and reliability
no
e statistics on state support for ConnSCU campuses when compared with other states
This is already included in the "nonfederal government appropriations per FTE" metric
yes (already included)
f. Total yearly cost of tuition and fees relative to 200 percent of federal poverty and/or CT median household income.
A state accountability metrics is quite similar to this. The wide variation in household income in Connecticut reduces the utility of this metric, especially for community colleges
no
Goal 4 – Innovation and Economic Development
Strategic Plan Metrics Feedback p. 9

Feedback on Metrics Office of Policy & Research Analysis Accept a. Are valid and reliable measures developed? Measures depend on quality of students recruited [CRITIQUE OF: Student performance/proficiency on all or selected TAP competencies]
Comment on this proposal is appropriate. Consideration of this approach should be delayed until data are available and have been validated
no
b. Is this a metric or a qualitative listing? Qualitative listings are likely most valuable here. [COMMENT ON: Annual report about innovation on campus]
This comment accurately reflects the nature of this item. The report will not be a metric but rather a qualitative report. The Board Strategic Planning Committee in April 2013 requested inclusion of this means to monitor progress
yes (remove metric)
c. Number of books and/or peer-reviewed publications.
Systems to collect faculty scholarly activity take significant resources to build and maintain as well as faculty buy in. Implementation across all 17 institutions or even the four CSUs is unrealistic.
no
d. Placement activity by college into such fields by percentage of students that graduate
These data are not comprehensively available no
e. Professional development expenditures per FT Faculty Member. ( CC institutions do not have research expenditures but pd expenditures play a large role in meeting this goal)
Professional development lacks sufficient definition, spending doesn't guarantee development occurs, and no benchmark data are available
no
f. Statistics on undergraduate research initiatives The National Survey of Student Engagement includes an item "seniors who worked on a research project with a faculty member outside of course or program requirements"
yes (add metric)
g. Student performance on TAP competencies is not a good metric as it does not really speak to the goal. The TAP sets a common gen ed core with some basic competencies that prepares a student to be a better learner and citizen, but I am not sure that it can be related to Innovation or Economic Growth, especially when I consider the other metrics listed.
See 4a. yes (remove metric)
Strategic Plan Metrics Feedback p. 10
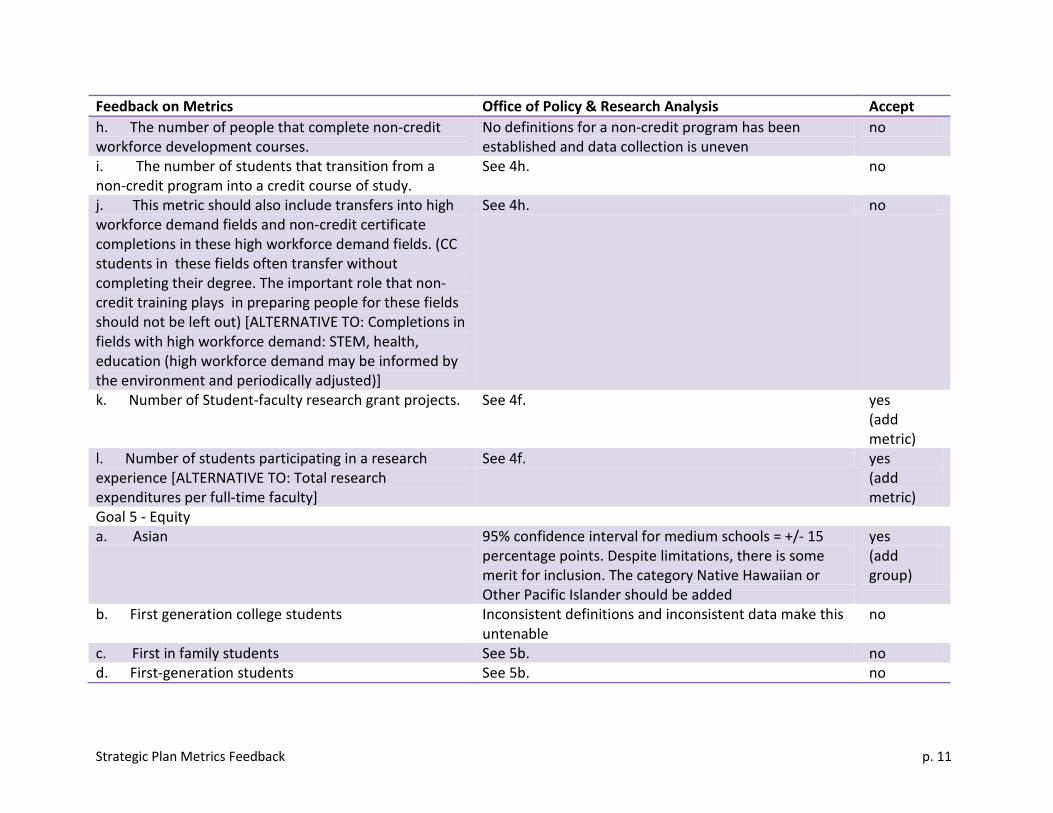
Feedback on Metrics Office of Policy & Research Analysis Accept h. The number of people that complete non-credit workforce development courses.
No definitions for a non-credit program has been established and data collection is uneven
no
i. The number of students that transition from a non-credit program into a credit course of study.
See 4h. no
j. This metric should also include transfers into high workforce demand fields and non-credit certificate completions in these high workforce demand fields. (CC students in these fields often transfer without completing their degree. The important role that non-credit training plays in preparing people for these fields should not be left out) [ALTERNATIVE TO: Completions in fields with high workforce demand: STEM, health, education (high workforce demand may be informed by the environment and periodically adjusted)]
See 4h. no
k. Number of Student-faculty research grant projects. See 4f. yes (add metric)
l. Number of students participating in a research experience [ALTERNATIVE TO: Total research expenditures per full-time faculty]
See 4f. yes (add metric)
Goal 5 - Equity a. Asian 95% confidence interval for medium schools = +/- 15
percentage points. Despite limitations, there is some merit for inclusion. The category Native Hawaiian or Other Pacific Islander should be added
yes (add group)
b. First generation college students Inconsistent definitions and inconsistent data make this untenable
no
c. First in family students See 5b. no d. First-generation students See 5b. no
Strategic Plan Metrics Feedback p. 11

Feedback on Metrics Office of Policy & Research Analysis Accept e. Immigrants, non-traditional students - over 25 years old
Immigrants are not well-defined and not presently tracked consistently
no
f. Indian American indian population is less than 1%; resulting statistics will not provide useful information
no
g. Race/ethnicity: Asian See 5a. yes (add group)
h. Race/ethnicity: Asian; See 5a. yes (add group)
i. Race/ethnicity: Native American See 5f. no j. Socioeconomic Status: First Generation Students See 5b. no
Strategic Plan Metrics Feedback p. 12

Responses by Individual
Respondent A: State University Faculty Member Goal 1 – A Successful First Year
Additional metric 1 Percent of full-time, first-time degree- or certificate-seeking students who transfer to another ConnSCU or UCONN to continue their studies after successfully completing a first year of college
Goal 2 – Student Success
Additional metric 1 Graduation rate of students who transferred to CSU campuses after AA/AS degrees at a ConnSCU campus;
Additional metric 2 Graduation rate of transfer students without AA/AS degrees into CSU programs
Goal 3 – Affordability and Sustainability
Additional metric 1 statistics on state support for ConnSCU campuses when compared with other states
Goal 4 – Innovation and Economic Development
Additional metric 1 Statistics on undergraduate research initiatives
Goal 5 - Equity
Additional group/disaggregation 1 Immigrants, non-traditional students - over 25 years old
Additional group/disaggregation 2 First in family students
Respondent B: State University Administrator Goal 3 – Affordability and Sustainability
Additional metric 1 Percent of direct costs (tuition, required fees, room & board) not covered by grant aid for students receiving aid
Strategic Plan Metrics Feedback p. 13

Goal 5 - Equity
Additional group/disaggregation 1 Race/ethnicity: Asian;
Additional group/disaggregation 2 Race/ethnicity: Native American
Respondent C: State University Faculty Member Goal 1 – A Successful First Year
Additional metric 1 Percent of Full or part time first degree students that obtain a minimum of a cumulative 2.0 GPA at the end of their first year.
Goal 2 – Student Success
Metric from Report / SPC Alternative Metric Percent of graduates employed, pursuing further study 3 quarters after graduation
Percent of graduates employed. (some fields do not require additional study-this data could be misleading)
Average wages of employed graduates 3 quarters after graduation
Percent of graduates in an appropriate field for their discipline.(Wages vary by discipline and time in career--data may be misleading)
Goal 3 – Affordability and Sustainability
Metric from Report / SPC Alternative Metric Total research expenditures per full-time faculty Number of students participating in a research
experience
Additional metric 1 Number of Student-faculty research grant projects.
Comments For # 4 Innovation and Economic Growth
I think the first metric, Student performance on TAP competencies is not a good metric as it does not really speak to the goal. The TAP sets a common gen ed core with some basic competencies that prepares a student to be a better learner and citizen, but I am not sure that it can be related to Innovation or Economic Growth, especially when I consider the other metrics listed.
Strategic Plan Metrics Feedback p. 14

The other metric, Research Expenditures per faculty seems to be too narrowly defined. In the current economic crisis, funds are limited at all levels, including federal grant funds. Also, several faculty (at least at CCSU) have research funds, but these support the faculty and not necessarily the student. In some cases, the research is done off campus and even out of the country. The goal seems to target ""students"". Perhaps something that better measures student research/creative activity would be better? Or looking at student-faculty research projects? Number of students participating in an internship, research experience? Number of students presenting at a local/regional/national conference?
Respondent D: State University Administrator Western Connecticut State University
Goal 1 – A Successful First Year
Additional metric 1 All of the above must be analyzed in relation to student preparation for college (SAT scores, High School GPAs)
Goal 2 – Student Success
Additional metric 1 Student success should be measured against investment in student success supports (FYE, Faculty, Tutors)
Additional metric 2 Successful transfer to a new university should also be measured as part of student success. For example, we offer no engineering, but our students may be well prepared to transfer to good engineering programs.
Goal 5 - Equity
Additional group/disaggregation 1 First generation college students
Additional group/disaggregation 2 Asian: Indian
Comments Contributions to Connecticut Economy and Quality of Life
Strategic Plan Metrics Feedback p. 15

Respondent E: Community College Faculty Member Goal 1 – A Successful First Year
Additional metric 1 Percent of part-time, non-degree or certificate-seeking students retained for one year
Goal 2 – Student Success
Additional metric 1 Percent of students graduating community colleges receiving community college scholarship funds to continue to universities.
Respondent F: State University Administrator Goal 1 – A Successful First Year
Additional metric 1 Increase in percent of each full-time, first-time degree- or certificate-seeking students retained for one year
Goal 2 – Student Success
Additional metric 1 Four-year graduation rate of full-time, first-time degree- or certificate-seeking students
Additional metric 2 Percent increase in graduation rate of full-time, first-time degree- or certificate-seeking students (150% normal time for 4-year institutions, 200% of normal time for 2-year institutions)
Respondent G: Employee Union Leader Goal 1 – A Successful First Year
Additional metric 1 Number of credits completed toward graduation requirement
Goal 2 – Student Success
Additional metric 1 Average annual salary one year after graduation benchmarked to mark survey for new employees in the field
Strategic Plan Metrics Feedback p. 16
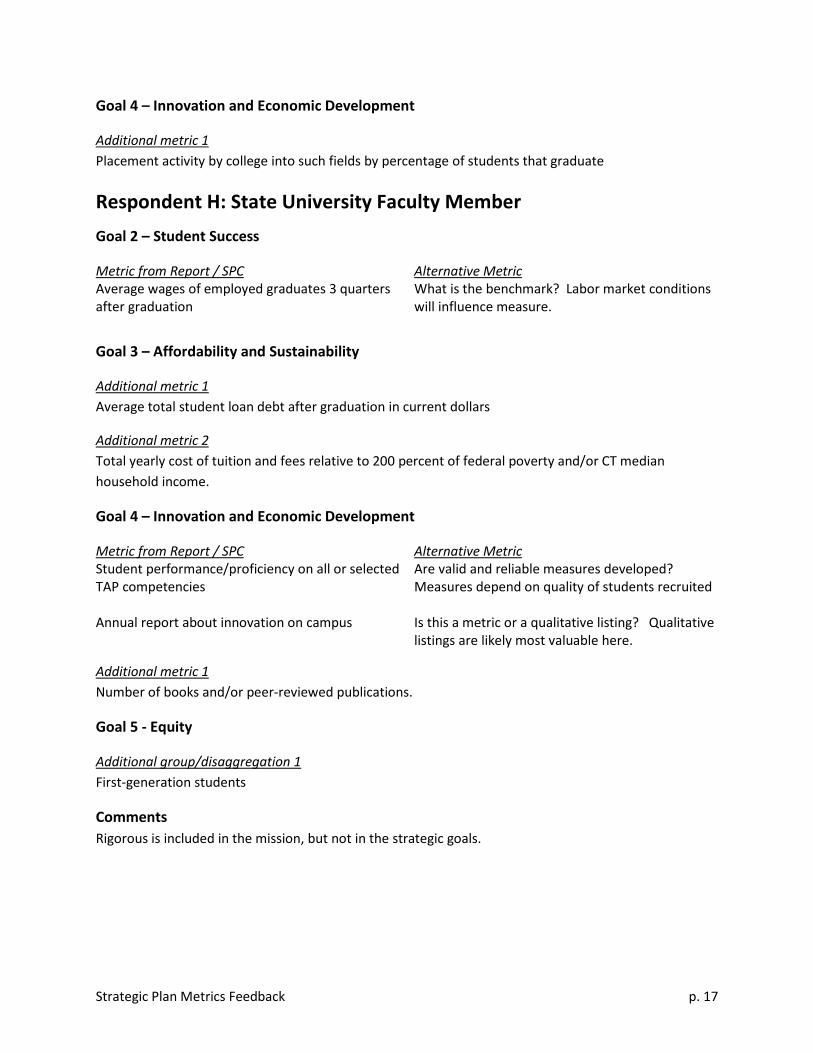
Goal 4 – Innovation and Economic Development
Additional metric 1 Placement activity by college into such fields by percentage of students that graduate
Respondent H: State University Faculty Member Goal 2 – Student Success
Metric from Report / SPC Alternative Metric Average wages of employed graduates 3 quarters after graduation
What is the benchmark? Labor market conditions will influence measure.
Goal 3 – Affordability and Sustainability
Additional metric 1 Average total student loan debt after graduation in current dollars
Additional metric 2 Total yearly cost of tuition and fees relative to 200 percent of federal poverty and/or CT median household income.
Goal 4 – Innovation and Economic Development
Metric from Report / SPC Alternative Metric Student performance/proficiency on all or selected TAP competencies
Are valid and reliable measures developed? Measures depend on quality of students recruited
Annual report about innovation on campus Is this a metric or a qualitative listing? Qualitative listings are likely most valuable here.
Additional metric 1 Number of books and/or peer-reviewed publications.
Goal 5 - Equity
Additional group/disaggregation 1 First-generation students
Comments Rigorous is included in the mission, but not in the strategic goals.
Strategic Plan Metrics Feedback p. 17

Respondent I: State University Faculty Member
Goal 2 – Student Success
Additional metric 1 Percent of graduates pursuing further graduate studies.
Goal 5 - Equity
Additional group/disaggregation 1 Race/ethnicity: Asian
Respondent J: Community College Administrator Goal 3 – Affordability and Sustainability
Metric from Report / SPC Alternative Metric Private giving (fundraising) per full-time equivalent enrollment
needs clarification-by college/foundation, both-scholarships and program support?
Respondent K: State University Administrator Goal 2 – Student Success
Metric from Report / SPC Alternative Metric Average wages of employed graduates 3 quarters after graduation
Should this be broken out by degree level?
Respondent L: Community College Faculty Member Northwestern Connecticut Community College
Goal 1 – A Successful First Year
Metric from Report / SPC Alternative Metric Number of first-time degree- or certificate-seeking students completing college-level English and math within one year
Should be looking at successfully completing vs completing? There should be separately written metrics for Math and English since students may not take both Math and English in the same semester/year
Percent of first-time degree- or certificate-seeking students completing college-level English and math within one year
See comments above and this one applies to both as well: instead of one year should the metrics read two semesters since students may not take the courses consecutively and may begin college in either the fall or spring semester.
Strategic Plan Metrics Feedback p. 18

Additional metric 1 Number of part-time and/or non-matriculated students who complete college-level English in two semesters
Additional metric 2 Number of part-time and/or non-matriculated students who complete college-level Math in two semesters.
Goal 4 – Innovation and Economic Development
Metric from Report / SPC Alternative Metric Completions in fields with high workforce demand: STEM, health, education (high workforce demand may be informed by the environment and periodically adjusted)
This metric should also include transfers into high workforce demand fields and non-credit certificate completions in these high workforce demand fields. (CC students in these fields often transfer without completing their degree. The important role that non-credit training plays in preparing people for these fields should not be left out)
Total research expenditures per full-time faculty and professional development expenditures. ( CC institutions do not have research expenditures but pd expenditures play a large role in meeting this goal)
Additional metric 1 The number of students that transition from a non-credit program into a credit course of study. ;
Additional metric 2 The number of people that complete non-credit workforce development courses.
Comments The metrics do not take into account transfer students. All of the ConnSCU institutions receive transfer students. This population of students is not counted in any of the metrics. At NWCC 13% of our incoming students are transfer students and will not be counted toward any of the retention, graduation or completion rates. Transfer students and their success should be addressed in the metrics.
Respondent M: Community College Administrator Middlesex Community College
Goal 5 - Equity
Additional group/disaggregation 1 Race/ethnicity: Asian;
Additional group/disaggregation 2 Socioeconomic Status: First Generation Students
Strategic Plan Metrics Feedback p. 19