strategic performance report mid-2020
TRANSCRIPT
44th Board Meeting
GF/B44/15A
11-12 November 2020, Virtual
Board Information
Purpose of the paper: to provide an update on mid-2020 Key Performance Indicators (KPIs) results against targets, and to outline proposed adjustments to KPI targets and indicators.
Strategic Performance Report mid-2020
44th Board Meeting, 11-12 November 2020, Virtual GF/B44/15A
2/3
Context
1. Positive trends are being maintained on both financial and programmatic performance. It shouldhowever be borne in mind that the results reported here are based, predominantly, on data which pre-dates the COVID-19 pandemic. A summary of KPI results and progress is presented in the main bodyof the report, a detailed description for each KPI result is contained in annex 2.
2. COVID-19’s impact on KPI progress will be observed in the end-2020 Strategic Report, to be presentedto the Board in Spring 2021. Meanwhile, the Global Fund and technical partners are implementingmonitoring tools to understand the impact of COVID-19 on health systems and the three diseases toguide decision-making during the current response; these tools, summary findings and potentialimpact of COVID-19 on KPI progress are described in annex 1.
3. The original Strategy targets will likely be maintained until the end of the current Strategy period.Following a planned recalibration exercise in 2020 (for KPIs with modeled targets), the results showedno significant difference between new estimates and the original Strategy targets (consideringuncertainty ranges). Based on this exercise, KPIs’ targets that were established up to end-2022 havenot been adjusted. KPI targets have also not been adjusted in response to COVID-19. Whilst the fullimpact of COVID-19 remains uncertain it is important to maintain the ambition of the Strategy targetsand to track progress towards these targets consistently over the Strategy period.
4. Several adjustments to the KPI Framework are however being proposed for Board decision. Most arescheduled changes, as KPIs shift from interim to final indicators, or where there is a need to redefinetargets which had only been set to 2020. Other changes are proposed to strengthen existing KPIs.Details of all proposed adjustments to the KPI Framework are contained in an accompanyingdocument to this report called “Adjustments to the KPI Framework” GF/B44/15B.
Mid-2020 KPI Results
Finance
i. Results related to the Global Fund’s resource mobilization for the 6th Replenishment remainon track. The majority (98%) of the 5th Replenishment is now committted or forecasted to becommitted (KPI 7a). Grant absorption over the 2017-2019 allocation period is at a high of 88%(KPI 7b).
HIV
ii. HIV incidence among Adolescent Girls and Young Women (AGYW) continues to decline. Whilethe Strategy target range appears to be in reach, progress, particularly in light of COVID-19,remains fragile. The new AGYW Strategic Initiative should contribute towards greater impactof targeted investments (KPI 8).
iii. Targets for the number of patients on ART and for VMMC are achievable, provided nationaltargets continue to be met. HIV indicators at risk of not meeting targets include “HIV/TB co-infected patients put on ART”, “PMTCT coverage” and “percentage of people living with HIVstarting IPT” (KPI 2).
iv. Despite considerable progress, countries’ capacity to report on HIV service coverage for KeyPopulations did not meet the interim target (KPI 5). Strong data is a prerequisite to reliablereporting, and it is critical the gains and momentum made to date are not lost; it is thereforeproposed to maintain this indicator as a sub-indicator of KPI 5 until the end of the currentStrategy period.
44th Board Meeting, 11-12 November 2020, Virtual GF/B44/15A
3/3
TB
v. There has been continued success in finding missing TB cases, with strong grant performanceon TB case detection and treatment coverage, seven new countries are being added to theStrategic Initiative (KPI 2).
vi. Despite some progress, TB treatment (drug-sensitive and MDR-TB) indicators remain off track.The continued lack of progress for ‘percentage of people living with HIV starting preventativetherapy for TB’ triggered the IPT strategic initiative, which aims to improve performance in the2020-2022 allocation period (KPI 2).
Malaria
vii. LLIN distribution has considerably improved over the past reporting year, and the Strategytarget is now in reach (KPI 2).
viii. There has been continued good performance on malaria testing, however results will need toimprove significantly to achieve the ambitious IPTp3 coverage target (KPI 2).
Cross-cutting
ix. For the 2017-2019 allocation period, the Secretariat achieved strong alignment between thelevel of investment made in countries and countries’ needs. New targets are proposed for 2021-2022 (KPI 3).
x. Results are reported for the first time for the 2020-2022 allocation period on alignmentbetween funding requests and National Strategic Plans (NSPs). All funding requests assessedat time of KPI reporting were rated by the TRP as aligned with NSPs (KPI 6f).
xi. The investment efficiency of national disease programs remained strong during the 2017-2019allocation period. Design of all HIV programs, and most TB and Malaria programs,demonstrated efficiency improvements compared to the previous period (KPI 4).
Input sought
The Board is requested to approve the following:
a. Restating KPI 3 (2021 & 2022) targets and a revised definition of Global Fund investmentsb. New sub-indicator (KPI 5a) on ‘Investment in HIV prevention for Key Populations’, maintaining
the previous KPI 5 interim indicator and target as KPI 5bc. Target for newly defined KPI 6a on procurement using national channelsd. Revised target setting methodology for KPI 6b on reducing non-availability of tracer itemse. Revised formula for KPI 7a on allocation utilizationf. Refocus of KPI 9b, expansion of cohort and targets for 2020-2022 allocation period for human
rights investmentsg. Restating the KPI 12b (2021) target for PPM savings
A detailed description of the background and rationale for KPI adjustments is contained in an accompanying document to this report called “Adjustments to the KPI Framework” GF/B44/15B.
Strategic Performance Reporting mid-2020
44TH BOARD MEETING
GF/B44/15A
11-12 NOVEMBER 2020,Virtual
2
Content
Main Report:
KPI results included in this report p. 3
Current performance and Global Fund level of control p. 5
Performance Paths – KPI progress across reporting periods p. 6
Overview by KPI results by reporting area p. 7
KPIs at risk of not achieving targets p. 11
Summary of adjustments to the KPI framework p. 13
Schedule for planned adjustments to the KPI framework p. 14
Annex 1: COVID-19 and Strategic Performance p. 15
Annex 2: Detailed KPI results p. 26
• Funding p. 32
• Program Design p. 35
• Implementation p. 39
• Results p. 44
Glossary of acronyms used in this report p. 74

3
Preamble – KPI results included in this report
KPI Description Date of measurement
2 Service delivery (16 sub-
indicators)
End 2019 (as per KPI
definition)
3 Alignment of investment &
need
August 2020
4 Investment efficiency August 2020
5
(interim)
Capacity to report on Key
Population Service coverage
July 2020
6f RSSH: NSP Alignment July 2020
KPI Description Date of measurement
7a Allocation utilization August 2020
7b Grant absorption (over 3
calendar years)
End 2019 (as per KPI
definition)
8 Gender & age equality:
HIV incidence for AGYW
End 2019 (from partners’ data)
10a Resource mobilization:
pledges
August 2020
10b Resource mobilization:
contributions
August 2020
The following table outlines the KPIs which are scheduled for reporting in this cycle and the date of measurement for the data used to calculate the
KPI result. All KPIs were calculated, verified and validated by the relevant teams using the defined methodology and are therefore the authoritative
source of KPI results at mid-2020.
Notes:
• The Secretariat confirms that no error has been detected in KPI results reported at the Spring 2020 Board meeting and that these results remain
unchanged.
• RSSH KPIs (except 6e and 6f) are reported in the Spring reporting cycle and will be available in the next Strategic Performance Report
• The Secretariat proposes a number of adjustments to the KPI Framework that are described in detail in an accompanying document called
“Adjustments to the KPI Framework” GF/B44/15B
4
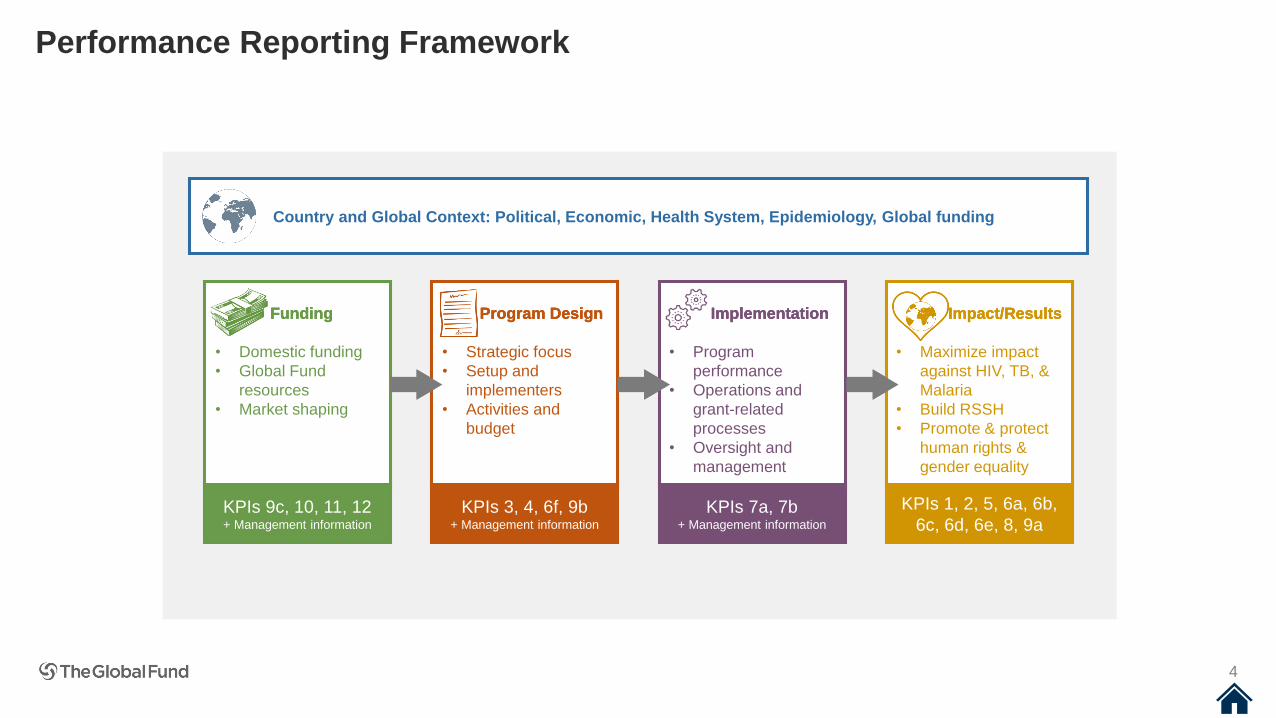
Country and Global Context: Political, Economic, Health System, Epidemiology, Global funding
Funding Impact/ResultsProgram Design Implementation
• Domestic funding
• Global Fund
resources
• Market shaping
• Program setup and
management
• Choice of activities
• Budget for activities
• Programmatic
performance
• Financial
performance
• Performance of
grant processes
• Maximize impact
against HIV, TB, &
Malaria
• Build RSSH
• Promote & protect
human rights &
gender equality
KPIs 9c, 10, 11, 12+ Management information
KPIs 1, 2, 5, 6a, 6b,
6c, 6d, 6e, 8, 9aKPIs 3, 4, 6f, 9b
+ Management information
KPIs 7a, 7b+ Management information
Country and Global Context: Political, Economic, Health System, Epidemiology, Global funding
Funding Impact/ResultsProgram Design Implementation
• Domestic funding
• Global Fund
resources
• Market shaping
• Strategic focus
• Setup and
implementers
• Activities and
budget
• Program
performance
• Operations and
grant-related
processes
• Oversight and
management
• Maximize impact
against HIV, TB, &
Malaria
• Build RSSH
• Promote & protect
human rights &
gender equality
KPIs 9c, 10, 11, 12+ Management information
KPIs 1, 2, 5, 6a, 6b,
6c, 6d, 6e, 8, 9aKPIs 3, 4, 6f, 9b
+ Management information
KPIs 7a, 7b+ Management information
Funding Impact/ResultsProgram Design Implementation Funding Impact/ResultsProgram Design Implementation
Performance Reporting Framework
Management information
Impact / ResultsImplementationProgram DesignFunding
Global Fund Performance Reporting Framework
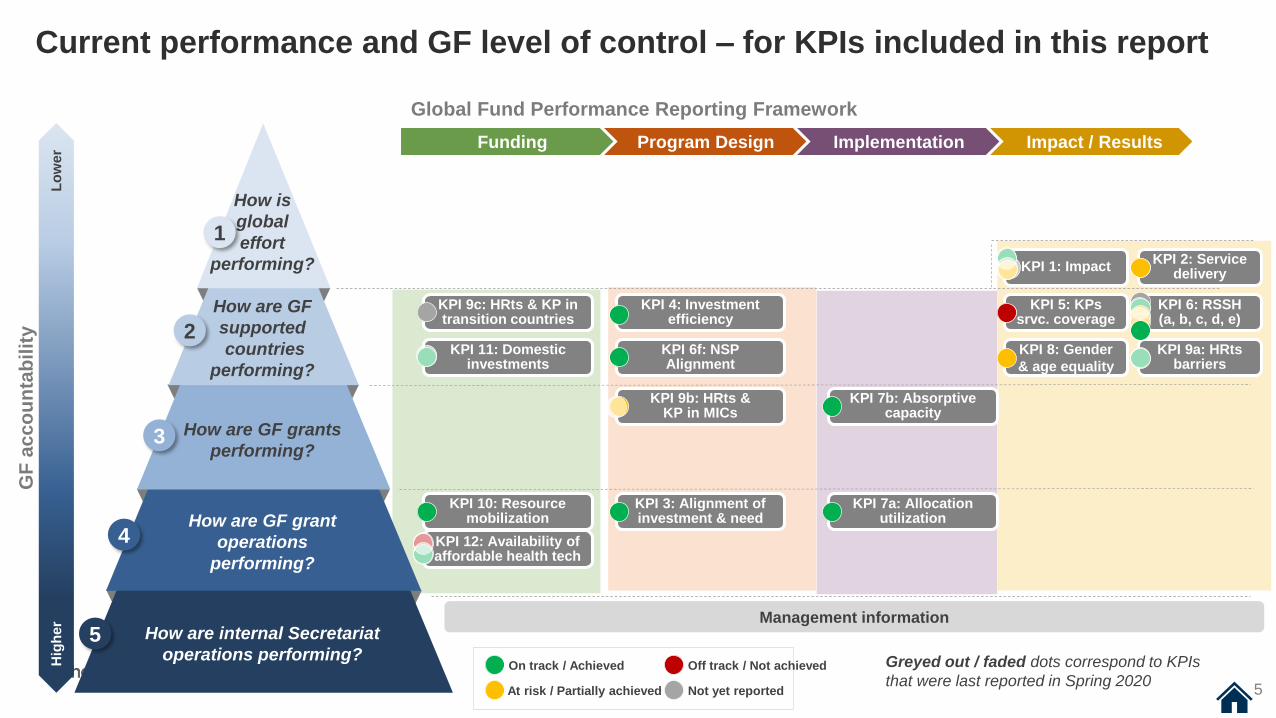
Current performance and GF level of control – for KPIs included in this reportG
F a
cco
un
tab
ilit
y
Lo
wer
Hig
her
KPI 5: KPs srvc. coverage
KPI 1: ImpactKPI 2: Service
delivery
KPI 6: RSSH (a, b, c, d, e)
KPI 8: Gender
& age equality
KPI 9a: HRtsbarriers
How are internal Secretariat
operations performing?
How are GF grant
operations
performing?
How are GF grants
performing?
How are GF
supported
countries
performing?
How is
global
effort
performing?
1
2
3
4
5
KPI 10: Resource mobilization
KPI 12: Availability of affordable health tech
KPI 6f: NSP Alignment
KPI 4: Investment efficiency
KPI 9c: HRts & KP in transition countries
KPI 11: Domestic investments
KPI 3: Alignment of investment & need
KPI 7a: Allocation utilization
KPI 7b: Absorptive capacity
KPI 9b: HRts & KP in MICs
On track / Achieved
At risk / Partially achieved
Off track / Not achieved
Not yet reported
Greyed out / faded dots correspond to KPIs
that were last reported in Spring 20205
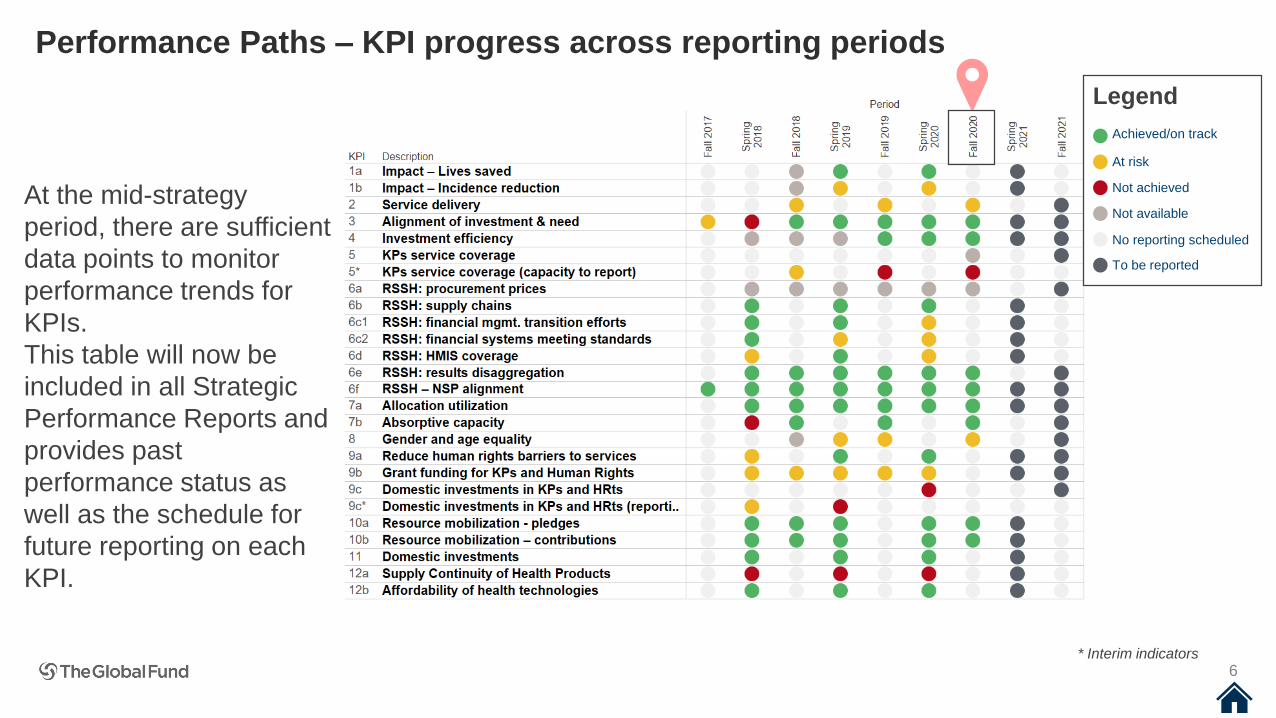
Performance Paths – KPI progress across reporting periods
* Interim indicators
At the mid-strategy
period, there are sufficient
data points to monitor
performance trends for
KPIs.
This table will now be
included in all Strategic
Performance Reports and
provides past
performance status as
well as the schedule for
future reporting on each
KPI.
6
Legend
Achieved/on track
At risk
Not achieved
No reporting scheduled
To be reported
Not available
Funding overview
7
Domestic Funding
• The first results of KPI 11 on actual domestic investments during the 2017-2019 allocation period are being collected as part of the application process for
the new allocation cycle. They will be reported in the Spring 2021 meeting.
• A baseline analysis has been performed for the new definition of KPI 9c (Domestic Funding for Human Rights and Key Populations). Based on 2017-2019
data from UNAIDS’s Global AIDS Monitoring and for the 20 countries in the cohort, the average country investment out of the total domestic HIV funding is
5.4% for prevention programs targeting key populations and 1% for social enablers including programs to reduce human rights related barriers. Following
further consultation with partners the new target will be proposed to the board for decision in Spring 2021.
Global Fund Resources
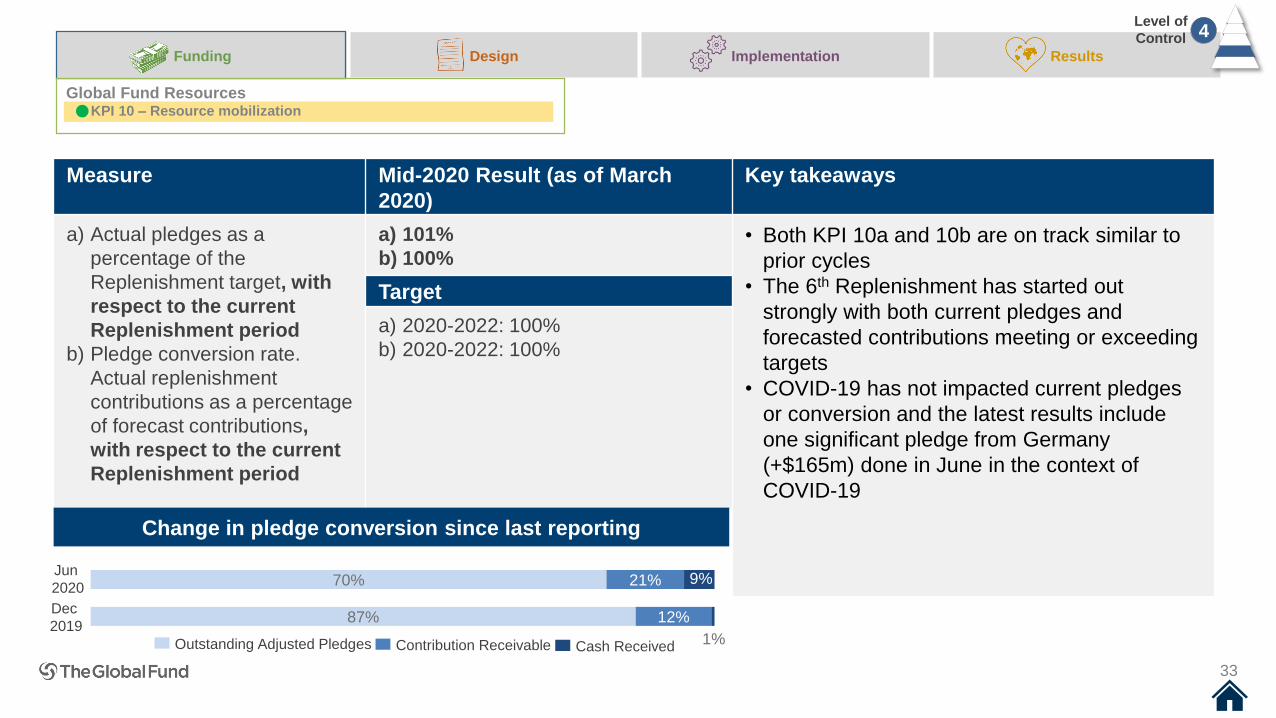
• The corresponding KPIs are reported for the first time on Sixth Replenishment data. Both sub-indicators are on track (with KPI 10a exceeding target).
Despite the global COVID-19 crisis, actual pledges are at 101% of the Replenishment target (KPI 10a) and 100% of actual contributions compared to
forecast (KPI 10b), (see Annex 2, page 33)
• Additional resources to mitigate COVID-19 are being sought with some success as new pledges are being made. This also includes extending emergency
C19RM funding until March 2021.
Market Shaping
• The Secretariat’s internal technical expert group has revised the cohort of products to be included in KPI 12a, measuring Supply Continuity of Health
Products. The number of products is significantly increased to 24 with the addition of condoms, viral load/early infant detection and rapid diagnostic tests (for
both HIV and malaria). This KPI will be reported next in Spring 2021 but appears to be back on track now based on the existing cohort but also when using
the new one. (see Annex 2, page 34)
• A 2021 target of USD 154m is proposed for PPM savings (KPI 12b) (see GF/B44/15B Adjustments to KPI Framework, page 22). Given the exceptional
circumstances faced (COVID-19 impact, lack of visibility on health products needs for the new grants to be signed), the Secretariat proposes to reassess the
validity of this 2021 target at the Spring 2021 meeting, when the 2020 results will be reported. It is noted that PPM price increases are potentially expected in
2021 for bed nets and malaria RDTs due to the COVID-19 situation and the associated increase in costs of raw material and labor.
• Despite current COVID-19 related challenges, the On-Time-In-Full indicator stays strong for PPM with 74% measured at the end of June 2020.
KPI 10a
KPI 10b
7
Program Design overview
8
Strategic Focus
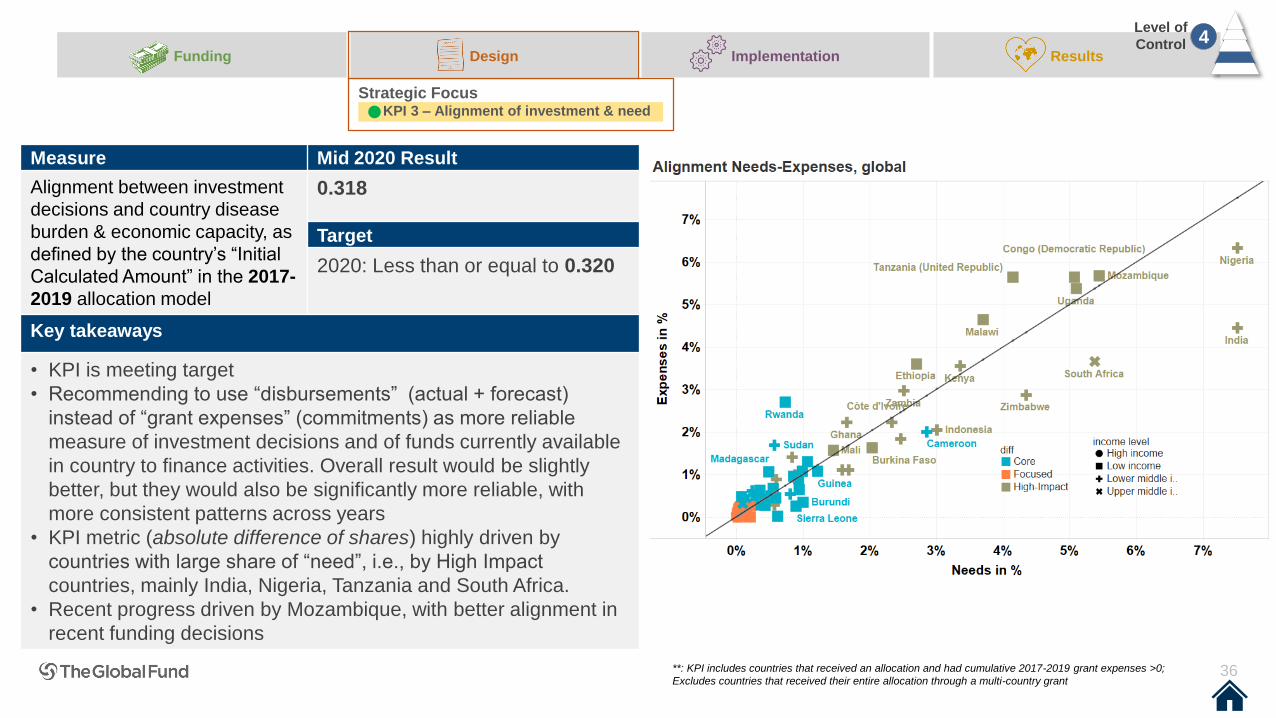
• Alignment between needs and funding (KPI 3) stays strong for the 2017-2019 allocation period, with a score of 0.318 compared to a target of 0.320 (note: low results are
good). New 2021-2022 targets are proposed for approval, following the same logic used for the definition of 2017-2020 targets. (see Annex 2, page 36)
• The Global Fund is also actively responding to mitigate the impact of COVID-19 through the COVID-19 Response Mechanism (C19RM) additional funding and with grant
flexibilities.
Setup and implementers
• Despite COVID-19 disruptions, the 2020-2022 funding cycle is well underway with 144 new country applications registered for 2020 with 110 out of 120 funding requests
(92%) recommended for grant-making in Windows 1 and 2. Approximately 58 country applications are expected in 2021. In Windows 1 and 2, $9.4 billion in allocation
funds was recommended for grant-making. $258 million in catalytic matching funds and $124 million in catalytic multi-country funds were also recommended
• As of 14 September 2020, 147 grants representing $9.7B are currently registered for GAC recommendation, and Board approval, in second half of 2020.
• As of 14 September 2020, $723 million has been approved to support the COVID-19 response across 104 countries – this includes $207 Million in Grant Flexibilities
and $516M through C19RM.
Activities
• Results are reported for the first time for the 2020-2022 allocation period on KPI 6f. They continue the strong performance trend observed in the previous allocation cycle
with 100% of funding requests in this cycle (out of 35 assessed so far) rated by the TRP as aligned with National Strategic Plans (see Annex 2. page 38)
• Strong performance is maintained on KPI 4. Overall 88% of national disease programs assessed demonstrate a decrease of cost per life saved or infection averted over the
2017-2019 allocation period indicating improved efficiency of national disease programs (see Annex 2, page 37)
• For the 2020-2022 allocation period, the Secretariat proposes to revise the indicators associated to grant funding for Human Rights (HRts) and Key Population (KP)
activities (KPI 9b) (see GF/B44/15B Adjustments to KPI Framework, page 18-21):
• It is proposed that the indicator on HIV grant funding for KP is moved from KPI 9 (generally focused on HRts) to KPI 5 (focused on KP coverage). This indicator
would include the full country portfolio (rather than Middle Income only) and would be based on grant funding for prevention activities for KP. The proposed target is
10% of total HIV grant funding, lower than corresponding target in previously KPI 9b due to the refocusing on prevention activities and the inclusion of Low Income
countries in the cohort.
• It is proposed that the indicator on HIV grant funding for HRts programs is expanded to all countries in the portfolio (rather than Middle Income only). A statistical
algorithm has been built to accommodate this considerable increase in cohort and replace the current individual manual review. The proposed target is 3% of total
HIV grant funding – an increase on the (met) target for 2017-2019 allocation period, despite the inclusion of Low Income countries in the cohort.
• It is proposed that the indicator on TB grant funding for HRts programs is expanded to include all TB countries in the “Finding New Cases” initiative. There is no
change proposed in the calculation method nor the target at 2% of total TB grant funding (not met for the 2017-2019 allocation period).
KPI 6f
KPI 3
KPI 4
8
Implementation overview
Grant Performance
• Continued strong performance on allocation utilization (KPI 7a) with the majority of the 5th Replenishment committed as grant
expenses or forecasted to be at 98% (it is 97% when considering disbursements, as recommended). Utilization stays high
across all portfolio categorizations (see Annex 2, page 40).
• For the 2017-2019 calendar years, grant absorption is at a very high level with 88% of the initial budget reported as spent (KPI
7b). The target (75%) is met in all regions, for all disease components and for all differentiation categories. Absorption is also
high in most programmatic activities, with slightly lower absorption rates (close to target) for TB and RSSH activities. There is a
clear pattern though when considering investment landscape categories with Program Activity related costs (especially capacity
building and technical assistance) absorbing at a lower level than Commodities or Program Management related costs (see
Annex 2, page 41).
• Programmatic performance in grants (when assessed against their performance framework targets) is generally strong over
2017-2019 for most indicators included in KPI 2 (see Annex 2, page 70). More than half of the grants have strong performance
(achievement are at least 90% of the grant target) for: number of patients on ART; number of male circumcisions (VMMC); and
number of households that received indoor residual spraying. Performance is slightly less strong (half of grants achieve at least
85% of their target over 2017-2019) for number of TB notifications and for long lasting nets distributed: both of them are showing
recent progress though with higher achievements in 2019. Performance is at a lower level for people with MDR-TB cases who
started treatment with less than half of the grants achieving 70% of their targets over 2017-2019 (and no significant recent
improvement). Further information on the aggregate performance across the portfolio and how it compares to Strategy targets
can be found on the KPI 2 discussion on the next page.
KPI 7a
KPI 7b
9
Result overview
10
Maximize Impact against HIV, TB and Malaria• KPI 2 results are available for end 2019, before any COVID-19 related impact (see Annex 2, page 48)
• For indicators with modelled targets, strategy targets are projected to be within reach, provided grants meet their own targets and provided targets for
PMTCT and ART coverage stay at least at the same level in new grants. However, some targets are at risk if grant performance does not improve in
several interventions (especially “MDR-TB cases treated”, “HIV/TB co-infected patients put on ART” and “PMTCT coverage”).
• For indicators with non-modelled targets, there is progress on the number of countries projected to meet the 2022 global targets but challenges remain for
most of the indicators, especially “% people living with HIV starting IPT” and “IPTp3 coverage” (malaria)
• The interim indicator for KPI 5, measuring the capacity to report on HIV Key Population coverage continues to have low results with 64% of cohort
countries deemed “able to report now” (target 75%). A new approach is proposed for the measurement of KPI 5 with three sub-indicators measuring
respectively the level of funding from GF grants (see GF/B44/15B Adjustments to KPI Framework, page 8-12); the capacity to report (same as interim
indicator); and the actual coverage level (see Annex 2, page 71).
• Results on lives saved and on incidence reduction (KPI 1) will be available in the 2021 Spring Report.
Build Resilient & Sustainable Systems for Health
• A baseline analysis was run for the new KPI 6a indicator on prices for products procured through national channels. The proposed 2022 target score is 50%
of cohort countries buying products on par with PPM prices, from a 41% baseline value. The cohort is small though as there are only 10 countries using
national channels and GF funding to procure at least one PPM core product
• Results for KPIs related to RSSH (supply chains, financial systems, information systems) will be reported at the Spring 2021 Report.
Promote and Protect Human Rights & Gender Equality
• Continued improvement in data availability: 65% of HI/Core countries are able to provide results fully disaggregated by age / gender for relevant indicators
(KPI 6e),. The Secretariat is working on defining a new indicator to measure the usage of disaggregated data in country (see Annex 2, page 72).
• Progress observed on KPI 8 (HIV incidence for AGYW) with strategy target looking achievable now. This is due mainly to the sustained effort of GF-
supported programs in country but also to UNAIDS revision of historical estimates based on updated or more reliable data and/or improvement in
estimation methods (see Annex 2, page 73).
Targets for modelled indicators (KPI 1, KPI 8 and KPI 2 - 10 of its 17 sub-indicators) were reviewed at mid-Strategy, as planned, to account for the 2020-2022
replenishment result, allocation methodology assumptions and updates on epidemiological baseline and national funding projections. The results indicate that
at the aggregate level the results of the new modelling exercise are consistent with the targets initially set in the Strategy (no statistically significant
difference). There is therefore no reason to reset these targets at mid-Strategy (see Annex 2, page 45)
KPI 2
KPI 5
KPI 8
KPI 6e
10
Not achieved
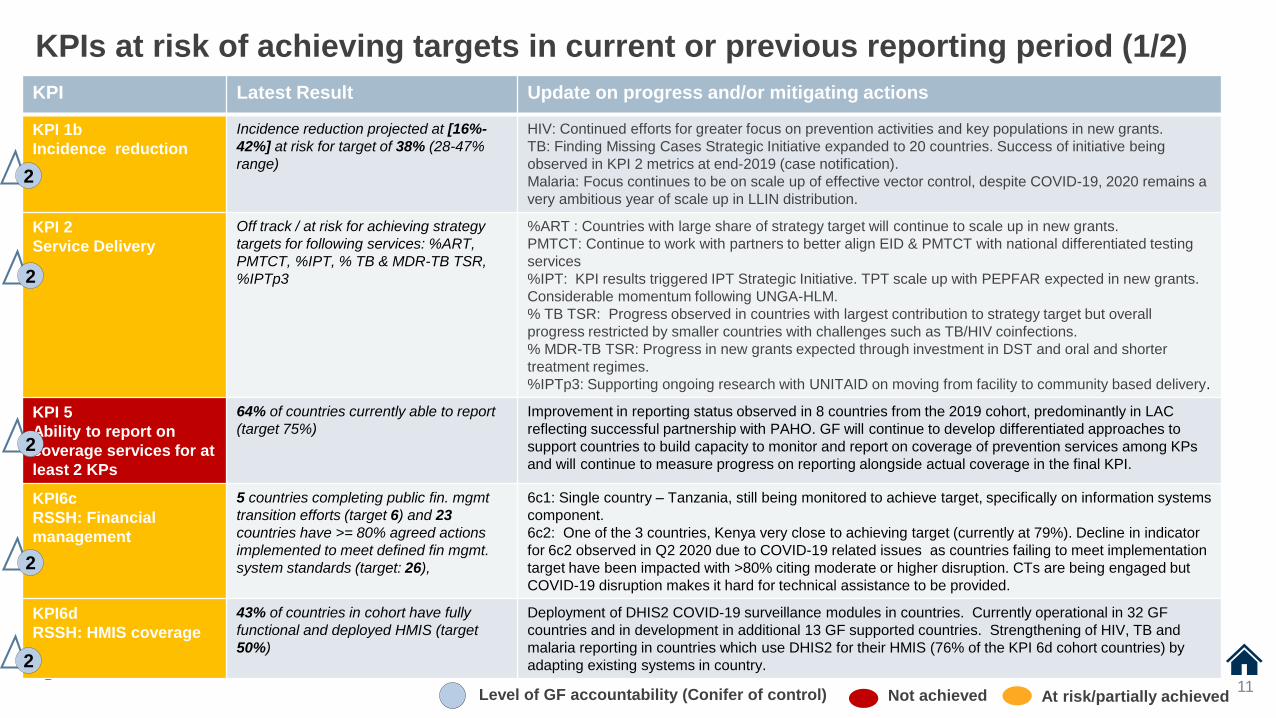
KPIs at risk of achieving targets in current or previous reporting period (1/2)
At risk/partially achieved11
KPI Latest Result Update on progress and/or mitigating actions
KPI 1b
Incidence reduction
Incidence reduction projected at [16%-
42%] at risk for target of 38% (28-47%
range)
HIV: Continued efforts for greater focus on prevention activities and key populations in new grants.
TB: Finding Missing Cases Strategic Initiative expanded to 20 countries. Success of initiative being
observed in KPI 2 metrics at end-2019 (case notification).
Malaria: Focus continues to be on scale up of effective vector control, despite COVID-19, 2020 remains a
very ambitious year of scale up in LLIN distribution.
KPI 2
Service Delivery
Off track / at risk for achieving strategy
targets for following services: %ART,
PMTCT, %IPT, % TB & MDR-TB TSR,
%IPTp3
%ART : Countries with large share of strategy target will continue to scale up in new grants.
PMTCT: Continue to work with partners to better align EID & PMTCT with national differentiated testing
services
%IPT: KPI results triggered IPT Strategic Initiative. TPT scale up with PEPFAR expected in new grants.
Considerable momentum following UNGA-HLM.
% TB TSR: Progress observed in countries with largest contribution to strategy target but overall
progress restricted by smaller countries with challenges such as TB/HIV coinfections.
% MDR-TB TSR: Progress in new grants expected through investment in DST and oral and shorter
treatment regimes.
%IPTp3: Supporting ongoing research with UNITAID on moving from facility to community based delivery.
KPI 5
Ability to report on
coverage services for at
least 2 KPs
64% of countries currently able to report
(target 75%)
Improvement in reporting status observed in 8 countries from the 2019 cohort, predominantly in LAC
reflecting successful partnership with PAHO. GF will continue to develop differentiated approaches to
support countries to build capacity to monitor and report on coverage of prevention services among KPs
and will continue to measure progress on reporting alongside actual coverage in the final KPI.
KPI6c
RSSH: Financial
management
5 countries completing public fin. mgmt
transition efforts (target 6) and 23
countries have >= 80% agreed actions
implemented to meet defined fin mgmt.
system standards (target: 26),
6c1: Single country – Tanzania, still being monitored to achieve target, specifically on information systems
component.
6c2: One of the 3 countries, Kenya very close to achieving target (currently at 79%). Decline in indicator
for 6c2 observed in Q2 2020 due to COVID-19 related issues as countries failing to meet implementation
target have been impacted with >80% citing moderate or higher disruption. CTs are being engaged but
COVID-19 disruption makes it hard for technical assistance to be provided.
KPI6d
RSSH: HMIS coverage
43% of countries in cohort have fully
functional and deployed HMIS (target
50%)
Deployment of DHIS2 COVID-19 surveillance modules in countries. Currently operational in 32 GF
countries and in development in additional 13 GF supported countries. Strengthening of HIV, TB and
malaria reporting in countries which use DHIS2 for their HMIS (76% of the KPI 6d cohort countries) by
adapting existing systems in country.
2
Level of GF accountability (Conifer of control)
2
2
2
2
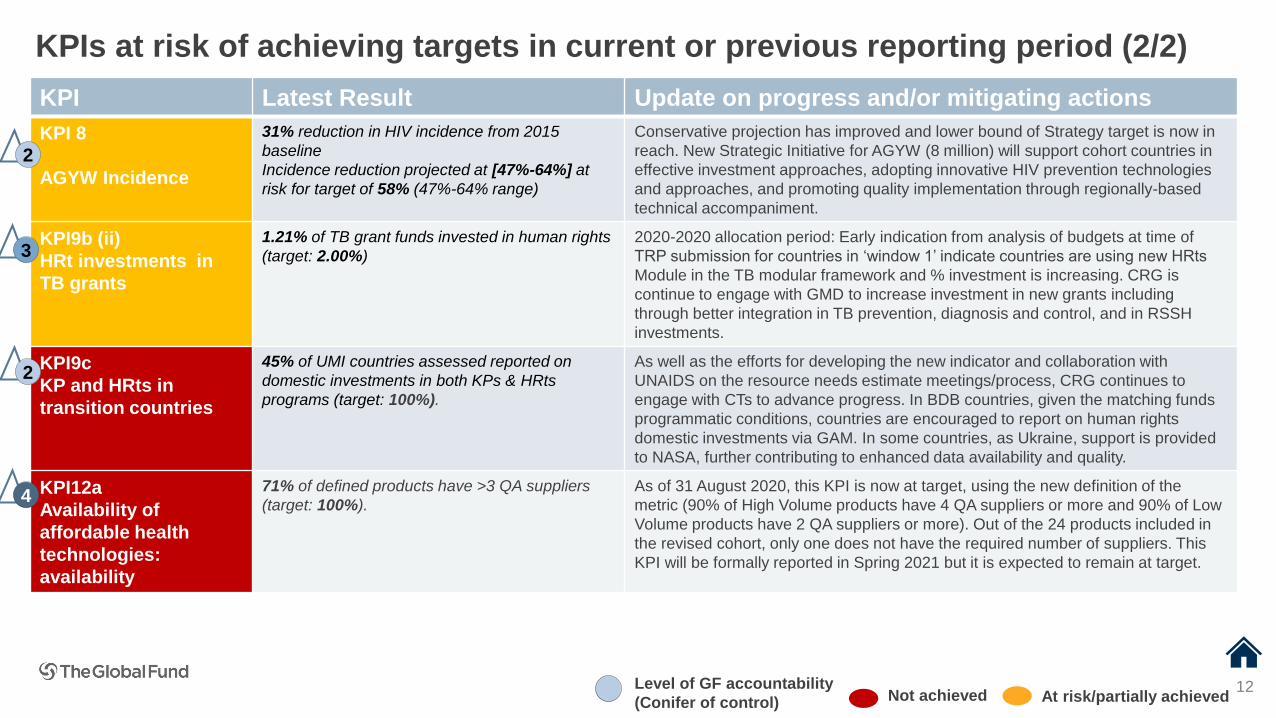
Not achieved
KPIs at risk of achieving targets in current or previous reporting period (2/2)
At risk/partially achieved12
KPI Latest Result Update on progress and/or mitigating actions
KPI 8
AGYW Incidence
31% reduction in HIV incidence from 2015
baseline
Incidence reduction projected at [47%-64%] at
risk for target of 58% (47%-64% range)
Conservative projection has improved and lower bound of Strategy target is now in
reach. New Strategic Initiative for AGYW (8 million) will support cohort countries in
effective investment approaches, adopting innovative HIV prevention technologies
and approaches, and promoting quality implementation through regionally-based
technical accompaniment.
KPI9b (ii)
HRt investments in
TB grants
1.21% of TB grant funds invested in human rights
(target: 2.00%)
2020-2020 allocation period: Early indication from analysis of budgets at time of
TRP submission for countries in ‘window 1’ indicate countries are using new HRts
Module in the TB modular framework and % investment is increasing. CRG is
continue to engage with GMD to increase investment in new grants including
through better integration in TB prevention, diagnosis and control, and in RSSH
investments.
KPI9c
KP and HRts in
transition countries
45% of UMI countries assessed reported on
domestic investments in both KPs & HRts
programs (target: 100%).
As well as the efforts for developing the new indicator and collaboration with
UNAIDS on the resource needs estimate meetings/process, CRG continues to
engage with CTs to advance progress. In BDB countries, given the matching funds
programmatic conditions, countries are encouraged to report on human rights
domestic investments via GAM. In some countries, as Ukraine, support is provided
to NASA, further contributing to enhanced data availability and quality.
KPI12a
Availability of
affordable health
technologies:
availability
71% of defined products have >3 QA suppliers
(target: 100%).
As of 31 August 2020, this KPI is now at target, using the new definition of the
metric (90% of High Volume products have 4 QA suppliers or more and 90% of Low
Volume products have 2 QA suppliers or more). Out of the 24 products included in
the revised cohort, only one does not have the required number of suppliers. This
KPI will be formally reported in Spring 2021 but it is expected to remain at target.
Level of GF accountability
(Conifer of control)
2
2
4
3

Summary of adjustments to the KPI framework
The following KPI adjustments are proposed for Board approval. They are described in detail in an accompanying
document called “Adjustments to the KPI Framework” GF/B44/15B )
KPI Definition Recommendations
3 Alignment of investment and need ❑ Calculate using disbursements (not grant expenses)
❑ Set end-2021 target=0.307; end-2022 target=0.293
5a Service coverage for key populations
(investments)
❑ Move HIV grants investment for key populations from 9b to 5a and focus on
prevention activities
❑ Expand cohort to full HIV portfolio; Set target at 10%
5b Service coverage for key populations
(capacity to report)
❑ Retain current (interim) KPI 5 as KPI 5b
❑ Maintain title, calculation, cohort, and target (75%)
6a RSSH – Procurement Prices ❑ Set end-2022 target=50%
6b RSSH – Supply Chains ❑ Modify target to “maintain current levels” for On Shelf Availability when above
90%
❑ Keep current target when not meeting 90% threshold
7a Allocation utilization ❑ Calculate using disbursements (not grant expenses)
9b Human Rights investments ❑ Focus only on Human Rights/move HIV KPs to 5a
❑ Expand HIV cohort to all eligible countries; TB cohort to countries in TB
strategic initiative
❑ Set HIV target=3%; Keep TB target=2%
12b Affordable health technologies ❑ Set 2021 target at $154m
13
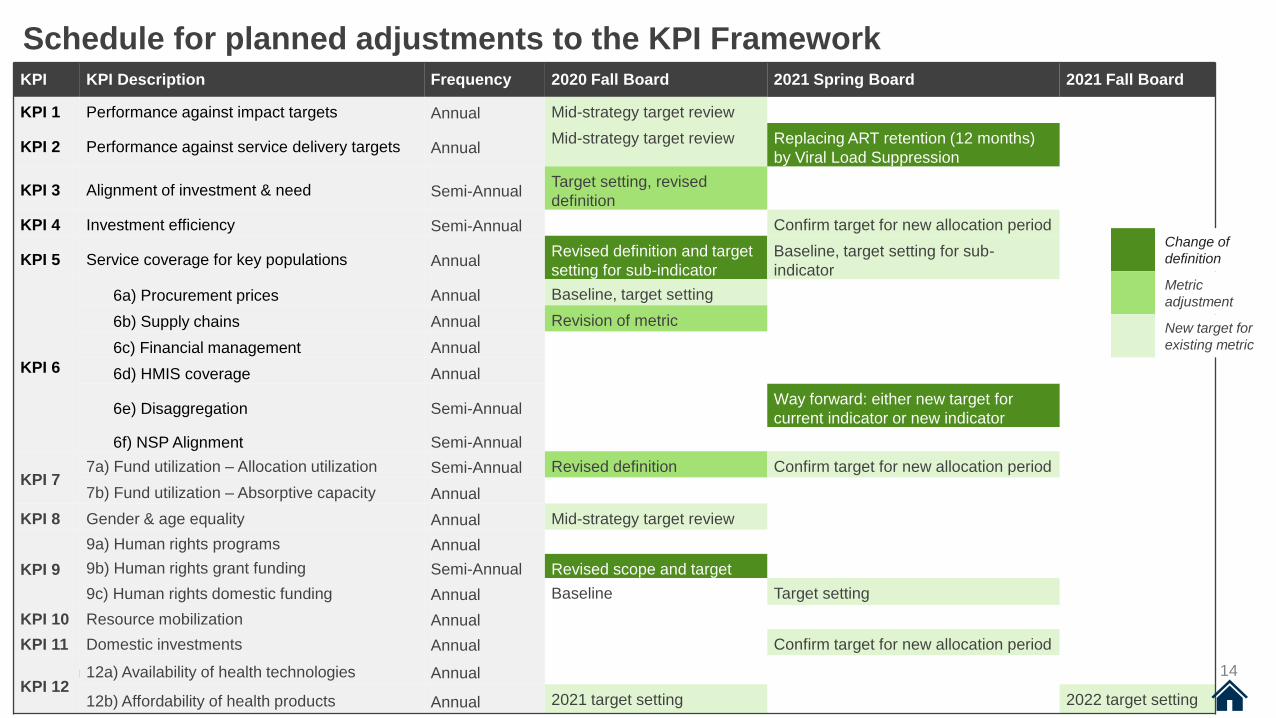
14
Schedule for planned adjustments to the KPI FrameworkKPI KPI Description Frequency 2020 Fall Board 2021 Spring Board 2021 Fall Board
KPI 1 Performance against impact targets Annual Mid-strategy target review
KPI 2 Performance against service delivery targets AnnualMid-strategy target review Replacing ART retention (12 months)
by Viral Load Suppression
KPI 3 Alignment of investment & need Semi-AnnualTarget setting, revised
definition
KPI 4 Investment efficiency Semi-Annual Confirm target for new allocation period
KPI 5 Service coverage for key populations AnnualRevised definition and target
setting for sub-indicator
Baseline, target setting for sub-
indicator
KPI 6
6a) Procurement prices Annual Baseline, target setting
6b) Supply chains Annual Revision of metric
6c) Financial management Annual
6d) HMIS coverage Annual
6e) Disaggregation Semi-AnnualWay forward: either new target for
current indicator or new indicator
6f) NSP Alignment Semi-Annual
KPI 77a) Fund utilization – Allocation utilization Semi-Annual Revised definition Confirm target for new allocation period
7b) Fund utilization – Absorptive capacity Annual
KPI 8 Gender & age equality Annual Mid-strategy target review
KPI 9
9a) Human rights programs Annual
9b) Human rights grant funding Semi-Annual Revised scope and target
9c) Human rights domestic funding Annual Baseline Target setting
KPI 10 Resource mobilization Annual
KPI 11 Domestic investments Annual Confirm target for new allocation period
KPI 1212a) Availability of health technologies Annual
12b) Affordability of health products Annual 2021 target setting 2022 target setting
Change of
definition
Metric
adjustment
New target for
existing metric
15
Annex 1: COVID-19 and Strategic Performance
Overview – KPI Results are not affected by COVID-19…yet
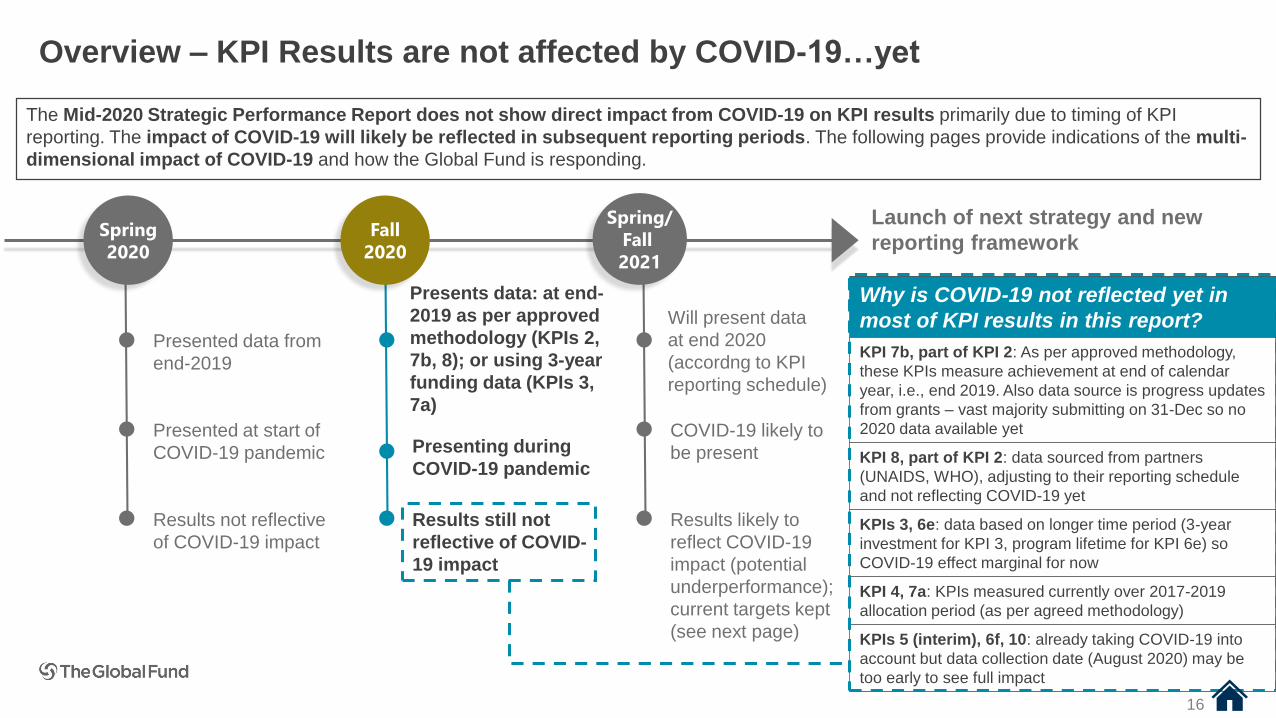
The Mid-2020 Strategic Performance Report does not show direct impact from COVID-19 on KPI results primarily due to timing of KPI
reporting. The impact of COVID-19 will likely be reflected in subsequent reporting periods. The following pages provide indications of the multi-
dimensional impact of COVID-19 and how the Global Fund is responding.
Spring
2020
Fall
2020
Spring/
Fall
2021
Presented data from
end-2019
Presented at start of
COVID-19 pandemic
Results not reflective
of COVID-19 impact
Presents data: at end-
2019 as per approved
methodology (KPIs 2,
7b, 8); or using 3-year
funding data (KPIs 3,
7a)
Presenting during
COVID-19 pandemic
Results still not
reflective of COVID-
19 impact
Will present data
at end 2020
(accordng to KPI
reporting schedule)
COVID-19 likely to
be present
Results likely to
reflect COVID-19
impact (potential
underperformance);
current targets kept
(see next page)
Launch of next strategy and new
reporting framework
Why is COVID-19 not reflected yet in
most of KPI results in this report?
KPI 7b, part of KPI 2: As per approved methodology,
these KPIs measure achievement at end of calendar
year, i.e., end 2019. Also data source is progress updates
from grants – vast majority submitting on 31-Dec so no
2020 data available yet
KPI 8, part of KPI 2: data sourced from partners
(UNAIDS, WHO), adjusting to their reporting schedule
and not reflecting COVID-19 yet
KPIs 3, 6e: data based on longer time period (3-year
investment for KPI 3, program lifetime for KPI 6e) so
COVID-19 effect marginal for now
KPI 4, 7a: KPIs measured currently over 2017-2019
allocation period (as per agreed methodology)
KPIs 5 (interim), 6f, 10: already taking COVID-19 into
account but data collection date (August 2020) may be
too early to see full impact
16

Despite the presence of COVID-19, KPI targets will likely be maintained till the launch of the Next Strategy
Strategic targets were set
to support a bold
aspiration that underlies
the Investment Case.
Keeping current targets
allows GF to maintain
ambition but also to
measure divergence from
this aspiration due to
COVID-19.
Ambition Depending on the
longevity of the
pandemic,
COVID-19 may
influence
development of
the next
Performance
Reporting
Framework
where target
setting will factor
in this context
Uncertainty
Consistency
Setting a target is a complex,
consultative process and could
divert attention (Board and
Secretariat) from other
priorities. Other tools are in
place to monitor COVID-19
impact (see next pages)
Focus
Maintain
current KPI
targets
17
The trajectory of COVID-19
globally and at the country
level is uncertain. Disparity
can be expected on the
state of the 3 diseases +
RSSH but the exact
outcomes and still not be
predicted
Changing targets would
reduce the Global Funds’
ability to consistently track
progress from the start of the
Strategy. Measurement of
results against the same
targets allows GF to better
understand patterns of
performance over the Strategy
period(Primary factor) (Primary factor)
(Additional factor) (Additional factor)
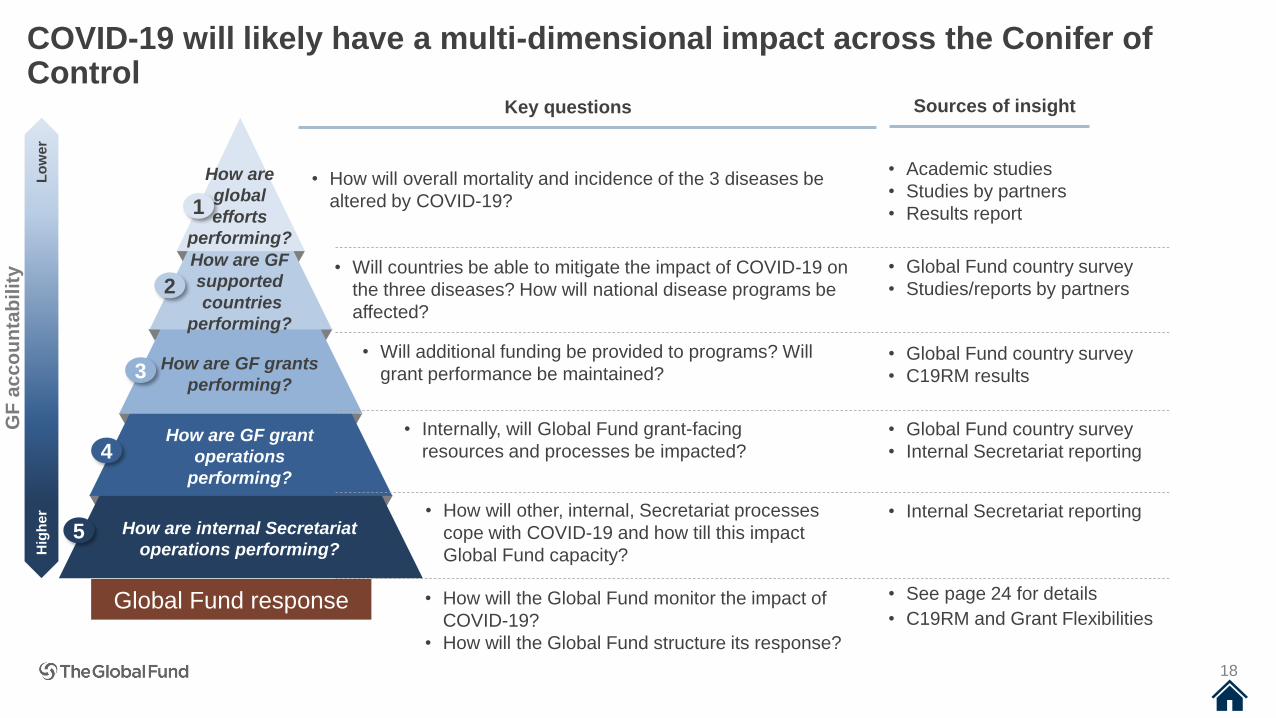
COVID-19 will likely have a multi-dimensional impact across the Conifer of Control
GF
ac
co
un
tab
ilit
y
Lo
wer
Hig
her
How are internal Secretariat
operations performing?
How are GF grant
operations
performing?
How are GF grants
performing?
How are GF
supported
countries
performing?
How are
global
efforts
performing?
1
2
3
4
5
Key questions Sources of insight
• How will overall mortality and incidence of the 3 diseases be
altered by COVID-19?
• Academic studies
• Studies by partners
• Results report
• Will countries be able to mitigate the impact of COVID-19 on
the three diseases? How will national disease programs be
affected?
• Global Fund country survey
• Studies/reports by partners
• Will additional funding be provided to programs? Will
grant performance be maintained?• Global Fund country survey
• C19RM results
• Internally, will Global Fund grant-facing
resources and processes be impacted?
• Global Fund country survey
• Internal Secretariat reporting
• How will other, internal, Secretariat processes
cope with COVID-19 and how till this impact
Global Fund capacity?
• Internal Secretariat reporting
Global Fund response • How will the Global Fund monitor the impact of
COVID-19?
• How will the Global Fund structure its response?
• See page 24 for details
• C19RM and Grant Flexibilities
18
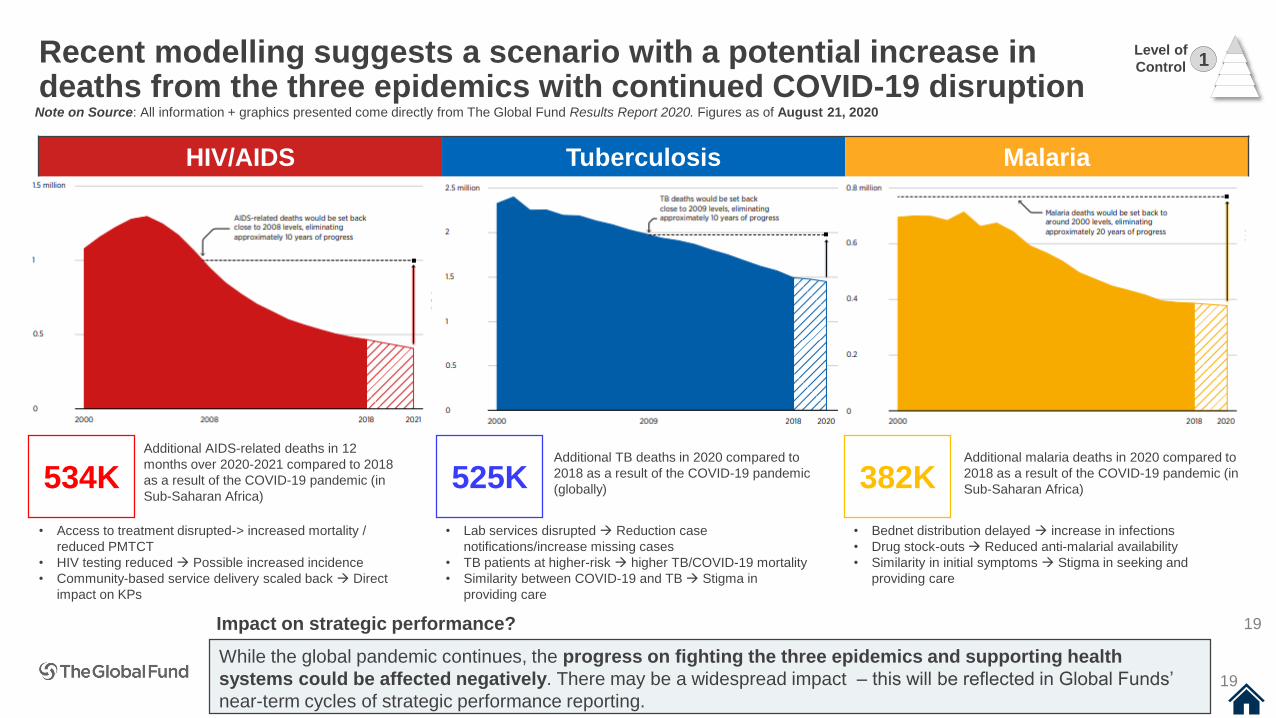
Recent modelling suggests a scenario with a potential increase in deaths from the three epidemics with continued COVID-19 disruption
19
While the global pandemic continues, the progress on fighting the three epidemics and supporting health
systems could be affected negatively. There may be a widespread impact – this will be reflected in Global Funds’
near-term cycles of strategic performance reporting.
Level of
Control 1
HIV/AIDS Tuberculosis Malaria
Additional AIDS-related deaths in 12
months over 2020-2021 compared to 2018
as a result of the COVID-19 pandemic (in
Sub-Saharan Africa)
Additional TB deaths in 2020 compared to
2018 as a result of the COVID-19 pandemic
(globally)
Additional malaria deaths in 2020 compared to
2018 as a result of the COVID-19 pandemic (in
Sub-Saharan Africa)534K 525K 382K
• Access to treatment disrupted-> increased mortality /
reduced PMTCT
• HIV testing reduced → Possible increased incidence
• Community-based service delivery scaled back → Direct
impact on KPs
• Lab services disrupted → Reduction case
notifications/increase missing cases
• TB patients at higher-risk → higher TB/COVID-19 mortality
• Similarity between COVID-19 and TB → Stigma in
providing care
• Bednet distribution delayed → increase in infections
• Drug stock-outs → Reduced anti-malarial availability
• Similarity in initial symptoms → Stigma in seeking and
providing care
Note on Source: All information + graphics presented come directly from The Global Fund Results Report 2020. Figures as of August 21, 2020
Impact on strategic performance? 19
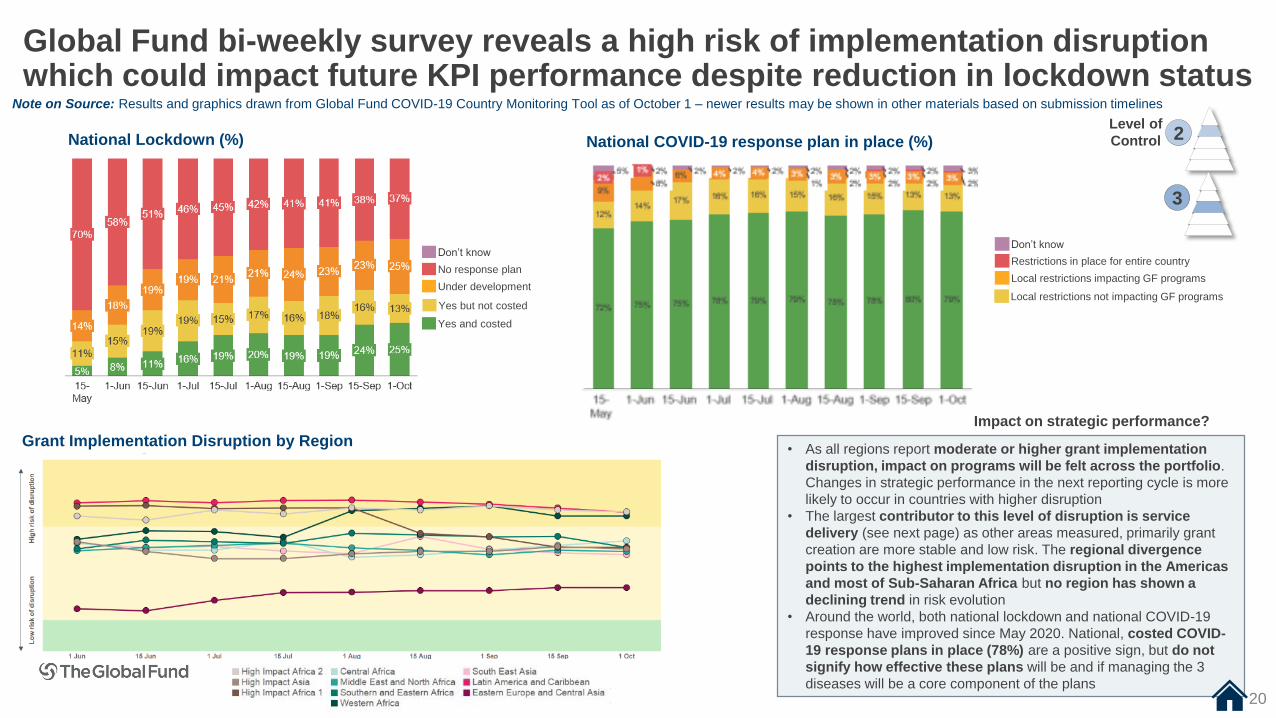
Global Fund bi-weekly survey reveals a high risk of implementation disruption which could impact future KPI performance despite reduction in lockdown status
20
• As all regions report moderate or higher grant implementation
disruption, impact on programs will be felt across the portfolio.
Changes in strategic performance in the next reporting cycle is more
likely to occur in countries with higher disruption
• The largest contributor to this level of disruption is service
delivery (see next page) as other areas measured, primarily grant
creation are more stable and low risk. The regional divergence
points to the highest implementation disruption in the Americas
and most of Sub-Saharan Africa but no region has shown a
declining trend in risk evolution
• Around the world, both national lockdown and national COVID-19
response have improved since May 2020. National, costed COVID-
19 response plans in place (78%) are a positive sign, but do not
signify how effective these plans will be and if managing the 3
diseases will be a core component of the plans
Level of
Control 2
Grant Implementation Disruption by Region
National Lockdown (%) National COVID-19 response plan in place (%)
3
20
Under development
No response plan
Yes but not costed
Yes and costed
Don’t know
Local restrictions impacting GF programs
Local restrictions not impacting GF programs
Restrictions in place for entire country
Don’t know
Note on Source: Results and graphics drawn from Global Fund COVID-19 Country Monitoring Tool as of October 1 – newer results may be shown in other materials based on submission timelines
Impact on strategic performance?
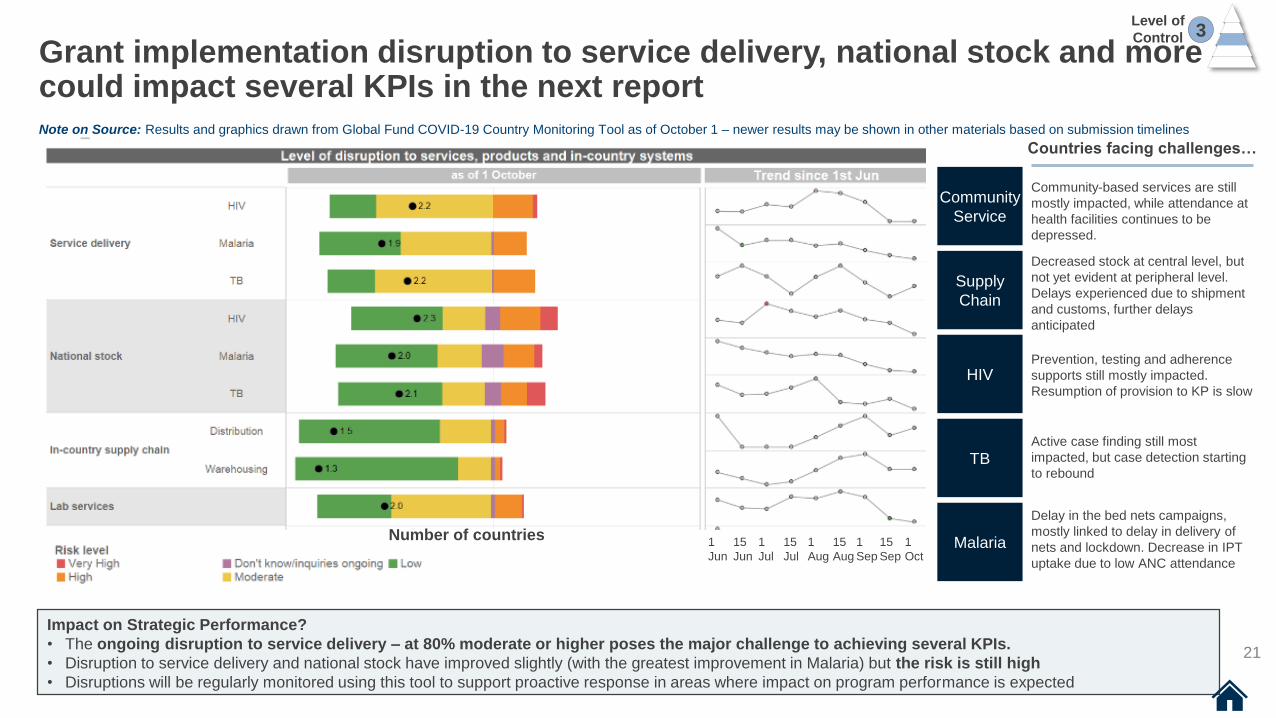
Grant implementation disruption to service delivery, national stock and more could impact several KPIs in the next report
21
Community
Service
Supply
Chain
HIV
TB
Malaria
Countries facing challenges…
Community-based services are still
mostly impacted, while attendance at
health facilities continues to be
depressed.
Decreased stock at central level, but
not yet evident at peripheral level.
Delays experienced due to shipment
and customs, further delays
anticipated
Prevention, testing and adherence
supports still mostly impacted.
Resumption of provision to KP is slow
Active case finding still most
impacted, but case detection starting
to rebound
Delay in the bed nets campaigns,
mostly linked to delay in delivery of
nets and lockdown. Decrease in IPT
uptake due to low ANC attendance
Impact on Strategic Performance?
• The ongoing disruption to service delivery – at 80% moderate or higher poses the major challenge to achieving several KPIs.
• Disruption to service delivery and national stock have improved slightly (with the greatest improvement in Malaria) but the risk is still high
• Disruptions will be regularly monitored using this tool to support proactive response in areas where impact on program performance is expected
Level of
Control 3
Note on Source: Results and graphics drawn from Global Fund COVID-19 Country Monitoring Tool as of October 1 – newer results may be shown in other materials based on submission timelines
1
Jun
15
Jun
1
Jul
15
Jul
1
Aug
15
Aug
1
Sep
15
Sep
1
Oct
Number of countries
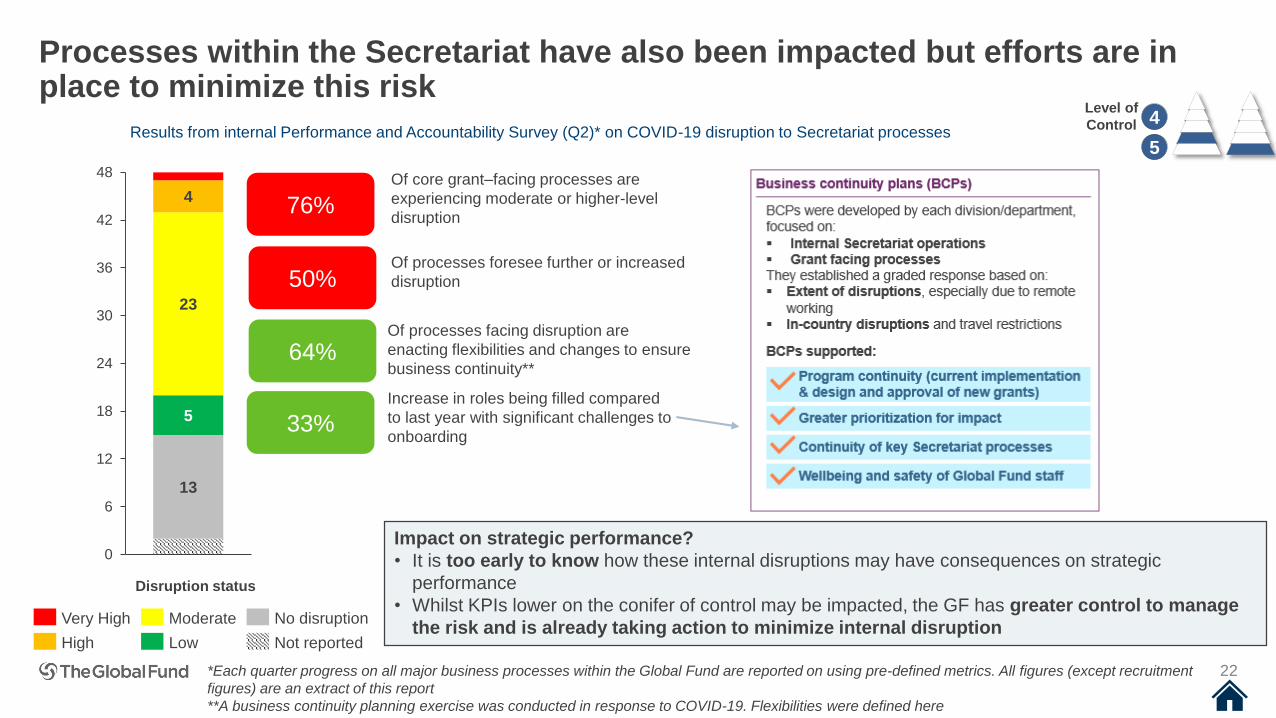
Processes within the Secretariat have also been impacted but efforts are in place to minimize this risk
22
64%
50%
76%
33%
Of core grant–facing processes are
experiencing moderate or higher-level
disruption
Of processes foresee further or increased
disruption
Of processes facing disruption are
enacting flexibilities and changes to ensure
business continuity**
Increase in roles being filled compared
to last year with significant challenges to
onboarding
Results from internal Performance and Accountability Survey (Q2)* on COVID-19 disruption to Secretariat processes
Impact on strategic performance?
• It is too early to know how these internal disruptions may have consequences on strategic
performance
• Whilst KPIs lower on the conifer of control may be impacted, the GF has greater control to manage
the risk and is already taking action to minimize internal disruption
Level of
Control 4
13
5
23
4
0
6
12
18
24
30
36
42
48
Disruption status
Very High
High
Moderate
Low
No disruption
Not reported
*Each quarter progress on all major business processes within the Global Fund are reported on using pre-defined metrics. All figures (except recruitment
figures) are an extract of this report
**A business continuity planning exercise was conducted in response to COVID-19. Flexibilities were defined here
5
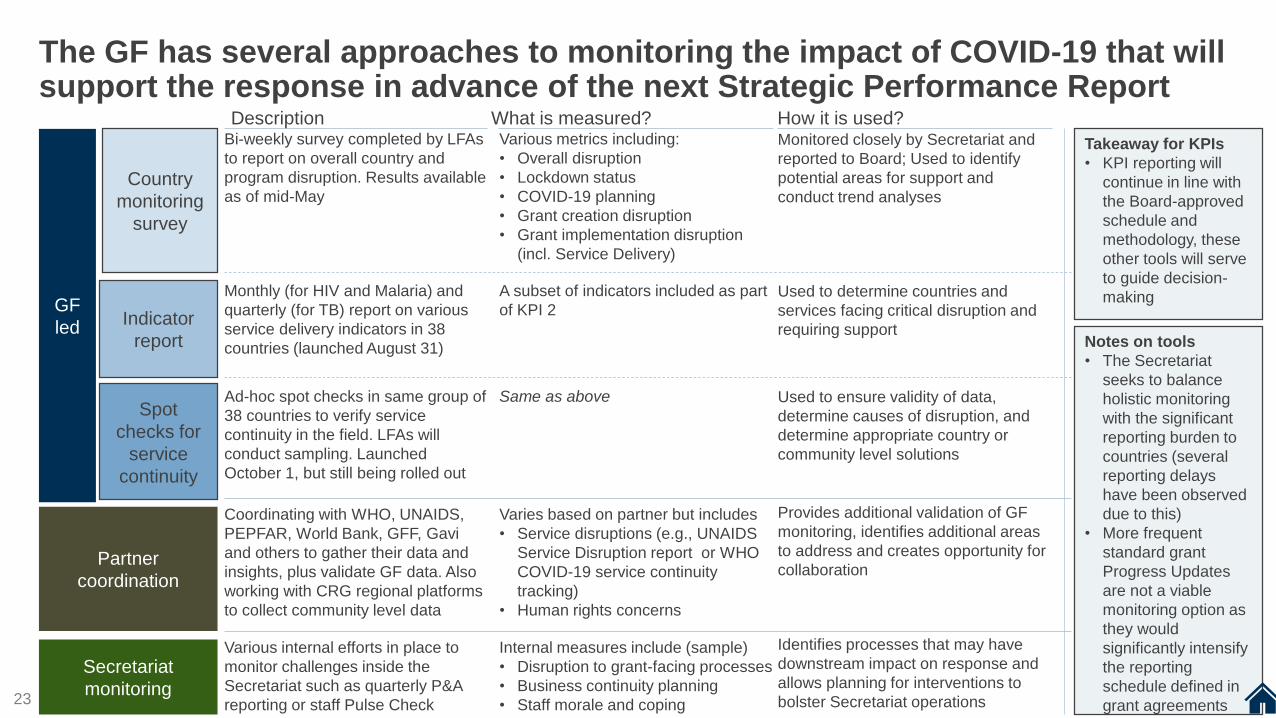
The GF has several approaches to monitoring the impact of COVID-19 that will support the response in advance of the next Strategic Performance Report
23
GF
led
Partner
coordination
Secretariat
monitoring
Description What is measured?
Country
monitoring
survey
Indicator
report
Spot
checks for
service
continuity
Bi-weekly survey completed by LFAs
to report on overall country and
program disruption. Results available
as of mid-May
Various metrics including:
• Overall disruption
• Lockdown status
• COVID-19 planning
• Grant creation disruption
• Grant implementation disruption
(incl. Service Delivery)
Monitored closely by Secretariat and
reported to Board; Used to identify
potential areas for support and
conduct trend analyses
Monthly (for HIV and Malaria) and
quarterly (for TB) report on various
service delivery indicators in 38
countries (launched August 31)
A subset of indicators included as part
of KPI 2Used to determine countries and
services facing critical disruption and
requiring support
Ad-hoc spot checks in same group of
38 countries to verify service
continuity in the field. LFAs will
conduct sampling. Launched
October 1, but still being rolled out
Same as above Used to ensure validity of data,
determine causes of disruption, and
determine appropriate country or
community level solutions
Coordinating with WHO, UNAIDS,
PEPFAR, World Bank, GFF, Gavi
and others to gather their data and
insights, plus validate GF data. Also
working with CRG regional platforms
to collect community level data
Varies based on partner but includes
• Service disruptions (e.g., UNAIDS
Service Disruption report or WHO
COVID-19 service continuity
tracking)
• Human rights concerns
Provides additional validation of GF
monitoring, identifies additional areas
to address and creates opportunity for
collaboration
Various internal efforts in place to
monitor challenges inside the
Secretariat such as quarterly P&A
reporting or staff Pulse Check
Internal measures include (sample)
• Disruption to grant-facing processes
• Business continuity planning
• Staff morale and coping
Identifies processes that may have
downstream impact on response and
allows planning for interventions to
bolster Secretariat operations
Takeaway for KPIs
• KPI reporting will
continue in line with
the Board-approved
schedule and
methodology, these
other tools will serve
to guide decision-
making
How it is used?
Notes on tools
• The Secretariat
seeks to balance
holistic monitoring
with the significant
reporting burden to
countries (several
reporting delays
have been observed
due to this)
• More frequent
standard grant
Progress Updates
are not a viable
monitoring option as
they would
significantly intensify
the reporting
schedule defined in
grant agreements23
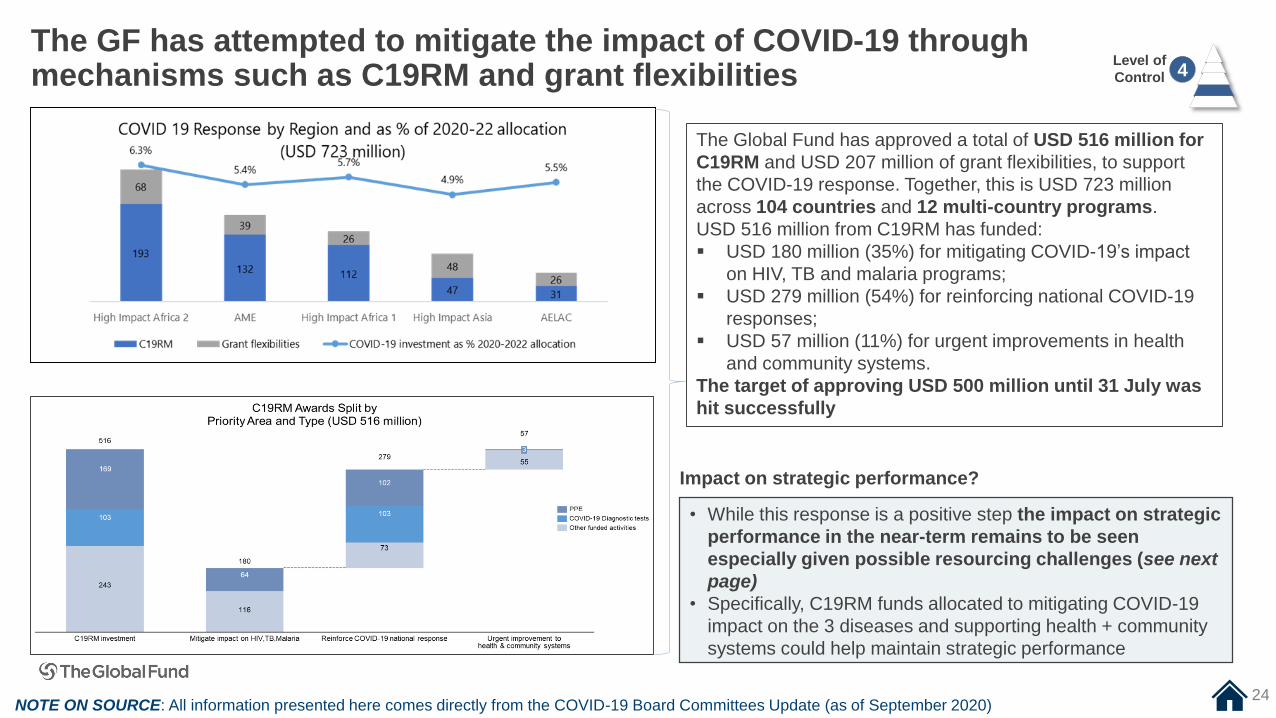
The GF has attempted to mitigate the impact of COVID-19 through mechanisms such as C19RM and grant flexibilities
NOTE ON SOURCE: All information presented here comes directly from the COVID-19 Board Committees Update (as of September 2020)
Level of
Control 4
The Global Fund has approved a total of USD 516 million for
C19RM and USD 207 million of grant flexibilities, to support
the COVID-19 response. Together, this is USD 723 million
across 104 countries and 12 multi-country programs.
USD 516 million from C19RM has funded:
▪ USD 180 million (35%) for mitigating COVID-19’s impact
on HIV, TB and malaria programs;
▪ USD 279 million (54%) for reinforcing national COVID-19
responses;
▪ USD 57 million (11%) for urgent improvements in health
and community systems.
The target of approving USD 500 million until 31 July was
hit successfully
• While this response is a positive step the impact on strategic
performance in the near-term remains to be seen
especially given possible resourcing challenges (see next
page)
• Specifically, C19RM funds allocated to mitigating COVID-19
impact on the 3 diseases and supporting health + community
systems could help maintain strategic performance
Impact on strategic performance?
24
Resourcing will remain a key challenge in the continued fight against COVID-19 and in reaching strategic performance goals
25
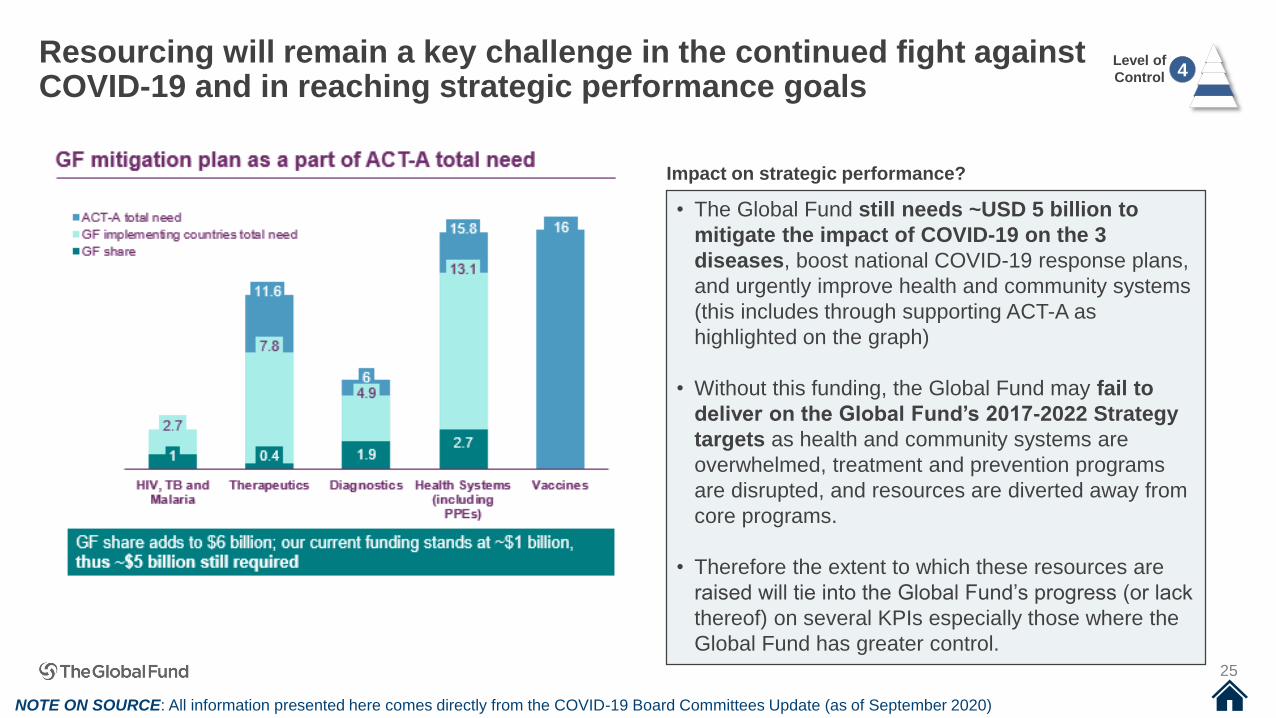
• The Global Fund still needs ~USD 5 billion to
mitigate the impact of COVID-19 on the 3
diseases, boost national COVID-19 response plans,
and urgently improve health and community systems
(this includes through supporting ACT-A as
highlighted on the graph)
• Without this funding, the Global Fund may fail to
deliver on the Global Fund’s 2017-2022 Strategy
targets as health and community systems are
overwhelmed, treatment and prevention programs
are disrupted, and resources are diverted away from
core programs.
• Therefore the extent to which these resources are
raised will tie into the Global Fund’s progress (or lack
thereof) on several KPIs especially those where the
Global Fund has greater control.
Level of
Control 4
Impact on strategic performance?
NOTE ON SOURCE: All information presented here comes directly from the COVID-19 Board Committees Update (as of September 2020)
26
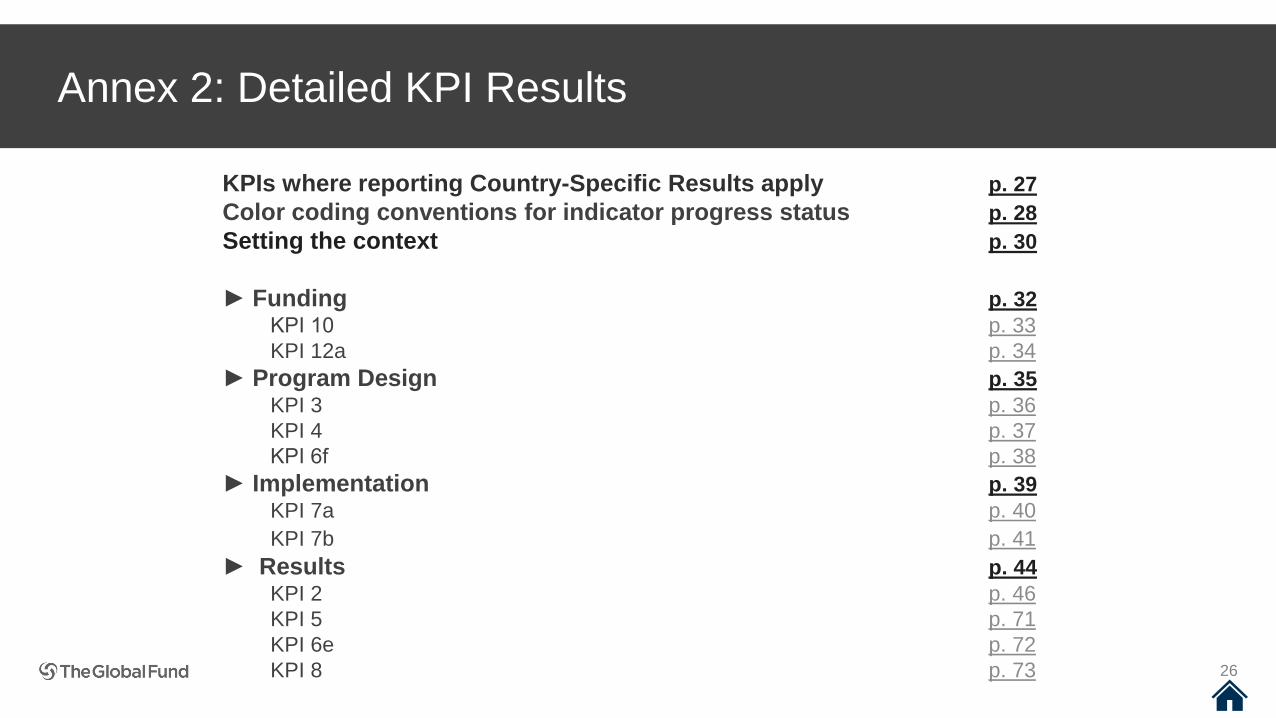
Annex 2: Detailed KPI Results
KPIs where reporting Country-Specific Results apply p. 27
Color coding conventions for indicator progress status p. 28
Setting the context p. 30
► Funding p. 32
KPI 10 p. 33
KPI 12a p. 34
► Program Design p. 35
KPI 3 p. 36
KPI 4 p. 37
KPI 6f p. 38
► Implementation p. 39
KPI 7a p. 40
KPI 7b p. 41
► Results p. 44
KPI 2 p. 46
KPI 5 p. 71
KPI 6e p. 72
KPI 8 p. 73
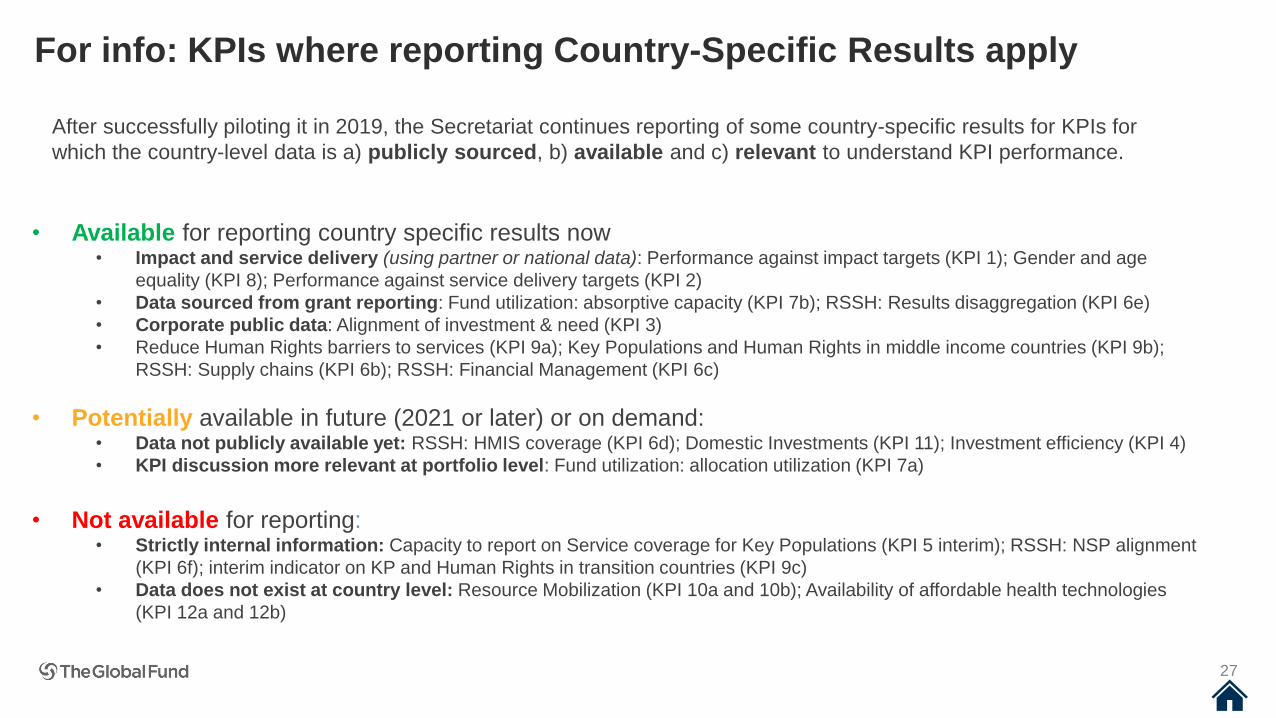
For info: KPIs where reporting Country-Specific Results apply
27
• Available for reporting country specific results now• Impact and service delivery (using partner or national data): Performance against impact targets (KPI 1); Gender and age
equality (KPI 8); Performance against service delivery targets (KPI 2)
• Data sourced from grant reporting: Fund utilization: absorptive capacity (KPI 7b); RSSH: Results disaggregation (KPI 6e)
• Corporate public data: Alignment of investment & need (KPI 3)
• Reduce Human Rights barriers to services (KPI 9a); Key Populations and Human Rights in middle income countries (KPI 9b);
RSSH: Supply chains (KPI 6b); RSSH: Financial Management (KPI 6c)
• Potentially available in future (2021 or later) or on demand:• Data not publicly available yet: RSSH: HMIS coverage (KPI 6d); Domestic Investments (KPI 11); Investment efficiency (KPI 4)
• KPI discussion more relevant at portfolio level: Fund utilization: allocation utilization (KPI 7a)
• Not available for reporting:• Strictly internal information: Capacity to report on Service coverage for Key Populations (KPI 5 interim); RSSH: NSP alignment
(KPI 6f); interim indicator on KP and Human Rights in transition countries (KPI 9c)
• Data does not exist at country level: Resource Mobilization (KPI 10a and 10b); Availability of affordable health technologies
(KPI 12a and 12b)
After successfully piloting it in 2019, the Secretariat continues reporting of some country-specific results for KPIs for
which the country-level data is a) publicly sourced, b) available and c) relevant to understand KPI performance.
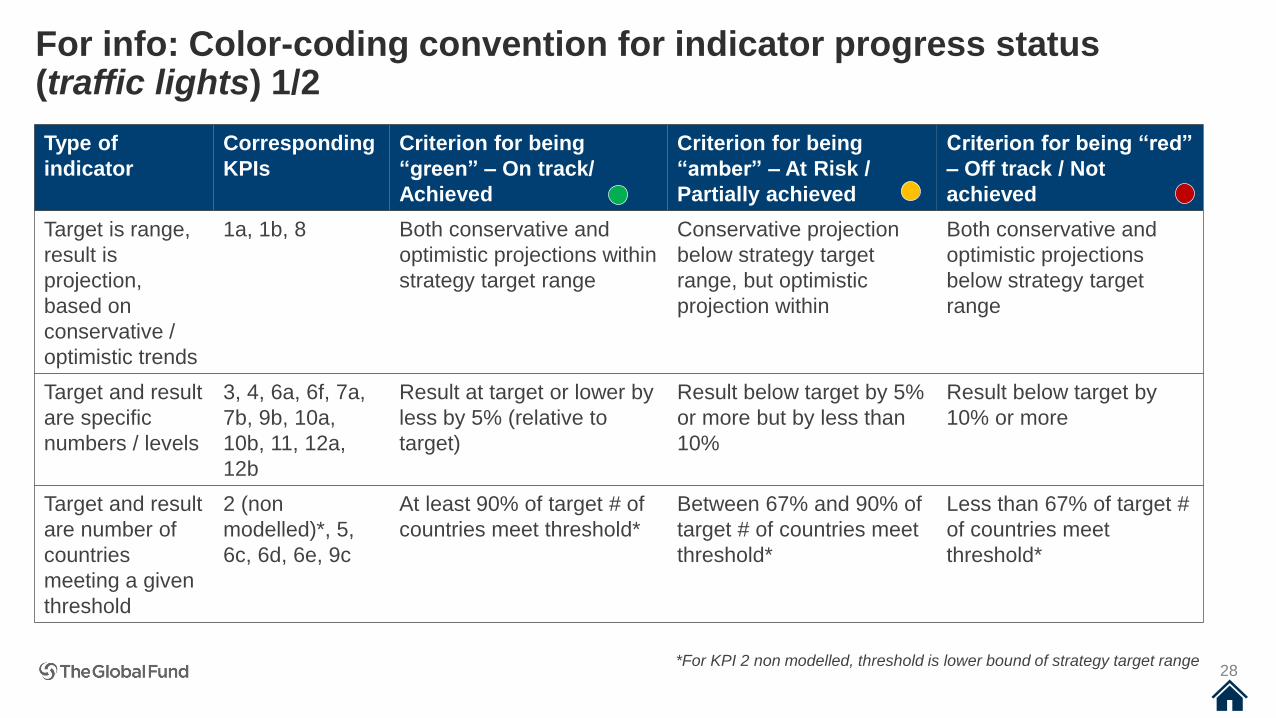
For info: Color-coding convention for indicator progress status (traffic lights) 1/2
28
Type of
indicator
Corresponding
KPIs
Criterion for being
“green” – On track/
Achieved
Criterion for being
“amber” – At Risk /
Partially achieved
Criterion for being “red”
– Off track / Not
achieved
Target is range,
result is
projection,
based on
conservative /
optimistic trends
1a, 1b, 8 Both conservative and
optimistic projections within
strategy target range
Conservative projection
below strategy target
range, but optimistic
projection within
Both conservative and
optimistic projections
below strategy target
range
Target and result
are specific
numbers / levels
3, 4, 6a, 6f, 7a,
7b, 9b, 10a,
10b, 11, 12a,
12b
Result at target or lower by
less by 5% (relative to
target)
Result below target by 5%
or more but by less than
10%
Result below target by
10% or more
Target and result
are number of
countries
meeting a given
threshold
2 (non
modelled)*, 5,
6c, 6d, 6e, 9c
At least 90% of target # of
countries meet threshold*
Between 67% and 90% of
target # of countries meet
threshold*
Less than 67% of target #
of countries meet
threshold*
*For KPI 2 non modelled, threshold is lower bound of strategy target range
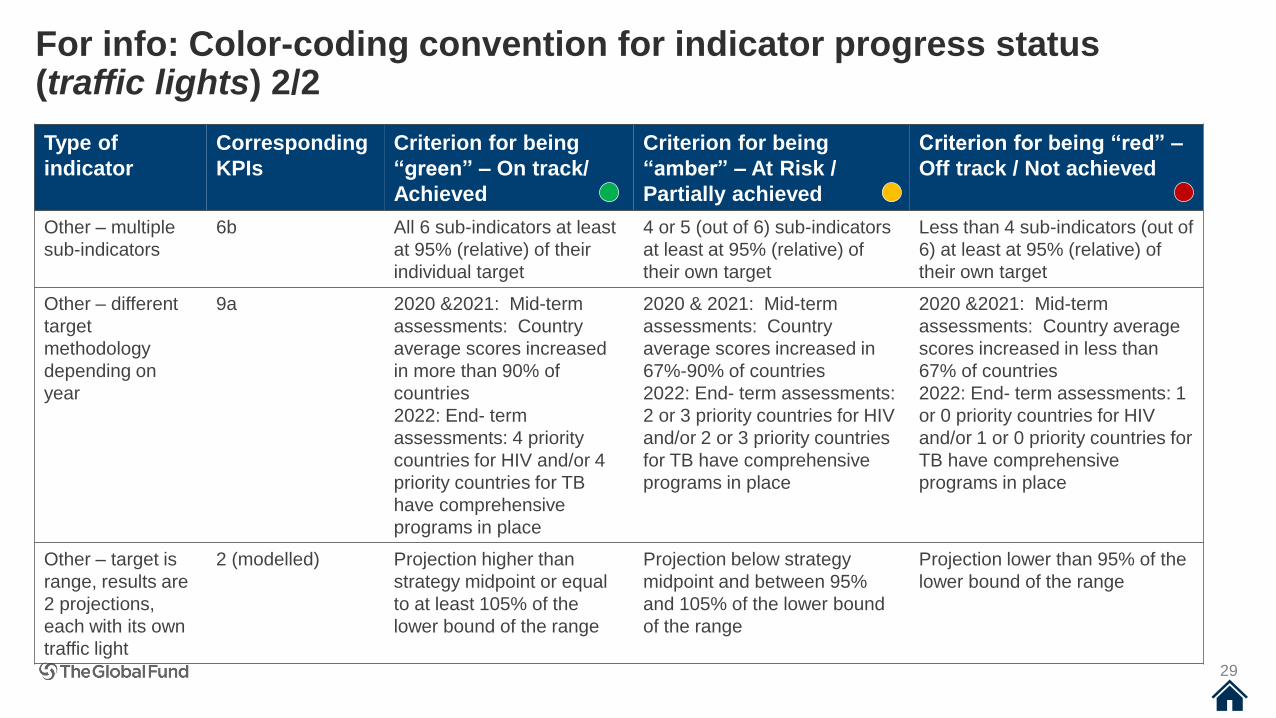
For info: Color-coding convention for indicator progress status (traffic lights) 2/2
29
Type of
indicator
Corresponding
KPIs
Criterion for being
“green” – On track/
Achieved
Criterion for being
“amber” – At Risk /
Partially achieved
Criterion for being “red” –
Off track / Not achieved
Other – multiple
sub-indicators
6b All 6 sub-indicators at least
at 95% (relative) of their
individual target
4 or 5 (out of 6) sub-indicators
at least at 95% (relative) of
their own target
Less than 4 sub-indicators (out of
6) at least at 95% (relative) of
their own target
Other – different
target
methodology
depending on
year
9a 2020 &2021: Mid-term
assessments: Country
average scores increased
in more than 90% of
countries
2022: End- term
assessments: 4 priority
countries for HIV and/or 4
priority countries for TB
have comprehensive
programs in place
2020 & 2021: Mid-term
assessments: Country
average scores increased in
67%-90% of countries
2022: End- term assessments:
2 or 3 priority countries for HIV
and/or 2 or 3 priority countries
for TB have comprehensive
programs in place
2020 &2021: Mid-term
assessments: Country average
scores increased in less than
67% of countries
2022: End- term assessments: 1
or 0 priority countries for HIV
and/or 1 or 0 priority countries for
TB have comprehensive
programs in place
Other – target is
range, results are
2 projections,
each with its own
traffic light
2 (modelled) Projection higher than
strategy midpoint or equal
to at least 105% of the
lower bound of the range
Projection below strategy
midpoint and between 95%
and 105% of the lower bound
of the range
Projection lower than 95% of the
lower bound of the range
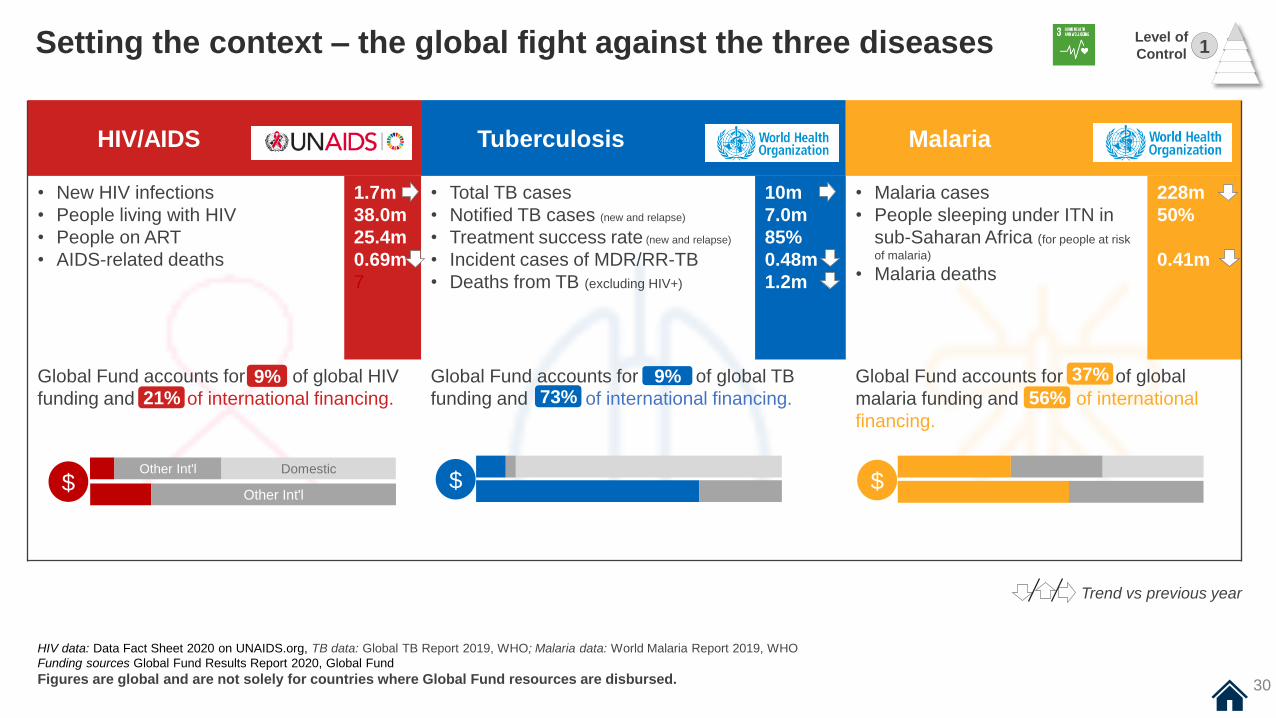
HIV data: Data Fact Sheet 2020 on UNAIDS.org, TB data: Global TB Report 2019, WHO; Malaria data: World Malaria Report 2019, WHO
Funding sources Global Fund Results Report 2020, Global Fund
Figures are global and are not solely for countries where Global Fund resources are disbursed.
HIV/AIDS Tuberculosis Malaria
• New HIV infections
• People living with HIV
• People on ART
• AIDS-related deaths
1.7m
38.0m
25.4m
0.69m
7
• Total TB cases
• Notified TB cases (new and relapse)
• Treatment success rate (new and relapse)
• Incident cases of MDR/RR-TB
• Deaths from TB (excluding HIV+)
10m
7.0m
85%
0.48m
1.2m
• Malaria cases
• People sleeping under ITN in
sub-Saharan Africa (for people at risk
of malaria)
• Malaria deaths
228m
50%
0.41m
Global Fund accounts for 8% of global HIV
funding and 20% of international financing.
Global Fund accounts for 8% of global TB
funding and 65% of international financing.
Global Fund accounts for 40% of global
malaria funding and 50% of international
financing.
Setting the context – the global fight against the three diseases
Other Int'l Domestic
Other Int'l
9%21%
9%73% 56%
37%
30
Trend vs previous year
$$
Level of
Control 1
$
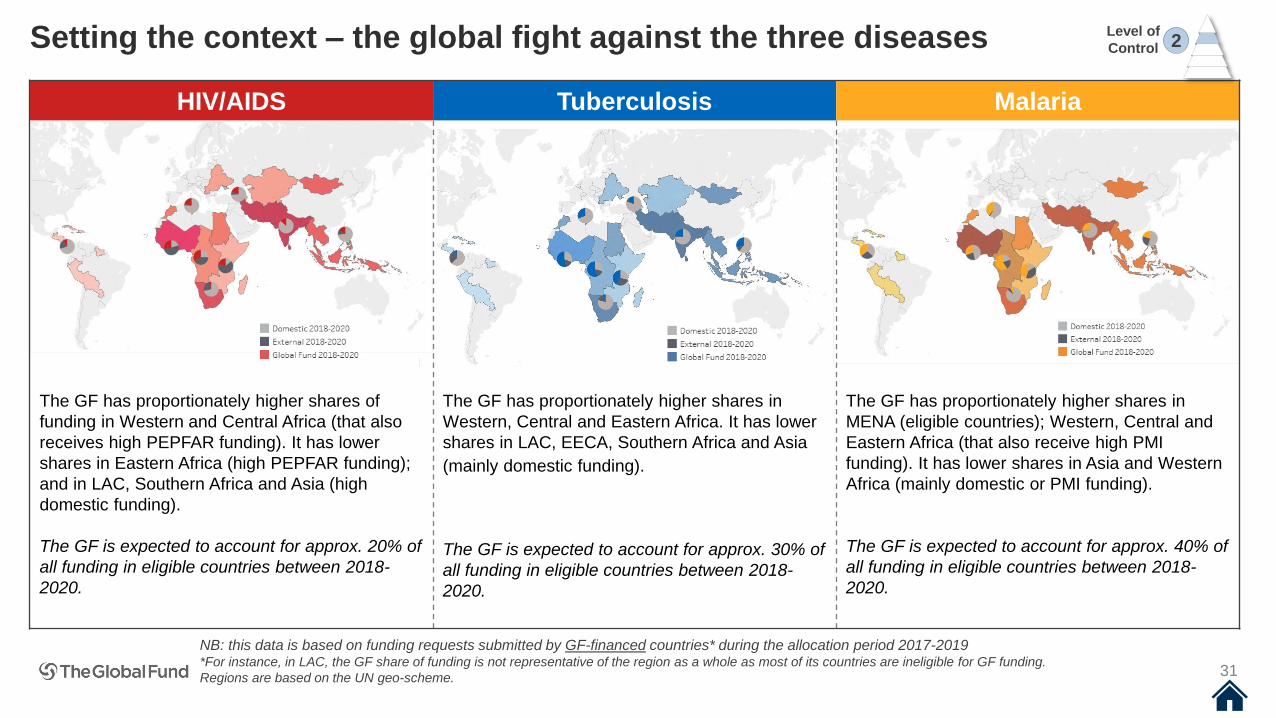
HIV/AIDS Tuberculosis Malaria
The GF has proportionately higher shares of
funding in Western and Central Africa (that also
receives high PEPFAR funding). It has lower
shares in Eastern Africa (high PEPFAR funding);
and in LAC, Southern Africa and Asia (high
domestic funding).
The GF is expected to account for approx. 20% of
all funding in eligible countries between 2018-
2020.
The GF has proportionately higher shares in
Western, Central and Eastern Africa. It has lower
shares in LAC, EECA, Southern Africa and Asia
(mainly domestic funding).
The GF is expected to account for approx. 30% of
all funding in eligible countries between 2018-
2020.
The GF has proportionately higher shares in
MENA (eligible countries); Western, Central and
Eastern Africa (that also receive high PMI
funding). It has lower shares in Asia and Western
Africa (mainly domestic or PMI funding).
The GF is expected to account for approx. 40% of
all funding in eligible countries between 2018-
2020.
Setting the context – the global fight against the three diseases Level of
Control 2
31
NB: this data is based on funding requests submitted by GF-financed countries* during the allocation period 2017-2019*For instance, in LAC, the GF share of funding is not representative of the region as a whole as most of its countries are ineligible for GF funding.
Regions are based on the UN geo-scheme.
32
Funding
Fundin
g
Measure Mid-2020 Result (as of March
2020)
Key takeaways
a) Actual pledges as a
percentage of the
Replenishment target, with
respect to the current
Replenishment period
b) Pledge conversion rate.
Actual replenishment
contributions as a percentage
of forecast contributions,
with respect to the current
Replenishment period
a) 101%
b) 100% • Both KPI 10a and 10b are on track similar to
prior cycles
• The 6th Replenishment has started out
strongly with both current pledges and
forecasted contributions meeting or exceeding
targets
• COVID-19 has not impacted current pledges
or conversion and the latest results include
one significant pledge from Germany
(+$165m) done in June in the context of
COVID-19
Target
a) 2020-2022: 100%
b) 2020-2022: 100%
33
Funding Design Implementation Results
Global Fund ResourcesKPI 10 – Resource mobilization
Level of
Control 4
Dec
2019
Jun
2020
Outstanding Adjusted Pledges Contribution Receivable Cash Received
Change in pledge conversion since last reporting
87%
70%
12%
21%
1%
9%
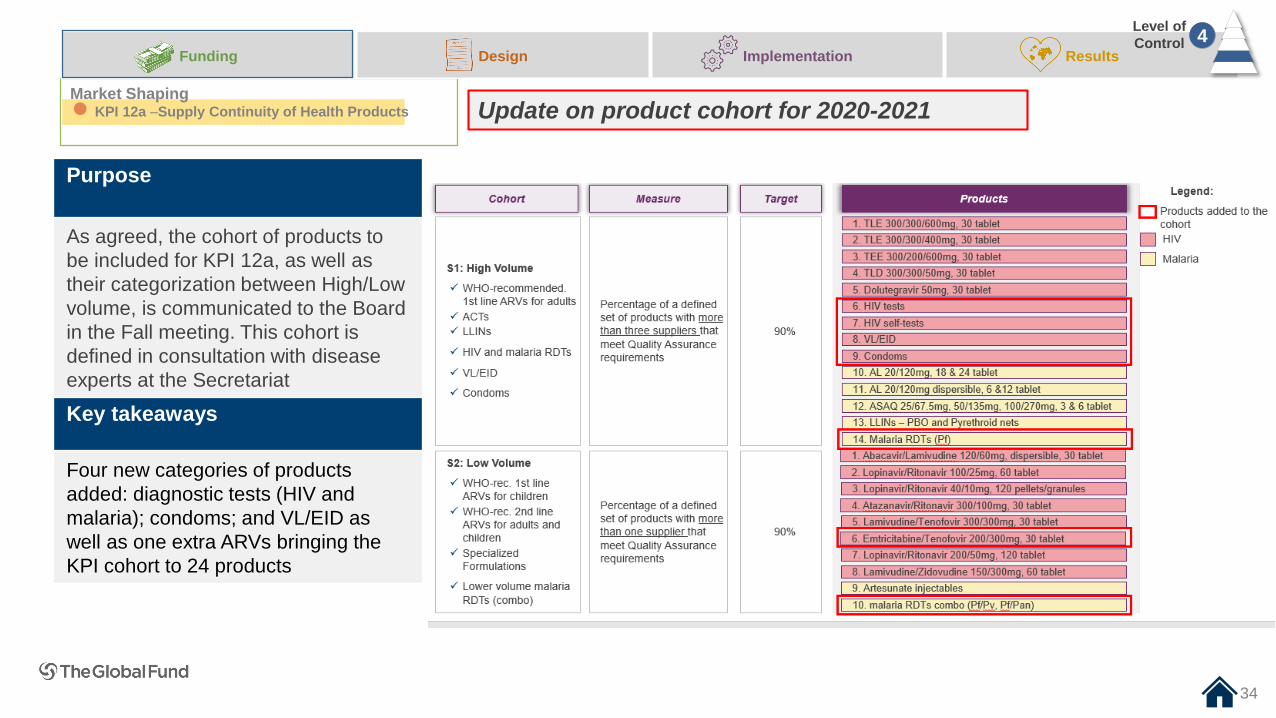
Market ShapingKPI 12a –Supply Continuity of Health Products
34
Funding Design Implementation Results
Level of
Control 4
Update on product cohort for 2020-2021
Purpose
As agreed, the cohort of products to
be included for KPI 12a, as well as
their categorization between High/Low
volume, is communicated to the Board
in the Fall meeting. This cohort is
defined in consultation with disease
experts at the Secretariat
Key takeaways
Four new categories of products
added: diagnostic tests (HIV and
malaria); condoms; and VL/EID as
well as one extra ARVs bringing the
KPI cohort to 24 products
35
Fundin
g
Design
Pro
gra
m D
esig
n
Funding Design Implementation Results
36**: KPI includes countries that received an allocation and had cumulative 2017-2019 grant expenses >0;
Excludes countries that received their entire allocation through a multi-country grant
Strategic FocusKPI 3 – Alignment of investment & need
Measure Mid 2020 Result
Alignment between investment
decisions and country disease
burden & economic capacity, as
defined by the country’s “Initial
Calculated Amount” in the 2017-
2019 allocation model
0.318
Target
2020: Less than or equal to 0.320
Key takeaways
• KPI is meeting target
• Recommending to use “disbursements” (actual + forecast)
instead of “grant expenses” (commitments) as more reliable
measure of investment decisions and of funds currently available
in country to finance activities. Overall result would be slightly
better, but they would also be significantly more reliable, with
more consistent patterns across years
• KPI metric (absolute difference of shares) highly driven by
countries with large share of “need”, i.e., by High Impact
countries, mainly India, Nigeria, Tanzania and South Africa.
• Recent progress driven by Mozambique, with better alignment in
recent funding decisions
Level of
Control 4
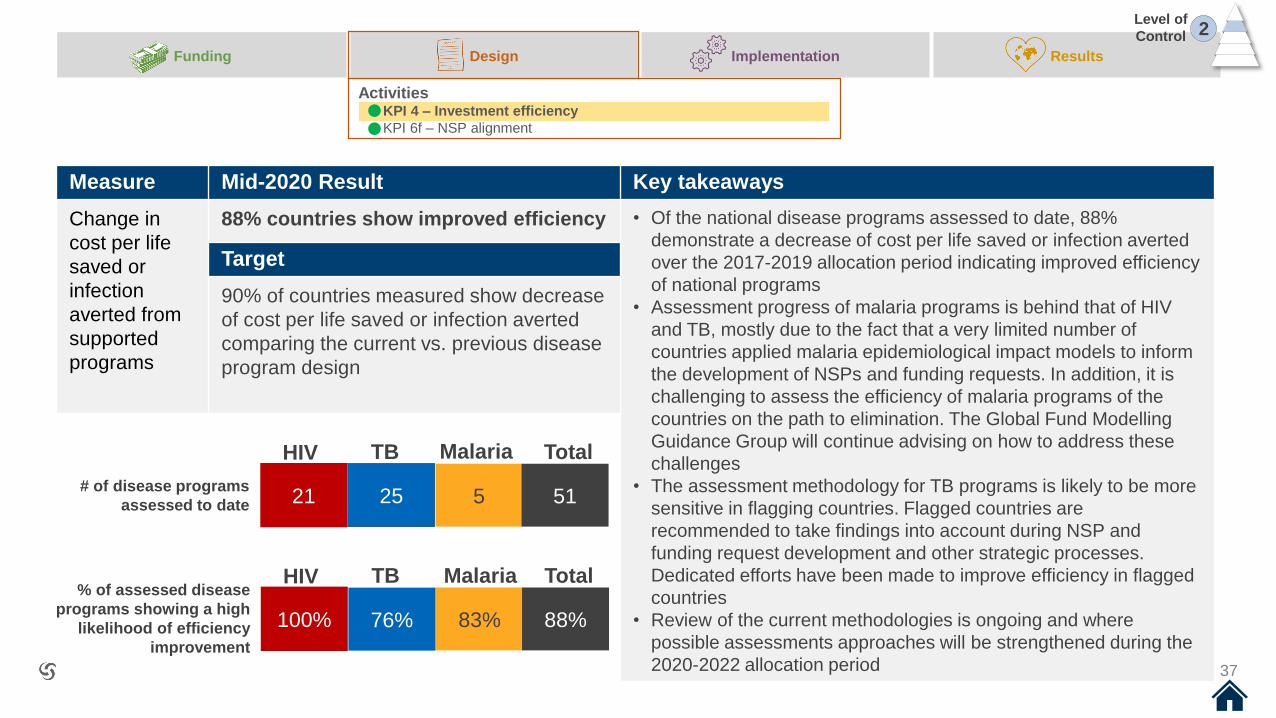
Measure Mid-2020 Result Key takeaways
Change in
cost per life
saved or
infection
averted from
supported
programs
88% countries show improved efficiency • Of the national disease programs assessed to date, 88%
demonstrate a decrease of cost per life saved or infection averted
over the 2017-2019 allocation period indicating improved efficiency
of national programs
• Assessment progress of malaria programs is behind that of HIV
and TB, mostly due to the fact that a very limited number of
countries applied malaria epidemiological impact models to inform
the development of NSPs and funding requests. In addition, it is
challenging to assess the efficiency of malaria programs of the
countries on the path to elimination. The Global Fund Modelling
Guidance Group will continue advising on how to address these
challenges
• The assessment methodology for TB programs is likely to be more
sensitive in flagging countries. Flagged countries are
recommended to take findings into account during NSP and
funding request development and other strategic processes.
Dedicated efforts have been made to improve efficiency in flagged
countries
• Review of the current methodologies is ongoing and where
possible assessments approaches will be strengthened during the
2020-2022 allocation period
Target
90% of countries measured show decrease
of cost per life saved or infection averted
comparing the current vs. previous disease
program design
Funding Design Implementation Results
37
ActivitiesKPI 4 – Investment efficiency
KPI 6f – NSP alignment
% of assessed disease
programs showing a high
likelihood of efficiency
improvement
# of disease programs
assessed to date
Level of
Control 2
21
HIV
25
TB
5
Malaria
51
Total
100%
HIV
76%
TB
83%
Malaria
88%
Total
56% 51%
42% 49%
Funding Design Implementation Results
38
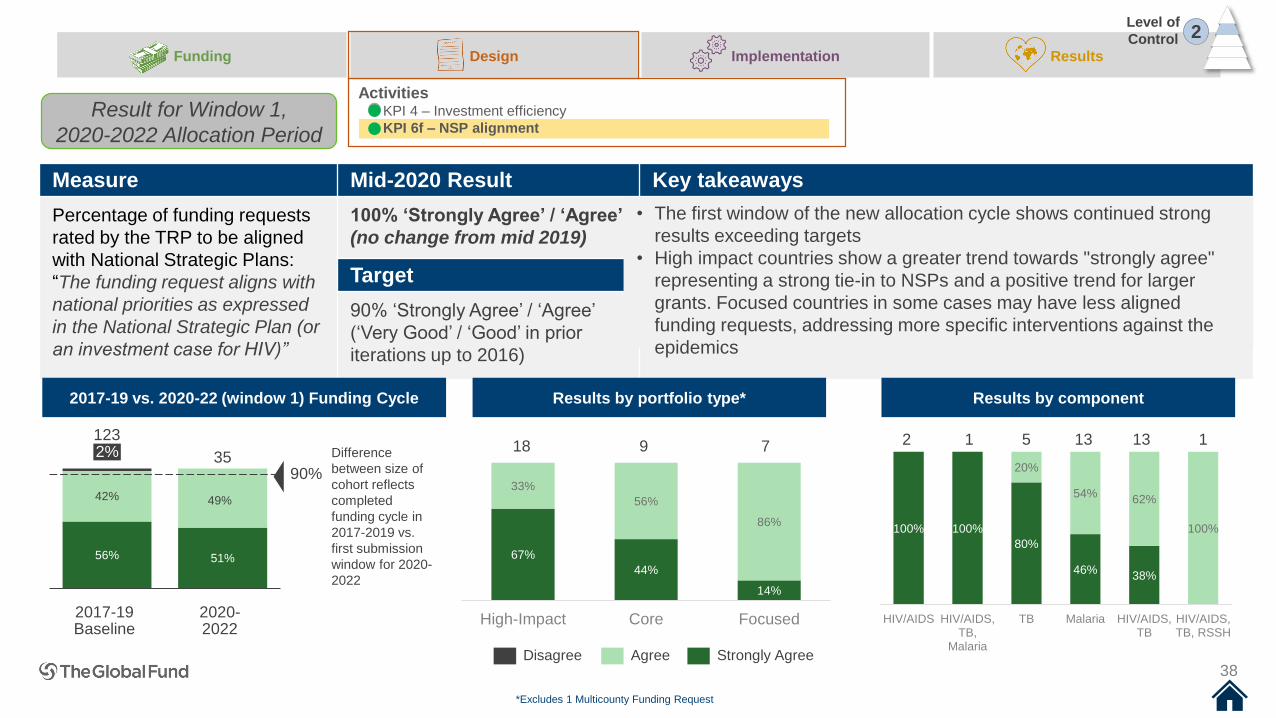
Measure Mid-2020 Result Key takeaways
Percentage of funding requests
rated by the TRP to be aligned
with National Strategic Plans:
“The funding request aligns with
national priorities as expressed
in the National Strategic Plan (or
an investment case for HIV)”
100% ‘Strongly Agree’ / ‘Agree’
(no change from mid 2019)
Target
90% ‘Strongly Agree’ / ‘Agree’
(‘Very Good’ / ‘Good’ in prior
iterations up to 2016)
2017-19 vs. 2020-22 (window 1) Funding Cycle
Difference
between size of
cohort reflects
completed
funding cycle in
2017-2019 vs.
first submission
window for 2020-
2022
• The first window of the new allocation cycle shows continued strong
results exceeding targets
• High impact countries show a greater trend towards "strongly agree"
representing a strong tie-in to NSPs and a positive trend for larger
grants. Focused countries in some cases may have less aligned
funding requests, addressing more specific interventions against the
epidemics
ActivitiesKPI 4 – Investment efficiency
KPI 6f – NSP alignment
90%
2%
2017-19Baseline
2020-2022
123
35
AgreeDisagree Strongly Agree
Level of
Control 2
Result for Window 1,
2020-2022 Allocation Period
Results by portfolio type* Results by component
*Excludes 1 Multicounty Funding Request
67%
44%
14%
33%
56%
86%
High-Impact Core Focused
100% 100%
80%
46%38%
20%
54%62%
100%
HIV/AIDS HIV/AIDS,TB,
Malaria
TB Malaria HIV/AIDS,TB
HIV/AIDS,TB, RSSH
18 9 7 2 1 5 13 13 1
39
Implementation
Imple
me
nta
tion
Funding Design Implementation Results
40
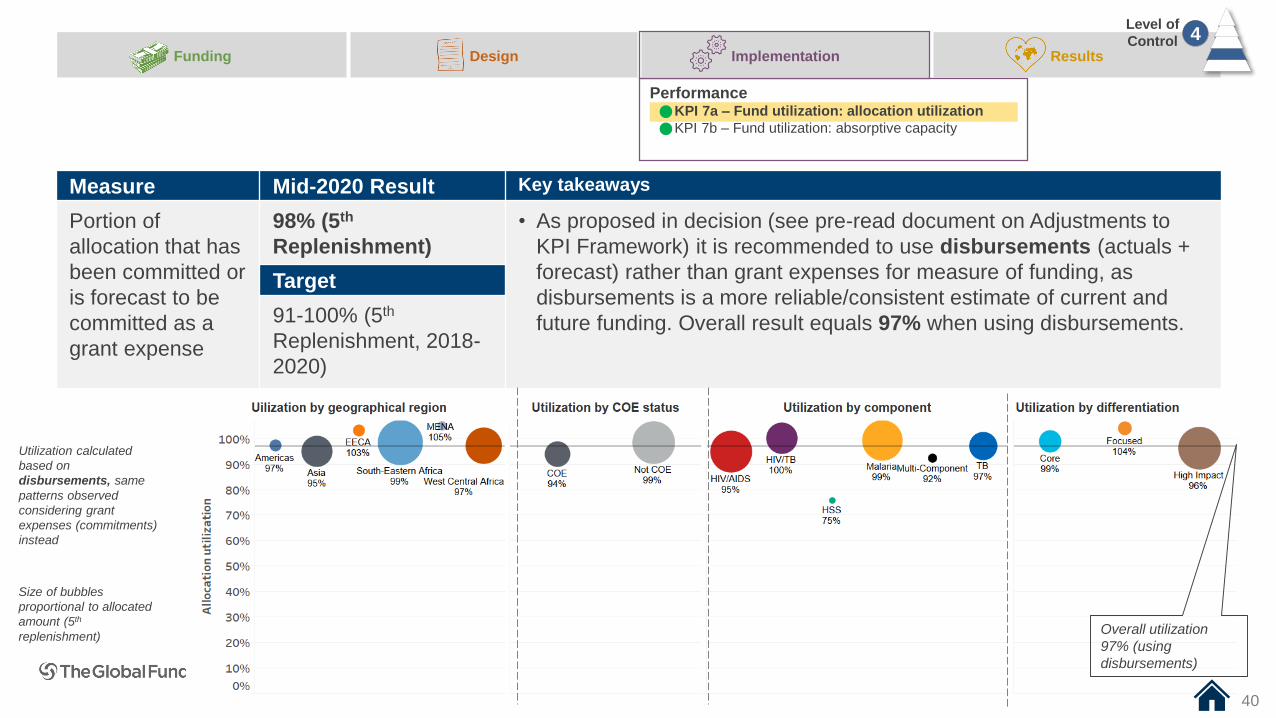
Measure Mid-2020 Result Key takeaways
Portion of
allocation that has
been committed or
is forecast to be
committed as a
grant expense
98% (5th
Replenishment)
• As proposed in decision (see pre-read document on Adjustments to
KPI Framework) it is recommended to use disbursements (actuals +
forecast) rather than grant expenses for measure of funding, as
disbursements is a more reliable/consistent estimate of current and
future funding. Overall result equals 97% when using disbursements.
Target
91-100% (5th
Replenishment, 2018-
2020)
PerformanceKPI 7a – Fund utilization: allocation utilization
KPI 7b – Fund utilization: absorptive capacity
Overall utilization
97% (using
disbursements)
Size of bubbles
proportional to allocated
amount (5th
replenishment)
Level of
Control 4
Utilization calculated
based on
disbursements, same
patterns observed
considering grant
expenses (commitments)
instead
Funding Design Implementation Results
PerformanceKPI 7a – Fund utilization: allocation utilization
KPI 7b – Fund utilization: absorptive capacity
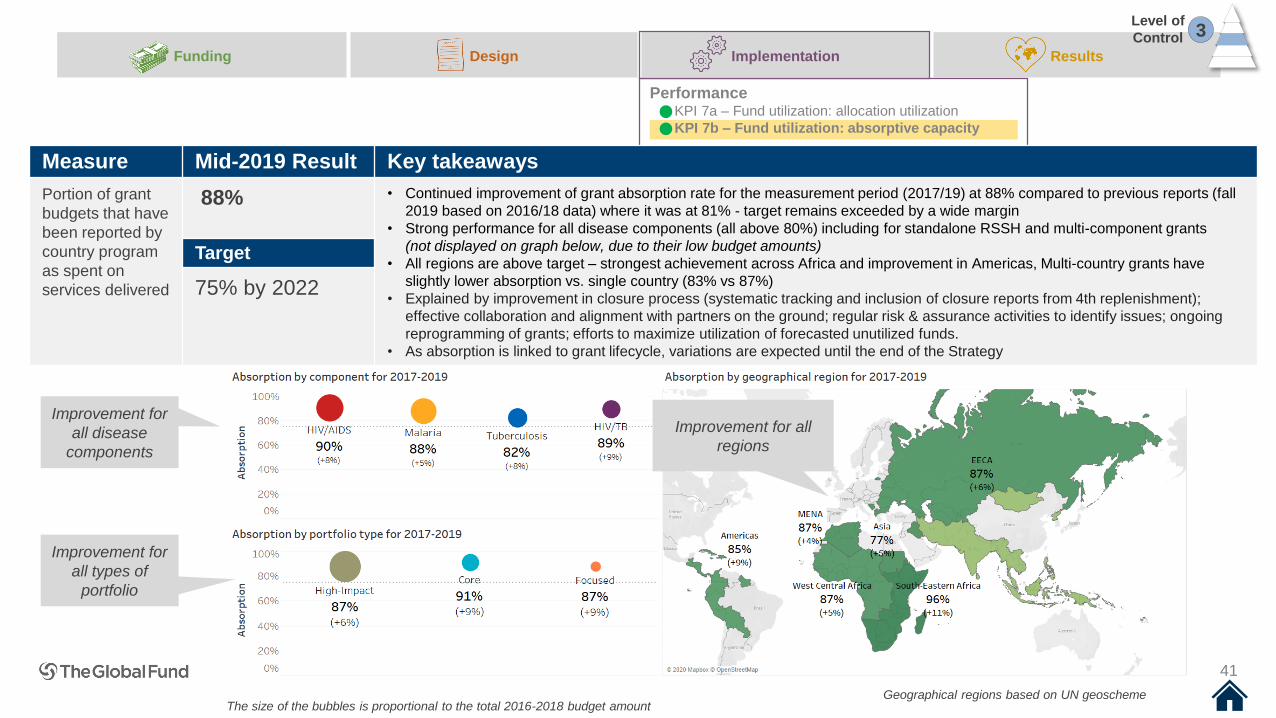
Measure Mid-2019 Result Key takeaways
Portion of grant
budgets that have
been reported by
country program
as spent on
services delivered
88% • Continued improvement of grant absorption rate for the measurement period (2017/19) at 88% compared to previous reports (fall
2019 based on 2016/18 data) where it was at 81% - target remains exceeded by a wide margin
• Strong performance for all disease components (all above 80%) including for standalone RSSH and multi-component grants
(not displayed on graph below, due to their low budget amounts)
• All regions are above target – strongest achievement across Africa and improvement in Americas, Multi-country grants have
slightly lower absorption vs. single country (83% vs 87%)
• Explained by improvement in closure process (systematic tracking and inclusion of closure reports from 4th replenishment);
effective collaboration and alignment with partners on the ground; regular risk & assurance activities to identify issues; ongoing
reprogramming of grants; efforts to maximize utilization of forecasted unutilized funds.
• As absorption is linked to grant lifecycle, variations are expected until the end of the Strategy
Target
75% by 2022
Improvement for
all types of
portfolio
Level of
Control 3
Improvement for
all disease
components
Improvement for all
regions
The size of the bubbles is proportional to the total 2016-2018 budget amountGeographical regions based on UN geoscheme
41
Funding Design Implementation Results
42
PerformanceKPI 7a – Fund utilization: allocation utilization
KPI 7b – Fund utilization: absorptive capacity
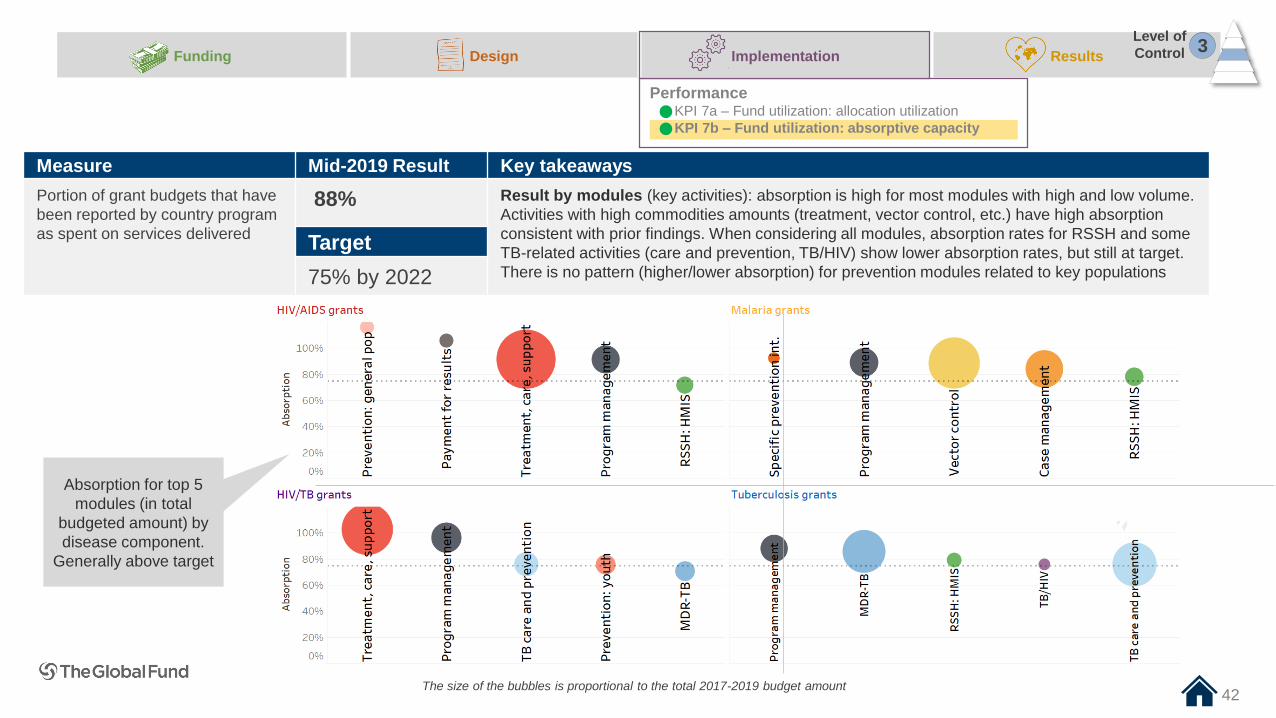
Measure Mid-2019 Result Key takeaways
Portion of grant budgets that have
been reported by country program
as spent on services delivered
88% Result by modules (key activities): absorption is high for most modules with high and low volume.
Activities with high commodities amounts (treatment, vector control, etc.) have high absorption
consistent with prior findings. When considering all modules, absorption rates for RSSH and some
TB-related activities (care and prevention, TB/HIV) show lower absorption rates, but still at target.
There is no pattern (higher/lower absorption) for prevention modules related to key populations
Target
75% by 2022
The size of the bubbles is proportional to the total 2017-2019 budget amount
Absorption for top 5
modules (in total
budgeted amount) by
disease component.
Generally above target
Level of
Control 3
Funding Design Implementation Results
43
PerformanceKPI 7a – Fund utilization: allocation utilization
KPI 7b – Fund utilization: absorptive capacity
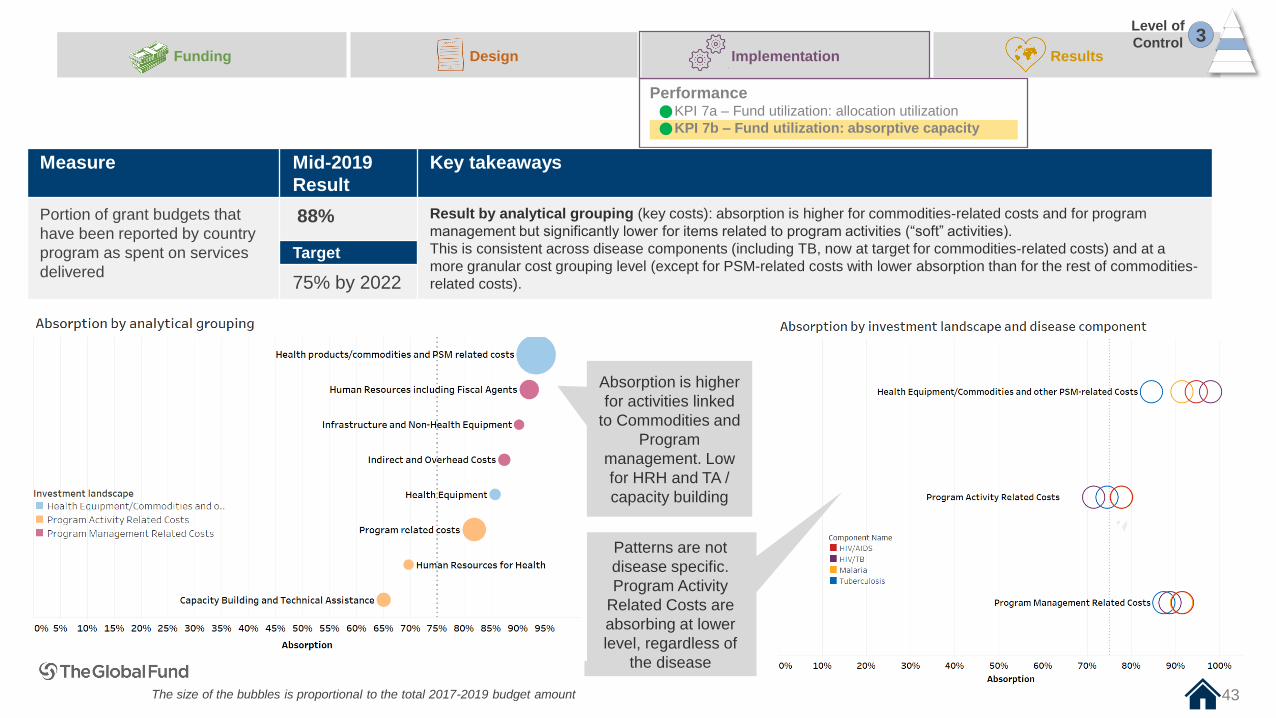
Measure Mid-2019
Result
Key takeaways
Portion of grant budgets that
have been reported by country
program as spent on services
delivered
88% Result by analytical grouping (key costs): absorption is higher for commodities-related costs and for program
management but significantly lower for items related to program activities (“soft” activities).
This is consistent across disease components (including TB, now at target for commodities-related costs) and at a
more granular cost grouping level (except for PSM-related costs with lower absorption than for the rest of commodities-
related costs).
Target
75% by 2022
The size of the bubbles is proportional to the total 2017-2019 budget amount
Level of
Control 3
Patterns are not
disease specific.
Program Activity
Related Costs are
absorbing at lower
level, regardless of
the disease
Absorption is higher
for activities linked
to Commodities and
Program
management. Low
for HRH and TA /
capacity building
44
FundingResults
Results
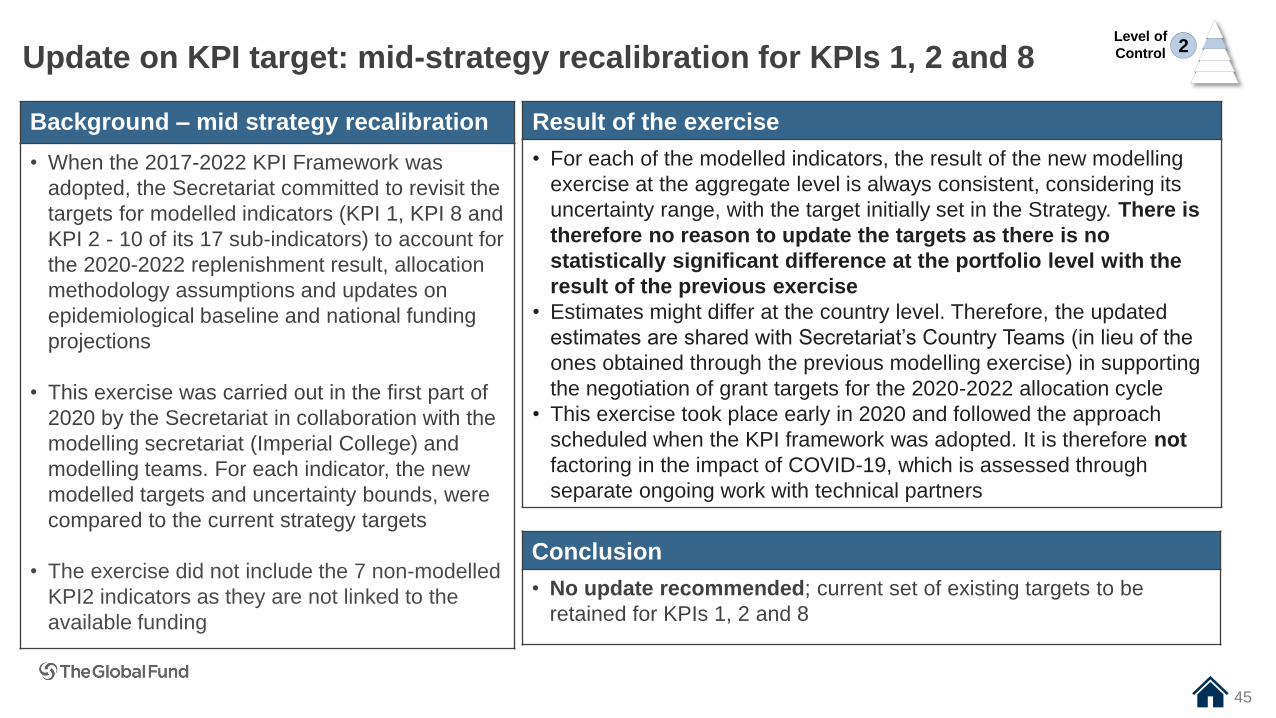
Update on KPI target: mid-strategy recalibration for KPIs 1, 2 and 8
45
Background – mid strategy recalibration
• When the 2017-2022 KPI Framework was
adopted, the Secretariat committed to revisit the
targets for modelled indicators (KPI 1, KPI 8 and
KPI 2 - 10 of its 17 sub-indicators) to account for
the 2020-2022 replenishment result, allocation
methodology assumptions and updates on
epidemiological baseline and national funding
projections
• This exercise was carried out in the first part of
2020 by the Secretariat in collaboration with the
modelling secretariat (Imperial College) and
modelling teams. For each indicator, the new
modelled targets and uncertainty bounds, were
compared to the current strategy targets
• The exercise did not include the 7 non-modelled
KPI2 indicators as they are not linked to the
available funding
Result of the exercise
• For each of the modelled indicators, the result of the new modelling
exercise at the aggregate level is always consistent, considering its
uncertainty range, with the target initially set in the Strategy. There is
therefore no reason to update the targets as there is no
statistically significant difference at the portfolio level with the
result of the previous exercise
• Estimates might differ at the country level. Therefore, the updated
estimates are shared with Secretariat’s Country Teams (in lieu of the
ones obtained through the previous modelling exercise) in supporting
the negotiation of grant targets for the 2020-2022 allocation cycle
• This exercise took place early in 2020 and followed the approach
scheduled when the KPI framework was adopted. It is therefore not
factoring in the impact of COVID-19, which is assessed through
separate ongoing work with technical partners
Conclusion
• No update recommended; current set of existing targets to be
retained for KPIs 1, 2 and 8
Level of
Control 2
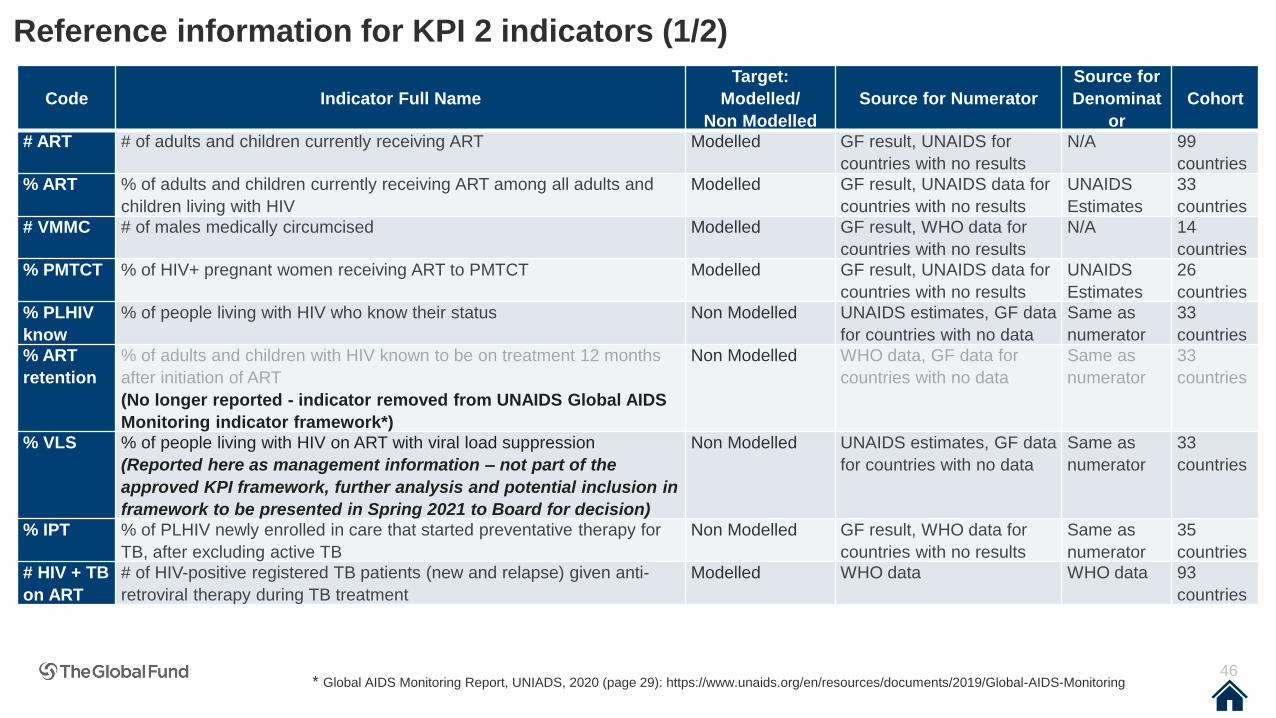
Reference information for KPI 2 indicators (1/2)
46
Code Indicator Full Name
Target:
Modelled/
Non Modelled
Source for Numerator
Source for
Denominat
or
Cohort
# ART # of adults and children currently receiving ART Modelled GF result, UNAIDS for
countries with no results
N/A 99
countries
% ART % of adults and children currently receiving ART among all adults and
children living with HIV
Modelled GF result, UNAIDS data for
countries with no results
UNAIDS
Estimates
33
countries
# VMMC # of males medically circumcised Modelled GF result, WHO data for
countries with no results
N/A 14
countries
% PMTCT % of HIV+ pregnant women receiving ART to PMTCT Modelled GF result, UNAIDS data for
countries with no results
UNAIDS
Estimates
26
countries
% PLHIV
know
% of people living with HIV who know their status Non Modelled UNAIDS estimates, GF data
for countries with no data
Same as
numerator
33
countries
% ART
retention
% of adults and children with HIV known to be on treatment 12 months
after initiation of ART
(No longer reported - indicator removed from UNAIDS Global AIDS
Monitoring indicator framework*)
Non Modelled WHO data, GF data for
countries with no data
Same as
numerator
33
countries
% VLS % of people living with HIV on ART with viral load suppression
(Reported here as management information – not part of the
approved KPI framework, further analysis and potential inclusion in
framework to be presented in Spring 2021 to Board for decision)
Non Modelled UNAIDS estimates, GF data
for countries with no data
Same as
numerator
33
countries
% IPT % of PLHIV newly enrolled in care that started preventative therapy for
TB, after excluding active TB
Non Modelled GF result, WHO data for
countries with no results
Same as
numerator
35
countries
# HIV + TB
on ART
# of HIV-positive registered TB patients (new and relapse) given anti-
retroviral therapy during TB treatment
Modelled WHO data WHO data 93
countries
* Global AIDS Monitoring Report, UNIADS, 2020 (page 29): https://www.unaids.org/en/resources/documents/2019/Global-AIDS-Monitoring
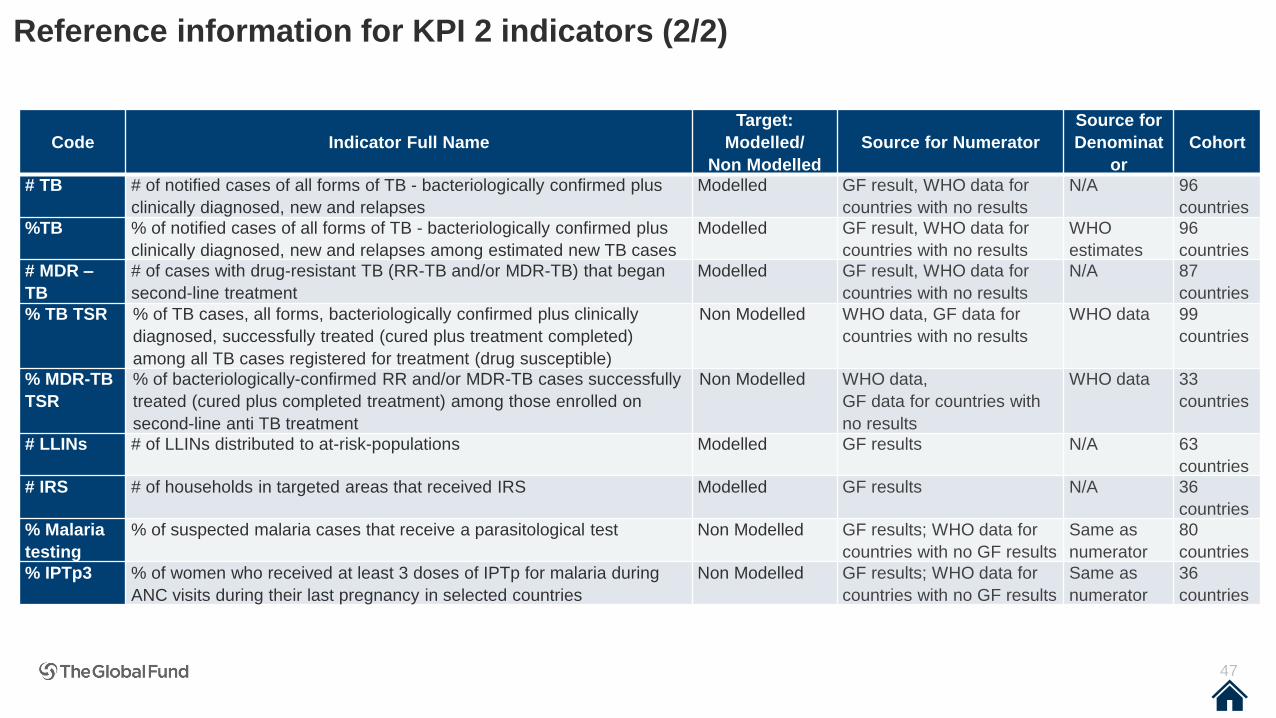
Reference information for KPI 2 indicators (2/2)
47
Code Indicator Full Name
Target:
Modelled/
Non Modelled
Source for Numerator
Source for
Denominat
or
Cohort
# TB # of notified cases of all forms of TB - bacteriologically confirmed plus
clinically diagnosed, new and relapses
Modelled GF result, WHO data for
countries with no results
N/A 96
countries
%TB % of notified cases of all forms of TB - bacteriologically confirmed plus
clinically diagnosed, new and relapses among estimated new TB cases
Modelled GF result, WHO data for
countries with no results
WHO
estimates
96
countries
# MDR –
TB
# of cases with drug-resistant TB (RR-TB and/or MDR-TB) that began
second-line treatment
Modelled GF result, WHO data for
countries with no results
N/A 87
countries
% TB TSR % of TB cases, all forms, bacteriologically confirmed plus clinically
diagnosed, successfully treated (cured plus treatment completed)
among all TB cases registered for treatment (drug susceptible)
Non Modelled WHO data, GF data for
countries with no results
WHO data 99
countries
% MDR-TB
TSR
% of bacteriologically-confirmed RR and/or MDR-TB cases successfully
treated (cured plus completed treatment) among those enrolled on
second-line anti TB treatment
Non Modelled WHO data,
GF data for countries with
no results
WHO data 33
countries
# LLINs # of LLINs distributed to at-risk-populations Modelled GF results N/A 63
countries
# IRS # of households in targeted areas that received IRS Modelled GF results N/A 36
countries
% Malaria
testing
% of suspected malaria cases that receive a parasitological test Non Modelled GF results; WHO data for
countries with no GF results
Same as
numerator
80
countries
% IPTp3 % of women who received at least 3 doses of IPTp for malaria during
ANC visits during their last pregnancy in selected countries
Non Modelled GF results; WHO data for
countries with no GF results
Same as
numerator
36
countries

Funding Design Implementation Results
Maximize impact against HIV, TB, MalariaKPI 2 – Performance against service delivery targets
KPI 5 – Service coverage for key populations
On track, at
least for lower
bound of
uncertainty
range
At risk
Off track
Summary of KPI 2 results and projections* to achieving 2022 targets
*Projections based
on best available
data and will be
updated with new
grant targets in the
next cycle and with
grant performance
**Compared to
domestic
funding and
other
international
funding. (See
mid-2018
Strategic
Performance
Report)
Indicator Strategy target
(See document related to KPI framework updates for discussion on mid-strategy recalibration)
Latest Result
Highprojection assumes grant targets will be fully reached
Low projection (only applies for
modelled indicators)
based on current performance remaining stable
GF level of
funding**
HIV
/AID
S
% PLHIV know 33 countries for which 80% PLHIV know their status 19 countries
# ART 23 million 20.5 million Medium
% ART 78% 67% Medium
# VMMC 22 million 12.2 million Low
% PMTCT 96% 86% Low
% ART retention 33 countries for which 90% PLHIV known to be on treatment 12 months after initiation of ART
HIV
/TB # HIV+TB on ART 2.7 million 1.1 million Low
% IPT 35 countries for which 80% of PLHIV newly enrolled in care started preventative therapy for TB 8 countries
TB
# TB 33 million 17 million High
% TB 73% 67% High
% TB TSR 99 countries for which 90% of TB cases successfully treated 65 countries
# MDR-TB 920 thousand 335 thousand High
% MDR-TB TSR 33 countries for which 85% of RR and/or MDR-TB cases successfully treated 6 countries
Ma
lari
a
# LLINS 1350 million 488 million High
# IRS 250 million 23 million Low
% Malaria testing 80 countries for which 90% of suspected malaria cases received a parasitological test 69 countries
% IPTp3 36 countries for which 70% of women received at least 3 doses of IPT for malaria during ANC visits 8 countries 48
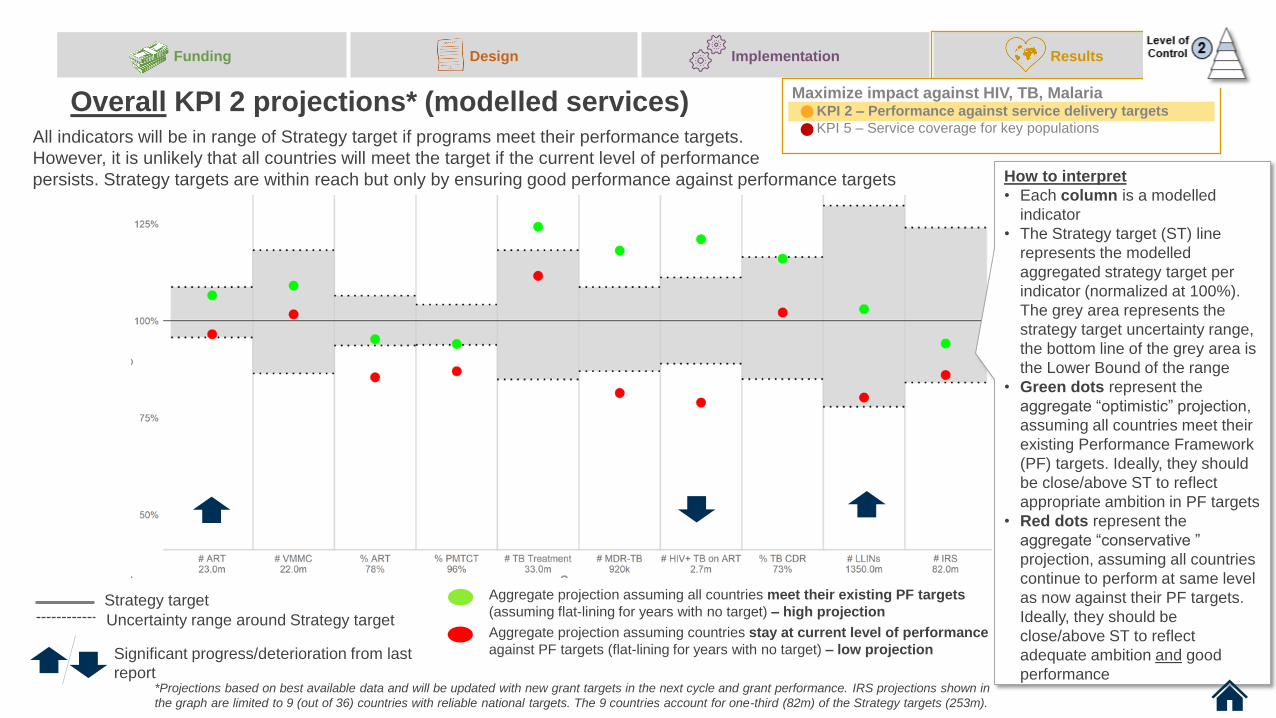
49
Funding Design Implementation Results
Overall KPI 2 projections* (modelled services)
Strategy target
Uncertainty range around Strategy target
Aggregate projection assuming all countries meet their existing PF targets
(assuming flat-lining for years with no target) – high projection
Aggregate projection assuming countries stay at current level of performance
against PF targets (flat-lining for years with no target) – low projection
All indicators will be in range of Strategy target if programs meet their performance targets.
However, it is unlikely that all countries will meet the target if the current level of performance
persists. Strategy targets are within reach but only by ensuring good performance against performance targets
*Projections based on best available data and will be updated with new grant targets in the next cycle and grant performance. IRS projections shown in
the graph are limited to 9 (out of 36) countries with reliable national targets. The 9 countries account for one-third (82m) of the Strategy targets (253m).
Maximize impact against HIV, TB, MalariaKPI 2 – Performance against service delivery targets
KPI 5 – Service coverage for key populations
Significant progress/deterioration from last
report
How to interpret
• Each column is a modelled
indicator
• The Strategy target (ST) line
represents the modelled
aggregated strategy target per
indicator (normalized at 100%).
The grey area represents the
strategy target uncertainty range,
the bottom line of the grey area is
the Lower Bound of the range
• Green dots represent the
aggregate “optimistic” projection,
assuming all countries meet their
existing Performance Framework
(PF) targets. Ideally, they should
be close/above ST to reflect
appropriate ambition in PF targets
• Red dots represent the
aggregate “conservative ”
projection, assuming all countries
continue to perform at same level
as now against their PF targets.
Ideally, they should be
close/above ST to reflect
adequate ambition and good
performance
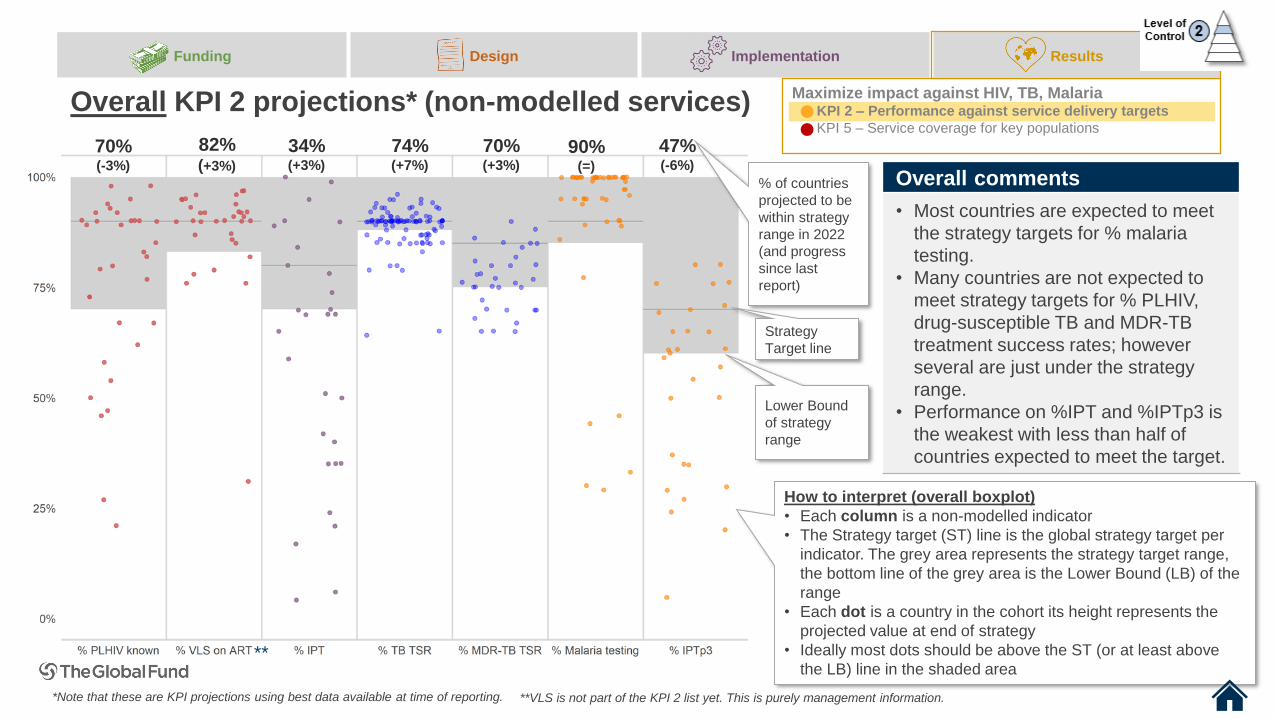
50
Funding Design Implementation Results
Overall KPI 2 projections* (non-modelled services) Maximize impact against HIV, TB, MalariaKPI 2 – Performance against service delivery targets
KPI 5 – Service coverage for key populations
Overall comments
• Most countries are expected to meet
the strategy targets for % malaria
testing.
• Many countries are not expected to
meet strategy targets for % PLHIV,
drug-susceptible TB and MDR-TB
treatment success rates; however
several are just under the strategy
range.
• Performance on %IPT and %IPTp3 is
the weakest with less than half of
countries expected to meet the target.
*Note that these are KPI projections using best data available at time of reporting.
Strategy
Target line
Lower Bound
of strategy
range
How to interpret (overall boxplot)
• Each column is a non-modelled indicator
• The Strategy target (ST) line is the global strategy target per
indicator. The grey area represents the strategy target range,
the bottom line of the grey area is the Lower Bound (LB) of the
range
• Each dot is a country in the cohort its height represents the
projected value at end of strategy
• Ideally most dots should be above the ST (or at least above
the LB) line in the shaded area
70%(-3%)
82%(+3%)
34%(+3%)
74%(+7%)
70%(+3%)
90%(=)
47%(-6%)
% of countries
projected to be
within strategy
range in 2022
(and progress
since last
report)
**
**VLS is not part of the KPI 2 list yet. This is purely management information.
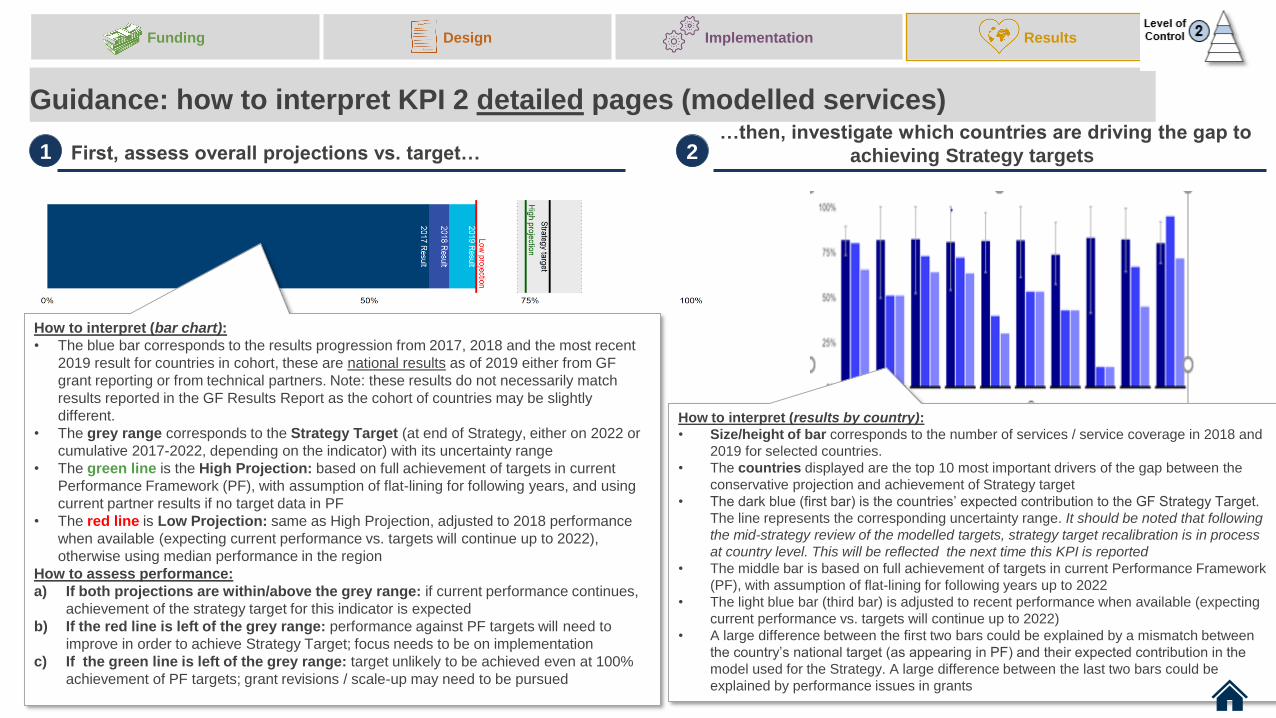
51
How to interpret (bar chart):
• The blue bar corresponds to the results progression from 2017, 2018 and the most recent
2019 result for countries in cohort, these are national results as of 2019 either from GF
grant reporting or from technical partners. Note: these results do not necessarily match
results reported in the GF Results Report as the cohort of countries may be slightly
different.
• The grey range corresponds to the Strategy Target (at end of Strategy, either on 2022 or
cumulative 2017-2022, depending on the indicator) with its uncertainty range
• The green line is the High Projection: based on full achievement of targets in current
Performance Framework (PF), with assumption of flat-lining for following years, and using
current partner results if no target data in PF
• The red line is Low Projection: same as High Projection, adjusted to 2018 performance
when available (expecting current performance vs. targets will continue up to 2022),
otherwise using median performance in the region
How to assess performance:
a) If both projections are within/above the grey range: if current performance continues,
achievement of the strategy target for this indicator is expected
b) If the red line is left of the grey range: performance against PF targets will need to
improve in order to achieve Strategy Target; focus needs to be on implementation
c) If the green line is left of the grey range: target unlikely to be achieved even at 100%
achievement of PF targets; grant revisions / scale-up may need to be pursued
First, assess overall projections vs. target…
Guidance: how to interpret KPI 2 detailed pages (modelled services)…then, investigate which countries are driving the gap to
achieving Strategy targets 1 2
Funding Design Implementation Results
51
How to interpret (results by country):
• Size/height of bar corresponds to the number of services / service coverage in 2018 and
2019 for selected countries.
• The countries displayed are the top 10 most important drivers of the gap between the
conservative projection and achievement of Strategy target
• The dark blue (first bar) is the countries’ expected contribution to the GF Strategy Target.
The line represents the corresponding uncertainty range. It should be noted that following
the mid-strategy review of the modelled targets, strategy target recalibration is in process
at country level. This will be reflected the next time this KPI is reported
• The middle bar is based on full achievement of targets in current Performance Framework
(PF), with assumption of flat-lining for following years up to 2022
• The light blue bar (third bar) is adjusted to recent performance when available (expecting
current performance vs. targets will continue up to 2022)
• A large difference between the first two bars could be explained by a mismatch between
the country’s national target (as appearing in PF) and their expected contribution in the
model used for the Strategy. A large difference between the last two bars could be
explained by performance issues in grants
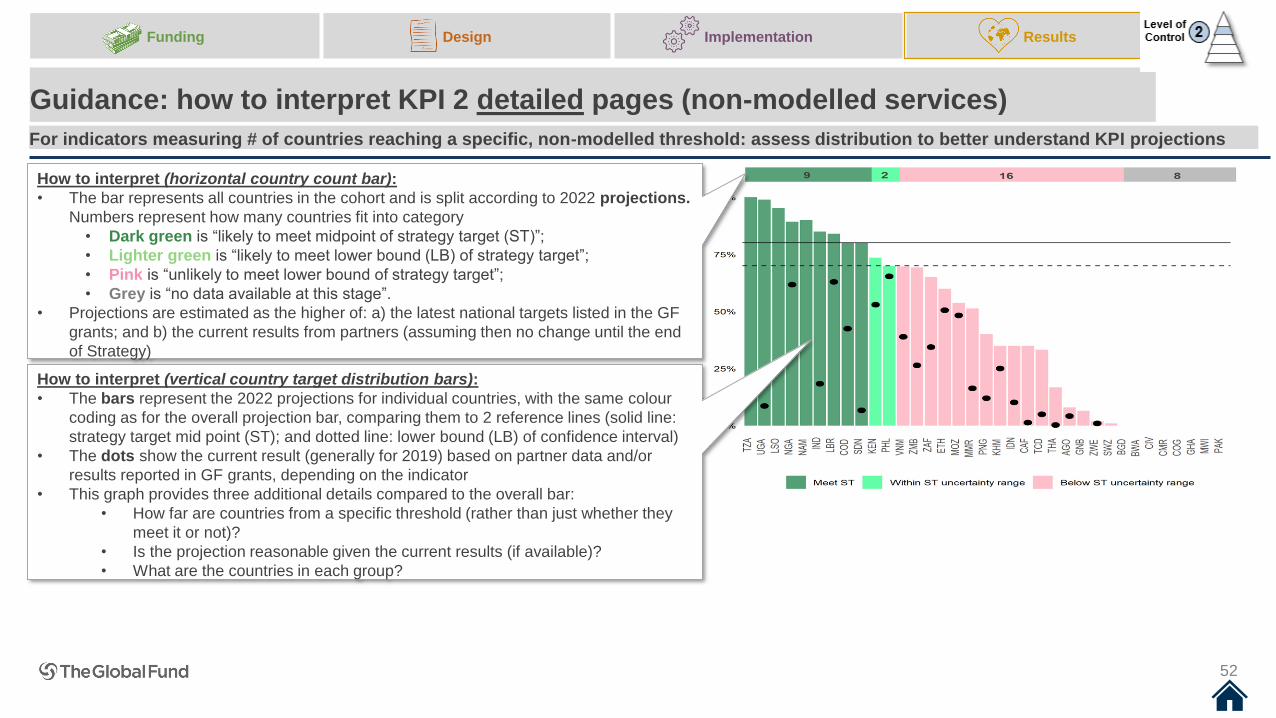
How to interpret (horizontal country count bar):
• The bar represents all countries in the cohort and is split according to 2022 projections.
Numbers represent how many countries fit into category
• Dark green is “likely to meet midpoint of strategy target (ST)”;
• Lighter green is “likely to meet lower bound (LB) of strategy target”;
• Pink is “unlikely to meet lower bound of strategy target”;
• Grey is “no data available at this stage”.
• Projections are estimated as the higher of: a) the latest national targets listed in the GF
grants; and b) the current results from partners (assuming then no change until the end
of Strategy)
For indicators measuring # of countries reaching a specific, non-modelled threshold: assess distribution to better understand KPI projections
Guidance: how to interpret KPI 2 detailed pages (non-modelled services)
How to interpret (vertical country target distribution bars):
• The bars represent the 2022 projections for individual countries, with the same colour
coding as for the overall projection bar, comparing them to 2 reference lines (solid line:
strategy target mid point (ST); and dotted line: lower bound (LB) of confidence interval)
• The dots show the current result (generally for 2019) based on partner data and/or
results reported in GF grants, depending on the indicator
• This graph provides three additional details compared to the overall bar:
• How far are countries from a specific threshold (rather than just whether they
meet it or not)?
• Is the projection reasonable given the current results (if available)?
• What are the countries in each group?
Funding Design Implementation Results
52
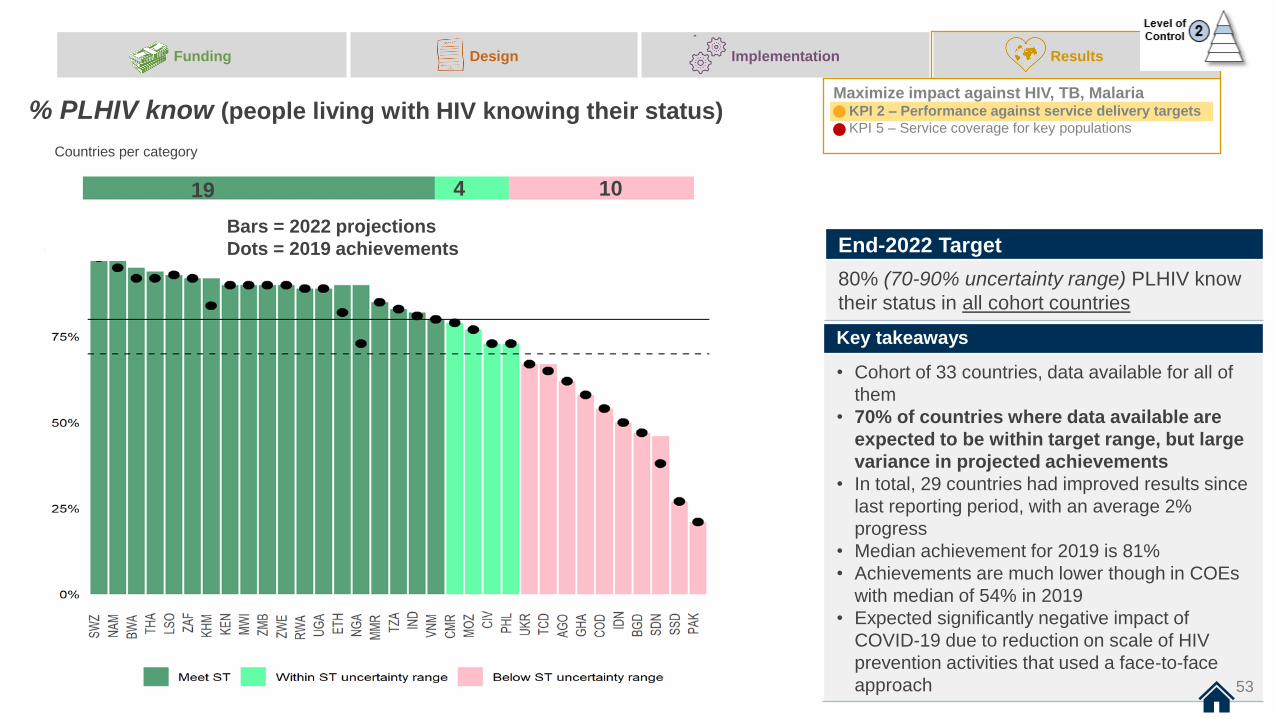
53
Funding Design Implementation Results
Key takeaways
• Cohort of 33 countries, data available for all of
them
• 70% of countries where data available are
expected to be within target range, but large
variance in projected achievements
• In total, 29 countries had improved results since
last reporting period, with an average 2%
progress
• Median achievement for 2019 is 81%
• Achievements are much lower though in COEs
with median of 54% in 2019
• Expected significantly negative impact of
COVID-19 due to reduction on scale of HIV
prevention activities that used a face-to-face
approach
% PLHIV know (people living with HIV knowing their status)Maximize impact against HIV, TB, Malaria
KPI 2 – Performance against service delivery targets
KPI 5 – Service coverage for key populations
End-2022 Target
80% (70-90% uncertainty range) PLHIV know
their status in all cohort countries
Bars = 2022 projections
Dots = 2019 achievements
Countries per category
19 4 10
53

54
Funding Design Implementation Results
# ART (patients on ART)
*KPI 2 results are based on a slightly different cohort of countries than the GF Results Report, so figures are not expected to
match perfectly
**Projections sensitive to updates in people living with HIV population estimates
Key takeaways
• Cohort composed of 99 countries
• Aggregate PF targets in line with strategy,
achievement of 2022 target looks likely with
continuing good performance and achievement of
targets
• Overall good grant performance against their own targets
across portfolio (median: 93%) with distribution of
performance slightly improving in most countries from
2018 to 2019
• The gap between the 2022 low projection and Strategy
target is mainly driven by Nigeria and Indonesia.
• Projections highly dependent on updates to PLHIV
population estimates. Contribution of Nigeria to the
Strategy target is based on outdated country prevalence
estimates; the size of population living with HIV is
estimated to be much lower than the assumption used by
the initial model. The gap to Strategy target might
therefore be overestimated for Nigeria. This will be
reassessed in next year’s report, when the recalibrated
country strategy contributions will be used
2022 projections**2019 results*
Maximize impact against HIV, TB, MalariaKPI 2 – Performance against service delivery targets
KPI 5 – Service coverage for key populations
End-2022 Target
23M (22-25M uncertainty range) adults and
children currently receiving ART
At the end of 2019 for countries in the Strategy, there were 20.5 M adults and children
receiving ART
Results for countries driving the gap between Low projection and Strategy targets
54
NGA IDN MYS PNG IND PHL VNM PAK CMR TCD
Contribution to 2022 Strategy target
2022 High projection (based on full achievement of grant targets)
2022 Low projection (based on recent performance)
Top 10 countries by
contribution to 2022
Strategy target
1 ZAF
2 NGA
3 IND
4 UGA
5 MOZ
6 KEN
7 TZA
8 ZMB
9 ZWE
10 MWI
Represents current estimated total population living with HIV in Nigeria, based
on most recent prevalence survey
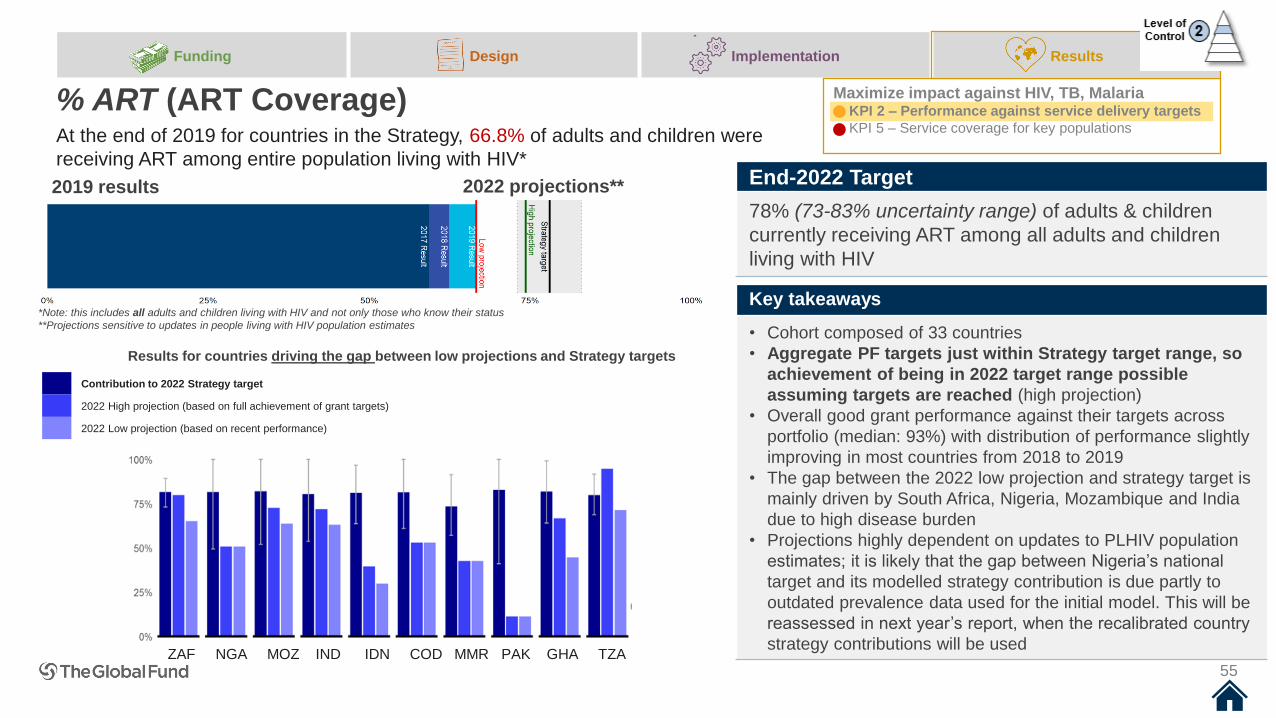
55
Funding Design Implementation Results
% ART (ART Coverage)
Key takeaways
• Cohort composed of 33 countries
• Aggregate PF targets just within Strategy target range, so
achievement of being in 2022 target range possible
assuming targets are reached (high projection)
• Overall good grant performance against their targets across
portfolio (median: 93%) with distribution of performance slightly
improving in most countries from 2018 to 2019
• The gap between the 2022 low projection and strategy target is
mainly driven by South Africa, Nigeria, Mozambique and India
due to high disease burden
• Projections highly dependent on updates to PLHIV population
estimates; it is likely that the gap between Nigeria’s national
target and its modelled strategy contribution is due partly to
outdated prevalence data used for the initial model. This will be
reassessed in next year’s report, when the recalibrated country
strategy contributions will be used
2022 projections**2019 results
Maximize impact against HIV, TB, MalariaKPI 2 – Performance against service delivery targets
KPI 5 – Service coverage for key populations
End-2022 Target
78% (73-83% uncertainty range) of adults & children
currently receiving ART among all adults and children
living with HIV
At the end of 2019 for countries in the Strategy, 66.8% of adults and children were
receiving ART among entire population living with HIV*
*Note: this includes all adults and children living with HIV and not only those who know their status
**Projections sensitive to updates in people living with HIV population estimates
Results for countries driving the gap between low projections and Strategy targets
ZAF NGA MOZ IND IDN COD MMR PAK GHA TZA
Contribution to 2022 Strategy target
2022 High projection (based on full achievement of grant targets)
2022 Low projection (based on recent performance)
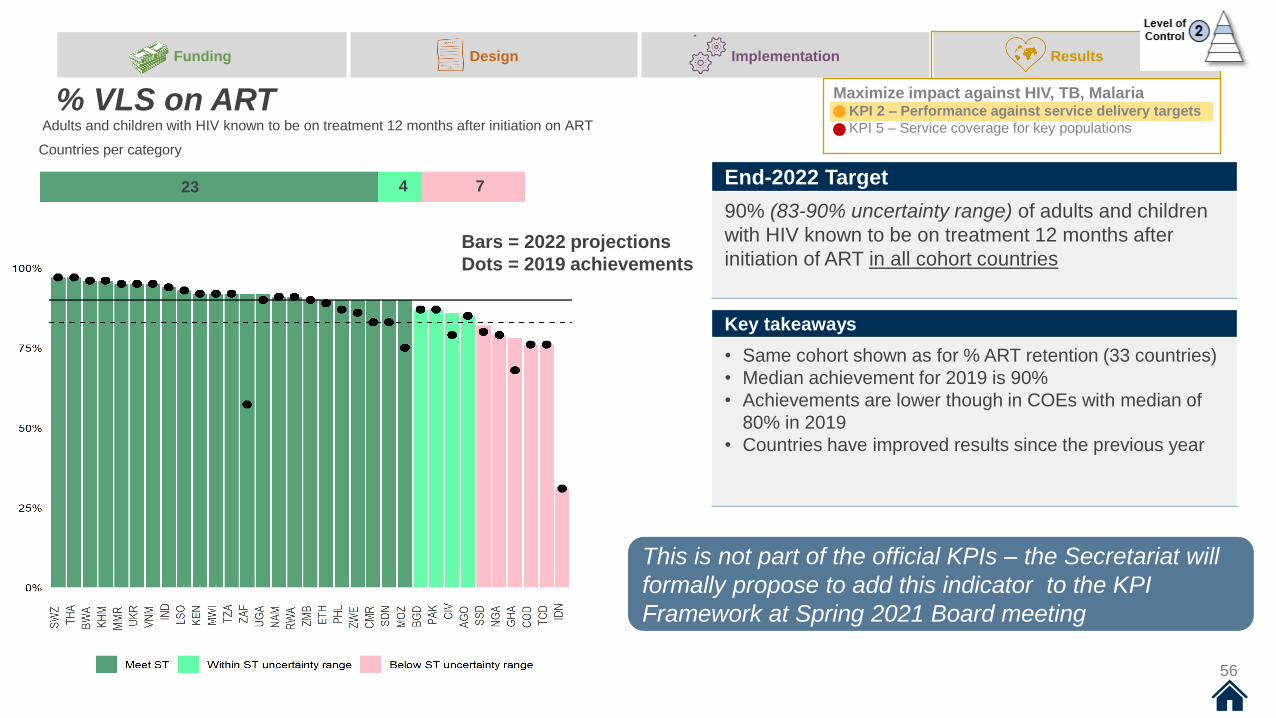
23 4 7
56
Funding Design Implementation Results
% VLS on ART
Key takeaways
• Same cohort shown as for % ART retention (33 countries)
• Median achievement for 2019 is 90%
• Achievements are lower though in COEs with median of
80% in 2019
• Countries have improved results since the previous year
Maximize impact against HIV, TB, MalariaKPI 2 – Performance against service delivery targets
KPI 5 – Service coverage for key populations
End-2022 Target
90% (83-90% uncertainty range) of adults and children
with HIV known to be on treatment 12 months after
initiation of ART in all cohort countries
Countries per category
Adults and children with HIV known to be on treatment 12 months after initiation on ART
This is not part of the official KPIs – the Secretariat will
formally propose to add this indicator to the KPI
Framework at Spring 2021 Board meeting
Bars = 2022 projections
Dots = 2019 achievements
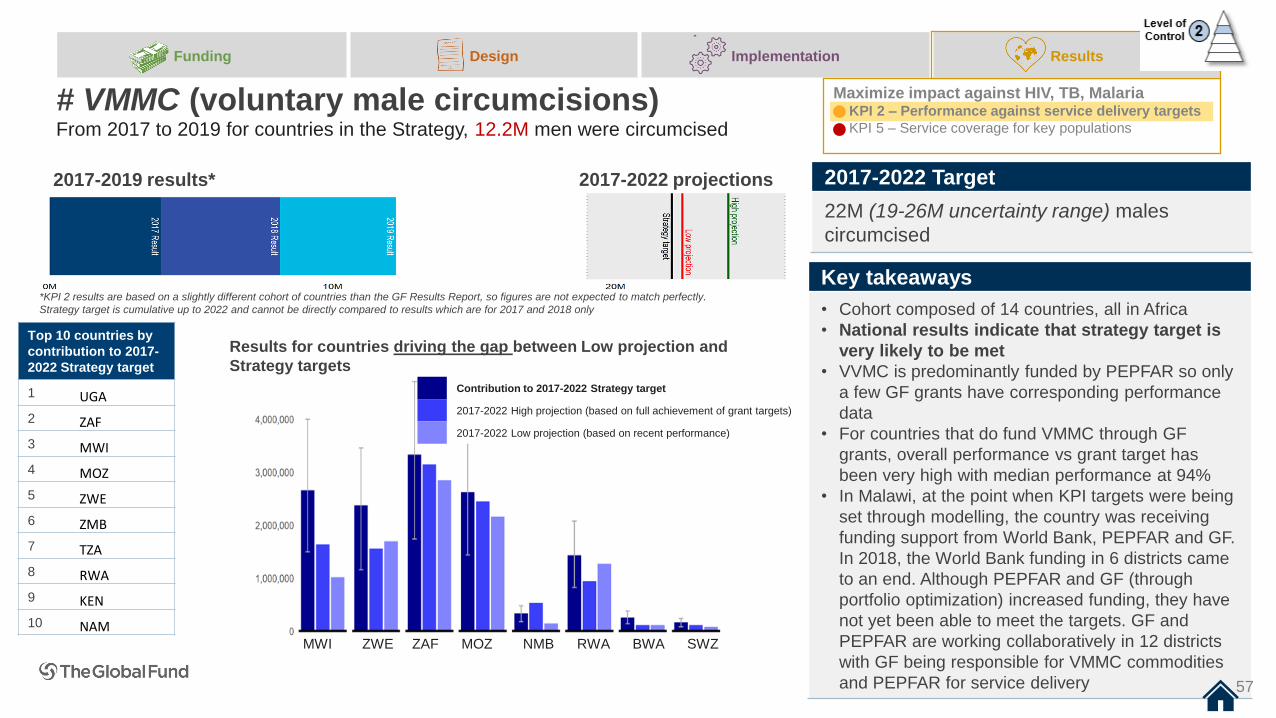
From 2017 to 2019 for countries in the Strategy, 12.2M men were circumcised
57
Funding Design Implementation Results
# VMMC (voluntary male circumcisions)
*KPI 2 results are based on a slightly different cohort of countries than the GF Results Report, so figures are not expected to match perfectly.
Strategy target is cumulative up to 2022 and cannot be directly compared to results which are for 2017 and 2018 only
Key takeaways
• Cohort composed of 14 countries, all in Africa
• National results indicate that strategy target is
very likely to be met
• VVMC is predominantly funded by PEPFAR so only
a few GF grants have corresponding performance
data
• For countries that do fund VMMC through GF
grants, overall performance vs grant target has
been very high with median performance at 94%
• In Malawi, at the point when KPI targets were being
set through modelling, the country was receiving
funding support from World Bank, PEPFAR and GF.
In 2018, the World Bank funding in 6 districts came
to an end. Although PEPFAR and GF (through
portfolio optimization) increased funding, they have
not yet been able to meet the targets. GF and
PEPFAR are working collaboratively in 12 districts
with GF being responsible for VMMC commodities
and PEPFAR for service delivery
Maximize impact against HIV, TB, MalariaKPI 2 – Performance against service delivery targets
KPI 5 – Service coverage for key populations
2017-2022 Target
22M (19-26M uncertainty range) males
circumcised
2017-2019 results* 2017-2022 projections
Results for countries driving the gap between Low projection and
Strategy targets
Contribution to 2017-2022 Strategy target
2017-2022 High projection (based on full achievement of grant targets)
2017-2022 Low projection (based on recent performance)
MWI ZWE ZAF MOZ NMB RWA BWA SWZ
Top 10 countries by
contribution to 2017-
2022 Strategy target
1 UGA
2 ZAF
3 MWI
4 MOZ
5 ZWE
6 ZMB
7 TZA
8 RWA
9 KEN
10 NAM
57
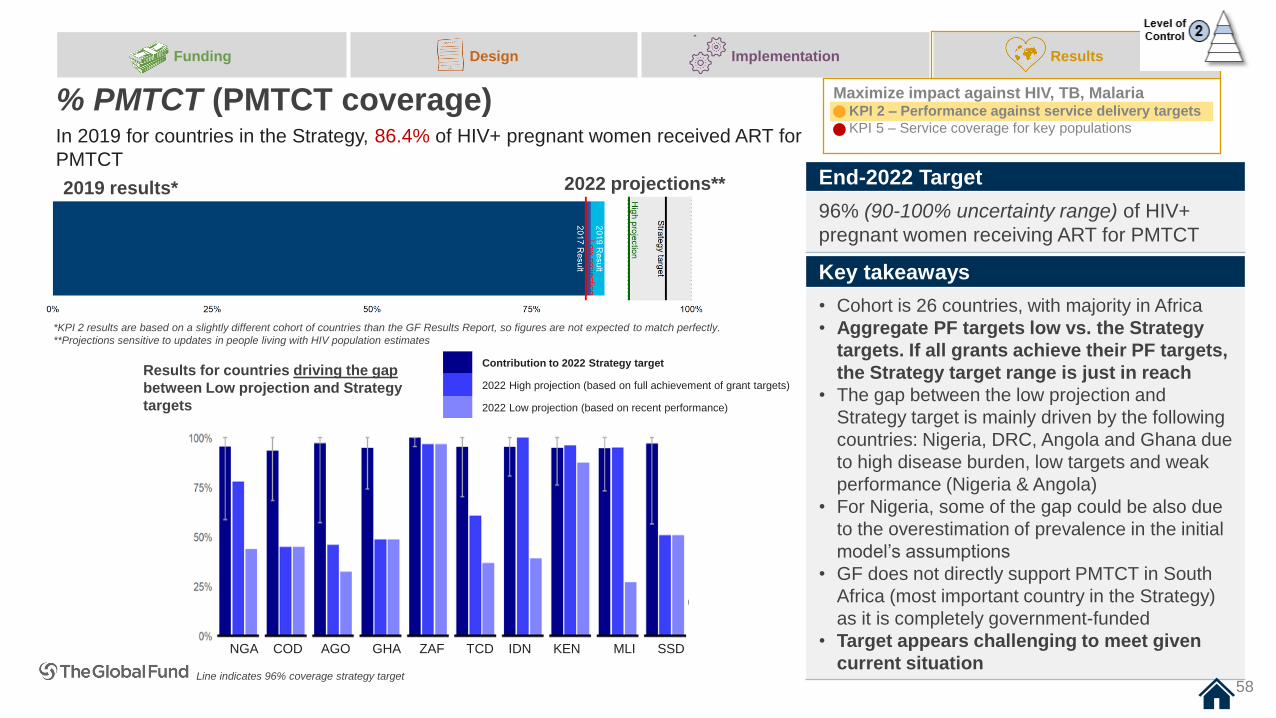
Contribution to 2022 Strategy target
2022 High projection (based on full achievement of grant targets)
2022 Low projection (based on recent performance)
58
Funding Design Implementation Results
% PMTCT (PMTCT coverage)
Key takeaways
• Cohort is 26 countries, with majority in Africa
• Aggregate PF targets low vs. the Strategy
targets. If all grants achieve their PF targets,
the Strategy target range is just in reach
• The gap between the low projection and
Strategy target is mainly driven by the following
countries: Nigeria, DRC, Angola and Ghana due
to high disease burden, low targets and weak
performance (Nigeria & Angola)
• For Nigeria, some of the gap could be also due
to the overestimation of prevalence in the initial
model’s assumptions
• GF does not directly support PMTCT in South
Africa (most important country in the Strategy)
as it is completely government-funded
• Target appears challenging to meet given
current situation
Maximize impact against HIV, TB, MalariaKPI 2 – Performance against service delivery targets
KPI 5 – Service coverage for key populations
End-2022 Target
96% (90-100% uncertainty range) of HIV+
pregnant women receiving ART for PMTCT
*KPI 2 results are based on a slightly different cohort of countries than the GF Results Report, so figures are not expected to match perfectly.
**Projections sensitive to updates in people living with HIV population estimates
2019 results* 2022 projections**
In 2019 for countries in the Strategy, 86.4% of HIV+ pregnant women received ART for
PMTCT
Line indicates 96% coverage strategy target58
NGA COD AGO GHA ZAF TCD IDN KEN MLI SSD
Results for countries driving the gap
between Low projection and Strategy
targets
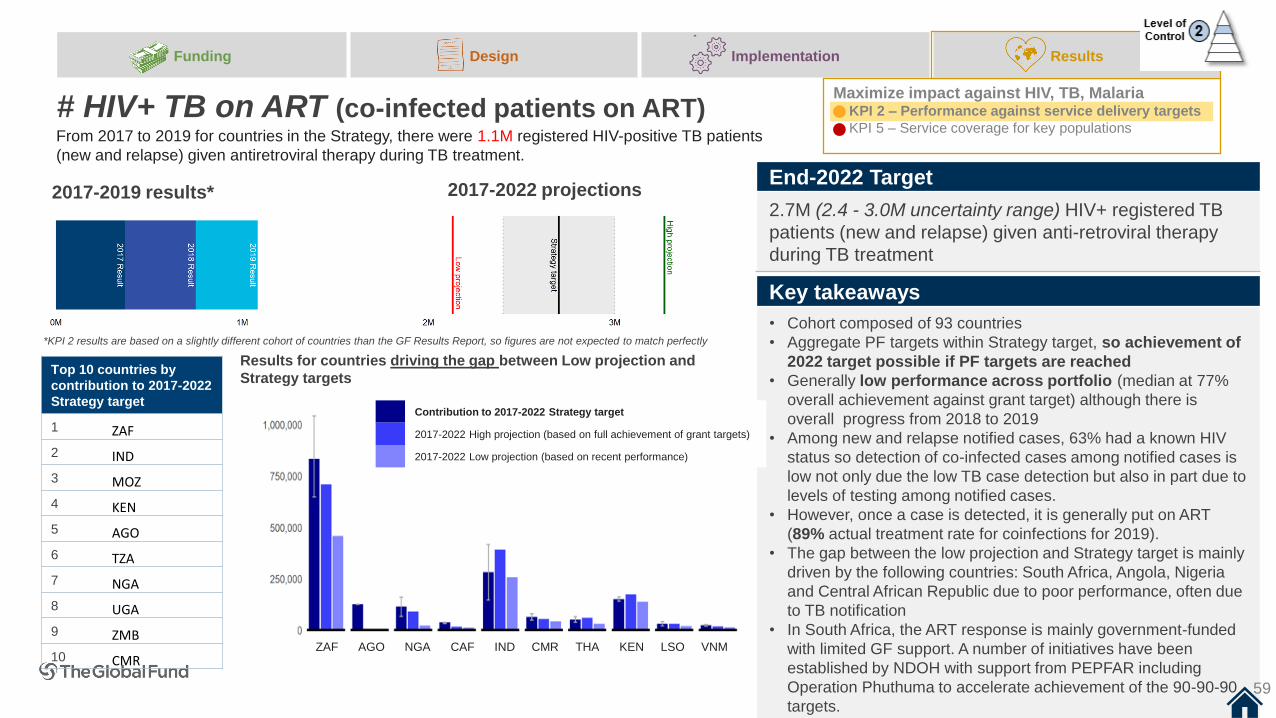
ZAF AGO NGA CAF IND CMR THA KEN LSO VNM
From 2017 to 2019 for countries in the Strategy, there were 1.1M registered HIV-positive TB patients
(new and relapse) given antiretroviral therapy during TB treatment.
59
Funding Design Implementation Results
# HIV+ TB on ART (co-infected patients on ART)
Key takeaways
• Cohort composed of 93 countries
• Aggregate PF targets within Strategy target, so achievement of
2022 target possible if PF targets are reached
• Generally low performance across portfolio (median at 77%
overall achievement against grant target) although there is
overall progress from 2018 to 2019
• Among new and relapse notified cases, 63% had a known HIV
status so detection of co-infected cases among notified cases is
low not only due the low TB case detection but also in part due to
levels of testing among notified cases.
• However, once a case is detected, it is generally put on ART
(89% actual treatment rate for coinfections for 2019).
• The gap between the low projection and Strategy target is mainly
driven by the following countries: South Africa, Angola, Nigeria
and Central African Republic due to poor performance, often due
to TB notification
• In South Africa, the ART response is mainly government-funded
with limited GF support. A number of initiatives have been
established by NDOH with support from PEPFAR including
Operation Phuthuma to accelerate achievement of the 90-90-90
targets.
2017-2022 projections2017-2019 results*
Maximize impact against HIV, TB, MalariaKPI 2 – Performance against service delivery targets
KPI 5 – Service coverage for key populations
End-2022 Target
2.7M (2.4 - 3.0M uncertainty range) HIV+ registered TB
patients (new and relapse) given anti-retroviral therapy
during TB treatment
MENA 23%
*KPI 2 results are based on a slightly different cohort of countries than the GF Results Report, so figures are not expected to match perfectly
59
Results for countries driving the gap between Low projection and
Strategy targets
Contribution to 2017-2022 Strategy target
2017-2022 High projection (based on full achievement of grant targets)
2017-2022 Low projection (based on recent performance)
Top 10 countries by
contribution to 2017-2022
Strategy target
1 ZAF
2 IND
3 MOZ
4 KEN
5 AGO
6 TZA
7 NGA
8 UGA
9 ZMB
10 CMR
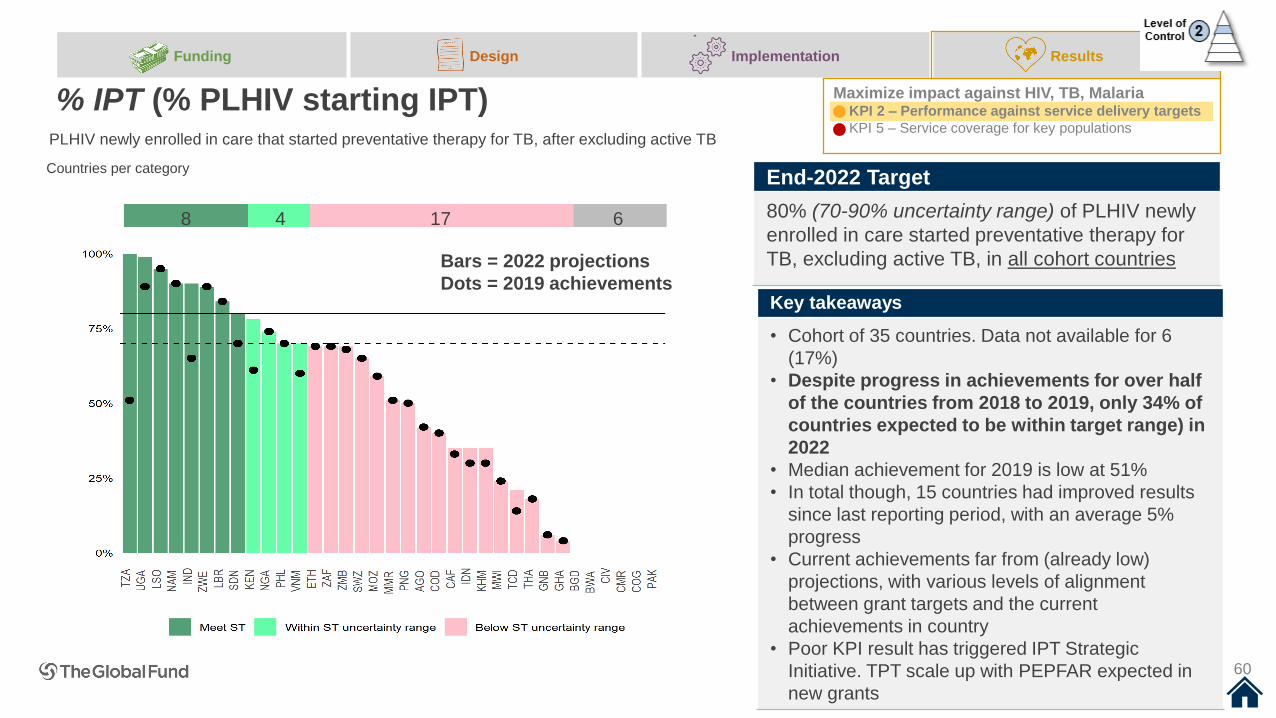
8 4 17 6
60
Funding Design Implementation Results
% IPT (% PLHIV starting IPT)
Key takeaways
• Cohort of 35 countries. Data not available for 6
(17%)
• Despite progress in achievements for over half
of the countries from 2018 to 2019, only 34% of
countries expected to be within target range) in
2022
• Median achievement for 2019 is low at 51%
• In total though, 15 countries had improved results
since last reporting period, with an average 5%
progress
• Current achievements far from (already low)
projections, with various levels of alignment
between grant targets and the current
achievements in country
• Poor KPI result has triggered IPT Strategic
Initiative. TPT scale up with PEPFAR expected in
new grants
Maximize impact against HIV, TB, MalariaKPI 2 – Performance against service delivery targets
KPI 5 – Service coverage for key populations
End-2022 Target
80% (70-90% uncertainty range) of PLHIV newly
enrolled in care started preventative therapy for
TB, excluding active TB, in all cohort countries
Countries per category
PLHIV newly enrolled in care that started preventative therapy for TB, after excluding active TB
Bars = 2022 projections
Dots = 2019 achievements
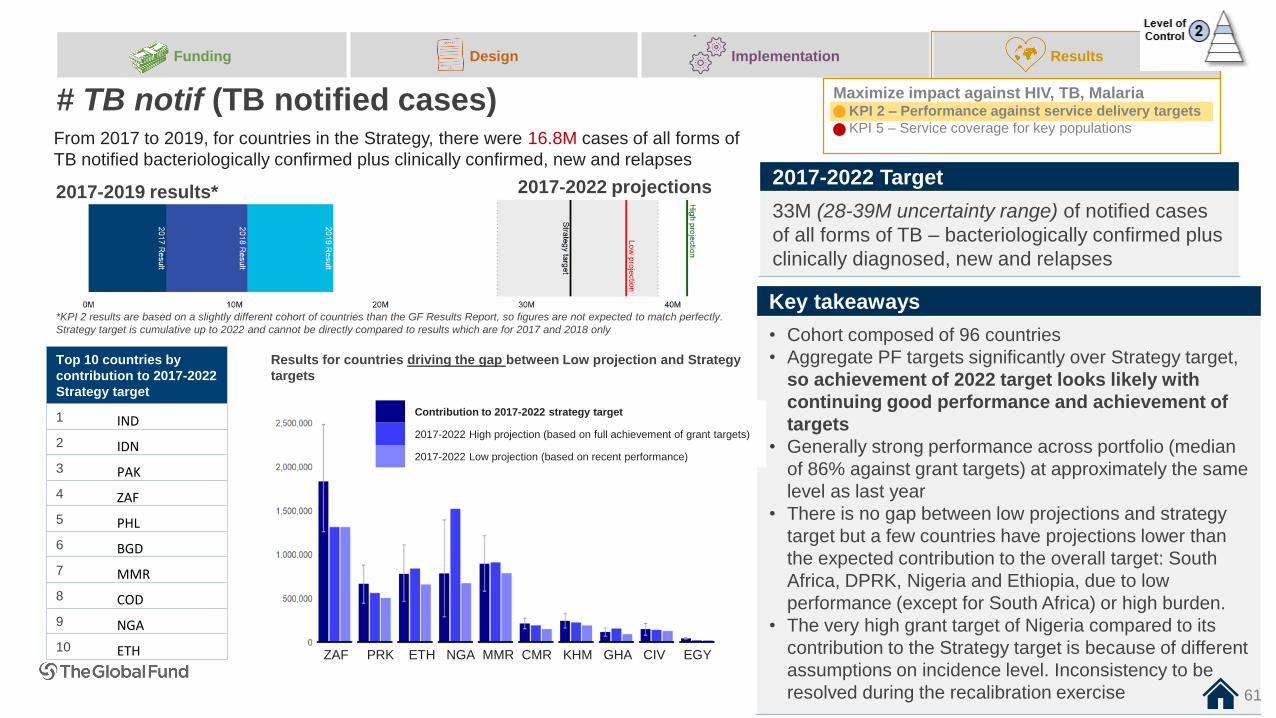
ZAF PRK ETH NGA MMR CMR KHM GHA CIV EGY
From 2017 to 2019, for countries in the Strategy, there were 16.8M cases of all forms of
TB notified bacteriologically confirmed plus clinically confirmed, new and relapses
61
Funding Design Implementation Results
# TB notif (TB notified cases)
Key takeaways
• Cohort composed of 96 countries
• Aggregate PF targets significantly over Strategy target,
so achievement of 2022 target looks likely with
continuing good performance and achievement of
targets
• Generally strong performance across portfolio (median
of 86% against grant targets) at approximately the same
level as last year
• There is no gap between low projections and strategy
target but a few countries have projections lower than
the expected contribution to the overall target: South
Africa, DPRK, Nigeria and Ethiopia, due to low
performance (except for South Africa) or high burden.
• The very high grant target of Nigeria compared to its
contribution to the Strategy target is because of different
assumptions on incidence level. Inconsistency to be
resolved during the recalibration exercise
2017-2022 projections2017-2019 results*
Maximize impact against HIV, TB, MalariaKPI 2 – Performance against service delivery targets
KPI 5 – Service coverage for key populations
2017-2022 Target
33M (28-39M uncertainty range) of notified cases
of all forms of TB – bacteriologically confirmed plus
clinically diagnosed, new and relapses
*KPI 2 results are based on a slightly different cohort of countries than the GF Results Report, so figures are not expected to match perfectly.
Strategy target is cumulative up to 2022 and cannot be directly compared to results which are for 2017 and 2018 only
Results for countries driving the gap between Low projection and Strategy
targets
Contribution to 2017-2022 strategy target
2017-2022 High projection (based on full achievement of grant targets)
2017-2022 Low projection (based on recent performance)
Top 10 countries by
contribution to 2017-2022
Strategy target
1 IND
2 IDN
3 PAK
4 ZAF
5 PHL
6 BGD
7 MMR
8 COD
9 NGA
10 ETH
61
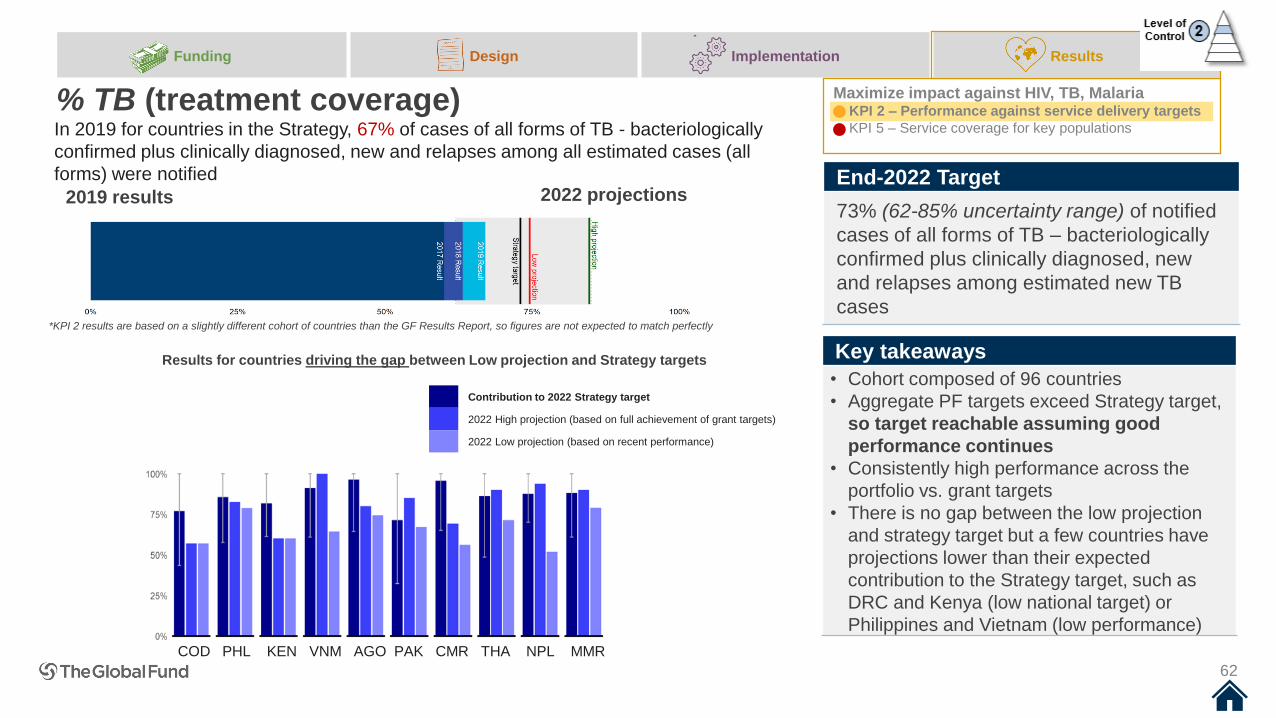
62
Funding Design Implementation Results
% TB (treatment coverage)
Key takeaways
• Cohort composed of 96 countries
• Aggregate PF targets exceed Strategy target,
so target reachable assuming good
performance continues
• Consistently high performance across the
portfolio vs. grant targets
• There is no gap between the low projection
and strategy target but a few countries have
projections lower than their expected
contribution to the Strategy target, such as
DRC and Kenya (low national target) or
Philippines and Vietnam (low performance)
2022 projections2019 results
Maximize impact against HIV, TB, MalariaKPI 2 – Performance against service delivery targets
KPI 5 – Service coverage for key populations
End-2022 Target
73% (62-85% uncertainty range) of notified
cases of all forms of TB – bacteriologically
confirmed plus clinically diagnosed, new
and relapses among estimated new TB
cases
In 2019 for countries in the Strategy, 67% of cases of all forms of TB - bacteriologically
confirmed plus clinically diagnosed, new and relapses among all estimated cases (all
forms) were notified
*KPI 2 results are based on a slightly different cohort of countries than the GF Results Report, so figures are not expected to match perfectly
Results for countries driving the gap between Low projection and Strategy targets
Contribution to 2022 Strategy target
2022 High projection (based on full achievement of grant targets)
2022 Low projection (based on recent performance)
COD PHL KEN VNM AGO PAK CMR THA NPL MMR
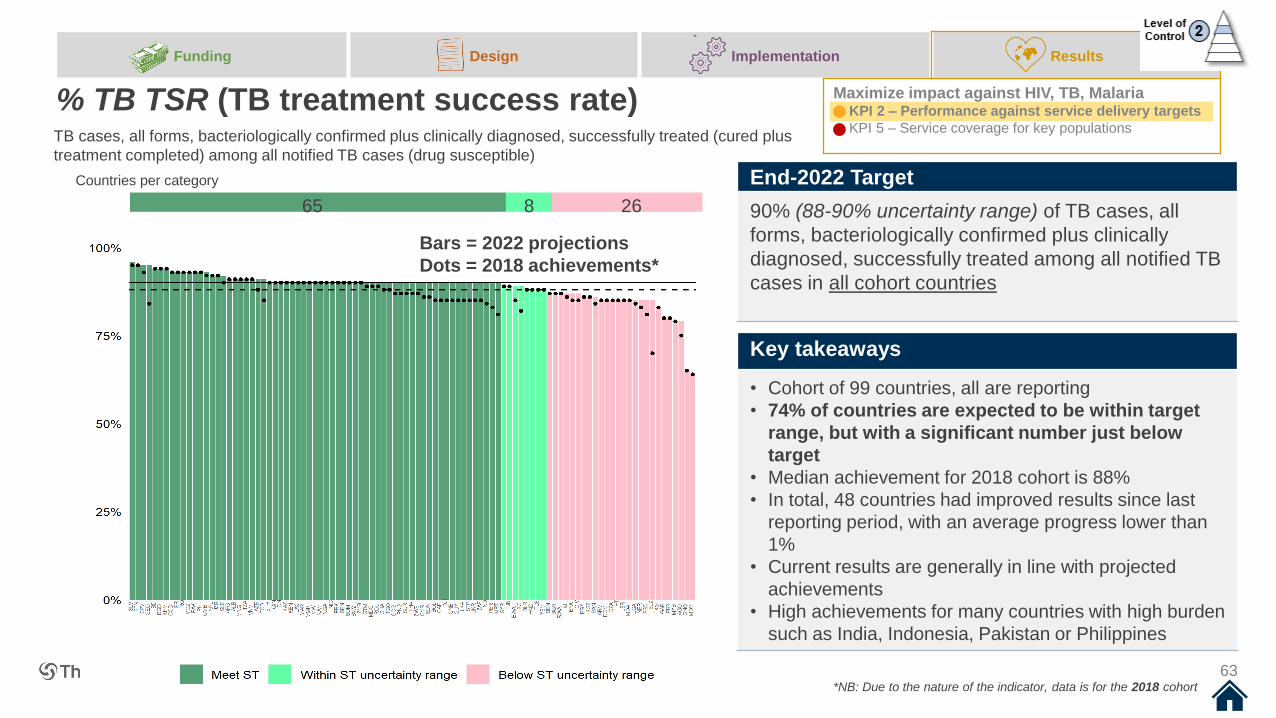
65 8 26
63
Funding Design Implementation Results
% TB TSR (TB treatment success rate)
Key takeaways
• Cohort of 99 countries, all are reporting
• 74% of countries are expected to be within target
range, but with a significant number just below
target
• Median achievement for 2018 cohort is 88%
• In total, 48 countries had improved results since last
reporting period, with an average progress lower than
1%
• Current results are generally in line with projected
achievements
• High achievements for many countries with high burden
such as India, Indonesia, Pakistan or Philippines
*NB: Due to the nature of the indicator, data is for the 2018 cohort
Maximize impact against HIV, TB, MalariaKPI 2 – Performance against service delivery targets
KPI 5 – Service coverage for key populations
End-2022 Target
90% (88-90% uncertainty range) of TB cases, all
forms, bacteriologically confirmed plus clinically
diagnosed, successfully treated among all notified TB
cases in all cohort countries
Countries per category
TB cases, all forms, bacteriologically confirmed plus clinically diagnosed, successfully treated (cured plus
treatment completed) among all notified TB cases (drug susceptible)
Bars = 2022 projections
Dots = 2018 achievements*
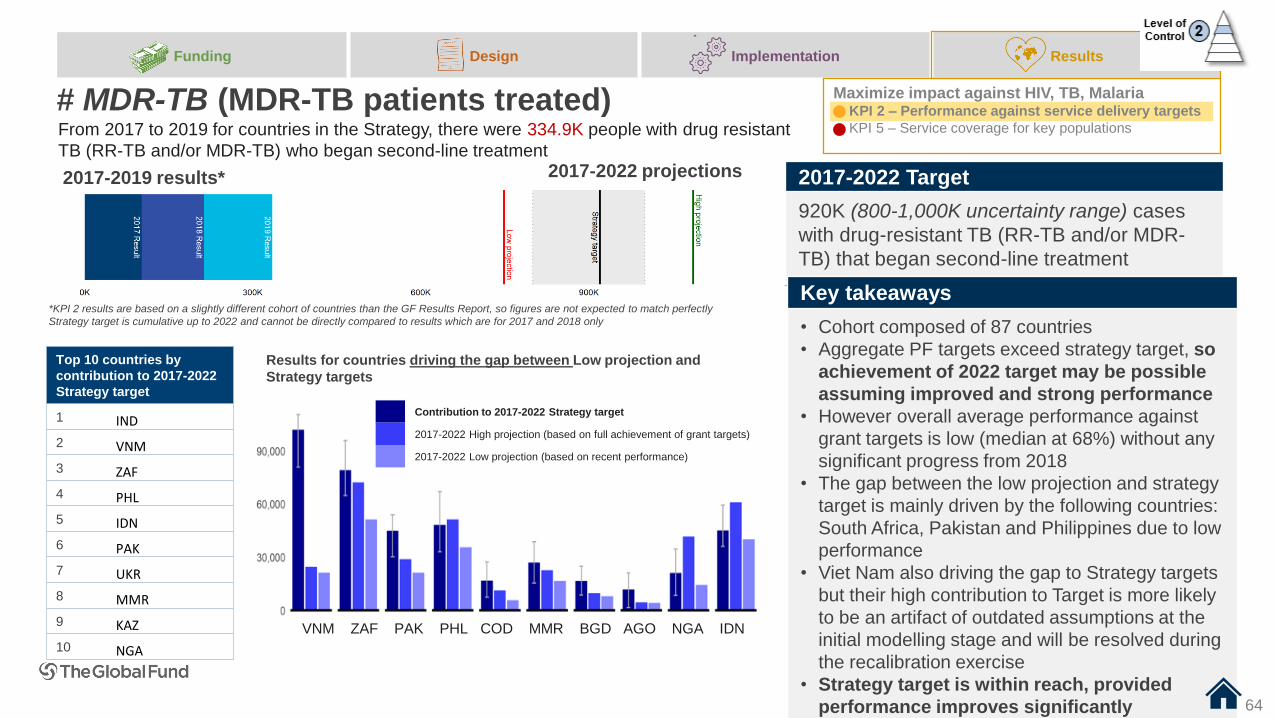
VNM ZAF PAK PHL COD MMR BGD AGO NGA IDN
From 2017 to 2019 for countries in the Strategy, there were 334.9K people with drug resistant
TB (RR-TB and/or MDR-TB) who began second-line treatment
64
Funding Design Implementation Results
# MDR-TB (MDR-TB patients treated)
2017-2022 projections2017-2019 results*
Maximize impact against HIV, TB, MalariaKPI 2 – Performance against service delivery targets
KPI 5 – Service coverage for key populations
2017-2022 Target
920K (800-1,000K uncertainty range) cases
with drug-resistant TB (RR-TB and/or MDR-
TB) that began second-line treatment
*KPI 2 results are based on a slightly different cohort of countries than the GF Results Report, so figures are not expected to match perfectly
Strategy target is cumulative up to 2022 and cannot be directly compared to results which are for 2017 and 2018 only
Results for countries driving the gap between Low projection and
Strategy targets
Contribution to 2017-2022 Strategy target
2017-2022 High projection (based on full achievement of grant targets)
2017-2022 Low projection (based on recent performance)
Top 10 countries by
contribution to 2017-2022
Strategy target
1 IND
2 VNM
3 ZAF
4 PHL
5 IDN
6 PAK
7 UKR
8 MMR
9 KAZ
10 NGA
Key takeaways
• Cohort composed of 87 countries
• Aggregate PF targets exceed strategy target, so
achievement of 2022 target may be possible
assuming improved and strong performance
• However overall average performance against
grant targets is low (median at 68%) without any
significant progress from 2018
• The gap between the low projection and strategy
target is mainly driven by the following countries:
South Africa, Pakistan and Philippines due to low
performance
• Viet Nam also driving the gap to Strategy targets
but their high contribution to Target is more likely
to be an artifact of outdated assumptions at the
initial modelling stage and will be resolved during
the recalibration exercise
• Strategy target is within reach, provided
performance improves significantly
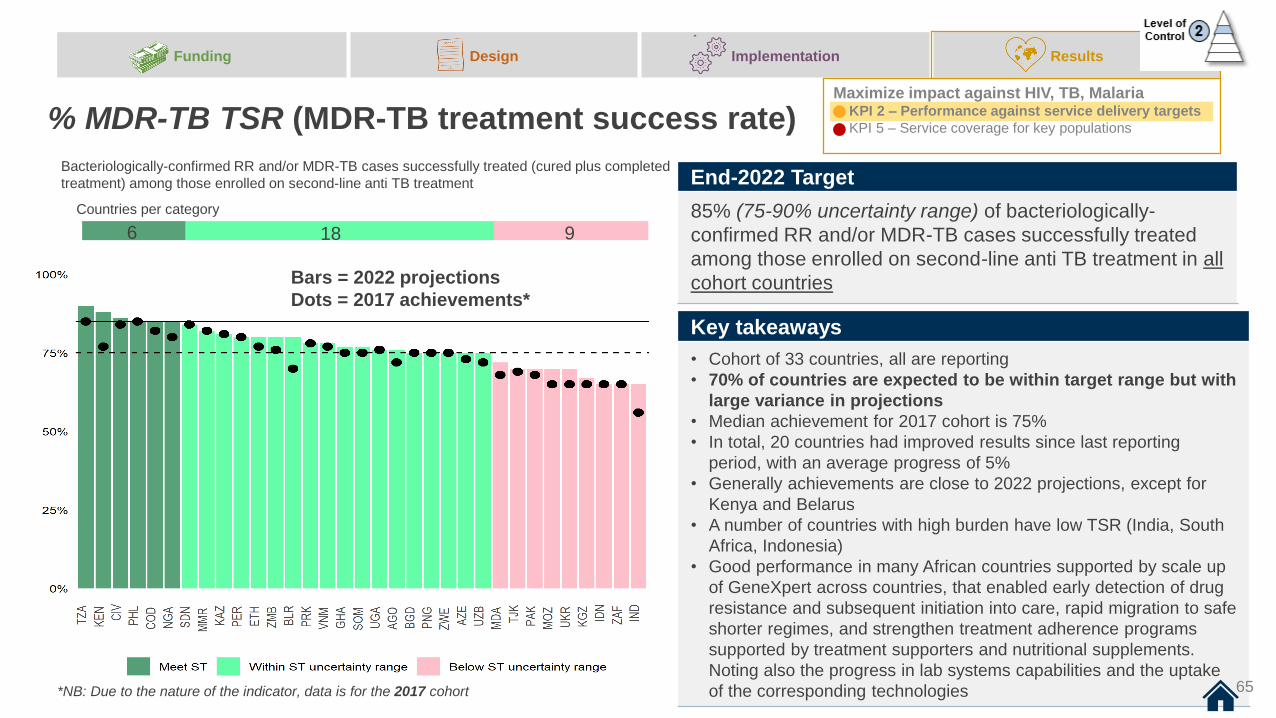
6 18 9
65
Funding Design Implementation Results
% MDR-TB TSR (MDR-TB treatment success rate)
Key takeaways
• Cohort of 33 countries, all are reporting
• 70% of countries are expected to be within target range but with
large variance in projections
• Median achievement for 2017 cohort is 75%
• In total, 20 countries had improved results since last reporting
period, with an average progress of 5%
• Generally achievements are close to 2022 projections, except for
Kenya and Belarus
• A number of countries with high burden have low TSR (India, South
Africa, Indonesia)
• Good performance in many African countries supported by scale up
of GeneXpert across countries, that enabled early detection of drug
resistance and subsequent initiation into care, rapid migration to safe
shorter regimes, and strengthen treatment adherence programs
supported by treatment supporters and nutritional supplements.
Noting also the progress in lab systems capabilities and the uptake
of the corresponding technologies*NB: Due to the nature of the indicator, data is for the 2017 cohort
Maximize impact against HIV, TB, MalariaKPI 2 – Performance against service delivery targets
KPI 5 – Service coverage for key populations
End-2022 Target
85% (75-90% uncertainty range) of bacteriologically-
confirmed RR and/or MDR-TB cases successfully treated
among those enrolled on second-line anti TB treatment in all
cohort countries
Countries per category
Bacteriologically-confirmed RR and/or MDR-TB cases successfully treated (cured plus completed
treatment) among those enrolled on second-line anti TB treatment
Bars = 2022 projections
Dots = 2017 achievements*
65
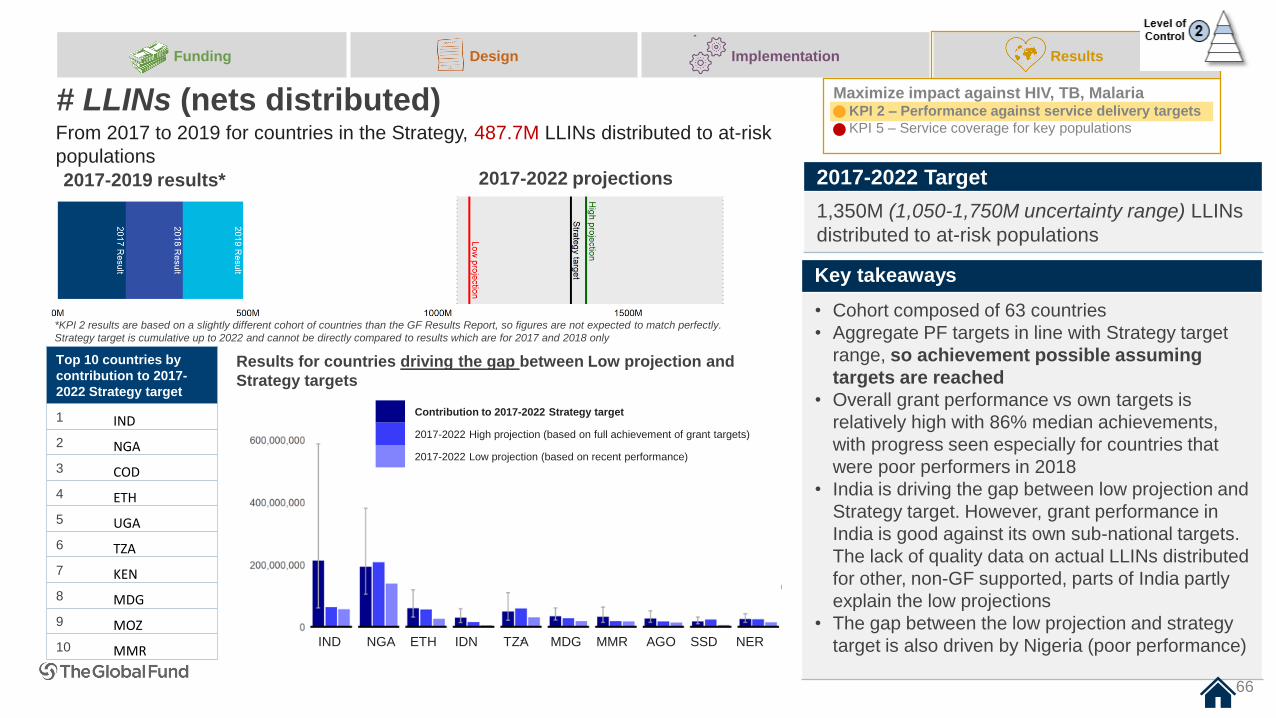
IND NGA ETH IDN TZA MDG MMR AGO SSD NER
From 2017 to 2019 for countries in the Strategy, 487.7M LLINs distributed to at-risk
populations
66
Funding Design Implementation Results
# LLINs (nets distributed)
Key takeaways
• Cohort composed of 63 countries
• Aggregate PF targets in line with Strategy target
range, so achievement possible assuming
targets are reached
• Overall grant performance vs own targets is
relatively high with 86% median achievements,
with progress seen especially for countries that
were poor performers in 2018
• India is driving the gap between low projection and
Strategy target. However, grant performance in
India is good against its own sub-national targets.
The lack of quality data on actual LLINs distributed
for other, non-GF supported, parts of India partly
explain the low projections
• The gap between the low projection and strategy
target is also driven by Nigeria (poor performance)
2017-2022 projections2017-2019 results*
Maximize impact against HIV, TB, MalariaKPI 2 – Performance against service delivery targets
KPI 5 – Service coverage for key populations
2017-2022 Target
1,350M (1,050-1,750M uncertainty range) LLINs
distributed to at-risk populations
*KPI 2 results are based on a slightly different cohort of countries than the GF Results Report, so figures are not expected to match perfectly.
Strategy target is cumulative up to 2022 and cannot be directly compared to results which are for 2017 and 2018 only
66
Results for countries driving the gap between Low projection and
Strategy targets
Contribution to 2017-2022 Strategy target
2017-2022 High projection (based on full achievement of grant targets)
2017-2022 Low projection (based on recent performance)
Top 10 countries by
contribution to 2017-
2022 Strategy target
1 IND
2 NGA
3 COD
4 ETH
5 UGA
6 TZA
7 KEN
8 MDG
9 MOZ
10 MMR
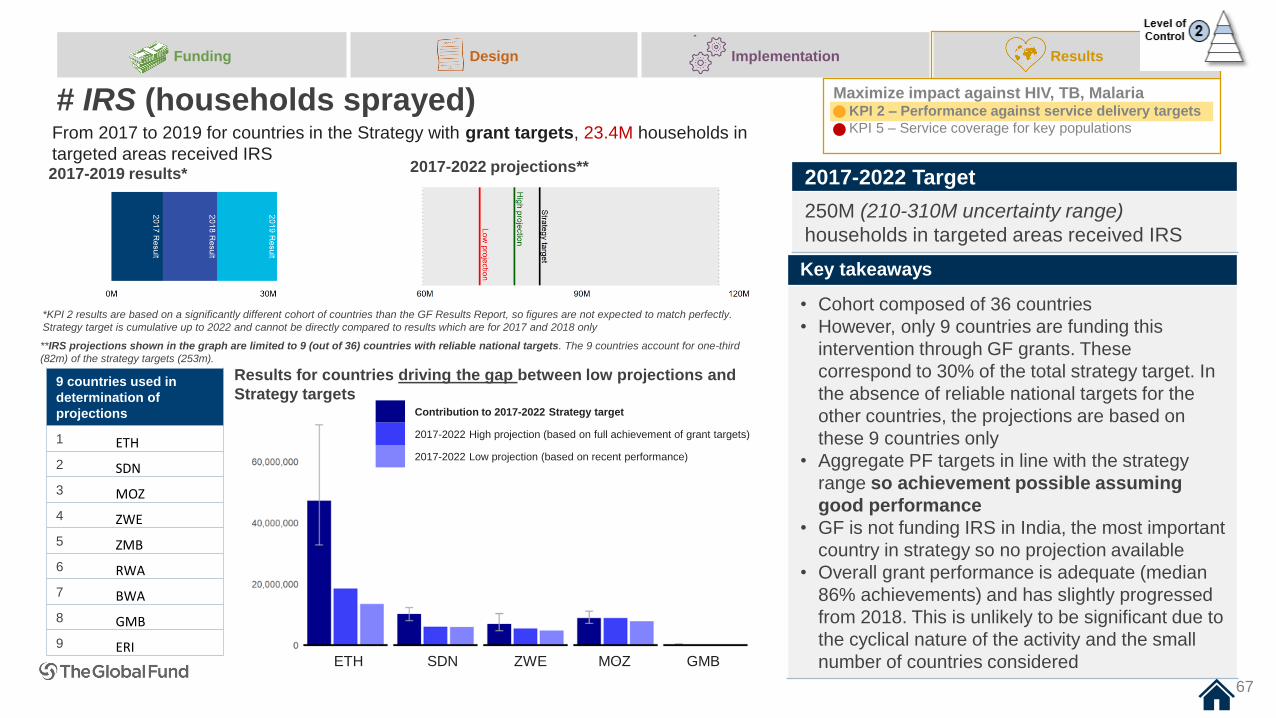
From 2017 to 2019 for countries in the Strategy with grant targets, 23.4M households in
targeted areas received IRS
67
Funding Design Implementation Results
# IRS (households sprayed)
Key takeaways
• Cohort composed of 36 countries
• However, only 9 countries are funding this
intervention through GF grants. These
correspond to 30% of the total strategy target. In
the absence of reliable national targets for the
other countries, the projections are based on
these 9 countries only
• Aggregate PF targets in line with the strategy
range so achievement possible assuming
good performance
• GF is not funding IRS in India, the most important
country in strategy so no projection available
• Overall grant performance is adequate (median
86% achievements) and has slightly progressed
from 2018. This is unlikely to be significant due to
the cyclical nature of the activity and the small
number of countries considered
2017-2022 projections**2017-2019 results*
Maximize impact against HIV, TB, MalariaKPI 2 – Performance against service delivery targets
KPI 5 – Service coverage for key populations
2017-2022 Target
250M (210-310M uncertainty range)
households in targeted areas received IRS
*KPI 2 results are based on a significantly different cohort of countries than the GF Results Report, so figures are not expected to match perfectly.
Strategy target is cumulative up to 2022 and cannot be directly compared to results which are for 2017 and 2018 only
**IRS projections shown in the graph are limited to 9 (out of 36) countries with reliable national targets. The 9 countries account for one-third
(82m) of the strategy targets (253m).
Results for countries driving the gap between low projections and
Strategy targetsContribution to 2017-2022 Strategy target
2017-2022 High projection (based on full achievement of grant targets)
2017-2022 Low projection (based on recent performance)
ETH SDN ZWE MOZ GMB
9 countries used in
determination of
projections
1 ETH
2 SDN
3 MOZ
4 ZWE
5 ZMB
6 RWA
7 BWA
8 GMB
9 ERI
67
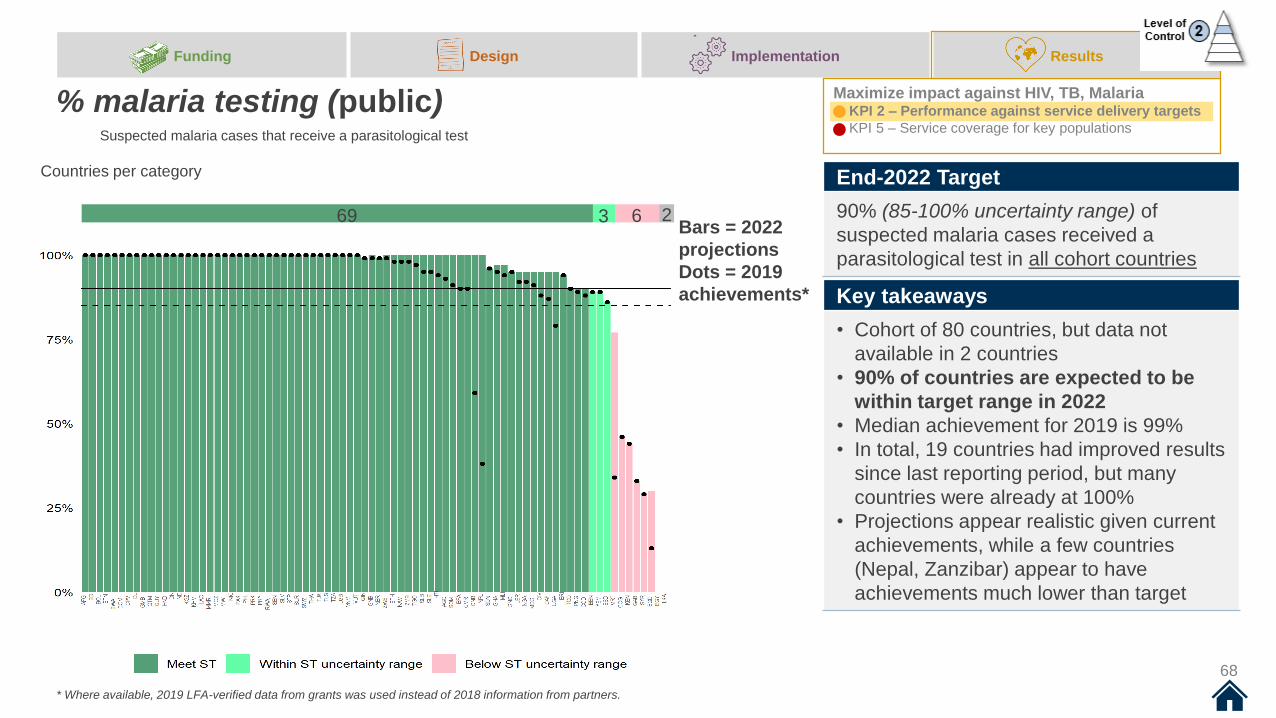
69 3 6 2
68
Funding Design Implementation Results
% malaria testing (public)
Key takeaways
• Cohort of 80 countries, but data not
available in 2 countries
• 90% of countries are expected to be
within target range in 2022
• Median achievement for 2019 is 99%
• In total, 19 countries had improved results
since last reporting period, but many
countries were already at 100%
• Projections appear realistic given current
achievements, while a few countries
(Nepal, Zanzibar) appear to have
achievements much lower than target
Maximize impact against HIV, TB, MalariaKPI 2 – Performance against service delivery targets
KPI 5 – Service coverage for key populations
End-2022 Target
90% (85-100% uncertainty range) of
suspected malaria cases received a
parasitological test in all cohort countries
Countries per category
Suspected malaria cases that receive a parasitological test
Bars = 2022
projections
Dots = 2019
achievements*
* Where available, 2019 LFA-verified data from grants was used instead of 2018 information from partners.
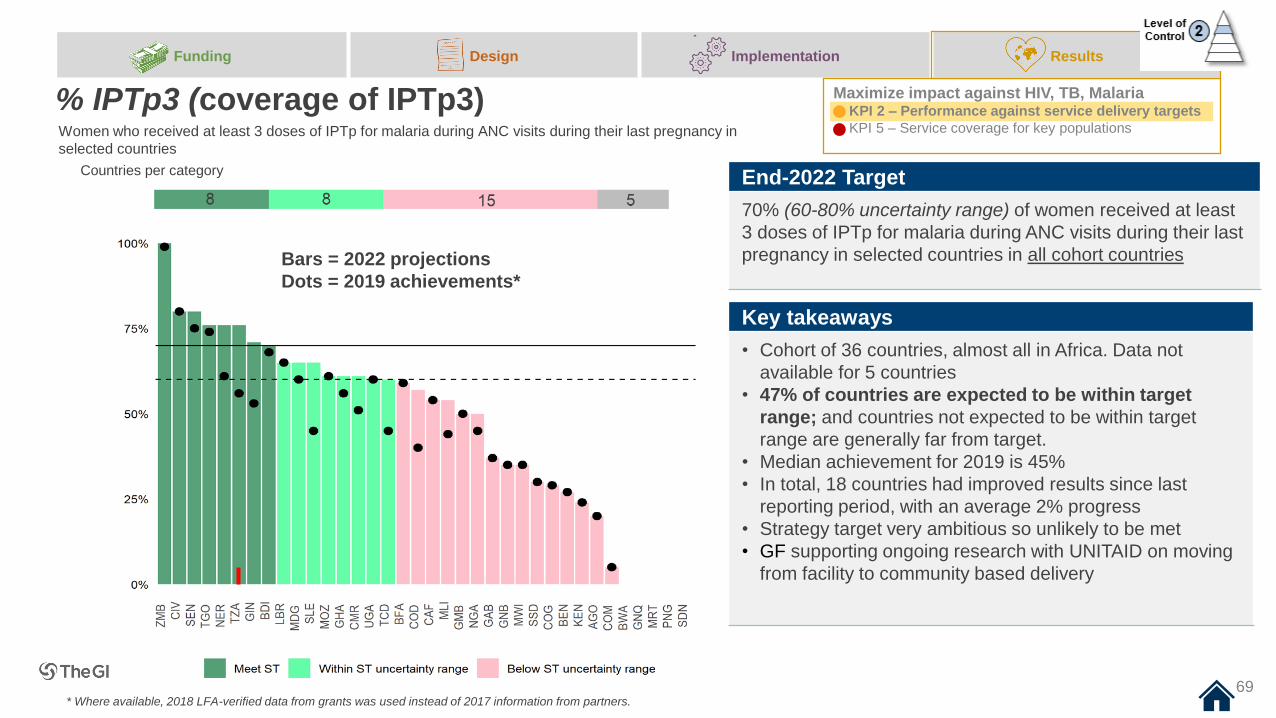
Funding Design Implementation Results
% IPTp3 (coverage of IPTp3)
Key takeaways
• Cohort of 36 countries, almost all in Africa. Data not
available for 5 countries
• 47% of countries are expected to be within target
range; and countries not expected to be within target
range are generally far from target.
• Median achievement for 2019 is 45%
• In total, 18 countries had improved results since last
reporting period, with an average 2% progress
• Strategy target very ambitious so unlikely to be met
• GF supporting ongoing research with UNITAID on moving
from facility to community based delivery
Maximize impact against HIV, TB, MalariaKPI 2 – Performance against service delivery targets
KPI 5 – Service coverage for key populations
End-2022 Target
70% (60-80% uncertainty range) of women received at least
3 doses of IPTp for malaria during ANC visits during their last
pregnancy in selected countries in all cohort countries
Countries per category
Women who received at least 3 doses of IPTp for malaria during ANC visits during their last pregnancy in
selected countries
69
Bars = 2022 projections
Dots = 2019 achievements*
* Where available, 2018 LFA-verified data from grants was used instead of 2017 information from partners.
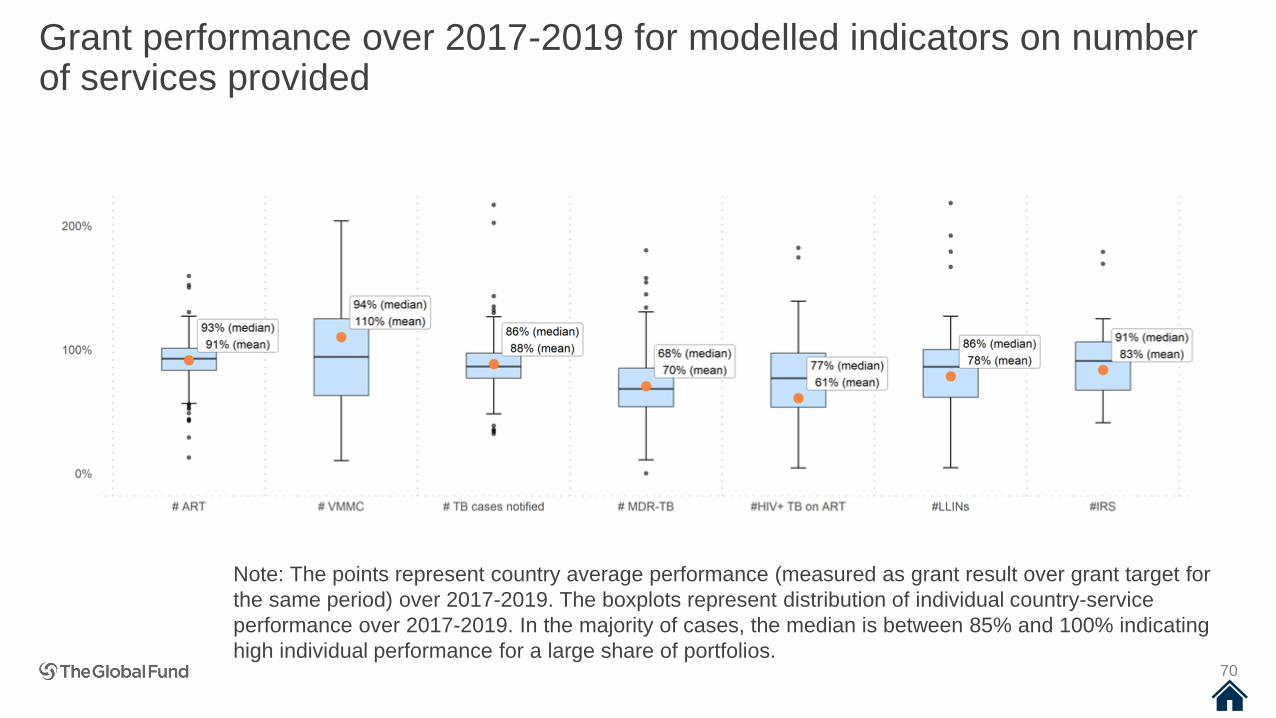
Grant performance over 2017-2019 for modelled indicators on number of services provided
70
Note: The points represent country average performance (measured as grant result over grant target for
the same period) over 2017-2019. The boxplots represent distribution of individual country-service
performance over 2017-2019. In the majority of cases, the median is between 85% and 100% indicating
high individual performance for a large share of portfolios.
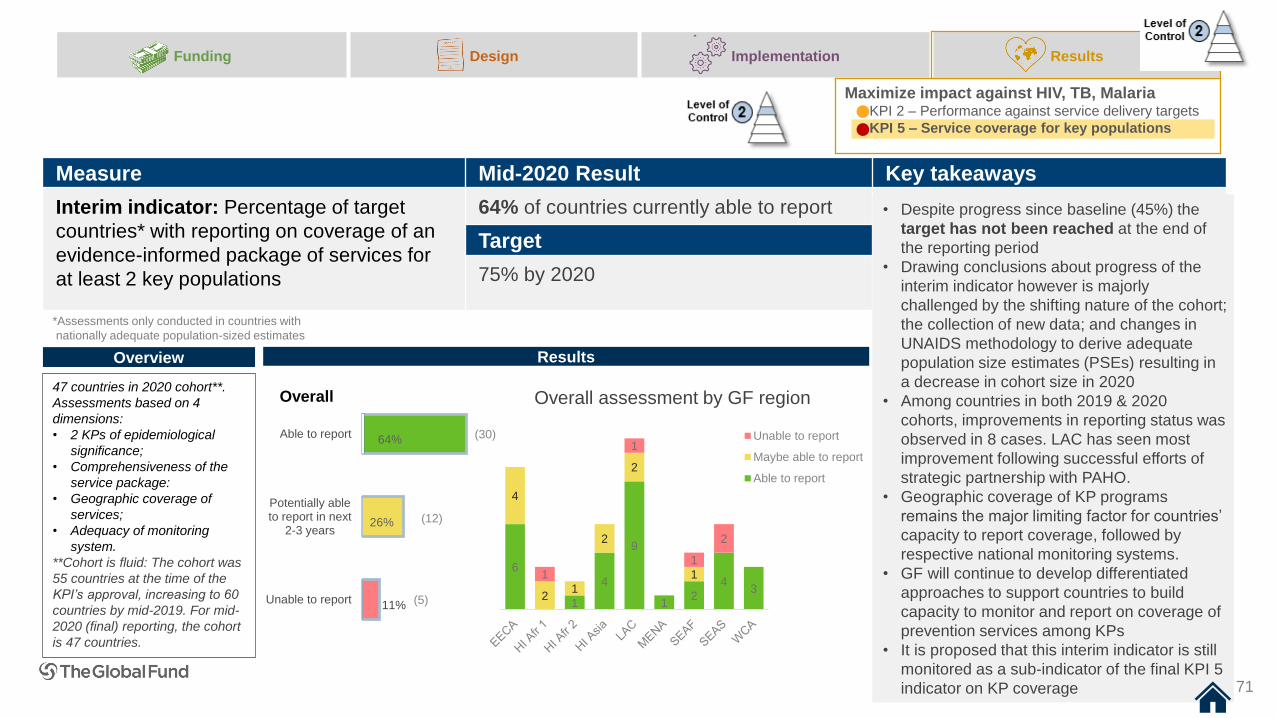
Measure Mid-2020 Result Key takeaways
Interim indicator: Percentage of target
countries* with reporting on coverage of an
evidence-informed package of services for
at least 2 key populations
64% of countries currently able to report
Target
75% by 2020
• Despite progress since baseline (45%) the
target has not been reached at the end of
the reporting period
• Drawing conclusions about progress of the
interim indicator however is majorly
challenged by the shifting nature of the cohort;
the collection of new data; and changes in
UNAIDS methodology to derive adequate
population size estimates (PSEs) resulting in
a decrease in cohort size in 2020
• Among countries in both 2019 & 2020
cohorts, improvements in reporting status was
observed in 8 cases. LAC has seen most
improvement following successful efforts of
strategic partnership with PAHO.
• Geographic coverage of KP programs
remains the major limiting factor for countries’
capacity to report coverage, followed by
respective national monitoring systems.
• GF will continue to develop differentiated
approaches to support countries to build
capacity to monitor and report on coverage of
prevention services among KPs
• It is proposed that this interim indicator is still
monitored as a sub-indicator of the final KPI 5
indicator on KP coverage
Funding Design Implementation Results
Maximize impact against HIV, TB, MalariaKPI 2 – Performance against service delivery targets
KPI 5 – Service coverage for key populations
Overview
47 countries in 2020 cohort**.
Assessments based on 4
dimensions:
• 2 KPs of epidemiological
significance;
• Comprehensiveness of the
service package:
• Geographic coverage of
services;
• Adequacy of monitoring
system.
**Cohort is fluid: The cohort was
55 countries at the time of the
KPI’s approval, increasing to 60
countries by mid-2019. For mid-
2020 (final) reporting, the cohort
is 47 countries.
Results
(5)
(12)
(30)
11%
26%
64%
Unable to report
Potentially ableto report in next
2-3 years
Able to report
Overall
*Assessments only conducted in countries with
nationally adequate population-sized estimates
6
1
4
9
12
43
4
21
2
2
11
1
1
2
Overall assessment by GF region
Unable to report
Maybe able to report
Able to report
71
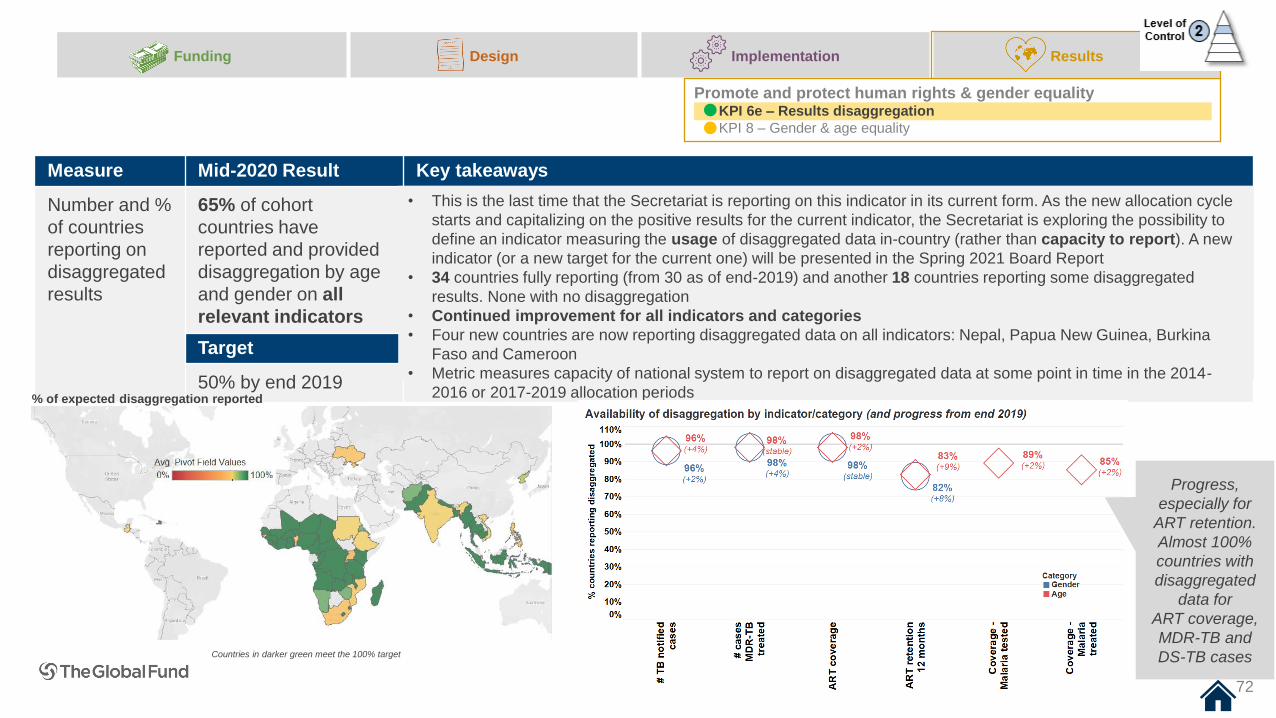
Funding Design Implementation Results
72
Measure Mid-2020 Result Key takeaways
Number and %
of countries
reporting on
disaggregated
results
65% of cohort
countries have
reported and provided
disaggregation by age
and gender on all
relevant indicators
Target
50% by end 2019
• This is the last time that the Secretariat is reporting on this indicator in its current form. As the new allocation cycle
starts and capitalizing on the positive results for the current indicator, the Secretariat is exploring the possibility to
define an indicator measuring the usage of disaggregated data in-country (rather than capacity to report). A new
indicator (or a new target for the current one) will be presented in the Spring 2021 Board Report
• 34 countries fully reporting (from 30 as of end-2019) and another 18 countries reporting some disaggregated
results. None with no disaggregation
• Continued improvement for all indicators and categories
• Four new countries are now reporting disaggregated data on all indicators: Nepal, Papua New Guinea, Burkina
Faso and Cameroon
• Metric measures capacity of national system to report on disaggregated data at some point in time in the 2014-
2016 or 2017-2019 allocation periods% of expected disaggregation reported
Countries in darker green meet the 100% target
Promote and protect human rights & gender equalityKPI 6e – Results disaggregation
KPI 8 – Gender & age equality
72
Progress,
especially for
ART retention.
Almost 100%
countries with
disaggregated
data for
ART coverage,
MDR-TB and
DS-TB cases
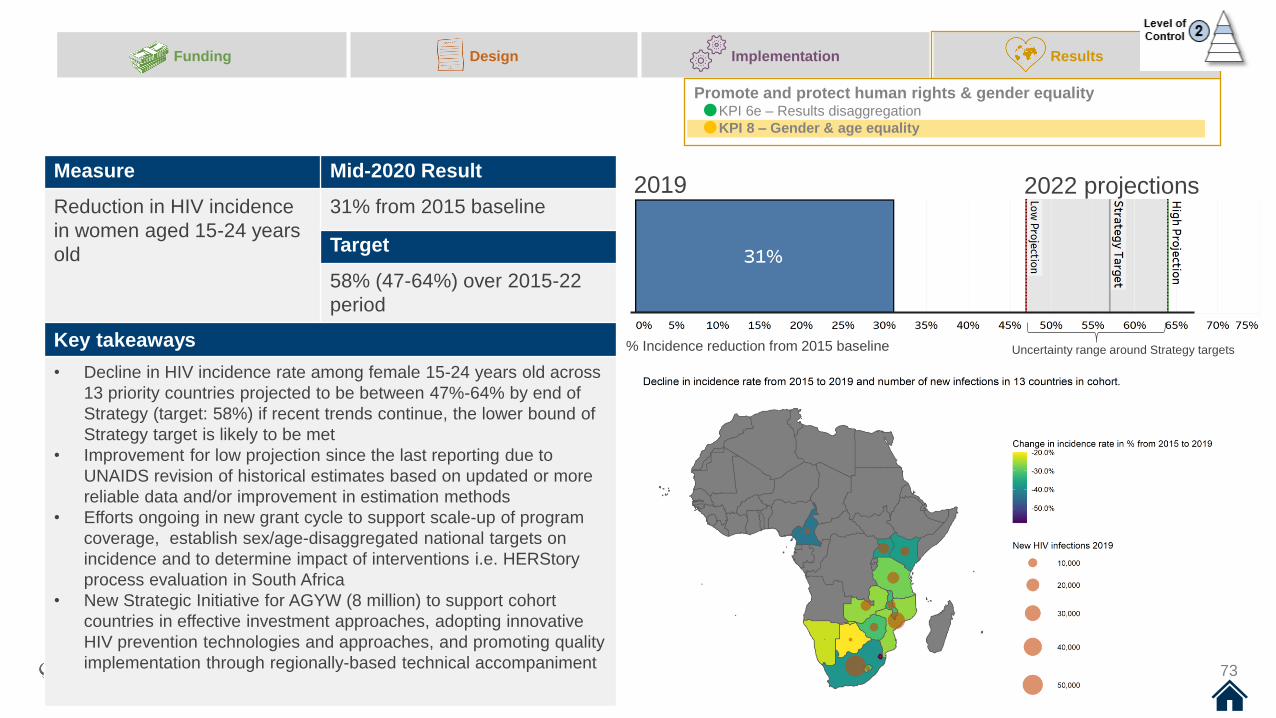
Funding Design Implementation Results
73
Promote and protect human rights & gender equalityKPI 6e – Results disaggregation
KPI 8 – Gender & age equality
Measure Mid-2020 Result
Reduction in HIV incidence
in women aged 15-24 years
old
31% from 2015 baseline
Target
58% (47-64%) over 2015-22
period
Key takeaways
• Decline in HIV incidence rate among female 15-24 years old across
13 priority countries projected to be between 47%-64% by end of
Strategy (target: 58%) if recent trends continue, the lower bound of
Strategy target is likely to be met
• Improvement for low projection since the last reporting due to
UNAIDS revision of historical estimates based on updated or more
reliable data and/or improvement in estimation methods
• Efforts ongoing in new grant cycle to support scale-up of program
coverage, establish sex/age-disaggregated national targets on
incidence and to determine impact of interventions i.e. HERStory
process evaluation in South Africa
• New Strategic Initiative for AGYW (8 million) to support cohort
countries in effective investment approaches, adopting innovative
HIV prevention technologies and approaches, and promoting quality
implementation through regionally-based technical accompaniment
2019 2022 projections
% Incidence reduction from 2015 baseline Uncertainty range around Strategy targets

74
AGYW Adolescent Girls and Young Women LMI Lower Middle Income
ANTM Antimalarial medicine MIC Middle Income Country
ART Antiretroviral therapy NFM New funding model
ARV Antiretroviral OIG Office of the Inspector General
BDB Breaking Down Barriers NSP National strategic plan
CCM Country Coordination Mechanism OTIF On time and in full
CDR Case detection rate OSA Off shelf availability
COE Challenging Operating Environment PAHO Pan American Health Organization
CPR Country Portfolio Review PLHIV People living with HIV
CRG Community, rights and gender PF Performance Framework
EECA Eastern Europe and Central Asia PMTCT Prevention of mother-to-child transmission
EPR Enterprise Portfolio Review PPM Pooled Procurement Mechanism
ERP Expert Review Process PQR Price & Quality Reporting
ESA East-Southern Africa RDT Rapid diagnostic tests
FLDs First Line Drugs RSSH Resilient and sustainable systems for health
GAC Grant Approval Committee SC Strategy Committee
GAM Global AIDS Monitoring SO Strategic Objective
GF Global Fund SEA Southern and Eastern Africa
HI High Impact (countries) SPH Strategy and Policy Hub
HMIS Health Management Information Systems ST Strategy target
HRts Human Rights STC Sustainability and transition & co-financing
IPT Isoniazid Preventive Therapy TA Technical Assistance
IPTp3 Intermittent preventive treatment in pregnancy TRP Technical Review Panel
IRS Indoor residual spraying TSR Treatment success rate
ITP Impact partnership UNDP United Nations Development Program
KP Key Populations UMI Upper Middle Income
LAC Latin America and the Caribbean VMMC Voluntary male medical circumcision
LLIN Long lasting insecticidal net WCA West and Central Africa
MDR-TB Multi drug resistant WHO World Health Organization
Glossary of acronyms used in this report