strategic ornithological support services project soss-02 a review
TRANSCRIPT

BTO Research Report Number 618
Strategic Ornithological Support Services
Project SOSS-02
A review of flight heights and avoidance rates of birds in relation to offshore wind farms
Authors
Aonghais S.C.P. Cook, Alison Johnston, Lucy J. Wright & Niall H.K. Burton
Report of work carried out by the British Trust for Ornithology on behalf of The Crown Estate
May 2012
British Trust for Ornithology
The British Trust for Ornithology, The Nunnery, Thetford, Norfolk IP24 2PU Registered Charity No. 216652
The idea and scope for this project was developed by the Strategic Ornithological Support Services (SOSS) steering group. Work was overseen by a project working group comprising Ian Davies (Marine Scotland), Ross McGregor (SNH), Chris Pendlebury (Natural Power, nominated by SeaEnergy) and Pernille Hermansen (DONG Energy), together with Bill Band. We thank the project working group and other members of the SOSS steering group for many useful comments which helped to improve this report. SOSS work is funded by The Crown Estate and coordinated via a secretariat based at the British Trust for Ornithology. More information is available on the SOSS website www.bto.org/soss. The SOSS steering group includes representatives of regulators, advisory bodies, NGOs and offshore wind developers (or their consultants). All SOSS reports have had contributions from various members of the steering group. However the report is not officially endorsed by any of these organisations and does not constitute guidance from statutory bodies. The following organisations are represented in the SOSS steering group: SOSS Secretariat Partners: The Crown Estate British Trust for Ornithology Bureau Waardenburg
Centre for Research into Ecological and Environmental Modelling, University of St. Andrews
Regulators: Marine Management Organisation Marine Scotland
Statutory advisory bodies: Joint Nature Conservation Committee Countryside Council for Wales Natural England Northern Ireland Environment Agency Scottish Natural Heritage
Other advisors: Royal Society for the Protection of Birds Offshore wind developers: Centrica (nominated consultant RES) Dong Energy Eon (nominated consultant Natural Power) EdF Energy Renewables Eneco (nominated consultant PMSS) Forewind Mainstream Renewable Power (nominated consultant Pelagica) RWE npower renewables (nominated consultant GoBe) Scottish Power Renewables SeaEnergy/MORL/Repsol (nominated consultant Natural Power) SSE Renewables (nominated consultant AMEC or ECON) Vattenfall Warwick Energy
1
CONTENTS Page No. List of Tables ...................................................................................................................................... 3 List of Figures ...................................................................................................................................... 5 List of Appendices .................................................................................................................................. 7 EXECUTIVE SUMMARY ........................................................................................................................... 9 1. INTRODUCTION ....................................................................................................................... 11 2. METHODS ................................................................................................................................ 13 2.1 Flight heights ........................................................................................................................... 13 2.2 Avoidance rates ....................................................................................................................... 14 3. RESULTS ................................................................................................................................... 15 3.1 Flight heights ........................................................................................................................... 15 3.1.1 Common Eider ............................................................................................................ 16 3.1.2 Long-tailed Duck ......................................................................................................... 16 3.1.3 Common Scoter .......................................................................................................... 16 3.1.4 Velvet Scoter .............................................................................................................. 17 3.1.5 Red-throated Diver .................................................................................................... 17 3.1.6 Black-throated Diver .................................................................................................. 18 3.1.7 Great Northern Diver ................................................................................................. 19 3.1.8 Northern Fulmar ......................................................................................................... 19 3.1.9 Sooty Shearwater ....................................................................................................... 20 3.1.10 Manx Shearwater ....................................................................................................... 20 3.1.11 European Storm-petrel .............................................................................................. 21 3.1.12 Northern Gannet ........................................................................................................ 21 3.1.13 Great Cormorant ........................................................................................................ 22 3.1.14 European Shag ............................................................................................................ 22 3.1.15 Great Crested Grebe .................................................................................................. 23 3.1.16 Red-necked Grebe ...................................................................................................... 23 3.1.17 Arctic Skua .................................................................................................................. 23 3.1.18 Great Skua .................................................................................................................. 24 3.1.19 Black-legged Kittiwake ............................................................................................... 24 3.1.20 Black-headed Gull ...................................................................................................... 25 3.1.21 Little Gull .................................................................................................................... 26 3.1.22 Common Gull .............................................................................................................. 27 3.1.23 Lesser Black-backed Gull ............................................................................................ 28 3.1.24 Herring Gull ................................................................................................................ 29 3.1.25 Glaucous Gull .............................................................................................................. 30 3.1.26 Great Black-backed Gull ............................................................................................. 30 3.1.27 Black Tern ................................................................................................................... 31 3.1.28 Sandwich Tern ............................................................................................................ 31 3.1.29 Common Tern ............................................................................................................. 32 3.1.30 Arctic Tern .................................................................................................................. 33 3.1.31 Common Guillemot .................................................................................................... 34 3.1.32 Razorbill ...................................................................................................................... 34 3.1.33 Little Auk ..................................................................................................................... 35 3.1.34 Atlantic Puffin ............................................................................................................. 36

2
Page No. 3.2 Avoidance rates ....................................................................................................................... 37 4. DISCUSSION ............................................................................................................................. 45 4.1 Flight heights ........................................................................................................................... 45 4.1.1 Discussion ................................................................................................................... 45 4.1.2 Aerial Survey Data ...................................................................................................... 46 4.1.3 Recommendations ..................................................................................................... 47 4.2 Avoidance ................................................................................................................................ 47 4.2.1 Discussion ................................................................................................................... 47 4.2.2 Recommendations ..................................................................................................... 48 4.3 Fulfilling information needs .................................................................................................... 49 4.3.1 Flight Heights .............................................................................................................. 49 4.3.2 Avoidance ................................................................................................................... 49 4.4 Benefits to consenting process ............................................................................................... 50 4.4.1 Flight Heights .............................................................................................................. 50 4.4.2 Avoidance ................................................................................................................... 50 ACKNOWLEDGEMENTS ........................................................................................................................ 51 REFERENCES .................................................................................................................................... 53
APPENDICES .................................................................................................................................... 57

3
LIST OF TABLES Page No. Table 3.1 Modelled proportion of birds flights within the collision risk window for a turbine with rotor blades a minimum of 20 m above sea-level and a diameter of 130 m. ..................................................................................................... 15 Table 3.2 Avoidance rates for seabirds and other species groups in relation to offshore wind farms, obtained from a detailed review of the literature…….............. 41 Table 4.1 Recommended precautionary avoidance rates for different species / species groups based on published estimates of avoidance and manoeuvrability, taken from Maclean et al. (2009)……………………………………………………………………………. ........ 48

4

5
LIST OF FIGURES Page No. Figure 3.1 Flight heights of Common Scoters in relation to offshore wind farms ....................... 17 Figure 3.2 Flight heights of Red-throated Divers in relation to offshore wind farms ................. 18 Figure 3.3 Flight heights of Black-throated Divers in relation to offshore wind farms ............... 18 Figure 3.4 Flight heights of Northern Fulmars in relation to offshore wind farms ..................... 19 Figure 3.5 Flight heights of Manx Shearwaters in relation to offshore wind farms .................... 20 Figure 3.6 Flight heights of Northern Gannets in relation to offshore wind farms ..................... 21 Figure 3.7 Flight heights of European Shags in relation to offshore wind farms ........................ 22 Figure 3.8 Flight heights of Arctic Skuas in relation to offshore wind farms ............................... 23 Figure 3.9 Flight heights of Great Skuas in relation to offshore wind farms ............................... 24 Figure 3.10 Flight heights of Black-legged Kittiwakes in relation to offshore wind farms ............ 25 Figure 3.11 Flight heights of Black-headed Gulls in relation to offshore wind farms ................... 26 Figure 3.12 Flight heights of Little Gulls in relation to offshore wind farms ................................. 27 Figure 3.13 Flight heights of Common Gulls in relation to offshore wind farms .......................... 28 Figure 3.14 Flight heights of Lesser Black-backed Gulls in relation to offshore wind farms ......... 29 Figure 3.15 Flight heights of Herring Gulls in relation to offshore wind farms ............................. 30 Figure 3.16 Flight heights of Great Black-backed Gulls in relation to offshore wind farms .......... 31 Figure 3.17 Flight heights of Sandwich Terns in relation to offshore wind farms ......................... 32 Figure 3.18 Flight heights of Common Terns in relation to offshore wind farms ......................... 33 Figure 3.19 Flight heights of Arctic Terns in relation to offshore wind farms ............................... 33 Figure 3.20 Flight heights of Common Guillemots in relation to offshore wind farms ................. 34 Figure 3.21 Flight heights of Razorbills in relation to offshore wind farms ................................... 35 Figure 3.22 Flight heights of Atlantic Puffins in relation to offshore wind farms .......................... 35 Figure 3.23 Flight heights of Atlantic Puffins in relation to offshore wind farms .......................... 36 Figure 3.24 Mean micro- and macro-avoidance rates of birds in relation to offshore wind farms .................................................................................................................. 37

6

7
LIST OF APPENDICES Page No. A1. Species sensitivities to collision risk as assessed by Langston (2010). .................................... 57 A2. Technical description of modelling methodology.. ................................................................. 59

8

9
EXECUTIVE SUMMARY 1. One of the potential impacts on birds from offshore wind farms is the mortality associated
with collisions with turbine blades.
2. There have been considerable advances in the development of statistical techniques to estimate potential collision-related mortality. However, there are still significant gaps in knowledge regarding the flight heights and avoidance rates of seabirds in relation to offshore wind farms, two key parameters in collision risk modelling.
3. This report reviews current information on the flight heights and avoidance rates of key seabird species that occur in UK waters and that are thought most susceptible to effects of collisions with offshore wind farms and which typically may need to be considered in EIAs. Recommendations are provided on the use of this information and where further work is needed. Updated guidance on the use of the Band et al. (2007) collision risk model and a revised spread-sheet for use in relation to offshore wind farms is provided separately (Band 2012).
4. An extensive literature search was undertaken to investigate the flight heights and
avoidance rates of seabirds in relation to offshore wind farms. In total data from 40 surveys of 32 existing, proposed or consented offshore wind farms were identified.
5. The mean proportion of birds predicted to fly at the generic collision risk height window of
20 to 150 m above sea-level varied from 0.03 % for the Little Auk to 33.1 % for the Great Black-backed Gull. For some species, notably divers, auks and sea duck, few individuals were predicted to fly at heights which placed them at risk of collision with wind turbines and there was relatively little variability in this finding between sites.
6. For collision risk modelling, it is recommended that consideration should be given to results
using both the site-specific and the modelled flight height data presented here. Where there is a clear difference between data recorded on a site-specific basis and the modelled data, the reasons for this – for example, that large numbers of migrating birds pass through the site – should be explored and clearly stated. Where there is good reason to have low confidence in the quality of the site-specific data, for example that it is based on low sample sizes or was collected during unrepresentative periods, the modelled flight height data might be considered more representative.
7. The updated guidance and a revised spread-sheet for offshore use of the Band collision risk
model (Band 2012) that accompanies this review provides the means for estimating collision risk (i) using site-specific data and assuming a uniform bird density in the risk window; (ii) also using the uniform density model, but using a figure for the proportion of birds at risk height derived from generic data; and (iii) using data on flight height distributions, as produced by the modelling presented here.
8. Whilst existing survey methodology produces estimates of the proportion of birds within
fixed flight height bands, the modelled data provide the opportunity for investigating flight height bands of differed sizes and extents. As a result these models make it possible to consider how alterations to turbine hub height and the size of turbine blades may affect the collision rate. In these circumstances, to ensure comparative values are presented, only the modelled data presented here should be used. Results using both the upper and lower confidence limits from the flight height distribution should also be presented when using the modelled data.

10
9. Bird data were collected in relation to the sea-level at the time of the survey. However, as sea-level will vary in relation to the fixed turbine structure, in the collision risk modelling process, flight heights should be considered in relation to mean sea-level. The models presented here do, however, offer the possibility of modelling the proportion of birds at collision risk height in relation to a range of sea-levels. Consideration of sea-level is also provided in the updated guidance for offshore use of the Band collision risk model (Band 2012).
10. Scientific studies of avian interactions with wind farms have tended to focus on collision and
mortality rates rather than actual avoidance rates. Whilst collision and mortality rates may provide a surrogate for avoidance rates, they do not necessarily reflect true avoidance rates i.e. the inverse of the ratio of the number of collisions to the number of collisions that would be predicted in the absence of avoidance behaviour (Band et al. 2007).
11. Avoidance behaviour varies in response to distance from turbines and it is important to
distinguish between macro-avoidance of the whole wind farm, and micro-avoidance of individual turbines within a wind farm. However, studies of avoidance have varied in their approaches, in particular, in the distances at which avoidance is measured and the avoidance rates reported are not strictly comparable. While some notable studies have taken place recently, without replication from additional sites, there is not a robust enough evidence base to suggest that existing guidance should be changed. The current, limited evidence suggests that avoidance rates may be likely to be more than 99% for some species (divers, Northern Gannet, sea ducks and auks). However, a value of 98 %, as recommended by SNH (2010), should be used as a precautionary avoidance rate until further evidence is available to build on that presented in this review. Given that there is potential for species to show higher rates, and also because of the uncertainty surrounding avoidance rates, it is recommended that collisions estimates associated with avoidance rates of 95 %, 99 % and 99.5 % should also be presented. However, these values should not take precedence in situations where strong evidence points to alternative avoidance rates. In the future, these recommendations may be refined as additional information becomes available.
12. There is an urgent need for further research into the flight heights and avoidance rates of
seabirds in relation to offshore wind farms. Ideally, this would include direct measurements of these variables through the tagging of individual birds and the monitoring of movements at a broader scale through the use of technologies such as radar, as well as through visual observations.

11
1. INTRODUCTION Offshore wind farms may potentially impact bird populations through four main effects: (i) displacement and disturbance associated with developments, (ii) the barrier effect posed by developments to migrating birds and birds commuting between breeding sites and feeding areas, (iii) collision mortality, and (iv) indirect effects due to changes in habitat or prey availability. There have been considerable advances in developing appropriate field methodologies to estimate flight activity (e.g. Madders & Whitfield 2006), and statistical methods to convert such activity data to estimates of collision mortality (Band et al. 2000, 2007). However, despite such advances there are still significant gaps in knowledge (Chamberlain et al. 2006) and many of these developments are in relation to onshore wind farms. Consequently there are high levels of uncertainty in the estimates of collision mortality produced for proposed offshore wind developments. Recent research has also developed a range of alternative modelling methods to estimate collision mortality (in addition to that developed by Band et al. 2000, 2007), but the relative value of these models for estimating collision risk at offshore wind farms has not been assessed to date. In Environmental Impact Assessments (EIAs) for proposed offshore wind farms, models to estimate collision mortality require estimates of the numbers of birds flying at the height of the proposed turbine blades (from field surveys), information on species’ flight speeds and morphology, the design of the turbines, and estimates of the ability of the birds to avoid in situ wind turbines (the “avoidance rate”). The avoidance rates assumed can have a large effect on estimates of collision mortality (Chamberlain et al. 2006), leading to erroneous under- or over-estimates. EIAs may over-estimate collision mortality for many bird species if the avoidance rates used are overly precautionary. The consequent uncertainties in estimates of collision mortality can impact on the consenting process for offshore wind projects. Reducing these uncertainties would have benefits for the assessment of collision risk both at site-specific and cumulative levels, and help inform the consenting process for proposed UK Round 3 and Scottish Territorial Waters (STW) offshore wind developments, extensions to existing Round 1 and 2 wind farms and the assessment of other future offshore wind developments. There is a need, for the benefit of EIA work undertaken for offshore windfarms, to: i. Standardise (where appropriate) the information used in the calculation of collision
mortality for offshore wind farms; ii. Provide a tool to standardise the way the collision risk model is used and the way results are
presented in Environmental Impact Assessments. This report aims to meet the first of these aims; updated guidance and a revised spread-sheet for offshore use of the Band collision risk model (Band 2012) is provided separately. The report first reviews current information on the flight heights of key seabird species that occur in UK waters and that are thought most susceptible to effects of collisions with offshore wind farms and which typically may need to be considered in EIAs. Using the data collated, the report considers whether it is possible to make generic conclusions regarding the proportion of birds of each species flying at different height ranges. Establishing generic flight height information for each key species will ensure that there is consistency in the data used for calculating collision mortality across EIAs and that the results of assessments are not dependent on limited data. However, it is not intended that generic flight height information should necessarily take priority over site-specific survey data where this shows that flight height ranges of some species are different from the generic range.
12
The report secondly reviews current information on the avoidance rates for key seabird species, and to provide recommendations as to what further work would be most beneficial to improve these estimates. The review considers available data collected at existing wind farms, as well as reviewing published literature. Recommendations on the use of both flight height data and avoidance rates in the updated Band collision risk model (Band 2012) are provided.

13
2. METHODS An extensive literature search was conducted to review information on the flight heights and avoidance rates of seabirds and sea duck in relation to offshore wind farms. Survey data collected as part of EIAs for existing, consented and proposed offshore wind farms in the UK and Europe were obtained and searches for peer-reviewed literature were conducted in Google Scholar and Web of Knowledge. As the majority of studies identified were EIAs, the data obtained reflect bird behaviour throughout the year. Where this is not the case and data refer only to a specific time period, this is stated in the appropriate text. These studies applied three different methodologies to the calculation of seabird flight heights: i. Assignment to flight classes during boat-based surveys undertaken to inform EIAs; ii. Estimation of height during land-based sea-watching (e.g. Kruger & Garthe 2001; Walls et al.
2004; Parnell et al. 2005); iii. Direct measurement by radar (e.g. Day et al. 2004; Shamoun-Baranes & van Loon 2006). Digital aerial surveys have been widely used in recent years to inform the EIA process for offshore wind farms. These methods have the potential not only to inform on baseline numbers of birds, but also on flight heights. Data on flight heights from these methods have not been used in this review – primarily because information on flight heights was required at a species-specific level – though they have undoubted potential and might offer a future alternative to data from boat surveys and this is discussed later. These sources were reviewed for information for all seabird and sea duck species assessed by Langston (2010) – see Appendix 1. In practice, however, information was not available for all those listed in that review. For the purposes of this review, the species considered were those typically associated with the marine environment – seabirds, sea duck, divers and grebes. Other species, including waders, wildfowl and passerines, are considered in a separate review (Wright et al. 2012). 2.1 Flight heights As part of EIAs, information on the flight height of seabirds is collected during boat-based surveys following the standard methodology of Camphuysen et al. (2004). Under this methodology, birds in flight are assigned to height classes in order to provide an estimate of the number of birds at risk of collision. Typically, flight classes are defined as (i) below wind turbine rotor sweep, (ii) within wind turbine rotor sweep and (iii) above wind turbine rotor sweep. However, the varying size and design of wind turbines means that the de-lineation of these classes varies between wind farms. Consequently, combining data for analysis from different wind farms presents difficulties. For each species, we modelled all available flight height data assigned to height bands during boat-based surveys of offshore wind farms, using a spline function, which fits a curve to the data. It was assumed that for each species, flight heights would follow a similar distribution across all study sites. Knot locations were determined by calculating evenly spaced quantiles of the height bands from all sites, using the mid-points of the bands. Initially, splines were fitted with six knots as this would allow a bimodal distribution (up to two “peaks”), without risking over-fitting the data. Where models failed to converge, a spline with six knots may have been inappropriate and fewer knots were considered. Initial values for the spline were calculated from the study site with the greatest number of birds. The model was then repeated using data from all study sites. A procedure was written in R (R

14
Development Core Team), which estimated parameters of the spline to optimise the fit of the data to the model. As there was evidence that there was some variation in the flight height distribution between sites, bootstrapping was carried out to estimate the variance around the mean estimate. Models were run for 500 bootstraps, each with a random sample of sites equal to the original number of sites. Some of the bootstrap samples failed to converge, and this was likely to indicate more substantial variation between sites, and may lead to bias in the subsequent estimate of variance. Therefore to account for this potential bias the number of bootstraps where the model failed to converge was used as an indication of confidence in the estimate of variance. For each bootstrap the proportion of birds flying at each height between 0 and 300 m above sea-level, in 1 m intervals, was calculated. The final results presented are the median of all of these values, and the associated 95 % confidence intervals calculated from the bootstrap values. For each species, the proportion of birds flying within a generic collision risk window, defined as covering a range from 20 m to 150 m above sea-level, was calculated. Model fit was assessed in two ways. Firstly, the spline was plotted and its shape compared to the observed data points. As the splines were universally heavily weighted towards lower heights, observed proportions in each height category were plotted against the lower limit of the height band. Secondly the models were used to predict the numbers of birds within each survey height band and these estimates were compared to the observed data proportions. Finally, where sufficient data were available from previous sea-watching and radar monitoring of flight movements, the species-specific proportion of birds within the generic collision risk zone was discussed in relation to the mean and range of flight heights observed in those studies. Concerns have been raised that flight height distributions may vary with distance from shore on a site-specific basis. To test this, the residuals of the proportion of birds in each height band were correlated with distance to shore. A more detailed description of the modelling methodology is available in appendix 2. 2.2 Avoidance rates Collision risk modelling is strongly influenced by the avoidance rate considered (Chamberlain et al. 2006). As a result, a range of avoidance rates are typically used in EIAs to indicate the possible risks of collision posed by offshore wind farms. For example, Band et al. (2007) considered a rate of 0.9999 in situations where avoidance was believed to be high, a rate of 0.9962 in situations where avoidance was believed to be moderate and a rate of 0.87 in situations where avoidance was believed to be low. The revised guidance for the model provided for an offshore context allows for estimates to be produced with avoidance rates of 0.95, 0.98, 0.99 and 0.995. The exact avoidance rate is likely to depend on a variety of factors including climate, the presence of mitigation measures (Cook et al. 2011) and the flight capability and visual acuity of the species under consideration (Martin & Shaw 2010, Martin 2011). However, real avoidance rates of bird species in relation to both onshore and offshore wind farms are poorly understood (Fox et al. 2006). As above, both EIAs and peer-reviewed literature were searched to review existing information on avoidance rates.

15
3. RESULTS 3.1 Flight heights Table 3.1 Modelled proportion of birds flights within the collision risk window for a turbine
with rotor blades a minimum of 20 m above sea-level and a diameter of 130 m. Sample
Size Study Sites
% at Collision Risk Height (95 %
confidence limits)
Model Fit
Confidence1
Common Eider 34513 11 *** *** *** Common Scoter 30847 18 1.0 (<0.1 – 17.0) 0.92 VERY HIGH Red-throated Diver 9715 19 2.0 (<0.1 – 22.4) 0.87 HIGH Black-throated Diver 126 6 0.1 (<0.1 – 30.5) 0.83 MODERATE Northern Fulmar 29168 21 0.2 (<0.1 – 22.1) 0.98 VERY HIGH Manx Shearwater 6957 10 0.04 (<0.01 -10.1) 0.92 MODERATE Northern Gannet 44851 27 9.6 (<0.1 – 19.9) 0.94 VERY HIGH Great Cormorant 20227 14 *** *** *** European Shag 233 4 12.4 (1.9 – 59.6) 0.74 MODERATE Arctic Skua 331 12 3.8 (<0.1 – 15.7) 0.91 MODERATE Great Skua 1202 12 4.3 (1.2 – 28.4) 0.93 HIGH Black-legged Kittiwake 62975 26 15.7 (7.9 - 23.6) 0.95 VERY HIGH Black-headed Gull 4490 17 7.9 (0.4 – 50.1) 0.75 VERY HIGH Little Gull 3851 14 5.5 (0.5 – 23.6) 0.95 MODERATE Common Gull 10190 20 22.9 (8.5 – 46.9) 0.87 HIGH Lesser Black-backed Gull
35142 24 25.2 (7.8 – 51.6) 0.83 VERY HIGH
Herring Gull 25252 20 28.4 (15.9 – 48.1) 0.90 VERY HIGH Great Black-backed Gull
8911 19 33.1 (18.2 – 57.1) 0.88 VERY HIGH
Sandwich Tern 33392 21 3.6 (0.7 – 34.9) 0.94 MODERATE Common Tern 19332 19 12.7 (6.0 – 18.7) 0.92 LOW Arctic Tern 2571 9 2.8 (<0.1 – 23.4) 0.88 MODERATE Common Guillemot 36260 23 0.01 (<0.01 – 3.9) 0.96 MODERATE Razorbill 13171 19 0.4 (<0.1 – 25.1) 0.96 HIGH Little Auk 1287 5 0.03 (<0.01 – 15.3) 0.99 HIGH Atlantic Puffin 5981 9 0.1 (<0.1 – 7.9) 0.88 MODERATE 1Based of number of bootstraps for which the model failed to converge – All bootstraps converged, very high, >400 bootstraps converging, high, 200 - 400 bootstraps converging, moderate, <200 bootstraps converging, low. *** Models for Common Eider and Great Cormorant would not converge In total, 40 surveys carried out as part of EIAs covering 32 existing or proposed wind farms and wind farm zones in the UK and Europe were sourced – Argyll Array, Barrow, Blyth, Burbo Bank, Docking Shoal, Dogger Bank, Dudgeon, Greater Gabbard, Gunfleet Sands, Gwynt Y Mor, Humber Gateway, Islay, Kentish Flats, Lincs, London Array, Lyn & Inner Dowsing, Moray Firth, Neart na Gaotihe, North Hoyle, Race Bank, Rampion, Sheringham Shoal, West of Duddon Sands and Westernmost Rough in

16
the UK, Meetpost Nordwijk and Egmond aan Zee in the Netherlands, Tunø Knob, Nysted and Horns Rev in Denmark, Thorntonbank and Zeebrugge in Belgium and Wangerooge in Germany. In total 427936 birds of 39 species were identified and assigned to variety of flight height bands. There were sufficient data to construct models for 25 species (Table 3.1). 3.1.1 Common Eider Somateria mollissima A total of 34,513 Common Eiders were recorded during surveys of 11 sites – Barrow, Blyth, Dogger Bank, Gunfleet Sands, Gwynt Y Mor, Neart na Gaoithe, Rampion, Nysted and Tunø Knob in Denmark, Wangerooge in Germany and Egmond aan Zee offshore wind farm in the Netherlands. Models for Common Eiders failed to converge. Attempts were made to distinguish between sites where Common Eiders were likely to be recorded during migration and those where they were resident, however, this had no impact on model performance. This may indicate that flight behaviour in Common Eiders is highly variable between sites. 3.1.2 Long-tailed Duck Clangula hyemalis A total of 114 Long-tailed Ducks were recorded during three studies of three sites – Burbo Bank, St. Lawrence Island in Alaska and Nantucket Sound in Massachusetts. Of these, none were recorded flying at heights that placed them at risk of collision with wind turbine blades. Mean estimated flight height was 1.9 m above sea-level (range = 0- 10 M). 3.1.3 Common Scoter Melanitta nigra A total of 30847 Common Scoter were recorded during 22 studies of 18 sites – Barrow, Blyth, Burbo Bank, Docking Shoal, Dogger Bank, Greater Gabbard, Gunfleet Sands, Gwynt Y Mor, Humber Gateway, Kentish Flats, London Array, Lynn & Inner Dowsing, North Hoyle, Rampion West of Duddon Sands, Horns Rev in Denmark, Thorntonbank in Belgium and Wangerooge in Germany. The model for Common Scoter shows most birds restricted to low altitudes, well below the minimum height of any turbines rotor blades. The model proved to be a very good fit for the observed data (R = 0.92). Assuming a turbine with a minimum rotor blade height of 20 m and a maximum rotor blade height of 150 m, approximately 1.0% (95 % CIs <0.1 – 17.0 %) of flights by Common Scoters are likely to be at a height which places them at risk of collision with turbine blades (Table 3.1, Figure 3.1). All 500 bootstraps converged, indicating that no site was likely to be having an undue influence on the final models. There was no significant relationship between distance from shore and the predicted and observed data. This is indicative of the proportion of Common Scoters flying at each height being consistent between sites. This relatively low risk of collision is reflected in the low mean value estimated from previous studies of Common Scoter flight heights of 9.4 m (range 0 – 30 m) (Walls et al. 2004; Parnell et al. 2005; Petersen et al. 2005; Sadoti et al. 2005).

17
Figure 3.1 Common Scoter (Left) Median modelled height distribution based on boat-based
survey data (red line), height distribution based on each bootstrap also shown (grey lines), plotted with raw data showing the proportion of birds in each height band. (Right) Modelled vs observed proportions of birds in each height band. (Circle diameter is proportional to the square root of the number of birds recorded in each band).
3.1.4 Velvet Scoter Melanitta fusca A total of 20 Velvet Scoters was recorded during four studies of three sites – Gunfleet Sands, Gwynt Y Mor and Weybourne. Of these, none were recorded flying at a height that placed them at risk of collision with wind turbine blades. Birds at Weybourne were observed flying at a mean height of 1 m above sea-level, well below the generic collision risk window. 3.1.5 Red-throated Diver Gavia stellata A total of 9715 Red-throated Divers were recorded during 22 studies of 18 sites – Barrow, Burbo Bank, Docking Shoal, Dogger Bank, Greater Gabbard, Gunfleet Sands, Gwynt Y Mor, Humber Gateway, Kentish Flats, Lincs, London Array, Lynn & Inner Dowsing, North Hoyle, West of Duddon Sands, Horns Rev in Denmark, Thorntonbank in Belgium, Egmond aan Zee wind farm in the Netherlands and Wangerooge in Germany. The model for Red-throated Diver shows most birds restricted to low altitudes, well below the minimum height of any turbines rotor blades. The model proved to be a very good fit for the observed data (R = 0.87). Assuming a turbine with a minimum rotor blade height of 20 m and a maximum rotor blade height of 150 m, approximately 2.0 % (95 % CIs <0.1 – 22.4) of flights by Red-throated Divers are likely to be at a height which places them at risk of collision with turbine blades (Table 3.1, Figure 3.2). Only 28 bootstraps failed to converge, indicating that the models are unlikely to have been biased towards particular sites. There was no significant relationship between distance from shore and the residuals of the proportion of birds in each band, indicating that flight height distribution is unlikely to vary with distance to shore.

18
This relatively low risk of collision is reflected in the low mean value estimated from previous studies of Red-throated Diver flight heights of 4.5 m (range 1 – 21 m) (Walls et al. 2004; Parnell et al. 2005; Sadoti et al. 2005).
Figure 3.2 Red-throated Diver (Left) Median modelled height distribution based on boat-based
survey data (red line), height distribution based on each bootstrap also shown (grey lines), plotted with raw data showing the proportion of birds in each height band. (Right) Modelled vs observed proportions of birds in each height band. (Circle diameter is proportional to the square root of the number of birds recorded in each band).
3.1.6 Black-throated Diver Gavia arctica A total of 126 Black-throated Divers was recorded during seven studies of six sites – Dogger Bank, Gunfleet Sands, Gwynt Y Mor, Kentish Flats, London Array and North Hoyle. The model for Black-throated Diver shows birds largely restricted to low altitudes, below the minimum height of any turbines rotor blades. The model proved to be a reasonable fit for the observed data (R = 0.83). Assuming a turbine with a minimum rotor blade height of 20 m and a maximum rotor blade height of 150 m, approximately 0.1 % (95% CIs <0.1 – 30.5) of flights by Black-throated Divers are likely to be at a height which places them at risk of collision with turbine blades (Table 3.1, Figure 3.3).
Figure 3.3 Black-throated Diver (Left) Median modelled height distribution based on boat-based
survey data (red line), height distribution based on each bootstrap also shown (grey

19
lines), plotted with raw data showing the proportion of birds in each height band. (Right) Modelled vs observed proportions of birds in each height band. (Circle diameter is proportional to the square root of the number of birds recorded in each band).
Only 314 bootstraps converged, indicating that the models may have been biased towards particular sites. However, there was no significant relationship between distance from shore and the residuals of the proportion of birds in each band, indicating that flight height distribution is unlikely to vary with distance to shore. 3.1.7 Great Northern Diver Gavia immer A total of 14 Great Northern Divers were recorded during five studies at four offshore wind farm sites: Argyll Array, Humber Gateway, Gwynt Y Mor and Burbo Bank. Of these, none recorded Great Northern Divers flying within the generic collision risk zone. No estimates were available to provide a mean flight height. 3.1.8 Northern Fulmar Fulmarus glacialis A total of 29168 Northern Fulmar were recorded during 25 studies of 21 sites – Argyll Array, Barrow, Docking Shoal, Dudgeon, Dogger Bank, Greater Gabbard, Gunfleet Sands, Gwynt Y Mor, Humber Gateway, Islay, Kentish Flats, London Array, Lynn & Inner Dowsing, Moray Firth, Neart na Gaoithe, North Hoyle, Race Back, Rampion, West of Duddon Sands and Meetpost Nordwijk and Egmond aan Zee wind farm in the Netherlands. The model for Northern Fulmar shows most birds restricted to low altitudes, well below the minimum height of any turbines rotor blades. The model proved to be a very good fit for the observed data (R = 0.98). Assuming a turbine with a minimum rotor blade height of 20 m and a maximum rotor blade height of 150 m, approximately 0.2 % (95 % CIs <0.1 – 22.1) of flights by Northern Fulmar are likely to be at a height which places them at risk of collision with turbine blades (Table 3.1, Figure 3.4). All 500 bootstraps converged, indicating that no site was likely to be having an undue influence on the final models. There was no significant relationship between distance from shore and the predicted and observed data. This is indicative of the proportion of Northern Fulmars flying at each height being consistent between sites.
Figure 3.4 Resident Northern Fulmar (Left) Median modelled height distribution based on boat-
based survey data (red line), height distribution based on each bootstrap also shown

20
(grey lines), plotted with raw data showing the proportion of birds in each height band. (Right) Modelled vs observed proportions of birds in each height band. (Circle diameter is proportional to the square root of the number of birds recorded in each band).
3.1.9 Sooty Shearwater Puffinus griseus A total of two Sooty Shearwaters was recorded during two studies of two sites – Humber Gateway and Weybourne. Of these, neither was flying at a level which placed it at risk of collision with wind turbine blades. The bird recorded at Weybourne was observed flying at a height of approximately 1 m above sea-level. 3.1.10 Manx Shearwater Puffinus puffinus A total of 6957 Manx Shearwaters were recorded during 10 studies of 10 offshore wind farm sites – Argyll Array, Dogger Bank, Gwynt Y Mor, Humber Gateway, Islay, Moray Firth, Neart na Gaoithe, North Hoyle, Rampion and West of Duddon Sands.
Figure 3.5 Manx Shearwater (Left) Median modelled height distribution based on boat-based
survey data (red line), height distribution based on each bootstrap also shown (grey lines), plotted with raw data showing the proportion of birds in each height band. (Right) Modelled vs observed proportions of birds in each height band. (Circle diameter is proportional to the square root of the number of birds recorded in each band).
The model for Manx Shearwater shows birds largely restricted to low altitudes, well below the minimum height of any turbines rotor blades, with only 0.04% (95 % CIs <0.01 – 10.1) at a height which placed them at risk of collision (Table 3.1, Figure 3.5). The model proved to be a very good fit for the observed data (R = 0.92). Only 341 bootstraps converged, indicating that the models may have been biased towards particular sites. However, there was no significant relationship between distance from shore and the residuals of the proportion of birds in each band, indicating that flight height distribution is unlikely to vary with distance to shore.
21
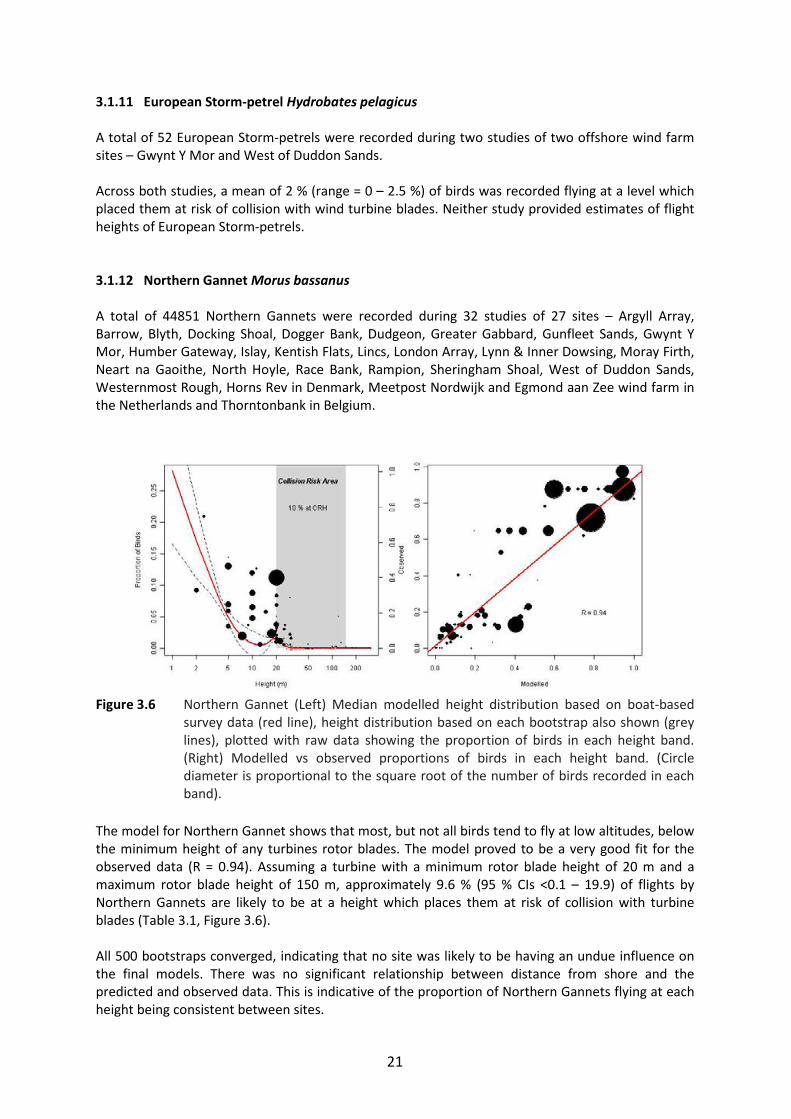
3.1.11 European Storm-petrel Hydrobates pelagicus A total of 52 European Storm-petrels were recorded during two studies of two offshore wind farm sites – Gwynt Y Mor and West of Duddon Sands. Across both studies, a mean of 2 % (range = 0 – 2.5 %) of birds was recorded flying at a level which placed them at risk of collision with wind turbine blades. Neither study provided estimates of flight heights of European Storm-petrels. 3.1.12 Northern Gannet Morus bassanus A total of 44851 Northern Gannets were recorded during 32 studies of 27 sites – Argyll Array, Barrow, Blyth, Docking Shoal, Dogger Bank, Dudgeon, Greater Gabbard, Gunfleet Sands, Gwynt Y Mor, Humber Gateway, Islay, Kentish Flats, Lincs, London Array, Lynn & Inner Dowsing, Moray Firth, Neart na Gaoithe, North Hoyle, Race Bank, Rampion, Sheringham Shoal, West of Duddon Sands, Westernmost Rough, Horns Rev in Denmark, Meetpost Nordwijk and Egmond aan Zee wind farm in the Netherlands and Thorntonbank in Belgium.
Figure 3.6 Northern Gannet (Left) Median modelled height distribution based on boat-based
survey data (red line), height distribution based on each bootstrap also shown (grey lines), plotted with raw data showing the proportion of birds in each height band. (Right) Modelled vs observed proportions of birds in each height band. (Circle diameter is proportional to the square root of the number of birds recorded in each band).
The model for Northern Gannet shows that most, but not all birds tend to fly at low altitudes, below the minimum height of any turbines rotor blades. The model proved to be a very good fit for the observed data (R = 0.94). Assuming a turbine with a minimum rotor blade height of 20 m and a maximum rotor blade height of 150 m, approximately 9.6 % (95 % CIs <0.1 – 19.9) of flights by Northern Gannets are likely to be at a height which places them at risk of collision with turbine blades (Table 3.1, Figure 3.6). All 500 bootstraps converged, indicating that no site was likely to be having an undue influence on the final models. There was no significant relationship between distance from shore and the predicted and observed data. This is indicative of the proportion of Northern Gannets flying at each height being consistent between sites.

22
Previous studies estimated mean flight heights for Northern Gannet at 10 m (range 0 – 200 m) (Walls et al. 2004; Parnell et al. 2005; Sadoti et al. 2005). 3.1.13 Great Cormorant Phalacrocorax carbo A total of 20,227 Great Cormorants were recorded during 17 studies of 14 sites – Barrow, Blyth, Burbo Bank, Dogger Bank, Gunfleet Sands, Gwynt Y Mor, Humber Gateway, Kentish Flats, London Array, North Hoyle, Rampion, Horns Rev and Nysted offshore wind farms in Denmark and Egmond aan Zee wind farm in the Netherlands. Models for Great Cormorant did not converge, the likely reason is that flight heights between offshore wind farm zones appeared highly variable. The proportion of birds flying at collision risk height, assuming a turbine with a minimum rotor blade height of 20 m and a maximum rotor blade height of 150 m, varied from 4 % at Kentish Flats to 33 % at Gunfleet Sands. Previous investigations of cormorant flight heights estimated a relatively low mean height of 8.3 m (range 1 – 150 m) within a relatively wide range (Walls et al. 2004; Parnell et al. 2005; Petersen et al. 2005) and Krijgsveld et al. (2011) reported that the majority of birds at Egmond aan Zee flew at heights of less than 5 m. 3.1.14 European Shag Phalacrocorax aristotelis A total of 233 European Shags were recorded during five studies of four offshore wind farm sites – Barrow, Dogger Bank Gwynt Y Mor and North Hoyle. The model for European Shag shows that most, but not all birds tend to fly at low altitudes, below the minimum height of any turbines rotor blades. The model proved to be a very good fit for the observed data (R = 0.74). Assuming a turbine with a minimum rotor blade height of 20 m and a maximum rotor blade height of 150 m, approximately 12.4 % (95 % CIs 1.9 – 59.6) of flights by European Shags are likely to be at a height which places them at risk of collision with turbine blades (Table 3.1, Figure 3.7). Only 314 bootstraps converged, indicating that the models may have been biased towards particular sites. However, there was no significant relationship between distance from shore and the residuals of the proportion of birds in each band, indicating that flight height distribution is unlikely to vary with distance to shore.
Figure 3.7 European Shags (Left) Median modelled height distribution based on boat-based
survey data (red line), height distribution based on each bootstrap also shown (grey

23
lines), plotted with raw data showing the proportion of birds in each height band. (Right) Modelled vs observed proportions of birds in each height band. (Circle diameter is proportional to the square root of the number of birds recorded in each band).
3.1.15 Great Crested Grebe Podiceps cristatus A total of 82 Great Crested Grebes were recorded during four studies of four offshore wind farm sites – Gunfleet Sands, Gwynt Y Mor, Kentish Flats and Egmond aan Zee wind farm in the Netherlands. Of these, none recorded Great Crested Grebes flying within the generic collision risk zone. No estimates were available to provide a mean flight height. 3.1.16 Red-necked Grebe Podiceps grisegena A single Red-necked Grebe was recorded during a survey of North Hoyle offshore wind farm. It was not recorded as flying within the generic collision risk zone and no estimate of its flight height was made. 3.1.17 Arctic Skua Stercorarius parasiticus A total of 331 Arctic Skuas were recorded during 14 studies of 12 sites – Argyll Array, Barrow, Dogger Bank, Greater Gabbard, Gwynt Y Mor, Humber Gateway, Islay, Kentish Flats, Lynn & Inner Dowsing, Moray Firth, North Hoyle and Rampion. The model for Arctic Skua shows that most birds tend to fly at low altitudes, below the minimum height of any turbines rotor blades. The model proved to be a very good fit for the observed data (R = 0.91). Assuming a turbine with a minimum rotor blade height of 20 m and a maximum rotor blade height of 150 m, approximately 3.8 % (95 % CIs <0.1 – 15.7) of flights by Arctic Skuas are likely to be at a height which places them at risk of collision with turbine blades (Table 3.1, Figure 3.8). Only 327 bootstraps converged, indicating that the models may have been biased towards particular sites. However, there was no significant relationship between distance from shore and the residuals of the proportion of birds in each band, indicating that flight height distribution is unlikely to vary with distance to shore.
Figure 3.8 Arctic Skua (Left) Median modelled height distribution based on boat-based survey
data (red line), height distribution based on each bootstrap also shown (grey lines), plotted with raw data showing the proportion of birds in each height band. (Right)

24
Modelled vs observed proportions of birds in each height band. (Circle diameter is proportional to the square root of the number of birds recorded in each band).
3.1.18 Great Skua Stercorarius skua A total of 1202 Great Skuas was recorded during 14 studies of 11 offshore wind farm sites – Argyll Array, Dogger Bank, Greater Gabbard, Gwynt Y Mor, Humber Gateway, Islay, Lynn & Inner Dowsing, Moray Firth, Neart na Gaoithe, North Hoyle and Rampion. The model for Great Skua shows that most birds tend to fly at low altitudes, below the minimum height of any turbines rotor blades. The model proved to be a very good fit for the observed data (R = 0.93). Assuming a turbine with a minimum rotor blade height of 20 m and a maximum rotor blade height of 150 m, approximately 4.3 % (95 % CIs 1.2 –28.4) of flights by Great Skuas are likely to be at a height which places them at risk of collision with turbine blades (Table 3.1, Figure 3.9). Only 14 bootstraps failed to converge, indicating that the models are unlikely to have been biased towards particular sites. There was no significant relationship between distance from shore and the residuals of the proportion of birds in each band, indicating that flight height distribution is unlikely to vary with distance to shore.
Figure 3.9 Great Skua (Left) Median modelled height distribution based on boat-based survey
data (red line), height distribution based on each bootstrap also shown (grey lines), plotted with raw data showing the proportion of birds in each height band. (Right) Modelled vs observed proportions of birds in each height band. (Circle diameter is proportional to the square root of the number of birds recorded in each band).
3.1.19 Black-legged Kittiwake Rissa tridactyla A total of 62975 Black-legged Kittiwakes were recorded during 29 studies of 25 sites – Argyll Array, Barrow, Blyth, Docking Shoal, Dogger Bank, Greater Gabbard, Gunfleet Sands, Gwynt Y Mor, Humber Gateway, Islay, Kentish Flats, London Array, Lynn & Inner Dowsing, Moray Firth, Neart na Gaoithe, North Hoyle, Race Bank, Rampion, West of Duddon Sands, Westernmost Rough, Weybourne, Meetpost Nordwijk and Egmond aan Zee wind farm in the Netherlands, Thorntonbank in Belgium and St. Lawrence Island in Alaska. The model for Black-legged Kittiwake shows that most, but not all birds tend to fly at low altitudes, below the minimum height of any turbine’s rotor blades. The model proved to be a very good fit for the observed data (R = 0.95). Assuming a turbine with a minimum rotor blade height of 20 m and a maximum rotor blade height of 150 m, approximately 15.7 % (95 % CIs 7.9 – 23.6) of flights by Black-

25
legged Kittiwakes are likely to be at a height which places them at risk of collision with turbine blades (Table 3.1, Figure 3.10).
Figure 3.10 Black-legged Kittiwake (Left) Median modelled height distribution based on boat-
based survey data (red line), height distribution based on each bootstrap also shown (grey lines), plotted with raw data showing the proportion of birds in each height band. (Right) Modelled vs observed proportions of birds in each height band. (Circle diameter is proportional to the square root of the number of birds recorded in each band).
All 500 bootstraps converged, indicating that no site was likely to be having an undue influence on the final models. There was no significant relationship between distance from shore and the predicted and observed data. This is indicative of the proportion of Black-legged Kittiwakes flying at each height being consistent between sites. Previous studies estimated mean flight heights for Black-legged Kittiwakes at 7.4 m (range 5 – 20 m) (Day et al. 2003; Walls et al. 2004; Parnell et al. 2005). 3.1.20 Black-headed Gull Chroicocephalus ridibundus A total of 4490 Black-headed Gulls were recorded during 20 studies of 17 sites – Barrow, Blyth, Dogger Bank, Greater Gabbard, Gunfleet Sands, Gwynt Y Mor, Humber Gateway, Kentish Flats, London Array, Lynn & Inner Dowsing, Neart na Gaoithe, North Hoyle, Rampion, West of Duddon Sands, Thorntonbank in Belgium and two sites in the Netherlands. The model for Black-headed Gulls shows that most, but not all birds tend to fly at low altitudes, below the minimum height of any turbines rotor blades. The model proved to be a reasonable fit for the observed data (R = 0.75). Assuming a turbine with a minimum rotor blade height of 20 m and a maximum rotor blade height of 150 m, approximately 7.9 % (95 % CIs 0.4 – 50.1) of flights by Black-headed Gulls are likely to be at a height which places them at risk of collision with turbine blades (Table 3.1, Figure 3.11). All 500 bootstraps converged, indicating that no site was likely to be having an undue influence on the final models. There was no significant relationship between distance from shore and the predicted and observed data. This is indicative of the proportion of Black-headed Gulls flying at each height being consistent between sites.

26
Previous studies estimated mean flight heights for Black-headed Gulls at 29 m (range 1 – 200 m), however, there was wide variation around this value (Day et al. 2003; Walls et al. 2004; Parnell et al. 2005).
Figure 3.11 Black-headed Gull (Left) Median modelled height distribution based on boat-based
survey data (red line), height distribution based on each bootstrap also shown (grey lines), plotted with raw data showing the proportion of birds in each height band. (Right) Modelled vs observed proportions of birds in each height band. (Circle diameter is proportional to the square root of the number of birds recorded in each band).
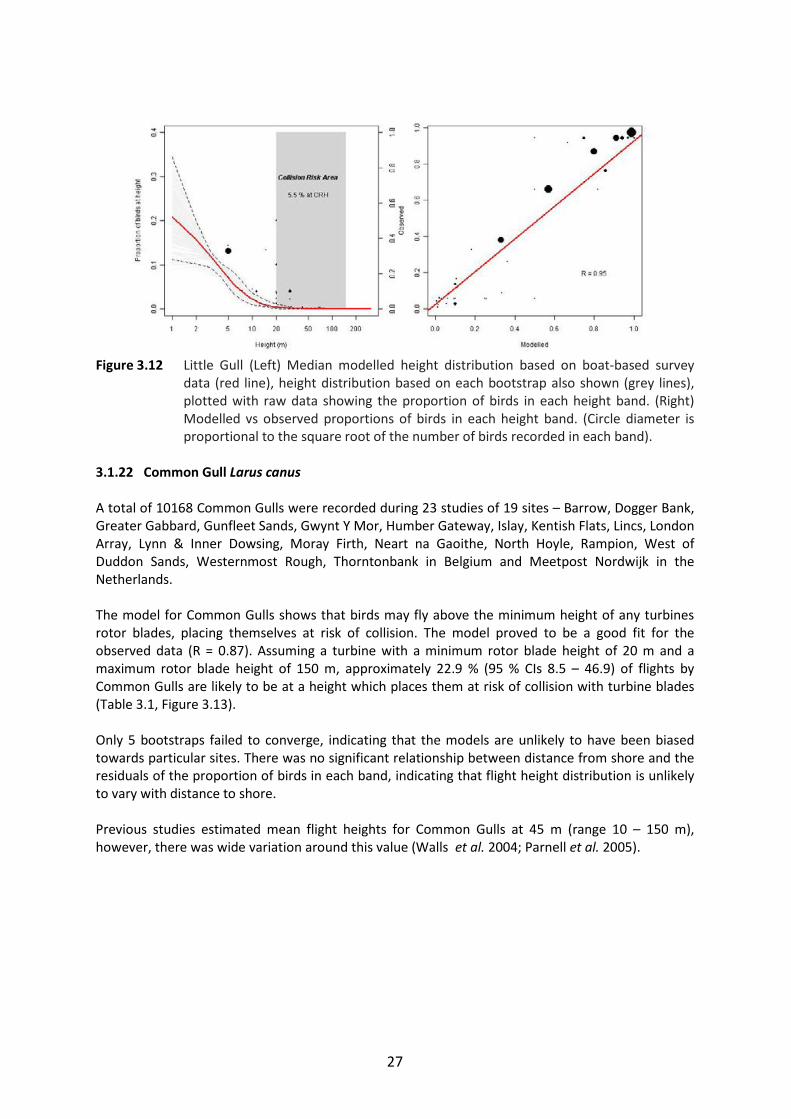
3.1.21 Little Gull Hydrocoloeus minutus A total of 3851 Little Gulls were recorded during 18 studies of 16 sites – Dogger Bank, Greater Gabbard, Gunfleet Sands, Gwynt Y Mor, Humber Gateway, Kentish Flats, Lincs, London Array, Lynn & Inner Dowsing, Neart na Gaoithe, Race Bank, Rampion, Sheringham Shoal, West of Duddon Sands, Horns Rev in Denmark and Meetpost Nordwijk in the Netherlands. The model for Little Gulls shows birds tend to fly at low altitudes, below the minimum height of any turbines rotor blades. The model proved to be a good fit for the observed data (R = 0.95). Assuming a turbine with a minimum rotor blade height of 20 m and a maximum rotor blade height of 150 m, approximately 5.5 % (95 % CIs 0.5 – 23.6) of flights by Little Gulls are likely to be at a height which places them at risk of collision with turbine blades (Table 3.1, Figure 3.12). Only 204 bootstraps converged, indicating that the models are likely to been biased towards particular sites. However, there was no significant relationship between distance from shore and the residuals of the proportion of birds in each band, indicating that flight height distribution is unlikely to vary with distance to shore. Previous studies estimated mean flight heights for Little Gulls at 67 m (range 4 – 250 m), however, there was wide variation around this value (Walls et al. 2004; Parnell et al. 2005).
27
Figure 3.12 Little Gull (Left) Median modelled height distribution based on boat-based survey
data (red line), height distribution based on each bootstrap also shown (grey lines), plotted with raw data showing the proportion of birds in each height band. (Right) Modelled vs observed proportions of birds in each height band. (Circle diameter is proportional to the square root of the number of birds recorded in each band).
3.1.22 Common Gull Larus canus A total of 10168 Common Gulls were recorded during 23 studies of 19 sites – Barrow, Dogger Bank, Greater Gabbard, Gunfleet Sands, Gwynt Y Mor, Humber Gateway, Islay, Kentish Flats, Lincs, London Array, Lynn & Inner Dowsing, Moray Firth, Neart na Gaoithe, North Hoyle, Rampion, West of Duddon Sands, Westernmost Rough, Thorntonbank in Belgium and Meetpost Nordwijk in the Netherlands. The model for Common Gulls shows that birds may fly above the minimum height of any turbines rotor blades, placing themselves at risk of collision. The model proved to be a good fit for the observed data (R = 0.87). Assuming a turbine with a minimum rotor blade height of 20 m and a maximum rotor blade height of 150 m, approximately 22.9 % (95 % CIs 8.5 – 46.9) of flights by Common Gulls are likely to be at a height which places them at risk of collision with turbine blades (Table 3.1, Figure 3.13). Only 5 bootstraps failed to converge, indicating that the models are unlikely to have been biased towards particular sites. There was no significant relationship between distance from shore and the residuals of the proportion of birds in each band, indicating that flight height distribution is unlikely to vary with distance to shore. Previous studies estimated mean flight heights for Common Gulls at 45 m (range 10 – 150 m), however, there was wide variation around this value (Walls et al. 2004; Parnell et al. 2005).

28
Figure 3.13 Common Gull (Left) Median modelled height distribution based on boat-based survey
data (red line), height distribution based on each bootstrap also shown (grey lines), plotted with raw data showing the proportion of birds in each height band. (Right) Modelled vs observed proportions of birds in each height band. (Circle diameter is proportional to the square root of the number of birds recorded in each band).
3.1.23 Lesser Black-backed Gull Larus fuscus A total of 35114 Lesser Black-backed Gulls were recorded during 29 studies of 23 sites – Barrow, Docking Shoal, Dogger Bank, Dudgeon, Greater Gabbard, Gunfleet Sands, Gwynt Y Mor, Islay, Kentish Flats, Lincs, London Array, Lynn & Inner Dowsing, Moray Firth, Neart na Gaoithe, North Hoyle, Race Bank, Rampion, Sheringham Shoal, West of Duddon Sands, Westernmost Rough Thorntonbank in Belgium, and two sites in the Netherlands. The model for Lesser Black-backed Gulls shows that some birds may fly above the minimum height of any turbines rotor blades, placing themselves at risk of collision. The model proved to be a good fit for the observed data (R = 0.83). Assuming a turbine with a minimum rotor blade height of 20 m and a maximum rotor blade height of 150 m, approximately 25.2 % (95 % CIs 7.8 – 51.6) of flights by Lesser Black-backed Gulls are likely to be at a height which places them at risk of collision with turbine blades (Table 3.1, Figure 3.14). All 500 bootstraps converged, indicating that no site was likely to be having an undue influence on the final models. There was no significant relationship between distance from shore and the predicted and observed data. This is indicative of the proportion of Lesser Black-backed Gulls flying at each height being consistent between sites. Previous studies estimated mean flight heights for Lesser Black-backed Gulls at 170 m (range 20 – 200 m), however, there was wide variation around this value (Walls et al. 2004; Parnell et al. 2005).

29
Figure 3.14 Lesser Black-backed Gulls (Left) Median modelled height distribution based on boat-
based survey data (red line), height distribution based on each bootstrap also shown (grey lines), plotted with raw data showing the proportion of birds in each height band. (Right) Modelled vs observed proportions of birds in each height band. (Circle diameter is proportional to the square root of the number of birds recorded in each band).
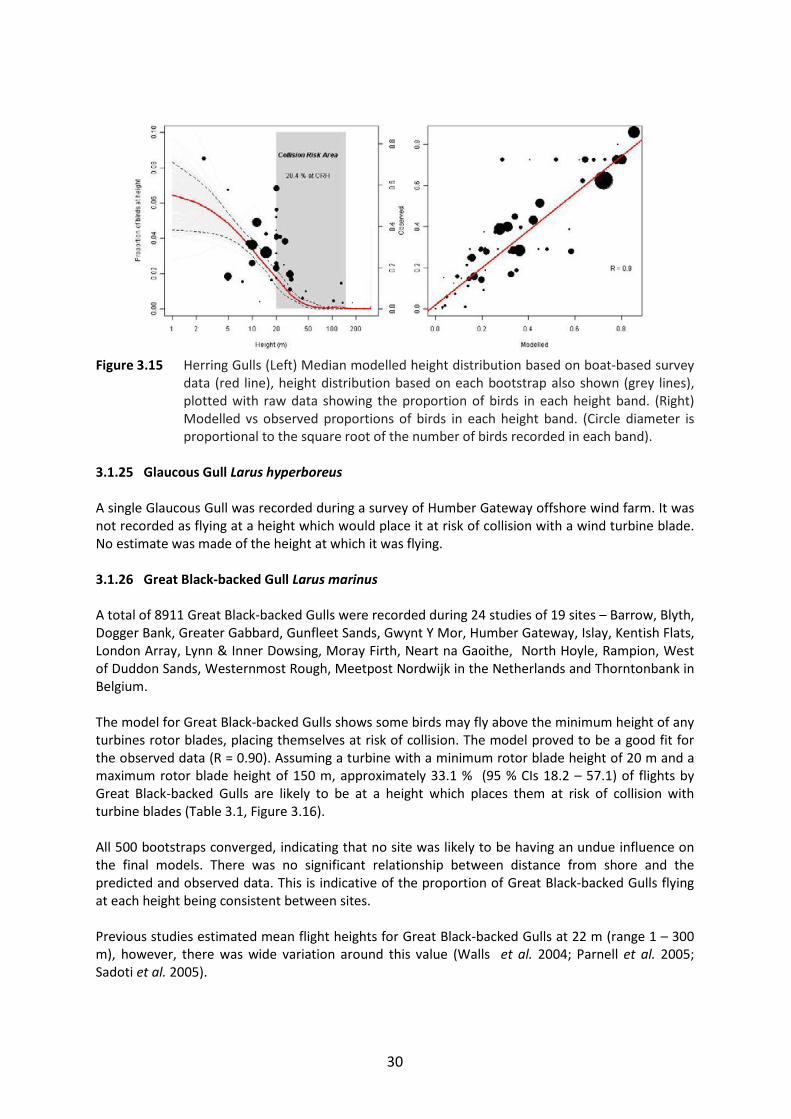
3.1.24 Herring Gull Larus argentatus A total of 25153 Herring Gulls were recorded during 24 studies of 19 sites – Barrow, Blyth, Dogger Bank, Greater Gabbard, Gunfleet Sands, Gwynt Y Mor, Humber Gateway, Islay, Kentish Flats, London Array, Lynn & Inner Dowsing, Moray Firth, Neart na Gaoithe, North Hoyle, Rampion, West of Duddon Sands, Westernmost Rough, Meetpost Nordwijk in the Netherlands and Thorntonbank in the Belgium. The model for Herring Gulls shows some birds may fly above the minimum height of any turbines rotor blades, placing themselves at risk of collision. The model proved to be a good fit for the observed data (R = 0.90). Assuming a turbine with a minimum rotor blade height of 20 m and a maximum rotor blade height of 150 m, approximately 28.4 % (95 % CIs 15.9 – 48.1) of flights by Herring Gulls are likely to be at a height which places them at risk of collision with turbine blades (Table 3.1, Figure 3.15). All 500 bootstraps converged, indicating that no site was likely to be having an undue influence on the final models. There was no significant relationship between distance from shore and the predicted and observed data. This is indicative of the proportion of Herring Gulls flying at each height being consistent between sites. Previous studies estimated mean flight heights for Herring Gulls at 33 m (range 1 – 300 m), however, there was wide variation around this value (Walls et al. 2004; Parnell et al. 2005; Sadoti et al. 2005).
30
Figure 3.15 Herring Gulls (Left) Median modelled height distribution based on boat-based survey
data (red line), height distribution based on each bootstrap also shown (grey lines), plotted with raw data showing the proportion of birds in each height band. (Right) Modelled vs observed proportions of birds in each height band. (Circle diameter is proportional to the square root of the number of birds recorded in each band).
3.1.25 Glaucous Gull Larus hyperboreus A single Glaucous Gull was recorded during a survey of Humber Gateway offshore wind farm. It was not recorded as flying at a height which would place it at risk of collision with a wind turbine blade. No estimate was made of the height at which it was flying. 3.1.26 Great Black-backed Gull Larus marinus A total of 8911 Great Black-backed Gulls were recorded during 24 studies of 19 sites – Barrow, Blyth, Dogger Bank, Greater Gabbard, Gunfleet Sands, Gwynt Y Mor, Humber Gateway, Islay, Kentish Flats, London Array, Lynn & Inner Dowsing, Moray Firth, Neart na Gaoithe, North Hoyle, Rampion, West of Duddon Sands, Westernmost Rough, Meetpost Nordwijk in the Netherlands and Thorntonbank in Belgium. The model for Great Black-backed Gulls shows some birds may fly above the minimum height of any turbines rotor blades, placing themselves at risk of collision. The model proved to be a good fit for the observed data (R = 0.90). Assuming a turbine with a minimum rotor blade height of 20 m and a maximum rotor blade height of 150 m, approximately 33.1 % (95 % CIs 18.2 – 57.1) of flights by Great Black-backed Gulls are likely to be at a height which places them at risk of collision with turbine blades (Table 3.1, Figure 3.16). All 500 bootstraps converged, indicating that no site was likely to be having an undue influence on the final models. There was no significant relationship between distance from shore and the predicted and observed data. This is indicative of the proportion of Great Black-backed Gulls flying at each height being consistent between sites. Previous studies estimated mean flight heights for Great Black-backed Gulls at 22 m (range 1 – 300 m), however, there was wide variation around this value (Walls et al. 2004; Parnell et al. 2005; Sadoti et al. 2005).

31
Figure 3.16 Great Black-backed Gulls (Left) Median modelled height distribution based on boat-
based survey data (red line), height distribution based on each bootstrap also shown (grey lines), plotted with raw data showing the proportion of birds in each height band. (Right) Modelled vs observed proportions of birds in each height band. (Circle diameter is proportional to the square root of the number of birds recorded in each band).
3.1.27 Black Tern Chlidonias niger A total of six Black Terns were recorded during studies of the Humber Gateway and Kentish Flats offshore wind farms. Of these, none were recorded as flying at heights which placed them at risk of collision with wind turbine blades. Neither study estimated flight height for individual birds. 3.1.28 Sandwich Tern Sterna sandvicensis A total of 33392 Sandwich Terns were recorded during 24 studies of 21 sites – Barrow, Blyth, Docking Shoal, Dogger Bank, Greater Gabbard, Gunfleet Sands, Gwynt Y Mor, Humber Gateway, Kentish Flats, London Array, Lynn & Inner Dowsing, North Hoyle, Race Bank, Rampion, Sheringham Shoal, West of Duddon Sands, Westernmost Rough, Zeebrugge and Thorntonbank in Belgium, Egmond aan Zee wind farm in the Netherlands and Wangerooge in Germany. The model for Sandwich Terns shows birds tend to fly at low altitudes, below the minimum height of any turbines rotor blades. The model proved to be a good fit for the observed data (R = 0.94). Assuming a turbine with a minimum rotor blade height of 20 m and a maximum rotor blade height of 150 m, approximately 3.6 % (95 % CIs 0.7 – 34.9) of flights by Sandwich Terns are likely to be at a height which places them at risk of collision with turbine blades (Table 3.1, Figure 3.17). Only 393 bootstraps converged, indicating that the models may have been biased towards particular sites. However, there was no significant relationship between distance from shore and the residuals of the proportion of birds in each band, indicating that flight height distribution is unlikely to vary with distance to shore. Previous studies estimated mean flight heights for Sandwich Terns at 20 m (range 8 – 80 m) (Walls et al. 2004; Parnell et al. 2005).

32
Figure 3.17 Sandwich Terns (Left) Median modelled height distribution based on boat-based
survey data (red line), height distribution based on each bootstrap also shown (grey lines), plotted with raw data showing the proportion of birds in each height band. (Right) Modelled vs observed proportions of birds in each height band. (Circle diameter is proportional to the square root of the number of birds recorded in each band).
3.1.29 Common Tern Sterna hirundo
A total of 19332 Common Terns were recorded during 23 studies of 19 sites – Dogger Bank, Dudgeon, Greater Gabbard, Gwynt Y Mor, Humber Gateway, Kentish Flats, Lincs, London Array, Lynn & Inner Dowsing, Moray Firth, North Hoyle, Race Bank, Rampion, Sheringham Shoal, West of Duddon Sands, Westernmost Rough, Weybourne and Thorntonbank and Zeebrugge in Belgium. The model for Common Terns shows birds tend to fly at low altitudes, below the minimum height of any turbines rotor blades. The model proved to be a good fit for the observed data (R = 0.92). Assuming a turbine with a minimum rotor blade height of 20 m and a maximum rotor blade height of 150 m, approximately 12.7 % (95 % CIs 6.0 – 18.7) of flights by Common Terns are likely to be at a height which places them at risk of collision with turbine blades (Table 3.1, Figure 3.18). There was no significant relationship between distance from shore and the residuals of the proportion of birds in each band. This indicates that flight height distribution is unlikely to vary with distance to shore. Only 175 bootstraps converged, indicating that the models are likely to have been biased towards particular sites. However, there was no significant relationship between distance from shore and the residuals of the proportion of birds in each band, indicating that flight height distribution is unlikely to vary with distance to shore. Previous studies estimated mean flight heights for Common Terns at 8 m (range 4 -250 m) (Walls et al. 2004; Parnell et al. 2005; Sadoti et al. 2005).

33
Figure 3.18 Common Terns (Left) Median modelled height distribution based on boat-based
survey data (red line), height distribution based on each bootstrap also shown (grey lines), plotted with raw data showing the proportion of birds in each height band. (Right) Modelled vs observed proportions of birds in each height band. (Circle diameter is proportional to the square root of the number of birds recorded in each band).
3.1.30 Arctic Tern Sterna paradisaea A total of 2571 Arctic Terns were recorded on 11 studies of nine sites – Barrow, Docking Shoal, Dogger Bank, Gwynt Y Mor, Humber Gateway, Moray Firth, Neart na Gaoithe, Rampion and West of Duddon Sands.
Figure 3.19 Arctic Terns (Left) Median modelled height distribution based on boat-based survey
data (red line), height distribution based on each bootstrap also shown (grey lines), plotted with raw data showing the proportion of birds in each height band. (Right) Modelled vs observed proportions of birds in each height band. (Circle diameter is proportional to the square root of the number of birds recorded in each band).
The model for Arctic Terns shows birds tend to fly at low altitudes, below the minimum height of any turbines rotor blades. The model proved to be a good fit for the observed data (R = 0.88). Assuming a turbine with a minimum rotor blade height of 20 m and a maximum rotor blade height

34
of 150 m, approximately 2.8 % (95 % CIs 0.1 – 23.4) of flights by Arctic Terns are likely to be at a height which places them at risk of collision with turbine blades (Table 3.1, Figure 3.19). Only 339 bootstraps converged, indicating that the models may have been biased towards particular sites. However, there was no significant relationship between distance from shore and the residuals of the proportion of birds in each band, indicating that flight height distribution is unlikely to vary with distance to shore. 3.1.31 Common Guillemot Uria aalge
A total of 36116 Common Guillemots were recorded during 26 studies of 22 sites – Barrow, Burbo Bank, Dogger Bank, Greater Gabbard, Gunfleet Sands, Gwynt Y Mor, Humber Gateway, Kentish Flats, Lincs, London Array, Lynn & Inner Dowsing, Moray Firth, Neart na Gaoithe, North Hoyle, Race Bank, Rampion, Sheringham Shoal, West of Duddon Sands, Westernmost Rough, Weybourne, Thorntonbank in Belgium and Egmond aan Zee Windfarm in the Netherlands. The model for Common Guillemots shows birds tend to fly at low altitudes, below the minimum height of any turbines rotor blades. The model proved to be a good fit for the observed data (R = 0.98). Assuming a turbine with a minimum rotor blade height of 20 m and a maximum rotor blade height of 150 m, approximately 0.01 % (95 % CIs <0.01 – 3.9) of flights by Common Guillemots are likely to be at a height which places them at risk of collision with turbine blades (Table 3.1, Figure 3.20). Only 384 bootstraps converged, indicating that the models may have been biased towards particular sites. However, there was no significant relationship between distance from shore and the residuals of the proportion of birds in each band, indicating that flight height distribution is unlikely to vary with distance to shore.
Figure 3.20 Common Guillemots (Left) Median modelled height distribution based on boat-based
survey data (red line), height distribution based on each bootstrap also shown (grey lines), plotted with raw data showing the proportion of birds in each height band. (Right) Modelled vs observed proportions of birds in each height band. (Circle diameter is proportional to the square root of the number of birds recorded in each band).
3.1.32 Razorbill Alca torda
A total of 13070 Razorbills were recorded during 21 studies of 18 sites – Barrow, Burbo Bank, Dogger Bank, Gunfleet Sands, Gwynt Y Mor, Humber Gateway, Islay, London Array, Lynn & Inner

35
Dowsing, Moray Firth, Neart na Gaoithe, North Hoyle, Race Bank, Rampion, Sheringham Shoal, Westernmost Rough, Thorntonbank in Belgium and Egmond aan Zee wind farm in the Netherlands. The model for Razorbills shows birds tend to fly at low altitudes, below the minimum height of any turbines rotor blades. The model proved to be a good fit for the observed data (R = 0.96). Assuming a turbine with a minimum rotor blade height of 20 m and a maximum rotor blade height of 150 m, approximately 0.4 % (95 % CIs <0.1 – 25.1) of flights by Razorbills are likely to be at a height which places them at risk of collision with turbine blades (Table 3.1, Figure 3.21). Only 9 bootstraps failed to converge, indicating that the models are unlikely to have been biased towards particular sites. There was no significant relationship between distance from shore and the residuals of the proportion of birds in each band, indicating that flight height distribution is unlikely to vary with distance to shore.
Figure 3.21 Razorbills (Left) Median modelled height distribution based on boat-based survey
data (red line), height distribution based on each bootstrap also shown (grey lines), plotted with raw data showing the proportion of birds in each height band. (Right) Modelled vs observed proportions of birds in each height band. (Circle diameter is proportional to the square root of the number of birds recorded in each band).
3.1.33 Little Auk Alle alle
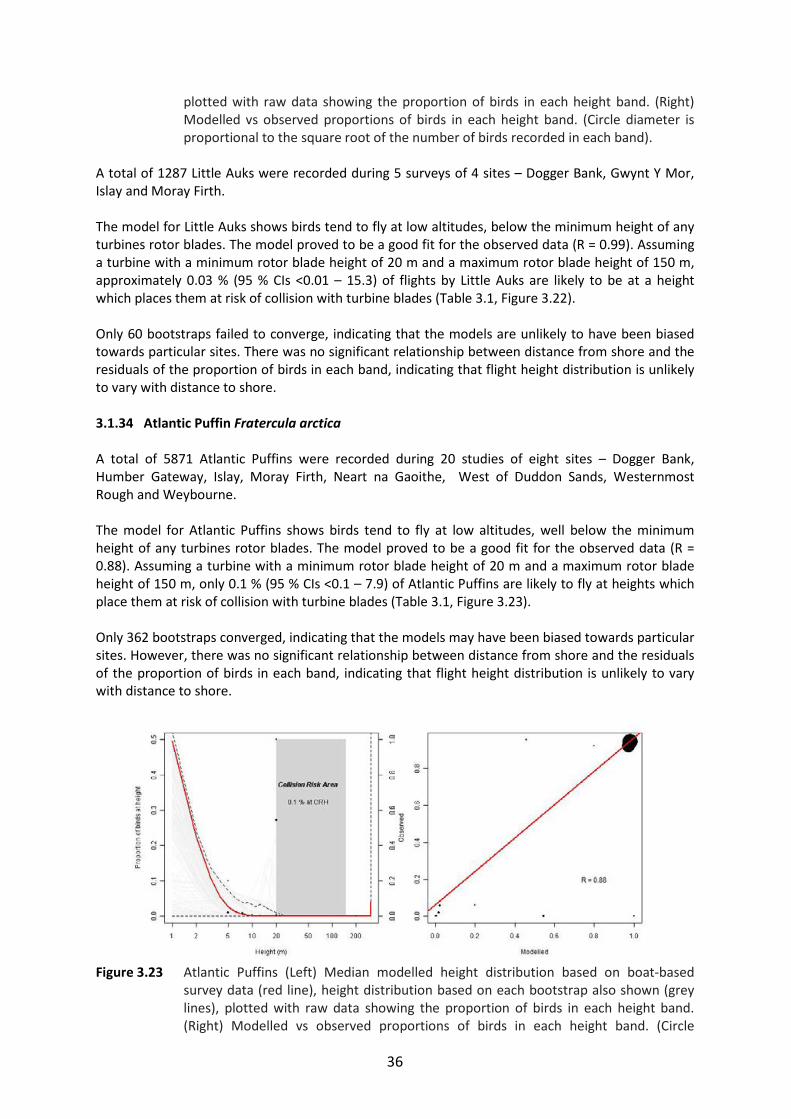
Figure 3.22 Little Auks (Left) Median modelled height distribution based on boat-based survey data (red line), height distribution based on each bootstrap also shown (grey lines),
36
plotted with raw data showing the proportion of birds in each height band. (Right) Modelled vs observed proportions of birds in each height band. (Circle diameter is proportional to the square root of the number of birds recorded in each band).
A total of 1287 Little Auks were recorded during 5 surveys of 4 sites – Dogger Bank, Gwynt Y Mor, Islay and Moray Firth. The model for Little Auks shows birds tend to fly at low altitudes, below the minimum height of any turbines rotor blades. The model proved to be a good fit for the observed data (R = 0.99). Assuming a turbine with a minimum rotor blade height of 20 m and a maximum rotor blade height of 150 m, approximately 0.03 % (95 % CIs <0.01 – 15.3) of flights by Little Auks are likely to be at a height which places them at risk of collision with turbine blades (Table 3.1, Figure 3.22). Only 60 bootstraps failed to converge, indicating that the models are unlikely to have been biased towards particular sites. There was no significant relationship between distance from shore and the residuals of the proportion of birds in each band, indicating that flight height distribution is unlikely to vary with distance to shore. 3.1.34 Atlantic Puffin Fratercula arctica A total of 5871 Atlantic Puffins were recorded during 20 studies of eight sites – Dogger Bank, Humber Gateway, Islay, Moray Firth, Neart na Gaoithe, West of Duddon Sands, Westernmost Rough and Weybourne. The model for Atlantic Puffins shows birds tend to fly at low altitudes, well below the minimum height of any turbines rotor blades. The model proved to be a good fit for the observed data (R = 0.88). Assuming a turbine with a minimum rotor blade height of 20 m and a maximum rotor blade height of 150 m, only 0.1 % (95 % CIs <0.1 – 7.9) of Atlantic Puffins are likely to fly at heights which place them at risk of collision with turbine blades (Table 3.1, Figure 3.23). Only 362 bootstraps converged, indicating that the models may have been biased towards particular sites. However, there was no significant relationship between distance from shore and the residuals of the proportion of birds in each band, indicating that flight height distribution is unlikely to vary with distance to shore.
Figure 3.23 Atlantic Puffins (Left) Median modelled height distribution based on boat-based
survey data (red line), height distribution based on each bootstrap also shown (grey lines), plotted with raw data showing the proportion of birds in each height band. (Right) Modelled vs observed proportions of birds in each height band. (Circle
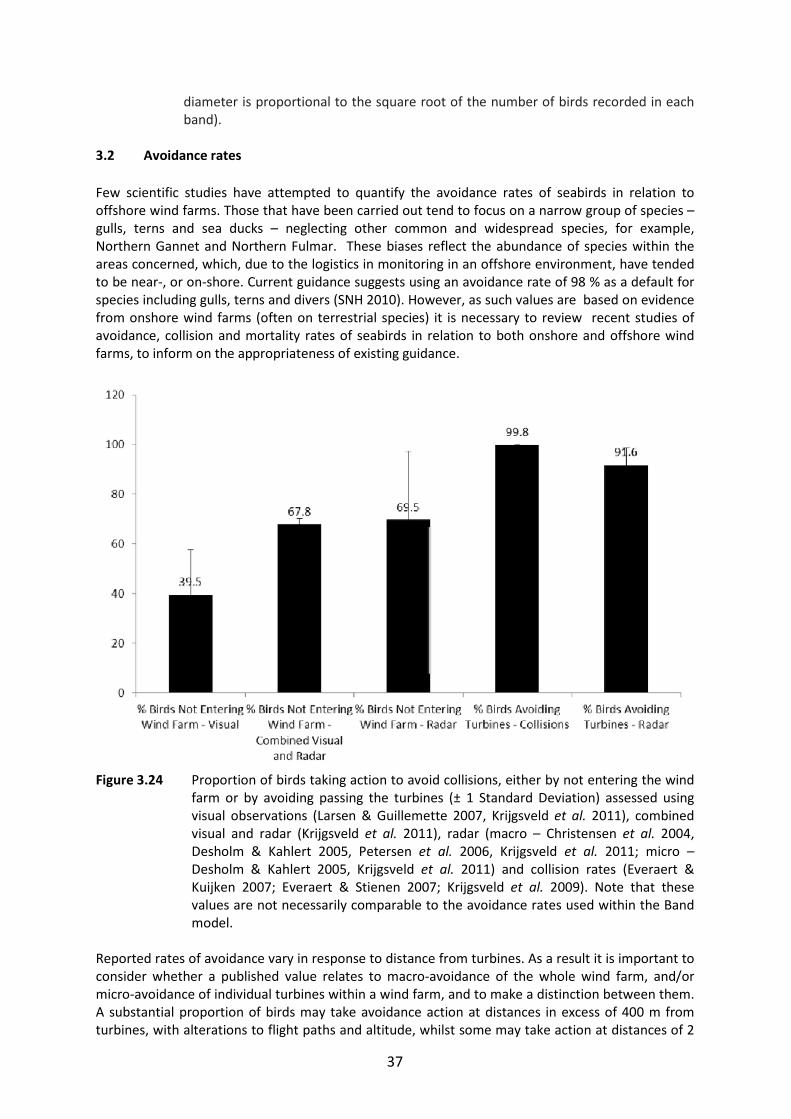
37
diameter is proportional to the square root of the number of birds recorded in each band).
3.2 Avoidance rates Few scientific studies have attempted to quantify the avoidance rates of seabirds in relation to offshore wind farms. Those that have been carried out tend to focus on a narrow group of species – gulls, terns and sea ducks – neglecting other common and widespread species, for example, Northern Gannet and Northern Fulmar. These biases reflect the abundance of species within the areas concerned, which, due to the logistics in monitoring in an offshore environment, have tended to be near-, or on-shore. Current guidance suggests using an avoidance rate of 98 % as a default for species including gulls, terns and divers (SNH 2010). However, as such values are based on evidence from onshore wind farms (often on terrestrial species) it is necessary to review recent studies of avoidance, collision and mortality rates of seabirds in relation to both onshore and offshore wind farms, to inform on the appropriateness of existing guidance.
Figure 3.24 Proportion of birds taking action to avoid collisions, either by not entering the wind
farm or by avoiding passing the turbines (± 1 Standard Deviation) assessed using visual observations (Larsen & Guillemette 2007, Krijgsveld et al. 2011), combined visual and radar (Krijgsveld et al. 2011), radar (macro – Christensen et al. 2004, Desholm & Kahlert 2005, Petersen et al. 2006, Krijgsveld et al. 2011; micro – Desholm & Kahlert 2005, Krijgsveld et al. 2011) and collision rates (Everaert & Kuijken 2007; Everaert & Stienen 2007; Krijgsveld et al. 2009). Note that these values are not necessarily comparable to the avoidance rates used within the Band model.
Reported rates of avoidance vary in response to distance from turbines. As a result it is important to consider whether a published value relates to macro-avoidance of the whole wind farm, and/or micro-avoidance of individual turbines within a wind farm, and to make a distinction between them. A substantial proportion of birds may take avoidance action at distances in excess of 400 m from turbines, with alterations to flight paths and altitude, whilst some may take action at distances of 2

38
km or more (Christensen et al. 2004, 2006; Fox et al. 2006). It appears a greater proportion of birds may take action to avoid turbines once inside a wind farm (micro-avoidance), than take action to avoid entering the wind farm in the first place (macro-avoidance) (Table 3.2; Figure 3.24). As a result estimates of collision rates based on one or the other of these are unlikely to provide an accurate representation of bird behaviour in response to turbines. It is possible to combine estimates of micro and macro avoidance to give an overall avoidance rate as follows: (1 - Total Avoidance) = (1 – Macro Avoidance) x (1 – Micro Avoidance) However, this must be done with care due to the inconsistencies in the way in which these rates are calculated. The variety of approaches used to measure avoidance, in particular the distances involved, mean that reported rates are unlikely to be strictly comparable. Nysted, Horns Rev and Egmond aan Zee wind farms have been the subject of extensive post-construction monitoring through the use of both visual observations and radar (Christensen et al. 2004, 2006; Petersen et al. 2006; Krijgsveld et al. 2011). These studies have considered the macro-avoidance of wind farms by a number of species, however, at the former site a particular emphasis has been placed on Common Eider and Common Scoter. Both visual observations and radar observations confirm that a significant proportion of birds display macro-avoidance behaviour, often avoiding the wind farms altogether. This macro-avoidance rate varies by species, with 30 % of terns and up to 72 % of Gannets taking macro-avoidance action at the Egmond aan Zee wind farm (Krijgsveld et al. 2010, 2011) (Table 3.2). Differences are apparent between the macro-avoidance rates obtained through visual observations and radar observations. Macro-avoidance rates were typically higher for radar observations than for visual observations. For Common Eider and Common Scoter, these differences are particularly pronounced, with macro-avoidance rates of 53 – 71 % from visual observations and 88 – 90 % for radar observations (Table 3.2). The differences in these avoidance rates are likely to be the result of the different spatial scales covered by each methodology, with radar providing the potential to monitor a far wider area than relying on visual observations. At Egmond aan Zee, macro-avoidance of the wind farm was assessed both visually and with the aid of radar (Krijgsveld et al. 2009), allowing us to compare these methodologies (Table 3.2). When radar was used, macro-avoidance rate were typically higher than when they were assessed visually. These differences may be indicative of birds taking action to avoid wind farms at long distances. Christensen et al. (2004) suggest that deflection to avoid wind farms may take place at distances of up to 4 – 6 km, far greater than could be observed visually. The differences in the methodologies used between sites, and the apparent biases associated with visual and radar observations (Fig 3.24), mean that it is not possible to determine how consistent macro-avoidance rates are between sites. Using the above example for sea-duck, it is not possible to determine how much of the observed variation arises from site specific differences and how much from methodological differences. There is a lack of clarity surrounding the use of the term “micro-avoidance”. A number of studies have presented estimates of collision or mortality rates, typically far higher than the macro-avoidance rates presented above. For example, studies in Belgium have presented collision rates of 0.09 % - 0.46 % in gulls and terns, whilst in the Netherlands an estimated 0.14 % of birds collided with turbines at three onshore wind farms (Everaert & Kuijken 2007; Everaert & Stienen 2007). Whilst these values can be converted to total “non-collision” rates, it is important to note that in this form, they do not reflect avoidance rates, micro- or otherwise. It is possible to calculate avoidance rates appropriate for use with the band model from collision rates by comparing the observed collision rates with the collision rate that would be expected in the
39
absence of avoidance. However, as the probability of collision in the absence of avoidance varies in relation to turbine design, to do so it would be necessary to have detailed knowledge of the turbines concerned. For a 3 MW turbine, the probability of collision in the absence of avoidance action has been calculated to be 8.4 % for the Herring Gull, 6.8 % for the Black-headed Gull, 7.1 % for the Common Tern and 6.9 % for the Sandwich Tern (Cook et al. 2011). For a 5 MW turbine the probability of collision in the absence of avoidance action decreases to 7.3 % for the Herring Gull, 6.1 % for the Black-headed Gull, 6.4 % for the Common Tern and 6.2 % for the Sandwich Tern. Using these values with the above collision rates, the calculated micro-avoidance rate for a 3 MW turbine may be up to 0.75 higher than for a 5 MW turbine. Such a difference may have a significant impact on the predicted annual collision rate. As these rates would relate to onshore turbines, relatively close to breeding colonies, they are not comparable with what may be expected in an offshore environment. Furthermore, in the case of the Belgian study, as the turbines are on the edge of a breeding colony, they arguably represent total, as opposed to micro-, avoidance. Few studies have sought to measure micro-avoidance directly. Avoidance action by seabirds may be more likely to occur on a horizontal plane than a vertical plane. Blew et al. (2008) tracked the vertical movements of birds passing through the Nysted wind farm in Denmark. Of those flying at turbine height, only 5.6 % during the day and 12 % at night showed a significant change in altitude, although these proportions were similar to those obtained for birds flying above turbine height. Desholm (2005) attempted to record near rotor avoidance behaviour using a combination of radar and an infra-red based detection system, the Thermal Animal Detection System (TADS). Despite over 50 days’ worth of observations, this system failed to pick up a single bird passing close enough to a turbine to necessitate micro-avoidance action. This study would appear to add further weight to the suggestion that the total avoidance rate of birds in relation to offshore wind turbines is very high. Desholm & Kahlert (2005) used radar to assess the proportion of migrating birds, mostly geese and Common Eiders, passing close enough to turbines to be at risk of collision. The majority of birds did not enter the wind farm at all, and of those that did only 6.5 % at night and 12.3 % during the day passed within 50 m of a turbine, potentially reflecting micro-avoidance rates of 93.5 % and 87.7 % respectively. In total, less than 1 % of the tracked birds passed close enough to the turbine to be at any risk of collision. A recent study, Krijgsveld et al. (2011) sought to combine estimates of macro-avoidance and micro-avoidance obtained from the Egmond aan Zee Offshore Wind Farm to give a total rate for horizontal avoidance of turbines. The study showed that the total avoidance of turbines varied from around 98 % in species which are thought to be attracted to offshore wind farms, such as cormorants and gulls, to around 99 % in species such as divers, which are thought to avoid wind farms (Petersen et al. 2006; Krijgsveld et al. 2011). It is important to note that a constant micro-avoidance rate of 97.6 %, for all species, was assumed by this study, which ws measured using radar and may be influenced by a large number of passerines. Unfortunately, due to the lack of comparable studies, it is not possible to determine how representative the values obtained by this study are of other sites, and therefore, whether or not it is appropriate to use them more widely. Consideration was given to combining the published estimates of macro- and micro-avoidance given in Table 1, adopting a similar methodology to Krijgsveld et al. (2011). However, given the available estimates of micro-avoidance, this was felt to be inappropriate. A total of 13 estimates of micro-avoidance were available from five separate studies. Of these, 10 estimates came from collision estimates calculated from corpse searches. It would not be appropriate to use these values in estimating total avoidance rates, as they do not account for birds that fly through the turbines (i.e. do not show avoidance behaviour) but survive, and thus over-estimate actual micro-avoidance. In addition, the conclusions that might be drawn regarding micro-avoidance rates using such collision estimates are dependent on the turbine design. An additional study (Desholm & Kahlert 2005) provided estimates of micro-avoidance from migrant ducks, mostly Common Eider and Common

40
Scoter. Without a more detailed understanding of how flight behaviour differs inside and outside migration periods, it would again be inappropriate to use these values. The final estimate of micro-avoidance was that presented by Krijgsveld et al. (2011) and this was not used as it would not offer an independent comparison to the total avoidance values presented by that study. Lastly, is unclear as to what degree the range of rates reported for macro-avoidance reflect actual variation between study sites of study design. The best data available suggest that avoidance rates may be likely to be more than 99 % for divers, Northern Gannet, sea ducks and auks and not less than 98 % for other species. However, these values are based on a single study (Krijgsveld et al. 2011) and, without replication from additional sites, it is not possible to conclude whether it is appropriate to apply these figures more widely. It is worth highlighting that an urgent call for studies into avoidance rates was made some time ago (Chamberlain et al. 2005, 2006). However, this topic has yet to receive the full attention it urgently requires. The study by Krijgsveld et al. (2011) should be recognised as an important contribution to this topic, but one that must be built on in order to provide a series of robust estimates of avoidance for a range of species and across a range of sites.

41
Table 3.2 Avoidance rates for seabirds and other species groups in relation to offshore wind farms, obtained from a detailed review of the literature. Reference numbers refer to references listed below the table.
Species/Group
Wind Farm Avoidance Rate
Avoidance Methodology Notes Ref.
Divers Egmond aan Zee 52 %3 Macro Visual Observations All Year, 36 turbines offshore
[1]
Grebes Egmond aan Zee 50 %3 Macro Visual Observations All Year, 36 turbines offshore
[1]
Tubenoses Egmond aan Zee 50 %3 Macro Visual Observations All Year, 36 turbines offshore
[1]
Gannets Egmond aan Zee 72 %3 Macro Visual Observations All Year, 36 turbines offshore
[1]
Cormorants Egmond aan Zee 23 %3 Macro Visual Observations All Year, 36 turbines offshore
[1]
Geese & Swans
Egmond aan Zee 41 %3 Macro Visual Observations All Year, 36 turbines offshore
[1]
Sea-ducks Egmond aan Zee 56 %3 Macro Visual Observations All Year, 36 turbines offshore
[1]
Other Ducks Egmond aan Zee 37 %3 Macro Visual Observations All Year, 36 turbines offshore
[1]
Waders Egmond aan Zee 27 %3 Macro Visual Observations All Year, 36 turbines offshore
[1]
Skuas Egmond aan Zee 0 %3 Macro Visual Observations All Year, 36 turbines offshore
[1]
Gulls Egmond aan Zee 30 %3 Macro Visual Observations All Year, 36 turbines offshore
[1]
Terns Egmond aan Zee 30 %3 Macro Visual Observations All Year, 36 turbines offshore
[1]
Alcids Egmond aan Zee 45 %3 Macro Visual Observations All Year, 36 turbines offshore
[1]
Raptors Egmond aan Zee 18 %3 Macro Visual Observations All Year, 36 turbines offshore
[1]
Landbirds Egmond aan Zee 35 %3 Macro Visual Observations All Year, 36 turbines offshore
[1]
Divers Egmond aan Zee 68 % Macro Visual Observations (validated with radar)
All Year, 36 turbines offshore
[1]
Gannets Egmond aan Zee 64 % Macro Visual Observations (validated with radar)
All Year, 36 turbines offshore
[1]
Gulls & Cormorants
Egmond aan Zee 18 % Macro Radar Observations All Year, 36 turbines offshore
[1]
Geese & Swans
Egmond aan Zee 68 % Macro Visual Observations (validated with radar)
All Year, 36 turbines offshore
[1]
Sea Ducks Egmond aan Zee 71 % Macro Visual Observations (validated with radar)
All Year, 36 turbines offshore
[1]
Alcids Egmond aan Zee 68 % Macro Visual Observations (validated with radar)
All Year, 36 turbines offshore
[1]
Other Species Egmond aan Zee 28 % Macro Radar Observations All Year, 36 turbines offshore
[1]
Migrant Sea Duck
Nysted 90 % Macro Radar Observations Autumn, 72 turbines, offshore
[2]
Common Scoter
Horns Rev 88.6 % Macro Radar Observations All year, 80 turbines, offshore
[2]
Gulls Horns Rev 76.4 % Macro Radar Observations All year, 80 turbines, offshore
[2]
Terns Horns Rev 69.5 % Macro Radar Observations All year, 80 turbines, offshore
[2]
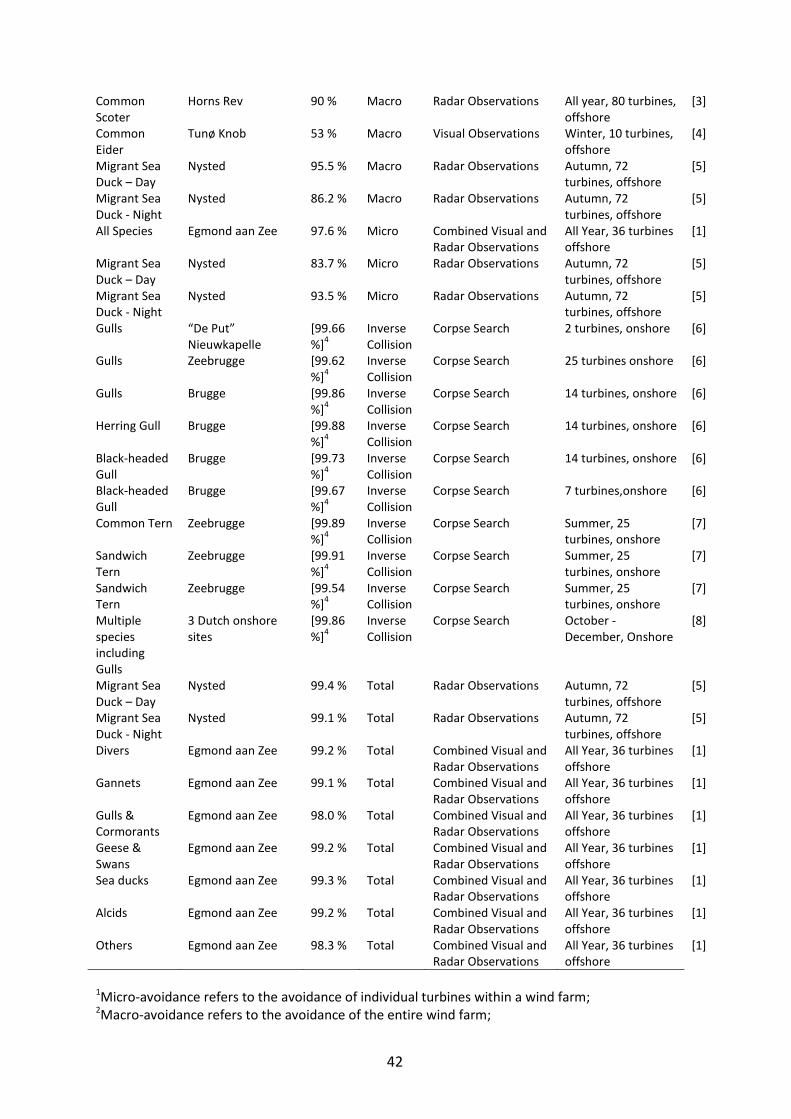
42
Common Scoter
Horns Rev 90 % Macro Radar Observations All year, 80 turbines, offshore
[3]
Common Eider
Tunø Knob 53 % Macro Visual Observations Winter, 10 turbines, offshore
[4]
Migrant Sea Duck – Day
Nysted 95.5 % Macro Radar Observations Autumn, 72 turbines, offshore
[5]
Migrant Sea Duck - Night
Nysted 86.2 % Macro Radar Observations Autumn, 72 turbines, offshore
[5]
All Species Egmond aan Zee 97.6 % Micro Combined Visual and Radar Observations
All Year, 36 turbines offshore
[1]
Migrant Sea Duck – Day
Nysted 83.7 % Micro Radar Observations Autumn, 72 turbines, offshore
[5]
Migrant Sea Duck - Night
Nysted 93.5 % Micro Radar Observations Autumn, 72 turbines, offshore
[5]
Gulls “De Put” Nieuwkapelle
[99.66 %]4
Inverse Collision
Corpse Search 2 turbines, onshore [6]
Gulls Zeebrugge [99.62 %]4
Inverse Collision
Corpse Search 25 turbines onshore [6]
Gulls Brugge [99.86 %]4
Inverse Collision
Corpse Search 14 turbines, onshore [6]
Herring Gull Brugge [99.88 %]4
Inverse Collision
Corpse Search 14 turbines, onshore [6]
Black-headed Gull
Brugge [99.73 %]4
Inverse Collision
Corpse Search 14 turbines, onshore [6]
Black-headed Gull
Brugge [99.67 %]4
Inverse Collision
Corpse Search 7 turbines,onshore [6]
Common Tern Zeebrugge [99.89 %]4
Inverse Collision
Corpse Search Summer, 25 turbines, onshore
[7]
Sandwich Tern
Zeebrugge [99.91%]4
Inverse Collision
Corpse Search Summer, 25 turbines, onshore
[7]
Sandwich Tern
Zeebrugge [99.54 %]4
Inverse Collision
Corpse Search Summer, 25 turbines, onshore
[7]
Multiple species including Gulls
3 Dutch onshore sites
[99.86 %]4
Inverse Collision
Corpse Search October - December, Onshore
[8]
Migrant Sea Duck – Day
Nysted 99.4 % Total Radar Observations Autumn, 72 turbines, offshore
[5]
Migrant Sea Duck - Night
Nysted 99.1 % Total Radar Observations Autumn, 72 turbines, offshore
[5]
Divers Egmond aan Zee 99.2 % Total Combined Visual and Radar Observations
All Year, 36 turbines offshore
[1]
Gannets Egmond aan Zee 99.1 % Total Combined Visual and Radar Observations
All Year, 36 turbines offshore
[1]
Gulls & Cormorants
Egmond aan Zee 98.0 % Total Combined Visual and Radar Observations
All Year, 36 turbines offshore
[1]
Geese & Swans
Egmond aan Zee 99.2 % Total Combined Visual and Radar Observations
All Year, 36 turbines offshore
[1]
Sea ducks Egmond aan Zee 99.3 % Total Combined Visual and Radar Observations
All Year, 36 turbines offshore
[1]
Alcids Egmond aan Zee 99.2 % Total Combined Visual and Radar Observations
All Year, 36 turbines offshore
[1]
Others Egmond aan Zee 98.3 % Total Combined Visual and Radar Observations
All Year, 36 turbines offshore
[1]
1Micro-avoidance refers to the avoidance of individual turbines within a wind farm; 2Macro-avoidance refers to the avoidance of the entire wind farm;

43
3Macro-avoidance rate calculated by combining estimate of birds not entering wind farm with estimate of birds deflecting around wind farm. 4Avoidance rate calculated as 1 – collision rate, not comparable with micro-avoidance rates presented elsewhere; [1] Krijgsveld et al. 2011; [2] Petersen et al. 2006; [3] Christensen et al. 2004 [4] Larsen & Guillemette 2007; [5] Desholm & Kahlert 2005; [6] Everaert & Kuijken 2007; [7] Everaert & Stienen 2007; [8] Krijgsveld et al. 2009.

44

45
4. DISCUSSION AND RECOMMENDATIONS 4.1 Flight heights 4.1.1 Discussion Models proved a reasonable representation of the observed data for 24 species. The proportions of flying birds estimated to be flying at heights which placed them at risk of collision ranged from 0.01 % for the Common Guillemot to 33.1 % for Great Black-backed Gulls. For most species, tight confidence limits indicated that data were reasonably consistent between sites. Applying the models to the height bands used in each survey indicated that they were a good match for the observed data, and there were no significant relationships between the error associated with each model and the distance from shore of the wind farm. These models are based on the best available data for a wide range of species. There is a reliance on estimated heights as directly recorded flight heights were only available from two radar studies, one focussing on Common Eider in Alaska (Day et al. 2004) and a second considering migrating Black-headed and Lesser Black-backed Gulls in in the Netherlands (Shamoun-Baranes & van Loon 2006). Whilst some recently developed tags have the capability to record the altitude at which birds are flying, the sample sizes involved in these studies are presently too small to make generalizations about species flight behaviour (Thaxter et al. 2011). Data considered within this study were typically collected during “snapshot” counts, when birds are at their closest to the boat, with height bands related to easily visible fixed objects such as the ships mast. There may be a danger that surveys of this type may over-represent the numbers of birds flying at low levels, particularly in the case of wary species, such as the Red-throated Diver, as birds are flushed from the sea-surface by approaching vessels. For the same reason, however, boat-based surveys might over-estimate the proportions of all birds that are recorded in flight and thus at risk from collision. The models presented here should be considered in relation to sites which are used by birds on a daily basis only. Attempts to model flight heights at sites where a significant proportion of birds are likely to be passing through as part of their migration were unsuccessful as the models failed to converge. This may imply that flight heights at these sites can be highly variable, and that they should be considered on an individual basis, or modelled within specific seasons. It is also worth noting that no data were available covering species flight heights at night. This is of concern given that several key seabird species, such as Northern Fulmar and Black-legged Kittiwake, are believed to be fairly active at night (Garthe & Hüppop 2004). These models are capable of disentangling data collected from different height bands and summarising it in a robust fashion. However, comparison with data collected as part of future studies would be simpler if a more standardised set of height bands were used. Camphuysen et al. (2004) highlight the bands used by Dutch studies (0-2 m, 2-10 m, 10-25 m, 25-50 m, 50-100 m, 100-200 m and >200 m). However, these bands were originally developed for use in the terrestrial environment, where estimating heights may be more straightforward. In the marine environment a smaller number of bands may be more appropriate. These should relate to the height of turbines above the sea surface. Bands should be assigned to reflect birds which are well below collision height risk (<10 m), birds which are close to the lower reaches of the turbine blades and may stray into the collision risk area (10-20 m), birds which are within the lower portion of the generic collision risk area (20-80 m), those that are in the higher portion of the generic collision risk area (80–150 m) and those that are above the collision risk area (> 150 m). It should also be noted whether the flight is in response to the approach of the vessel or not. This would enable flushed birds to be excluded from the analysis of flight heights, leading to more representative estimates. At all times one

46
observer should be responsible for estimating the flight heights of seabirds. It may be possible to do this in conjunction with the “snapshot” counts, alternatively, it may be necessary to use an additional observer. As there may be concern about the ability of observers to estimate heights on boat-based surveys, this should be tested and standardised on land using objects of known height. The strength of these models is that they make it possible to understand how collision risk varies in relation to the position and extent of the collision risk window. Current survey data assigns birds in flight to fixed height bands. Consequently, it is not possible to use this information to determine how the number of birds at risk will vary in relation to changes in the collision risk window. As turbine design is constantly evolving, the ability to consider how the number of birds at risk of collision changes in relation to different collision risk windows, as offered by these models, is a major benefit. 4.1.2 Aerial Survey Data Digital aerial surveys have been widely used in recent years to inform the EIA process for offshore wind farms. These methods have the potential not only to inform on baseline numbers of birds, but also on flight heights. Data on flight heights from these methods have not been used in this review, for reasons outlined below, though they have undoubted potential and might offer a future alternative to data from boat surveys. The review and modelling of flight heights presented here was based on boat-based data primarily because information on flight heights was required at a species-specific level. Identification rates from digital methods can be highly variable and a high proportion of data have often remained unidentified to species level (Hexter 2009), though it should be noted that considerable advances have been made in this regard in the last two to three years. Some, such as the Northern Gannet can be readily identified due to their size and characteristic markings. However, some species groups, for example auks, may be difficult to identify to species level. Of more concern, is the difficulty in distinguishing between Fulmar and gulls in some images (Mellor et al. 2007; Thaxter & Burton 2009). The results presented above indicate that these are species with very different flight behaviours, with gulls typically flying higher than Fulmar. The methodologies used to calculate the flight height of seabirds from digital aerial survey data are likely to rely on being able to apply biometric data from the appropriate species. As such, if species are mis-identified, or if there is a vertical bias in the likelihood of accurate species-level identification, this is likely to lead to inaccurate estimates of species’ typical flight heights. This is of concern given the relatively strong impact that a small change in flight height may have on the proportion of a species potentially exposed to collision risk. It should be noted that species might also be mis-identified or remain unidentified during boat-based surveys and this problem is also likely to be greatest for birds flying higher (i.e. at greatest distance from the observer). However, for most species, the majority of birds fly at low altitudes where identification from boats will be possible. Walls et al. (2009) concluded that video imagery was potentially useful in relation to monitoring flight heights and avian interactions with turbines, but that its value in the offshore environment was unproven. As instrument settings are optimised and technology develops, species identification rates have improved dramatically (Mellor & Maher 2008). Given this, it would be of immense benefit to review the quality of the most recent digital images and, in particular, the presently unpublished methodologies which are used to estimate flight heights.

47
4.1.3 Recommendations For collision risk modelling, it is recommended that consideration should be given to results using both the site-specific and the modelled flight height data presented here. Where there is a clear difference between data recorded on a site-specific basis and the modelled data, the reasons for this – for example, that large numbers of migrating birds pass through the site – should be explored and clearly stated. Where there is good reason to have low confidence in the quality of the site-specific data, for example that it is based on low sample sizes or was collected during unrepresentative periods, it the modelled flight height data might be considered more representative. The updated guidance and a revised spreadsheet for offshore use of the Band collision risk model (Band 2012) that accompanies this review provides the means for estimating collision risk (i) using site-specific data and assuming an uniform bird density in the risk window; (ii) also using the uniform density model, but using a figure for the proportion of birds at risk height derived from generic data; and (iii) using data on flight height distributions, as produced by the modelling presented here. Developers may wish to take advantage of the ability of these models to consider turbines of different sizes and with different hub-heights. In these circumstances, to ensure comparative values are presented, only the modelled data presented here should be used. Results using both the upper and lower confidence limits from the flight height distribution should also be presented when using the modelled data. Bird data were collected in relation to the sea-level at the time of the survey. However, as sea-level will vary in relation to the fixed turbine structure, in the collision risk modelling process flight heights should be considered in relation to mean sea-level. The models presented here do, however, offer the possibility of modelling the proportion of birds at collision risk height in relation to a range of sea-levels. Consideration of sea-level is also provided in the updated guidance for offshore use of the Band collision risk model (Band 2012). 4.2 Avoidance 4.2.1 Discussion Scientific studies of avian interactions with wind farms have tended to focus on collision and mortality rates rather than actual avoidance rates. Whilst collision and mortality rates may be used to provide a surrogate for avoidance rates, they overestimate actual avoidance rates as not all birds that fail to take avoidance action will collide with turbines or turbine blades. Furthermore, particularly in the case of offshore wind farms, it is unlikely that carcasses of all collision victims will be found. Each of these factors is likely to lead to inaccuracies in the determination of the true avoidance rate of offshore wind farms by birds. To put this into context, apparently relatively subtle changes in the avoidance rate, for example from 99.0 % to 99.5 %, can severely impact the accuracy of collision risk modelling (Chamberlain et al. 2006). Identifying meaningful avoidance rates for seabirds is complicated by the fact that studies frequently fail to describe the spatial scale over which the avoidance behaviour is recorded. Without such an assessment, avoidance rates are essentially meaningless. Radar studies indicate that a high proportion of birds alter their flight patterns in order to avoid flying through a wind farm, i.e. take macro-avoidance (Christensen et al. 2004; De Lucas et al. 2004; Desholm & Kahlert 2005; Masden et al. 2009). Birds then show micro-avoidance of individual turbines within a wind farm. As an example, if 99 % of birds exhibit avoidance behaviour in response to wind turbines at a distance of 50 m, yet 75 % birds have already altered their course so as not to come closer than 50 m from the turbines, the true overall avoidance rate may more accurately be thought of as 99.75 %. Avoidance rates suitable for use in the band model can be calculated by comparing the number of observed

48
collisions to the number of predicted collisions. However, this relies on being able to accurately measure collisions in an offshore environment. Until such a time as this is possible, our understanding of avoidance rates in relation to offshore wind farms would be greatly enhanced by future studies presenting them alongside the distances over which they were calculated. Avoidance rates are likely to vary in response to adverse weather conditions, poor visibility and different behaviours, such as the pursuit of other species, either for predation or klepto-parasitism, and whether birds are on passage through an area or effectively resident. Similarly, lighting has been shown to attract birds towards offshore wind farms (Cook et al. 2011), however, no comparisons are available between low-light conditions, when lighting would be visible, and normal conditions, when it would not. There is also some evidence that birds habituate to the presence of offshore wind farms (i.e. Npower Renewables 2007), this may result in them becoming less cautious of the turbines over time. At present the impact of each these factors on avoidance rates has not been quantified, and consequently it is not possible to determine whether they may make a significant contribution to the mortality associated with offshore wind farms. Improved estimates of macro- and micro-avoidance, and overall avoidance rates, are needed to be able to refine guidance in the future. 4.2.2 Recommendations An avoidance rate of 98 % has been widely used as a realistic worst case scenario and is suggested in current guidance as a default for species including gulls, terns and divers (SNH 2010). Maclean et al. (2009) previously recommended that, until more information became available, a combination of published estimates should be used for species for which sufficient information exists and that alternative avoidance rates, based on flight manoeuvrability and the likelihood of a species avoiding the wind farm altogether, are used for other groups. The rates that they recommended are summarised in Table 4.1. Table 4.1 Avoidance rates for different species / species groups based on published estimates of avoidance and manoeuvrability, taken from Maclean et al. (2009).
Avoidance Rate Species 99.0 Terns, divers, Great Cormorant, ducks, geese, grebes, Atlantic Puffin 99.5 Auks, gulls, Northern Gannet 99.9 Fulmar, shearwaters
This review has provided an opportunity to revisit the recommendations provided in Maclean et al. (2009). As indicated in section 3.2, it was felt inappropriate to combine estimates of micro- and macro-avoidance from different studies, but where estimates of overall avoidance are available (Table 3.2) these suggest lower values for some species or species groups than proposed by Maclean et al. (2009), though there is an approximate similarity in the ranks of species or species groups. While some notable studies have taken place recently, without replication from additional sites, there is not a robust enough evidence base to suggest that existing guidance should be changed. A key reason for this is that there is little consistency in the species-specific macro-avoidance rates available from different study sites, in part due to the different methodologies used. The current, limited evidence suggests that avoidance rates may be likely to be more than 99% for some species (e.g. for divers, sea ducks, auks and Northern Gannet, based on Krijgsveld et al. 2011, and inference from the micro- and macro-avoidance rates presented in Table 3.2). However, a value of 98 %, as recommended by SNH (2010), should be used as a precautionary avoidance rate until further evidence is available to build on that presented in this review. Given that there is potential for species to show higher rates, and also because of the uncertainty surrounding avoidance rates, it is

49
recommended that collision estimates associated with avoidance rates of 95 %, 99 % and 99.5 % should also be presented. Provision for using a range of values in this way has been made possible in the updated guidance and spreadsheet for offshore use of the Band collision risk model (Band 2012). However, these values should not take precedence in situations where strong evidence points to alternative avoidance rates. It is important to re-iterate the urgent need for additional data to be collected on avian avoidance of wind farms, as expressed by Chamberlain (et al. 2005). In particular, an assessment needs to be made as to how consistent species-specific avoidance rates are between seasons, sites, age-classes and sexes. As these additional data become available, it is extremely likely that recommendations will need to be refined. 4.3 Fulfilling information needs More detailed information is required both in relation to the avoidance rates of seabirds in response to offshore wind farms and in relation to flight heights within offshore wind farms. Few studies have sought to measure either directly. 4.3.1 Flight heights Flight heights are typically recorded during boat-based surveys prior to construction, with flying birds assigned to height bands. This existing methodology for recording flight heights is limited in as far as the wide bands typically used make it impossible to discern whether a species is exploiting the full height of the band or merely a narrow section at the lower end. This information is more or less sufficient for the purposes for which it is collected – identifying how likely a bird is to collide with a turbine. However, more detailed data would be of great value. For instance, collision risk is likely to vary along the length of each turbine blade in response to differences in pitch and chord width. Foraging birds are likely to be clustered towards the bottom of the height band in question, rather than evenly distributed within it, and are therefore more likely to be exposed to the ends of the turbine blades than the centre of the turbine itself. The updated guidance and a revised spread-sheet for offshore use of the Band collision risk model (Band 2012) that accompanies this review provides the means for estimating collision risk not only assuming an uniform bird density in the risk window, but also using data on flight height distributions, as produced by the modelling presented here. More detailed scientific studies of the flight heights of birds, that both report means and the variation around these values, and which could be used to express the probabilities of birds occurring in particular flight bands, would be highly desirable. 4.3.2 Avoidance Avoidance of wind turbines by birds can often be hard to estimate and there is an urgent to need to collect more information on this. As such, avoidance rates calculated using mortality rates in the absence of predictions of collision rates (i.e. those calculated from the data presented in Everaert & Kuijken 2007; Everaert & Stienen 2007 and Krijgsveld et al. 2009 above) in the absence of avoidance are likely to be overestimates of the true avoidance rates. Langston (2010) assesses the sensitivities to collision risk of species in relation to offshore wind farms as high, medium or low. At present there is insufficient information to make a more detailed assessment. Furthermore, inconsistencies in the way in which avoidance rates are recorded, and the very limited range of species for which these have been estimated, make it difficult to quantify how individual species interact with offshore wind farms.

50
Ideally, information on both avoidance rates and flight heights would be collected by directly recording bird movements within the offshore environment. Potential routes for collecting such information include the use of radar, visual observations and through tagging birds, i.e. with devices such as GPS tags. As described above, radar studies can provide detailed information on both flight heights and macro-avoidance around wind farms. As it is not currently usually possible to identify species through their radar echoes, ideally such a study would be undertaken in combination with visual observations in order that some of the echoes could be identified to species level and micro-avoidance within the wind farm also estimated. In this way overall avoidance rates can be also estimated. The sheer volume of data that can be collected through radar studies makes this approach particularly advantageous. Tagging or other tracking studies can provide detailed species-specific information on the interaction between individual birds and wind farms and are particularly applicable to colonially nesting species. The data collected by such studies may also be extensive, though limited by the numbers of individuals tagged. Given their respective advantages and disadvantages, the different approaches should be viewed as complementary. 4.4 Benefits to the consenting process 4.4.1 Flight heights At present, the proportion of birds from each species flying at collision risk height must be calculated from boat-based survey data where individual birds are assigned to one of a broad range of flight height categories. These categories are often not consistent between sites and do not necessarily represent the true areas covered by the turbines. By fitting models to data collected for 23 species at 32 sites it has been possible to produce generic distributions showing the proportion of birds expected at 1 metre intervals between 0 and 300 m above sea-level. This is of enormous benefit to the consenting process as it means that collision risk models can be based on the actual height range covered by the turbine as opposed to being constrained to using the height bands birds were assigned to during data collection, which may lead to inflated collision rates. It also means that it is possible to consider the impact of varying turbine design on likely collision rates. The updated guidance and a revised spread-sheet for offshore use of the Band collision risk model (Band 2012) that accompanies this review provides the means for estimating collision risk (i) using site-specific data and assuming an uniform bird density in the risk window; (ii) also using the uniform density model, but using a figure for the proportion of birds at risk height derived from generic data; and (iii) using data on flight height distributions, as produced by the modelling presented here. For collision risk modelling, it is recommended that consideration should be given to results using both the site-specific and the modelled flight height data presented here. 4.4.2 Avoidance The review provided here provides an up-to-date overview of studies of the avoidance rates of seabirds to offshore wind farms and turbines. While some notable studies have taken place, at present it is not appropriate to suggest that recommendations about the avoidance rates that should be used within the collision risk modelling framework should be updated. The availability of avoidance rates has been highlighted as a key factor that is impinging on the ability of models to produce accurate estimates of collision rates (Chamberlain et al. 2005). Despite this, there have only been a limited number of studies on avian avoidance of wind turbines. In order to enable accurate assessment of the collision risk associated with offshore turbines, and therefore simplify the consenting process, we must echo the call of Chamberlain et al. (2005) for more work to consider variation in avoidance within and between sites and species.

51
ACKNOWLEDGEMENTS Our thanks to Phil Bloor, Ian Davies, Ross McGregor, Jesper Kyed Larsen, Marcus Cross, Chris Pendlebury, Alistair Mackay, Graham Austin, Maria Scarlett, Sue King, Zoe Crutchfield, Eleri Owen and Paula Low for their help in obtaining and collating information for seabird flight heights and their comments on previous drafts. Thanks to Karen Krijgsveld for comments on previous drafts and for supplying avoidance data from Egmond aan Zee offshore wind farm. Thanks also to Ian Davies, Rob Fryer and Colin Millar for useful discussion on flight height modelling methodology. Finally, thanks to Bill Band and Sophy Allan for useful discussions about avoidance rates.

52

53
REFERENCES Band, W. 2000. Guidance WINDFARMS AND BIRDS: calculating a theoretical collision risk assuming no avoidance action. Guidance notes series 2000. Scottish Natural Heritage, Battleby. Band, W. 2012. Using a collision risk model to assess bird collision risks for offshore windfarms. SOSS-02 Project Report to The Crown Estate. Band, W., Madders, M. & Whitfield, D.P. 2007. Developing field and analytical methods to assess avian collision risk at windfarms. In: de Lucas, M., Janss, G. & Ferrer, M. (eds.) Birds and Wind Power. Lynx Edicions, Barcelona. Blew, J., Hoffmann, M., Nehls, G. & Hennig, V. 2008. Investigations of the bird collision risk and the responses of harbour porpoises in the offshore wind farms Horns Rev, North Sea and Nysted, Baltic Sea, in Denmark Part 1: Birds. University of Hamburg, Hamburg, Germany. Camphuysen, C.J., Fox, A.D., Leopold, M.F. & Petersen, I.K. 2004. Towards standardised seabirds at sea census techniques in connection with environmental impact assessments for offshore wind farms in the UK. A Comparison of Ship and Aerial Sampling Methods for Marine Birds and Their Applicability to Offshore Wind Farm Assessments. Report by Royal Netherlands Institute for Sea Research and the Danish National Environmental Research Institute to COWRIE BAM 02–2002. London: Crown Estate Commissioners. Available at: http://www.thecrownestate.co.uk/1352_bird_survey_ phase1_final_04_05_06.pdf. Chamberlain, D., Freeman, S., Rehfisch, M., Fox, T. & Desholm, M. (2005) Appraisal of Scottish Natural Heritage’s Wind Farm Collision Risk Model and its application. BTO Report to English Nature Chamberlain, D.E., Rehfisch, M.R., Fox, A.D., Desholm, M. & Anthony, S.J. 2006. The effect of avoidance rates on bird mortality predictions made by wind turbine collision risk models. Ibis 148: 198-202. Christensen, T.K., Hounisen, J.P., Clausager, I. & Petersen, I.K. 2004. Visual and radar observations of birds in relation to collision risk at the Horns Rev offshore wind farm. National Environmental Research Institute, Denmark. Christensen, T.K., Petersen, I.K. & Fox, A.D. 2006. Effects on birds of the Horns Rev 2 offshore wind farm: Environmental Impact Assessment. National Environmental Research Institute, Denmark. Cook, A.S.C.P., Ross-Smith, V.H., Roos, S., Burton, N.H.K., Beale, N., Coleman, C., Daniel, H., Fitzpatrick, S., Rankin, E., Norman, K. & Martin, G. 2011. Identifying a range of options to prevent or reduce avian collision with offshore wind farms, using a UK-based case study. BTO Research Report No. 580 to Defra. British Trust for Ornithology, Thetford. Day, R.H., Rose, J.R., Ritchie, R.J. & Shook, J.E. 2003. Collision potential of eiders and other birds near a proposed wind farm at St. Lawrence Island, October-November 2002. ABR, Inc. – Environmental Research & Services, Fairbanks, Alaska. Day, R.H., Rose, J.R., Prichard, A.K., Blaha, R.J. & Cooper, B.A. 2004. Environmental effects on the fall migration of eiders at Barrow, Alaska. Marine Ornithology 32: 13-24. De Lucas, M. Janss, G.F.E. & Ferrer, M. 2004. The effects of a wind farm on birds in a migration point: the Strait of Gibraltar. Biodiversity and Conservation 13: 395-407.

54
Desholm, M. 2005. TADS investigations of avian collision risk at Nysted offshore wind farm, autumn 2004. National Environmental Research Institute, Denmark. Desholm, M., Fox, A.D. & Beasley, P. 2005. Best practice guidance for the use of remote techniques for observing bird behaviour in relation to offshore wind farms. COWRIE Ltd. Desholm, M. & Kahlert, J. 2005. Avian collision risk at an offshore wind farm. Biology Letters 1: 296-298. Everaert J. & Stienen E. 2007. Impact of wind turbines on birds in Zeebrugge (Belgium). Significant effect on breeding tern colony due to collisions. Biodiversity and Conservation 16: 3345-3359. Everaert, J. & Kuijken, E. 2007. Wind turbines and birds in Flanders (Belgium). Preliminary summary of the mortality research results. Research Institute for Nature and Forest (INBO), Belgium. Fox, A.D., Desholm, M., Kahlert, J., Christensen, T.K. & Petersen, I.K. 2006. Information needs to support environmental impact assessment of the effects of European marine offshore wind farms on birds. Ibis 148: 129-144. Hexter, R. 2009. High resolution video survey of seabirds and mammals in the Rhyl Flats area. COWRIE Ltd. Garthe, S. & Hüppop, O. 2004. Scaling possible adverse effects of marine wind farms on seabirds: developing and applying a vulnerability index. Journal of Applied Ecology 41: 724-734. Krijgsveld K.L., Akershoek K., Schenk F., Dijk F. & Dirksen S. 2009. Collision risk of birds with modern large wind turbines. Ardea 97: 357-366. Krijgsveld, K.L., Fijn, R.C., Heunks, C., van Horssen, P.W., de Fouw, J., Collier, M., Poot, M.J.M., Beuker, D. & Dirksen, S. 2010. Effect studies offshore wind farm Egmond aan Zee; Progress report on fluxes and behaviour of flying birds covering 2007 & 2008. Bureau Waardenburg report No. 09-023, The Netherlands. Krijgsveld, K. L., Fijn, R. C., Japink, M., van Horssen, P. W., Heunks, C., Collier, M. P., Poot, M. J. M., Beuker, D., Dirksen, S. 2011. Effect Studies Offshore Wind Farm Egmond aan Zee. Final report on fluxes, flight altitudes and behaviour of flying bird. Bureau Waardenburg report 10-219, NZW-ReportR_231_T1_flu&flight. Bureau Waardenburg, Culmeborg, Netherlands. Langston, R.H.W. 2010. Offshore wind farms and birds: Round 3 zones, extensions to Round 1 and Round 2 sites and Scottish Territorial Waters. RSPB Research Report No. 39. RSPB, Sandy, UK. Larsen, J.K. & Guillemette, M. 2007. Effects of wind turbines on flight behaviour of wintering Common Eiders: implications for habitat use and collision risk. Journal of Applied Ecology 44: 516-522. Maclean, I. M. D., Wright, L. J., Showler, D. A. & Rehfisch, M. M. 2009. A review of assessment methodologies for offshore windfarms. BTO Report commissioned by COWRIE Ltd. Madders M. & Whitfield D.P 2006. Upland raptors and the assessment of wind farm impacts. Ibis 148: 43-56. Martin, G.R. 2011. Understanding bird collisions with man-made objects: a sensory ecology approach. Ibis 153: 239-254.

55
Martin, G.R. & Shaw, J.M. 2010. Bird collisions with power lines: failing to see the way ahead? Biological Conservation 143: 2695-2702. Masden, E. A., Haydon, D. T., Fox, A. D., Furness, R. W., Bullman, R., and Desholm, M. 2009. Barriers to movement: impacts of wind farms on migrating birds. ICES Journal of Marine Science 66: 746-753. Mellor, M., Craig, T. Baillie, D., Woolaghan, P. 2007. Trial high definition video survey of seabirds. Commissioned by COWRIE Ltd. Mellor, M. & Maher, M. 2008. Full scale trial of high definition video survey for offshore windfarm sites. Commissioned by COWRIE Ltd. Npower Renewables. 2007. Annual FEPA Monitoring Report (2005-6) North Hoyle Offshore Wind Farm., Npower Renewables Ltd., Swindon Parnell, M., Walls, R. J., Brown, M. D. & Brown, S. 2005. The remote monitoring of offshore avian movement using bird detection radar at Weybourne, North Norfolk. Central Science Laboratory, York, UK. Petersen, I.K., Christensen, T.K., Kahlert, J., Desholm, M., Fox, A.D. 2006. Final results of bird studies at the offshore wind farms at Nysted and Horns Rev, Denmark. National Environmental Research Institute, Denmark. Sadoti, G., Allison, T., Perkins, S. & Jones, A. 2005. A survey of tern activity within Nantucket sound, Massachusetts, during the 2004 breeding period. Final Report for Massachusetts Technology Collaborative. Massachusetts Audubon Society, Lincoln, MA, USA. Shamoun-Baranes, J. & van Loon, E. 2006. Energetic influence on gull flight strategy selection. Journal of Experimental Biology 209: 3489-3498. SNH. 2010. Use of avoidance rates in the SNH wind farm collision risk model. SNH Avoidance Rate Information & Guidance Note. Scottish Natural Heritage, Inverness, UK. Thaxter, C. B. & Burton, N. H. K. 2009. High definition imagery for surveying seabirds and marine mammals: a review of recent trials and development of protocols. BTO report commissioned by COWRIE Ltd. Walls, R.J., Brown, M. B., Budgey, R., Parnell, M. & Thorpe, L. 2004. The remote monitoring of offshore avian movement using bird detection radar at Skegness, Lincolnshire. Central Science Laboratory, York, UK. Wright, L. J., Ross-Smith, V. H., Massimino, D., Dadam, D., Cook, A. S. C. P., & Burton, N. H. K. 2012. Assessing the risk of offshore wind farm development to migratory birds designated as features of UK Special Protection Areas (and other Annex 1 species). BTO report to the Strategic Ornithological Support Service (SOSS), Thetford.

56

57
APPENDICES A1 Species sensitivities to collision risk as assessed by Langston (2010). High collision risk Bewick’s Swan Whooper Swan Corncrake Medium collision risk Bean Goose (Taiga) Pink-footed Goose Greater White-fronted Goose (Greenland and European races) Greylag Goose (Iceland and NW Scotland populations) Barnacle Goose (Nearctic and Svalbard populations) Dark-bellied Brent Goose Light-bellied Brent Goose (Svalbard and Canada populations) Northern Gannet Great Cormorant Pomarine Skua Long-tailed Skua Arctic Skua Great Skua Mediterranean Gull Lesser Black-backed Gull Herring Gull Iceland Gull Glaucous Gull Great Black-backed Gull Black-legged Kittiwake Sandwich Tern Common Tern Roseate Tern Arctic Tern Low collision risk Greater Scaup Common Eider Long-tailed Duck Common Scoter Velvet Scoter Goldeneye Red-breasted Merganser Red-throated Diver Black-throated Diver Great Northern Diver Slavonian Grebe Northern Fulmar Cory’s Shearwater Great Shearwater Sooty Shearwater Manx Shearwater Balearic Shearwater

58
European Storm-petrel Leach’s Storm-petrel European Shag Little Gull Black-headed Gull Common Gull Little Tern Common Guillemot Razorbill Black Guillemot Little Auk Atlantic Puffin

59
A2 Technical description of modelling methodology. As part of EIAs, information on the flight height of seabirds is collected during boat-based surveys following the standard methodology of Camphuysen et al. (2004). Under this methodology, birds in flight are assigned to height classes in order to provide an estimate of the number of birds at risk of collision. Typically, flight classes are defined as (i) below wind turbine rotor sweep, (ii) within wind turbine rotor sweep and (iii) above wind turbine rotor sweep. However, the varying size and design of wind turbines means that the de-lineation of these classes varies between wind farms. Consequently, combining data for analysis from different wind farms presents difficulties. The distribution of flight heights was fitted by a thin-plate log-spline with six knots (although for a small number of species the number of knots was reduced). (Eqn 1). Splines were initially fitted with six knots as this allowed for a bimodal distribution, without over-fitting the data. Knots were chosen based on evenly spaced data quantiles, assuming birds were flying in the midpoint of the flight height category. The spline formula was:
log(NBirdsa) = Z1,a + (β1*Z2,a) + ( β2*Z3,a) + (β3*Z4,a) + ( β4*Z5,a) + ( β5*Z6,a) (1) Where NBirdsa is the number of birds flying at height a metres above sea-level. NBirdsa was normalised after fitting to produce proportions flying at different heights. β values are coefficients, and Z is a matrix which is the product of two other matrices, Zκ and Ωκ
-1/2 (following notation by Crainiceanu et al. 2005). Zκ contains the cubed differences between flight heights and the knot locations and Ωκ contains the cubed differences between all the knot locations. Within each site, the numbers of birds flying within each height category was assumed to be from a multinomial distribution. The data from each site were assumed to be independent and the multinomial log-likelihoods could therefore be combined by addition. The β values were selected to maximise the log-likelihood, using the function “optim” in R (R Development Core Team). To obtain starting values for the values of β in the model for the full dataset for each species, the spline was fitted to the data collected from the site at which the greatest number of birds was recorded. The final spline from the optimised β-values was then used to estimate the proportion of birds flying at every height between 1 and 300 m. Chi-squared models revealed that there were small, but significant differences between the estimated proportion and the observed proportions at some sites, suggesting that there were differences between sites not accounted for in the model. To account for this source of over-dispersion in the models, a boot-strapping process was used to estimate confidence intervals. For each species, models were run for 500 bootstrap samples. The bootstrapping unit was the site, and each bootstrap sample had the same number of sites as the original data. The procedure was carried out such that each site was selected exactly 500 times over all the bootstrap samples. The results presented are the median values from each of these 500 bootstraps as well as the associated 95% confidence limits calculated from the quantiles of the bootstrap results. Crainiceanu, C. M., Ruppert, D. & Wand, M. P. 2005. Bayesian analysis for penalized spline regression using WinBUGS. Journal of Statistical Software 14. R Development Core Team. 2011. R: A language and environment for statistical computing. R Foundation for Statistical Computing, Vienna, Austria.