strategic middlemen: monongahela, mohawk, and …
TRANSCRIPT

STRATEGIC MIDDLEMEN: MONONGAHELA, MOHAWK, AND MESKWAKI
SETTLEMENTS IN A TRADE LANDSCAPE
By
Emma Elizabeth Bremer
Submitted to the Faculty of
The Archaeological Program
Department of Sociology and Archaeology
in partial fulfillment of the requirements for the degree of
Bachelor of Science
University of Wisconsin-La Crosse
2012

ii
Copyright © 2012 by Emma Elizabeth Bremer
All Rights Reserved

iii
STRATEGIC MIDDLEMEN: MONONGAHELA, MOHAWK, AND MESKWAKI
SETTLEMENTS IN A TRADE LANDSCAPE
Emma Elizabeth Bremer, B.S.
University of Wisconsin-La Crosse, 2012
North America was home to a vast set of trade networks both prehistorically and historically. In
several instances key passages within these networks were controlled by societies who acted as
middlemen. This position allowed them to command great power and wealth, which created
tension with their neighbors and trade partners. This study examines how the Monongahela of
the upper Ohio River valley (A.D. 1100-1635), the Mohawk of the Mohawk valley (A.D. 1525-
1776), and the Meskwaki of the Fox River Passage (A.D. 1665-1730) settled within their
territories and how these decisions may have reflected considerations including subsistence,
control of routes, and defense.
.

iv
Acknowledgements
First and foremost, I would like to thank my readers, Dr. Constance Arzigian and Dr. David
Anderson for their constant support and guidance. I would also like to thank the members of my
reading group, Cindy Kocik and Caitlin Larson, as well as my family, roommates, and friends
for supporting me through this long process and providing much needed help with editing. Last,
but not least I owe a huge debt of gratitude to Dr. Jeffrey Behm for sharing his knowledge of the
Meskwaki and meeting with me at the Archaeology Lab at the University of Wisconsin-
Oshkosh, and to Dr. Dean Snow and Dr. David Anderson for kindly providing me with the
datasets and assistance that made this research possible.

1
INTRODUCTION
North America was home to societies of middlemen who commanded ironclad control over trade
corridors, often following waterways, both in prehistory and during the contact period. They
used their positions to gain power, influence, and wealth. Native allies and Europeans alike were
at the mercy of their control. For the purpose of this paper I will be focusing on three such
middleman societies: The Monongahela Culture, the Mohawk, and the Meskwaki. Each
controlled their respective trade corridor during different periods (Figure 1), but they shared
several important characteristics. All practiced a mixed subsistence pattern with a focus on corn
horticulture, fortified their villages, and controlled river valleys. It is also important to note that
while they faced intertribal warfare and raiding, each of these middlemen groups also collided
with enemies who possessed great military advantages, both politically and technologically.
The Monongahela culture of southwestern Pennsylvania, northern West Virginia, and
eastern Ohio controlled the upper Ohio River Valley from around A.D. 1050-A.D. 1635. They
operated as pre-contact and protohistoric middlemen in a trade route between the Ohio Valley
and Neutral Nation in the marine shell trade, later participating in the fur trade (2001). Many of
their settlements were found in upland locations near soils that are very suitable for corn
agriculture. Johnson et al.(1989) found that many of the settlements are located in upland
locations on features that include stretches of slightly lower land between peaks (saddles),
prominent rounded hills (knobs), and flat, narrow stretches of land (benches). These settlements
are also associated with tributary divides for the Ohio, Monongahela, Youghiogheny, and
Allegheny rivers and known overland trails. There appears to be an overall shift toward more

2
intensive use of maize horticulture through time (Anderson and Simon 2009; Johnson et al. 1989,
Johnson 2001).
Known as the Keepers of the Eastern Gate, the Mohawk had the most intensive exposure
to Europeans and controlled the flow of people and goods west through their territory (Jones
2008; Richter 1992). The Mohawk homeland extended from Amsterdam to Little Falls, New
York, following the Mohawk Valley. Villages were generally located within 7 km of the
Mohawk River (Fenton and Tooker 1978; Snow 2001). Jones (2008) found that the League
Iroquois, of whom the Mohawk are one of the Five Nations, generally exhibited a trend of
locating settlements in areas most suited to defensibility, access to overland trade and
communication routes, and productive soils. Earlier sites in the fifteenth and sixteenth centuries
display a greater focus on defensibility than later ones. The settlement pattern took on an
intricate series of adjustments throughout the historic period as the Mohawk adjusted to
epidemics, the influx of refugee populations and adoptees, and aggressions from the French and
native enemies (Snow 1995a).
The Meskwaki were middlemen in the Middle Fox Passage from approximately A.D.
1680- A.D. 1730. Little is known for certain about them before they were displaced from
Michigan by intertribal warfare and relocated to Wisconsin (Behm 2008; Edmunds and Peyser
1993; Hunt 1940). They eventually established themselves in the Middle Fox Passage in east-
central Wisconsin. The earliest known settlement was set back on a high embankment out of
sight from the Wolf River, a tributary of the Fox River. In the Middle Fox Passage, settlements
were quite close to the water and would have been visible from the route. Soils close to the river
would have been fertile (Behm 2008).

3
Each group appears to shift groups of settlements to be nearer to more fertile soils,
occupy higher ground, and exert control over their territory over time. Therefore, this study will
examine how settlements are distributed in relation to fertile soils, relief, and confluences of
bodies of water. To truly understand how each middleman society took shape and account for
the similarities and differences between them, it is important to take into account the forces that
shaped them, including geography, the landscape, the social and political atmosphere, and the
cultures themselves. Since several of these factors were incredibly dynamic, I will be studying
these societies synchronically and diachronically. I will also be taking into account possible
differences between main settlements and smaller settlements, such as hamlets, since they may
have served different functions within the settlement system and may or may not have been
related to the culture’s involvement in trade.
Figure 1. Middleman culture areas (adapted from the National Atlas of the United States, U.S.
Geological Survey 2012).

4
LAY OF THE LAND
Environment, Terrain, and Trade Implications
The core region of the Monongahela culture (Figure 2) was located in an unglaciated portion of
the Allegheny Plateau (Johnson 2001; Johnson et al. 1989). Most sites were in areas of the upper
Ohio River Valley that have over 140 frost-free growing days, averaging 170 frost- free growing
days. The growing period may be extended in these upland locations because of the beneficial
nature of airflow through the valley, which delays killing frosts (Johnson et al. 1989).
Approximately 70% of these sites in the Monongahela River basin were located in the uplands
and, significantly, were associated with the most fertile soils in the area (Anderson and Simon
2009; Johnson et al. 1989). Many of these upland sites were located on benches and saddles on
tributary divides for the Ohio, Monongahela, Youghiogheny, and Allegheny Rivers (Johnson et
al.1989; Johnson and Athens 1998; Johnson 2001).
The Mohawk Valley lies between the Adirondack Mountains and the unglaciated
Appalachian uplands, and has been a natural trade corridor for thousands of years. By and large,
the rocks in the area are Ordovician shales, siltstones, and sandstones. Older igneous rocks lie to
the north with the Adirondacks, and younger Devonian and Silurian rocks lie to the south with
the Appalachians (Snow 1995a). Glaciations have formed a landscape of U-shaped stream
valleys, lakes, and rolling till plains. Soils in this area are deeper and better drained than those in
surrounding areas, providing an ideal environment for swidden agriculture (Jones 2008:97-99).
The Mohawk settlement pattern displayed a clear preference for areas with loamy soil that
overlay sedimentary bedrock (Snow 2001:19).

5
Eastern Wisconsin’s landscape has been heavily altered by glacial activity. The
Wisconsin glaciation covered parts of Wisconsin as recently as 12,000 years ago and scoured the
Great Lakes. It changed the landscape of east central Wisconsin to one of low, flat relief, dotted
with countless streams, lakes, and marshes (Kay 1977). The resulting network of waterways
became an integral part of trade. The Wisconsin River flows south through nearly the entirety of
the state before turning west to meet the Mississippi River. The Fox River headwaters are only
two miles from the lower Wisconsin River. An important route west followed the Fox River
from its mouth in Green bay to this portage (Behm 2008; Edmunds and Peyser 1993; Kay 1977;
Kellogg 1968). An important area along the Fox-Wisconsin Waterway, which passed through
Lake Winnebago, Lake Butte des Morts, and Lake Poygan was known as the Middle Fox
Passage. Before the damming of the opening to Lake Winnebago, which raised the water level
slightly more than three feet (Mason 1989; Titus 1941), the route was characterized by marshy
expanses cut through by a muddy channel that meandered sluggishly. During this time, east
central Wisconsin was also on the margin between deciduous forest and oak prairie. A fairly
open setting provided excellent visibility along the trade route (Tanner 1987; Kay 1977).

6
Soils and Corn Horticulture
All three groups in this study intensively raised and stored maize along with some other crops,
most notably beans and squash. For successful yields, corn generally requires at least 140 frost
free growing days, particularly if it is being raised in any intensive form. Further, it is a deep
rooting crop that requires nitrogen rich environments and moist, well drained limey soils. While
there are many variables that are considered when determining soil fertility, several of the most
prominent include texture, drainage, depth, and ability to hold moisture. These factors relate
closely to the how easily the soil can be eroded as well as how well it holds on to nutrients and
minerals (Jones 2008).
Middlemen Through Time
Monongahela
Unlike the Mohawk and Meskwaki, the Monongahela were not represented in the ethnohistoric
record, and what we know of their culture comes from the archaeological record. Exactly who
the Monongahela were is under debate, though they were most likely a confederation of tribes
who spoke an Iroquoian language and were known as the Black Minqua or Massowomeck
(Anderson 2002; Johnson and Athens 1998; Johnson 2001). They were intermediaries in the
whelk shell trade between Chesapeake Bay, the Ohio-Allegheny Valley, and the Ontario and
Lower Great Lakes region (Johnson 1992, 2001; Lapham and Johnson 2002:97). In protohistoric
times, the Monongahela also had a monopoly over the fur trade in the upper Ohio Valley. The
early Monongahela period (A.D. 1050/1100-1250) was marked by planned, nucleated villages
that were made up of circular houses surrounding a central plaza. Villages were surrounded by
flimsy palisades. Maize, beans, and squash were grown with increasing intensity, and by the
7
middle Monongahela period maize may have constituted 50-70% of the diet (Anderson and
Simon 2009). The middle Monongahela period (A.D. 1250-1580) is marked by a contraction of
Monongahela settlements from more marginal agricultural areas into the core culture area (lower
and middle Monongahela River basin), the appearance of para-Iroquoian ceramics, the
construction of houses with pear shaped storage extensions (petal houses), and the construction
of stockades with trenches (Johnson 2001). Decorative features on ceramics continued to reflect
Iroquoian and Susquehanna River basin features. Settlements of the late or protohistoric
Monongahela Period (A.D. 1580-1635) no longer had stockades, and some villages showed signs
of consolidation with two or three house rings. During this late period, the Monongahela were
withdrawing even further, probably as a result of environmental stress, depopulation from
disease, and pressure from Iroquoian raids (Richardson, Anderson, and Cook 2002). By 1635,
the Monongahela had dispersed, most likely as a result of Seneca aggression, and taken refuge
among the Susquehannocks (Johnson 2001).

8
Figure 2. Monongahela territory (Lapham and Johnson 2002, Figure 1).

9
Mohawk
While the Mohawk had been in the Mohawk Valley (Figure 3) long before 1525, it was only
after this point that they maintained contact with Europeans and became middlemen. Like many
groups in the northeast, the Mohawk grew maize along with beans and squash. This diet was
supplemented with the exploitation of wild resources. Settlements were composed of matrilineal
longhouses packed within heavy palisades and were often located on hills or bluffs (Snow 1995,
2001). There was a slow shift toward more open locations that overlooked the Mohawk River
and were near fertile soils. Fertile river flats were used increasingly for agriculture (Snow 2001).
At a given time, there usually were between three and four large fortified villages, which were
known as castles. Settlements would relocate approximately every ten years or whenever the
surrounding resources were exhausted (Richter 1992, Snow 1995a, 2001). Between 1525 and
1626, the Mohawk gained power and established their position as middlemen. After 1626,
tension mounted as furs became harder to come by and other nations, particularly the Onondaga,
began to resent Mohawk control (Hunt 1940). Between 1626 and 1635, trade alliances shifted
several times between the French, English, and Dutch. Contact with European powers increased
as Jesuit priests were allowed into communities and the first formal treaty was signed with the
Dutch. After an epidemic swept through in 1634, the Mohawk engaged in a series of wars
against the Huron and Algonkian groups to the north and west in hopes of securing captives and
greater control over the fur market (Hunt 1940; Richter 1992; Snow 1995a). A series of raids by
the Mahicans in 1626 and the French in 1666 and 1693 caused settlements to shift between the
north and south side of the Mohawk River. By 1675, large numbers of Mohawk were relocating
to Canada with Jesuit missionaries. The settlement pattern after 1700 was scattered. Most of the
remaining Mohawk lived in European style cabins outside of the two remaining castles and were

10
under the protection of the English Fort Hunter. The Mohawk largely relocated to Canada after
the Revolutionary War, during which had they allied themselves with the British (Snow 1995a,
2001).
Figure 3. Northeast regional map with Mohawk territory (Bradley 2001, Figure 4.3).
11
Meskwaki
Meskwaki collective memory holds that they first lived near the Atlantic Ocean and were slowly
pushed west, eventually settling in the Detroit area of Michigan (Behm 2008; Buffalo 2008;
Edmunds and Peyser 1993). In the 1640s and 1650s, regional hostilities mounted as the
Mohawk and various other members of the Five Iroquois Nations mounted a series of wars
against the Huron and the Neutral Nation. Many peoples were pushed west as a result of these
competitive hopes of gaining control of fur rich territories. As a result of this turmoil, the
Meskwaki and several other tribes were displaced to Wisconsin. Wisconsin became a very
diverse environment with many villages housing multiple ethnic groups (Edmunds and Peyser
1993; Hunt 1940; Kay 1977). The Meskwaki arose as a powerful and populous tribe in the
1680s when they established themselves in the Middle Fox Passage. They soon gained a
reputation for being quarrelsome and difficult, refusing to trust the French. In 1710, the French
established the Fort at Detroit to maintain their presence in the West. At the invitation of the
French, over a thousand Meskwaki relocated to the Detroit area, which was still remembered as
their homeland. The Meskwaki presence made the French nervous, and sparked the first Fox
War in 1712, which resulted in the massacre of the Meskwaki living at Detroit. Reverberations
of this conflict echoed in Wisconsin as hostilities came to an uneasy peace in 1716. Several
years later, in 1728, the Second Fox War resulted in the genocide of the Meskwaki. The few
surviving Meskwaki were driven West with the Sauk to Minnesota and eventually Iowa
(Edmunds and Peyser 1993; Kellogg 1968).
Prior to their early settlement on the Wolf River, little is known about them as they had
little direct contact with Europeans and have proven to be difficult to identify archaeologically.
They grew maize, beans, squash, pumpkins, and melons in the fertile soils of river bottoms and

12
also hunted (Callender 1978). Summer villages were made up of long open lodges in parallel
rows, which housed extended families. Scattered winter camps were composed of anywhere
from a few families to an entire band. Winter dwellings were round domes covered in cattail
mats (Callender 1978; Edmunds and Peyser 1993).
The Wolf River Village (Markman Site) was their first known village in Wisconsin and
was occupied between 1665 and 1680. In a far less visible location than later villages and set off
from travel routes, the characteristics of its location were distinctly different from those of later
settlements. In 1680, the Meskwaki established settlements in the Middle Fox Passage (Figure
4), taking advantage of an increase in the intensity of the fur trade (Edmunds and Peyser 1993;
Kay 1977; Kellogg 1968). Between 1680 and 1712 there were two recorded settlements: one at
the confluence of the Lower Fox River and Lake Winnebago on Doty Island (Mahler Site), and
the Grand Village (Bell Site) on Lake Butte des Morts. The Grand Village was located on the
southern shore of Lake Butte des Morts on a high point, which provided a great view over the
surrounding area (Behm 2008). It was located between the confluences of the Fox and Wolf
Rivers and the confluence of the Fox River and Lake Winnebago. Excavations (Behm 1992,
1998, 2008) revealed at least two burn layers and grenade fragments. One of these layers relates
to a siege from the First Fox War in 1716, which was the only time that grenades were used.
Between 1728 and 1730, two additional villages were also located in the Middle Fox
Passage. The West Meskwaki Village, noted by Chaussegros de Léry’s 1730 map, was located
at the former confluence of the Fox and Wolf Rivers. It would have not only been a good control
point for trade, but was located advantageously for exploiting the rich soils of the river flats and
riverine resources. Unfortunately, the site is inundated as a result of damming.

13
The East Meskwaki Village was also noted vaguely in the de Léry map. It has been tied
to Farney Point on the western shore of Lake Winnebago, though the exact location remains
undetermined. This point would have made an excellent watch point for traffic crossing or
travelling around Lake Winnebago toward the Grand Village.

14
Figure 4. Middle Fox Passage (adapted from Faulkner 1974, Figure 1.).

15
Theoretical Perspective
The Monongahela, Mohawk, and Meskwaki had similar economic strategies, heavily utilizing
trade and engaging in a mixed subsistence economy that relied heavily on maize agriculture.
However, each group was also the product of its own history and socio-political conditions.
Behavioral ecology can be defined as “the study of adaptive behavior in relation to social
and environmental circumstances” (Bird and O’Connell 2006:143). I seek to provide both
historical and functional explanations for middleman settlement patterns. A functionalist
perspective will be useful in examining the costs and benefits of economic and subsistence
activities, but it is important to remember that local conditions and sequences of events can be
expected to shape cultural decisions and characteristics in unique ways.
METHODOLOGY
The focus of this study is to examine how middleman societies in the Northeastern United States
located their settlements in the landscape so as to take the greatest advantage of subsistence
opportunities, as well as defensive opportunities. Through this research I hope to gain a greater
understanding of not only how local currencies and costs may influence settlement choices, but
also of larger processes that shape life in trade landscapes. In order to do this, I have chosen
three middleman societies to examine: the Monongahela (A.D. 1100- 1630), the Mohawk (A.D.
1525-1776), and the Meskwaki (1665-1730). Since I am studying defensibility, soil fertility, and
control of the trade corridor, my variables include the landforms on which sites are found, the
relative productivity rating for related soils, and site distance from stream confluences.

16
Selection of Societies and Periods
The Monongahela, Mohawk, and Meskwaki were chosen because they have all been established
as middlemen, either historically or through archaeology, represent different time periods, have
different landscapes, unique cultures and political circumstances, and have accessible settlement
data. Relative comparisons of broad trends should confirm settlement adaptations that are
beneficial to middleman roles and additionally provide some insight into conditions that are
unique to each society.
For the purpose of comparison, each group was divided into three temporal segments
based on previously established chronologies or major events or trends which I observed. The
Monongahela sequence was previously defined mainly using changes in pottery styles and, later,
the presence or absence of European trade goods (Johnson 2001; Mayer-Oakes 1955). I began to
study the Mohawk in 1525, when European artifacts first show a strong presence in the
archaeological record. The middle period began when the Mohawk became established
middlemen and aggressively protected their economic interests and waged a series of wars
against the Huron and other competing groups (Hunt 1940; Richter 1992; Snow 1995a). I
identified the late period (1626-1666) as the time during which the French launched attacks on
settlements and there was political jostling as the Mohawk were torn between the French and
English (Richter 1992; Snow 1995a). The late period ended at the summation of the
Revolutionary War, when the Mohawk were driven from their lands for their alliance with
Britain (Snow 1995a). The early period for the Meskwaki spans from the time they were driven
from eastern Michigan, roughly in the 1640s, to 1680, when they moved to the Middle Fox
Passage. The only site from the early period dates to around A.D. 1660-1680, and future
references in this work to early Meskwaki sites use this range because of that. During the middle
17
period, the Meskwaki controlled the Middle Fox Passage without much incidence. I have
designated the period of 1712-1730 as the late period because it was marked by two wars and
constant hostilities with the French and neighboring tribes. During this period, hostilities
culminated into an effort to exterminate the Meskwaki between 1728 and 1730 by the French
and their native allies.
Data
The sample of Monongahela and Mohawk sites comes from databases kindly provided by Dr.
David Anderson and Dr. Dean Snow, respectively, who have conducted previous research in
these areas. Sites were selected from within these databases based on their period, and the
applicability and completeness of information in entries. Sites that were excluded included six
settlements from the Monongahela database with an “Unknown” settlement type and one
nameless site from the Mohawk database whose terminal date fell far outside of the norm for
other late period sites. Additionally, Wisconsin sites that were not primarily associated with the
Meskwaki but had Meskwaki remains, dated after the end of the late period, or have few remains
and no ethnographic references were excluded. It is also important to note that each society had
several sites that were re-occupied. These sites were included in the analysis for each period
during which they were occupied.
Within the Monongahela Site Database (Anderson 2012), sites were assigned to one or
more periods of occupation. This pre-existing classification was followed by selecting sites to
study for each period. Upland and lowland sites had been previously determined. Several
different landscape features were listed within this database, and for the selected sites these
designations included: Bench, Terrace_Holocene, Saddle, Knob, Terrace_Illinoian, Bench and
Terrace_Illinoian, Terrace_Wisconsinan, Other-Low Slope to Bench, Other-Spine, and Other.

18
To simplify the analysis, these categories were narrowed into benches, terraces, saddles, knobs,
and other landforms. The categories of Saddle and Knob did not have any other features from
the Monongahela Sites Data (Anderson 2012) database added to them. However, in this study
Terraces refer to the designations of Terrace_Holocene, Terrace_Illinoian, and Terrace
Wisconsinan and “Other” refers to the Other-Low Slope to Bench, Other-Spine, and Other
feature designations from the database(Anderson 2012).
Settlement designations in the database (Anderson 2012) included:
Hamlet_Farmstead_Multiple, Hamlet_Farmstead_Isolated, Village and
Hamlet_Farmstead_Isolated, Village and Hamlet_Farmstead_Multiple, Village, and Unknown.
Unknown sites were discarded, and the remaining sites were divided into Hamlets and Villages.
Hamlets include the categories Hamlet_Farmstead_Multiple and Hamlet_Farmstead_Isolated
while Villages include Village and Hamlet_Farmstead_Isolated, Village and
Hamlet_Farmstead_Multiple, and Village.
The New York Sites database (Snow 2012) included data from cultures ranging from
Clovis to historic times, site coordinates, site names, beginning and end dates, and settlement
types for sites within the state of New York. Sites were chosen by establishing “Mohawk” as the
culture I wished to study and selecting beginning dates between 1525 and 1768 in a Microsoft
Access query. Sites were easily divided into periods by selecting corresponding beginning and
ending dates. In contrast with the Monongahela data, designations for upland and lowland status
of sites are a combination of my own observations using topographic maps (NRCS 2012) and
available site descriptions from Mohawk Valley Archaeology: the Sites (Snow 1995a). Values in
the soils analysis for Mohawk and Meskwaki sites are also of my own observances.

19
To obtain soils values, examine landscape features, and measure site distances from the
nearest confluence, I used Web Soil Survey, which is a web service provided by the Natural
Resources Conservation Service (2012), an agency under the United States Department of
Agriculture. To use this service, I entered the coordinates of each site and measured octagonal
catchment areas with boundaries 1 km from coordinate point. These boundaries were measured
by hand after calibrating the screen for accuracy. After establishing my area of interest, I
selected data for customized soil reports under the “Suitabilities and Limitations for Use” tab and
the “Soils Reports” tab. For each, I requested values for corn under “Yields of Non-Irrigated
Crops.” Data from the “Suitabilities and Limitations for Use” tab included the percent and
acreage make-up of individual soil types within the area of interest while data from the “Soils
Reports” tab was comprised mainly of the average bushels per acre provided by each soil type in
a given county.
To analyze the relative soil fertility, I took the three most prevalent and accessible soil
types within a catchment area. This means that soils in areas that were steep, cut off from the
site either by relief or major waterway, or heavily altered (cut and fill land) were excluded.
Fluvial soils and cut and fill soils were only included as one of the three soil types when there
were no other soil types that were both accessible and of significant acreage. Areas that either
had limited farmable areas or many types of soil could have as few as 12 acres for a major soil
type. Because neither fluvial soils nor cut and fill soils were given average yield ratings and
could make up large percentages of land, catchment areas which had more than 20% of the soils
categorized as cut and fill or fluvial were excluded from the analysis. Likewise, catchment areas
with more than one of the most common and accessible soils associated with an undetermined
value (in bushels per acre of non-irrigated corn) were also excluded from the analysis. While

20
these exclusions apply mainly to Mohawk data, several Monongahela sites were also excluded.
These sites were those with 5555, 6666, or 9999 values in the “Corn Yield in Bu/acre” column.
Excluded sites will be discussed later with data problems.
Web Soil Survey also provided useful mapping features that aided me in my examination
of site situations within the landscape and site distances from the nearest confluence. It was
possible to select for a topographic map as the background for an area of interest, adjust the map
scale, and measure distances using a “ruler” feature. Consequently, I used the topographic
feature to examine the topography of sites and the area that surrounds them. I also found this
view useful when measuring confluence distances because streams are well marked on
topographic maps.
Meskwaki data was collected in a different way. Sites were identified based on published
data on excavations and surveys. These sites were then located using Wisconsin Archaeological
Sites Inventory reports (Wisconsin Historical Society 1993, 1994, 1998a, 1998b, 2011, 2012).
Examination of Variables
As has been mentioned, landscapes vary greatly between each society. Consequently, variables
are defined differently for each group. Examining the variables in a relative fashion enables
cross-cultural comparisons.
Defensible locations within a landscape can be linked to the landforms on which
settlements rest. The location of settlements on high or low features in the landscape of
individual territories will be the main method of examination for defensibility. Among the
Monongahela, highland locations include saddles, knobs, and benches, while lowland areas will
be defined as those areas lying on river or stream terraces (Figure 5). In the landscape, saddles
can be identifies as areas between two peaks, knobs as prominent rounded hills, and benches as

21
flat, narrow platforms of land. While both benches and river or stream terraces are flat platforms
resulting from the river cutting into the landscape, benches are narrower and associated with
more upland areas in this area. Data for this analysis came from the Monongahela Sites Data
database (Anderson 2012).
Figure 5. Typical features in Monongahela landscape analysis.
Highland areas among the Mohawk are here defined as bluff tops, hills, and knolls, while
lowland areas are areas on alluvial flats or on low lying stream terraces (Figure 6). Hills are
simply areas that extend above the surrounding landscape, whereas knolls can be differentiated
in that they are specifically small hills that are rounded in nature. Bluffs are large hills, generally
found around rivers, with one or more sides that drop off dramatically. These features were
either described in Mohawk Valley Archaeology: the Sites (Snow 1995a) or were observed using
topographic maps (NRCS 2012).

22
Figure 6. Typical features in Mohawk landscape analysis.
Since the landscape of east central Wisconsin has low relief, highland locations can be
described as broad hills or embankments. Lowland areas include alluvial flats along the banks or
shores of waterways. These features are either listed in Archaeological Site Inventory Reports
(Wisconsin Historical Society 1993, 1994, 1998a, 1998b, 2011, 2012) or are visible in
topographic maps (NRCS 2012).
Soil productivity was addressed by determining the average non-irrigated corn yield
value (in bushels) for the top three soil types within 1 km of each site. These soil values were
then compared to the average regional yield. As a control, ten additional catchment areas were
randomly selected for the Mohawk and Meskwaki areas. The Monongahela are an exception to
this since a prevalence of steep slopes in the upper Ohio Valley limit arable land to the areas on
which sites rest. Soil values for Monongahela settlements come from previous research
(Anderson 2012), but soils data for areas on and around Mohawk and Meskwaki settlements
were obtained from the United States Department of Agriculture’s Web Soil Survey (NRCS
2012). This online program allows users to define areas of interest and obtain soils data, which

23
include the types of soils present, their prevalence, detailed descriptions of the soils, and
vegetative productivity. For this study, vegetative productivity was measured in terms of un-
irrigated bushels per acre for corn using modern farming methods. These values are applicable
to the past because the relative productivity of in-tact soils should not be affected.
Control of the trade corridor was then examined through the proximity of sites to stream
confluences as the crow flies. Measurements start at the presumed center of the site and extend
to the center of the stream confluence. Distances have been grouped into the following ranges
for easier relative comparison: less than 500 m, 500 m-1000 m, and greater than 1000 m. The
use of ranges should also serve to balance variability in measurements. These measurements do
not account for ease of access to confluences, but are rather meant to provide general information
on positioning and surveillance.
Data Problems
Site information:
While the archaeological record is never complete, solid, indisputable evidence for several
Meskwaki sites in east central Wisconsin is particularly evasive. From historic records, we now
have a general sense of where sites were located. Unfortunately, damming activities have raised
the water level of Lake Winnebago by almost four feet, inundating several sites (Behm 2008;
Mason 1989; Titus 1941). Further preservation problems and a short period of occupation make
Meskwaki sites difficult to pin down to circumscribed areas.
To mitigate this concern, locations have been chosen through the combined
consideration of the opinions of other scholars, historic descriptions, and historic maps. Where
sites are inundated, the nearest available land is used to measure soil fertility and estimates for a

24
site’s proximity to a stream confluence are based on the proposed location and nature of the
waterway.
Overland Trails.
While the Middle Fox Passage is a riverine trade route, the upper Ohio River Valley and the
Mohawk Valley housed major overland trails. Several scholars have noted that sites have a
relationship with these overland trails (Hasenstab 2007; Jones 2008). Since overland trails were
major parts of the routes through these corridors, this almost certainly affects their relationship to
stream confluences, which would be very important for any travel by water. Consequently, it is
expected to see a significant disparity between a site’s distance from a stream confluence among
the Meskwaki and the distance between Monongahela and Mohawk settlements and stream
confluences. It is also important to note that proximity to stream confluences becomes more
significant in lowland areas. This is because upland streams, particularly in areas of high relief
such as the region settled by the Monongahela, are often very small and shallow.
Soils
Soil catchment areas were determined by setting an area of interest (AOI) with borders 1 km
from a site’s coordinates or estimated location using Web Soil Survey (NCRS 2012). The
usefulness of this catchment area varies based on the terrain. For example, fields associated with
a site sitting on the base of a bluff in the Mohawk Valley are unlikely to be on the areas on top of
the bluffs if there is flat land available nearby. Consequently, soils were chosen with
accessibility in mind.
Since soil surveys are conducted by counties, yield values also vary by location (NRCS
2012). This has proven to be a point of frustration with Mohawk sites since catchment areas split

25
between counties may have differences of up to 20 bushels per acre for non-irrigated corn with
soils of what seem to be the same type. All soils values were used as listed in soil reports.
An additional problem that plagues sites is alterations in the soils based on erosion or
human use. To account for this, sites were excluded from soils analysis when they had either
over half of their acreage made up of soils that do not have a bushels per acre rating or if the two
most abundant or most available soils did not have bushels per acre ratings. Sites excluded from
the Monongahela dataset include the Vesta Mine Site, the Speers Site, the Vesta Bottoms site,
the Horn-Stephens-Giles Farms Site, the Grays Landing 2 Site, the Outcrop/Morgan site, the
Voegtly Cemetery Site, an unnamed early site, the Drew Site, the Wilkinson Site, the Kiski
Junction Site, the Rice Site, the State College Site, the Rochester Site, the Fisher #Beazels Site,
the Brave Site, and the Delphene Site (Anderson 2012). Sites excluded from the Mohawk soils
analysis included the Fort Hunter Site, the Gravel Ridge Site, the Bushy Hill Site, the Lipe 2
Site, and one of the ten randomly selected controls (Snow 2012). In addition, although Site
154A-7-1 is included in all other analyses, it was accidentally excluded from soils analysis. No
selected Meskwaki sites were excluded from analysis.
Landscape
Most information about how sites were situated on landscape features came from site
descriptions and databases. There were, however, several instances in which no data was
available and geographic features defied any firm interpretation using topographic maps. Almost
all of these sites were found in upland locations. Since hills are simply defined as areas rising
above the rest of the landscape, many of these upland sites have been categorized as hills.

26
ANALYSIS
A description of findings must be prefaced by an introduction of the nature of my samples. In
total, I used 134 Monongahela sites. The early period had 60 sites, of which 47 were villages
and 13 were hamlets. There were 53 sites from the middle period, which included 47 village
sites and six hamlets. Twenty one sites made up the late sample, with 20 village sites, one
hamlet or farmstead (Anderson 2012). It is worth noting that several Monongahela sites were re-
used during each period, since there was a practice of returning to previously occupied locales in
later time periods (Johnson et al. 1989).
Data sets for Mohawk included a total of 53 sites for all time periods. The early period
had 16 sites, 15 of which were village sites; the middle period had 18 sites of which 16 were
villages, and the late period had 19 sites, of which 16 were villages (Snow 2012).
In total, there were six Meskwaki sites (Wisconsin Historical Society 1993, 1994, 1998a,
1998b, 2011, 2012). One of these sites dated to the early period, one specifically to the middle
period, and three specifically to the late period. The sixth village, the Grand Village (Bell Site),
carried over from the middle period to the late period. The relatively low number of sites is most
likely a reflection of the brevity of the Meskwaki presence in east central Wisconsin, which was
a period of about fifty years. It is likely that there are a greater number of Meskwaki sites
scattered throughout the area, but they have yet to be located and may never be found.

27
Results for Proximity to Nearest Confluence
Monongahela
Among early Monongahela sites (A.D. 1050/1100-1250), 35% were within 500 m of the nearest
confluence, with 30% between 500 m and 1000 m, and 13% farther away than 1000 m. In the
middle period (A.D. 1250-1580) there was a marked increase in village settlements between 500
m and 1000 m of the nearest stream confluence, at 50%. Twenty five percent of village sites
were within 500 m of the nearest confluence and 15% were over 1000 m away. Late period
Monongahela village settlements (A.D. 1580-1635) returned to a similar pattern to what could be
seen in the early period. There were far fewer hamlets represented. Late period villages within
500 m made up 45% of all settlements, 38% were between 500 and 1000 m, and 10 % were over
1000 m from the nearest stream confluence.
As we can see in Figure 7, there was a general shift to locations that were slightly further
away from the nearest confluence between the early and middle periods. This is not surprising
since there is a contemporaneous shift to upland locations, as we shall see, in the middle period
as well. Upland streams are often small, rendering them far less important as potential means of
transportation and territorial control. It is also apparent that this shift was reversed in the late
period. During this time, the Monongahela were under heavy threat from Seneca raids and
settlements were spread throughout the landscape. It is possible that an increased proximity to
stream confluences in more lowland areas could be more significant as a means of territorial
awareness and escape from raiding parties. While sites further than 1000 m from the nearest
confluence never made up more than twenty percent of the total, there were progressively fewer
of these sites in each period.

28
Figure 7. Distance of Monongahela settlements from confluences by period.
Mohawk
Mohawk sites show a similar general pattern to that seen among the Monongahela sites. In all
periods, most sites were within 1000 m of the nearest stream confluence. Between the early
(A.D. 1525-1626) and middle (A.D. 1626-1666) periods, settlements moved farther from stream
confluences and there were increases in both the 500 m-1000 m and over 1000 m categories.
This trend reversed itself in the late period (A.D. 1666-1776), with nearly equal percentages of
settlements falling either within 500 m or between 500 m and 1000 m of the nearest confluence.
The movement away from stream confluences in the middle period happens as settlements move
slightly closer to the Mohawk River and into more lowland areas, most likely in response to
growing relationships with European powers. It is possible that the increased distance from
stream confluences during this period was tied to the increase in brutal intertribal warfare. Late
period sites continued to be located in increasingly lowland areas near the Mohawk River as a
0%
10%
20%
30%
40%
50%
60%
Early Middle Late
Percen
t o
f P
erio
d S
ett
lem
en
ts
Period
Distance from Confluences:
Monongahela Settlements
Less than 500m
500m-1000m
Over 1000m

29
result of the security offered by the League of the Iroquois and an alliance with the British.
Because of this, it is possible that increased proximity to stream confluences reflects those
conditions. It is also possible that these differences in the proximity to stream confluences in
each period are more closely aligned with how suitable areas for settlement are situated in the
landscape compared to confluences. Less than 10% of sites in each period, except for the middle
period (11%), were located over 1000 m from the nearest confluence. None of the hamlets from
any period were over 1000 m from the nearest confluence.
Figure 8. Distance of Mohawk settlements from confluences by period.
Meskwaki
Meskwaki data differed from that of the Monongahela and Mohawk, in part because of the
nature of the waterways. Because measurements run from the site to the center of the confluence
and the bodies of water in the Middle Fox Passage are wide, no sites until the late period were
less than 500 m from the stream confluence. This was the case even though almost all sites were
0%
10%
20%
30%
40%
50%
60%
Early Middle Late
Percen
t o
f P
erio
d S
ett
lem
en
ts
Period
Distance from Confluences:
Mohawk Settlements
Less than 500m
500m-1000m
Over 1000m

30
very close to the banks of the river or lake. As can be seen in Figure 9 below, there were no
settlements closer than 500 m until the late period, and most settlements fell between 500 m and
1000 me in all periods. A qualitative examination of site locations provides a clearer view of the
settlement pattern.
When examining the locations of the settlements on a map, it can be seen that of the two
middle period sites (A.D. 1680-1712), one was located on a stream confluence. Of the four late
period sites (A.D. 1712-1730), one was directly on a stream confluence, another overlooked a
stream confluence, and the third subsidiary settlement (East Meskwaki Village) was situated on a
point that provided a view of all traffic moving toward the confluence of the Upper Fox River
and Lake Winnebago. During both of these periods, the Meskwaki were very much in control of
trade and facing increasing hostility from the French and neighboring tribes. It would have been
to their advantage to be at these points to control the flow of people and goods through their
territory and to be able to take note of military threats. The Grand Village of the middle and late
periods was located in an open area overlooking the lake where the Wolf River, Lower Fox
River, and Lake Winnebago (through another short stretch of the Lower Fox River) came
together. In essence, the Grand Village could be considered to lie along the greatest confluence
of all in the Middle Fox Passage, providing a nearby safe-haven for strategically placed
subsidiary sites in times of conflict.

31
Figure 9. Distances of Meskwaki settlements from confluences by period.
Results for Settlements in the Landscape
Monongahela
Results for Monongahela settlements showed several interesting and unexpected trends. Similar
to previous studies, a greater proportion of Monongahela sites were located in upland locations
than lowland locations (see Figure 10). However, this sample of sites showed a closer spread
between upland and lowland sites than has been found in other studies.
0%
10%
20%
30%
40%
50%
60%
70%
80%
90%
100%
Early Middle Late
Percen
t o
f P
erio
d S
ett
lem
en
ts
Period
Distance from Confluence: Meskwaki
Less than 500m
500m-1000m
Over 1000m

32
Figure 10. Distribution of upland and lowland Monongahela sites.
In the early Monongahela period (A.D. 1050/1100-1250), 52% of the sites were in upland
locations and 48% were in lowland locations. Only 12% of the upland sites were hamlets.
Interestingly, there appear to not have been hamlets among sampled upland sites from the middle
and late Monongahela periods. Hamlets made up approximately one third of the lowland sites
for the early and middle periods, but only ten percent of the late lowland settlements. It is
possible that the decrease in the proportion of hamlets in the middle and late periods was related
to mounting pressure from enemies, specifically the Seneca. If settlements were less visible in
lowland areas, and consequently somewhat safer, it is not surprising that hamlets would be found
almost exclusively in lowland areas. The middle Monongahela period (A.D. 1250-1580), which
was a time of economic success, showed an increase of more than ten percent among upland
settlements. It is important to remember here that some of the best soils and growing conditions
were, counter-intuitively, located in upland areas. Late Monongahela settlements (A.D. 1580-
0%
10%
20%
30%
40%
50%
60%
70%
Early Middle Late
Percen
t o
f P
erio
d S
ites
Period
Monongahela Upland and Lowland
Sited by Period
Upland
Lowland

33
1635) took on the same proportion of upland and lowland sites observed in the early period. This
movement most likely is a response to late period Seneca aggressions. Given that the landscape
in the area is extremely hilly, that the Seneca were skilled at siege warfare, and that upland
settlements were generally located along large stream divides that were easy to follow, a
defensive settlement pattern that involves dispersal through the landscape would be a viable
response to such pressures.
Within upland and lowland settlements there were definite preferences with regards to
landforms. As can be seen in Figure 11, saddles and benches were chosen over all other features
in all three periods; however, knobs were also used 21% of the time during the middle period.
Figure 11. Distribution of Monongahela settlements among upland features.
0%
5%
10%
15%
20%
25%
30%
35%
40%
45%
50%
Bench Saddle Terrace Knob Other
Percen
t o
f P
erio
d S
ites
Upland Feature
Monongahela Upland Settlements
Early
Middle
Late

34
Mohawk
Early Mohawk settlements (A.D. 1525-1626) were often in upland locations, with only a quarter
of the sites lying in lowland settings. Of the upland settings, over half (63%) were located on
hills and 18% were on terraces. The only upland hamlet was located on a ridge.
In the middle period (A.D. 1626-1666), there was a shift toward more lowland areas as
settlements gradually moved closer to the Mohawk River, which was possibly due to the
increased security provided by Mohawk membership in the League of the Iroquois (Snow 2001).
The proportion of hamlets also increased during this period. Both hamlets and villages were
largely located on bluffs and hilltops, though settlements appear to have been spread through a
more diverse range of landscape features. Defensible locations would have been important
during this period since there was not only increased aggression from and against neighboring
tribes, but French attempts to weaken or drive out the Mohawk in 1666 and 1693 (Richter 1992,
Snow 1995a, 2001).
The late period (A.D. 1666-1776) had a far greater percentage of sites in lowland areas,
with lowland sites making up 68% of the period sites. This is almost a complete reversal of the
proportions of upland and lowland settlements in the early period. It is also notable that the
proportion of hamlets increased in each period, going from 7% of upland sites in the early period
to 18% of upland sites in the late period. This progression to more lowland areas is natural as the
sites were increasingly located in areas close to the Mohawk River (Snow 1995a, 2001). In
particular, sites often were situated on features overlooking the river. The dynamics we see in
village movements fit with known social trends associated with ever increasing exposure to and
reliance on Europeans, especially the British.

35
Meskwaki
Two of the Meskwaki settlements could be considered to be in upland positions. Both of these
settlements were Grand Villages, one of which dated from the early period (A.D. 1660-1680)
and the other from the middle (A.D. 1680-1712) and late (A.D. 1712-1776) periods. While the
land that the subsidiary settlements were located on may not have been low at the time, the areas
were not high points in the landscape either. Rather, each smaller settlement was located either
on a point or in some other position that commanded a view of traffic at key points along the
trade route. In consideration of the relative functions of these settlements, they are impeccably
placed within the area’s landscape. Grand Villages were not just large population centers with
economic and political importance. They were heavily fortified areas that offered protection to
the nearby Meskwaki settlements whenever an enemy threatened destruction. Positioning the
Grand Villages in upland areas made them more defensible. The Grand Village of the middle
and late periods would have been more visible and commanded a greater view of the area than
the early Grand Village, but this can be seen as a change in priorities. The early village was
occupied after the Meskwaki had been displaced from their homeland in Michigan by brutal
intertribal warfare, and it would not be surprising if concealment, defensibility, and the ability to
live in quiet recovery would have been valued over strong control of a new territory. In the
middle and late periods, however, the Meskwaki were capitalizing on an incredibly lucrative
business. Control of their territory and the ability to see new opportunities and new threats
would have been very important.

36
Smaller sites, which I call hamlets for the sake of comparison, have very different
functions. Never supporting large populations, these sites were in areas that allowed inhabitants
to survey the movements of goods and people through the territory and set up the plots along the
waterways on which they grew their food.
Results for Soil Productivity
Monongahela
The mean productivity for Monongahela sites from all periods, which I will be calling the
population mean, was 110.4 bushels of corn per acre in un-irrigated conditions. Between
periods, sites shift to more productive soils in the middle period before returning to less
productive areas in the late period (see Figure 12). Figure 13 shows that period shifts in average
fertility are very significant in the early period, with only a 1% chance that the differences seen
are a result of the vagaries of sampling. Differences between the middle and late periods are not
significant due to the large error ranges associated with the late period. This illustrates a
deliberate shift to upland areas of more fertile farmland during the Monongahela’s most
successful period. The large error ranges of the late period are related to the more dispersed,
defensive settlement pattern in the late period when Seneca attacks threatened the existence of
the society.

37
Early period (AD 1050/1100-1250) Monongahela sites had an average productivity of
108.1 bushels per acre of un-irrigated corn and most sites (68.1%) were between zero and three
standard deviations above the mean productivity for Monongahela sites from all periods
(population mean), which was 110.4 bushels per acre (Figure 12). Of these, 7.1% were between
two and three standard deviations above the mean, or in areas with extremely fertile soils. Most
sites below with below average soils were between zero and one standard deviations of the
population mean.
Figure 12. Monongahela soil fertility in deviations from population mean.
Sites from the middle period (AD 1250-1580) had an average productivity of
113.5bushels per acre. Sites were generally located on more fertile soils, with 82.6% between
zero and three standard deviations above the population mean. Of these, 80.4% were between
zero and two standard deviations above average. Like the early period, most sites with below
average soils were less than one standard deviation from the population mean. No sites were
0.0%
5.0%
10.0%
15.0%
20.0%
25.0%
30.0%
35.0%
40.0%
45.0%
50.0%
321-1-2-3
Percen
t o
f P
erio
d S
ites
Deviations from Population Mean (bu/acre)
Monongahela Soil Fertility
Early
Middle
Late

38
associated with soils more than two standard deviations below mean productivity. It is worth
noting that while sites were moving toward more fertile locations in the middle period, the
landscape analysis showed that sites were in more upland areas as well.
Late period sites (1580-1635) were not located on as fertile soils as middle period sites
had been. The average productivity of the period was 110.7bushels per acre. No sites were
associated with soils more than two standard deviations from the population mean. Forty percent
of late sites were between zero and one standard deviation above the mean and 26% were
between zero and one standard deviation below the mean.
Figure 13. Confidence intervals for Monongahela soil fertility for each period.
112
116
120
108
104
100Early
Monongahela
Middle
Monongahela
Late
Monongahela
96
Bu
shel
s p
er A
cre
80% = 108.1 3.5
95%=108.1 5.4
99%= 108.1 7.1
80% = 113.5 2.5
95%=113.5 3.9
99%= 113.5 5.2
80% = 110.7 4.3
95%=110.7 6.9
99%= 110.7 9.6
Confidence Intervals: Monongahela Mean Fertility in Bushels per Acre

39
Mohawk
The mean soil fertility rating for Mohawk sites from all periods (population mean) was 93.8
bushels per acre. Sites show a trend of moving toward more fertile soils in each subsequent
period (Figure 14). This can be seen both in deviations from the population mean and from
period means. Examination of these changes at 80%, 95%, and 99% levels of confidence
indicate that there is less than a 20% chance that the shift to more fertile soils in between the
early and middle period are the result of the vagaries of sampling and that the shift to more fertile
soils between the middle and late periods cannot necessarily be attributed to actual differences
(Figure 15). In other words, while sites are increasingly located on more fertile soils, these are
not dramatic shifts and, unlike the shift between the early and middle Monongahela periods,
cannot be said to necessarily reflect more conscious decisions to seek out more fertile farmland.
In fact, soils available for exploitation may be increasingly fertile because sites progressively
relocated to areas of lower relief that were closer to the Mohawk River.
Figure 14. Mohawk soil fertility in deviations from population mean.
0.0%
10.0%
20.0%
30.0%
40.0%
50.0%
60.0%
70.0%
80.0%
90.0%
321-1-2-3
Percen
t o
f P
erio
d S
ites
Deviations from Population Mean (bu/acre)
Mohawk Soil Fertility
Early
Middle
Late

40
Early Mohawk (A.D. 1525-1626) sites were associated with soils with a mean fertility
rating of 84.4 bushels per acre. Slightly more than half (53%) of sites were associated with soils
between zero and one standard deviations above the population mean, and no sites were
associated with soils more than one standard deviation above the mean population mean. Of the
46.7% of sites associated with below average soils, 13% were between zero and one standard
deviations below the population mean, 26.7% were between one and two standard deviations
below the population mean, and 6.7% were between two and three standard deviations below the
population mean. When graphically represented, we can see that sites are distributed bimodally
with many sites falling between the ranges of zero and one standard deviations above or one and
two standard deviations below the population mean.
Sites from the middle Mohawk period (1626-1666) had a mean fertility rating of 98.5
bushels per acre. Of the 72.3% of sites associated with above average soils, 66.7% were between
zero and one standard deviation above the population mean and 5.6% were associated with soils
between one and two standard deviations above the population mean. Of the 27.8% of sites
associated with below average soils, 22.2% were between zero and one standard deviation and
5.6 % were between one and two standard deviations of the population mean. No sites were more
than two standard deviations above or below the population mean.
Late Mohawk sites (1666-1776) had an average productivity of 102.5 bushels per acre.
Of late period sites, 86.7% were associated with above average productivity. Eighty percent
were within one standard deviation of the population mean, and 6.7% were between one and two
standard deviations of the mean. Of the 13.4% of late period sites associated with areas of below
average productivity, 6.7% were within one standard deviation of the population mean and 6.7%
were between two and three standard deviations of the population mean.

41
Figure 15. Confidence intervals for Mohawk soil fertility.
Meskwaki
Meskwaki sites had a population mean productivity of 89.1 bushels per acre. Sites were
increasingly associated with more productive soils in each period (Figure 16), though these
increases may have limited significance. Figure 17 shows that the period means are very similar,
particularly among middle (A.D. 1680-1712) and late (A.D. 1712-1730) period sites and that it is
not possible at confidence levels of 80%, 95%, or 99% to be sure that any of the shifts to more
fertile soils between any of the periods are not merely reflections of the vagaries of sampling. As
will be discussed later, the trend of moving toward more productive soils is most likely distorted
by erosion at the early village site (Jeffrey Behm, personal communication 2012), inundation of
soils that were most likely used during the time, and the small sample available. No patterning is
98
106
90
82
74
Early Mohawk
Middle
MohawkLate Mohawk
66
Bu
shel
s p
er A
cre
80% =86.1 7.3
95%= 86.1 11.4
99%= 86.1 15.5
80% =94.2 5.8
95%= 94.2 9.1
99%=94.2 12.3
80% =96.1 7.1
95%=96.1 11.2
99%= 96.1 15.1
Confidence Intervals: Mohawk Mean Fertility in Bushels per Acre
114
42
evident when comparing soil fertility associated with hamlets to the fertility of soils associated
with villages. This is in part because of the Meskwaki practice of farming on riverbanks
(Callender 1978:637), which means that most fields, regardless of settlement location, would
have been taking advantage of fertile river deposits.
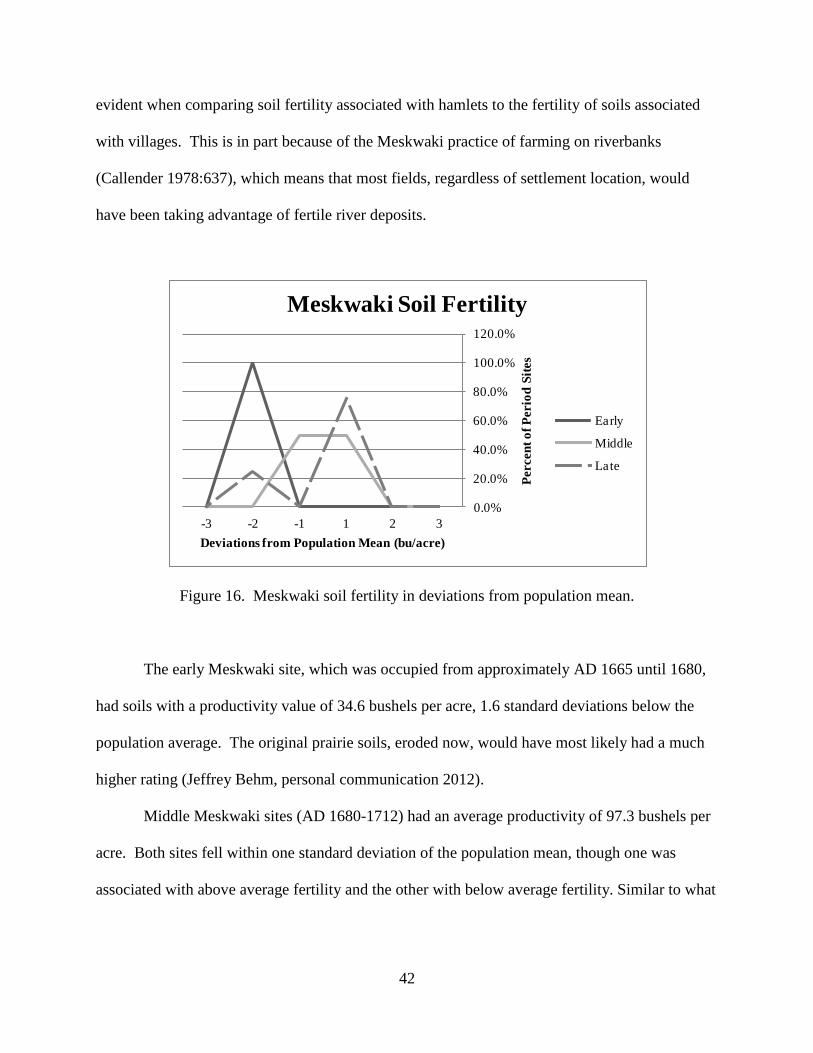
Figure 16. Meskwaki soil fertility in deviations from population mean.
The early Meskwaki site, which was occupied from approximately AD 1665 until 1680,
had soils with a productivity value of 34.6 bushels per acre, 1.6 standard deviations below the
population average. The original prairie soils, eroded now, would have most likely had a much
higher rating (Jeffrey Behm, personal communication 2012).
Middle Meskwaki sites (AD 1680-1712) had an average productivity of 97.3 bushels per
acre. Both sites fell within one standard deviation of the population mean, though one was
associated with above average fertility and the other with below average fertility. Similar to what
0.0%
20.0%
40.0%
60.0%
80.0%
100.0%
120.0%
321-1-2-3P
ercen
t o
f P
erio
d S
ites
Deviations from Population Mean (bu/acre)
Meskwaki Soil Fertility
Early
Middle
Late

43
can be seen with the results of other sites, a below average rating could be related to the
inundation or alteration of soils actually utilized historically.
The four late period sites (AD 1712-1730) had an average productivity of 95.2 bushels
per acre. Seventy-five percent of sites were associated with above average soils, and all of these
sites were within one standard deviation of the population mean. The site associated with below
average soils was 1.1 standard deviations below the population mean. This value is probably not
accurate since the West Village is currently inundated and the nearest associable soils are mucks.
It is likely that the soils being exploited during the time would have been fertile river deposits
rather than poorly drained mucks.
Figure 17. Confidence intervals for Meskwaki soil fertility for each period.
110
150
90
70
50
Early
Meskwaki
Middle
Meskwaki
Late Meskwaki
30
Bu
shel
s p
er A
cre
80% = 85.5 16.2
95%= 85.5 26.2
99%= 85.5 37.3
80% = 91.7 13.4
95%= 91.7 21.6
99%= 91.7 30.4
80% = 91.9 12.3
95%= 91.9 19.7
99%= 91.9 27.5
Confidence Intervals: Meskwaki Mean Fertility in Bushels per Acre
130

44
SUMMARY AND CONCLUSIONS
Each society in this study experienced common social trends at a different point in their careers
as middlemen. Consequently, comparisons between groups must reflect social trends rather than
simple temporal units. From this point forward I will be examining how shifts in settlement
patterns can be interpreted in the light of noted social, economic, and martial trends. Since the
Monongahela and Meskwaki were driven from their territories as a result of these conflicts,
settlement changes after periods of major conflict will not be considered. For the Monongahela
and Meskwaki, the middle periods will represent the period prior to major conflict and the late
periods will represent the time of conflict. Among the Mohawk, the period of conflict will be the
middle period, with the early period representing the time before major conflict.
Between the early (A.D. 1050/1100- A.D. 1250) and middle (A.D. 1250- A.D. 1580)
periods, there is a shift of 13% in Monongahela settlements from locations within 500 m of the
nearest confluence to locations between 500 m and 1000 m of the nearest confluence.
Simultaneously there was a 9% increase in the proportion of upland settlements and an increase
in the average soil fertility of 5.4 bushels per acre. While a shift toward the uplands and away
from stream confluences may be interpreted as defensive positioning, I find it more likely that
this data supports the hypothesis that these areas were inhabited for their fertility. For this there
are several reasons. The first is that confluence analyses are of weak importance in upland
locations since streams starting in the uplands tend to be narrow and shallow. Consequently,
these streams would have been more important as sources of fresh water than as methods of
transportation or territorial control. A second reason lies with the nature of the upland
settlements. The most commonly settled upland features from all periods were saddles, or the
areas of land between two peaks or high points. These features often follow large drainage

45
divides, making them some of the highest areas in the region. It also would not have been
terribly difficult for travelers to go between upland settlements by simply following these stream
divides. It is likely that the contraction of the territory and movement toward more fertile and
upland locales is a reflection of economic success and the ability to choose to live in the most
productive areas (Anderson and Simon 2009, Johnson and Athens 1989, Johnson 2001).
In the late period (A.D. 1580- A.D. 1635), there was an 18% increase in the proportion of
settlements within 500m of the nearest stream confluence and, unlike earlier periods, a marked
decrease of 7% in the proportion of sites over 1000 m from the nearest confluence. Sites also
show a 9% shift toward lowland areas and a decrease of 2.8 bushels per acre in the average
productivity of associated soils. This period also had a marked decrease in the proportion of
hamlets represented. While hamlets had made up 38% of sites in the early period and 21% of
sites in the middle period, less than 5% of sites in the late period were hamlets .During this time,
the Monongahela were facing increasing hostility from the Seneca, who were notably skilled in
the art of siege warfare (Johnson 2001). Dispersal through upland and lowland areas, the
consequent utilization of more marginal soils, and the decrease in hamlet sites may reflect a
defensive strategy against Seneca raiding which involved locating settlements in ways that made
them more difficult to locate and easier to flee. This is further supported by the late period
abandonment of the use of palisades around villages (Richardson, Anderson, and Cook 2002).
Living together in villages rather than in hamlets may have provided some measure of security
and solidarity by reducing the number of easy targets for marauding Seneca war parties. The
increased proportion of lowland sites may make the increased proximity to stream confluences
more significant; however, it is impossible to make a sound conclusion in this respect without
first examining the nature of these stream confluences and their accessibility from the sites. If

46
these stream confluences are large enough for travel and allow some ease of access, the increased
proximity to confluences in the late period could be interpreted as a settlement feature that would
have allowed an increased capacity to flee quickly. Increased proximity to navigable
confluences would have also had implications for movement throughout the territory and perhaps
an increased awareness of the movements of trade goods and enemies through Monongahela
lands.
The Mohawk and Meskwaki showed very different trends in their settlement patterns
when compared to the Monongahela. This can, in part be attributed to the nature of their
enemies and the ways in which they became middlemen. Both groups actively sought the
middleman role and aggressively maintained it. Both groups also had long-term exposure to
Europeans, changing both the way they conducted warfare and their access to technology. In
contrast to the Monongahela response to conflict, the Mohawk and Meskwaki appear to have
taken on a defensive strategy that involves fighting off foes rather than fleeing them.
As the Mohawk established themselves as middlemen during their middle period (A.D.
1626- A.D. 1666), there was a 14% shift toward more lowland locations, an 18.1% shift toward
areas between 500 m and 1000 m of stream confluences (17.4% of which was constituted by a
shift away from areas within 500 m of the nearest confluence), and an increase in the average
period soil fertility of 8.4 bushels per acre for un-irrigated corn. This was an incredibly
tumultuous period, fraught with epidemics, an intensification of inter-tribal warfare, and
constant, delicate shifts in loyalty between the Dutch, French, and English (Hunt 1940, Richter
1992, Snow 1995a, 2001). One thing was for certain: the Mohawk were increasing their
exposure to European powers through trade and political maneuvering, in the process moving
increasingly to areas that overlooked the Mohawk River. Another factor that may have made

47
such a move feasible from a defensive standpoint would have been the protection offered by the
League of the Iroquois (Snow 2001). This movement would have allowed access to more fertile
soils (river deposits), trails to Fort Orange, and greater surveillance of their territory. Lowland
locations in the middle period refer mainly to sites that are still on landscape features that are
above the floodplain, and could in some ways be considered “upland,” but are not among the
highest landforms in the area. As was the case with the Monongahela, the general trend of sites
locating in areas slightly farther from stream confluences may reflect a defensive strategy to
make settlements less accessible to marauding enemy raiders or simply be the result of suitable
areas for settlement simply not being as close to stream confluences. A better understanding of
this will have to be addressed in other studies.
In the late period (A.D. 1666-A.D. 1776), Mohawk sites continued to move toward the
Mohawk River (Snow 1995a, 2001), with 69% of lowland sites located on the floodplain. There
was a 29% increase in the number of lowland sites in the late period, an 8.5% increase in the
proportion of sites within 500 m of the nearest confluence, and a 1.2 bushel per acre increase in
period average productivity for un-irrigated corn. Average soil productivity most likely saw a
minimal change in part because middle period sites were already often in positions that allowed
inhabitants to easily take advantage of the rich soils of the river flats. The late period was a time
of great culture change for the Mohawk. Families were fragmented by waves of Christians
leaving for the haven of French Canada and recurring epidemics. The once strong longhouse
tradition evolved into one increasingly characterized by smaller, more nucleated families,
European style cabins, and farmsteads (Richter1992, Snow 1995a, 2001). This is reflected in the
data not only by the large shift in settlements to the floodplain, but by an increase in the
proportion of hamlets of 5% from the early to middle period and an additional 4% from the

48
middle to late period. In all, hamlets made up 15% of all late Mohawk sites. Defense for the
Mohawk in the middle and late periods would have involved taking shelter within heavily
fortified castles (Grand Villages) or, in the late period, Fort Hunter, which was built for their
protection by British allies.
Meskwaki settlement patterns and can be interpreted qualitatively since the small number
of sites and wide nature of the water bodies skew numeric analyses to the point of making
anything but broad observations impossible. Like the Mohawk, the Meskwaki move closer to
the main river in the region as they establish themselves as successful middlemen and increase
the proportion of hamlets through time. What is unique about the Meskwaki is that the
relocation to the Middle Fox Passage was a deliberate move to establish themselves as
middlemen in the lucrative fur trade. All known sites are positioned in very strategic locations.
Both Grand Villages were located on high points and were heavily fortified. The Grand Village
of the middle (A.D. 1680-A.D. 1712) and late (A.D. 1712-1730) periods (the Bell Site) was on a
hill overlooking Lake Butte des Morts, which housed the confluence of three important bodies of
water along the riverine trade route: the Fox River segment connecting to Lake Winnebago and
the route to Green Bay, the Wolf River, which winds north, and the Lower Fox River, which
flows south to a portage with the Wisconsin River on the route to the Mississippi River. The sites
designated as hamlets would have been exceedingly effective for controlling traffic. The hamlet
from the middle period was located at the confluence of the Upper Fox River and Lake
Winnebago, meaning any furs going east to Green Bay and France would have passed that point.
Late period hamlet sites clearly reflected concerns for control of the trade corridor and
awareness of those passing through it. The East Meskwaki Village would have overlooked Lake
Winnebago. Any traders or military forces moving toward the other settlements along Lake

49
Butte des Morts would have been seen approaching from far away. The site known as Fort ou
Les Renards was located on a point that overlooked the connection of the waters of Lake
Winnebago and Lake Butte des Morts. The location would have not only been an excellent
check point for trade, but also an excellent post for monitoring threats since it had a clear view of
the waterway and was close to the Grand Village. The final hamlet site, the West Meskwaki
Village, was located on the confluence of the Lower Fox River and Wolf River as they met at
Lake Butte des Morts. While each of these sites would have been instrumental in controlling
trade and providing warnings in times of conflict, particularly in the context of the two Fox Wars
and ultimate French attempt to exterminate the Meskwaki in the late period, they were also in
locations that were close enough to the Grand Village to seek shelter within the fortifications
quickly. In this way, like the Mohawk, the Meskwaki defensive pattern of choice involved
fighting enemies from fortifications rather than fleeing.
In conclusion, this study sought to understand two basic points: how individual
middleman societies adjust their settlement patterns over time, and whether different middleman
societies might react in similar or different ways to economic success and enemy aggression.
The information at hand has both provided insights and important questions. It is apparent from
the results that each society did respond both to periods of success and to periods of conflict
through their settlement patterns. As expected, groups appeared to have tried to maximize access
to fertile soils, defensive locations, and areas that allowed control of their territories. Equally
apparent, however, are the differences in how each group chose to maximize and choose between
these factors based on the nature of their threats, landscapes, and successes.
This thesis took a broad look at how middlemen maximized their resources, both in trade
and subsistence, and mitigated their risks in the context of their unique circumstances and

50
landscapes. There is ample room for additional research in many areas of which I have simply
scratched the surface. When formulating my research design, I chose to measure factors more
closely aligned with riverine trade than overland trade. In the cases of the Mohawk and
Monongahela, an important topic of study would be how sites correlate with overland trade
routes.
Another worthwhile avenue would involve a more in-depth analysis of any of the factors
I chose to study. Understanding the nature of confluences and how sites lie in relation to them
within the landscape could provide useful insights into the extent to which these features could
have been of use for travel or control of territories. The same can be said of the soils and
landscape analyses. Specifically, this could be done with more detailed and, admittedly, accurate,
measurements using GIS programs.
Finally, the Meskwaki offer an amazing opportunity for future study. At the moment, it
is not unreasonable to consider our knowledge of Meskwaki settlements as the equivalent of only
knowing the locations of Mohawk castles in a given period. It may be possible to learn more
about their presence in Wisconsin by studying their elusive roots in Michigan.

51
APPENDIX A
Raw Data Tables for Monongahela Sites
Table A1. Early Monongahela raw data.
Site Name Period Type Upland/Lowland Site Setting Distance to Nearest Confluence (m) Deviations from Population Mean
Previously Logan's Ferry Early Village Low Land Terrace_Holocene 752.396 1.94
Drew Site Early Village Low Land Terrace_Wisconsinan 356.546 9999
Early Hamlet Low Land Terrace_Wisconsinan 441.418 9999
Railroad Early Village Low Land Terrace_Holocene 320.663 0.74
Voegtly Cemetery Early Hamlet Low Land Terrace_Wisconsinan 1081.35 9999
Murphys Old House Early Village Low Land Terrace 346.302 1.94
Lower Field Early Village Low Land Terrace_Holocene 234.787 1.94
Industry Early Hamlet Low Land Terrace_Holocene 256.32 1.94
Georgetown Early Village Low Land Terrace_Holocene 300 1.94
Hocking Knob Early Village Upland Bench 615.731 1.64
Fuller's Hill* Early Village Upland Saddle 546.008 0.74
Phillips Early Village Upland Saddle 1090.78 -1.04
Campbell Farm* Early Village Upland Knob 1008.13 1.64
Stewart Farm Site Early Village Upland Saddle 726.997 -1.34
Sutor Early Village Upland Saddle 841.338 -2.54
Arnold Knob Early Hamlet Upland Knob 1286.33 0.74
Beeson Farm Early Village Upland Saddle 588.069 1.64
Outcrop/Morgan Early Village Upland Bench 1577.85 9999
Walters Early Village Low Land Terrace_Illinoian 94.8683 1.64
Albany Hill Early Village Upland Bench 706.435 -1.04
Otvos Garden Early Hamlet Upland Bench 725.758 0.74
Thomas Early Village Upland Bench 295.466 -0.14
Grays Landing 2 Early Hamlet Low Land Terrace_Holocene 445.982 9999
Varner/John Lapping* Early Village Upland Saddle 735.612 0.74
Horn-Stephens-Giles Farms* Early Village Low Land Other 717.025 9999
Bruckner Farm* Early Village Upland Saddle 949.868 0.74
Harold Fisher Early Village Low Land Terrace_Holocene 195 -0.14
Noah Hartley 1* Early Village Upland Bench 1273.5 1.64
EARLY MONONGAHELA

52
Table A1. Early Monongahela raw data continued
Site Name Period Type Upland/Lowland Site Setting Distance to Nearest Confluence (m) Deviations from Population Mean
Noah Hartley 2/Arthur Biddle Early Village Upland Saddle 1078.02 -0.14
Buckeye Early Village Upland
Bench and
Terrace_Illinoian 492.037 1.04
State Line* Early Village Low Land Terrace_Holocene 189.737 -0.14
Gensler Early Village Low Land Terrace_Holocene 261.964 2.24
Crow Farm Early Village Low Land Terrace_Holocene 391.152 2.24
Atkinson Early Hamlet Low Land Terrace_Holocene 342.381 2.24
Vesta Bottoms Site Early Village Low Land Terrace_Holocene 303.727 9999
Moore Farm, Arawanna
Delaware Village Early Village Low Land Terrace_Holocene 246.018 0.74
Boyles Site Early Village Upland Saddle 574.913 -2.24
Indian Ridge/Old Delaware
Camp Early Village Upland
Bench and
Terrace_Illinioan 441.163 0.74
Woodwiff Farm Early Hamlet Upland Other-Spine 555 -2.24
Speers* Early Village Low Land Terrace_Holocene 390 9999
Vesta Mine Site* Early Village Low Land Terrace_Holocene 530.754 9999
Greenlee Early Village Upland Bench 442.945 0.74
Felix Early Village Upland Saddle 992.837 -0.44
Wylie Site #1 Early Village Upland
Other-Low Slope to
Bench 467.172 -0.14
Wylie Site #7 Early Village Upland
Other-Low Slope to
Bench 706.435 0.74
Wylie Site #8 Early Village Upland Knob 471.01 -0.14
Early Village Low Land Terrace_Wisconsinan 349.857 1.04
Weaver Village Early Village Low Land Terrace_Wisconsinan 429.535 -0.14
Ashmore #2 Early Village Upland Saddle 640.8 0.74
Kiger #1* Early Hamlet Low Land Terrace_Illinoian 411.886 0.74
Kiger Pond Early Hamlet Low Land Terrace_Illinoian 437.321 -1.04
Hostoffer-Summy Early Village Upland Saddle 1279.14 0.74
Ryan Early Village Upland Saddle 1173.46 1.64
Thomas Hurst #1 Early Village Upland Saddle 1299.12 1.64
Ryan #2 Early Village Upland Bench 919.416 0.74
Denmark Manor #2 Early Village Upland Bench 825.545 1.64
Meyers Early Village Upland Bench 615 -1.34
Gary Balog #1 Early Hamlet Low Land Terrace_Wisconsinan 632.851 1.64
Free #4 Early Hamlet Upland Bench 1034.13 0.74
Conrath #1 Early Hamlet Low Land Terrace_Holocene 258.07 -0.14
EARLY MONONGAHELA
Note: re-occupied sites indicated with *

53
Table A2. Middle Monongahela Raw Data
Site Name Period Type Upland/Lowland Site Setting Distance to Nearest Confluence (m) Deviations from Population Mean
Large Site Middle Village Upland Knob 201.246 0.74
Bunola Middle Village Low Land Terrace_Holocene 279.016 0.74
Fisher Pa. Indian
Research 74 Middle Village Upland Knob 603.738 1.64
McJunkin Herron Farms Middle Village Low Land Terrace_Holocene 785.318 1.64
Woodville Middle Hamlet Low Land Terrace_Wisconsinan 309.233 0.74
Old Fort Field Middle Village Upland Saddle 978.225 0.74
Godwin-Portman
(Boyce Station) Middle Village Low Land Terrace_Wisconsinan 106.066 1.94
Jos A Portman Middle Hamlet Low Land Terrace_Wisconsinan 261.964 -1.04
Born Middle Village Low Land Terrace_Wisconsinan 600.75 -0.14
Howell Farm Middle Village Upland Saddle 626.418 0.74
Helmstader Middle Village Upland Knob 1250.32 1.64
Middle Village Low Land Terrace_Holocene 551.543 0.74
Rochester* Middle Village Low Land Terrace_Wisconsinan 558.032 9999
Baum Middle Village Upland Saddle 713.092 0.74
Hillary Armory Middle Village Upland Saddle 850.779 0.74
Fort Hill/Old Redstone
Fort Middle Village Upland Knob 834.086 1.64
Newell Junction Middle Village Low Land Terrace_Holocene 976.844 0.74
Francis Middle Village Upland Bench 852.364 1.64
Fuller's Hill* Middle Village Upland Saddle 546.008 0.74
Ghrist-Crawford Middle Village Upland Saddle 869.612 -1.34
Campbell Farm* Middle Village Upland Knob 1008.13 1.64
Old Stephens
Farm/Novak Middle Village Upland Saddle 649.346 1.64
Brown Farm Middle Village Upland Bench 1320.09 0.74
Howarth-Nelson/Old
Hill* Middle Village Upland Saddle 612.066 1.64
Deffenbaugh Middle Village Upland Saddle 1233.29 0.74
Redstone Old Fort Middle Village Upland Bench and Terrace_Illinoian 297.741 1.04
Naomi Middle Village Upland Bench and Terrace_Illinoian 574.326 1.64
New Geneva 2/MST-1 Middle Village Upland Saddle 935.909 1.64
Grays Landing 7 Middle Hamlet Low Land Terrace_Holocene 465.967 2.24
State Line* Middle Village Low Land Terrace_Holocene 189.737 -0.14
Johnston Middle Village Low Land Terrace_Holocene 150.748 -0.14
Scarem & Foder Farm Middle Village Low Land Terrace_Illinoian 455.467 -0.14
Speers* Middle Village Low Land Terrace_Holocene 390 9999
Denniston Middle Village Upland Knob 906.601 1.64
Morganza Village Middle Village Upland Knob 1140.39 0.74
Naylor Middle Village Upland Bench 882.454 1.64
MIDDLE MONONGAHELA
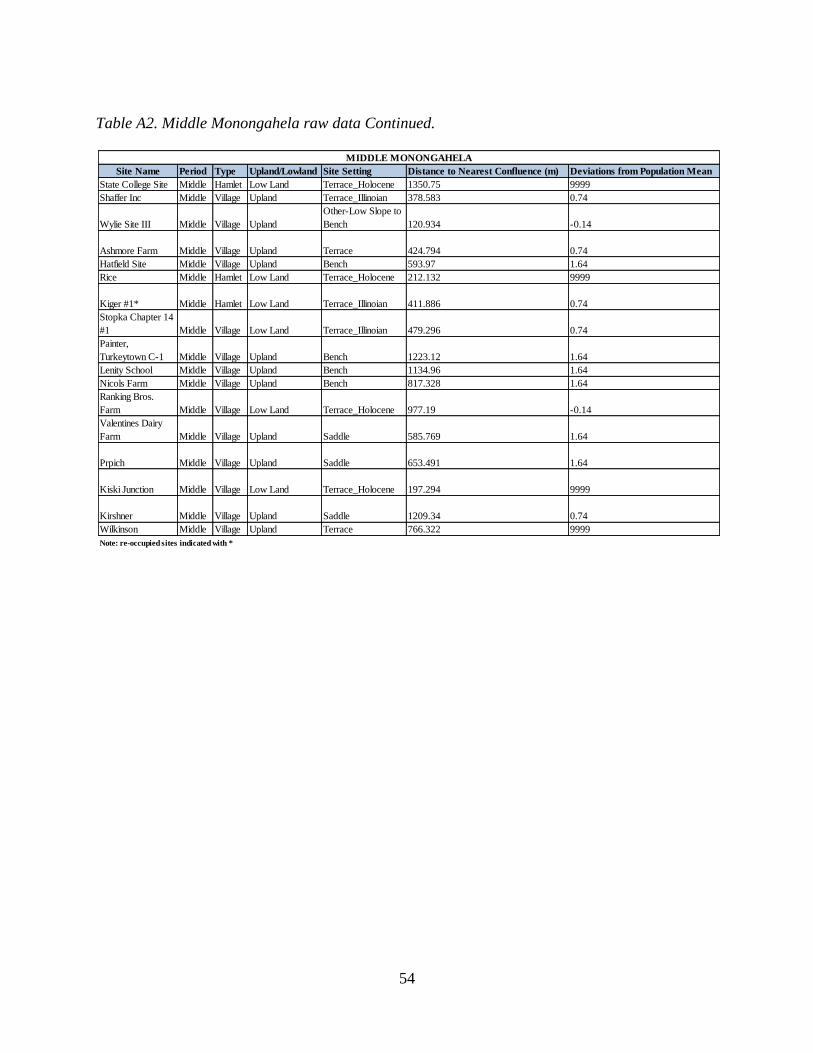
54
Table A2. Middle Monongahela raw data Continued.
Site Name Period Type Upland/Lowland Site Setting Distance to Nearest Confluence (m) Deviations from Population Mean
State College Site Middle Hamlet Low Land Terrace_Holocene 1350.75 9999
Shaffer Inc Middle Village Upland Terrace_Illinoian 378.583 0.74
Wylie Site III Middle Village Upland
Other-Low Slope to
Bench 120.934 -0.14
Ashmore Farm Middle Village Upland Terrace 424.794 0.74
Hatfield Site Middle Village Upland Bench 593.97 1.64
Rice Middle Hamlet Low Land Terrace_Holocene 212.132 9999
Kiger #1* Middle Hamlet Low Land Terrace_Illinoian 411.886 0.74
Stopka Chapter 14
#1 Middle Village Low Land Terrace_Illinoian 479.296 0.74
Painter,
Turkeytown C-1 Middle Village Upland Bench 1223.12 1.64
Lenity School Middle Village Upland Bench 1134.96 1.64
Nicols Farm Middle Village Upland Bench 817.328 1.64
Ranking Bros.
Farm Middle Village Low Land Terrace_Holocene 977.19 -0.14
Valentines Dairy
Farm Middle Village Upland Saddle 585.769 1.64
Prpich Middle Village Upland Saddle 653.491 1.64
Kiski Junction Middle Village Low Land Terrace_Holocene 197.294 9999
Kirshner Middle Village Upland Saddle 1209.34 0.74
Wilkinson Middle Village Upland Terrace 766.322 9999
MIDDLE MONONGAHELA
Note: re-occupied sites indicated with *

55
Table A3. Late Monongahela raw data.
Site Name Period Type Upland/Lowland Site Setting Distance to Nearest Confluence (m) Deviations from Population Mean
Rochester* Late Village Low Land Terrace_Wisconsinan 558.032 9999
Howarth-Nelson/Old Hill* Late Village Upland Saddle 612.066 1.64
Varner/John Lapping* Late Village Upland Saddle 735.612 0.74
Jesse Lapping/Reisiminger Late Village Upland Saddle 432.926 -0.44
Horn-Stephens-Giles Farms* Late Village Low Land Other 717.025 9999
Ingraham Farm Late Village Low Land Terrace_Holocene 117.154 -0.14
Bruckner Farm* Late Village Upland Saddle 949.868 0.74
White(Smith) Late Village Upland Saddle 658.977 1.64
Noah Hartley 1* Late Village Upland Bench 1273.5 1.64
Delphene Late Village Upland Bench 350.179 9999
Foley Farm Late Village Low Land Terrace_Holocene 182.483 -0.14
Brave Late Village Low Land Terrace_Holocene 165.68 9999
Cliff Heath Late Village Low Land Terrace_Holocene 117.154 0.74
Throckmorton 1 Late Village Low Land Terrace_Holocene 87.4643 0.74
Sugar Camp Village Late Village Upland
Bench and
Terrace_Illinoian 268.328 0.74
Vesta Mine Site* Late Village Low Land Terrace_Holocene 530.754 9999
Fisher #Beazels Late Village Low Land Terrace_Illinoian 295.466 9999
Moore Farm Late Hamlet Low Land Terrace_Illinoian 256.759 1.64
Household Site Late Village Upland
Bench &
Terrace_Illinoian 424.264 1.64
Piersols Late Village Upland Knob 754.337 0.74
Sony Late Village Upland Terrace 1500 -0.14
LATE MONONGAHELA
Note: re-occupied sites indicated with *

56
APPENDIX B
Raw Data Tables for Mohawk Sites
Table B1. Early Mohawk raw data
Site Name Period Start End Type Upland/Lowland Site Setting Distance in meters Deviations from Population Mean
Coleman-Van Duesen Early 1614 1626 Village Upland Hill 999 0.75
Wagner's Hollow Early 1614 1626 Village Upland Terrace 216 0.61
Failing Early 1614 1635 Village Lowland Hill 238 0.48
Briggs Run Early 1614 1626 Village Lowland Spur 108 0.46
Martin Early 1614 1626 Village Lowland Terrace 455 0.39
Rice's Woods Early 1580 1614 Village Upland Ridge 564 0.32
England's Woods #1 Early 1580 1614 Village Upland Hill 596 0.30
Chapin Early 1580 1614 Village Upland Spur 400 0.06
Barker Early 1580 1614 Village Upland Terrace 1380 -0.04
Smith-Pagerie Early 1560 1580 Village Upland Hill 717 -0.39
Klock Early 1545 1560 Village Upland Hill 467 -1.54
Garoga Early 1525 1545 Village Upland Hill 794 -1.56
Cayadutta Early 1525 1580 Village Upland Hill 677 -1.68
Ganada #2 Early 1525 1580 Village Upland Hill 480 -1.74
Dewandalaer Early 1525 1580 Hamlet Upland Ridge 304 -2.42
154A-7-1 Early 1525 1580 Village Lowland Riverflat 231 N/A
EARLY MOHAWK
Note: re-occupied sites indicated with *

57
Table B2. Middle Mohawk raw data.
Table B3. Late Mohawk raw data.
Site Name Period Start End Type Upland/Lowland Site Setting Distance in meters Deviations from Population Mean
Fisk Middle 1645 1666 Hamlet Upland Hill 889 1.48
Printup Middle 1645 1666 Village Upland Bluff 1390 0.08
Allen* Middle 1645 1666 Village Upland Spur 706 0.71
Janie Middle 1645 1666 Hamlet Upland Bluff 61 0.61
Freeman Middle 1645 1666 Village Lowland Hill 719 0.55
Horatio Nellis Middle 1645 1666 Village Upland Bluff 649 0.51
Mitchell Middle 1645 1666 Village Upland Bluff 384 0.48
Oak Hill #1 Middle 1635 1645 Village Upland Hill 857 0.36
Crouse Middle 1635 1645 Village Lowland Terrace 270 0.36
Van Evera-McKinney Middle 1635 1645 Village Upland Bluff 807 0.33
Bauder Middle 1635 1645 Village Upland Spur 217 0.33
Prospect Hill* Middle 1635 1645 Village Lowland Hill 588 0.32
Rumrill-Naylor Middle 1635 1645 Village Upland Terrace 406 0.25
Sand Hill #1 Middle 1635 1645 Village Lowland Hill 565 -0.11
Cromwell #1 Middle 1626 1635 Village Lowland Hill 606 -0.70
Yates Middle 1626 1635 Village Lowland Hill 385 -0.71
Cromwell #2 Middle 1626 1635 Village Lowland Hill 252 -0.81
Brown Middle 1626 1635 Village Upland Hill 744 -1.18
MIDDLE MOHAWK
Note: re-occupied sites indicated with *
Site Name Period Start End Type Upland/Lowland Site Setting Distance in meters Deviations from Population Mean
Ganada #1 Late 1755 1776 Hamlet Lowland Hill 543 0.97
Indian Castle Late 1753 1776 Village Lowland Riverflat 176 0.16
Fort Hendrick Late 1753 1776 Village Lowland Riverflat 107 0.84
Mud BRidge Late 1747 1776 Village Lowland Riverflat 294 0.71
Fort Hunter Late 1710 1776 Village Lowland Riverflat 811 N/A
Prospect Hill* Late 1693 1753 Village Lowland Hill 591 0.83
Dekanohage Late 1693 1753 Village Lowland Riverflat 124 1.12
Milton Smith Late 1693 1710 Village Upland Hill 200 -2.55
Allen* Late 1693 1710 Village Upland Spur 706 0.32
Gravel Ridge Late 1693 1776 Village Lowland Riverflat 925 N/A
Bushy Hill Late 1693 1710 Hamlet Upland Bluff 572 N/A
Auriesville #1 Late 1693 1710 Village Lowland Hill 682 0.41
Tehondaloga Late 1693 1710 Hamlet Lowland Riverflat 387 N/A
Lipe #2 Late 1689 1693 Village Lowland Hill 747 -0.05
Caughnawaga Late 1679 1693 Village Upland Hill 315 0.94
Fox Farm Late 1666 1679 Village Upland Bluff 1290 0.51
Schenck Late 1666 1679 Village Lowland Riverflat 359 0.63
White Orchard Late 1666 1689 Village Upland Bluff 324 0.47
Jackson-Everson Late 1657 1679 Village Lowland Hill 533 0.23
LATE MOHAWK
Note: re-occupied sites indicated with *

58
APPENDIX C
Meskwaki Raw Data Table
Table C1. Meskwaki raw data from all periods.
Site Name Period Type Upland/LowlandSite Setting Distance to Nearest Confluence Deviations from Population Mean
Markman Site Early Village Upland Embankment 500-1000m -1.6
Mahler Site Middle Hamlet Lowland Confluence Less than 500m -0.04
Bell Site* Middle Village Upland Hill Over 1000m 0.52
West Village Late Hamlet Lowland Confluence Less than 500m -1.13
East Village Late Hamlet Lowland Point 500-1000m 0.61
Fort Ou Les Renards Late Hamlet Lowland Point 500-1000m 0.71
Bell Site* Late Village Upland Hill Over 1000m 0.52
MESKWAKI
Note: re-occupied sites indicated with *
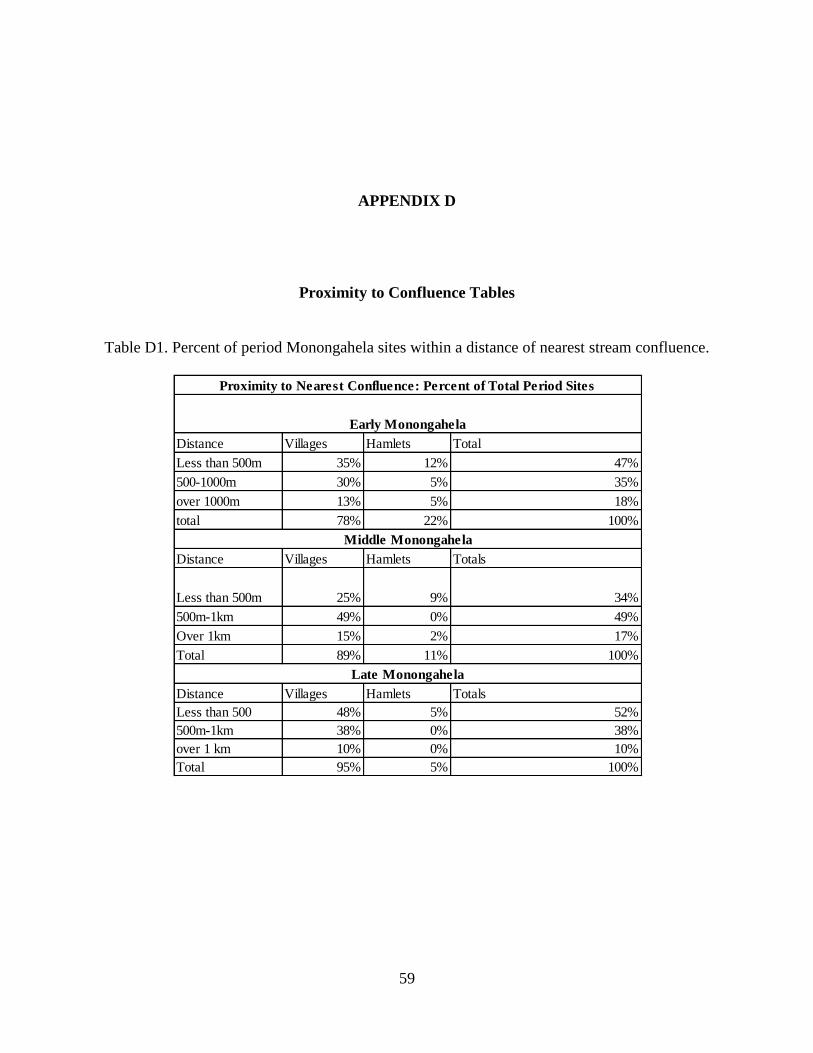
59
APPENDIX D
Proximity to Confluence Tables
Table D1. Percent of period Monongahela sites within a distance of nearest stream confluence.
Distance Villages Hamlets Total
Less than 500m 35% 12% 47%
500-1000m 30% 5% 35%
over 1000m 13% 5% 18%
total 78% 22% 100%
Distance Villages Hamlets Totals
Less than 500m 25% 9% 34%
500m-1km 49% 0% 49%
Over 1km 15% 2% 17%
Total 89% 11% 100%
Distance Villages Hamlets Totals
Less than 500 48% 5% 52%
500m-1km 38% 0% 38%
over 1 km 10% 0% 10%
Total 95% 5% 100%
Early Monongahela
Middle Monongahela
Late Monongahela
Proximity to Nearest Confluence: Percent of Total Period Sites

60
Table D2. Percent of period Mohawk sites within distance division of nearest stream confluence.
Distance Village Hamlet Total
Less than 500m 50.0% 100.0% 56.3%
500-1000m 37.5% 0.0% 37.5%
Over 1000m 6.3% 0.0% 6.3%
Total 93.8% 6.3% 100.0%
Distance Villages Hamlets Total
Less than 500m 33.3% 5.6% 38.9%
500-1000m 50.0% 5.6% 55.6%
Over 100m 5.6% 0.0% 5.6%
Total 88.9% 11.1% 100%
Distance Villages Hamlets Total
Less than 500m 42.1% 5.3% 47.4%
500-1000m 36.8% 10.5% 47.4%
Over 1000m 5.3% 0.0% 5.3%
Total 84.2% 15.8% 100.0%
Early Mohwak
Middle Mohawk
Late Mohawk
Proximity to Nearest Confluence: Percent of Total Period Sites

61
APPENDIX E
Landscape Features Tables
Table E1. Monongahela landscape features in percents of period upland and lowland sites.
Landform Village Hamlet Total Landform Village Hamlet Total Landform Village Hamlet Total
Bench 33.3% 6.1% 39.4% Bench 27.3% 0% 27.3% Bench 36.4% 0% 36.4%
Saddle 42.4% 0.0% 42.4% Saddle 39.4% 0% 39.4% Saddle 45.5% 0% 45.5%
Terrace 0.0% 0.0% 0.0% Terrace 9.1% 0% 9.1% Terrace 9.1% 0% 9.1%
Knob 6.1% 3.0% 9.1% Knob 21.2% 0% 21.2% Knob 9.1% 0% 9.1%
Other 6.1% 3.0% 9.1% Other 3.0% 0% 3.0% Other 0.0% 0% 0.0%
Total 87.9% 12.1% 100.0% Total 100.0% 0% 100.0% Total 100.0% 0% 100.0%
Landform Village Hamlet Total Landform Village Hamlet Total Landform Village Hamlet Total
Terrace 63% 33% 96% Terrace 66.7% 28.6% 95.2% Terrace 80.0% 10.0% 90.0%
Other 4% 0% 4% Other 0.0% 4.8% 4.8% Other 10.0% 0.0% 10.0%
Total 67% 33% 100% Total 66.7% 33.3% 100.0% Total 90.0% 10.0% 100.0%
Early Upland
Landscape: Monongahela
Middle Upland
Early Lowland Middle Lowland
Late Upland
Late Lowland

62
Table E2. Monongahela landscape features in percents of period upland and lowland sites.
Landform Village Hamlet Total Landform Village Hamlet Total Landform Village Hamlet Total
Hill 58.3% 0.0% 58.3% Hill 18.2% 9.1% 27.3% Hill 33.3% 0.0% 33.0%
Bluff 0.0% 0.0% 0.0% Bluff 36.4% 9.1% 45.5% Bluff 33.3% 16.7% 50.0%
Spur 8.3% 0.0% 8.3% Spur 18.2% 0.0% 18.2% Spur 16.7% 0.0% 17.0%
Terrace 16.7% 0.0% 16.7% Terrace 9.1% 0.0% 9.1% Terrace 0.0% 0.0% 0.0%
Ridge 8.3% 8.3% 17% Ridge 0.0% 0.0% 0.0% Ridge 0.0% 0.0% 0.0%
Total 91.7% 8.3% 100% Total 81.8% 18.2% 100.0% Total 83.3% 17.0% 100.0%
Landform Village Hamlet Total Landform Village Hamlet Total Landform Village Hamlet Total
Spur 25.0% 0% 25% Spur 0.0% 0.0% 0.0% Spur 0.0% 0.0% 0.0%
Hill 25.0% 0% 25% Hill 86.0% 0.0% 86.0% Hill 23.1% 7.7% 30.8%
Terrace 25.0% 0% 25% Terrace 14.0% 0.0% 14.0% Terrace 0.0% 0.0% 0.0%
Riverflat 25.0% 0% 25% River Flat 0.0% 0.0% 0.0% River Flat 61.5% 7.7% 69.2%
Total 100% 0% 100% Total 100.0% 0.0% 100.0% Total 23.1% 7.7% 100.0%
Middle Upland
Middle Lowland
Late Upland
Late Lowland
Landscape: Mohawk
Early Upland
Early Lowland

63
APPENDIX F
Comparative Tables
Figure1. Monongahela, Mohawk, and Meskwaki distances from nearest confluence.
0%
10%
20%
30%
40%
50%
60%
70%
80%
90%
100%
Percen
t o
f S
ett
lem
en
ts
Distance From Nearest Stream Confluence
Less than 500m
500m-1000m
Over 1000m

64
Figure F2. Monongahela, Mohawk, and Meskwaki landform changes.
Figure F3. Monongahela, Mohawk, and Meskwaki soil fertility changes.
0%
10%
20%
30%
40%
50%
60%
70%
80%
90%
100%
Monongahela Mohawk Meskwaki
Percen
t o
f S
ett
lem
en
tsLandform Changes
Early Upland
Early Lowland
Middle Upland
Middle Lowland
Late Upland
Late Lowland
0%
20%
40%
60%
80%
100%
120%
321-1-2-3
Per
cen
t o
f P
erio
d S
ites
Deviations from Population Mean
Soil Fertility
Early Monongahela
Middle Monongahela
Late Monongahela
Early Mohawk
Middle Mohawk
Late Mohawk
Early Meskwaki
Middle Meskwaki
Late Meskwaki

65
BIBLIOGRAPHY
Anderson, David A.
2002 Elites Among the Monongahela?: Evidence for Emergent Social Complexity in the Late
Prehistoric-Protohistoric Period of Southwestern Pennsylvania. Archaeology of
Eastern North America 30:121-136.
Anderson, David A. and Jenica Simon
2009 Investigating the Upland Settlement Pattern of the Monongahela: Plowshares or
Swords?, Paper presented at the 76th
Annual Meeting of the Eastern States
Archaeological Federation, Johnstown.
Anderson, David A.
2012 “Monongahela Site Data.” Unpublished database. University of Wisconsin-La Crosse,
La Crosse, Wisconsin.(accessed in Microsoft Access form 2012).
Behm, Jeffrey A.
1998 The Bell Site: Community Plan of the Grand Village of the Meskwaki. The Wisconsin
Archaeologist 79:131-174.
2008 The Meskwaki in Eastern Wisconsin: Ethnohistory and Archaeology. The Wisconsin
Archaeologist 89(1-2):7-85.
Bird, Douglas W. and James F. O’Connell
2006 Behavioral Ecology and Archaeology. Journal of Archaeological Research 14:143-
188.
Bradley, James W.
2001 The Onondaga Iroquois. In Societies in Eclipse: Archaeology of the Eastern
Woodlands Indians, A.D. 1400-1700, edited by David S. Brose, C. Wesley Cowan, and
Robert C. Mainfort Jr., pp. 27-36. Smithsonian, Washington and London.
Buffalo, Johnathan Lantz
2008 Oral History of the Meskwaki. The Wisconsin Archaeologist 89:3-6.
Callender, Charles
1978 Fox. In Northeast, edited by Bruce G. Trigger, pp. 648-655. Handbook of North
American Indians, Volume 15, William C. Sturtevant, general editor, Smithsonian
Institution, Washington D.C.

66
Edmunds, David R. and Joseph L. Peyser
1993 The Fox Wars: The Meskwaki Challenge to New France. University of Oklahoma
Press, Norman, Oklahoma.
Faulkner, Alaric
1974 Archaeological and Historical Site Survey of the Middle Fox River Passageway.
Department of Sociology and Anthropology, University of Oshkosh, Oshkosh,
Wisconsin. Report in fulfillment of grant 55-72-00009 from the National Park Service
and the State Historical Societo f Wisconsin. Copies of this report are on file with the
Division of Historic Preservation, Wisconsin Historical Society, Madison, Wisconsin
and the Archaeology Laboratory, University of Wisconsin -Oshkosh, Oshkosh,
Wisconsin.
Hasenstab, Robert J
2007 Aboriginal Settlement Patterns in Late Woodland Upper New York State. In
Archaeology of the Iroquois, edited by Jordan E. Kerber, pp.164-173. Syracuse
University Press.
Hunt, George T.
1940 The Wars of the Iroquois: A Study in Intertribal Trade Relations. The University of
Wisconsin Press. Madison.
Johnson, William C.
2001The Protohistoric Monongahela and the Case for an Iroquois Connection. In Societies
in Eclipse: Archaeology of the Eastern Woodlands Indians, A.D. 1400-1700, edited by
David S. Brose, C. Wesley Cowan, and Robert C. Mainfort Jr., pp. 67-82. Smithsonian,
Washington and London.
Johnson, William C., William P. Athens, Martin T. Fuess, Luis G. Jaramillo, Keith R. Bastianini,
and Elizabeth Ramos
1989 Late Prehistoric Period Monongahela Culture Site and Cultural Resource Inventory.
Report prepared by the Cultural Resource Management Program, Department of
Anthropology, University of Pittsburg in fulfillment of a Survey and Planning Grant
from the Pennsylvania Historical and Museum Commission, Bureau for Historic
Preservation, Harrisburg.
Johnson, William C. and William P. Athens
1998 Late Prehistoric period Monongahela Culture Settlement Patterns in the Appalachian
Plateaus Section of the Upper Ohio River Valley: The Case for a Risk Reduction
Subsistence Strategy. Paper presented at the Pennsylvania Archaeological Council’s
Late Woodland/Late Prehistoric Symposium at the Sixty-Ninth Annual Meeting of the
Society for Pennsylvania Archaeology, New Cumberland, April 24-26, 1998.

67
Jones, Eric E.
2008 Iroquois Population History and Settlement Ecology, AD 1500-1700. Ph.D
Dissertation, Department of Anthropology, Pennsylvania State University, Pittsburg.
University Microfilms, Anne Arbor.
Kay, Jeanne
1978 The Land of La Baye: The Ecological Impact of the Green Bay Fur Trade, 1634-1836.
Ph.D. dissertation, Department of Geography, University of Wisconsin-Madison,
Madison, Wisconsin.
Lapham, Heather A. and William C. Johnson
2002 Protohistoric Monongahela Trade Relations: Evidence from the Foley Farm Phase
Glass Beads. Archaeology of Eastern North America 30: 97-120.
Mason, Richard P.
1989 Notes on Some Early History and Water Levels (1839-1851) In Winnebago County.
Fox Valley Archaeology 15: 40-45.
Means, Bernard K.
2006 Circular Reasoning: Drawing on Models of Ring-Shaped Village Spatial Layouts to
Examine Villages in Late Prehistoric Pennsylvania. Ph.D. dissertation, Arizona State
University, Phoenix. University Microfilms, Anne Arbor.
Montage, Michelle L.
2001 Small Sites and the Monongahela Settlement System: A View from the Sandrock
Shelter. Ph.D dissertation, Department of Anthropology, Binghamton University, State
University of New York. University Microfilms, Anne Arbor.
Natural Resource Conservation Service
2012 Web Soil Survey. Electronic document,
http://websoilsurvey.nrcs.usda.gov/app/HomePage.htm, accessed February 2, 2012.
Richardson, James B. III, David A. Anderson and Edward R. Cook
2002 The Disappearance of the Monongahela: Solved? Archaeology of Eastern North
America 30: 81-96.
Richter, Daniel K.
1992 The Ordeal of the Longhouse: the Peoples of the Iroquois League in the Era of
European Colonization. University of North Carolina Press, Chapel Hill.
Snow, Dean R.
1995a Mohawk Valley Archaeology: The Sites. The Institute for Archaeological Studies,
University at Albany, SUNY.
1995b Mohawk Valley Archaeology: The Collections. The Institute for Archaeological
Studies, University at Albany, SUNY.

68
2001 Evolution of the Mohawk Iroquois. In Societies in Eclipse: Archaeology of the Eastern
Woodlands Indians, A.D. 1400-1700, edited by David S. Brose, C. Wesley Cowan, and
Robert C. Mainfort Jr., pp. 16-26. Smithsonian, Washington and London.
2012 “New York Sites.” Unpublished MapInfo database. Pennsylvania StateUniversity,
State College, Pennsylvania. (accessed in Microsoft Access format 2012).
Tanner, Helen Hornbeck
1987 Atlas of Great Lakes Indian History. University of Oklahoma Press, Norman,
Oklahoma.
Titus, W.A.
1941 Early Navigation on the Fox and Wolf Rivers and Lake Winnebago. Wisconsin
Magazine of History 25(1):16-30.
U.S. Geological Survey
2012 The National Map. Electronic document, http://nationalmap.gov/, accessed February 2,
2012.
Wisconsin Historical Society
1993 Archaeological Sites Inventory Report 24442 for State Site WN-6013, September
24,1993. Division of Historic Preservation, Wisconsin Historical Society.
http://www.wisahrd.org/print_rec.cfm (accessed January 5, 2012). Wisconsin Historical
Society, Madison, Wisconsin.
1994 Archaeological Sites Inventory Report 25951 for State Site WN-0670, November
23,1994. Division of Historic Preservation, Wisconsin Historical Society.
http://www.wisahrd.org/print_rec.cfm (accessed January 5, 2012). Wisconsin
Historical Society, Madison, Wisconsin.
1998a Archaeological Sites Inventory Report 29094 for State Site WN-0754, May 5, 1998.
Division of Historic Preservation, Wisconsin Historical Society.
http://www.wisahrd.org/print_rec.cfm (accessed January 5, 2012). Wisconsin
Historical Society, Madison, Wisconsin.
1998b Archaeological Sites Inventory Report 29095 for State Site WN-0755, May 5, 1998.
Division of Historic Preservation, Wisconsin Historical Society.
http://www.wisahrd.org/print_rec.cfm (accessed January 5, 2012). Wisconsin Historical
Society, Madison, Wisconsin.
2011 Archaeological Sites Inventory Report 7265 for State Site BWN-0162, November 1,
2011. Division of Historic Preservation, Wisconsin Historical Society.
http://www.wisahrd.org/print_rec.cfm (accessed January 5, 2012). Wisconsin Historical
Society, Madison, Wisconsin.

69
2012 Archaeological Sites Inventory Report 7114 for State Site BWP-0144, January 5, 2012.
Division of Historic Preservation, Wisconsin Historical Society.
http://www.wisahrd.org/print_rec.cfm (accessed January 5, 2012). Wisconsin Historical
Society, Madison, Wisconsin.
