strategic market analysis for electric works
TRANSCRIPT

STRATEGIC MARKET
ANALYSIS FOR
ELECTRIC WORKS
Presentation to Allen County-Fort Wayne CIB
May 30, 2018
Adam Ducker, Managing Director

OBJECTIVES & KEY FINDINGS

U4-14231.00 | 5/30/2018 | 3
BACKGROUND AND OBJECTIVES
BACKGROUND
RTM Ventures, LLC (“RTM Ventures”) is planning the adaptive reuse of Electric Works, a former GE
Campus in Fort Wayne, Indiana. With a convenient location near the edge of Downtown Fort Wayne,
Electric Works is comprised of 39 acres and 18 historic buildings, which collectively offer more than 1.2
million square feet of space for office, retail, residential, hospitality, entertainment, and educational uses,
with potential for up to 1.6 million additional square feet of new construction.
RTM Ventures engaged RCLCO to provide a quantitative, fact-driven assessment of the development
program for Phase I of the project. At this time, Phase I is planned to include the redevelopment of the
western site, which consists of 10 buildings that are planned to offer approximately 224,000 square feet
of office, 113,000 square feet of research/education space, 83,000 square feet of retail/restaurants and
a food hall, 83,000 square feet of dedicated innovation space, 82,000 square feet of rental apartments,
and 31,000 square feet of amenity and recreational space.
ASSESS MARKET SUPPORT FOR PHASE I OF ELECTRIC WORKS

U4-14231.00 | 5/30/2018 | 4
BACKGROUND AND OBJECTIVES
OBJECTIVES
Specifically, the goals of the following analysis are as follows:
► Analyze the evolving economy of Fort Wayne, focusing on the composition of jobs and growth of
industries in the market;
► Assess the market depth and performance of office, apartment, and retail spaces in and around Fort
Wayne, with the goal of evaluating the overall depth of demand for new spaces in the market, in
general, and at Electric Works, in particular;
► Determine the optimal level of pricing for office, apartment, and retail at Electric Works, taking into
account the characteristics of the site as well as the positioning of competitive projects; and
► Survey other markets for national examples of catalytic, mixed-use developments which may help
assess whether a project like Electric Works has the potential to help reset the pricing paradigms or
demand conditions in Downtown Fort Wayne
ASSESS MARKET SUPPORT FOR PHASE I OF ELECTRIC WORKS

U4-14231.00 | 5/30/2018 | 5
KEY FINDINGS
MARKET OVERVIEW
There is a subtle but important story of growth in Fort Wayne. While the urbanization of larger or faster-
growing cities like Columbus and Indianapolis has been somewhat quicker and more obvious, there is a
strong opportunity for new urban development in Fort Wayne, as the perceptions about its downtown
continue to evolve, and as its employment and population bases continue to expand. With a rich past
and a convenient location relative to the historic core of Fort Wayne, Electric Works offers the unique
opportunity to introduce a dynamic, mixed-use location for people to live, work, and play—while also
revitalizing an existing development of great cultural and economic significance to the surrounding area.
Although the Fort Wayne Metropolitan Statistical Area (“MSA”) lost jobs during the Great Recession, its
economy has since recovered. Since 2010, Education & Health Services and Manufacturing have been
two large drivers of new employment growth, while moderate job growth in Professional & Business
Services has fueled demand for some new office in Downtown Fort Wayne, as well. At the same time,
Downtown Fort Wayne outpaced the region as a whole in terms of household growth, following a
decade of decline between 2000 and 2010. Coupled with the younger ages of people living in Downtown
Fort Wayne, this trend points to a renewed interest in urban living, likely attributable to young
professionals wanting to live near their places of work.
SUBTLE BUT IMPORTANT STORY OF GROWTH IN FORT WAYNE
U4-14231.00 | 5/30/2018 | 6
KEY FINDINGS
EVOLUTION OF DOWNTOWN FORT WAYNE
As the job and population bases in Downtown Fort Wayne have continued to expand, they have fueled a
need for new spaces. As a result, the quality and quantity of new development in Downtown Fort Wayne
has increased in recent years. Today, new projects like Ash Skyline Plaza, The Harrison, and Cityscape
Flats are pushing the upper threshold on office and residential pricing, and the strong performance of
these projects indicates there are indeed customers who are willing to pay for them.
Going forward, new projects like Skyline Tower and Metro 202 will continue to solidify Downtown Fort
Wayne as a vibrant place for people to live, work, and play when they deliver, likely attaining pricing
near or at the top of the market in the process. Further, future development along the riverfront will
continue to bring a new sense of energy to Downtown Fort Wayne. As new forms of development occur,
public perceptions about Downtown Fort Wayne will continue to evolve, fueling additional growth
opportunities as the neighborhood emerges as the economic and cultural core of the region.
DOWNTOWN MARKET IS CONTINUING TO EMERGE

U4-14231.00 | 5/30/2018 | 7
KEY FINDINGS
IMPLICATIONS ON ELECTRIC WORKS
With a rich history and community significance, Electric Works is positioned to capture demand spurred
by renewed interest in Downtown Fort Wayne. The site already serves as a regional landmark, and its
effective revitalization could strengthen Downtown Fort Wayne and solidify its positioning within and
outside of the market, helping to attract new tenants and—just as importantly —maintain existing ones.
While the performance of existing projects in Downtown Fort Wayne indicates there is clearly a market
for new, urban product, there are three questions pertaining to the specific opportunity at Electric Works:
► Depth of Market: Is the market big enough to absorb this amount of space? Yes: In Downtown Fort Wayne, new deliveries are performing
well due to pent-up demand for new space, and future growth will continue to yield opportunities. Although Electric Works has a different
location and feel than recent deliveries, case studies indicate that these features will not impact—and may in fact help—its capture of overall
development in Downtown Fort Wayne.
► Level of Pricing: Is the proposed level of pricing reasonable for the market? Yes: Despite a location in an emerging part of Downtown
Fort Wayne, Electric Works is poised to attain similar pricing to its top-of-market competitors, given its unique features and proposed mix of
uses. Moreover, case studies indicate there is no reason that a project of this type or in this location needs lower pricing.
► Impact of Adaptive Reuse: Does adaptive reuse open up a market? Yes: New and different product is likely to tap into new market
segments which are presently underserved in Fort Wayne. As seen in places like Pittsburgh, this type of product has strong appeal among
prospective tenants.
OPPORTUNITY FOR URBAN DEVELOPMENT AT ELECTRIC WORKS

U4-14231.00 | 5/30/2018 | 8
OPPORTUNITY BY LAND USEPHASE I OF ELECTRIC WORKS
OFFICE APARTMENT RETAIL
PR
OD
UC
T
SF/Units 224,000 SF (+ 83,000 SF of Innovation Space) 82,000 SF (Approximately 90-100 Units) 83,000 SF (Including Potential Food Hall)
Opportunity
Coupled with a lack of new office in Downtown Fort
Wayne, the historic features of Electric Works make it a
compelling location for top-of-market office, with
features that appeal to creative tenants, in particular
In Downtown Fort Wayne, new supply has not kept up
with demand. Situated along edge of Downtown Fort
Wayne near other successful projects, Electric Works
will be an exceedingly popular location to urban living
Given the growing household and employment bases in
Downtown Fort Wayne, the area is underserved by
supporting retail uses, and Electric Works is poised to
become a premiere destination for urban retail
Target Market
Professional & Business Services and Education &
Health Care Services, with some potential to attract
creative office-using Manufacturing tenants as well
Young professionals, with secondary market appeal
towards mature professionals and empty nesters
looking for newer/nicer product
Restaurants and entertainment, with household-
supporting retail targeted towards people who live in
and around Downtown Fort Wayne
PR
ICIN
G
Underwritten $25 / SF (Full-Service) $1.25 / SF $14.50 / SF (NNN)
Achievable $25 / SF (Full-Service) $1.50 / SF $15.00 / SF (NNN), with upside potential
Market
Positioning
Generally in line with new and renovated product, but
slightly above other, older product in Downtown Fort
Wayne, where most inventory is well-occupied but
growing increasingly dated
In line with such top-of-market competitors as The
Harrison and Skyline Tower, though pricing at Skyline
Tower may increase in the long run as it finds its
competitive positioning in the market
Below historic core of Downtown Fort Wayne and other,
larger regional destinations (i.e. Jefferson Pointe and
Glenbrook Square), but in-line with or above
community-serving retail centers
DE
MA
ND
Market Demand
Next 5 Years
0 SF in MSA (Due to Vacant Suburban Office)
650,000 SF in Downtown (Due to Pent-Up Demand)
3,150 Units in MSA
700 Units in Downtown Fort WayneN/A – While region as a whole is served, parts are not
Site Demand
Next 5 Years
270,000 SF of Conventional Office
100,000 SF of Creative Office160 Units 105,000 to 115,000 SF
Absorption
Period1-2 Years Upon Delivery 8-10 Units Per Month 1-2 Years Upon Delivery

MARKET OVERVIEW & SITE ANALYSIS

U4-14231.00 | 5/30/2018 | 10
► For the purposes of this study, RCLCO projects moderate job growth of approximately 1.0% per year, in line with long-term
averages and accounting for the cyclical nature of the economy.
► However, there is upside potential for growth in Fort Wayne. As highlighted in The Road to One Million plan, Northeastern
Indiana can attain additional economic growth if it attracts and maintains younger, well-educated workers, who have driven
growth in other regions. Instrumental in attracting these workers, new urban projects like Electric Works can achieve this goal
by strengthening the appeal and positioning of Downtown Fort Wayne, both within and outside of the region. For the purposes
of projecting demand, this report relies on a more conservative set of assumptions, taking into account growth that is in-line
with recent historic levels.
REGIONAL EMPLOYMENT GROWTH31,000 JOBS THROUGH 2030, WITH POTENTIAL UPSIDE
Source: Moody’s; The Road to One Million; RCLCO
-8%
-6%
-4%
-2%
0%
2%
4%
-20,000
-15,000
-10,000
-5,000
0
5,000
10,000
1990 1992 1994 1996 1998 2000 2002 2004 2006 2008 2010 2012 2014 2016 2018 2020 2022 2024 2026 2040 2030
Employment Growth (#) Employment Growth (%)
1990-2007:
25,000 jobs were added
(Annual Growth of 0.7%)
Great Recession:
17,000 jobs were lost
(Annual Decay of 2.6%)
2010-2017:
20,000 jobs were added
(Annual Growth of 1.4%)
Growth Projections:
Based on long-term growth trends
(Annual Growth of 1.0%)
Job growth likely to
vary depending on
timing in cycle
Historic and Projected Employment Growth, 1990-2030;
Fort Wayne MSA

U4-14231.00 | 5/30/2018 | 11
PRIMARY ECONOMIC DRIVERSMOSTLY EDUCATION & HEALTH SERVICES AND MANUFACTURING,
WITH PROFESSIONAL SERVICES FUELING SOME OFFICE DEMAND
Source: Moody’s; The Road to One Million; RCLCO
Historic Employment Growth by Sector, 2013-2017;
Fort Wayne MSA
-1,000 -500 0 500 1,000 1,500 2,000 2,500 3,000 3,500 4,000
Information
Wholesale Trade
Utilities
Natural Resources and Mining
Financial Activities
Transportation & Warehousing
State & Local Government
Other Services
Professional & Business Services
Construction
Retail Trade
Manufacturing
Leisure & Hospitality
Educational & Health Services
25,000
27,500
30,000
32,500
35,000
37,500
40,000
42,500
1990 1995 2000 2005 2010 2015 2020 2025 2030
Historic and Projected Office-Using Employment, 1990-2030;
Fort Wayne MSA
Since 2009:
Over 2,400 New Office-Using Jobs
(0.8% Growth / Year)
1990 to 2000:
Over 7,200 New Office-Using
Jobs (2.1% Growth / Year)
Projected:
3,800 New Office-Using Jobs by 2030
(0.7% Growth / Year)

U4-14231.00 | 5/30/2018 | 12
JOB BASE IN DOWNTOWN FORT WAYNEWELL-POISED TO CAPTURE OFFICE DEMAND FROM JOB GROWTH
Source: LEHD Employment Data; Robert Manduca; RCLCO
Distribution of Employment;
Fort Wayne MSA and Central Fort Wayne
27%
19% 16% 11%
24%
10%
12%
10%
6%
10%
14%
5%
3%
5%
3%
5% 5% 4%
7%
0% 10% 20% 30% 40% 50% 60% 70% 80% 90% 100%
Central Fort Wayne
Fort Wayne MSA
Educational & Health ServicesManufacturingRetail TradeState & Local GovernmentProfessional & Business ServicesLeisure & HospitalityFinancial ActivitiesOther ServicesConstructionWholesale TradeTransportation & WarehousingInformationUtilitiesNatural Resources and Mining
Central Fort Wayne
MAP KEY
Manufacturing and Logistics
Professional Services
Healthcare, Education, Government
Retail, Hospitality, Other Services
NOTE: One Dot Equals One Job
Location of Jobs by Industry Sector, 2014;
Central Fort WayneThe employment makeup of Central Fort Wayne is somewhat dissimilar
from the job composition of the broader region.
► Relative to the MSA, Central Fort Wayne is a particularly attractive
location for companies in Education & Health Care Services,
Government, Professional & Business Services, and Financial
Activities, all of which require some amount of office space and help
attract young workers.
► In comparison, areas outside of Central Fort Wayne are more likely to
attract companies in Manufacturing or Transportation & Warehousing.

U4-14231.00 | 5/30/2018 | 13
ECONOMICS AND DEMOGRAPHICSHOUSEHOLDS IN DOWNTOWN FORT WAYNE ARE YOUNGER, AND
~40% ARE CAPABLE OF AFFORDING NEW PRODUCT
Source: Esri; RCLCO
4%
17% 17% 18% 19%
14%10%10%
26%
15% 16% 16%
11%8%
0%
5%
10%
15%
20%
25%
30%
Under 25 25-34 35-44 45-54 55-64 65-74 75 and over
Fort Wayne MSA Central Fort Wayne
Household Distribution by Age, 2017;
Fort Wayne MSA and Central Fort Wayne
32%
16%20%
13% 12%7%
60%
13% 13%
6% 5% 3%
0%
10%
20%
30%
40%
50%
60%
70%
Less Than $35,000 $35,000 to $50,000 $50,000 to $75,000 $75,000 to $100,000 $100,000 to $150,000 $150,000 And Above
Fort Wayne MSA Central Fort Wayne
Household Distribution by Income, 2017;
Fort Wayne MSA and Central Fort Wayne

U4-14231.00 | 5/30/2018 | 14
SITE ASSESSMENT
STRENGTHS
► Unique Building With Historical Significance: A former General Electric (“GE”)
campus, Electric Works offers a number of unique and historically significant buildings,
which will draw interest from perspective tenants and differentiate the project from
existing and future developments in the market. The project is likely to be viewed as
truly one-of-a-kind, both within the market as well as outside of it.
► Location Near Parkview Field and Downtown Fort Wayne: Situated along the urban
fringe of Downtown Fort Wayne, Electric Works is located less than a mile from
Downtown Fort Wayne, as well a five minute walk from Parkview Field. This location
will appeal to people who want to live, work, or play in an urban setting.
OPPORTUNITIES
► Transformative Project: The Electric Works site already serves as a landmark in Fort
Wayne, and its effective revitalization could strengthen the surrounding neighborhood,
in addition to solidifying its competitive positioning in the market.
► Opportunity for Placemaking: Given the rich history of the site and its buildings,
Electric Works offers numerous opportunities for placemaking, which will bolster the
appeal of the project and ameliorate potential consequences of its location being
near—but technically outside of—the historic urban core of Fort Wayne.
► Potential Path of Urban Growth: Following the delivery of Parkview Field, the area to
the southwest of Downtown Fort Wayne has begun to transform, and new projects like
The Harrison and Cityscape Flats have recently emerged. Located just past these
projects, Electric Works offers the ability to leverage this sense of energy, and continue
to develop the path of growth along Broadway.
► Downtown Supply Constraints: At this time, there is a lack of office, retail, and
residential offerings in Downtown Fort Wayne, providing Electric Works with the
opportunity to fill this gap in the market and meet the need for new space.
► Easier, More Affordable Parking than Downtown: Relative to office buildings located
in the historic urban core of Fort Wayne, Electric Works offers cheaper, easier parking
options, making it attractive to employees who do not like having to navigate
underground parking garages.
CHALLENGES
► Separation from Downtown: Electric Works is bound by railroads on two sides, and
these tracks act as physical and mental barriers that separate the site from Downtown
Fort Wayne. Accessing Downtown, via car and on foot, requires travel through one of
two underpasses beneath the railroad. While this these connectivity challenges inhibit
the perceived walkability and accessibility of the site at this time, case studies show that
similar physical barriers can have a minimal impact on developments, given proper
placemaking on-site.
► Reputation of Surrounding Neighborhood: Parts of the neighborhood in which
Electric Works is located are economically challenged, and have low household
incomes. While the site itself and its proximity to Downtown Fort Wayne are both
appealing, and while the economic makeup of the surrounding area may change
following the redevelopment of Electric Works, the surrounding area may repel
individuals looking for a more established place to live or work in the near-term
STRONG OPPORTUNITY FOR URBAN DEVELOPMENT
Map of Subject Site; Electric Works
Parkview Field
Electric Works

EVOLUTION OF DOWNTOWN

U4-14231.00 | 5/30/2018 | 16
ESTABLISHED OFFICE CORECHARACTERIZED BY HIGH RENTS AND LOW VACANCIES
Source: RCLCO, CoStar; the Zacher Company
0.0%
3.0%
6.0%
9.0%
12.0%
15.0%
18.0%
21.0%
0
2,000,000
4,000,000
6,000,000
8,000,000
10,000,000
12,000,000
2011 2012 2013 2014 2015 2016 2017
Vacan
cy Rate, %
Occ
up
ied
Sp
ace,
SF
Downtown Occupied SF Rest of Market Occupied SFDowntown Vacancy Rate MSA Vacancy Rate
Historic Occupied and Vacant Space, 2018;
Downtown Fort Wayne and Fort Wayne Market
A desirable location for office-using employers, Downtown Fort Wayne has:
► 40% of all office inventory in the Fort Wayne MSA, making it the single-
largest job core
► Higher rents than suburban submarkets, on average
► Lower vacancies than the rest of the MSA, on average
MAP KEY
High
Medium/High
Medium
Medium/Low
Low
New Building (2010+)
Heat Map of Office Buildings, 2018;
Fort Wayne MSA
AVERAGE FULL SERVICE LEASE RATES
DOWNTOWN SUBURBAN
Class A $18.00 - $22.00 $16.00 - $20.00
Class B $13.00 - $16.00 $12.00 - $15.00
Class C $9.00 - $12.00 $9.00 - $11.00
New Build to Suit $23.00 - $26.00
Average Full Service Lease Rates, 2017;
Fort Wayne MSA

U4-14231.00 | 5/30/2018 | 17
EMERGING RESIDENTIAL MARKETINCREASING SOPHISTICATION OF PRODUCT OFFERINGS
Source: CoStar; Axiometrics; RCLCO
Evolution of Product Offerings;
Downtown Fort Wayne
2010 2011 2012 2013 2014 2015 2016 2017 2018
The Harrison (2013)
Luxury apartment building, amenitized by ground
floor retail and Parkview Field; smaller in scale but
top-of-market in price
Cityscape Flats (2017)
Moderately dense apartment community that is
larger in scale, with a more diverse product line and
a more comprehensive amenity package
Skyline Tower (2018)
High-rise rental apartment community, larger in
scale/density and higher in quality than what has
traditionally delivered
Pre-2010
Older, often unrenovated apartment buildings;
buildings are typically value-oriented, targeted
towards price-conscious households
Heat Map of Rental Apartment Buildings, 2018;
Fort Wayne MSA
MAP KEY
High
Medium/High
Medium
Medium/Low
Low
New Building (2010+)
Historically, rental apartment development in the Fort Wayne MSA has been
spread out, and predominately focused on lower-density, value-oriented product
offerings. However, this dynamic has changed, as Downtown Fort Wayne has
continued to evolve. In recent years, a renewed interest in Downtown Fort
Wayne have spurred new rental apartment development since 2010.
As this shift has occurred in Downtown Fort Wayne, the positioning of rental
communities has evolved over time. In recent years, rental apartments have
transitioned from value propositions to luxury offerings, which have increased in
scale, density, and programming over time.

U4-14231.00 | 5/30/2018 | 18
STRONG APARTMENT RENT GROWTHDRIVEN BY NEW INVENTORY AND DESIRE TO LIVE DOWNTOWN
Source: CoStar; RCLCO
$0.6
1
$0.6
2
$0.6
4
$0.6
5
$0.6
4
$0.6
4
$0.6
4
$0.6
6
$0.6
7
$0.6
9
$0.7
3
$0.7
6
$0.7
9
$0.7
9
$0.6
8
$0.6
9
$0.7
0
$0.7
1
$0.6
9
$0.6
9
$0.7
1 $0.7
9
$0.8
0
$0.7
9
$0.9
5
$0.9
9
$1.0
1
$1.0
0
5.0%
10.0%
15.0%
20.0%
25.0%
30.0%
35.0%
$0.00
$0.20
$0.40
$0.60
$0.80
$1.00
$1.20
2005 2006 2007 2008 2009 2010 2011 2012 2013 2014 2015 2016 2017 2018 YTD
Prem
ium
, %R
ent
Per
Sq
uar
e F
oo
t
Asking Rent PSF - Fort Wayne MSA Asking Rent PSF - Central Fort Wayne Premium - Central Fort Wayne
Historic Asking Rents, 2005-2018;
Fort Wayne MSA and Central Fort Wayne

U4-14231.00 | 5/30/2018 | 19
RETAIL HAS NOT YET FOLLOWEDEVEN AS JOBS AND HOUSEHOLDS MOVE DOWNTOWN
Source: CoStar; Esri; Census Bureau; RCLCO
In Fort Wayne, retail development is concentrated in the suburbs, around such
anchors as Jefferson Pointe and Glenbrook Square. Meanwhile, Downtown Fort
Wayne lacks many household-supporting uses, given its historic reputation as a
9-to-5 employment core. Even as this reputation has evolved, new retail
development has not shifted towards Downtown Fort Wayne.
Given this lack of supply, most households living in Downtown Fort Wayne must
travel to the suburbs for their retail needs. In particular, residents of Downtown
Fort Wayne are likely to commute outwards for household-supporting uses, like
grocery stores, pharmacies, general merchandise stores. As household growth
occurs in Downtown Fort Wayne, there are likely to be opportunities to
introduce these types of retail, given that Downtown Fort Wayne is currently
losing this spending to its suburbs.
Heat Map of Retail, 2018;
Fort Wayne MSA
MAP KEY
High
Medium/High
Medium
Medium/Low
Low
New Retail (2010+)
Central Fort Wayne:
Gap in Market,
Considering Amount of
Office/Residential
-$40,000,000 -$30,000,000 -$20,000,000 -$10,000,000 $0 $10,000,000 $20,000,000 $30,000,000
General Merchandise Stores
Food & Beverage Stores
Motor Vehicle & Parts Dealers
Health & Personal Care Stores
Sporting Goods, Hobby, Book & Music Stores
Furniture & Home Furnishings Stores
Electronics & Appliance Stores
Clothing & Clothing Accessories Stores
Bldg Materials, Garden Equip. & Supply Stores
Gasoline Stations
Miscellaneous Store Retailers
Food Services & Drinking Places
Current Retail Leakage, 2017;
Central Fort Wayne
Households Support Outside RetailRetail Supported by Outside Households
People who live in Downtown Fort Wayne
drive elsewhere to shop for these items
People drive into Downtown
Fort Wayne from outside to
shop for these items

CASE STUDIES

U4-14231.00 | 5/30/2018 | 21
TAKEAWAYS FROM PROJECT ANALOGUESIN COLUMBUS, PITTSBURGH, AND STAMFORD
Source: RCLCO
TOPIC LESSON LEARNED
NEW, URBAN
DEVELOPMENT
OUTSIDE OF
HISTORIC
CORE
Electric Works’ location in a residential neighborhood along the fringe of
Downtown Fort Wayne should not hinder its ability to compete with properties
located within the historic urban core, even with the railroad acting as a physical
and mental barrier at this time. Outside of Downtown Columbus, Grandview
Yard has a remarkably similar location, and has been very successful despite
these same obstacles.
CAPTURE OF
REGIONAL
DEVELOPMENT
Electric Works has the potential to jump start the development that is already
beginning to occur near Parkview Field, and could catalyze the revitalization of
its surrounding area. A comparable adaptive reuse project in a formerly
distressed part of Pittsburgh, Bakery Square fueled development throughout its
surrounding area. Today, this area accounts for a large share of new
development in the metro area, and has helped Pittsburgh maintain and foster
growth at companies like Google.
CATALYTIC
IMPACT ON
MARKET
DYNAMICS
A significant redevelopment project like Electric Works can help reset market
dynamics in Downtown Fort Wayne. Although smaller development projects are
already fueling reinvestment throughout the neighborhood, a project of this
scale can leverage existing activity and serve as the catalyst to a larger
transformation. In Stamford, Harbor Point supplemented development activity
happening elsewhere in the city, sparking additional development and changing
the trajectory of the market.
Grandview Yard; Columbus, Ohio
Bakery Square; Pittsburgh, Pennsylvania
Harbor Point; Stamford, Connecticut

U4-14231.00 | 5/30/2018 | 22
GRANDVIEW YARDCOLUMBUS, OHIO
Source: RCLCO
DESCRIPTION
With its first phase opening in 2010, Grandview Yard is in the
process of transforming a long-vacant distribution yard into a
vibrant mixed-use neighborhood in Grandview Heights, a
residential neighborhood northwest of Downtown Columbus.
Since opening, Grandview Yard has attracted many major
office tenants, including a 500,000 square foot Nationwide
Insurance campus, as well as supporting residential, retail, and
hotel space. Driven by strong demand, additional office and
residential space is currently under construction.
LAND USES
Land Area 125 Acres
Residential 550 Units (1,500 at build-out)
Office 756,000 SF
Retail 80,000 SF
Hotel 260 Rooms
KEY TAKEAWAYS IMPLICATIONS
The expansion of existing
development corridors
can be successful, even
with physical barriers
Grandview Yard is located within a mile of the Arena District
and Short North, both of which have undergone extensive
development in recent years. As a result of its location,
Grandview Yard has served as an extension of the
development corridor to the northeast of Downtown
Columbus, despite I-670 creating a barrier.
Electric Works has a similar
opportunity to expand the range of
development that has occurred in
Downtown Fort Wayne, despite
physical barriers that create
separation
New office at the fringe of
downtown can achieve
the same positioning as
space located directly
downtown
Grandview Yard has been successful in attracting office
tenants, including office tenants looking to relocate their
offices to downtown Columbus, despite its location nearly
two miles from downtown.
Electric Works’ location could still be
considered ‘Downtown’ by area
businesses, and could see success in
attracting office tenants as a result.
New rental apartments
can also compete with
comparable product in
more established urban
locations
Grandview Yard, which has yet to reach full build-out, has
been able to successfully position its average multifamily
rent per unit above Downtown Columbus and the high-
development neighborhoods of Short North and The Arena
District. Rents should continue to increase as the
development moves toward full build-out.
Multifamily rents at Electric Works
should be able to similarly compete
with or exceed rents Downtown and in
more established neighborhoods,
even before all phases of the
development are complete.

U4-14231.00 | 5/30/2018 | 23
GRANDVIEW YARD: LOCATIONTHE EXPANSION OF EXISTING DEVELOPMENT CORRIDORS CAN
BE SUCCESSFUL, EVEN WITH PHYSICAL BARRIERS
Source: Google Maps; RCLCO
Electric Works
Parkview Field
Downtown Fort Wayne
Electric Works; Fort Wayne
Grandview Yard
Arena District
Downtown Columbus
Short North
Grandview Yard; Columbus

U4-14231.00 | 5/30/2018 | 24
GRANDVIEW YARD: OFFICENEW OFFICE AT THE FRINGE OF DOWNTOWN CAN ACHIEVE THE
SAME POSITIONING AS SPACE DIRECTLY DOWNTOWN
Source: CoStar; RCLCO
92,000 209,000209,000 209,000
209,000284,000
641,000756,00022.1%
39.2%
26.8%24.2%
17.1%
20.8%
30.9% 30.6%
0.0%
5.0%
10.0%
15.0%
20.0%
25.0%
30.0%
35.0%
40.0%
0
500,000
1,000,000
1,500,000
2,000,000
2,500,000
3,000,000
3,500,000
4,000,000
2010 2011 2012 2013 2014 2015 2016 2017
Grandview Yard
Other Urban Columbus
Downtown Columbus
Grandview Yard Capture
Cumulative Capture of Urban Office Deliveries, 2010-2017;
Grandview Yard and Downtown Columbus
Historic Base Rents for Office Built After 2000, 2015-2017;
Grandview Yard and Downtown Columbus
$16.27 $16.28
$17.00
$15.72 $15.71
$16.23
$15.00
$15.50
$16.00
$16.50
$17.00
$17.50
2015 2016 2017
Grandview Yard Downtown Columbus

U4-14231.00 | 5/30/2018 | 25
GRANDVIEW YARD: RESIDENTIALNEW RENTAL APARTMENTS CAN COMPETE WITH COMPARABLE
PRODUCT IN MORE ESTABLISHED URBAN LOCATIONS
Source: CoStar; RCLCO
Price-To-Size Comparison of Buildings Built After 2010, March 2018;
Grandview Yard, Downtown, and Short North
$800
$1000
$1200
$1400
$1600
$1800
$2000
$2200
400 500 600 700 800 900 1,000 1,100 1,200 1,300 1,400
Downtown Short North Grandview Yard Other Columbus
Comparative Rent Characteristics for Properties Built After 2010, March 2018;
Grandview Yard, Downtown, and Short North
NEIGHBORHOOD AVG. RENT
AVG. UNIT
SIZE (SF)
AVG. RENT
PSF
Downtown $1,540 830 $1.86
Short North $1,465 810 $1.81
Grandview Yard $1,585 925 $1.71
City-Wide Average $1,345 905 $1.49
U4-14231.00 | 5/30/2018 | 26
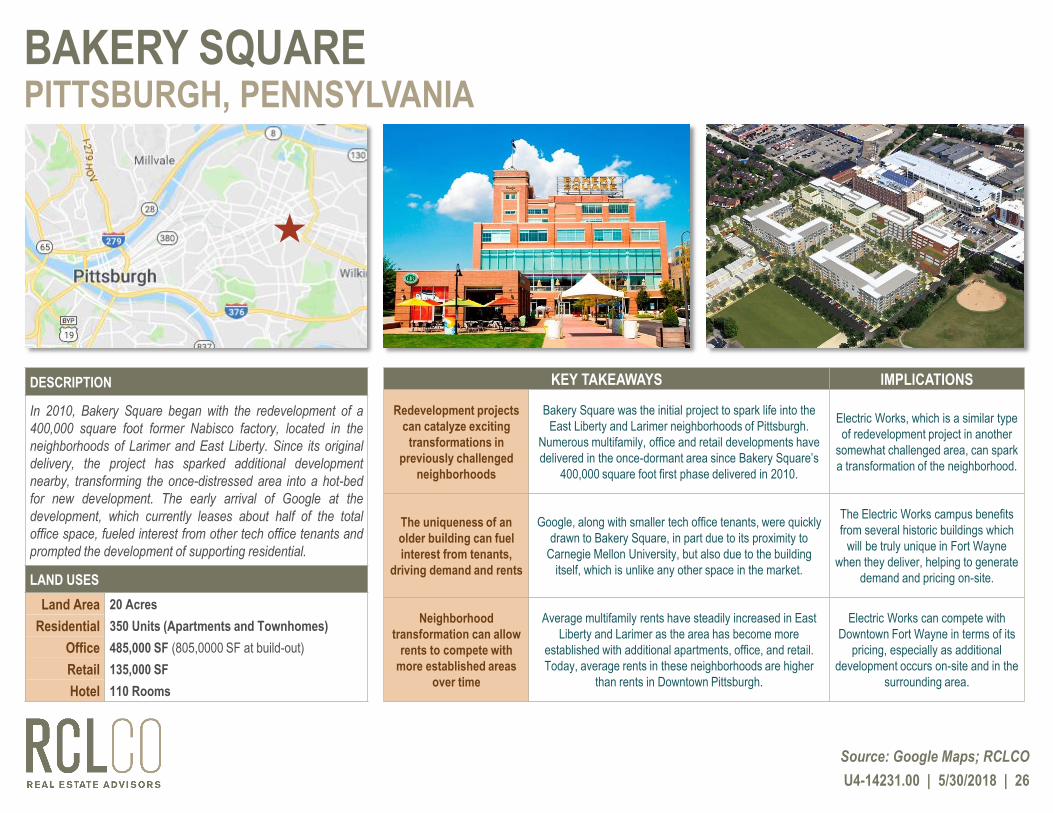
BAKERY SQUAREPITTSBURGH, PENNSYLVANIA
Source: Google Maps; RCLCO
DESCRIPTION
In 2010, Bakery Square began with the redevelopment of a
400,000 square foot former Nabisco factory, located in the
neighborhoods of Larimer and East Liberty. Since its original
delivery, the project has sparked additional development
nearby, transforming the once-distressed area into a hot-bed
for new development. The early arrival of Google at the
development, which currently leases about half of the total
office space, fueled interest from other tech office tenants and
prompted the development of supporting residential.
LAND USES
Land Area 20 Acres
Residential 350 Units (Apartments and Townhomes)
Office 485,000 SF (805,0000 SF at build-out)
Retail 135,000 SF
Hotel 110 Rooms
KEY TAKEAWAYS IMPLICATIONS
Redevelopment projects
can catalyze exciting
transformations in
previously challenged
neighborhoods
Bakery Square was the initial project to spark life into the
East Liberty and Larimer neighborhoods of Pittsburgh.
Numerous multifamily, office and retail developments have
delivered in the once-dormant area since Bakery Square’s
400,000 square foot first phase delivered in 2010.
Electric Works, which is a similar type
of redevelopment project in another
somewhat challenged area, can spark
a transformation of the neighborhood.
The uniqueness of an
older building can fuel
interest from tenants,
driving demand and rents
Google, along with smaller tech office tenants, were quickly
drawn to Bakery Square, in part due to its proximity to
Carnegie Mellon University, but also due to the building
itself, which is unlike any other space in the market.
The Electric Works campus benefits
from several historic buildings which
will be truly unique in Fort Wayne
when they deliver, helping to generate
demand and pricing on-site.
Neighborhood
transformation can allow
rents to compete with
more established areas
over time
Average multifamily rents have steadily increased in East
Liberty and Larimer as the area has become more
established with additional apartments, office, and retail.
Today, average rents in these neighborhoods are higher
than rents in Downtown Pittsburgh.
Electric Works can compete with
Downtown Fort Wayne in terms of its
pricing, especially as additional
development occurs on-site and in the
surrounding area.

U4-14231.00 | 5/30/2018 | 27
BAKERY SQUARE: REDEVELOPMENTREDEVELOPMENT PROJECTS CAN CATALYZE TRANSFORMATIONS
IN PREVIOUSLY CHALLENGED NEIGHBORHOODS
Source: Google Maps; RCLCO
Bakery Square
← Eastside Bond Apartments (2016)
Eastside Bond Apartments (2016) →
Walnut on Highland (2013) →
← Coda on Centre (Under Construction)
← Ollie at Baumhaus (Under Construction)
← Morrow Park City (2016)
LARIMER
EAST LIBERTY
Map of Bakery Square and Surrounding Development Projects;
Pittsburgh, Pennsylvania

U4-14231.00 | 5/30/2018 | 28
BAKERY SQUARE: COMMERCIALTHE UNIQUENESS OF AN OLDER BUILDING CAN FUEL INTEREST
FROM TENANTS, DRIVING DEMAND AND RENTS
Source: Walnut Capital; CoStar; RCLCO
Comparison of Office Rents, 2015-2017;
Bakery Square and Three Newest Buildings in Downtown Pittsburgh
$32.90 $32.50 $34.00
$40.00 $40.00 $40.30
$0.00
$10.00
$20.00
$30.00
$40.00
$50.00
2015 2016 2017
Downtown
Bakery Square
Comparison of Retail Rents, 2015-2017;
Bakery Square and Downtown Pittsburgh
$15.35$16.85
$21.43$22.40 $22.35 $25.00
$0.00
$5.00
$10.00
$15.00
$20.00
$25.00
$30.00
2015 2016 2017
Downtown
Bakery Square
CURRENT OFFICE AND RETAIL TENANTS:
• ANTHROPOLOGIE
• COFFEE TREE ROASTERS
• FREE PEOPLE
• JIMMY JOHN’S
• LEARNING EXPRESS TOYS
• MARRIOTT SPRINGHILL SUITES
• MASSAGE HEIGHTS
• PANERA BREAD
• RAGGED ROW
• UNIVERSITY OF PITTSBURGH MASTERS OF SCIENCE
IN PROSTHETICS AND ORTHOTICS PROGRAM
• UNIVERSITY OF PITTSBURGH ROAR LAB
• UNIVERSITY OF PITTSBURGH SCHOOL OF HEALTH
AND REHABILITATION SCIENCES
• UPMC TECHNOLOGY DEVELOPMENT CENTER
• LA FITNESS
• VERIZON FIOS
• CMU SOFTWARE ENGINEERING INSTITUTE
• NUANCE COMMUNICATIONS
• TIAA-CREF
• WEST ELM

U4-14231.00 | 5/30/2018 | 29
BAKERY SQUARE: RESIDENTIALNEIGHBORHOOD TRANSFORMATION CAN ALLOW RENTS TO
COMPETE WITH MORE ESTABLISHED AREAS OVER TIME
Source: CoStar; RCLCO
8.5% 8.5% 7.8% 7.7%9.0%
7.2%8.7%
10.9%
16.4% 16.1% 16.3%
0%
3%
6%
9%
12%
15%
18%
0
2,000
4,000
6,000
8,000
10,000
12,000
2007 2008 2009 2010 2011 2012 2013 2014 2015 2016 2017
Capture of M
etroC
umul
ativ
e D
eliv
erie
s (U
nits
)
Pittsburgh Metro Area (Excl. East Liberty/Larimer) East Liberty/Larimer Percent Deliveries East Liberty/Larimer
Phase 1 Phase 2
Cumulative Capture of New Rental Apartments, 2007-2018;
Pittsburgh Metropolitan Area
$1,6
52
$1,6
88
$1,7
12
$1,7
32
$1,6
87
$1,6
54
$1,6
45
$1,7
11
$1,6
24
$1,5
62
$1,6
98
$1,7
04
$1,7
14
$1,9
37
$1,8
04
$1,8
41
$1,9
26
$1,9
09
-5%
0%
5%
10%
15%
20%
25%
-$500
$0
$500
$1,000
$1,500
$2,000
$2,500
1Q 2014 3Q 2014 1Q 2015 3Q 2015 1Q 2016 3Q 2016 1Q 2017 3Q 2017 1Q 2018
Downtown Pittsburgh East Liberty/Larimer East Liberty/Larimer Preium
Comparison of Apartment Rents, 2014-2018;
Downtown Pittsburgh and East Liberty/Larimer

U4-14231.00 | 5/30/2018 | 30
HARBOR POINTSTAMFORD, CONNECTICUT
Source: Google Maps; RCLCO
DESCRIPTION
Harbor Point is one of the largest mixed-use development
projects in the country, with plans for of over 3 million square
feet of development on a 100 acre, former brownfield site,
located south of Downtown Stamford. While development is
still ongoing, it has already transformed the site and, due to its
scale, Stamford as a whole. Since its initial delivery in 2010,
the development has attained strong pricing, and most
properties are consistently well-occupied, even as additional
buildings continue to deliver on-site.
LAND USES
Land Area 100 Acres
Residential 2,980 Units (over 4,000 at build-out)
Office 405,000 SF (1.5 million SF at build-out)
Retail 237,000 SF
Hotel None
KEY TAKEAWAYS IMPLICATIONS
Effective redevelopment
of one major project can
have a catalytic impact on
market dynamics
Prior to its development, Harbor Point was largely vacant,
comprised of former industrial fields. Nevertheless, the
redevelopment of Harbor Point has completely changed the
landscape of the market, which has seen an uptick in
development and renewed interest in Downtown Stamford
Coupled with development already
occurring downtown, Electric Works
has a similar opportunity to reset the
market in Fort Wayne, by bringing a
new sense of energy to the area
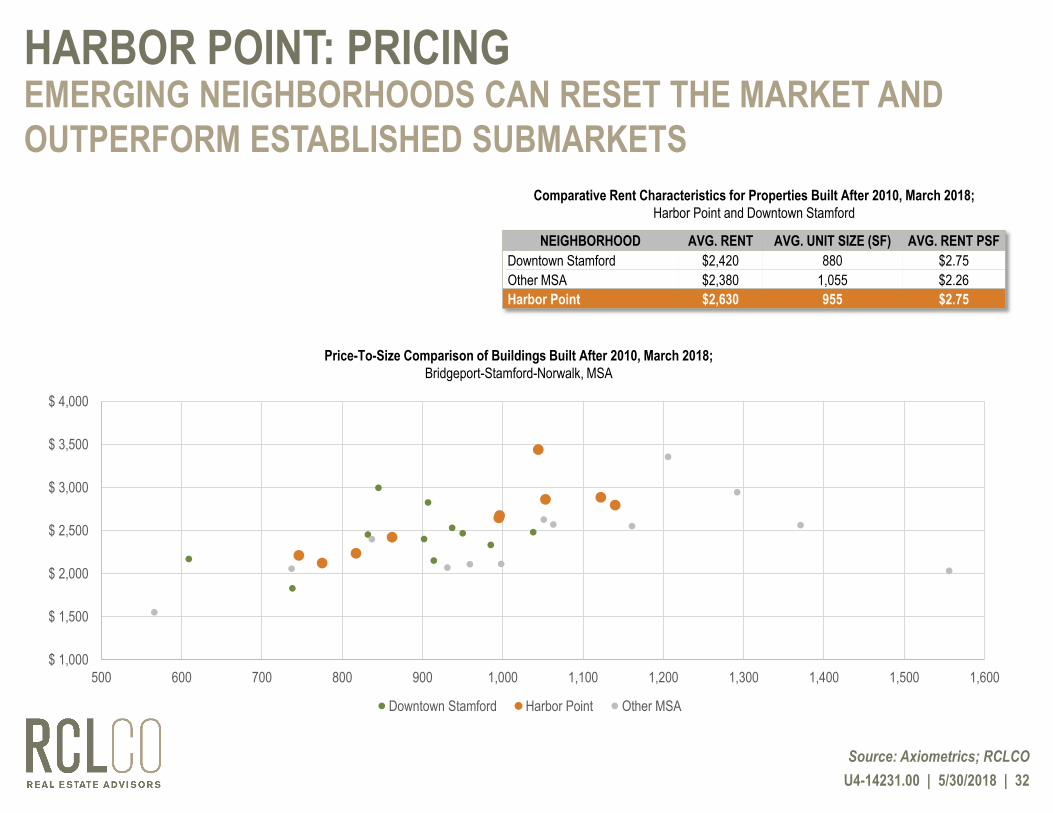
Emerging neighborhoods
can reset the market and
outperform established
submarkets
As a result of its rapidly developing sense of place, Harbor
Point is outperforming Downtown Stamford in terms of the
pricing of its apartment, office, and retail properties
Creating a clear sense of place will
create sizeable value for the project
and allow pricing to be competitive
with the rents at properties at the
center of Downtown Fort Wayne
New development outside
of established
submarkets can achieve a
sizeable capture of
demand
Harbor point has captured nearly 40% of all office deliveries
and nearly 30% of all multifamily deliveries in the entire
Stamford MSA since its initial delivery in 2010
Though smaller-scale than Harbor
Point, Electric Works can generate a
sizeable capture of new development
despite its location outside of an
established neighborhood

U4-14231.00 | 5/30/2018 | 31
HARBOR POINT: RESET THE MARKETEFFECTIVE REDEVELOPMENT OF ONE MAJOR PROJECT CAN
HAVE A CATALYTIC IMPACT ON MARKET DYNAMICS
Source: CoStar; RCLCO
Growth in Multifamily, Office, and Retail Square Footage, 2006-2018;
Select Cities in Connecticut
5% 7%2% 1%
13%
4% 1%0%
5%
10%
15%
20%
Stamford New Haven Bridgeport Waterbury
2006-2010 2010-2018 Growth
8%, Without
Harbor Point
16%, With
Harbor Point
GROWTH IN INVENTORY
CITY APARTMENT OFFICE RETAIL
Bridgeport 10% 1% 5%
New Haven 19% 19% 1%
Waterbury 0% 2% 3%
Stamford 39% (#1) 2% (#2) 4% (#2)
GROWTH IN RENTS
CITY APARTMENT OFFICE RETAIL
Bridgeport 16% -10% 9%
New Haven 16% 10% 2%
Waterbury 13% -1% 4%
Stamford 24% (#1) 4% (#2) 39% (#1)
Growth in Inventory and Rents, 2010-2018;
Select Cities in Connecticut
U4-14231.00 | 5/30/2018 | 32
HARBOR POINT: PRICINGEMERGING NEIGHBORHOODS CAN RESET THE MARKET AND
OUTPERFORM ESTABLISHED SUBMARKETS
Source: Axiometrics; RCLCO
Price-To-Size Comparison of Buildings Built After 2010, March 2018;
Bridgeport-Stamford-Norwalk, MSA
$ 1,000
$ 1,500
$ 2,000
$ 2,500
$ 3,000
$ 3,500
$ 4,000
500 600 700 800 900 1,000 1,100 1,200 1,300 1,400 1,500 1,600
Downtown Stamford Harbor Point Other MSA
NEIGHBORHOOD AVG. RENT AVG. UNIT SIZE (SF) AVG. RENT PSF
Downtown Stamford $2,420 880 $2.75
Other MSA $2,380 1,055 $2.26
Harbor Point $2,630 955 $2.75
Comparative Rent Characteristics for Properties Built After 2010, March 2018;
Harbor Point and Downtown Stamford

U4-14231.00 | 5/30/2018 | 33
HARBOR POINT: DEVELOPMENT CAPTURENEW DEVELOPMENT OUTSIDE OF ESTABLISHED SUBMARKETS
CAN ACHIEVE A SIZABLE CAPTURE OF DEMAND
Source: CoStar; RCLCO
Harbor Point Cumulative Capture of Retail SF Delivered, 2010-2018;
Bridgeport-Stamford-Norwalk MSA
35% 36%
27% 27%25%
20%18% 17% 17%
0%
5%
10%
15%
20%
25%
30%
35%
40%
0
200,000
400,000
600,000
800,000
1,000,000
1,200,000
1,400,000
1,600,000
2010 2011 2012 2013 2014 2015 2016 2017 2018
Other Stamford MSA Harbor Point % Capture
Harbor Point Cumulative Capture of Office SF Delivered, 2010-2018;
Bridgeport-Stamford-Norwalk MSA
52%
67%57% 56%
51%46%
39% 37% 37%
0%
20%
40%
60%
80%
0
200,000
400,000
600,000
800,000
1,000,000
1,200,000
2010 2011 2012 2013 2014 2015 2016 2017 2018
Other Stamford MSA Harbor Point % Capture
Harbor Point Cumulative Capture of Apartment Units Delivered, 2010-2018;
Bridgeport-Stamford-Norwalk MSA
79%
38%43%
37% 34% 30% 26% 25% 27%
0%
20%
40%
60%
80%
100%
0
2,000
4,000
6,000
8,000
10,000
12,000
2010 2011 2012 2013 2014 2015 2016 2017 2018
Other Stamford MSA Harbor Point % Capture

MARKET ANALYSIS

U4-14231.00 | 5/30/2018 | 35
OFFICE SUPPLYMOST DOWNTOWN BUILDINGS ARE OLDER BUT WELL-OCCUPIED
1 Currently Under Renovation
Source: CoStar; The Zacher Company; RCLCO
10%
11%
12%
13%
14%
15%
16%
17%
-1,000,000
-500,000
0
500,000
1,000,000
1,500,000
2,000,000
2,500,000
2013 2014 2015 2016 2017
Vacant SF Absorption SF Vacant %
KEY NAME YEAR SQ. FT. STORIES CLASS OCC.
CORPORATE URBAN
1 Ash Skyline Plaza 2016 116,600 6 A 100%
2 PNC Center 1970 246,346 26 A 97%
3 ATRIUM: Start Fort Wayne 1910 5,500
4 Indiana Michigan Power Center 1981 270,000 26 A 99%
5 Wells Fargo Indiana Center 1995 137,829 8 B 80%
6 Citizens Square 1978 267,000 5 A 100%
7 202 Metro 1974 1 123,400 8 A 52%1
CORPORATE SUBURBAN
8 Swiss RE 2010 80,302 3 stories A 100%
9 SDI Corporate Center 2000 50,000 2 stories A 100%
10 Dupont Office Center 1999-2001 187,633 3 buildings A/B 61%
10
89
1
2
4
563
7
Historic Vacancies and Absorption, 2013-2017;
Fort Wayne MSA
Office Competitive Set;
Fort Wayne MSA

U4-14231.00 | 5/30/2018 | 36
OFFICE POSITIONINGTOP OF MARKET, IN LINE WITH NEW AND RENOVATED PRODUCT
Source: RTM Ventures, LLC; Loopnet; CoStar; RCLCO
PNC Center
202 Metro*MG
1st Source Center
Lincoln Tower
927 S. Harrison
Street
IN/MI Power Center
Skyline Tower
229 W. Berry The Central
Building
130 W. Main Street*MN 111 E.
Wayne …
Star Financial Building*MN
347 W. Berry Street
Electric Works
$0
$5
$10
$15
$20
$25
$30
0 100,000 200,000 300,000
Fu
ll-S
ervi
ce R
ents
PS
F
Building Size (in SF)
Price-To-Size Comparison of Office Buildings, April 2018;
Downtown Fort Wayne
All lease rates Full Service unless:
*MN= modified net lease rate
*MG= modified gross lease rate

U4-14231.00 | 5/30/2018 | 37
OFFICE DEMAND
By analyzing employment patterns in the metropolitan area as a whole
and Downtown Fort Wayne in particular, RCLCO estimates there is
demand to support approximately 235,000 square feet of conventional
office and an additional 85,000 square feet of creative office by 2021,
when the first phase of Electric Works is expected to deliver.
Within the MSA, there already exists significant pent-up demand for new
office space in Downtown Fort Wayne. Going forward, future demand is
likely to come from:
► Regional Job Growth: As the job base in the Fort Wayne MSA
expands, many employers are likely to locate to or expand in
Downtown Fort Wayne.
► Churn from Suburbs: Employers in older, suburban spaces are
likely to look for newer and/or urban spaces when their leases turn
over.
DEMAND FOR ~650K SF OF DOWNTOWN OFFICE IN NEXT 5 YEARS
Source: RCLCO
Cumulative Demand for Conventional Office Space, 2018-2022;
Downtown Fort Wayne
138,600 170,600 202,900 235,600 268,700
0%
15%
30%
45%
60%
0
200,000
400,000
600,000
800,000
2018 2019 2020 2021 2022
Electric Works Other Downtown Fort Wayne
Electric Works Capture
PROJECTED
2013 2014 2015 2016 2017 2018 2019 2020 2021 2022 2023 2024 2025 2026 2027 2028 2029 2030
Entire MSA
Occupied Space 10,808,000 10,980,000 11,050,000 11,128,000 11,150,000 11,209,000 11,269,000 11,330,000 11,391,000 11,453,000 11,515,000 11,578,000 11,642,000 11,706,000 11,771,000 11,837,000 11,903,000 11,970,000
Vacancy Rate 16.6% 15.2% 14.4% 13.9% 14.0% 13.5% 13.1% 12.6% 12.1% 11.6% 11.2% 10.7% 10.2% 9.7% 9.5% 9.4% 9.4% 9.4%
Supported Additions 0 0 0 0 0 0 0 0 40,600 69,100 72,600 73,600 74,400
Downtown Fort Wayne
Occupied Space 5,088,000 5,017,000 4,962,000 4,983,000 5,073,000 5,158,000 5,245,000 5,332,000 5,420,000 5,510,000 5,600,000 5,691,000 5,784,000 5,877,000 5,972,000 6,067,000 6,164,000 6,261,000
Vacancy Rate 9.0% 8.8% 9.8% 9.2% 7.0% 5.4% 8.5% 8.5% 8.5% 8.5% 8.5% 8.5% 8.5% 8.5% 8.6% 8.6% 8.6% 8.6%
Supported Additions 277,200 95,900 97,000 98,200 99,300 100,300 101,600 102,600 103,800 104,900 106,000 107,200 108,300

U4-14231.00 | 5/30/2018 | 38
APARTMENT SUPPLYNEW DOWNTOWN BUILDINGS ARE PERFORMING VERY WELL
1 Not yet stabilized; still in lease-up or pre-leasing
Source: Axiometrics; CoStar; RCLCO
Competitive Set of New Rental Apartment Communities, 2018;
Fort Wayne, Indiana
MAP
KEYCOMMUNITY NAME
YEAR
BUILT
MARKET
UNITSOCC. RATE AVG SIZE (SF)
AVG
ASKING
RENT
AVG ASKING $/SF
1 Skyline Tower 2018 124 20%1 884 $1,363 $1.54
2 The Harrison 2013 43 100% 890 $1,360 $1.53
3 Cityscape Flats 2017 163 60%1 892 $1,233 $1.38
4 Superior Lofts 2018 72 N/A 988 $1,222 $1.24
5 Canal Flats 2016 204 85% 996 $1,045 $1.05
6 Centennial Highlands I 2017 153 88% 1,336 $1,460 $1.09
7 Williamsburg Village I 2017 158 92% 1,277 $1,364 $1.07

U4-14231.00 | 5/30/2018 | 39
APARTMENT POSITIONING & RECOMMENDED MIXIN LINE WITH EXISTING TOP-OF-MARKET COMMUNITIES
Source: Axiometrics; CoStar; RCLCO
Jr. 1BR
1BR
1BR+
2BR
3BR
$0
$500
$1,000
$1,500
$2,000
$2,500
500 600 700 800 900 1,000 1,100 1,200 1,300 1,400 1,500
Ask
ing
Ren
t
Unit Size (SF)
Subject Site
Skyline Tower
The Harrison
City Scape Flats
Superior Lofts
Canal Flats
Centennial Highlands I
Williamsburg Village I
UNIT TYPE UNITS MIX UNIT SIZE RANGE (SF) AVG. SIZE (SF) RENT RANGE AVG. RENT AVG. $/SFJr. 1BR 8 8.0% 550 - 600 575 $875 - $925 $900 $1.57
1BR 38 40.0% 650 - 800 725 $1,050 - $1,200 $1,125 $1.55
1BR+ 11 12.0% 850 - 950 900 $1,250 - $1,350 $1,300 $1.44
2BR 30 32.0% 1,000 - 1,100 1,050 $1,500 - $1,600 $1,550 $1.48
3BR 8 8.0% 1,200 - 1,300 1,250 $1,900 - $2,000 $1,950 $1.56
TOTAL/AVG. 94 100.0% 550 - 1,300 880 $875 - $2,000 $1,330 $1.51
Program Recommendations Relative to Competitive Rental Apartment Communities; 2018
Electric Works and Competitive Set

U4-14231.00 | 5/30/2018 | 40
APARTMENT DEMANDDEMAND FOR 700+ RENTAL APARTMENTS IN DOWNTOWN FORT
WAYNE IN THE NEXT FIVE YEARS; UP TO 250 AT ELECTRIC WORKS
Rental Apartment Demand; 2018-2030
Capture of Fort Wayne MSA
123 132 142 152 159 168 178 187 196 205 214 223 232
20%
35%
0%
5%
10%
15%
20%
25%
30%
35%
40%
0
100
200
300
400
500
600
700
800
2018 2019 2020 2021 2022 2023 2024 2025 2026 2027 2028 2029 2030
Central Fort Wayne Other Fort Wayne MSA Central Fort Wayne Capture
TIMING CAPTURE OF DOWNTOWN SITE DEMAND
Near-Term 2018-202025%
(One of four buildings)100 Units
Mid-Term 2021-202520%
(One of five buildings)170 Units
Long-Term 2026-203017%
(One of six buildings)180 Units
TOTAL 450 Units
Summary of Site Demand, 2018-2030
Electric Works

U4-14231.00 | 5/30/2018 | 41
APARTMENT SEGMENTATIONYOUNG PROFESSIONAL, POST-GRAD HOUSEHOLDS ACCOUNT
FOR MORE THAN HALF OF DEMAND FOR NEW UNITS
Source: RCLCO
2%
10%
4%
26%
11%
3%
8%
1%
3%
14%
7%
1%
8%
3%
0% 10% 20% 30% 40% 50% 60% 70%
Workforce
Market Rate
Luxury
Post-Grad Young Professional Family Mature Professional Empty Nester
Segmentation of Demand for New Rental Apartment Units, 2017-2022
Fort Wayne MSA

U4-14231.00 | 5/30/2018 | 42
RETAIL SUPPLYPEOPLE WHO LIVE IN DOWNTOWN FORT WAYNE MUST DRIVE 10-
15 MINUTES TO FULFILL MOST SHOPPING NEEDS
Source: CoStar; RCLCO
KEY PROPERTY NAME RETAIL GLA YEAR BUILT VACANCY
LIFESTYLE CENTER
1 Jefferson Pointe 600,000 2001 5.3%
2 Glenbrook Square 1,224,890 1966 0.0%
POWER CENTERS
3 Apple Glen Crossing 438,796 1992 3.0%
4 Northcrest Shopping Center 246,292 1988 1.5%
5 Coldwater Crossing 567,747 1988 1.3%
COMMUNITY CENTERS
6 Covington Plaza 182,866 1979 15.6%
7 Orchard Crossing 244,777 2008 2.7%
8 The Village Shoppes 280,331 2012 1.5%
NEIGHBORHOOD CENTERS
9 Lima Marketplace 100,461 2008 5.2%
10 Dupont Crossing 93,671 1987 5.1%
109
2 4
7
3
6
8
1 Primary
Market
Area
5
Regional Retail Destinations, 2018
Fort Wayne MSA

U4-14231.00 | 5/30/2018 | 43
RETAIL DEMAND
RCLCO projected the demand for various types of retail by
examining retail spending patterns by store type for four groups of
people, as well as the likelihood that those people would shop at the
subject site:
► PMA Households: Households living in the primary market
area. Electric Works’ capture rate of spending by this group is
estimated to be moderately high, given the lack of competitive
retail within the PMA.
► SMA Households: Households living in the secondary market
area, defined as the remainder of the MSA. This group is
assumed to have a lower capture, given the other options that
presently exist in the suburbs.
► Subject Site Households: Households living at the subject
site. This group is assumed to have a high capture rate, given
that it is likely they will shop disproportionately near their
homes.
► Subject Site Employees: People who will work at the subject
site. This group is assumed to have a high capture rate, given
the relative convenience of the retail.
DEMAND FOR 100,000+ SF OF RETAIL AT ELECTRIC WORKS
Source: Esri; RCLCO
TOTAL RETAIL SPACE DEMANDED
STORE TYPE 2017 2025
Grocery & Drug 46,900 50,150
Restaurant/Specialty Foods 29,400 31,700
Boutique Soft Goods 3,300 3,600
Home Goods 0 0
Florist/Gift/Hobby 2,800 3,050
Electronics 0 0
Beer/Wine/Specialty 3,300 3,400
Other 0 0
General Merchadise 14,500 15,700
+ Services 5,200 6,400
TOTAL DEMAND POTENTIAL 105,400 SF 114,000 SF
Grocery & Drug, 50,150 SF
Restaurant/Specialty Foods, 31,700 SF
Boutique Soft Goods,
3,600 SF
Florist/Gift/Hobby,
3,050 SF
Liquor, 3,400 SF
General Merchadise,
15,700 SF
Services, 6,400 SF
Demand for Retail, 2017-2030
Electric Works

AUSTIN LA ORLANDO DC
221 W 6th St
Suite 2030
Austin, TX 78701
11601 Wilshire Blvd
Suite 1650
Los Angeles, CA 90025
964 Lake Baldwin Ln
Suite 100
Orlando, FL 32814
7200 Wisconsin Ave
Suite 1110
Bethesda, MD 20814
Adam Ducker
Managing Director
P: (240) 644-0980
W: RCLCO.COM