strategic management of new products
TRANSCRIPT

International Journal of Market Research Vol. 55 Issue 2
289© 2013 The Market Research Society
DOI: 10.2501/IJMR-2013-024
Strategic management of new productsEx-ante simulation and market segmentation
Jae Young ChoiKorea Institute for Industrial Economics & Trade (KIET)Jungwoo Shin and Jongsu LeeSeoul National University
Among various methodologies for demand forecasting of new products, the random-coefficient discrete-choice model using stated preference data is considered to be effective because it reflects heterogeneity in consumer preference and enables the design of experiments in the absence of revealed-preference data . Based on estimates drawn from consumer preference data by structural hierarchical Bayesian logit models, this study develops the overall, strategic, demand-side management for new products by combining market share simulation and a rigorous clustering methodology, the Gaussian mixture model . It then applies the process to the empirical case of electronic payment instruments .
Introduction
Recent developments in the field of information technology (hereafter, IT) have brought rapid transformations in traditional industries, creating significant gains for businesses and consumers . This shift has led to a variety of new services and products appearing in the multimedia and financial industries . Despite their positive prospects as new growth industries, there are concerns that they might not be successful, as illustrated by the cases of iridium satellite phones (Coburn 2006) .
This changing market situation raises question about the factors that will most affect the success of new products and how their success can be achieved . Technological achievements will undoubtedly impact the adoption of new products, but consumer evaluations of them will also play a crucial role . In fact, economic research into consumer behaviour and the valuations associated with consumer adoption of new products are essential for market success .
Received (in revised form): 10 October 2011
Strategic management of new products
290
Researchers face scarcity of revealed-preference (hereafter, RP) data on products in current use, and no data relate to new products or products of the future . They are, therefore, unable to practically base predictions about products that will be most commonly used . Stated-preference data (hereafter, SP) not only allow the estimation of choice models in the absence of RP data but also enable researchers to design experiments that contain as much variation in each attribute as they deem appropriate (Train 2003) .
In particular, according to the report by Allenby et al . (2005), the latest improvements in estimation processes, such as the hierarchical Bayes, reinvigorate discrete choice models using SP data . The hierarchical Bayesian mixed logit model allows researchers to estimate the reliable random-coefficient discrete-choice models that can reflect heterogeneous consumer preferences and employ unrestricted substitution patterns among alternatives by assuming parameters with mixed distributions . In fact, despite requiring a computationally intensive simulation process, random-coefficient discrete-choice models estimate consumers’ demand for differentiated products under the most relaxed constraints .
Therefore, the availability of the reliable random-coefficient discrete-choice model can significantly improve traditional fixed-coefficient discrete-choice models by providing individual-level parameter estimates and making possible market share simulations under specific competition scenarios . In fact, by using SP data, many empirical studies on the demand of new products and services, such as those in the IT and biotechnology industries, have recently started using random-coefficient discrete-choice models . In particular, the mixed logit model is used for estimating consumer preferences on new products and simulating market share . That is, simulated choice probabilities of alternatives, based on imaginary competition scenarios and estimating results of individual-level preference estimates, are drawn from the parameter estimates of the mixed logit model by enumerating logit probability (Brownstone et al. 2000) .
However, the mixed logit model can lead to unrealistic results in forecasts of future market competition . Specifically, even though some alternatives are, strictly speaking, worse than others, the choice probability of the poor alternative can still carry a high value in the simulation . In addition, the mixed logit model cannot explain the reasons consumer preferences are heterogeneous, and it only reveals the mean and standard deviation of the estimates . Therefore, previous market-share simulation approaches based on the estimated results of mixed logit model using SP data has limitation to provide sufficient information on consumer heterogeneity for target marketing or product differentiation .

International Journal of Market Research Vol. 55 Issue 2
291
A previous approach for the market segmentation of new products, based on the estimated results of utility function using SP data, also had a significant flaw in estimating consumers’ utility function . It separately estimated the utility function of each individual with ordinary least squares, using his or her rate data on the experimental alternatives . Results of most estimates were statistically insignificant and meaningless (Green & Krieger 1991) . Even in clustering, the number of differentiated products should be predefined if the researchers have adopted K-means clustering for market segmentation .
This study aims to develop an integrated strategic demand-side management process for new products, which reflects certain major concerns . It does this through modified simulations and a rigorous clustering methodology based on the stringent estimation process of the consumer utility function (see Figure 1) .
First, for the exact demand forecasts of new products, the utility function should reflect the heterogeneous preference structure of consumers .
Figure 1 Components of strategic management processes of new products in demand side and their roles
Re�ecting heterogeneousconsumers’ preference
Market sharesimulations
Technological factors + non-technological factors
Strategic demand-side management ofnew product/technology
Other competingalternatives
Marketsegmentation
E�ective and �exibleclustering
Success of new product/technology
Estimation of consumers’utility function 1st step
2nd/3rd step
Simulationresults
Parameter estimatesParameter estimates
Strategic management of new products
292
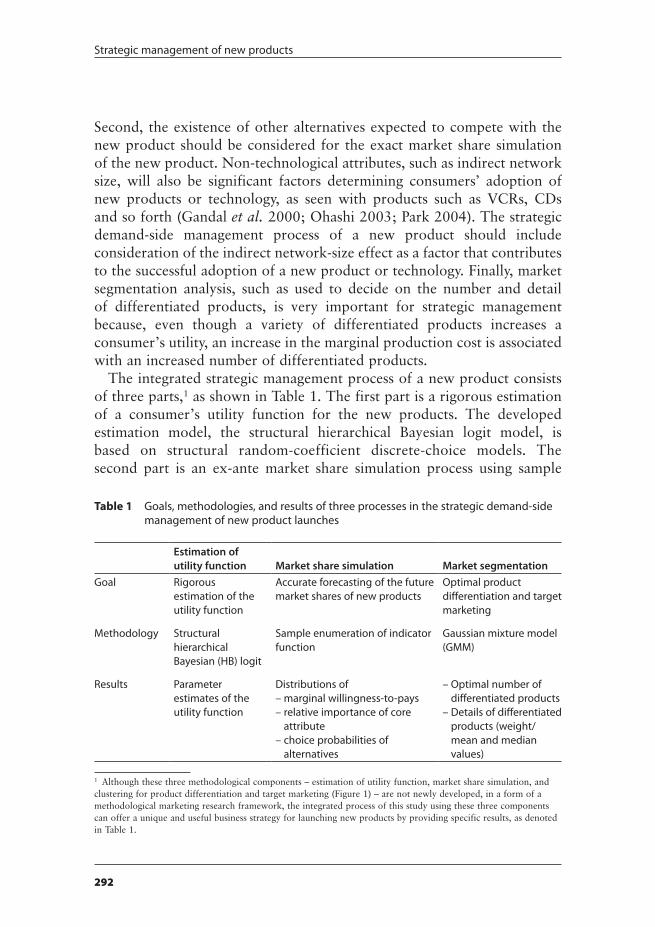
Second, the existence of other alternatives expected to compete with the new product should be considered for the exact market share simulation of the new product . Non-technological attributes, such as indirect network size, will also be significant factors determining consumers’ adoption of new products or technology, as seen with products such as VCRs, CDs and so forth (Gandal et al. 2000; Ohashi 2003; Park 2004) . The strategic demand-side management process of a new product should include consideration of the indirect network-size effect as a factor that contributes to the successful adoption of a new product or technology . Finally, market segmentation analysis, such as used to decide on the number and detail of differentiated products, is very important for strategic management because, even though a variety of differentiated products increases a consumer’s utility, an increase in the marginal production cost is associated with an increased number of differentiated products .
The integrated strategic management process of a new product consists of three parts,1 as shown in Table 1 . The first part is a rigorous estimation of a consumer’s utility function for the new products . The developed estimation model, the structural hierarchical Bayesian logit model, is based on structural random-coefficient discrete-choice models . The second part is an ex-ante market share simulation process using sample
1 Although these three methodological components – estimation of utility function, market share simulation, and clustering for product differentiation and target marketing (Figure 1) – are not newly developed, in a form of a methodological marketing research framework, the integrated process of this study using these three components can offer a unique and useful business strategy for launching new products by providing specific results, as denoted in Table 1 .
Table 1 Goals, methodologies, and results of three processes in the strategic demand-side management of new product launches
Estimation of utility function Market share simulation Market segmentation
Goal Rigorous estimation of the utility function
Accurate forecasting of the future market shares of new products
Optimal product differentiation and target marketing
Methodology Structural hierarchical Bayesian (HB) logit
Sample enumeration of indicator function
Gaussian mixture model (GMM)
Results Parameter estimates of the utility function
Distributions of – marginal willingness-to-pays– relative importance of core
attribute– choice probabilities of
alternatives
– Optimal number of differentiated products
– Details of differentiated products (weight/mean and median values)
International Journal of Market Research Vol. 55 Issue 2
293
enumeration method under various scenarios, which use individual-level preference estimates drawn from the random-coefficient discrete-choice model . The final part is market segmentation that uses simulated results and socio-demographic variables . The Gaussian mixture model, one of the most rigorous clustering methodologies, is used for effective product differentiation and target marketing .
This paper is organised as follows . Starting with a short introduction to the integrated model’s overall processes, the model specifications of all three parts are explained . The following section explores the demand for electronic payment instruments by applying this integrated process . The market simulation and segmentation results are explained before the concluding remarks .
Model specifications
Many earlier studies attempted to forecast the demand for new differentiated products using SP data that had been collected as a representative sample by conjoint questionnaires . Some of these studies conducted market share simulations by sample enumerations of logit probability based on estimates of utility function, while others used unsupervised clustering analysis for post hoc market segmentation . Each of these approaches has limits in terms of implications, methodologies or theoretical backgrounds .
As shown in Figure 2, this study suggests an integrated strategic demand-side management process for new products, which includes both market share simulations and clustering analysis for market segmentation based on estimates of the structural hierarchical Bayesian logit model,2 the specification of which can systematically explain individuals’ heterogeneity . Specifically, the structural hierarchical Bayesian logit model estimates the parameters of structural utility function G and W . Second, in the simulation part, using preference data of individual n, which are generated from the estimated parameters of the utility function, it is possible to simulate not only basic estimate values that can be used to deduce policy or managerial implications, such as individual marginal willingness-to-pay (hereafter, MWTP), but also the future market share of alternatives under specific competition scenarios . Finally, at the market segmentation stage, using the
2 Although the structural hierarchical Bayesian logit model in this paper is based on the concepts of Allenby and Lenk’s (1994) hierarchical Bayesian model, the details of the model specification and estimation process are slightly different . Allenby and Lenk’s (1994) hierarchical Bayesian model assumes enj has iid . normal distribution N(0,s2) and uses logit probability or probit probability only for generating respondents’ profile evaluations . However, the structural hierarchical Bayesian logit model in this study assumes enj has iid type I extreme value distribution just as Train’s (2003) mixed logit model .

Strategic management of new products
294
Figu
re 2
Sch
emat
ic d
iagr
am o
f int
egra
ted
proc
esse
s fo
r dem
and
fore
cast
ing
of a
new
pro
duct
usi
ng S
P da
ta
Baye
sian
mix
ed lo
git
Stru
ctur
al h
iera
rchi
cal
Baye
sian
logi
t
Esti
mat
ion
of u
tilit
y fu
ncti
on
Re�e
ctin
g he
tero
gene
ous
pref
eren
ce
Indi
vidu
al n
’s st
ated
pre
fere
nce
data
Indi
vidu
al n
’s so
cio-
dem
ogra
phic
varia
ble
Opt
imal
num
ber o
f clu
ster
s: K
Det
ails
of c
lust
ers
(clu
ster
siz
e (π
k))m
ean/
med
ian
valu
e
Mar
ket s
egm
enta
tion
Re�e
ctin
g e�
cien
t pro
duct
di�
eren
tiat
ion
Cons
truc
tda
ta s
etfo
r clu
ster
ing
Clas
sify
ing
new
con
sum
ers
Sam
ple
enum
erat
ion-
indi
cato
r fu
nctio
n
Fore
cast
ing
mar
ket s
hare
Re�e
ctin
g al
tern
ativ
e te
chno
logi
es
Des
igni
ngco
mpe
titio
n sc
enar
ios
M
WTP
nq
P nj o
r I(U
nj >
Uni
∀j ≠
i)
(Rel
ativ
e im
port
ance
of a
ttrib
utes
) n
Gau
ssia
nm
ixtu
rem
odel
Clus
terin
g pr
oces
s
Sim
ulat
ion
proc
ess
C(β n)
β n = Γ
z n + ζ
n
β n ~ N
(b,W
)
Unj
= C
(βn)′
x j + ε nj
ζ n ~ N
orm
al(0
,W)
Gen
erat
e in
divi
dual
n’s
pref
eren
ce
data
Γ,W
C(β n)
b,W

International Journal of Market Research Vol. 55 Issue 2
295
aggregated data set that consists of the individual-level simulation data and individual socio-demographic information, it is possible to reveal the optimal number of clusters with detailed information, such as the weight as well as the mean and median values of the cluster, through the Gaussian mixture model . Furthermore, the classification of new customers is also possible via their socio-demographic information .
The first part is a rigorous estimation of a consumer’s utility function for the new products . The developed estimation model, the structural hierarchical Bayesian logit model, is based on structural random-coefficient discrete-choice models that can accommodate heteroskedasticity of consumer preferences .
The utility of individual n, based on alternatives j, can be denoted as Unj in the following equations:
U V x p snj n nj n j nj p j s j njn n= + = ′ + = ′ + ′ +ε β ε β β ε (1)
where xj denotes the vector of attributes associated with alternative j; βn shows the vector of the attributes’ coefficients, which are distributed as multivariate normal with Gzn mean and variance covariance matrix W, βn ∼ N(Gzn,W) . zn represents vectors of variables that explain heterogeneity as cross-unit differences typically postulated as demographic variables, such as gender and age . Specifically, when zn = 1 for all respondents, the coefficients of zn denote the fixed-effects coefficients that are the common part-worth estimates across all respondents; enj is a random disturbance having a logistic distribution; sj is the vector of the attributes associated with alternative j except the price variable .
According to Train and Sonnier (2005), researchers can postulate the type of parameter distributions (the distributions of attribute coefficients) based on the characteristics of the attributes that influence consumer utility . Although traditionally set to normal, the parameter distributions for attributes that are liked or disliked by all customers are set as log-normal . In particular, the price variable parameter is generally assumed to follow a log-normal distribution, bounded above by zero . In addition, for the parameters of attributes that some customers do not care about, it is far more suitable to use a setting of normal, censored from below at zero or censored from above at zero .
Consequently, a utility function with an observed part with linear parameters can be denoted after transformation of the distribution of βn from a normal distribution to a log-normal or censored normal distribution as seen in equation (2) . Thus, the overall choice probability of

Strategic management of new products
296
the structural hierarchical Bayesian logit model can be specified as shown in equation (3) .
U V C x C p C snj n nj n j nj p j s j njn n= + = ′ + = ′ + ′ +ε β ε β β ε( ) ( ) ( ) (2)
P L W de
eW dnj nj n n
C x
C x
k
k J n n
n j
n k
� = ( ) = ( )∫∑
∫′
′
=
=φ β β φ β ββ
β
Γ Γ, ,( )
( )
1
(3)
To elicit more and precise information from each respondent, this study asked each individual to rank the alternatives in order of preference among J alternatives in each of T choice sets . Then the likelihood function of the individual was substituted as follows in equation (4):
L r W L r W d
e
e
n n n n n
C x
C x
k j
k J
n nkt
n nkt
( , ) ,( )
( )
Γ Γ= ( ) ( )=
∫
∑
′
′
=
=
β φ β ββ
βjj
J
t
T
n nW d=
−
=∏∏∫ ( )
1
1
1
φ β βΓ, (4)
where rn = {rn1t,…rnJt} is the vector of ranking responses of individual n in choice set t, in descending order of preference . T is the total number of choice sets .
For estimating parameters of the utility function, this study employed a Bayesian estimation process instead of a traditional maximum likelihood estimation (hereafter, MLE) method . The Bayesian estimation varies from the MLE in that it does not carry the computational burden associated with the integration of multivariate (normal) density functions . The Markov chain Gibbs sampler is especially useful to avoid direct evaluation of the posterior density . The specifications of the Markov chain Monte Carlo, which consists of three steps, are denoted in equations (5)–(7) .
Γ W n,β (5)
W nβ ,Γ (6)
βn WΓ, (7)
International Journal of Market Research Vol. 55 Issue 2
297
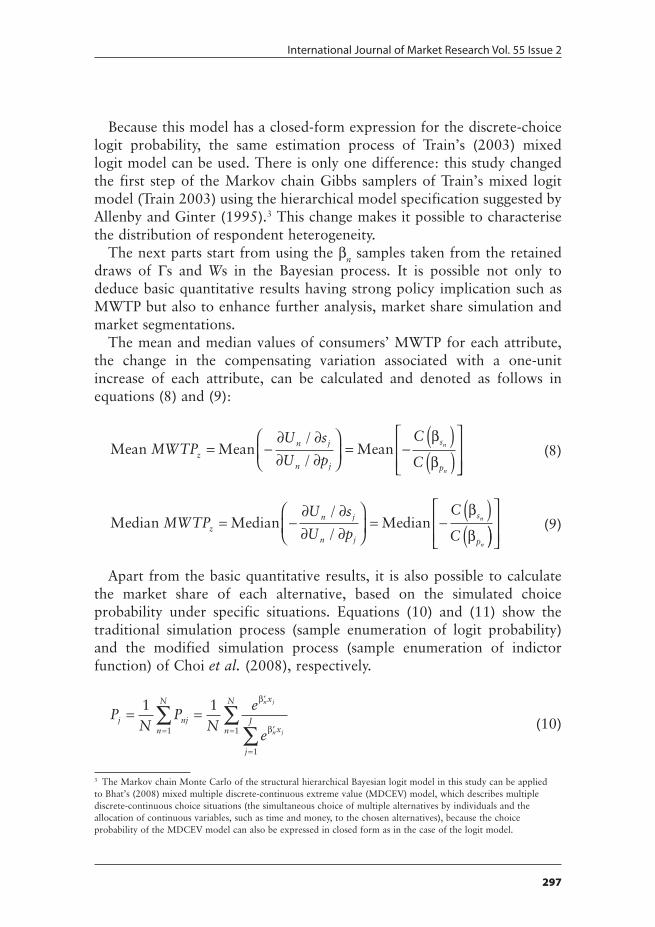
Because this model has a closed-form expression for the discrete-choice logit probability, the same estimation process of Train’s (2003) mixed logit model can be used . There is only one difference: this study changed the first step of the Markov chain Gibbs samplers of Train’s mixed logit model (Train 2003) using the hierarchical model specification suggested by Allenby and Ginter (1995) .3 This change makes it possible to characterise the distribution of respondent heterogeneity .
The next parts start from using the βn samples taken from the retained draws of Gs and Ws in the Bayesian process . It is possible not only to deduce basic quantitative results having strong policy implication such as MWTP but also to enhance further analysis, market share simulation and market segmentations .
The mean and median values of consumers’ MWTP for each attribute, the change in the compensating variation associated with a one-unit increase of each attribute, can be calculated and denoted as follows in equations (8) and (9):
Mean Mean MeanMWTPU s
U p
C
Cz
n j
n j
s
p
n
n
= −∂ ∂∂ ∂
= −
( )( )
/
/
β
β (8)
Median Median MedianMWTPU s
U p
C
Cz
n j
n j
s
p
n
n
= −∂ ∂∂ ∂
= −
( )(
/
/
β
β ))
(9)
Apart from the basic quantitative results, it is also possible to calculate the market share of each alternative, based on the simulated choice probability under specific situations . Equations (10) and (11) show the traditional simulation process (sample enumeration of logit probability) and the modified simulation process (sample enumeration of indictor function) of Choi et al. (2008), respectively .
PN
PN
e
ej nj
n
N x
x
j
Jn
N n j
n j
= ==
′
′
=
=∑
∑∑1 1
1
1
1
β
β (10)
3 The Markov chain Monte Carlo of the structural hierarchical Bayesian logit model in this study can be applied to Bhat’s (2008) mixed multiple discrete-continuous extreme value (MDCEV) model, which describes multiple discrete-continuous choice situations (the simultaneous choice of multiple alternatives by individuals and the allocation of continuous variables, such as time and money, to the chosen alternatives), because the choice probability of the MDCEV model can also be expressed in closed form as in the case of the logit model .

Strategic management of new products
298
PN
I U U j i
NI C x C x j i
jn
N
nj ni
n j nj n i ni
= > ∀ ≠( )
= ′ + > ′ + ∀ ≠
=∑1
11
( ) ( )β ε β ε =
∑n
N
1
(11)
where I(·) is the indicator function, equalling 1 when the expression in parentheses is true and 0 otherwise . That is, I(·) is 1 only when alternative j provides the greatest utility to individual n .
This study also employed the Gaussian mixture model, a representative probabilistic clustering model with a minimum description length (hereafter, MDL) criterion for market segmentation analysis . Even though learning the Gaussian mixture model parameters generally requires a computationally extensive process, the expectation maximisation algorithm, it presents distinct advantages over competing non-probabilistic approaches, such as the K-means algorithm and hierarchical clustering . Specifically, the Gaussian mixture model allows uncertainty in cluster membership (overlapping among clusters) and variability within each cluster by enabling an estimate of the optimal number of clusters through adoption of penalty terms, such as the Akaike information criterion (hereafter, AIC) and MDL criterion . According to Bouman et al . (2005), the MDL criterion can overcome the limitations of the AIC criterion – that is, more data tend to result in over-fitting of the model by generally guaranteeing a consistent estimator .
Thus, the objective of the Gaussian mixture model in this study is to find out the model order C and q = (p, m, W), which will minimise the MDL criterion shown in equation (12):
MDL C p y C L NM
p y c
y
y x n cc
C
n n
( , ) log , log( )
log ,
θ θ
θ π
= − ( ) +
= − ( )
=∑
12
1
+
=∑n
N
L NM1
12
log( ) (12)
where L = C(1 + M + [{M + 1}M/2]) – 1; pc denotes the probability that an observation is in cluster c (i .e . weight of cluster); mc and Wc denote the mean vector and covariance matrix for cluster c respectively . p, m and W denote the parameter sets that describe all clusters .

International Journal of Market Research Vol. 55 Issue 2
299
Empirical study
Introduction
One way to help accelerate a market economy’s evolution is to adopt increasingly efficient payment systems . Such systems facilitate trade and exchange among both firms and consumers in product markets . When transaction payments are made efficiently and with less risk, financial markets are deeper and more liquid . The payment medium is most efficient when the transaction costs of an economic exchange are low .
Payment costs are commonly believed to be negligibly low . In fact, according to Hancock and Humphrey (1998), payment costs account for more than 5% of the value of an average consumer’s purchases, and the total cost of a country’s payment system may account for as much as 3% of the value of its gross domestic product . However, advances in IT allow for dramatically lower transaction costs . Specifically, the cost of electronic payments is usually only one-third to one-half of paper-based transactions (Robinson & Flatraaker 1995) . Thus, many countries are altering the current structure of payment systems and, in some cases, new electronic payment instruments have already been adopted . The adoption of new payment instruments, such as the integrated circuit (hereafter, IC) cards, still faces hurdles in terms of infrastructure installation costs, and the possibility of serious social consequences . Any new payment instrument will be designed to prevent the divulging of private information as such a breach could cause havoc for the owner because of the valuable private information contained in some such instruments .
For the purposes of this empirical study, the concept of an electronic payment instrument is narrowed to offline card-based instruments classified according to two criteria: the technology applied to the instrument and the granting of credit .
In terms of the technology applied to the payment instrument, offline card-based instruments can be categorised by magnetic or IC cards . Magnetic cards, which store information in a magnetic strip, are widely used because they are relatively inexpensive to fabricate and issue . However, their simple fabrication process makes them vulnerable to forgery or counterfeiting . The IC card, developed to overcome the security weaknesses inherent in a magnetic card and to increase consumer convenience, features ten times the memory of regular cards, as well as a stronger and more advanced security system . In particular, due to its remote activation system, which uses a radio frequency chip, the contactless IC card has increased access time, which refers to the time

Strategic management of new products
300
lag from the moment the consumer enters the transaction, the price data of a good or service is checked, and the completion of the transaction . However, the IC card has not been widely and actively adopted because the issuing cost is 20 times higher than that of a magnetic card, and the costs of installing IC card readers are astronomical . Moreover, even if the risk of private information being divulged through forgery or counterfeiting is only 1 in 10,000, the damage to the card’s owner would be irrecoverable and catastrophic because the IC card contains significantly more valuable private information than the magnetic card . The private information on a contactless IC card is more vulnerable than that on the contact IC card, because the contactless card is activated remotely – that is, an illegal radio frequency reader can extract private information during a cashing-access period .
Offline card-based instruments can also be categorised into credit and debit cards . A credit card owner can settle an account through a credit line, normally about one month after the date of purchase . A debit card, meanwhile, does not grant credit to the card owner, and settlement occurs at the time of the purchase of a product or service . The debit card owner can settle the account only from an account balance from which the money is transferred immediately after the purchase . A cheque card, a kind of offline card-based instrument recently introduced in South Korea, can be categorised as a debit card, although it is typically issued by credit card companies, because it does not grant credit and the account is settled instantly . The criteria used in this paper to differentiate a credit card from a debit card may not coincide exactly with those used in other research .
Survey and data
Many studies for estimating the utility function of consumers in differentiated new product markets use SP data normally obtained by conjoint surveys . Through the conjoint survey, respondents rank certain options from hypothetical alternatives that feature various combinations of goods and service attributes . This type of survey has some major advantages in terms of enabling researchers to estimate consumers’ preferences for non-existing alternatives and avoiding co-linearity among the core attributes . Specifically, it allows researchers to conduct freely designed experiments that contain the level of variation in each attribute as the researchers deem appropriate . It has therefore been applied widely in a variety of research fields, including marketing (Huber & Train 2001), environmental economics (Roe et al. 1996; Layton 2000; Alvarez-Farizo &

International Journal of Market Research Vol. 55 Issue 2
301
Hanley 2002), health care (Ryan 1999; Sapede & Girod 2002; Bowditch et al. 2003) and transportation research (Hensher 2001), and now even in new high-tech applied items and services such as IT products (Batt & Katz 1997; Kim et al. 2004) and IT services (Byun et al . 2004; Ahn et al . 2006; Kim et al . 2006) .
For data acquisition, Dongseo Research conducted conjoint surveys in August 2005 in Seoul, South Korea, among 500 adult respondents aged between 20 and 60 years . A set of attributes and their levels were created for the survey, and alternative cards were composed that depicted various kinds of payment instrument . The following attributes were chosen as the core attributes of a payment instrument: possibility of private information being divulged (hereafter, PID), access time, carrying charge, infrastructure, credit line and type of payment instrument . An explanation of the attributes and levels used in the survey can be found in Table 2 . In particular, please note that this study uses the South Korea monetary unit, which is the Korean won (hereafter, KRW) .
Table 2 Attributes and attribute levels of payment instruments
Attribute Explanation LevelCarrying charge (1,000 KRW/year)
The cost paid for carrying the card, excluding settlement funds
0, 10, 30
Credit line (million KRW/month)
An arrangement in which a bank or vendor extends unsecured credit to a borrower for a specified time; in this study, a credit line of zero means the consumer cannot execute a settlement unless there is a balance in his/her account (e.g. cash, cheque, and debit card each have zero credit lines)
0, 1
Infrastructure (%) Rate at which stores accept the chosen instrument for payment (based on the assumption that cash has 100% infrastructure)
60, 80, 100
Possibility of private information being divulged (%)
Possibility per transaction that private information will be divulged
0, 1, 5
Access time (seconds) Duration of obtaining cashing: time lag from the moment the consumer enters the point of transaction and checks the price of a good or service to the completion of the transaction
1, 15, 60
Type of payment instrument Other characteristics of payment instruments except the five core attributes chosen in this study
Cash, cheque, magnetic card, IC card

Strategic management of new products
302
The number of alternative cards that can be derived from the theoretical combinations of the six attributes (i .e . 3 × 3 × 3 × 2 × 4 × 3 = 648) is quite large, so a fractional factorial design test was conducted to reduce the number of alternative cards to 32 . Those 32 alternative cards were then divided into eight sub-alternative card sets, based on the tendency of respondents to evaluate the low-ranking alternatives in a trivial manner . Respondents were therefore asked to rank each of the four cards eight times .
Results and discussion
As noted in the section on model specifications, this study assumed the type of distribution of each attribute coefficient by considering the attribute characteristics affecting consumer preference . The coefficients of carrying charge, credit line, infrastructure, PID and access time were assumed to have a log-normal distribution because these features are liked or disliked by all customers . In this paper, the signs of the coefficients of carrying charge, PID and access time were set as negative because they are considered undesirable . The coefficients of the other attributes are assumed to have a normal distribution . Of particular note, cash (a type of payment instrument) was set as the base attribute level to estimate the dummy variable coefficient .
While conducting Bayesian estimation, this study generated 20,000 draws by Gibbs sampling while conducting the Bayesian estimation . The first 10,000 draws were considered a burn-in period and were therefore discarded . Every tenth draw from the remaining 10,000 draws was retained .
Using the 1,000 retained draws of Gs and Ws along with the respondents’ socio-demographic variable, zn, another 500 draws of βn were taken from a normal distribution with the Gzn (different across individual) and the variance equal to the value of W . Each draw of βn was then transformed to obtain a draw of coefficients C(βn) . As can be seen in Table 3, which denotes the related parameter estimates to the three chosen demographic variables (gender, age and household income), 11 coefficient estimates are statistically different from 0 at the 1% level .
Results show that older respondents and those with high household incomes are less concerned about high carrying charges . Regarding credit lines, older respondents and those with high household incomes placed less value on the existence of a credit line . With regard to infrastructure, female, older respondents and those with high household incomes put less

International Journal of Market Research Vol. 55 Issue 2
303
value on the high infrastructure of payment instruments . Older respondents were less concerned about the high possibility of private information being divulged . Finally, female, older respondents, and those with high household incomes cared less about long access times . Although these results describe the heterogeneity of consumers, the estimates themselves are not enough to design specific or realistic strategies for optimal market segmentation .
Market share simulations among off-line payment instruments
Apart from the fundamental estimates, other quantitative figures that have strong policy or economic implications can be deduced using the βn samples taken from the retained draws of Gs and Ws (see empirical model section) . Using the βn, the MWTP distribution for each attribute can be obtained from the aggregation of the MWTP values from each person, which were obtained via the estimated coefficients .
As seen in Table 4, the simulated mean (median) MWTP estimates per year for the four core attributes (credit line, infrastructure, PID and access time) are 8,094 KRW (1,834 KRW), 13,764 KRW/% (2,804 KRW/%), 14,255 KRW/% (326 KRW/%) and 2,378 KRW/% (603 KRW/%), respectively .4
As noted in the introductory part of the empirical study section, in terms of the technology and settlement type applied, future offline payment
4 The figures in the parentheses refer to median MWTP estimates per year .
Table 3 Parameter estimates of the structural hierarchical Bayesian logit model (posterior mean)
Variable
Demographic variables
Gender (female) Age (years)Monthly household income
(100,00 KRW/house)Carrying charge –0.06845 –0.08416*** –0.01053***Credit line –0.39346 –0.07673*** –0.00859***Infrastructure –0.54876*** –0.06352*** –0.00883***Possibility of private information being divulged (PID)
–0.60700 –0.08357*** –0.01360
Access time (AT) –1.21804*** –0.11571*** –0.00674***Cheque 0.00455 0.00016 –0.00003Magnetic card 0.00364 0.00003 0.00002IC card 0.00323 0.00021 –0.00002
*** Denotes statistically different from zero at the 1% level (i.e. 99% posterior probability interval excludes zero)

Strategic management of new products
304
instruments can generally be classified as one of the following five types: cash, magnetic credit card, magnetic debit card, IC credit card and IC debit card . Although the exact levels of each attribute are difficult to predict directly, they can be estimated for each alternative by examining the available information . Table 5 shows how these payment instruments compare in terms of core attributes .
First, this study assumes that the alternatives with credit lines (i .e . credit cards) have an additional carrying charge of 5,000 KRW (US$4 .86) (based on the average annual carrying charge of magnetic credit cards in the survey) . Second, based on the current issuing costs of IC cards, the two
Table 4 Mean and median marginal willingness to pay (MWTP) of the four core attributes
Attribute Mean MWTP Median MWTPCredit line 8,094 KRW
(US$7.87)1,834 KRW (US$1.78)
Infrastructure 13,764 KRW/% (US$13.39/%)
2,804 KRW/% (US$2.73/%)
Possibility of private information being divulged (PID) 14,255 KRW/% (US$13.87/%)
326 KRW/% (US$0.32/%)
Access time (AT) 2,378 KRW/% (US$2.31/%)
603 KRW/% (US$0.59/%)
Note: According to the Bank of Korea (www.bok.or.kr), 1 US$ was equal to approximately 1,028 Korean won (KRW) at the time of the survey (August 2005)
Table 5 Core attribute levels of offline payment instruments
Variable
Alternative levels of available offline payment instruments
CashMagnetic
credit cardMagnetic debit card
IC credit card
IC debit card
Carrying charge (1,000 KRW/year) 0 5 0 6 1Credit line (million KRW/month) 0 1 0 1 0Infrastructure (%) 100 70 70 70 (10~100) 70 (10~100)Possibility of private information being divulged (PID) (%)
0 10 10 0 (0~10) 0 (0~10)
Access time (AT) (sec) 60 60 60 30 (1~60) 30 (1~60)Cheque 0 0 0 0 0Magnetic card 0 1 1 0 0IC card 0 0 0 1 1
Note: Bold figures denote the basic attributes’ levels of alternatives and figures in parentheses refer to the ranges of variable attributes’ level
International Journal of Market Research Vol. 55 Issue 2
305
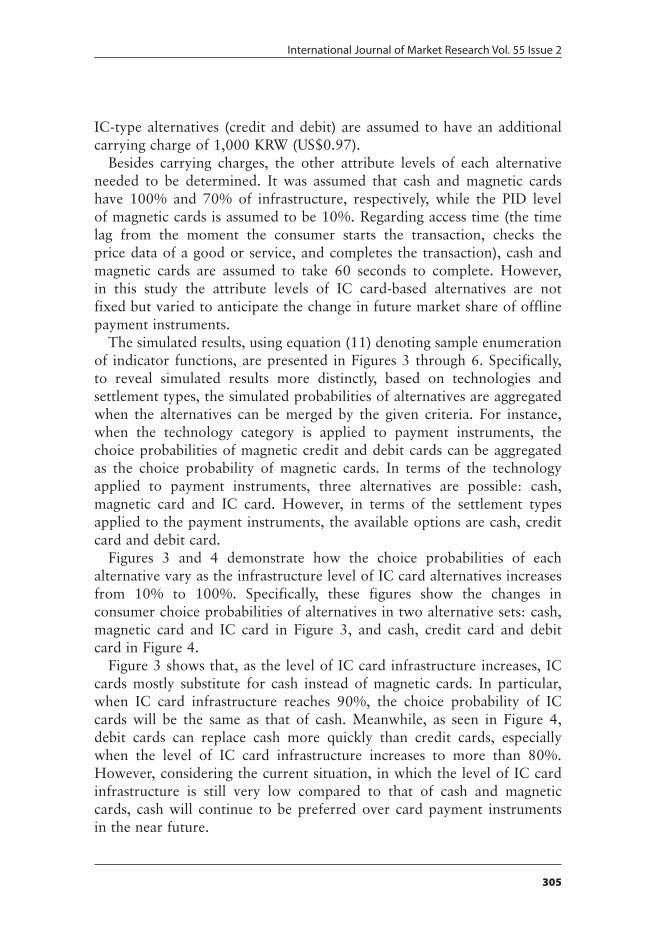
IC-type alternatives (credit and debit) are assumed to have an additional carrying charge of 1,000 KRW (US$0 .97) .
Besides carrying charges, the other attribute levels of each alternative needed to be determined . It was assumed that cash and magnetic cards have 100% and 70% of infrastructure, respectively, while the PID level of magnetic cards is assumed to be 10% . Regarding access time (the time lag from the moment the consumer starts the transaction, checks the price data of a good or service, and completes the transaction), cash and magnetic cards are assumed to take 60 seconds to complete . However, in this study the attribute levels of IC card-based alternatives are not fixed but varied to anticipate the change in future market share of offline payment instruments .
The simulated results, using equation (11) denoting sample enumeration of indicator functions, are presented in Figures 3 through 6 . Specifically, to reveal simulated results more distinctly, based on technologies and settlement types, the simulated probabilities of alternatives are aggregated when the alternatives can be merged by the given criteria . For instance, when the technology category is applied to payment instruments, the choice probabilities of magnetic credit and debit cards can be aggregated as the choice probability of magnetic cards . In terms of the technology applied to payment instruments, three alternatives are possible: cash, magnetic card and IC card . However, in terms of the settlement types applied to the payment instruments, the available options are cash, credit card and debit card .
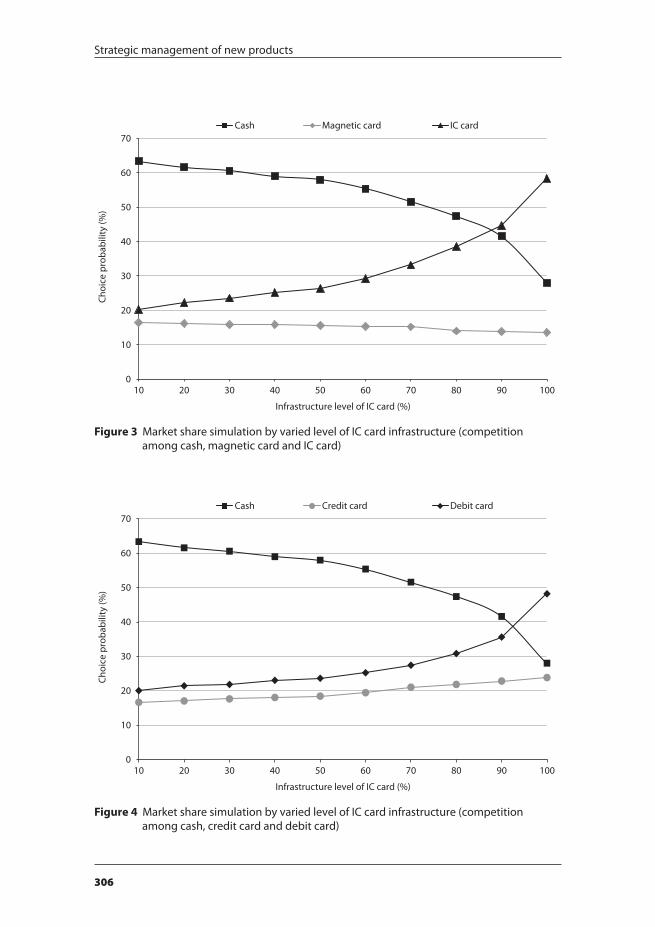
Figures 3 and 4 demonstrate how the choice probabilities of each alternative vary as the infrastructure level of IC card alternatives increases from 10% to 100% . Specifically, these figures show the changes in consumer choice probabilities of alternatives in two alternative sets: cash, magnetic card and IC card in Figure 3, and cash, credit card and debit card in Figure 4 .
Figure 3 shows that, as the level of IC card infrastructure increases, IC cards mostly substitute for cash instead of magnetic cards . In particular, when IC card infrastructure reaches 90%, the choice probability of IC cards will be the same as that of cash . Meanwhile, as seen in Figure 4, debit cards can replace cash more quickly than credit cards, especially when the level of IC card infrastructure increases to more than 80% . However, considering the current situation, in which the level of IC card infrastructure is still very low compared to that of cash and magnetic cards, cash will continue to be preferred over card payment instruments in the near future .
Strategic management of new products
306
Figure 3 Market share simulation by varied level of IC card infrastructure (competition among cash, magnetic card and IC card)
0
10
20
30
40
50
60
70
10 20 30 40 50 60 70 80 90 100
Choi
ce p
roba
bilit
y (%
)
Infrastructure level of IC card (%)
Cash Magnetic card IC card
Figure 4 Market share simulation by varied level of IC card infrastructure (competition among cash, credit card and debit card)
0
10
20
30
40
50
60
70
10 20 30 40 50 60 70 80 90 100
Choi
ce p
roba
bilit
y (%
)
Infrastructure level of IC card (%)
Cash Credit card Debit card

International Journal of Market Research Vol. 55 Issue 2
307
Figure 5 shows changes in the market shares of each alternative set as the IC card PID level varies from 0% to 10% . Even though the IC card perfectly prevents private information from being divulged – that is, the level of possibility of private information being divulged is set to zero – more than one-half of consumers still prefer cash to other card payment instruments, including IC cards .
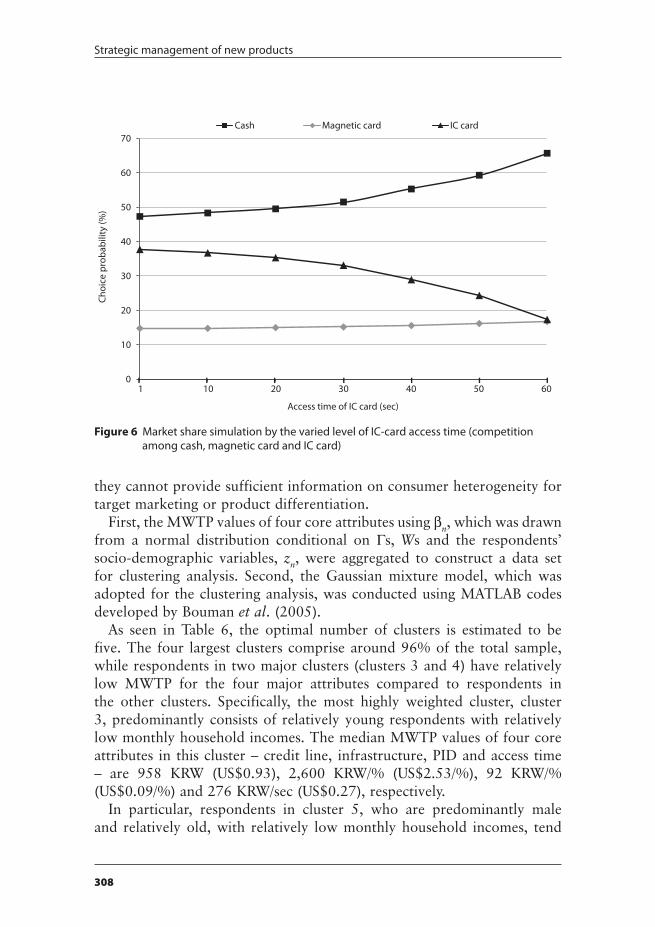
Figure 6 shows changes in the market shares of each alternative, set as the level of IC card access time, which varies from 1 to 60 seconds . As with the results of PID, almost 50% of consumers still prefer cash over card payment instruments, including the IC card, despite the IC card requiring almost no time to access . If the IC card does not provide any advantage in shortening time to access compared to the magnetic card, the choice probability of the IC card is nearly the same as that of the magnetic card .
Market segmentation using simulated results and relevant socio-demographic variables
The simulated mean or median values of the attributes’ MWTP and the mean choice probabilities of alternatives generally represent attributes’ MWTP values and choice probabilities of consumer alternatives . However,
Figure 5 Market share simulation by varied IC-card PID level (competition among cash, magnetic card and IC card)
0
10
20
30
40
50
60
70
Choi
ce p
roba
bilit
y (%
)
Possibility of private information being divulged (PID) of IC card (%)
Cash Magnetic card IC card
0 2 4 6 8 10
Strategic management of new products
308
they cannot provide sufficient information on consumer heterogeneity for target marketing or product differentiation .
First, the MWTP values of four core attributes using βn, which was drawn from a normal distribution conditional on Gs, Ws and the respondents’ socio-demographic variables, zn, were aggregated to construct a data set for clustering analysis . Second, the Gaussian mixture model, which was adopted for the clustering analysis, was conducted using MATLAB codes developed by Bouman et al . (2005) .
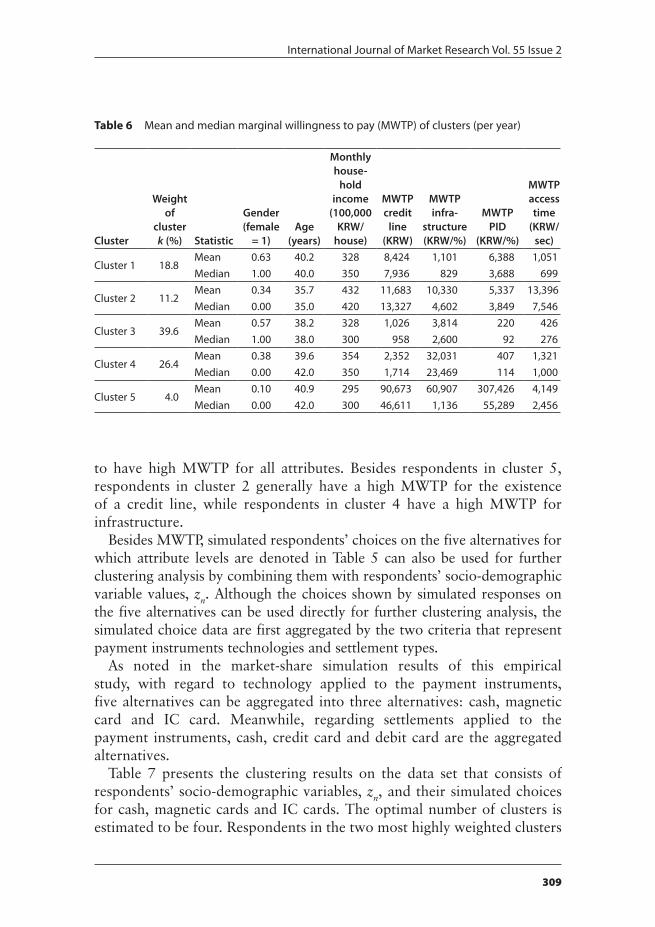
As seen in Table 6, the optimal number of clusters is estimated to be five . The four largest clusters comprise around 96% of the total sample, while respondents in two major clusters (clusters 3 and 4) have relatively low MWTP for the four major attributes compared to respondents in the other clusters . Specifically, the most highly weighted cluster, cluster 3, predominantly consists of relatively young respondents with relatively low monthly household incomes . The median MWTP values of four core attributes in this cluster – credit line, infrastructure, PID and access time – are 958 KRW (US$0 .93), 2,600 KRW/% (US$2 .53/%), 92 KRW/% (US$0 .09/%) and 276 KRW/sec (US$0 .27), respectively .
In particular, respondents in cluster 5, who are predominantly male and relatively old, with relatively low monthly household incomes, tend
Figure 6 Market share simulation by the varied level of IC-card access time (competition among cash, magnetic card and IC card)
0
10
20
30
40
50
60
70
Choi
ce p
roba
bilit
y (%
)
Access time of IC card (sec)
Cash Magnetic card IC card
1 10 20 30 40 6050
International Journal of Market Research Vol. 55 Issue 2
309
to have high MWTP for all attributes . Besides respondents in cluster 5, respondents in cluster 2 generally have a high MWTP for the existence of a credit line, while respondents in cluster 4 have a high MWTP for infrastructure .
Besides MWTP, simulated respondents’ choices on the five alternatives for which attribute levels are denoted in Table 5 can also be used for further clustering analysis by combining them with respondents’ socio-demographic variable values, zn . Although the choices shown by simulated responses on the five alternatives can be used directly for further clustering analysis, the simulated choice data are first aggregated by the two criteria that represent payment instruments technologies and settlement types .
As noted in the market-share simulation results of this empirical study, with regard to technology applied to the payment instruments, five alternatives can be aggregated into three alternatives: cash, magnetic card and IC card . Meanwhile, regarding settlements applied to the payment instruments, cash, credit card and debit card are the aggregated alternatives .
Table 7 presents the clustering results on the data set that consists of respondents’ socio-demographic variables, zn, and their simulated choices for cash, magnetic cards and IC cards . The optimal number of clusters is estimated to be four . Respondents in the two most highly weighted clusters
Table 6 Mean and median marginal willingness to pay (MWTP) of clusters (per year)
Cluster
Weight of
cluster k (%) Statistic
Gender (female
= 1)Age
(years)
Monthly house-
hold income
(100,000 KRW/
house)
MWTP credit
line (KRW)
MWTP infra-
structure (KRW/%)
MWTP PID
(KRW/%)
MWTP access time
(KRW/sec)
Cluster 1 18.8Mean 0.63 40.2 328 8,424 1,101 6,388 1,051Median 1.00 40.0 350 7,936 829 3,688 699
Cluster 2 11.2Mean 0.34 35.7 432 11,683 10,330 5,337 13,396Median 0.00 35.0 420 13,327 4,602 3,849 7,546
Cluster 3 39.6Mean 0.57 38.2 328 1,026 3,814 220 426Median 1.00 38.0 300 958 2,600 92 276
Cluster 4 26.4Mean 0.38 39.6 354 2,352 32,031 407 1,321Median 0.00 42.0 350 1,714 23,469 114 1,000
Cluster 5 4.0Mean 0.10 40.9 295 90,673 60,907 307,426 4,149Median 0.00 42.0 300 46,611 1,136 55,289 2,456

Strategic management of new products
310
(clusters 1 and 4), which make up 51 .6% of the total sample, chose cash as their preferred payment instrument . Respondents in clusters 2 (15 .2% of the total sample) and 3 (33 .2% of the total sample) rate magnetic card and IC card as their favourite payment instruments, respectively . Specifically, respondents who favour cash tend to be relatively young (37–39 years) and have relatively low monthly household income (3 million–3 .2 million KRW, US$2,918–3,112) . Respondents who are relatively old (46–49 years) and have relatively high monthly household income (4 million–4 .1 million KRW, US$3,891–3,988), however, indicated that magnetic cards were their preferred payment instrument . In an interesting result, the IC card is generally favoured by the respondents characterised by average age and household income .
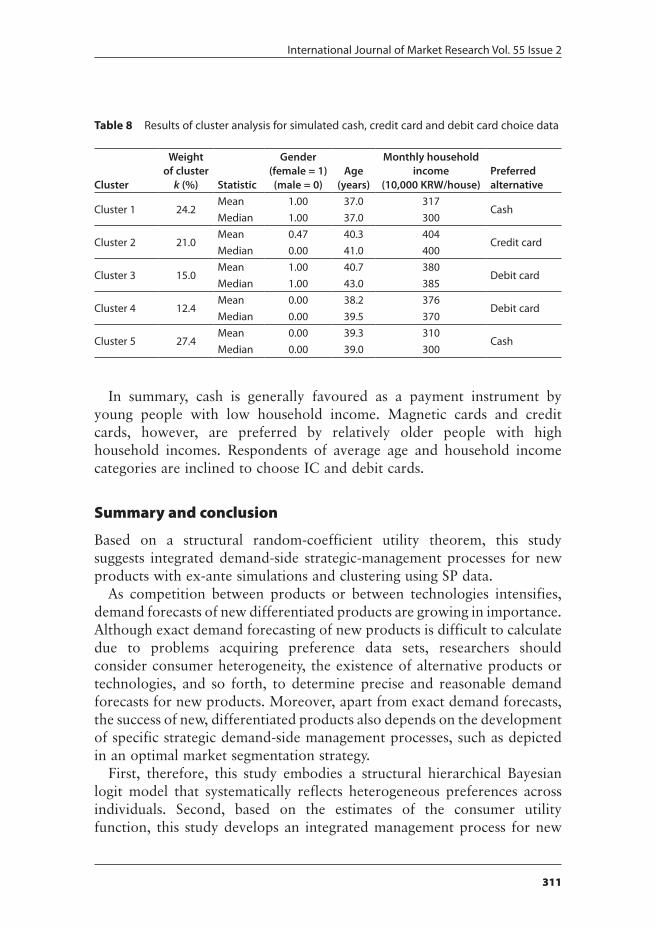
Table 8 shows the clustering results on the data set that includes respondents’ socio-demographic variables, zn, and their simulated choice results on cash, credit cards and debit cards . The optimal number of clusters is estimated to be five . The respondents in the two largest clusters (clusters 1 and 5), which comprise 51 .6% of the total sample, chose cash as their preferred payment instrument . Respondents in clusters 2 – which comprises 21% of the total sample – 3 and 4, which make up 27 .4% of the total sample, rate credit and debit cards as their favourite payment instruments, respectively . Specifically, the respondents who favour cash are relatively young (37–39 years) and have relatively low monthly household incomes (3 million–3 .2 million KRW, US$2,918–3,112) . Respondents who are relatively old, however (41–43 years), and have relatively high monthly household incomes (4 million–4 .1 million KRW, US$3,891–3,988) rate credit cards as their preferred payment instruments . Debit cards are generally favoured by respondents of average age and household income .
Table 7 Results of cluster analysis for simulated cash, magnetic card and IC card choice data
Cluster
Weight of cluster k (%) Statistic
Gender (female = 1) (male = 0)
Age (years)
Monthly household income
(10,000 KRW/house)Preferred alternative
Cluster 1 24.2Mean 1.00 37.0 317
CashMedian 1.00 37.0 300
Cluster 2 15.2Mean 0.55 45.7 411
Magnetic cardMedian 1.00 48.5 400
Cluster 3 33.2Mean 0.49 37.3 380
IC cardMedian 0.00 38.5 375
Cluster 4 27.4Mean 0.00 39.3 310
CashMedian 0.00 39.0 300
International Journal of Market Research Vol. 55 Issue 2
311
In summary, cash is generally favoured as a payment instrument by young people with low household income . Magnetic cards and credit cards, however, are preferred by relatively older people with high household incomes . Respondents of average age and household income categories are inclined to choose IC and debit cards .
Summary and conclusion
Based on a structural random-coefficient utility theorem, this study suggests integrated demand-side strategic-management processes for new products with ex-ante simulations and clustering using SP data .
As competition between products or between technologies intensifies, demand forecasts of new differentiated products are growing in importance . Although exact demand forecasting of new products is difficult to calculate due to problems acquiring preference data sets, researchers should consider consumer heterogeneity, the existence of alternative products or technologies, and so forth, to determine precise and reasonable demand forecasts for new products . Moreover, apart from exact demand forecasts, the success of new, differentiated products also depends on the development of specific strategic demand-side management processes, such as depicted in an optimal market segmentation strategy .
First, therefore, this study embodies a structural hierarchical Bayesian logit model that systematically reflects heterogeneous preferences across individuals . Second, based on the estimates of the consumer utility function, this study develops an integrated management process for new
Table 8 Results of cluster analysis for simulated cash, credit card and debit card choice data
Cluster
Weight of cluster k (%) Statistic
Gender (female = 1) (male = 0)
Age (years)
Monthly household income
(10,000 KRW/house)Preferred alternative
Cluster 1 24.2Mean 1.00 37.0 317
CashMedian 1.00 37.0 300
Cluster 2 21.0Mean 0.47 40.3 404
Credit cardMedian 0.00 41.0 400
Cluster 3 15.0Mean 1.00 40.7 380
Debit cardMedian 1.00 43.0 385
Cluster 4 12.4Mean 0.00 38.2 376
Debit cardMedian 0.00 39.5 370
Cluster 5 27.4Mean 0.00 39.3 310
CashMedian 0.00 39.0 300

Strategic management of new products
312
demand-side products by using market share simulation and a rigorous clustering methodology, the Gaussian mixture model . This approach enables specific management strategies for new differentiated products in the demand side with regard to increased market share and the market segmentation to be established, such as the optimal number of differentiated products and their representative level of attributes .
To specify the results and outcomes of suggested integrated strategic- management processes for new products, an empirical study on the demand of electronic payment instruments was implemented . Results show that the integrated-process demand forecasting of a new product is expected to be a useful methodology for establishing strategies for the success of the new product as well as for understanding consumer behaviour .
Apart from demand forecasting for new products, this methodology can be applied to any subject in which conjoint analysis is used, such as the fields of marketing, health care, environment economics, and so forth . Moreover, by changing the research perspective from the private to public sector, the methodology can be applied to studies of government policies related to the management of new technologies or public goods for which no RP data exist .
Although the integrated process introduced herein is powerful and useful for understanding respondent behaviour towards new products, and for establishing strategies, it also has a few drawbacks and limitations . Too many parameters need to be estimated, and the strategies drawn from the results of the methodology used in this study should be interpreted as the response of the demand side .
In short, the methodology suggested in this study is an integrated strategic management process that combines the three following processes: a structural hierarchical Bayesian logit model, various simulation methods that start with the estimation of a utility function, and the rigorous clustering methodology . The method presented in this study can help company decision makers and government officials to make informed decisions .
Acknowledgement
This paper is a summarised version of Jae Young Choi’s unpublished doctoral dissertation .
ReferencesAhn, J ., Lee, J ., Lee, J .D . & Kim, T .Y . (2006) An analysis of consumer preferences among
wireless LAN and mobile internet services . ETRI Journal, 28, 2, pp . 205–215 .
International Journal of Market Research Vol. 55 Issue 2
313
Allenby, G .M . & Ginter, J .L . (1995) Using extremes to design products and segment markets . Journal of Marketing Research, 32, 4, pp . 392–403 .
Allenby, G .M . & Lenk, P .J . (1994) Modeling household purchase behavior with logistic normal regression . Journal of the American Statistical Association, 89, 428, pp . 1218–1231 .
Allenby, G .M ., Fennell, G ., Huber, J ., Eagle, T ., Gilbride, T ., Horsky, D ., Kim, J ., Lenk, P ., Johnson, R ., Ofek, E ., Orme, B ., Otter, T . & Walker, J . (2005) Adjusting choice models to better predict market behavior . Marketing Letters, 6, 3, pp . 197–208 .
Alvarez-Farizo, B . & Hanley, N . (2002) Using conjoint analysis to quantify public preferences over environmental impacts of wind farms . Energy Policy, 30, 2, pp . 107–116 .
Batt, C .E . & Katz, J .E . (1997) A conjoint model of enhanced voice mail services: implications for new service development and forecasting . Telecommunications Policy, 21, 8, pp . 743–760 .
Bhat, C .R . (2008) The multiple discrete-continuous extreme value (MDCEV) model: role of utility function parameters, identification considerations, and model extensions . Transportation Research Part B, 42, 3, pp . 274–303 .
Bouman, C .A ., Shapiro, M ., Cook, G .W ., Atkins, C .B ., Cheng, H ., Jennifer, G . & Borman, S . (2005) Cluster: An Unsupervised Algorithm for Modeling Gaussian Mixtures . West Lafayette, IN: School of Electrical Engineering, Purdue University .
Bowditch, A ., Gurrieri, G . & Henry, B . (2003) The use of combined conjoint approaches to improve market share predictions . International Journal of Market Research, 45, 3, pp . 389–404 .
Brownstone, D ., Bunch, D .S . & Train, K . (2000) Joint mixed logit models of stated and revealed preferences for alternative-fuel vehicles . Transportation Research Part B: Methodological, 34, 5, pp . 315–338 .
Byun, S .K ., Lee, J ., Lee, J .D . & Ahn, J . (2004) Korean wireless data communication markets and consumer technology . In Cooper, R . & Madden, G . (eds) Frontiers of Broadband, Electronic, and Mobile Commerce . New York, NY: Physica-Verlag, pp . 149–164 .
Choi, J .Y ., Koh, D . & Lee, J . (2008) Ex-ante simulation of mobile TV market based on consumers’ preference data . Technological Forecasting and Social Change, 75, pp . 1043–1053 .
Coburn, P . (2006) The Change Function: Why Some Technologies Take Off and Others Crash and Burn . New York, NY: Penguin Portfolio .
Gandal, N ., Kende, M . & Rob, R . (2000) The dynamics of technological adoption in hardware/software systems: the case of compact disc players . Rand Journal of Economics, 31, 1, pp . 43–61 .
Green, P .E . & Krieger, A .M . (1991) Segmenting markets with conjoint analysis . Journal of Marketing, 55, 4, pp . 20–31 .
Hancock, D . & Humphrey, D .B . (1998) Payment transactions, instruments, and systems: a survey . Journal of Banking and Finance, 21, 11–12, pp . 1573–1624 .
Hensher, D .A . (2001) The valuation of commuter travel time savings for car drivers: evaluating alternative model specifications . Transportation, 28, 1, pp . 101–118 .
Huber, J . & Train, K . (2001) On the similarity of classical and Bayesian estimates of individual mean partworths . Marketing Letters, 12, 3, pp . 257–267 .
Kim, Y ., Lee, J .D . & Koh, D . (2004) Effects of consumer preference on the convergence of mobile telecommunications devices . Applied Economics, 37, 7, pp . 817–826 .
Kim, Y ., Park, Y ., Lee, J .D . & Lee, J . (2006) Using stated-preference data to measure the inconvenience cost of spam among Korean e-mail users . Applied Economics Letter, 13, 12, pp . 795–800 .
Layton, D .F . (2000) Random coefficient models for stated preference surveys . Journal of Environmental Economics and Management, 40, 1, pp . 21–36 .
Ohashi, H . (2003) The role of network effects in the US VCR market, 1978–1986 . Journal of Economics and Management Strategies, 12, 4, pp . 447–494 .

Strategic management of new products
314
Park, S . (2004) Quantitative analysis of network externalities in competing technologies: the VCR case . Review of Economics and Statistics, 86, 4, pp . 937–945 .
Robinson, P . & Flatraaker, D . (1995) Costs in the payments system . Norges Bank Economic Bulletin, 66, 2, pp . 207–216 .
Roe, B ., Boyle, K .J . & Teisl, M .F . (1996) Using conjoint analysis to derive estimates of compensating variation . Journal of Environmental Economics and Management, 31, 2, pp . 145–159 .
Ryan, M . (1999) Using conjoint analysis to take account of patient preferences and go beyond health outcomes: an application to in-vitro fertilization . Social Science and Medicine, 48, 4, pp . 535–546 .
Sapede, C . & Girod, I . (2002) Willingness of adults in Europe to pay for a new vaccine: the application of discrete choice-based conjoint analysis . International Journal of Market Research, 44, 4, pp . 463–476 .
Train, K . (2003) Discrete Choice Method with Simulation . Cambridge, UK: Cambridge University Press .
Train, K . & Sonnier, G . (2005) Mixed logit with bounded distribution of partworths . In Scarpa, R . & Alberini, A . (eds) Applications of Simulation Methods in Environmental and Resource Economics . Dordrecht, The Netherlands: Springer, pp . 117–134 .
About the authors
Dr Jae Young Choi is an associate research fellow of the Korea Institute for Industrial Economics & Trade (KIET), Korea . His current research interests lie both in econometric modelling and empirical studies regarding R&D management and the IT industry .
Dr Jungwoo Shin is a senior researcher at the Seoul National University Engineering Research Institute . He received his PhD from the Technology Management, Economics, and Policy Program at Seoul National University in 2012 . His research activities focus on the consumer decision making process, demand forecasting of new technologies and services, economic impacts of new products from emerging sectors, and economic modelling .
Dr Jongsu Lee is an associate professor of the Department of Industrial Engineering and Technology Management, Economics, and Policy Program at Seoul National University . His research interests include demand forecasting for new technologies/products/services and related methodologies such as discrete choice models, diffusion models and time series .
Address correspondence to: Jae Young Choi, Center for Industrial Economics & Policy Studies, Korea Institute for Industrial Economics and Trade (KIET), 66, Hoegiro, Dongdaemun-gu, Seoul, 130-742, South Korea .
E-mail: boogalooaz@gmail .com

Copyright of International Journal of Market Research is the property of Warc LTD and its content may not be
copied or emailed to multiple sites or posted to a listserv without the copyright holder's express written
permission. However, users may print, download, or email articles for individual use.