strategic issues in long term care - etouches plan to transform the ontario health care system ......
TRANSCRIPT
Strategic Issues in Long Term Care
Colin Preyra, PhD
OLTCA Quality Forum June 13, 2013

Strategic Issues in Long Term Care
2
1. Funding Reform and Integrated Care
2. Quality: Measurement, Reporting and Improvement
3. Improving Case Mix Measurement
4. Future Service Mix in LTC Homes
• Role of Supportive Housing
• Short Stay
• LTC role in Redressing HBAM Service Variance
• End of Life Care
5. Regional and Home Characteristics
6. Future Planning
7. Enhancing Services in Long Term Care: Sketching a Business Case
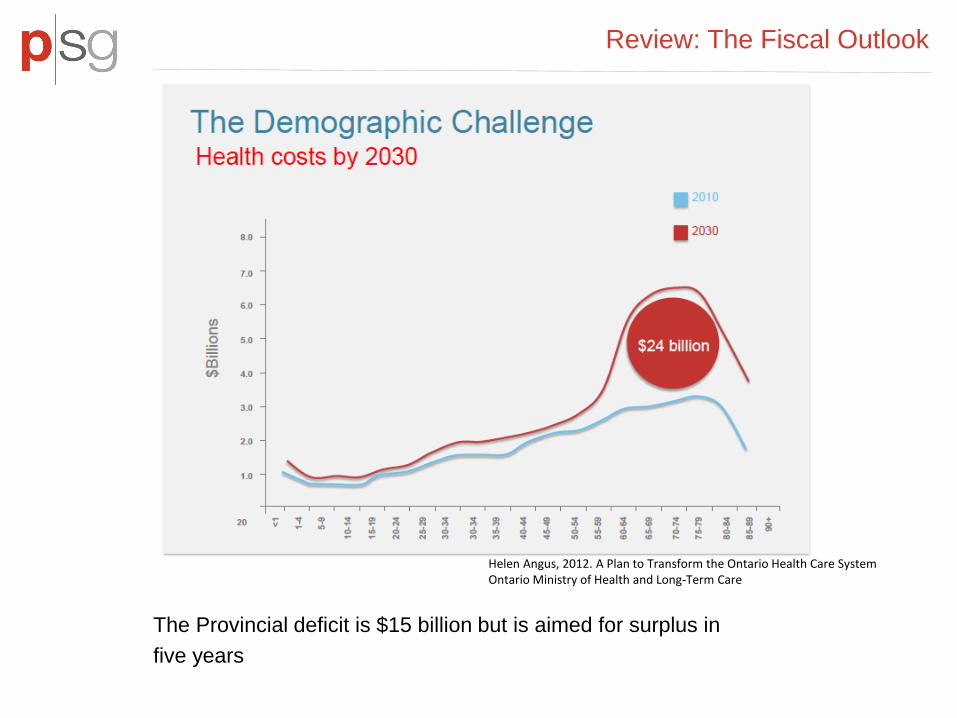
Review: The Fiscal Outlook
The Provincial deficit is $15 billion but is aimed for surplus in
five years
Helen Angus, 2012. A Plan to Transform the Ontario Health Care System Ontario Ministry of Health and Long-Term Care
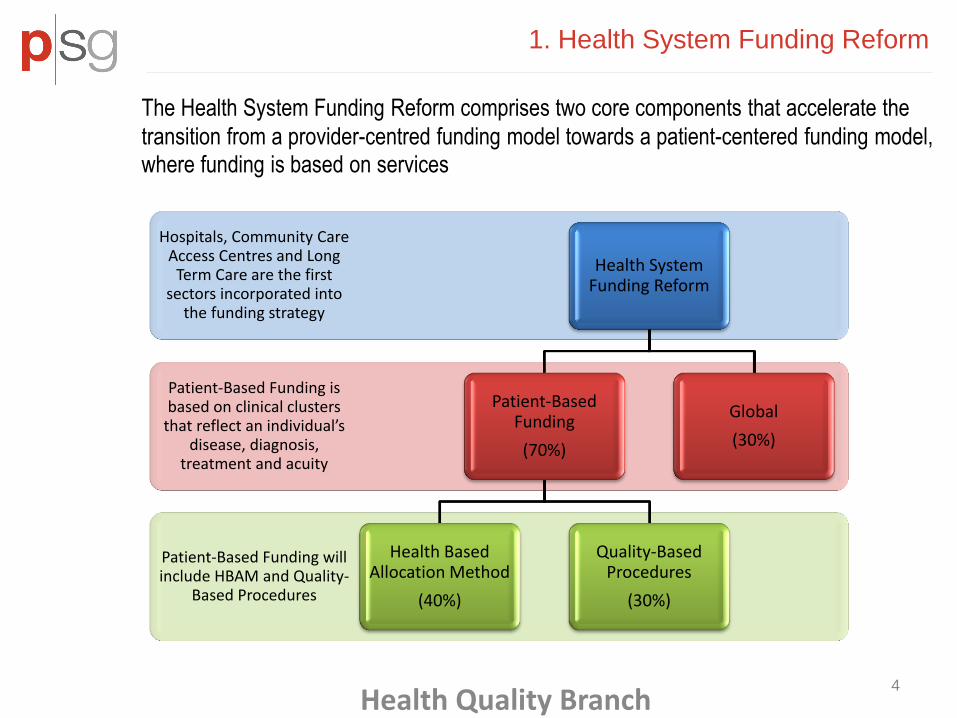
1. Health System Funding Reform
Patient-Based Funding will include HBAM and Quality-
Based Procedures
Patient-Based Funding is based on clinical clusters
that reflect an individual’s disease, diagnosis,
treatment and acuity
Hospitals, Community Care Access Centres and Long
Term Care are the first sectors incorporated into
the funding strategy
Health System Funding Reform
Patient-Based Funding
(70%)
Health Based Allocation Method
(40%)
Quality-Based Procedures
(30%)
Global
(30%)
Health Quality Branch
The Health System Funding Reform comprises two core components that accelerate the
transition from a provider-centred funding model towards a patient-centered funding model, where funding is based on services
4

QBP
2010/11 - 2011/12 Ontario Admissions
Total % Age 75+ % To or From
LTC % Residents
with Diagnosis
Congestive Heart Failure 42,866 65% 7% 12%
Chronic Obstructive Pulmonary Disease
46,771 51% 7% 14%
Stroke - Hemorrhage 3,012 53% 7%
21% Stroke - Ischemic 17,029 54% 6%
Stroke - Transient Ischemic Attack 5,785 57% 3%
Stroke - Unspecified 4,862 60% 7%
Source: 2010/11 - 2011/12 DAD
Seniors and QBP
• these are common conditions in long term care homes • LTC care is an important component of the multidiscplinary/multisite care of these residents • pharmacologic and non pharmacologic management in homes, including rehabilitation and other focused programs

Focus on High Use Populations
“About one per cent of Ontario’s population accounts for 49 per cent of hospital and home care costs, and 10 per cent of the population accounts for 95 per cent of such costs, according to a 2010 study by the Canadian Health Services Research Group (CHSRG).” Commission on the Reform of Ontario’s Public Services. 2012. Recommendation 5-17: Optimize the HBAM data set to identify and profile each LHIN’s high-use population to understand differences in treatment practice in each LHIN and apply best practices across the province. Use HBAM data to build specific strategies for co-ordinating health care for each high-use clinical group, for example: end-of-life care, avoidable complications, and care for those with mental health and addictions issues.
About Health Links Ontario is improving care for seniors and others with complex conditions through Health Links. This innovative approach brings together health care providers in a community to better and more quickly coordinate care for high-needs patients

High Use Frail Seniors
High Use Seniors in a LHIN, 2011/12
Age Seniors
Admitted to Hospital
Seniors with ED
Visits Admissions
Hospital Days Average Comorbidities per Admission
% Seniors Died in
Hospital
% Seniors to or from LTC/CCC
% Seniors to HC Total
Average per Senior
65-69 784 680 1,922 27,442 35.0 2.7 24% 12% 38%
70-74 870 748 2,190 37,476 43.1 2.9 27% 15% 38%
75-79 968 861 2,337 40,479 41.8 3.0 29% 21% 33%
80-84 1,067 951 2,526 45,920 43.0 3.0 29% 27% 34%
85-89 767 704 1,784 36,885 48.1 3.0 34% 33% 30%
90+ 444 411 951 22,817 51.4 3.0 34% 33% 27%
All Seniors 4,900 4,355 11,710 211,019 43.1 2.9 29% 23% 34%
Source: 2011/12 DAD, NACRS
• 7,604 people used 50% of the LHIN’s inpatient hospital resources in 2011/12. We identified the 4,900 75+ seniors in this group as the high use senior population in the LHIN.
• The above table shows the characteristics of these high use seniors:
• Their average hospital resource use is 43 days
• 29% of high user seniors died in hospital, 23% used CCC/LTC

High Use Frail Seniors
Historical Resource Use, High Use Seniors in a LHIN
High Use Seniors in 2011/12
Age Cohort % Seniors to or from LTC, CCC % Seniors to Home Care
2011/12 (t) t - 1 t - 2 2011/12 (t) t - 1 t - 2
65-69 12% 3% 4% 38% 32% 35%
70-74 15% 11% 4% 38% 33% 28%
75-79 21% 10% 6% 33% 33% 34%
80-84 27% 12% 12% 34% 35% 24%
85-89 33% 12% 9% 30% 38% 37%
90+ 33% 11% 5% 27% 28% 48%
All Seniors 23% 10% 7% 34% 33% 33% *t-1 refers to 2010/11 and t-2 refers to 2009/10 Source: 2009/10 - 2011/12 DAD, NACRS
• High use seniors are more likely to be discharged to LTC/CCC over time. They are increasingly frail
-

2. Quality: CMS Five-Stars Quality Rating System
The US Center for Medicare and Medicaid Services publicly reports quality indicators in nursing homes since 1998, through the Nursing Home Compare website
There is one overall 5-star rating for each nursing home, and a separate rating for each of the following three sources of information:
- Health Inspections
- Staffing
- Quality Measures: has information on 9 different physical and clinical measures for nursing home residents
The evidence is not strong so far that consumers use the information to choose providers, but this is expected to change over time. The evidence so far points to providers paying attention to the fact that this data is going to be published, and some impact on quality outcomes have been reported (Konetzka, 2006 & 2010; Werner, 2009)
9

Quality: HQO
Health Quality Ontario (HQO) recently launched a Long-Term Care public reporting website
This system is based on five attributes, defined as: accessible, effective, safe, appropriately resourced, and focused on population health.
It reports provincially aggregated wait times, quality indicators in nine categories (incontinence, ADL, cognitive function, pain, falls, pressure ulcers, physical restraints, medication safety, and infections), ED visits, and provincially aggregated staffing levels.
Only four quality indicators are reported at the individual LTCH facility level: - Falls
- Incontinence
- Pressure ulcers
- Physical restraints
Case mix adjustment is important for fair comparisons
10

Potentially Avoidable ED Visits by Home

Potentially Avoidable ED Visits from LTC by Diagnosis
12
• Injuries are the most common cause of avoidable ED visits in senior patients in Province
Most Common Potentially Avoidable Hospitalizations for Senior ED Patients
Ontario
% Total Visits from LTC
Injury 20%
Injury: Open Wounds : Head Neck & Trunk 5%
Injury: Hip Fracture 4%
Injury: Trauma to Skin & Subcutaneous Tissue 3%
Injury: Fracture Sprain Strain & Dislocation 3%
Injury: Traumatic Injury : MSK 1%
Injury: Open Wounds : Extremities 1%
Injury: Fracture of Neck Lumbar Spine Pelvis 1%
ADE: Possible 9%
Urinary Tract Infections Including Pyelonephritis 7%
Heart Failure 4%
Dehydration and Gastroenteritis 2%
Chronic Obstructive Pulmonary Disease 3%
Septicemia or Severe Sepsis 1.7%
Visits with any ASC 52%
All ED Visits fiscal years: 2009/10
- 2011/12

Potentially Avoidable ED Visits from LTC by Procedure
13
• Sutures and urinary catheter procedures are the most common minor therapeutic procedure received by senior patients visiting the emergency department
10 Most Common Minor Therapeutic Procedures for Senior ED Patients
Ontario
% Total Visits from LTC
Suture of Skin and Subcutaneous Tissue 32%
Bladder Procedures 24%
Therapeutic Intervention Body NEC 9%
Vascular/Venous, Other 10%
Ear Nose and Throat 4%
Respiratory Procedures 11%
Gastric Tube : Management & Removal 2%
Nasogastric Aspiration 2%
Total ED Visits with a Minor Therapeutic Procedure
fiscal years: 2009/10 - 2011/12
-

3. Case Mix and The Morbidity of Long
Term Care Residents
14
Characteristic within +/- 1 year Percent of Residents with Inpatient Admission 60% Acute Days per Resident 10 ALC Days per Resident 9.6 Mortality Rate 37%
Long Term Care residents are typically multimorbid and shift between acute and sub acute health status

Improving Case Mix Measurement: Combining Data and Methods
Clinical Setting Classification System
Acute Inpatient HBAM Inpatient Groups (HIG) Emergency Department
Comprehensive Ambulatory Care Classification System (CACS)
Inpatient Rehabilitation Rehabilitation Patient Groups (RPG)
Complex Continuing Care Resource Utilization Group III (44-Group)
Long Term Care Resource Utilization Group III (34-Group)
Inpatient Mental Health
System for Classification of In-Patient Psychiatry (SCIPP)
• improve case mix adjustment • compare cost in LTC with other settings, including cost savings of avoidance • MEDPAC recommends use of hospital data to inform case mix adjustment • RUG criticized for not accurately targeting payments for nontherapy ancillary (NTA) services, such as drugs, and for encouraging the provision of unnecessary therapy services • CMS move from 44 to 53 RUG model (9 new groups for extensive services and rehabilitation) • Most residents are candidates for nursing-based rehabilitative care that focuses on maintaining and expanding self involvement in ADLs (CMS RAI Manual)

16
Frail Seniors: The Role of Comborbidity
Diagnoses and Comorbidities; Sample
ALZHEIMER'S DISEASE /DEMENTIA PATHOLOGICAL FRACTURE
RESPIRATORY INFECTIONS & INFLAMMATIONS OTHER NERVOUS SYSTEM DISORDERS
WEIGHT LOSS OTHER SIGNS & SYMPTOMS
HIP FRACTURE SEIZURES & HEADACHES
KIDNEY & URINARY TRACT INFECTION RENAL DISEASE
FRACTURE OF NECK LUMBAR SPINE PELVIS : NEC CELLULITIS
DEGENERATIVE NERVOUS SYSTEM DISORDERS BACK INJURIES
SEPTICEMIA OR SEVERE SEPSIS INTRACRANIAL HEMORRHAGE
ORGANIC DISTURBANCES TRAUMA TO SKIN & SUBCUTANEOUS TISSUE
SIMPLE PNEUMONIA & PLEURISY INTRACRANIAL INJURY
DIABETES : WITH COMPLICATIONS GI BLEEDING
FLUID & ELECTROLYTE DISORDERS DIABETES WO OR W MINOR COMPLICATION
MAJOR INTESTINAL INFECTIONS-BACTERIAL ATHEROSCLEROSIS : PERIPHERAL & OTHER
STROKE : UNSPECIFIED CHRONIC PULMONARY DISEASE
ISCHEMIC STROKE HEART FAILURE
FRACTURE SPRAIN STRAIN & DISLOCATION: EXCEPT FEMUR HIP PELVIS & THIGH

17
Frail Seniors:
Age-Comorbidity Interactions
Number of Comorbid Conditions
Age Frail /At Risk Number of Comorbid Conditions
Age Frail /At Risk
4+ 90+ Most Likely 3 65-69 Less Likely
3 90+ Most Likely 2 70-74 Less Likely
2 90+ Most Likely 1 75-79 Less Likely
4+ 85-89 Most Likely 0 80-84 Less Likely
1 90+ Very Likely 4+ <=59 Less Likely
3 85-89 Very Likely 3 60-64 Less Likely
4+ 80-84 Very Likely 2 65-69 Less Likely
2 85-89 Very Likely 1 70-74 Less Likely
0 90+ Very Likely 2 60-64 Less Likely
3 80-84 Very Likely 0 75-79 Less Likely
4+ 75-79 Very Likely 3 <=59 Less Likely
1 85-89 Very Likely 1 65-69 Less Likely
2 80-84 Very Likely 1 60-64 Least Likely
4+ 70-74 Likely 0 70-74 Least Likely
3 75-79 Likely 2 <=59 Least Likely
0 85-89 Likely 0 65-69 Least Likely
4+ 65-69 Likely
1 80-84 Likely
2 75-79 Likely
4+ 60-64 Likely
3 70-74 Likely

18
Frail/At Risk Inpatient Discharges Per
Year Probability LTC
Least Likely 102,458 2%
Less Likely 170,202 5%
Likely 80,690 11%
Very Likely 88,675 18%
Most Likely 25,798 28%
Frail Senior Groups

19
Rug CMI and Frailty Index

RUG CMI
vs. Median LTC LOS
20
R-Squared = 0.09

RUG CMI
vs. Probability of Death
21
R-Squared = 0.06
-

4: The Mix of Seniors Services Across LHINs
22
We designed spending scenarios for the following programs
• Community Support Services • Assisted Living Services in Supportive Housing • Community Care Access Centres (Age 65+) • Long Term Care Homes • Complex Continuing Care (Age 65+) • Inpatient Rehabilitation (Age 65+) • Acute Inpatient and Day Surgery (Age 65+)
23
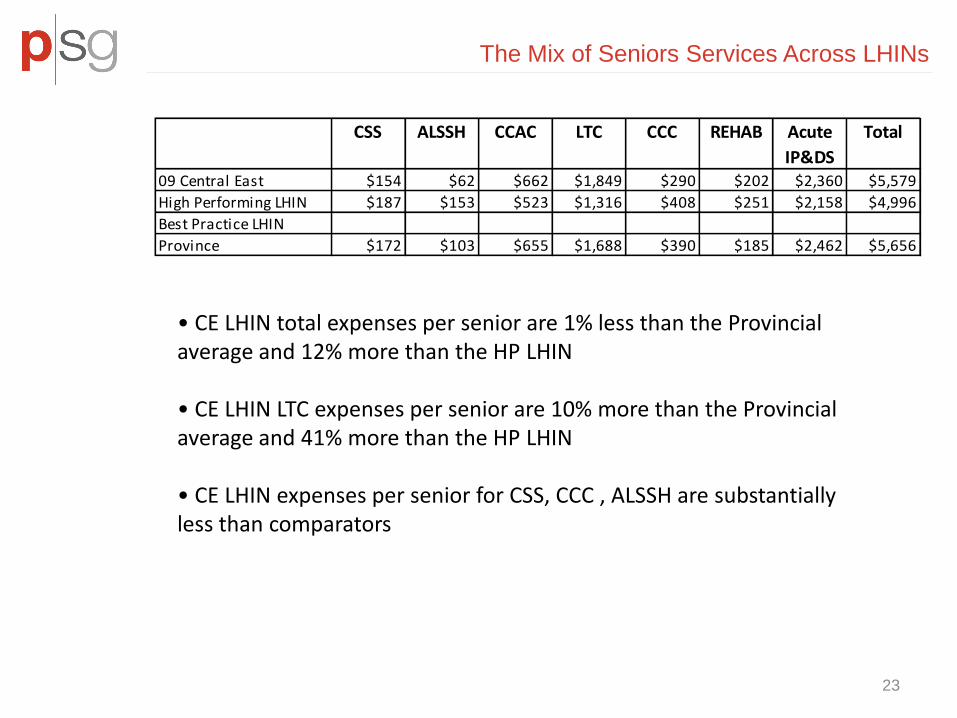
• CE LHIN total expenses per senior are 1% less than the Provincial average and 12% more than the HP LHIN • CE LHIN LTC expenses per senior are 10% more than the Provincial average and 41% more than the HP LHIN
• CE LHIN expenses per senior for CSS, CCC , ALSSH are substantially less than comparators
CSS ALSSH CCAC LTC CCC REHAB Acute
IP&DS
Total
09 Central East $154 $62 $662 $1,849 $290 $202 $2,360 $5,579
High Performing LHIN $187 $153 $523 $1,316 $408 $251 $2,158 $4,996
Best Practice LHIN
Province $172 $103 $655 $1,688 $390 $185 $2,462 $5,656
The Mix of Seniors Services Across LHINs

24
Supporting Housing and Long Term Care
However, LTC residents are a multimorbid population -

25
Expanding Short Stay Programs

Short Stay in American Nursing Homes
26
• Skilled nursing facilities (SNFs) provide short-term skilled nursing care and rehabilitation services, such as physical and occupational therapy and speech–language pathology services. Examples of SNF patients include those recovering from surgical procedures, such as hip and knee replacements, or from medical conditions, such as stroke and pneumonia. • In 2010, Medicare-covered SNF days made up 12 percent of total patient days but 23 percent of facility revenue.
-

Redressing HBAM Variance
-

Discharge Destination for Patients with
Palliative Care
• Hospice care provided to nursing home (NH) residents has been shown to improve the quality of end-of-life (EOL) care. However, hospice utilization in LTC Homes is typically low (Zheng et al, 2012, Gerontologist) • Total Medicare spending for hospice care for nursing facility residents grew by 69 percent from 2005 to 2009 (Gozalo, 2011, NEJM ) .
Discharge Destination
Provider LHIN Discharges
with Palliative Care
Acute CCC Died Home Care
Home LTC Other IP
Rehab Retirement
Home
Erie St. Clair 2,056 1% 10% 61% 12% 8% 2% 5% 0% 2%
Windsor Regional Hospital 812 1% 10% 51% 17% 14% 3% 2% 1% 2%
South West 3,107 2% 7% 72% 10% 3% 2% 1% 1% 2%
Waterloo Wellington 2,122 2% 10% 57% 13% 5% 3% 7% 1% 2%
Hamilton Niagara Haldimand Brant 4,371 2% 16% 57% 13% 5% 3% 3% 0% 2%
Central West 1,227 1% 2% 74% 8% 8% 4% 2% 0% 1%
Mississauga Halton 2,174 1% 13% 53% 17% 10% 3% 1% 1% 2%
Toronto Central 5,375 3% 13% 48% 15% 10% 3% 1% 3% 2%
Central 3,038 1% 16% 61% 10% 5% 4% 1% 1% 2%
Central East 4,763 2% 6% 68% 12% 6% 3% 0% 1% 1%
South East 1,887 3% 9% 62% 16% 4% 3% 0% 1% 2%
Champlain 3,895 2% 9% 61% 12% 6% 3% 4% 1% 2%
North Simcoe Muskoka 1,105 1% 9% 59% 14% 4% 3% 9% 0% 1%
North East 1,787 2% 3% 64% 12% 8% 3% 5% 0% 1%
North West 1,157 4% 17% 40% 25% 7% 3% 0% 0% 3%
Province 38,064 2% 10% 60% 13% 7% 3% 2% 1% 2%
Reducing Senior Decedent Hospital Days
29
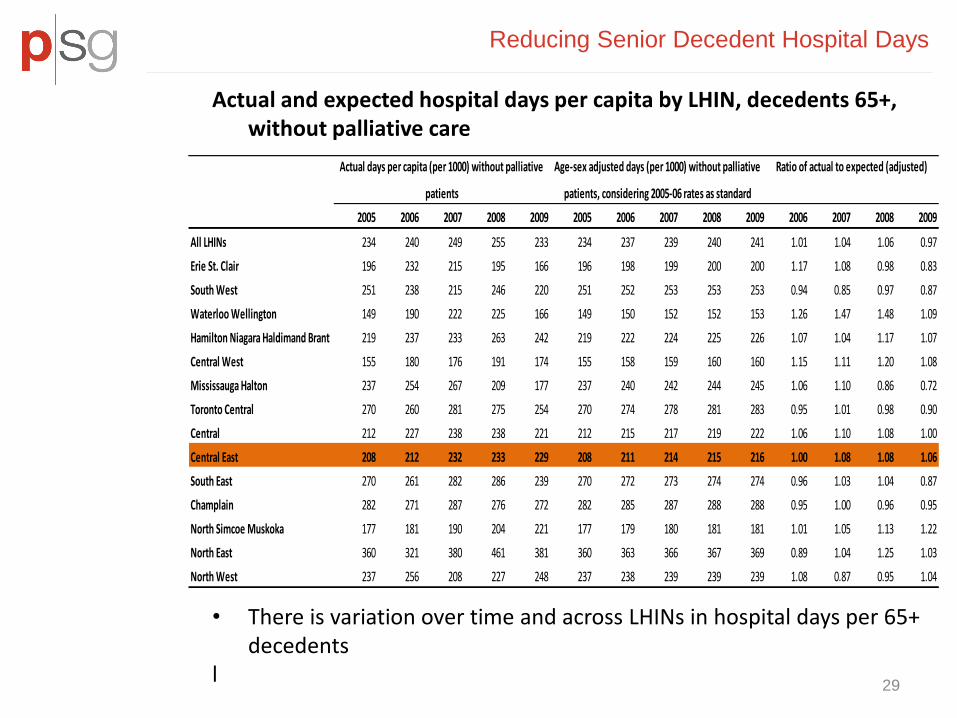
Actual and expected hospital days per capita by LHIN, decedents 65+, without palliative care
• There is variation over time and across LHINs in hospital days per 65+
decedents l
2005 2006 2007 2008 2009 2005 2006 2007 2008 2009 2006 2007 2008 2009
All LHINs 234 240 249 255 233 234 237 239 240 241 1.01 1.04 1.06 0.97
Erie St. Clair 196 232 215 195 166 196 198 199 200 200 1.17 1.08 0.98 0.83
South West 251 238 215 246 220 251 252 253 253 253 0.94 0.85 0.97 0.87
Waterloo Wellington 149 190 222 225 166 149 150 152 152 153 1.26 1.47 1.48 1.09
Hamilton Niagara Haldimand Brant 219 237 233 263 242 219 222 224 225 226 1.07 1.04 1.17 1.07
Central West 155 180 176 191 174 155 158 159 160 160 1.15 1.11 1.20 1.08
Mississauga Halton 237 254 267 209 177 237 240 242 244 245 1.06 1.10 0.86 0.72
Toronto Central 270 260 281 275 254 270 274 278 281 283 0.95 1.01 0.98 0.90
Central 212 227 238 238 221 212 215 217 219 222 1.06 1.10 1.08 1.00
Central East 208 212 232 233 229 208 211 214 215 216 1.00 1.08 1.08 1.06
South East 270 261 282 286 239 270 272 273 274 274 0.96 1.03 1.04 0.87
Champlain 282 271 287 276 272 282 285 287 288 288 0.95 1.00 0.96 0.95
North Simcoe Muskoka 177 181 190 204 221 177 179 180 181 181 1.01 1.05 1.13 1.22
North East 360 321 380 461 381 360 363 366 367 369 0.89 1.04 1.25 1.03
North West 237 256 208 227 248 237 238 239 239 239 1.08 0.87 0.95 1.04
Actual days per capita (per 1000) without palliative
patients
Age-sex adjusted days (per 1000) without palliative
patients, considering 2005-06 rates as standard
Ratio of actual to expected (adjusted)

30
• The increase in ALC resources used by senior decedents within the Central East LHIN is among the highest in the province
Ratios of actual to expected ALC LOS in 2009 by LHIN, 2005 age and gender standardized rates, 65+ patients excluding palliative care
Reducing Senior Decedent Hospital Days
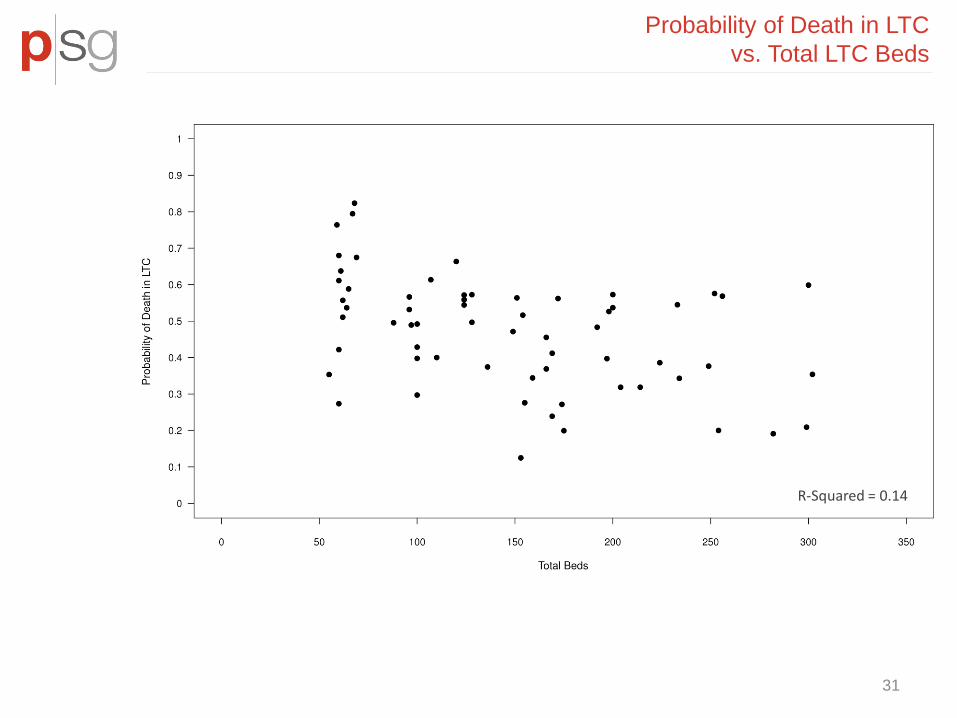
Probability of Death in LTC
vs. Total LTC Beds
31
R-Squared = 0.14

Probability of Residents Dying in Hospital
vs. Total LTC Beds
32
R-Squared = 0.26
-

5. Incorporating Regional Characteristics for Planning

Economies of Scale In Complex Continuing Care
$-
$100
$200
$300
$400
$500
$600
$700
$800
- 20,000 40,000 60,000 80,000 100,000 120,000 140,000 160,000
Chronic RUG Weighted Days
Un
it C
ost
Actual Predicted
Incorporating Facility Characteristics for Planning
HBAM adjusts CPRWPD for small CCC facilities -

Over the next 10-20 years, without LTC bed increases, most subLHINs will have long term care beds per senior lower than is presently observed in the province.
6. Scenario Planning: Beds per Senior by SubLHIN , No New Beds

Reducing Future Demand: Median LTC LOS
by LTC Home
36
?
-

7. Enhanced Long Term Care
37
• This plot shows costs over time for three hypothetical patients: a healthy senior that required only primary care once a year, and two frail seniors with an incident hospitalization at age 75.5. Over 3 years:
• the healthy senior costs $231 • the frail senior with no enhanced LTC services was discharged to LTC, had 4 follow up ED visits and two hospital readmissions before dying in hospital. This patient cost $230,040 ($118,950 in hospital). • the frail senior that received enhanced LTC services had fewer ALC days in their incident admission, was discharged to LTC+ and had two follow up ED visits, with health care costs of $194,970 ($10,400 in hospital).

Strategic Issues in Long Term Care
38
1. Funding Reform and Integrated Care
2. Quality: Measurement, Reporting and Improvement
3. Improving Case Mix Measurement
4. Future Service Mix in LTC Homes
• Role of Supportive Housing
• Short Stay
• LTC role in Redressing HBAM Service Variance
• End of Life Care
5. Regional and Home Characteristics
6. Future Planning
7. Enhancing Services in Long Term Care: Sketching a Business Case