strategic business plan - navsea - u.s. navy
TRANSCRIPT

Multifamily Quarter In Review: New York City | Q1 2014Released April 2014 | By Ariel Property Advisors
Join Our E-mail List:
e-mail [email protected] or visit arielpa.com

2| Ariel Property Advisors | Building Results | 122 East 42nd Street, Suite 1015 - New York NY 10168 | 212.544.9500 | arielpa.com
Multifamily Quarter In Review: New York City | Q1 2014
About The Report
Ariel Property Advisors is pleased to present its Multifamily Quarter In Review: New York City | Q1
2014. The report is a modified version of our Multifamily Month In Review: New York City, which pro-
vides a monthly overview of market activity, benchmark transactions, revenue and expense trends,
and current events that affect the multifamily real estate market.
The Multifamily Month In Review is distributed to our clients on a monthly basis. Past versions of the
Multifamily Month In Review can be found at http://arielpa.com/research/reports/.

Ariel Property Advisors | Building Results | 122 East 42nd Street, Suite 1015 - New York NY 10168 | 212.544.9500 | arielpa.com |3
Multifamily Quarter In Review: New York City | Q1 2014
Table Of Contents
4 New York City Multifamily Quarter In Review
5 Multifamily Market Performance By Sub-Market
6 Trailing Six Month Analysis: Introduction
7 Trailing Six Month Performance Comparison
8 Transaction & Dollar Volume Trailing Analysis
9 Macro-Economic Overview & Market Fundamentals
10 NYC Sub-Market OverviewManhattan | N. Manhattan | The Bronx | Brooklyn | Queens
15 About Ariel Property Advisors
16 Sample Listing Activity By Ariel Property Advisors
4| Ariel Property Advisors | Building Results | 122 East 42nd Street, Suite 1015 - New York NY 10168 | 212.544.9500 | arielpa.com
Multifamily Quarter In Review: New York City | Q1 2014
Qu
ee
ns
Bro
okl
ynT
he
Bro
nx
N. M
anh
atta
nM
anh
atta
n
Shimon Shkury Mike A. Tortorici Victor SozioPresident Vice President Vice President
212.544.9500 x.11 212.544.9500 x.13 212.544.9500 [email protected] [email protected] [email protected]
Ne
w Y
ork
Cit
y
Multifamily Quarter In Review: New York City | Q1 2014
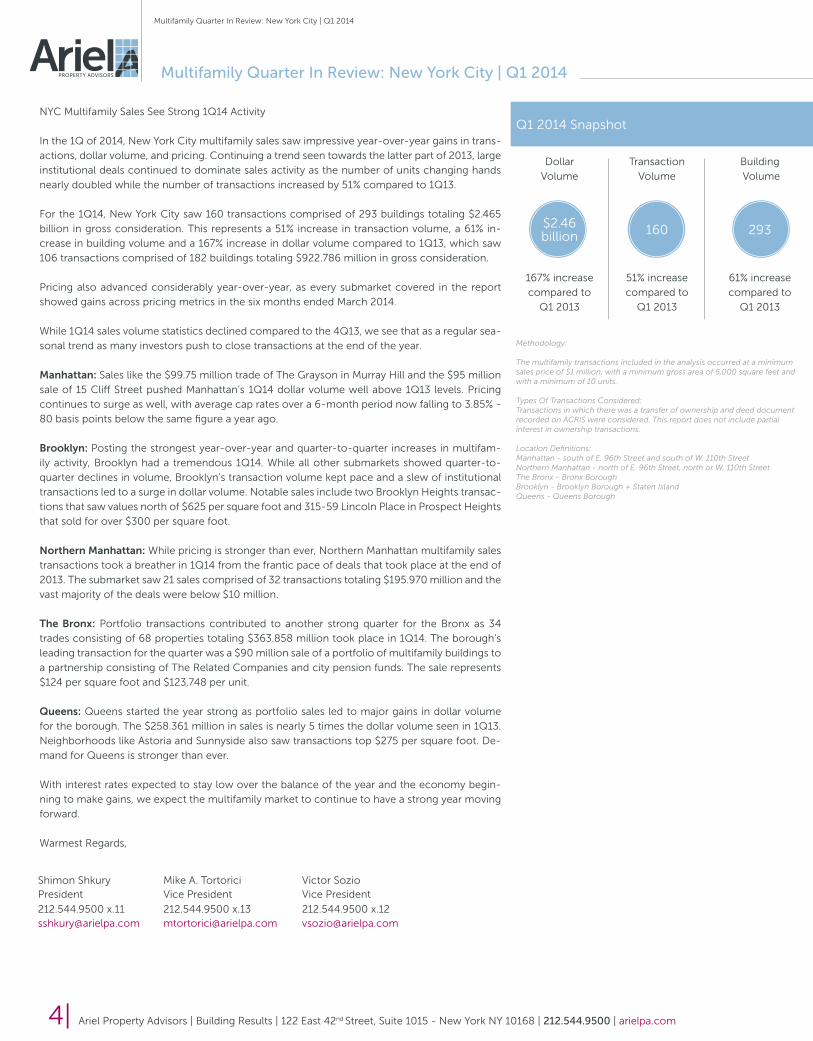
NYC Multifamily Sales See Strong 1Q14 Activity
In the 1Q of 2014, New York City multifamily sales saw impressive year-over-year gains in trans-
actions, dollar volume, and pricing. Continuing a trend seen towards the latter part of 2013, large
institutional deals continued to dominate sales activity as the number of units changing hands
nearly doubled while the number of transactions increased by 51% compared to 1Q13.
For the 1Q14, New York City saw 160 transactions comprised of 293 buildings totaling $2.465
billion in gross consideration. This represents a 51% increase in transaction volume, a 61% in-
crease in building volume and a 167% increase in dollar volume compared to 1Q13, which saw
106 transactions comprised of 182 buildings totaling $922.786 million in gross consideration.
Pricing also advanced considerably year-over-year, as every submarket covered in the report
showed gains across pricing metrics in the six months ended March 2014.
While 1Q14 sales volume statistics declined compared to the 4Q13, we see that as a regular sea-
sonal trend as many investors push to close transactions at the end of the year.
Manhattan: Sales like the $99.75 million trade of The Grayson in Murray Hill and the $95 million
sale of 15 Cliff Street pushed Manhattan’s 1Q14 dollar volume well above 1Q13 levels. Pricing
continues to surge as well, with average cap rates over a 6-month period now falling to 3.85% -
80 basis points below the same figure a year ago.
Brooklyn: Posting the strongest year-over-year and quarter-to-quarter increases in multifam-
ily activity, Brooklyn had a tremendous 1Q14. While all other submarkets showed quarter-to-
quarter declines in volume, Brooklyn’s transaction volume kept pace and a slew of institutional
transactions led to a surge in dollar volume. Notable sales include two Brooklyn Heights transac-
tions that saw values north of $625 per square foot and 315-59 Lincoln Place in Prospect Heights
that sold for over $300 per square foot.
Northern Manhattan: While pricing is stronger than ever, Northern Manhattan multifamily sales
transactions took a breather in 1Q14 from the frantic pace of deals that took place at the end of
2013. The submarket saw 21 sales comprised of 32 transactions totaling $195.970 million and the
vast majority of the deals were below $10 million.
The Bronx: Portfolio transactions contributed to another strong quarter for the Bronx as 34
trades consisting of 68 properties totaling $363.858 million took place in 1Q14. The borough’s
leading transaction for the quarter was a $90 million sale of a portfolio of multifamily buildings to
a partnership consisting of The Related Companies and city pension funds. The sale represents
$124 per square foot and $123,748 per unit.
Queens: Queens started the year strong as portfolio sales led to major gains in dollar volume
for the borough. The $258.361 million in sales is nearly 5 times the dollar volume seen in 1Q13.
Neighborhoods like Astoria and Sunnyside also saw transactions top $275 per square foot. De-
mand for Queens is stronger than ever.
With interest rates expected to stay low over the balance of the year and the economy begin-
ning to make gains, we expect the multifamily market to continue to have a strong year moving
forward.
Warmest Regards,
Q1 2014 Snapshot
Dollar
Volume
Transaction
Volume
Building
Volume
$2.46 billion 160 293
167% increase
compared to
Q1 2013
51% increase
compared to
Q1 2013
61% increase
compared to
Q1 2013
Methodology: The multifamily transactions included in the analysis occurred at a minimum sales price of $1 million, with a minimum gross area of 5,000 square feet and with a minimum of 10 units. Types Of Transactions Considered: Transactions in which there was a transfer of ownership and deed document recorded on ACRIS were considered. This report does not include partial interest in ownership transactions. Location Definitions: Manhattan - south of E. 96th Street and south of W. 110th Street Northern Manhattan - north of E. 96th Street, north or W. 110th Street The Bronx - Bronx Borough Brooklyn - Brooklyn Borough + Staten Island Queens - Queens Borough
Ariel Property Advisors | Building Results | 122 East 42nd Street, Suite 1015 - New York NY 10168 | 212.544.9500 | arielpa.com |5
Multifamily Quarter In Review: New York City | Q1 2014
Manhattan
Northern Manhattan
The Bronx
Brooklyn
Queens
Dollar & Building Volume Graphs
Dollar Volume
Comparison Graph
Building Volume
Comparison Graph
Legend: 36+8+15+31+10+z 13+11+23+41+12+z
$1.0b
$900m
$800m
$700m
$600m
$500m
$400m
$300m
$200m
$100m
$0
120
110
100
90
80
70
60
50
40
30
20
10
0
Bronx
Manhattan N. Manhattan
Brooklyn Queens
Legend
Qu
ee
ns
Bro
okl
ynT
he
Bro
nx
N. M
anh
atta
nM
anh
atta
nN
ew
Yo
rk C
ity
Dollar Volume Comparison
By Location Graph
Building Volume Comparison
By Location Graph
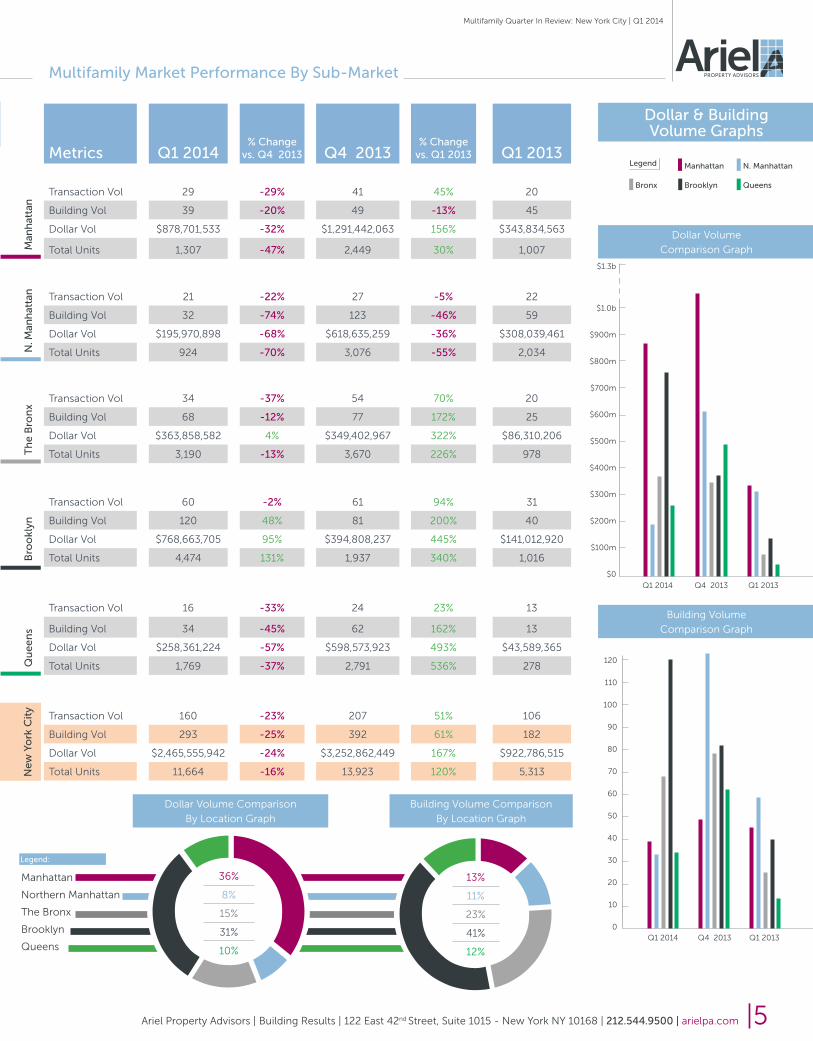
Metrics Q1 2014% Change
vs. Q4 2013 Q4 2013% Change
vs. Q1 2013 Q1 2013
Transaction Vol 29 -29% 41 45% 20
Building Vol 39 -20% 49 -13% 45
Dollar Vol $878,701,533 -32% $1,291,442,063 156% $343,834,563
Total Units 1,307 -47% 2,449 30% 1,007
Transaction Vol 21 -22% 27 -5% 22
Building Vol 32 -74% 123 -46% 59
Dollar Vol $195,970,898 -68% $618,635,259 -36% $308,039,461
Total Units 924 -70% 3,076 -55% 2,034
Transaction Vol 34 -37% 54 70% 20
Building Vol 68 -12% 77 172% 25
Dollar Vol $363,858,582 4% $349,402,967 322% $86,310,206
Total Units 3,190 -13% 3,670 226% 978
Transaction Vol 60 -2% 61 94% 31
Building Vol 120 48% 81 200% 40
Dollar Vol $768,663,705 95% $394,808,237 445% $141,012,920
Total Units 4,474 131% 1,937 340% 1,016
Transaction Vol 16 -33% 24 23% 13
Building Vol 34 -45% 62 162% 13
Dollar Vol $258,361,224 -57% $598,573,923 493% $43,589,365
Total Units 1,769 -37% 2,791 536% 278
Transaction Vol 160 -23% 207 51% 106
Building Vol 293 -25% 392 61% 182
Dollar Vol $2,465,555,942 -24% $3,252,862,449 167% $922,786,515
Total Units 11,664 -16% 13,923 120% 5,313
Multifamily Quarter In Review: New York City | Q1 2014
NYC Multifamily Sales See Strong 1Q14 Activity
In the 1Q of 2014, New York City multifamily sales saw impressive year-over-year gains in trans-
actions, dollar volume, and pricing. Continuing a trend seen towards the latter part of 2013, large
institutional deals continued to dominate sales activity as the number of units changing hands
nearly doubled while the number of transactions increased by 51% compared to 1Q13.
For the 1Q14, New York City saw 160 transactions comprised of 293 buildings totaling $2.465
billion in gross consideration. This represents a 51% increase in transaction volume, a 61% in-
crease in building volume and a 167% increase in dollar volume compared to 1Q13, which saw
106 transactions comprised of 182 buildings totaling $922.786 million in gross consideration.
Pricing also advanced considerably year-over-year, as every submarket covered in the report
showed gains across pricing metrics in the six months ended March 2014.
While 1Q14 sales volume statistics declined compared to the 4Q13, we see that as a regular sea-
sonal trend as many investors push to close transactions at the end of the year.
Manhattan: Sales like the $99.75 million trade of The Grayson in Murray Hill and the $95 million
sale of 15 Cliff Street pushed Manhattan’s 1Q14 dollar volume well above 1Q13 levels. Pricing
continues to surge as well, with average cap rates over a 6-month period now falling to 3.85% -
80 basis points below the same figure a year ago.
Brooklyn: Posting the strongest year-over-year and quarter-to-quarter increases in multifam-
ily activity, Brooklyn had a tremendous 1Q14. While all other submarkets showed quarter-to-
quarter declines in volume, Brooklyn’s transaction volume kept pace and a slew of institutional
transactions led to a surge in dollar volume. Notable sales include two Brooklyn Heights transac-
tions that saw values north of $625 per square foot and 315-59 Lincoln Place in Prospect Heights
that sold for over $300 per square foot.
Northern Manhattan: While pricing is stronger than ever, Northern Manhattan multifamily sales
transactions took a breather in 1Q14 from the frantic pace of deals that took place at the end of
2013. The submarket saw 21 sales comprised of 32 transactions totaling $195.970 million and the
vast majority of the deals were below $10 million.
The Bronx: Portfolio transactions contributed to another strong quarter for the Bronx as 34
trades consisting of 68 properties totaling $363.858 million took place in 1Q14. The borough’s
leading transaction for the quarter was a $90 million sale of a portfolio of multifamily buildings to
a partnership consisting of The Related Companies and city pension funds. The sale represents
$124 per square foot and $123,748 per unit.
Queens: Queens started the year strong as portfolio sales led to major gains in dollar volume
for the borough. The $258.361 million in sales is nearly 5 times the dollar volume seen in 1Q13.
Neighborhoods like Astoria and Sunnyside also saw transactions top $275 per square foot. De-
mand for Queens is stronger than ever.
With interest rates expected to stay low over the balance of the year and the economy begin-
ning to make gains, we expect the multifamily market to continue to have a strong year moving
forward.
Warmest Regards,
Q1 2014 Snapshot
Dollar
Volume
Transaction
Volume
Building
Volume
$2.46 billion 160 293
167% increase
compared to
Q1 2013
51% increase
compared to
Q1 2013
61% increase
compared to
Q1 2013
Methodology: The multifamily transactions included in the analysis occurred at a minimum sales price of $1 million, with a minimum gross area of 5,000 square feet and with a minimum of 10 units. Types Of Transactions Considered: Transactions in which there was a transfer of ownership and deed document recorded on ACRIS were considered. This report does not include partial interest in ownership transactions. Location Definitions: Manhattan - south of E. 96th Street and south of W. 110th Street Northern Manhattan - north of E. 96th Street, north or W. 110th Street The Bronx - Bronx Borough Brooklyn - Brooklyn Borough + Staten Island Queens - Queens Borough
36%
8%
15%
31%
10%
13%
11%
23%
41%
12%
Q1 2014 Q4 2013 Q1 2013
Multifamily Market Performance By Sub-Market
Q1 2014 Q4 2013 Q1 2013
$1.3b
6| Ariel Property Advisors | Building Results | 122 East 42nd Street, Suite 1015 - New York NY 10168 | 212.544.9500 | arielpa.com
Multifamily Quarter In Review: New York City | Q1 2014
Trailing Six Month Analysis Methodology
By
Tran
sact
ion
Vo
lum
eB
y D
olla
r V
olu
me
Trailing Six Month Analysis: Introduction
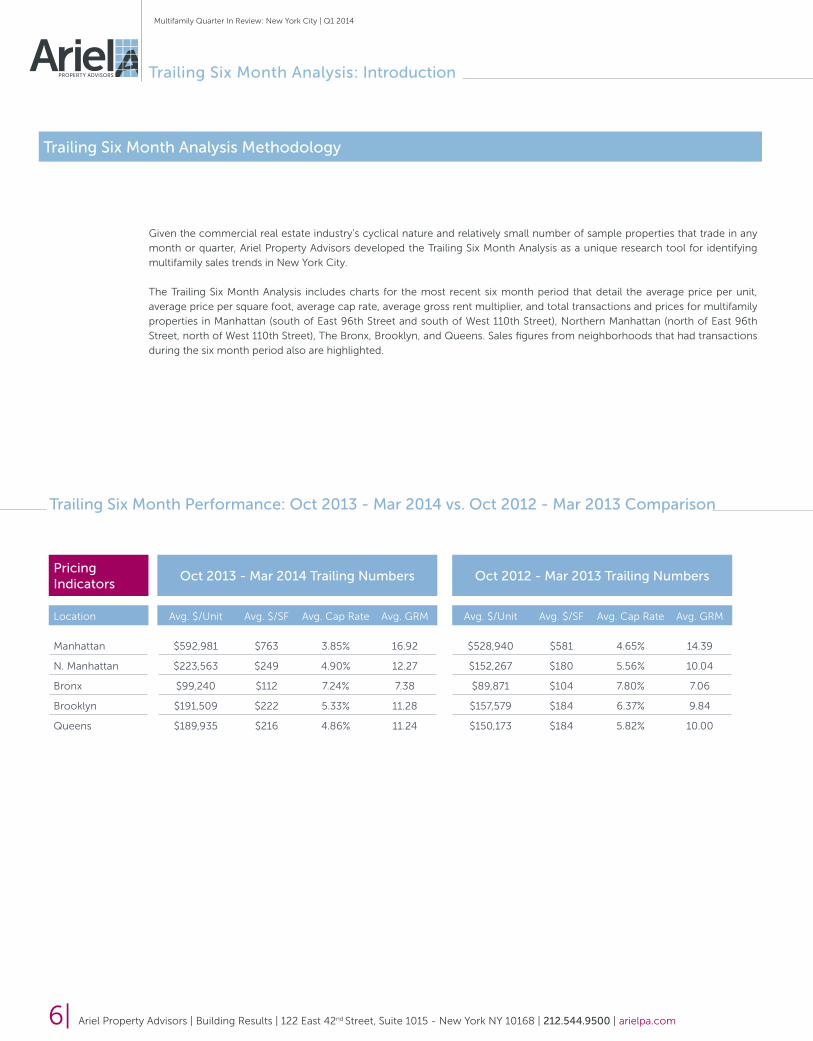
Trailing Six Month Analysis Methodology
Given the commercial real estate industry’s cyclical nature and relatively small number of sample properties that trade in any
month or quarter, Ariel Property Advisors developed the Trailing Six Month Analysis as a unique research tool for identifying
multifamily sales trends in New York City.
The Trailing Six Month Analysis includes charts for the most recent six month period that detail the average price per unit,
average price per square foot, average cap rate, average gross rent multiplier, and total transactions and prices for multifamily
properties in Manhattan (south of East 96th Street and south of West 110th Street), Northern Manhattan (north of East 96th
Street, north of West 110th Street), The Bronx, Brooklyn, and Queens. Sales figures from neighborhoods that had transactions
during the six month period also are highlighted.
Trailing Six Month Performance: Oct 2013 - Mar 2014 vs. Oct 2012 - Mar 2013 Comparison
Pricing Indicators
Oct 2013 - Mar 2014 Trailing Numbers Oct 2012 - Mar 2013 Trailing Numbers
Location Avg. $/Unit Avg. $/SF Avg. Cap Rate Avg. GRM Avg. $/Unit Avg. $/SF Avg. Cap Rate Avg. GRM
Manhattan $592,981 $763 3.85% 16.92 $528,940 $581 4.65% 14.39
N. Manhattan $223,563 $249 4.90% 12.27 $152,267 $180 5.56% 10.04
Bronx $99,240 $112 7.24% 7.38 $89,871 $104 7.80% 7.06
Brooklyn $191,509 $222 5.33% 11.28 $157,579 $184 6.37% 9.84
Queens $189,935 $216 4.86% 11.24 $150,173 $184 5.82% 10.00

Ariel Property Advisors | Building Results | 122 East 42nd Street, Suite 1015 - New York NY 10168 | 212.544.9500 | arielpa.com |7
Multifamily Quarter In Review: New York City | Q1 2014B
y Tr
ansa
ctio
n V
olu
me
By
Do
llar
Vo
lum
e
30+50+20+A16+42+42+A8+31+61+A11+29+60+A24+26+50+A80+17+3+A67+25+8+A43+35+22+A58+25+17+A84+10+6+A
$20mm+ $5-20mm $1-5mm
Trailing Six Month Analysis: Introduction
Trailing Six Month Analysis Methodology
Given the commercial real estate industry’s cyclical nature and relatively small number of sample properties that trade in any
month or quarter, Ariel Property Advisors developed the Trailing Six Month Analysis as a unique research tool for identifying
multifamily sales trends in New York City.
The Trailing Six Month Analysis includes charts for the most recent six month period that detail the average price per unit,
average price per square foot, average cap rate, average gross rent multiplier, and total transactions and prices for multifamily
properties in Manhattan (south of East 96th Street and south of West 110th Street), Northern Manhattan (north of East 96th
Street, north of West 110th Street), The Bronx, Brooklyn, and Queens. Sales figures from neighborhoods that had transactions
during the six month period also are highlighted.
Trailing Six Month Performance: Deal Distribution By Transaction Count and Dollar Volume
Trailing Six Month Performance: Oct - Mar 2014 vs. Oct -Mar 2013 Comparison
Oct 2013 - Mar 2014 Trailing Numbers Oct 2012 - Mar 2013 Trailing Numbers
Location / CriteriaTotal
Transactions
Total Buildings Traded
Total Dollar
Value Traded
Median Price
Total Units
Traded
Median Units /
Transaction
Total Transactions
Total Buildings Traded
Total Dollar
Value Traded
Median Price
Total Units
Traded
Median Units /
Transaction
Manhattan 70 88 $2,170,143,596 $12,000,000 3,756 22 97 159 $2,486,341,978 $7,000,000 5,309 21
Brooklyn 48 155 $814,606,157 $5,500,000 4,000 29 66 133 $629,735,242 $5,338,500 4,349 38
Bronx 88 145 $713,261,549 $4,050,000 6,860 42 72 117 $660,872,895 $4,187,500 6,673 50
Queens 121 201 $1,163,471,942 $4,000,000 6,411 23 90 120 $437,133,023 $2,820,000 3,232 20
N. Manhattan 40 96 $856,935,147 $4,983,000 4,560 33 31 40 $170,939,865 $3,200,000 1,185 22
Summary 367 685 $5,718,418,391 $5,000,000 25,587 31 356 569 $4,385,023,003 $4,700,000 20,748 26
Manhattan N. Manhattan Bronx Brooklyn Queens
30% 16% 8% 11% 24%
50% 42% 31% 29% 26%
20% 42% 61% 60% 50%
Manhattan N. Manhattan Bronx Brooklyn Queens
80% 67% 43% 58% 84%
17% 25% 35% 25% 10%
3% 8% 22% 17% 6%
8| Ariel Property Advisors | Building Results | 122 East 42nd Street, Suite 1015 - New York NY 10168 | 212.544.9500 | arielpa.com
Multifamily Quarter In Review: New York City | Q1 2014
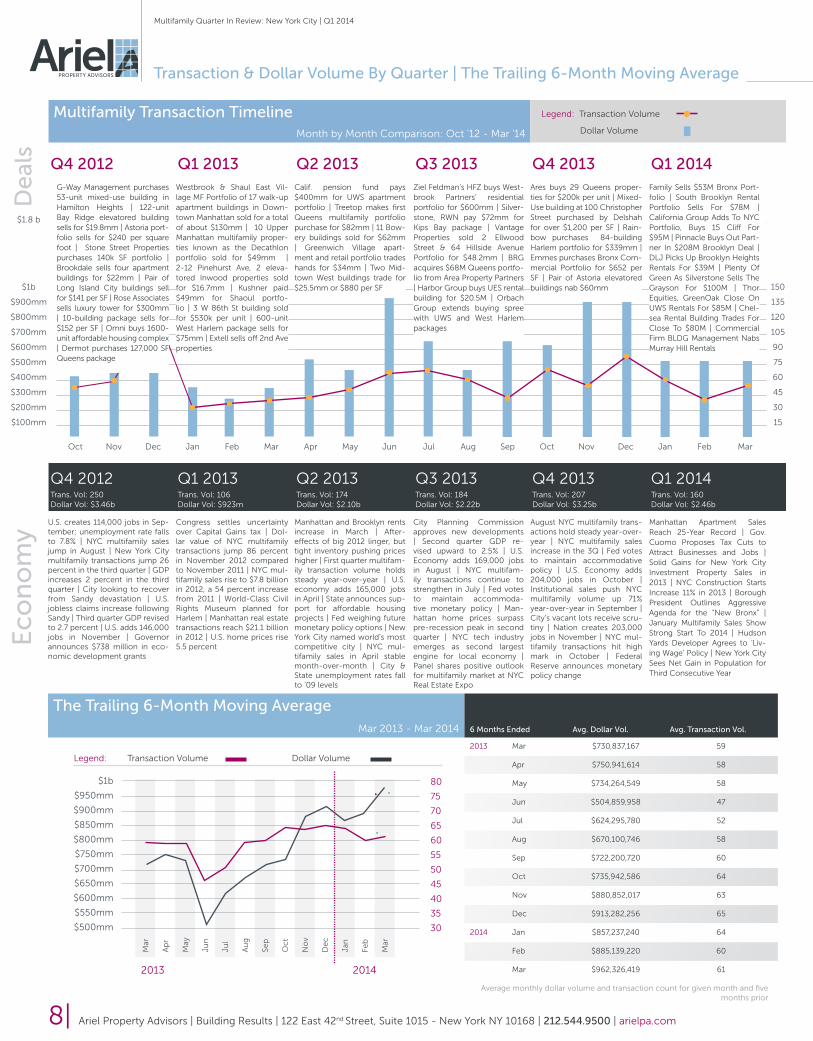
Multifamily Transaction TimelineMonth by Month Comparison: Oct '12 - Mar '14
Q4 2012 Q1 2013 Q2 2013 Q3 2013 Q4 2013 Q1 2014
Q4 2012 Q1 2013 Q2 2013 Q3 2013 Q4 2013 Q1 2014Trans. Vol: 250 Trans. Vol: 106 Trans. Vol: 174 Trans. Vol: 184 Trans. Vol: 207 Trans. Vol: 160Dollar Vol: $3.46b Dollar Vol: $923m Dollar Vol: $2.10b Dollar Vol: $2.22b Dollar Vol: $3.25b Dollar Vol: $2.46b
$1.8 b
$1b 150
$900mm 135
$800mm 120
$700mm 105
$600mm 90
$500mm 75
$400mm 60
$300mm 45
$200mm 30
$100mm 15
Oct Nov Dec Jan Feb Mar Apr May Jun Jul Aug Sep Oct Nov Dec Jan Feb Mar
De
als
Eco
no
my
The Trailing 6-Month Moving Average6 Months Ended Avg. Dollar Vol. Avg. Transaction Vol.Mar 2013 - Mar 2014
2013 Mar $730,837,167 59
Apr $750,941,614 58
May $734,264,549 58
Jun $504,859,958 47
Jul $624,295,780 52
Aug $670,100,746 58
Sep $722,200,720 60
Oct $735,942,586 64
Nov $880,852,017 63
Dec $913,282,256 65
2014 Jan $857,237,240 64
Feb $885,139,220 60
Mar $962,326,419 61
Mar
Ap
r
May
Jun
Jul
Au
g
Sep
Oc
t
No
v
De
c
Jan
Feb
Mar
Legend: Transaction Volume Dollar Volume
$1b
$950mm
$900mm
$850mm
$800mm
$750mm
$700mm
$650mm
$600mm
$550mm
$500mm
80
75
70
65
60
55
50
45
40
35
30
Legend: Transaction Volume
Dollar Volume
Average monthly dollar volume and transaction count for given month and five months prior
Transaction & Dollar Volume By Quarter | The Trailing 6-Month Moving Average
U.S. creates 114,000 jobs in Sep-tember; unemployment rate falls to 7.8% | NYC multifamily sales jump in August | New York City multifamily transactions jump 26 percent in the third quarter | GDP increases 2 percent in the third quarter | City looking to recover from Sandy devastation | U.S. jobless claims increase following Sandy | Third quarter GDP revised to 2.7 percent | U.S. adds 146,000 jobs in November | Governor announces $738 million in eco-nomic development grants
Congress settles uncertainty over Capital Gains tax | Dol-lar value of NYC multifamily transactions jump 86 percent in November 2012 compared to November 2011 | NYC mul-tifamily sales rise to $7.8 billion in 2012, a 54 percent increase from 2011 | World-Class Civil Rights Museum planned for Harlem | Manhattan real estate transactions reach $21.1 billion in 2012 | U.S. home prices rise 5.5 percent
Westbrook & Shaul East Vil-lage MF Portfolio of 17 walk-up apartment buildings in Down-town Manhattan sold for a total of about $130mm | 10 Upper Manhattan multifamily proper-ties known as the Decathlon portfolio sold for $49mm | 2-12 Pinehurst Ave, 2 eleva-tored Inwood properties sold for $16.7mm | Kushner paid $49mm for Shaoul portfo-lio | 3 W 86th St building sold for $530k per unit | 600-unit West Harlem package sells for $75mm | Extell sells off 2nd Ave properties
G-Way Management purchases 53-unit mixed-use building in Hamilton Heights | 122-unit Bay Ridge elevatored building sells for $19.8mm | Astoria port-folio sells for $240 per square foot | Stone Street Properties purchases 140k SF portfolio | Brookdale sells four apartment buildings for $22mm | Pair of Long Island City buildings sell for $141 per SF | Rose Associates sells luxury tower for $300mm | 10-building package sells for $152 per SF | Omni buys 1600-unit affordable housing complex | Dermot purchases 127,000 SF Queens package
Manhattan and Brooklyn rents increase in March | After-effects of big 2012 linger, but tight inventory pushing prices higher | First quarter multifam-ily transaction volume holds steady year-over-year | U.S. economy adds 165,000 jobs in April | State announces sup-port for affordable housing projects | Fed weighing future monetary policy options | New York City named world’s most competitive city | NYC mul-tifamily sales in April stable month-over-month | City & State unemployment rates fall to ‘09 levels
City Planning Commission approves new developments | Second quarter GDP re-vised upward to 2.5% | U.S. Economy adds 169,000 jobs in August | NYC multifam-ily transactions continue to strengthen in July | Fed votes to maintain accommoda-tive monetary policy | Man-hattan home prices surpass pre-recession peak in second quarter | NYC tech industry emerges as second largest engine for local economy | Panel shares positive outlook for multifamily market at NYC Real Estate Expo
August NYC multifamily trans-actions hold steady year-over-year | NYC multifamily sales increase in the 3Q | Fed votes to maintain accommodative policy | U.S. Economy adds 204,000 jobs in October | Institutional sales push NYC multifamily volume up 71% year-over-year in September | City’s vacant lots receive scru-tiny | Nation creates 203,000 jobs in November | NYC mul-tifamily transactions hit high mark in October | Federal Reserve announces monetary policy change
Manhattan Apartment Sales Reach 25-Year Record | Gov. Cuomo Proposes Tax Cuts to Attract Businesses and Jobs | Solid Gains for New York City Investment Property Sales in 2013 | NYC Construction Starts Increase 11% in 2013 | Borough President Outlines Aggressive Agenda for the “New Bronx” | January Multifamily Sales Show Strong Start To 2014 | Hudson Yards Developer Agrees to ‘Liv-ing Wage’ Policy | New York City Sees Net Gain in Population for Third Consecutive Year
Ziel Feldman’s HFZ buys West-brook Partners’ residential portfolio for $600mm | Silver-stone, RWN pay $72mm for Kips Bay package | Vantage Properties sold 2 Ellwood Street & 64 Hillside Avenue Portfolio for $48.2mm | BRG acquires $68M Queens portfo-lio from Area Property Partners | Harbor Group buys UES rental building for $20.5M | Orbach Group extends buying spree with UWS and West Harlem packages
Ares buys 29 Queens proper-ties for $200k per unit | Mixed-Use building at 100 Christopher Street purchased by Delshah for over $1,200 per SF | Rain-bow purchases 84-building Harlem portfolio for $339mm | Emmes purchases Bronx Com-mercial Portfolio for $652 per SF | Pair of Astoria elevatored buildings nab $60mm
Family Sells $53M Bronx Port-folio | South Brooklyn Rental Portfolio Sells For $78M | California Group Adds To NYC Portfolio, Buys 15 Cliff For $95M | Pinnacle Buys Out Part-ner In $208M Brooklyn Deal | DLJ Picks Up Brooklyn Heights Rentals For $39M | Plenty Of Green As Silverstone Sells The Grayson For $100M | Thor Equities, GreenOak Close On UWS Rentals For $85M | Chel-sea Rental Building Trades For Close To $80M | Commercial Firm BLDG Management Nabs Murray Hill Rentals
Calif. pension fund pays $400mm for UWS apartment portfolio | Treetop makes first Queens multifamily portfolio purchase for $82mm | 11 Bow-ery buildings sold for $62mm | Greenwich Village apart-ment and retail portfolio trades hands for $34mm | Two Mid-town West buildings trade for $25.5mm or $880 per SF
2013 2014

Ariel Property Advisors | Building Results | 122 East 42nd Street, Suite 1015 - New York NY 10168 | 212.544.9500 | arielpa.com |9
Multifamily Quarter In Review: New York City | Q1 2014
Macro-Economic Overview: Unemployment | Financing | Revenue | Expenses
Unemployment: Rental Market / Vacancy:
The first quarter of 2014 has shown a slight bump in the unemployment rate on a city and state level, though the overall trend for the last 18 months has been a thoroughly positive one. The latest statistics have unemployment sitting at 8.6%, an improve-ment over the same period in 2013, when the rate consistently sat above 9%. On a national level, the ADP National Unemployment Report found that the US Economy added 191,000 private sector jobs in March alone, an encouraging sign for current and future growth.
At the end of the 1Q, Manhattan vacancy rates came in at 1.46%, the same rate the borough experienced after the first quarter of 2013. SoHo and TriBeCa had the lowest vacancy rate of any area of Man-hattan, while also commanding the highest rents. Over in Brooklyn, DUMBO remained the most expensive rental market, though a few other neighborhoods are beginning to catch up. Both Crown Heights and Bed-Stuy saw large year-over-year increases in average rents, in-creasing 16% and 12%, respectively.
Financing: Expenses:
As treasury rates rose over the summer months of 2013, many predicted a continu-ation of that trend, restoring treasury rates closer to historical norms. But as the end of 2013 and the early part of 2014 have shown, that may not be the case. Interest rate increases have slowed down in the first quarter of 2014, remaining below 4% for 30-year bonds. 10-year and 5-year notes dipped slightly to start 2014 to 2.61% and 1.44%, respectively. 1-year Treasury bills remained relatively flat, dropping from .13% to .11% since January.
The Mid-Atlantic January residential electricity rate increased slightly to 15.63 cents per kilowatt hour (KWH). The New York State Energy Research and Development Authority (NYSERDA) reported the March price of No. 2 home heating at 424.1 cents per gallon, a modest de-crease from February.
Residential Electricity RatesRegional - Middle Atlantic (Cents / KWH)
Source: US EIA
2008 2009 2010 2011 2012 2013 2014
Cents
17.5
15
12.5
Unemployment Rate History
NYS (Seasonally Adjusted) & NYC (Not Seasonally Adjusted)
Source: NYS Dept Of Labor
%10%
7.5%
5%
2.5%
Treasury Yield Curve Rates
30-year | 10-year | 5-year | 1-year
Source: US Treasury Dept.
%6%
4%
2%
0%
Home Heating Oil PricesMonthly Average (cents per gallon)
500
400
300
200
100
Source: NYSERDA
2008 2009 2010 2011 2012 2013 2014
Cents Per Gallon
2007
7.7%
8.6%
Transaction & Dollar Volume By Quarter | The Trailing 6-Month Moving Average
Manhattan Rental Vacancy Rates | Monthly Percentage Change
1.46% 1.28% 1.09% 1.10% 1.28% 1.31% 1.48% 1.65% 1.74% 1.82% 1.62% 1.50% 1.46%
2.5%
2%
1.5%
1%
0.5%
0%
Mar Apr May Jun Jul Aug Sep Oct Nov Dec Jan Feb Mar
Source: Citi Habitats2004 2005 2006 2007 2008 2009 2010 2011 2012 2013 2014
2004 2005 2006 2007 2008 2009 2010 2011 2012 2013 2014
10| Ariel Property Advisors | Building Results | 122 East 42nd Street, Suite 1015 - New York NY 10168 | 212.544.9500 | arielpa.com
Multifamily Quarter In Review: New York City | Q1 2014H
igh
ligh
ted
Tran
sact
ion
s
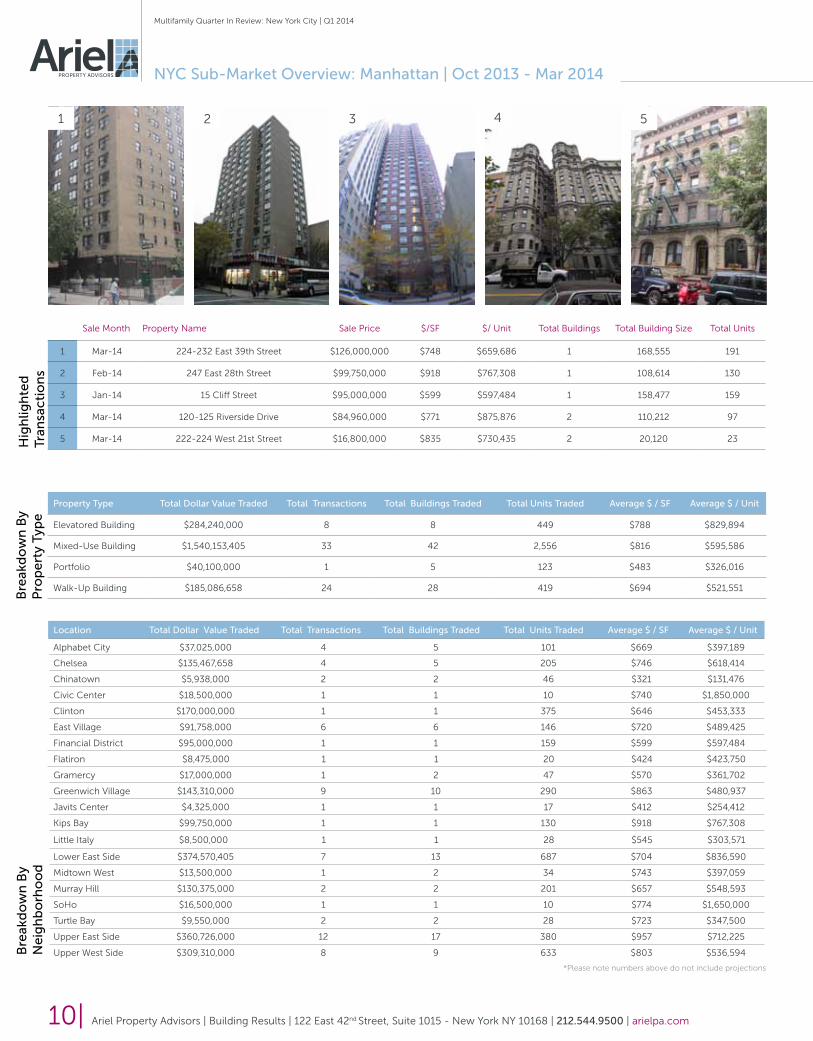
Sale Month Property Name Sale Price $/SF $/ Unit Total Buildings Total Building Size Total Units
1 Mar-14 224-232 East 39th Street $126,000,000 $748 $659,686 1 168,555 191
2 Feb-14 247 East 28th Street $99,750,000 $918 $767,308 1 108,614 130
3 Jan-14 15 Cliff Street $95,000,000 $599 $597,484 1 158,477 159
4 Mar-14 120-125 Riverside Drive $84,960,000 $771 $875,876 2 110,212 97
5 Mar-14 222-224 West 21st Street $16,800,000 $835 $730,435 2 20,120 23
11 2 3 4 5
NYC Sub-Market Overview: Manhattan | Oct 2013 - Mar 2014
Property Type Total Dollar Value Traded Total Transactions Total Buildings Traded Total Units Traded Average $ / SF Average $ / Unit
Elevatored Building $284,240,000 8 8 449 $788 $829,894
Mixed-Use Building $1,540,153,405 33 42 2,556 $816 $595,586
Portfolio $40,100,000 1 5 123 $483 $326,016
Walk-Up Building $185,086,658 24 28 419 $694 $521,551
Bre
akd
ow
n B
y P
rop
ert
y Ty
pe
Bre
akd
ow
n B
y N
eig
hb
orh
oo
d
Location Total Dollar Value Traded Total Transactions Total Buildings Traded Total Units Traded Average $ / SF Average $ / Unit
Alphabet City $37,025,000 4 5 101 $669 $397,189
Chelsea $135,467,658 4 5 205 $746 $618,414
Chinatown $5,938,000 2 2 46 $321 $131,476
Civic Center $18,500,000 1 1 10 $740 $1,850,000
Clinton $170,000,000 1 1 375 $646 $453,333
East Village $91,758,000 6 6 146 $720 $489,425
Financial District $95,000,000 1 1 159 $599 $597,484
Flatiron $8,475,000 1 1 20 $424 $423,750
Gramercy $17,000,000 1 2 47 $570 $361,702
Greenwich Village $143,310,000 9 10 290 $863 $480,937
Javits Center $4,325,000 1 1 17 $412 $254,412
Kips Bay $99,750,000 1 1 130 $918 $767,308
Little Italy $8,500,000 1 1 28 $545 $303,571
Lower East Side $374,570,405 7 13 687 $704 $836,590
Midtown West $13,500,000 1 2 34 $743 $397,059
Murray Hill $130,375,000 2 2 201 $657 $548,593
SoHo $16,500,000 1 1 10 $774 $1,650,000
Turtle Bay $9,550,000 2 2 28 $723 $347,500
Upper East Side $360,726,000 12 17 380 $957 $712,225
Upper West Side $309,310,000 8 9 633 $803 $536,594
*Please note numbers above do not include projections
Ariel Property Advisors | Building Results | 122 East 42nd Street, Suite 1015 - New York NY 10168 | 212.544.9500 | arielpa.com |11
Multifamily Quarter In Review: New York City | Q1 2014
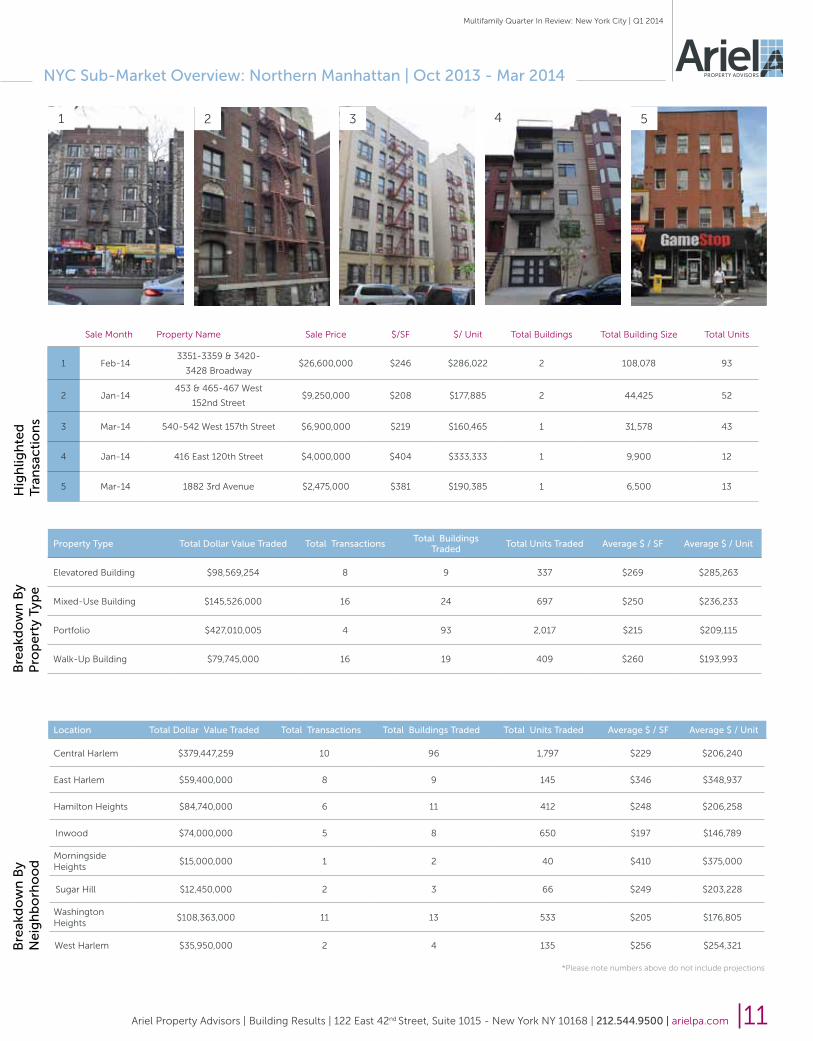
NYC Sub-Market Overview: Northern Manhattan | Oct 2013 - Mar 2014
Property Type Total Dollar Value Traded Total TransactionsTotal Buildings
TradedTotal Units Traded Average $ / SF Average $ / Unit
Elevatored Building $98,569,254 8 9 337 $269 $285,263
Mixed-Use Building $145,526,000 16 24 697 $250 $236,233
Portfolio $427,010,005 4 93 2,017 $215 $209,115
Walk-Up Building $79,745,000 16 19 409 $260 $193,993
Bre
akd
ow
n B
y P
rop
ert
y Ty
pe
Bre
akd
ow
n B
y N
eig
hb
orh
oo
d
11 2 3 4 5
Sale Month Property Name Sale Price $/SF $/ Unit Total Buildings Total Building Size Total Units
1 Feb-143351-3359 & 3420-
3428 Broadway$26,600,000 $246 $286,022 2 108,078 93
2 Jan-14453 & 465-467 West
152nd Street$9,250,000 $208 $177,885 2 44,425 52
3 Mar-14 540-542 West 157th Street $6,900,000 $219 $160,465 1 31,578 43
4 Jan-14 416 East 120th Street $4,000,000 $404 $333,333 1 9,900 12
5 Mar-14 1882 3rd Avenue $2,475,000 $381 $190,385 1 6,500 13Hig
hlig
hte
dTr
ansa
ctio
ns
Location Total Dollar Value Traded Total Transactions Total Buildings Traded Total Units Traded Average $ / SF Average $ / Unit
Central Harlem $379,447,259 10 96 1,797 $229 $206,240
East Harlem $59,400,000 8 9 145 $346 $348,937
Hamilton Heights $84,740,000 6 11 412 $248 $206,258
Inwood $74,000,000 5 8 650 $197 $146,789
Morningside Heights
$15,000,000 1 2 40 $410 $375,000
Sugar Hill $12,450,000 2 3 66 $249 $203,228
Washington Heights
$108,363,000 11 13 533 $205 $176,805
West Harlem $35,950,000 2 4 135 $256 $254,321
*Please note numbers above do not include projections

12| Ariel Property Advisors | Building Results | 122 East 42nd Street, Suite 1015 - New York NY 10168 | 212.544.9500 | arielpa.com
Multifamily Quarter In Review: New York City | Q1 2014
NYC Sub-Market Overview: Bronx | Oct 2013 - Mar 2014
Bre
akd
ow
n B
y P
rop
ert
y Ty
pe
Bre
akd
ow
n B
y N
eig
hb
orh
oo
d
Property Type Total Dollar Value Traded Total Transactions Total Buildings Traded Total Units Traded Average $ / SF Average $ / Unit
Elevatored Building $109,463,038 10 12 844 $135 $135,367
Mixed-Use Building $362,164,959 31 60 3,230 $119 $106,162
Portfolio $16,578,352 1 5 269 $80 $61,630
Walk-Up Building $149,429,558 40 57 1,718 $102 $86,113
Hig
hlig
hte
dTr
ansa
ctio
ns
Sale Month Property Name Sale Price $/SF $/ Unit Total Buildings Total Building Size Total Units
1 Feb-14Wasserman Realty Bronx
Multifamily Portfolio$91,450,000 $124 $123,748 12 737,217 739
2 Jan-14Pelham Parkway
Multifamily Portfolio$52,500,000 $156 $172,131 4 336,427 305
3 Jan-14Pinnacle Group Bronx Multifamily Portfolio
$33,750,000 $111 $126,880 3 304,584 266
4 Jan-14 The Belmont-Venezia Portfolio $18,550,000 $107 $104,213 3 172,606 178
5 Jan-14 2985-2995 Botanical Square $17,050,000 $96 $88,342 2 178,200 193
Location Total Dollar Value Traded Total Transactions Total Buildings Traded Total Units Traded Average $ / SF Average $ / Unit
Bathgate $12,300,286 2 5 155 $98 $81,281
Bedford Park $108,340,000 5 16 909 $96 $103,108
Belmont $87,430,725 9 18 818 $135 $124,790
Bronxdale $4,300,000 2 2 53 $98 $81,176
Castle Hill $2,040,000 1 1 27 $81 $75,556
Crotona Park $2,125,000 1 1 25 $128 $85,000
East Tremont $41,650,000 2 4 483 $98 $86,524
Fordham $70,004,000 8 15 660 $111 $98,455
Highbridge $43,288,352 7 11 545 $98 $92,521
Hunts Point $3,225,000 1 1 35 $95 $92,143
Jerome Park $17,050,000 1 2 193 $96 $88,342
Kingsbridge $21,900,000 2 2 140 $165 $141,716
Kingsbridge Heights $20,878,000 7 7 239 $99 $86,806
Melrose $26,440,334 6 9 320 $112 $82,062
Morris Park $52,500,000 1 4 305 $156 $172,131
Morrisania $41,060,000 6 8 447 $122 $90,920
Mott Haven $5,200,340 4 5 60 $102 $89,146
Mount Hope $58,975,538 10 10 520 $122 $111,001
Parkchester $2,500,000 1 1 30 $99 $83,333
Pelham Parkway $18,000,000 1 1 139 $108 $129,496
Soundview $19,428,332 3 11 208 $105 $92,235
Williamsbridge $15,000,000 3 3 168 $100 $88,932
*Please note numbers above do not include projections
1 2 3 4 5

Ariel Property Advisors | Building Results | 122 East 42nd Street, Suite 1015 - New York NY 10168 | 212.544.9500 | arielpa.com |13
Multifamily Quarter In Review: New York City | Q1 2014
NYC Sub-Market Overview: Bronx | Oct 2013 - Mar 2014 NYC Sub-Market Overview: Brooklyn | Oct 2013 - Mar 2014
Bre
akd
ow
n B
y P
rop
ert
y Ty
pe
Bre
akd
ow
n B
y N
eig
hb
orh
oo
d
Property Type Total Dollar Value Traded Total Transactions Total Buildings Traded Total Units Traded Average $ / SF Average $ / Unit
Elevatored Building $512,322,960 22 31 2,144 $269 $288,436
Mixed-Use Building $66,417,500 20 32 394 $252 $209,185
Portfolio $247,200,625 3 32 1,593 $344 $219,731
Walk-Up Building $272,893,527 69 95 1,924 $193 $154,255
Hig
hlig
hte
dTr
ansa
ctio
ns
Sale Month Property Name Sale Price $/SF $/ Unit Total Buildings Total Building Size Total Units
1Jan-14
Kensington Associates Brighton Beach Multifamily
Portfolio$70,600,000 $189 $176,942 4 374,532 399
2 Feb-14 25 Monroe Place $38,500,000 $634 $574,627 1 60,720 67
3 Feb-14 Brooklyn Law School Portfolio $36,500,000 $648 $331,818 2 56,342 110
4 Jan-14 596 Bushwick Avenue $4,000,000 $205 $181,818 1 19,460 22
5 Jan-14 315-329 Lincoln Place $12,800,000 $305 $256,000 4 41,920 50
6 Feb-14 991-993 President Street $9,000,000 $195 $142,857 2 46,112 63
Location Total Dollar Value Traded Total Transactions Total Buildings Traded Total Units Traded Average $ / SF Average $ / Unit
Bath Beach $3,500,000 1 1 25 $193 $140,000
Bay Ridge $15,025,000 4 6 88 $224 $184,017
Bedford-Stuyvesant $42,250,000 7 7 163 $270 $217,317
Bensonhurst $6,780,000 3 3 47 $156 $144,503
Boerum Hill $3,725,000 1 3 10 $284 $372,500
Borough Park $2,700,000 1 1 32 $115 $84,375
Brighton Beach $73,775,000 2 5 420 $183 $164,066
Brooklyn (mixed portfolio) $217,373,125 3 33 1,523 $186 $177,521
Brooklyn Heights $78,900,000 3 4 187 $652 $432,148
Brownsville $6,537,500 2 3 66 $114 $95,564
Bushwick $9,400,000 3 5 54 $196 $173,106
Canarsie $2,200,000 1 1 21 $120 $104,762
Carroll Gardens $15,400,000 1 1 20 $506 $770,000
Clinton Hill $40,543,260 6 8 129 $307 $256,423
Crown Heights $87,450,000 17 24 631 $166 $136,497
Cypress Hills $1,125,000 1 1 15 $173 $75,000
Downtown $9,200,000 1 1 23 $418 $400,000
East Flatbush $21,530,000 4 4 182 $154 $120,178
Flatbush $133,830,000 16 22 1,026 $143 $119,752
Flatlands $1,800,000 1 1 16 $141 $112,500
Fort Hamilton $7,000,000 2 4 43 $194 $151,137
Gravesend $16,700,000 2 2 113 $162 $147,312
Greenpoint $72,000,000 1 1 130 $415 $553,846
Kensington $4,475,000 2 4 48 $90 $91,161
Midwood $18,283,000 4 7 104 $200 $267,382
Ocean Hill $4,740,000 3 3 52 $164 $90,764
Ocean Parkway $2,200,000 1 2 12 $297 $183,333
Park Slope $26,100,000 6 8 105 $335 $256,900
Prospect Heights $18,200,000 2 5 108 $209 $174,552
Prospect Lefferts Garden $17,925,000 3 7 119 $189 $170,467
Sheepshead Bay $70,985,750 2 3 302 $272 $272,308
Sunset Park $11,981,977 4 5 122 $171 $129,371
Williamsburg $55,200,000 4 5 119 $421 $409,143
*Please note numbers above do not include projections
11 2 3 4 5 6

14| Ariel Property Advisors | Building Results | 122 East 42nd Street, Suite 1015 - New York NY 10168 | 212.544.9500 | arielpa.com
Multifamily Quarter In Review: New York City | Q1 2014
NYC Sub-Market Overview: Queens | Oct 2013 - Mar 2014
Bre
akd
ow
n B
y P
rop
ert
y Ty
pe
Bre
akd
ow
n B
y N
eig
hb
orh
oo
d
Property Type Total Dollar Value Traded Total Transactions Total Buildings TradedTotal Units
TradedAverage $ / SF Average $ / Unit
Elevatored Building $194,067,730 8 18 1,052 $234 $204,962
Mixed-Use Building $126,440,812 11 18 627 $252 $266,063
Portfolio $403,318,937 3 33 2,041 $254 $184,683
Walk-Up Building $44,268,297 14 19 344 $169 $126,465
Hig
hlig
hte
dTr
ansa
ctio
ns
Sale Month Property Name Sale Price $/SF $/ Unit Total Buildings Total Building Size Total Units
1 Mar-14Urban American Queens
Multifamily Portfolio$52,000,000 $137 $122,931 5 378,261 423
2 Mar-1487-40,42 Elmhurst Ave
& 43-31 45th St & 41-96 Gleane St
$47,098,812 $194 $170,032 4 242,210 277
3 Mar-1446-15 & 49-15 Skillman
Avenue$37,771,174 $278 $192,710 2 136,028 196
4 Mar-14 88-15 168th Street $27,400,000 $212 $143,455 1 128,961 191
Location Total Dollar Value Traded Total Transactions Total Buildings Traded Total Units Traded Average $ / SF Average $ / Unit
Astoria $129,296,000 9 11 376 $282 $260,190
Bayside $6,000,000 1 1 36 $219 $166,667
Briarwood $7,500,000 1 2 74 $244 $101,351
Douglaston $28,500,000 1 2 148 $249 $192,568
Elmhurst $77,678,812 5 9 366 $253 $219,237
Far Rockaway $65,727,730 4 13 610 $110 $93,694
Flushing $11,500,000 1 1 34 $400 $338,235
Flushing-North $1,450,000 1 1 12 $126 $120,833
Holliswood $12,731,863 1 1 95 $186 $134,020
Jackson Heights $11,828,297 2 3 67 $233 $177,674
Jamaica $34,460,000 3 3 249 $149 $122,035
Jamaica Hills $9,840,000 1 1 112 $169 $87,857
Richmond Hill $4,850,000 2 5 56 $101 $83,125
Ridgewood $1,280,000 1 2 12 $237 $106,667
Rockaway $4,966,000 1 1 15 $249 $331,067
St. Albans $2,300,000 1 3 24 $124 $95,833
Sunnyside $397,468,937 2 31 2,005 $258 $195,774
Woodhaven $1,950,000 1 1 16 $143 $121,875
*Please note numbers above do not include projections
1 2 3 4

Ariel Property Advisors | Building Results | 122 East 42nd Street, Suite 1015 - New York NY 10168 | 212.544.9500 | arielpa.com |15
Multifamily Quarter In Review: New York City | Q1 2014
About Ariel Property Advisors
Investment Sales Brokerage | NYCAriel Property Advisors is a New York City investment property sales firm founded by Shimon Shkury.
From multifamily portfolios to office buildings and vacant lots to warehouses, the Company has successfully
handled nearly every different kind of asset class and transaction size. Our success has led us to develop a
vast network of relationships with investors, developers, institutions, brokers and other market participants
throughout the region.
Our ApproachAriel Property Advisors is committed to providing unmatched value for our clients by combining top-notch,
relationship-driven investment sales professionals with cutting edge technology and research support.
For every deal size and asset type, we assign a team of professionals to ensure superior asset positioning,
broad marketing efforts, sophisticated negotiation tactics and a smooth closing. All clients benefit from the
close collaboration of senior and junior professionals.
Asset Evaluation
Utilizing the joint efforts of our investment sales and investment research teams, an Asset Evaluation will pro-
vide you with a thorough analysis of your investment property. Combining comprehensive financial analyses
with real time market data, our Asset Evaluation will help you both establish the current market value of the
asset and identify the primary value drivers affecting the price. Our team will not only review today’s pricing
environment but also explore every possible opportunity that could result in maximizing the asset’s value, be
it today or in the future. The best part – it’s free.
Exclusive Market ResearchOur investment research professionals strive to provide our sales staff, clients and industry leaders with the
latest market information. Our expertise in multifamily sales is supported by our New York City multifamily re-
search reports, which are produced and distributed monthly, quarterly, and annually. We also produce a variety
of comprehensive research reports that illustrate the latest in real estate and economic trends throughout
the boroughs.
For More Information Please call 212.544.9500 or visit arielpa.com
NYC Sub-Market Overview: Queens | Oct 2013 - Mar 2014
16| Ariel Property Advisors | Building Results | 122 East 42nd Street, Suite 1015 - New York NY 10168 | 212.544.9500 | arielpa.com
Multifamily Quarter In Review: New York City | Q1 2014
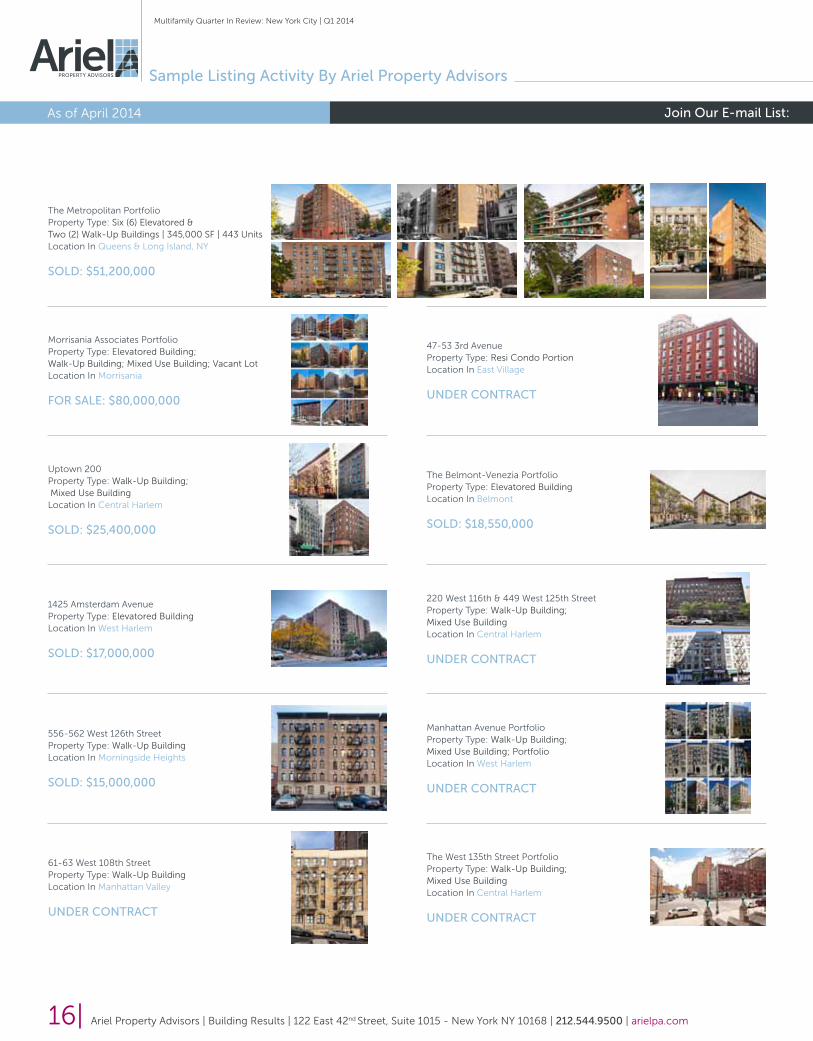
Sample Listing Activity By Ariel Property Advisors
As of April 2014 Join Our E-mail List: e-mail us at [email protected] or visit arielpa.com
Morrisania Associates PortfolioProperty Type: Elevatored Building; Walk-Up Building; Mixed Use Building; Vacant LotLocation In Morrisania
FOR SALE: $80,000,000
The Metropolitan PortfolioProperty Type: Six (6) Elevatored & Two (2) Walk-Up Buildings | 345,000 SF | 443 UnitsLocation In Queens & Long Island, NY
SOLD: $51,200,000
47-53 3rd AvenueProperty Type: Resi Condo PortionLocation In East Village
UNDER CONTRACT
Uptown 200Property Type: Walk-Up Building; Mixed Use BuildingLocation In Central Harlem
SOLD: $25,400,000
The Belmont-Venezia PortfolioProperty Type: Elevatored BuildingLocation In Belmont
SOLD: $18,550,000
1425 Amsterdam AvenueProperty Type: Elevatored BuildingLocation In West Harlem
SOLD: $17,000,000
220 West 116th & 449 West 125th StreetProperty Type: Walk-Up Building; Mixed Use BuildingLocation In Central Harlem
UNDER CONTRACT
556-562 West 126th StreetProperty Type: Walk-Up BuildingLocation In Morningside Heights
SOLD: $15,000,000
Manhattan Avenue PortfolioProperty Type: Walk-Up Building; Mixed Use Building; PortfolioLocation In West Harlem
UNDER CONTRACT
61-63 West 108th StreetProperty Type: Walk-Up BuildingLocation In Manhattan Valley
UNDER CONTRACT
The West 135th Street PortfolioProperty Type: Walk-Up Building; Mixed Use BuildingLocation In Central Harlem
UNDER CONTRACT

Ariel Property Advisors | Building Results | 122 East 42nd Street, Suite 1015 - New York NY 10168 | 212.544.9500 | arielpa.com |17
Multifamily Quarter In Review: New York City | Q1 2014
Sample Listing Activity By Ariel Property Advisors Sample Listing Activity By Ariel Property Advisors
As of April 2014Join Our E-mail List: e-mail us at [email protected] or visit arielpa.com
1340-1350 Stratford AvenueProperty Type: Elevatored BuildingLocation In Soundview
FOR SALE: $11,500,000
4720 BroadwayProperty Type: Elevatored Building; Mixed Use BuildingLocation In Washington Heights
SOLD: $11,360,000
453 & 465-467 West 152nd StreetProperty Type: Walk-Up BuildingLocation In Sugar Hill
SOLD: $9,250,000
500 Ft Washington AvenueProperty Type: Walk-Up Building; Mixed Use BuildingLocation In Washington Heights
SOLD: $8,620,000
22-24 Mount Morris Park WestProperty Type: Elevatored BuildingLocation In Central Harlem
UNDER CONTRACT
143-48 41st AvenueProperty Type: Elevatored BuildingLocation In Flushing-North
SOLD: $8,110,000
163 West 80th StreetProperty Type: Walk-Up Building; Condo BuildingLocation In Upper West Side
SOLD: $7,650,000
1314 Seneca AvenueProperty Type: Elevatored Building; Mixed Use BuildingLocation In Hunts Point
SOLD: $6,900,000
540-542 West 157th StreetProperty Type: Elevatored BuildingLocation In Washington Heights
SOLD: $6,900,000
New Sierra PortfolioProperty Type: Walk-Up Building; Mixed Use Building; PortfolioLocation In Central Harlem
SOLD: $5,250,000
313 West 77th StreetProperty Type: Walk-Up BuildingLocation In Upper West Side
SOLD: $5,200,000
950 Columbus AvenueProperty Type: Walk-Up Building; Mixed Use BuildingLocation In Upper West Side
SOLD: $5,100,000
18| Ariel Property Advisors | Building Results | 122 East 42nd Street, Suite 1015 - New York NY 10168 | 212.544.9500 | arielpa.com
Multifamily Quarter In Review: New York City | Q1 2014
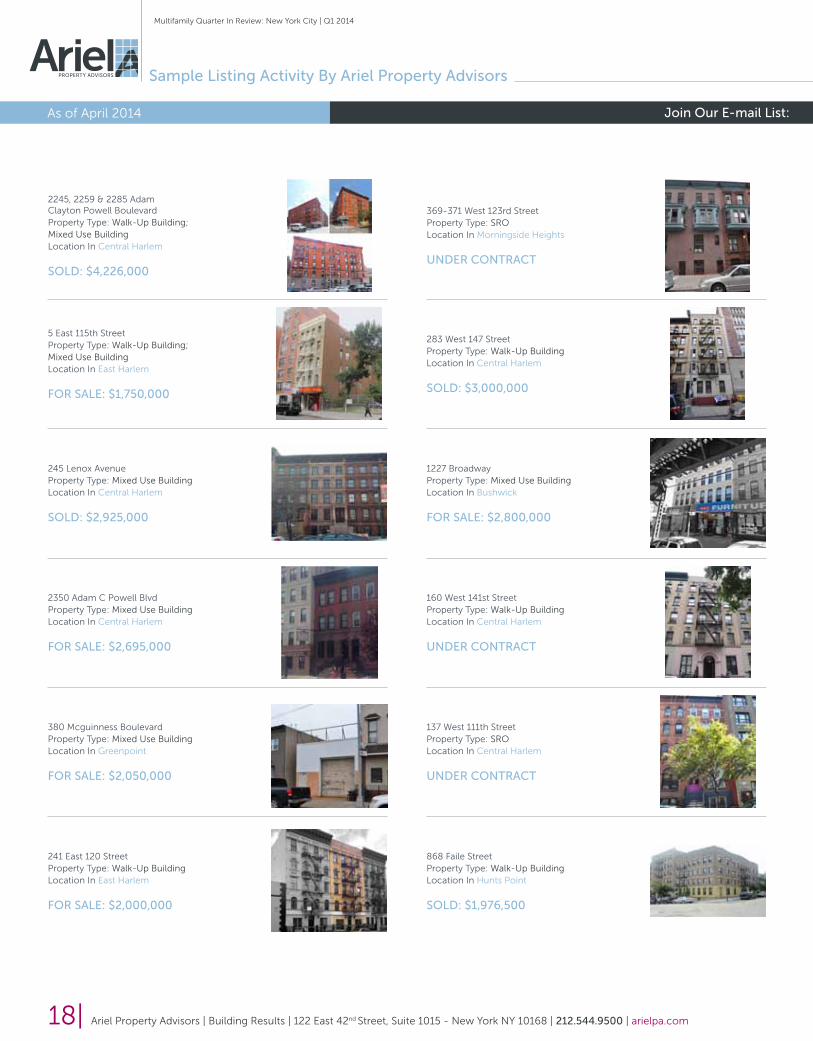
Sample Listing Activity By Ariel Property Advisors
As of April 2014 Join Our E-mail List: e-mail us at [email protected] or visit arielpa.com
5 East 115th StreetProperty Type: Walk-Up Building; Mixed Use BuildingLocation In East Harlem
FOR SALE: $1,750,000
283 West 147 StreetProperty Type: Walk-Up BuildingLocation In Central Harlem
SOLD: $3,000,000
245 Lenox AvenueProperty Type: Mixed Use BuildingLocation In Central Harlem
SOLD: $2,925,000
1227 BroadwayProperty Type: Mixed Use BuildingLocation In Bushwick
FOR SALE: $2,800,000
2350 Adam C Powell BlvdProperty Type: Mixed Use BuildingLocation In Central Harlem
FOR SALE: $2,695,000
160 West 141st StreetProperty Type: Walk-Up BuildingLocation In Central Harlem
UNDER CONTRACT
380 Mcguinness BoulevardProperty Type: Mixed Use BuildingLocation In Greenpoint
FOR SALE: $2,050,000
137 West 111th StreetProperty Type: SROLocation In Central Harlem
UNDER CONTRACT
241 East 120 StreetProperty Type: Walk-Up BuildingLocation In East Harlem
FOR SALE: $2,000,000
868 Faile StreetProperty Type: Walk-Up BuildingLocation In Hunts Point
SOLD: $1,976,500
2245, 2259 & 2285 Adam Clayton Powell BoulevardProperty Type: Walk-Up Building; Mixed Use BuildingLocation In Central Harlem
SOLD: $4,226,000
369-371 West 123rd StreetProperty Type: SROLocation In Morningside Heights
UNDER CONTRACT

Ariel Property Advisors | Building Results | 122 East 42nd Street, Suite 1015 - New York NY 10168 | 212.544.9500 | arielpa.com |19
Multifamily Quarter In Review: New York City | Q1 2014
Sample Listing Activity By Ariel Property Advisors Sample Listing Activity By Ariel Property Advisors
As of April 2014Join Our E-mail List: e-mail us at [email protected] or visit arielpa.com
508 West 149th StreetProperty Type: TownhouseLocation In Hamilton Heights
FOR SALE: $1,950,000
735 Saint Nicholas AvenueProperty Type: Mixed Use BuildingLocation In Hamilton Heights
FOR SALE: $1,895,000
2381 Belmont AvenueProperty Type: Elevatored Building; Mixed Use BuildingLocation In Belmont
FOR SALE: $1,800,000
315 West 112th StreetProperty Type: SROLocation In Morningside Heights
SOLD: $1,675,000
347 East 105th StreetProperty Type: Walk-Up BuildingLocation In East Harlem
SOLD: $1,675,000
156 Graham AvenueProperty Type: Mixed Use BuildingLocation In Williamsburg
SOLD: $1,615,000
2299 Adam C Powell BoulevardProperty Type: Walk-Up Building; Mixed Use BuildingLocation In Central Harlem
SOLD: $1,412,500
690 Monroe StreetProperty Type: Walk-Up BuildingLocation In Bedford-Stuyvesant
FOR SALE: Please inquire for details
17-17 Himrod StreetProperty Type: Walk-Up BuildingLocation In Ridgewood
FOR SALE: $1,300,000
2427 Hoffman StreetProperty Type: Walk-Up BuildingLocation In Belmont
FOR SALE: $1,250,000
53 West 127th StreetProperty Type: Walk-Up BuildingLocation In Central Harlem
SOLD: $1,140,000
647 Bryant AvenueProperty Type: Mixed Use BuildingLocation In Hunts Point
FOR SALE: $1,050,000

v5
The information contained herein has either been given to us by the owner of the property or obtained from sources that we deem reliable. We have no reason to doubt its accuracy but we do not guarantee the accuracy of any informa-tion provided herein. As an example, all zoning information, buildable footage estimates and indicated uses must be independently verified. Vacancy factors used herein are an arbitrary percentage used only as an example, and does not necessarily relate to actual vacancy, if any. The value of this prospective investment is dependent upon these estimates and assumptions made above, as well as the investment income, the tax bracket, and other factors which your tax advisor and/or legal counsel should evaluate. The prospective buyer should carefully verify each item of income, and all other information contained herein.
To visit our website please go to arielpa.com or scan the tag to the right with your smartphone K
no
w T
he
Mar
ket
Do
Th
e R
ese
arc
h
Join
Ou
r N
etw
ork
Know The ValueContact us to request aComplimentary Asset Evaluation
212.544.9500
MULTIFAMILY QUARTER IN REVIEw: NEw YORk CITY
by Ariel Property Advisors | Released April 2014
If you would like to use or quote this report on the web, we ask that you quote the source as “Multifamily Quarter In Review: New York City by Ariel Property Advisors” and link report from our website page (http://arielpa.com/research/reports/)
Investment Sales
Shimon Shkury ext. [email protected]
Marko Agbaba ext. [email protected]
Victor Sozio ext. [email protected]
Akil Rossi ext. [email protected]
Michael A. Tortorici ext. [email protected]
Joshua Berkowitz ext. 41
Randy Modell ext. [email protected]
Investment Research
Jonathan Berman ext. [email protected]
Ivan [email protected]
Scot Hirschfield ext. [email protected]
Aryeh [email protected]
Howard Raber ext. [email protected]
Daniel [email protected]
Mark Spinelli ext. [email protected]
David [email protected]
Daniel Tropp ext. [email protected]
Brett [email protected]
Jesse Deutch ext. [email protected]
Jason Pappas
Jason Gold ext. [email protected]
Sam Stuart
Daniel Wechsler ext. [email protected]
Dusan Panic
To learn more about current market conditions or if you would like a comprehensive Asset Evaluation for your property, please do not hesitate to contact us using the information below:
phone: 212.544.9500