strand: 6.3.3 emphasis 20 minutes 90 minutes 50-70 minutes ...20 minutes (episodes.1 & 2 can be...
TRANSCRIPT

Strand: 6.3.3 Emphasis: Uneven heating of the Earth’s surface (Atacama Desert)
Anticipated Time Required (assuming 50 minute class periods):
Episode 1: Why So Dry? 20 minutes Episode 2: What’s in a Desert System? 20 minutes (Episodes.1 & 2 can be taught together in one day)
Episode 3: The Convection Connection 90 minutes (2 class periods) Episode 4: It’s All About the Interactions 20 minutes Episode 5: Defining the Cause 50-70 minutes (Can be taught over 2 days as needed)
Episode 6: Now I Know Why the Atacama is SO Dry! 30 minutes Dominant CCC: Systems and Systems Models, Energy and Matter, Cause and Effect Dominant SEP: Develop and use a Model
Management Strategies to support equitable access to content:
1. Useexitticketsforquickformativefeedbacktoseewherestudentsarehavingproblems.Askquestionsthatwillrevealdepthofunderstandingandmisconceptions.
2. Studentsshouldbedoingmostoftheworkthroughoutthisstoryline.Thatmeansthattheteachermustmovearoundandlistentowhatstudentsarethinking.Adjustinstruction,pacingandgroupingofstudentsbasedonwhatyouarehearingandobserving.Allstudentscanworkingroups,butitmaytakeafewtriestofindtherightcombinationoflearners.
3. Assessstudentmodelsastheyaredevelopingthem.Youdonotneedto“grade”everytaskyourstudentsrecord,butwalkaroundwithastamporpenandacknowledgeprogress,thinkingandeffort.Thiswillkeepstudentsontask,astheywillknowthattheirworkandthinkingisimportant.Youwillbeabletogiveimmediatefeedbackandseeerrorsearlyon.
Shopping list: GlueSticksChartPaperandMarkers(groupsets)Coloredpencils(redandblue)Post-itNotesPlasticshoeboxes(onepergroup)halffullofwaterBlueandredfoodcoloringIcecubetrayRedfoodcoloringHotpot(electrickettle)oraccesstomicrowaveSmallbottlesorcontainersforhotredwater(onepergroup)C. Penrod

C. Penrod
StorylinePlannerTemplateAnchorPhenomenon:TheAtacamaDesertisthedriestdesertonEarthStudentPerformanceExpectation:DevelopanduseamodeltoshowhowunequalheatingoftheEarth’ssystemscausespatternsofatmosphericandoceaniccirculationthatdetermineregionalclimates.Emphasizehowwarmwaterandairmovefromtheequatortowardthepoles.ExampleofmodelscouldincludeUtahregionalweatherpatternssuchaslake-effectsnowandwintertimetemperatureinversions.
DominantDCI DominantCCC DominantSEP
AllEarthprocessesaretheresultofenergyflowingandmattercyclingwithinandamongtheplanet’ssystems.Thecomplexpatternsofthechangesandthemovementofwaterintheatmosphere,determinedbywinds,landforms,andoceantemperaturesandcurrents,aremajordeterminantsoflocalweatherpatterns.Globalmovementsofwateranditschangesinformarepropelledbysunlightandgravity.Variationsindensityduetovariationsintemperatureandsalinitydriveaglobalpatternofinterconnectedoceancurrents.
PatternsSystemsandSystemsModelsEnergyandMatter
DevelopanduseamodelAnalyzeandinterpretdata
ScienceExperiences
CCC/SEP
Whatarestudentsdoing?(ThisshouldmatchyourSEP!)
Whatspecificunderstandingsshouldstudentsgetfromthisexperience?(Whatpiecesoftheperformanceexpectationdoestheexperience
provide?)
Newquestionsstudentshavetopropelustothenextscience
experience
Assessment
1 PatternsAnalyzingand
AnalyzeandinterpretdataaboutglobalclimatesAskquestionsaboutpatternsonmapof
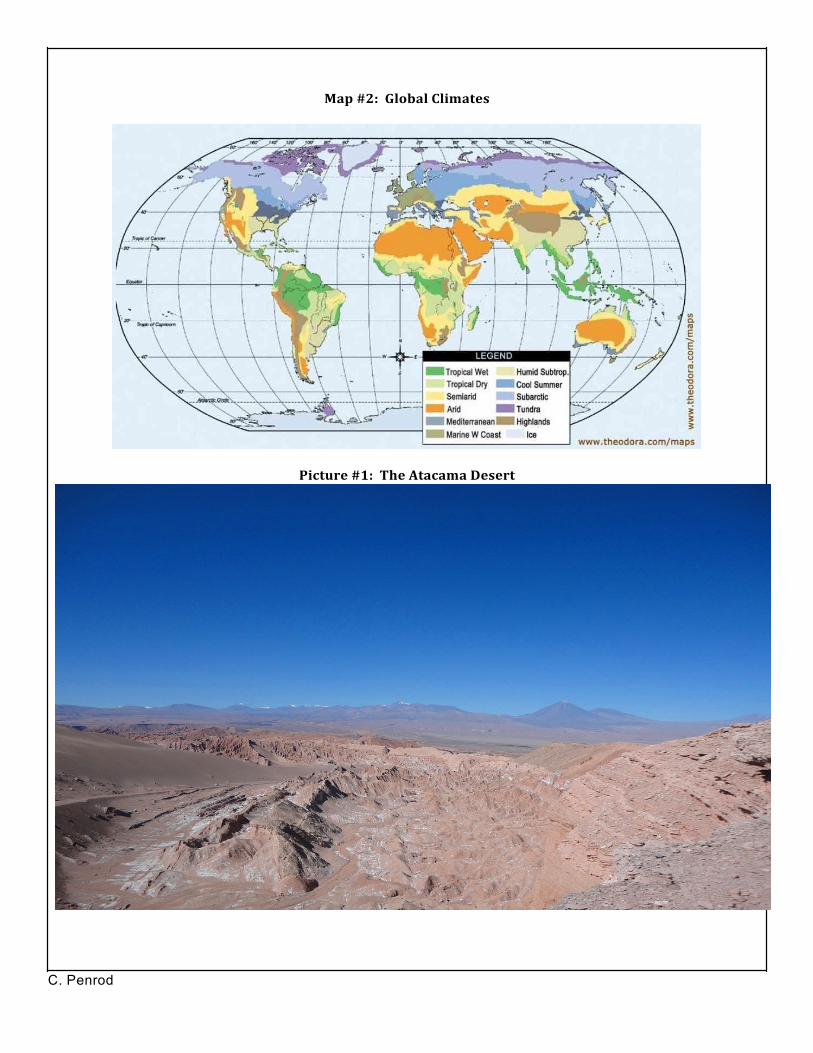
Therearepatternsofglobalclimates.Mostdesertsarelocatedeitheraboveorbelowtheequatorat
Whyaretherepatterns?Whatcausesthepatterns?WhyistheAtacamasodry?
ExitTicket:GroupquestionsabouttheAtacamaDesert

C. Penrod
InterpretingData
globalclimate aboutthesamedistance.
2 SystemsandSystemsModelsDevelopanduseModels
DefinethepartsoftheAtacamasystemtobegindevelopingamodelPartsofthesystem-readaboutdesertAskquestions
TheAtacamaDesertisasystemincludingtheatmosphere,thehydrosphere,thegeosphereandthebiosphere.Thesesystemsinteractonglobalandlocalscales.
Howdothesesystemsinteract?
SystemsModelofAtacamaDesert
3 Energyand Carryoutaninvestigationtotesta Heatcausesmattertobecomeless Howdooceancurrent ClearestPoint Matter predictiononhowenergyeffectsthe denseandrise.Thisistrueofany patternseffectthe MuddiestPoint movementofmatterintwoofEarth’s fluid-waterorair. AtacamaDesert? Systems systems-theatmosphereandinthe Saltcancausedifferencesin Howdoatmospheric hydrosphere(ocean). densitiesinfluids. circulationpatternseffect Carryoutan Differencesindensitycause theAtacamaDesert? investigation AnalyzeandInterpretdatatofind movementinfluids. Howdoesthematterflow patternsinenergyflowandmatter Therearecolderandwarmerparts andenergycyclethrough Analyzeand cyclingbetweenEarth’ssystems oftheocean. thevarioussystems Interpret (hydrosphere,atmosphere,geosphere). Therearecolderandwarmerparts aroundtheAtacama data oftheland. Desert?(systems Thereisapredictablepatternofair interactions). currentsintheatmosphereknown asGlobalcirculation.
4 Energyand Readtoobtaininformationonhow Therearemanysystem WhatistheRainShadow Exitticket: matter systemsinteracttocreatethedriest interactionsthateffecttheAtacama Effect? Relating desertintheworld Desert. Howdoestheocean’s convectioncells Obtain Convectionintheoceaneffects temperatureeffectthe toAtacama information deserts. AtacamaDesert? Desert Energyfromthesundriveschanges inEarth’ssystems.
5 Causeand Analyzeandinterpretdatatobegin Coldoceancurrentseffectthe Howdoesallthisevidence Studentnotebooks: Effect developingamodeltoshowhow AtacamaDesert. fittogethertoexplainthe reviewmodels unequalheatingoftheEarth’ssystems Elevationcausesairtorise,cool causeofthedrynessofthe givingfeedbackas causespatternsofatmosphericand andbecomelessdense. Atacamadesert. needed(modelof oceaniccirculationthatdetermine OceanTemperature regionalclimates. TheRainShadoweffectmeansthat andRainShadow

C. Penrod
onesideofamountaingetsrainandtheothersidedoesnot.ARainShadowisduetothechangesinelevationandthecondensinganddroppingofwateronthewindwardvstheleewardsideofamountain.
Effect)
6 Systemsand Developamodeltoshowhowuneven RainShadowEffect(winds Whataresomeother Student’sfinal Systems heatingoftheEarth’ssystemscauses (atmosphere)carrymoisture weatherpatternsthat model Models patternsofatmosphericandoceanic (hydrosphere-matter)toward causedifferentclimates? patternsthatdeterminedeserts mountains,thenairlosesenergy Developand (Atacamadesert) (cools)andrainsonthewindward useamodel sideofmountain;lesswatervapor inair(atmosphere)duetocooler oceantemperature(hydrosphere), andhighelevation(geosphere)of theAtacamaleadstodryair (atmosphereandhydrosphere). Bonus:Thesunheatstheoceanand theairovertheoceanwhichcauses themoisturetoriseandmoveaway fromdesertregions(convection).

C. Penrod
6.3.3LessonPlan1
StudentSciencePerformancesAnalyzeandinterpretdata/Askquestions
Topic:GlobalClimatesandDeserts Title:WhySoDry?
OverarchingPerformanceExpectations(Standard)fromStateStandardsorNGSS:DevelopanduseamodeltoshowhowunequalheatingoftheEarth’ssystemscausespatternsofatmosphericandoceaniccirculationthatdetermineregionalclimates.
LessonPerformanceExpectations:Analyzeandinterpretdataaboutglobalclimatesandaskquestionsaboutpatternsonmapofglobalclimate
StudentsWill...ToConstructMeaningPart1:FindPatternsonMaps
1. MakeobservationsaboutMap#1:EarthfromSpaceinsmallgroups.Studentsrecordobservationsinlabnotebook.
2. Shareoutobservationswithgroup.3. Recordquestionstheyhaveaboutdata(map).4. MakeobservationsaboutWorldClimateMap
#2.Usesameformatasabove.5. Shareobservationswithothergroupsduring
classdiscussion.6. Recordpatternsfoundboththemaps.7. Studentscomparebothmapsfindpatterns.8. Studentsgenerateandrecordquestionsinlab
notebookaboutpatternsandworldclimate.9. Studentsrecord2-3questionstheyhaveabout
worldclimatesinlabnotebook.Part2:TheAtacamaDesert
1. RecordPhenomenoninlabnotebook:TheAtacamaDesertisthedriestdesertintheworld.
2. GiveonereasonwhyyouthinktheAtacamaDesertisthedriestdesertintheworld.
3. Record2-3questionsyouhaveabouttheAtacamaDesert.
ManagementStrategies:Planformapactivitybyarrangingstudentsingroupformationatbeginningofclass.Makegroupsof2-4students. Besuretohavecolorcopiesofmapsforeachgroup.Donotpassoutbothmapsatonce.Giveoneatatimeandrequirestudentstorecordobservationsinnotebookbeforemovingontonextmap.Useatimertokeeptimeurgentandmoving.Givegroups2-3minutestomakeandrecordobservations.
TeacherWill...ToSupportStudents
Part1:FindingPatternsonMaps1. HandoutMap#1:EarthfromSpace.Have
studentsworkinsmallgroupstoanalyzeandinterpretthedataandnoteanypatterns.Instructstudentstorecordobservationsinlabnotebook.
2. Listentogroupsandcirculateasstudentsareanalyzingdata.Ensurethateachstudentisrecordingsomethinginlabnotebook.Leadclassdiscussionandclarifyideasasneeded.
3. HandoutMap#2:GlobalClimates.Havestudentsworkinsmallgroupstoanalyzeandinterpretthedataandnoteanypatterns.Instructstudentstorecordobservationsinlabnotebook.
4. Lookforpatternsonbothmapsandrecordinlabnotebook.
5. Instructstudentstofindpatternsonbothmapsandrecordinlabnotebook.
6. Instructstudentstorecordquestionstheynowhaveaboutthepatternstheyseethecauseofthepatterns.Youcannamethepatternsasthe“effect”andexplainhowtheyneedtofigureoutthe“cause.”
7. Studentsaskandrecordthatwillleadintonextepisodeandarerelevanttowhattheyneedtoknow(whatevidencetheyneedtoexplainphenomenon).
Part2:TheAtacamaDesert
1. IntroducethePhenomenon:TheAtacamaDesertisthedriestdesertintheworld.
2. ShowstudentsPictures#1and#2andMap#3.3. PointouttheAtacamaDesertisverycloseto
theAmazonRainforest.4. Havestudentsrecordquestionstheyhave

C. Penrod
ALSO-TheobjectiveinPart1istointerpretthe abouttheAtacamaDesert.5. Instructstudentstogiveonereasonwhythey
thinkthattheAtacamaDesertisthedriestdesertintheworld.
6. Instructstudentstorecord2-3questionstheyhaveabouttheAtacamaDesert
7. Exitticket:Asagroup(thesamegrouptheyworkedwithearlier)discussthequestionsyouhaveandwritedownthequestionsonapieceofpaper.Eachgroupwillturninalistof5-8questionsthattheyhaveabouttheAtacama.Instructthemtowriteeachquestiononlyonce,sothatnoquestionsarerepeated.Thisisaformativeassessmentforyoutoseewhatthestudentsarethinkingandwonderingandwhattheywillneedtoknowtoexplainthisphenomenon.
Materials:CopiesofMapsandPictures-Setsforeachsmallgroup.
datasetpresentedinthemapandthentoask questionsaboutthepatternsnoted.Students recordobservationsintheirscience journals.Examplesofquestionstospurstudent observationanddiscussionarebelow:Whatdoes yourmaprepresent?Whatdothecolorsrepresent onyourmap?Whatpatternsdoyouobserve?What questionsdoyouhaveaboutthepatternsyou observe?
AssessmentofStudentLearningProficient:Theexitticketisaformativeassessmentforyoutoseewhatthestudentsarethinkingandwonderingandwhattheywillneedtoknowtoexplainthisphenomenon.Sortthroughthequestionsandgroupandtallythemyourselfsothatyoucanseewhereyouwillneedtospendthemosttimeduringthisstoryline.Besuretoeliminatequestionsthatwillnotgenerateevidencethatexplainsthephenomenon:TheAtacamaDesertisthedriestdesertintheworld.
Map#1:EarthfromSpace
C. Penrod
Map#2:GlobalClimates
Picture#1:TheAtacamaDesert

C. Penrod
Picture#2:LocationofDesert
Map#3:SouthAmerica

C. Penrod

C. Penrod
6.3.3LessonPlan2
StudentSciencePerformancesReadtoObtainInformation
Developandmodel
Topic:SystemoftheAtacama:Atmosphere,hydrosphere,geosphereandbiosphere.
Title:What’sinaDesertSystem?
OverarchingPerformanceExpectations(Standard)fromStateStandardsorNGSS:DevelopanduseamodeltoshowhowunequalheatingoftheEarth’ssystemscausespatternsofatmosphericandoceaniccirculationthatdetermineregionalclimates.
LessonPerformanceExpectations:ReadtoobtaininformationanddevelopamodelofthepartsoftheAtacamaDesertsystem(atmosphere,hydrosphere,geosphereandbiosphere)
StudentsWill...ToConstructMeaningPart1:Reading-TheAtacamaDesert
1. ReadthearticleTheAtacamaDesertasaclass.
2. Payattentiontoandunderlinethepartsofthedesertsystem.
Part2:SystemsModel
1. Drawthe“SystemsModel”inlabnotebook.2. Labelthecenter“AtacamaDesert”and
eachofthefourpartsasinstructedbyteacher.
3. Insmallgroups(2-4),discussandrecordinformationfoundinthearticleandinthepicturesthatrelatestoeachpartofthelargerdesertsystem.
ManagementStrategy:Alwaysbethoughtfulwhenassigningareadinginthescienceclassroom.Somestudentshavereadingdifficultiesandneedscaffoldingsuchasreadingwithapartnerandfollowingalongwithahi-lighterorsummarizingattheendofthearticle.Besuretocheckforunderstanding.Youmayalsoreadasaclass,butonlyaskvolunteerstoread.
TeacherWill...ToSupportStudents
Part1:Reading-TheAtacamaDesert1. Makecopiesofthereading,AtacamaDesert,
oneeachstudent.(Cutandpastethearticlebelowontoonepage).
2. Directstudentstopayattentionto(underline)thepartsthatmakeuptheAtacamasystem.Remindthemthatmostofthesepartsarenon-living.
3. Directaclassdiscussiononwhatwasdiscoveredinthereading.
Part2:SystemsModel
1. Put/drawthe“SystemsModel”ontheboardforthestudentstoseeandinstructeachstudenttodrawthisintheirlabnotebook.
2. Youcanusethelabelsair,land,water,life,butalsorefertoatmosphere(air),geosphere(land),hydrosphere(water)andbiosphere(life).
3. Checkinwitheachgroupastheyareworking.Askprobingquestionsasneeded.
4. Check“SystemsModel”asaclasstobesureallnecessaryinformationisrecorded.
5. Tiebacktothephenomenon:TheAtacamaDesertisthedriestdesertintheworld.
Materials:CopyofAtacamaDesertforeachstudent.SlideorcopyofSystemsModel

C. Penrod
AssessmentofStudentLearning
Proficient:Studentswillincludeatleast2ofthefollowingforeachcategory:
Hydrosphere:verylittlewatertono,lessthan1mmrain/year,fewoasesAtmosphere:dryair,fewclouds,0-25degreesCelsiusaveragetemperature(32-77degreesF)Geosphere:nearPacificOcean,longpieceofland,600miles,sanddunes,mudcracks,highaltitudeBiosphere:hardforplants,animalsandhumanstolivethere,smallplants/grasses
THE ATACAMA DESERT
TheAtacamaisthedriestdesertinthe
world.Thedeserttypicallygetslessthan1mmof
rainayearandsomeplaceshaven’teverrecorded
rain.Itisextremelyhardforpeopleandplantsand
animalstolivehere.Lifeisconcentratedaround
oases(waterholes)andminingtowns.
Figure1:AnOasisintheAtacama.
Desertsareplaceswhererainisscarce,butthereisonlyoneareaonthisearth-thecentralportion
ofChile'sAtacamaDesert-whereithasnevereverrained-atleastsincehumansstartedkeepingarecord-
about400 years ago! Themost amazingpart is, that
this 600-mile stretch of land lies right alongside
Chile's coast, next to the biggest body of water on
Earth-ThePacificOcean.Thoughdrierthanallother
deserts, the temperature in the Atacama Desert is
quite cool, ranging from 0-25 degrees Celsius (32-77
degreesFahrenheit),thankstoitshighaltitude.
Figure2:Sanddunesanddryland.

C. Penrod
AtacamaFACTSSize:40,600squaremiles(105,000squarekilometers)Countries:Chile,PeruContinent:SouthAmerica
Edited from: https://wiki.kidzsearch.com/wiki/Atacama_Desert
Figure3:Mudcracksonthedesertfloor.
SystemsModel:

6.3.3LessonPlan3
StudentSciencePerformancesCarryoutaninvestigationAnalyzeandInterpretData
Topic:ConvectionCellsintheAtmosphere Title:TheConvectionConnection
OverarchingPerformanceExpectations(Standard)fromStateStandardsorNGSS:DevelopanduseamodeltoshowhowunequalheatingoftheEarth’ssystemscausespatternsofatmosphericandoceaniccirculationthatdetermineregionalclimates.
LessonPerformanceExpectations:CarryoutaninvestigationtotestapredictiononhowenergyeffectsthemovementofmatterintwoofEarth’ssystems-theatmosphere(air)andinthehydrosphere(ocean).AnalyzeandInterpretdatatofindpatternsinenergyflowandmattercyclingbetweenEarth’ssystems(hydrosphere,atmosphere,geosphere).
StudentsWill...ToConstructMeaningPart1:PredictingEnergywithMaps
1. Gluetwosmallmapsofworldintolabnotebook.Titleone“Hydrosphere”andtheother“Atmosphere.”
2. Discusswithyoursmallgroupyourpredictiononwherethesurfaceoftheoceanisthewarmest(moreenergy)andwherethesurfaceoftheoceanisthecoldest(lessenergy)inthissystem.
3. Useabluepenciltorepresentcold.Usearedpenciltorepresentwarm.Drawonyour“Hydrosphere”mapwheretheseareas(warmandcold)arelocated.Usearrows,words,coloringin,etc.
4. Now,discusswithyourgroupwhereyouthinkwarmandcoldairisintheEarth’satmosphere(system).Alsothinkofhowtheairismoving-whichdirectionandwhatmightbecausingthis.
Part2:ConvectioninaFluidModel
5. Watchyourteachersetupthismodelofasystem.Itisveryimportanttofollowallinstructionspreciselyfordesiredresults.
6. Setupmodelwithsmallgroup.7. Recordyourdata(drawapicture)inyourlab
notebookusingyourredandbluepencilsofwhatyouobserve.Besuretousearrowstoshowwhichwaythewater(matter)ismovinginyourmodel.Identifywhattheenergysourceisinyourmodel.
8. Cleanupareaandreturnmaterialstoteacher.
Part3:ConnectingyourModeltoEarth’sSystems
TeacherWill...ToSupportStudentsMaterialsalert:BLUEicecubesneeded!Mustmakeadayahead!!Fill8plasticshoeboxeshalffullofwatera
dayahead.Part1:PredictingEnergywithMaps
1. Arrangestudentsintosmallgroups(2-4).2. Make3copiesoftheworldmapsforeach
student.3. Instructstudentstoglue2mapsinlab
notebookandtitleone“Hydrosphere”andtheother“Atmosphere.”
4. Tellstudentstodiscusinasmallgrouptheirpredictiononwherethesurfaceoftheoceanisthewarmest(moreenergy)andwherethesurfaceoftheoceanisthecoldest(lessenergy)inthissystem
5. Directstudentstouseabluepenciltorepresentcoldandaredpenciltorepresentwarm.Instructthemtodrawon“Hydrosphere”mapwheretheseareas(warmandcold)arelocated.Usearrows,words,coloringin,etc.
6. Walkaroundandlistentowhatstudentsaresayingandwhattheirpredictionsare.Thiswillhelptoguidethequestionsyouaskinthenextsection.
Part2:ConvectioninaFluidModel
7. Onemethodingeoscienceisusingamodelforunderstandingaprocessorevent.Yourstudentswillcreateamodeltohelpthemunderstandconvectioninfluids(liquidsandgases-ietheoceanandatmosphere).Thisisnotaninvestigationwithacontrolledvariable,butratheraninvestigationintounderstandingaprocess.Thus,youmustmodelHOWtosetthemodelup.

9. Makeatableinlabnotebooklistingthecomponentsofyoursystemsmodel(containerofwater,hotredwater,bluecoldwater).
10. Indicateinyourtablewhateachcomponentofthemodelrepresentsfortheatmosphereandthenforthehydrosphere.(Note:don’tgiveanswers!Letstudentsthinkandconnect).
11. Example:
12. Writeasentenceabouthowenergyeffectsmatterintheatmosphere.Labelthisasconvection.
13. Writeasentenceabouthowenergyeffectsmatterinthehydrosphere(ocean).Labelthisasconvection.
14. Answerthesequestions:Whatisthesourceofenergy(heat)intheatmosphere?Whatisthesourceofenergy(heat)intheocean?
Part4:RevisitingPredictions
15. Gluethelastmap(3rd)intolabnotebook.16. Followteacher’sdirectionsonwheretodraw
actualcurrentswithredandbluepencils.17. Discussmeaningofcurrentsandsourceof
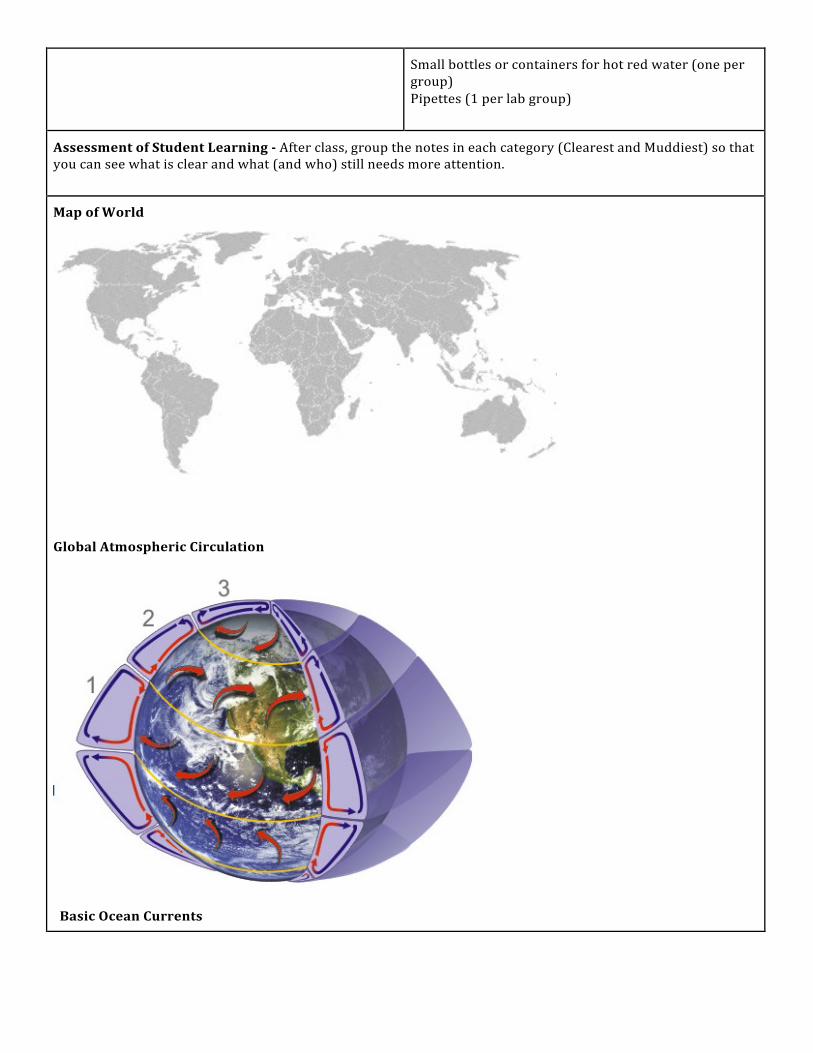
energy.18. ConstructamodelofGlobalAtmospheric
Circulationinyourlabnotebook.Useredandbluecoloredpencils.
19. Discusstwoquestionswithyourgroup:Whatisthesourceofenergy(heat)intheatmosphere?Whatisthesourceofenergy(heat)intheocean?
20. Writeastatementforeachinyourlabnotebook.
21. ExitTicket-ClearestPoint,MuddiestPointassessment(describedinteachernotes).
ManagementStrategies:
1. Make3copiesoftheworldmapsforeachstudent.Copyandpastefourmapsontoonepageandthencopyandcutapartonapapercutter.Themapsdonotneedtobelarge.
2. Itisverytemptingtowanttodothe
investigationonlyasademo,butDON’T!Let
8. Watchthisvideo:https://www.youtube.com/watch?v=bN7E6FCuMbY
9. Insteadoffloatingthebottleontopofthewater,useapipettetoputthehotredwaterinthebottomcornerofthecontaineroppositetheblueicecube.Becarefultopushthewateroutofthepipetteonthebottomofthecontainer.Youmayneedtodothistwotimestogetenoughhotredwaterinplace.DONOTmovethetable.Aconvectioncellofrisinghotredwaterandsinkingcoldbluewatershoulddevelopinyourcontainer.
10. Youwillneedtodemothesetupforthestudents,butbesuretoletthemcreateaconvectionmodelwiththeirgroup.Focusonthematterandenergyinthesystemandhowtheyareinteracting.Drawthistoyourstudents’attention.
11. Monitorinvestigationbymovingaroundtoallgroupsduringlab.
12. Takenoteofwhatstudentsaredrawinginlabnotebooksanddirectthemasneededtorecordgooddata.
13. Havestudentscleanupareabeforeyoumoveon.
Part3:ConnectingyourModeltoEarth’sSystems
14. Instructstudentsmakeatableinlabnotebooklistingthecomponentsofthesystemsmodel.Seeexampletoleft.
15. Emphasizehowenergycausesmattertorise(moreenergy-heat)andsink(lessenergy-cold).ThisisaBIGideahere!Warmairrises,coolairsinks.Warmwaterrises,coolwatersinks.Thiscreatescurrentsintheair(atmosphere)andtheocean(hydrosphere).ThisisaconnectiontoStrand6.2.Thenewpiecehereistotiethistofluids-liquidsandgases-andthenlabeltheliquidhydrosphereandthegasatmosphere.
16. Givestudentsthetwoquestions:Whatisthesourceofenergy(heat)intheatmosphere?Whatisthesourceofenergy(heat)intheocean?Todiscusswiththeirgroups.
17. Besuretocheckunderstandingthatthesunisthesourceofenergythatheatsboththeatmosphereandtheocean.
18. Tiethistothephenomenon-Part4:RevisitingPredictions
19. HereissomeinformationforyoutoreadaheadoftimeaboutOceanicCirculation.
Modelweused Atmosphere HydrosphereHotredwater Hot,risingair Warm,rising
waterColdbluewater
Cold,sinkingair
Cold,sinkingwater
Containerofwater
Anairmassintheatmosphere
Waterintheocean

thestudentstryoutitoutandinvestigate.Evenifnotallgroupsgetastrong,visibleconvectioncell,someoneintheclasswillgetittoworkandeveryonecanusethatasamodel.
http://www.srh.noaa.gov/srh/jetstream/ocean/circulation.html
20. Hereisinformationaboutatmosphericcirculation:http://www.srh.noaa.gov/jetstream/global/circ.html.YourstudentsdoNOTneedtoknowthenamesofthethreecirculationcells-justthattherearelargeconvectioncellsthattransportenergyaroundtheEarth.ItISimportantforthemtoconnectthatmoreenergyfromthesunattheequatormeansthatwarm,moistairisrising.Connectthistotheconvectioncellmodel.
21. Havestudentsgluethethirdmapinlabnotebook.LabelActualOceanicCirculation.
22. Showthemapofoceaniccirculation.23. Instructstudentstodrawthecorrectarrowson
themapusingBasicOceanCurrentsasaguide.24. Discussthesourceofenergy(thesun)and
pointouthowwarmcurrentsaremovingawayfromtheequator,whilecoldcurrentsaremovingawayfromthepoles.Connecttotheconvectioncellmodel.
25. Now,showthemapofGlobalAtmosphericCirculation.
26. InstructstudentstodrawacircleontheirpapertorepresenttheEarth.ItisNOTnecessarytodrawanycontinents.LabelGlobalCirculation.
27. DOincludetheequator.ThisisaBIGdeal(mostincomingsolarradiation).
28. Instructstudentstouseredandbluepencils,again,toshowconvectioncurrentsintheatmosphere.
29. Exitticket:ClearestPointandMuddiestPoint-Putuptwobigpiecesofchartpaperordrawtoverylargesquaresontheboard.LabeloneClearestPointandtheotherMuddiestPoint.Giveeachstudent2post-itnotes.Instructthemtowritedownonethingfromtoday’slessonthatthatgotandonethingthatstillseemsunclear.Havethemplacetheirnotesastheyleave/endclass.
30. Materials:TwosmallcopiesofmapforeachstudentGluesticks(oneperstudent)ColoredpencilsPost-itnotesPlasticshoeboxes(onepergroup)halffullofwaterBluefoodcoloringIcecubetray12blueicecubesRedfoodcoloringMicrowaveorhotpot(electrickettle)
Smallbottlesorcontainersforhotredwater(onepergroup)Pipettes(1perlabgroup)
AssessmentofStudentLearning-Afterclass,groupthenotesineachcategory(ClearestandMuddiest)sothatyoucanseewhatisclearandwhat(andwho)stillneedsmoreattention.
MapofWorld
GlobalAtmosphericCirculation
BasicOceanCurrents


C. Penrod
6.3.3LessonPlan4
StudentSciencePerformancesDevelopandmodel
Topic:InteractionsofsystemsoftheAtacama:Atmosphere,hydrosphere,geosphereandbiosphere.
Title:It’sAllAbouttheInteractions
OverarchingPerformanceExpectations(Standard)fromStateStandardsorNGSS:DevelopanduseamodeltoshowhowunequalheatingoftheEarth’ssystemscausespatternsofatmosphericandoceaniccirculationthatdetermineregionalclimates.
LessonPerformanceExpectations:Readtoobtaininformationonhowsystemsinteracttocreatethedriestdesertintheworld
StudentsWill...ToConstructMeaningPart1:Reading-TheAtacamaDesert
1. ReviewSystemModelfortheAtacamaDesertpreparedinpreviouslesson
2. ReadthearticleTheAtacamaDesert,Chile:TheDriestDesertonEarthasaclass.
3. Recordsysteminteractionsinlabnotebookbyaddingthemtoyourfour-boxmodelfromEpisode2.
Part2:AskingQuestions
1. Insmallgroups(2-4),discusshowthisinformationrelatestothephenomenonoftheAtacamaDesertbeingsodry.
2. Payattentiontoandwritedownquestionsyoustillhaveaboutthesystemsinteractions.Recordtheminlabnotebook.
Part3:ConnectingSystemsModelConvectionModel
3. Refertoconvectionmodelfrompreviouslesson.
4. Exitticket:HowdoestheconvectionmodelrelatetowhatyoulearnedtodayabouttheAtacamaDeserts’systems?Makeasmanyconnectionsasyoucan.
ManagementStrategy:Readthearticleaheadoftimeandfilloutyourownsystemsmodelinteraction.Someoftheseinteractionstakethinkingaboutandyouwillhave
TeacherWill...ToSupportStudents
Part1:Reading-TheAtacamaDesert1. Makecopiesofthereading,AtacamaDesert,
Chile:TheDriestDesertonEarthoneeachstudent.(Cutandpastethearticlebelowontoonepage).
2. ReviewtheSystemsModelstudentspreparedinpreviouslesson.
3. Directstudentstopayattentionto(underline)theinteractionsofthesystemsintheAtacamasystem.
4. Duringreading,stopandcheckforunderstatingbyaskingquestions.Also,stopandFigure1.InstructstudentstodrawFigure1inlabnotebooks.(Thisisanimportantpieceofevidence.)
5. Modelhowtoaddandlabelaninteractionbetweenthesystemsbydrawingarrowsontheoutsideoftheboxfromonesystemtoanotherandlabelingtheinteraction.Forexample,coldoceanwater(hydrosphere)preventsmoisturethatcouldturnintocloudsandrain(atmosphere).Thearrowgoingfromhydrospheretoatmospherecouldsay“preventsmoisturethatcouldberain”.Instructeachstudenttodrawthisintheirlabnotebook.
6. Continuereadingasaclassandaddinginformationonsystemsinteractionstothemodel.
7. Alsopointouthowenergyandmatterare

C. Penrod
adifficulttimedoingthisonthespotinfrontofthestudents.Youwilldiscoverweresomethingisunclearandthenwillbeabletohelpstudentsastheyreadandmakesenseoftheinformation.
interacting.8. Check“SystemsModel”asaclasstobesure
allnecessaryinformationisrecorded.9. Tiebacktothephenomenon:TheAtacama
Desertisthedriestdesertintheworld.10. Directaclassdiscussiononwhatwas
discoveredinthereading.Part2:AskingQuestions
11. InstructstudentstodiscussinsmallgroupshowthisinformationrelatestotheAtacamaDesertbeingsodry.
12. Havestudentsrecordquestionsinlabnotebooks.
13. Movearoundtheclassroomandreadthequestions.Makenoteofwhatinformationthestudentsstillneed.Thisisaformativeassessmentforyoutoknowwhattospendtimeonnext.
Part3:ConnectingSystemsModelConvectionModel
14. Havestudentsreviewconvectionmodelonown.
15. Assignexitticket:HowdoestheconvectionmodelrelatetowhatyoulearnedtodayabouttheAtacamaDeserts’systems?Makeasmanyconnectionsasyoucan.
16. Collectexitticketsandreviewfeedbacktoguidenextlesson.
Materials:CopyofAtacamaDesert,Chile:TheDriestDesertonEarthforeachstudent.SlideorcopyofSystemsModel
.AssessmentofStudentLearningProficient:ExitTicketStudentswillmaketwoormoreofthefollowingconnections:Heatenergyfromthesuncauseshotairtoriseandmovemoistureawayfromthedesert.HotaircanpreventprecipitationDuetohighelevation,mountainscauseairtorise,coolanddropmoistureAcoldoceancurrentcausesoninversionthatpreventsmoisturefromrisingthatwouldleadtorainMountainspreventrainfrommovingovertotheotherside(rainshadoweffect)
SystemsModel:

C. Penrod
THE ATACAMA DESERT, CHILE: THE DRIEST DESERT ON EARTH A desert is a hot area of land that gets very little rain, and where temperatures during the daytime
can get as high as 55°C (131°F). At night, deserts cool down, sometimes even below 0°C. Most
deserts lie between 15° and 35° north and south of the equator. The desert climate is due in part to
air that rises over the equator and comes down over the Tropic of Cancer and the Tropic of
Capricorn. All over the world, around 20% of the deserts lie in these regions.
Figure 1: Rain over the equatorial region (1) is caused by the cooling and condensing of hot, wet rising air (2). Cool, dry air moves out and sinks back toward Earth’s surface (3), resulting in a high-pressure system with no precipitation. (4).
How does this happen? (See figure 1)

C. Penrod
1. Land over the equator becomes very hot because the sun’s rays hit the equator at a direct
angle between 23°N and 23°S latitude. The hot and wet air rises and it rains a lot in these
areas.
2. The air cools down and moves north and southwards as it gets drier.
3. The cool, dry air sinks to the ground over the Tropic of Cancer in the north, and the Tropic of
Capricorn in the south, causing high pressure (“sunny weather”).
4. And then again, warm air near the surface moves back to the equator causing the air to rise.
These moving air masses are called trade winds. As the rising air cools, clouds and rain
develop. The resulting bands of cloudy and rainy weather near the equator create tropical
conditions. But… what makes the Atacama Desert in Chile drier than other deserts?
A cold ocean current flows northward along the Chilean coast (see figure 2). The
cold, humid air produced by the sea stays down along the coastline due to hot
air masses rising from the continent (an inversion layer). This reduces the
moisture in the air and, also, results in nearly 350 days of clear skies inland.
Figure 2: Cold ocean water moves along Chile’s coast.
It must also be considered that the Atacama Desert is located over high
altitudes, above 8,200 feet (2,500 meters) above sea level. This fact contributes
to low, drying temperatures and very low humidity in the air (about 10%).
Another important reason is that
two mountain ranges, the Chilean Coastal Range and the
Andes Range, run along the west and east sides of the
Atacama Desert acting as natural barriers of moisture (the rain
shadow effect). A rain shadow is a dry region of land on the
side of a mountain that is protected from the prevailing winds
(winds that occur most of the time in a particular location on
the Earth), also called the leeward or down-wind side of the
mountain.
Figure 3: Rain Shadow effect of Chilean Coastal Range and Andes Mountains.
Figure 4: Prevailing winds carry air and moisture toward Andes Mountains, which then dries out.
Prevailing winds carry air toward the mountain range. As
the air rises, it cools, and water vapor condenses to form
clouds over the windward side of the mountain. Here,
precipitation falls in the form of rain or snow. The windward

C. Penrod
side of a mountain range is moist and lush because of this precipitation. Once the air passes over the
mountain range, it moves down the other side, warms, and dries out. This dry air produces a rain shadow.
Land in a rain shadow is typically very dry and receives much less precipitation and cloud, creating desert
conditions on the leeward side of the range cover. Nowhere else on Earth do these climatic features come
together as they do in Atacama! MODIFIED FROM CARMEN ABUHADBA’S ORIGINAL ARTICLE PUBLISHED ON 9/4/2013

C. Penrod
6.3.3LessonPlan5
StudentSciencePerformancesDevelopamodel
Topic:AnnualPrecipitation,OceanTemperatures,andRainShadowEffect
Title:DefiningtheCause
OverarchingPerformanceExpectations(Standard)fromStateStandardsorNGSS:DevelopanduseamodeltoshowhowunequalheatingoftheEarth’ssystemscausespatternsofatmosphericandoceaniccirculationthatdetermineregionalclimates.
LessonPerformanceExpectations:AnalyzeandinterpretdatatobegindevelopingamodeltoshowhowunequalheatingoftheEarth’ssystemscausespatternsofatmosphericandoceaniccirculationthatdetermineregionalclimates.
StudentsWill...ToConstructMeaningPart1:DevelopingAModel
1. Moveintosmallgroups(2-4people).2. LookatEvidenceCardA:SouthAmerica:
AnnualPrecipitation(1976-2009).3. Writedownthreeobservationsyoumakefrom
thepatternsonthismap.4. Asagroup,discussandrecordevidenceand
it’scausefromthismapthatwouldsupportthephenomenon.
Part2:RainShadowandOceanCurrents
5. Teacherwillassigngrouponepieceofevidence(BorC).
6. Asagroup,worktogethertodevelopamodelofeitherOceanTemperaturesortheRainShadowEffect.Drawpictures,labelpartsandwritedescriptions.Also,refertothearticleTheAtacamaDesert,Chile:TheDriestDesertonEarth.FocusonhowthisprovidesevidencethatsupportsWHYorthecauseoftheAtacamaDesertbeingsodry.
Part3:RefiningandRecordingtheModels
7. Recordthemodelyourgroupcreatedinyourlabnotebook.
8. Hangupposters.Govisitandstudytheothermodelsthatarethesametopicasyourown.Addthingstoyourmodelthatyoumayhavemissed.
9. Returntoyourseat.10. Asagroup,fixanythingyouwantonyour
model.11. Now,recordtheothermodelthatyoudonot
havethatispresentedinclassbyanother
TeacherWill...ToSupportStudentsPart1:DevelopingA
Model1. PreparegroupsetsofEvidenceA-C.Printin
color.2. Instructyourstudentsthattheywillbegin
constructingtheirmodeltoexplainthephenomenon:TheAtacamaDesertistheDriestdesertintheworld.
3. GiveeachgroupacopyoftheEvidenceCardA:SouthAmerica:AnnualPrecipitation(1976-2009).InstructstudentstorecordevidencefromthepatternsonthismapthatwouldprovideevidenceofWHYtheAtacamaissodry.
Part2:RainShadowandOceanCurrents
4. DistributeEvidenceCardB:OceanTemperaturestohalfthegroupsandEvidenceCardC:RainShadowEffecttotheotherhalf.Theobjecthereisforeachgrouptobecomeexpertsononeofthepiecesofevidenceandthensharewiththeclass.
5. Handoutapieceofchartpaperandmarkerstoeachgroup.Instructstudentsthateachgroupistomakeapostertosharethatwillexplainthispieceofevidence.Studentsmustincludepictures,labelpartsandwrittendescriptions/explanationsonthemodelandconnecttotheAtacamabeingsodry.Studentsshouldalsorefertopreviousarticle:TheAtacamaDesert,Chile:TheDriestDesertonEarth
6. Movearoundandlistentogroupswhiletheyarepreparingposters.
Part3:RefiningandRecordingtheModels
C. Penrod
group.ManagementStrategies:
1. MakecolorcopiesoftheEvidenceCardsareessentialtotoady’slessons.Studentsneedtoseethecolorstoeffectivelyanalyzethedataoneachcard.
2. ItisessentialtoclearupandcorrectanywronginformationaboutRainShadowEffectandOceanTemperaturesBEFOREitispresentedasafinalmodeltotheclass.Takethetimeyouneedtobesurepostersareaccurate.
3. Toquicklycheckallstudentnotebooks,walkaroundgivingimmediatefeedbackonneededcorrectionsandthenstampcorrectmodelswhensatisfactory.
7. Havestudentshangmodelsup.Spendafewminutesexaminingeachmodel.Havestudentstakenotesonhowtoimprovetheirmodel.Lookatandstudymodelsduringthistimesothatyoucancorrectanythingthatiswronginabyaskingprobingquestionstorefinethinking.
8. Directstudentstoreturntotablesandfixmodels.
9. Chosemostaccuratemodelforeachtopic(OceanTemperaturesandRainShadowEffect).Havestudentsfromthesegroupspresenttheirmodeltoclass.Studentsrecordmodelsinlabnotebooks.
10. TheobjectivehereisforstudentstoendupwithacorrectmodelforRainShadowEffectandOceanTemperatureintheirownnotebook.Makeuseofaclassdiscussiontoclarifyandrefineanythingthatneedsattention.
11. Checkallstudentnotebooksandreviewmodelsgivingfeedbackasneeded.Correctmodelsareessentialtothesuccessofthefinallesson(theperformanceexpectation).
Materials:GroupsetsofEvidenceCardsA-CPosterpaperMarkers
AssessmentofStudentLearningProficient:EachstudentwillhaveacorrectmodelofOceanTemperatureandRainShadowEffectandexplainthecauseforeach.ConsultEvidenceCardsBandCfordetails.

C. Penrod

C. Penrod

C. Penrod

C. Penrod
6.3.3LessonPlan6
StudentSciencePerformances
Topic:EvidenceforDryness Title:NowIKnowWhy…theAtacamaissoDry!
OverarchingPerformanceExpectations(Standard)fromStateStandardsorNGSS:DevelopanduseamodeltoshowhowunequalheatingoftheEarth’ssystemscausespatternsofatmosphericandoceaniccirculationthatdetermineregionalclimates.
LessonPerformanceExpectations:DevelopamodeltoshowhowunevenheatingoftheEarth’ssystemscausespatternsofatmosphericandoceanicpatternsthatdeterminedeserts(AtacamaDesert)
StudentsWill...ToConstructMeaningPuttingitAllTogether
1. Inyourlabnotebook,createafinalmodelthatexplainsWHY(thecauses),usingevidencegathered,theAtacamaDesertisthedriestdesertintheworld.
2. Usealltheresourcesavailable,includingtheSystemsModelmadeearlierinthestoryline.
3. Includetext(explanations)anddrawings/illustrationsofconceptspresented,including.Itshouldidentifythepartsofthesystem(atmosphere,hydrosphere,andgeosphere)andhowmatterandenergyinteracttocreatethissystem.Focusthinkingtheoncausesandexplainingeachone.
ManagementStrategy:
1. RememberthemodelisbeingusedtoexplainWHYtheAtacamaDesertissodry.ThisisnotamodeloftheAtacamaDesert.Also,thisisaconceptualmodelsoitiscomplex.Thismaytakesometimeforyourstudentstoputalltheevidencetogether.BesuretoreferstudentsbacktotheSystemsModelandtheinteractions.Thisiswheretheanswerlies-intheinteractions!
2. DevelopyouownconceptualmodelBEFOREyougiveyoustudentsthistask.Youwillknowwherestudentsmayneedsupportandwillalsobetterunderstandthephenomenonyourself.
TeacherWill...ToSupportStudents
PuttingItAllTogether1. Makeallmapsandarticlesusedinthestoryline
availableforstudents.2. Promptstudentstocreateafinalmodelfor
explainWHY(cause)theAtacamaDesertisthedriestdesertintheworld.
3. Instructthemtousetheevidencetheyhavegatheredincreatingthemodel.
4. Also,encouragestudentstouseanyresourcestheyneed.Remindthemthattheyhaveallthepartsrecordedintheirlabnotebook,theyjustneedtopullitalltogether.
5. Themodelshouldfocusonthecausesandincludetext(explanations)anddrawings/illustrationsofconceptspresented,including:thepartsofthesystem(atmosphere,hydrosphere,andgeosphere)andhowmatterandenergyinteracttocreatethissystem.
Materials:Allmapsandarticlesusedinstoryline
AssessmentofStudentLearning
Proficient:RainShadowEffect(winds(atmosphere)carrymoisture(hydrosphere-matter)towardmountains,thenairlosesenergy(cools)andrainsonthewindwardsideofmountain;lesswatervaporinair(atmosphere)duetocooleroceantemperature(hydrosphere),andhighelevation(geosphere)oftheAtacamaleadstodryair(atmosphereandhydrosphere).Bonus:Thesunheatstheoceanandtheairovertheoceanwhichcausesthemoisturetoriseandmoveawayfromdesertregions(convection).