straits - listed companystraitstrading.listedcompany.com/misc/ar2011.pdf · origami change in its...
TRANSCRIPT


This year marks a significant one for Straits Trading, as we enter into a new phase of growth and celebrate 125 years of transforming with the times. To commemorate this event, we refreshed our corporate identity and would like to share our new logo with you.
The new Straits Trading logo retains familiar elements to honour our history, but is now presented in a more modern and contemporary manner.
The new logo embodies the essence of our business origins in tin smelting, as its design bears semblance to a tin ingot. Its form is also symoblic as a stamp of quality.
A new sans serif typeface was chosen as its modern look reflects our aim to constantly transform and keep up with the times. Its simple yet current appeal also serves to complement Straits Trading’s contemporary presence and forward-looking stance in today’s dynamic global economy.
old
STRAITSTRADING new
STRAITS TRADING REBRANDED

CONT EN T S
04. Chairman’s Statement
12. Board of Directors
16. Key Personnel
20. Group Financial Highlights
22. Corporate Social Responsibility
26. Business Review
32. Corporate Information
33. Corporate Governance
41. Financial Report
ORIGAMI
Change in its essence, is cultivated through the process of time. And Straits Trading’s vision to become a corporate transformer is by no means any different. Some successes are achieved overnight, but building a legacy takes time. Building upon last year’s theme of transformation, this year’s annual report is an extension of the origami concept to symbolise our ongoing process of transformation and growth.
Just as it takes time and skill to craft a single piece of paper into a work of art, we dedicate our efforts to constantly mould and develop our investments into businesses of enhanced value. With each experience bringing us closer to fulfilling our vision, we invite you to join us once again as we continue this journey of transformation.
THE STRAITS TRADING COMPANY LIMITED ANNUAL REPORT 2011 01

TRANSFORMATION02

T R AN SFORMWe seek to inspire change as much as change inspires us. In transforming ourselves in step with the dynamism in our markets, we will continue to refine our strategy to maximise our returns and enhance value, to create wealth for our shareholders.
THE STRAITS TRADING COMPANY LIMITED ANNUAL REPORT 2011 03

MS CHEW GEK KHIMExecutive ChairmanThe Straits Trading Company Limited
“We have been making encouraging progress in transforming Straits Trading into a holding company with stakes in businesses that are focused players in their chosen fields. The objective of these businesses should be to achieve a targeted return on equity or capital, justifying the capital that has been allocated to them such that the parent company, Straits Trading, receives a steady stream of income.”
TRANSFORMATION04

CHAIRMAN’S STATEMENT
Dear Shareholders,
O n behalf of the board of directors, it is with pleasure that I present to you the annual report of The Straits Trading
Company Limited (“Straits Trading”) for the financial year ended 31 December 2011.
Though our transformation is far from complete, we are pleased to report that we have become a stronger player in our chosen markets, and we are starting to see the results of initiatives put in place to create greater shareholder value. As a result, Straits Trading has emerged stronger and leaner with a sharper focus, and is better positioned with a robust management team and an improved set of results.
I am pleased to report that during FY2011, our revenue grew by 11% to $1.5 billion. The increase was broad-based across all businesses, with the highest contribution coming from our Resources division. Significantly, our net profit increased by 62% to $45.6 million. The better year-on-year results were due to higher profits from both tin mining and smelting operations in Malaysia, improved operating performance from the Hospitality division and fair contributions from our Property division. Our earnings per share (EPS) increased from 8.6 cents in 2010 to 14 cents in 2011. Our net asset value (NAV) per share also increased from $3.52 to $3.57.
MAIDEN MTN ISSUEGiven the uncertain economic outlook for global financial markets, we decided to strengthen our capital structure and balance sheet, by launching a Multicurrency Debt Issuance Programme in October 2011. This was followed by our successful inaugural S$225 million note issue in November 2011. Our debut on the capital markets was met with enthusiastic response by investors, as evidenced by the strong subscription rate at 4.5 times of the original intended deal size. We are heartened that investors appreciate the strength and stability of Straits Trading and the assets we possess.
With our additional capital resources, we are better-positioned to take advantage of any opportunistic acquisitions of assets that may arise, as well as undertake further investments to enhance and upgrade our existing assets, given the uncertain economic outlook. It will also enable us to ride through any unexpected turbulence with adequate funds.
THE STRAITS TRADING COMPANY LIMITED ANNUAL REPORT 2011 05

CHAIRMAN’S STATEMENT CONTINUED
PROGRESS IN TRANSFORMATIONWe have been making encouraging progress in transforming Straits Trading into a holding company with stakes in businesses that are focused players in their chosen fields. The objective of these businesses should be to achieve a targeted return on equity or capital, justifying the capital that has been allocated to them such that the parent company, Straits Trading, receives a steady stream of income. Such a structure should afford shareholders a degree of risk diversification across industries and geographies. At the same time, the importance of capital allocation to each of these businesses as well as the balance between centralised and decentralised management control is critical. There should be sufficient control from the parent, to ensure proper risk assessment and mitigation but sufficient autonomy in the business to ensure continued entrepreneurial strivings.
One of the visible effects of these changes is our streamlined corporate structure, as well as the strong top line growth in all our businesses. However in some of our businesses, this top line growth has yet to be translated into profits, as this can only be achieved through restructuring.
“Our streamlined corporate structure, combined with our transformation strategy, has helped buttress our objective of building long-term shareholder value.”
Consequently while 2011 saw increased top line growth, we also saw sharp falls in profits in some of our businesses as harsh decisions were made to “write-off” or impair investments made before 2008, which we thought were not of strategic value. This fall in profits was exacerbated by longer term strategic decisions that we felt were necessary such as, in the case of the Hospitality division, investing significant amounts of capital in businesses or assets which we thought were sub-optimal in performance and which would benefit in the longer term from this increased capital injection. (More of this will be covered under the reviews on “Resources” and “Hospitality”).
755
1,1591,271
Resources (S$Million)
1,400
1,200
1,000
800
600
400
200
0
09 10 11 09 10 11 09 10 11
6253
82
Property (S$Million)
90
80
70
60
50
40
30
20
10
0
128
147158
Hospitality (S$Million)
180
160
140
120
100
80
60
40
20
0
REVENUE
TRANSFORMATION06

pool of potential investors. In the long-term, we are optimistic that this secondary listing will enable MSC to enjoy wider investor interest and position it as an Asian integrated tin player that it is.
The additional funds raised have also enabled MSC to invest more capital in its mining arm to expand production. During the course of the year, MSC commenced operation of a new production unit at its Rahman Hydraulic tin mine in Perak that contributed to an increase in mine output. Work is also ongoing to upgrade the smelting and refining facilities at Butterworth to increase refining capacity and improve efficiency. Such investments will enhance the integration between the two arms, leading to increased efficiency and scale.
Rahman Hydraulic Tin currently undertakes its operations over five mining leases in the state of Perak covering an area of 601 hectares. MSC recently announced that the State of Perak has approved the renewal of these leases for a longer period up to 2030. The extension of the current mining leases to 2030 will enable Rahman Hydraulic Tin to undertake the necessary additional investments to optimise its long-term production
We also concede that some of the impairments and “write-offs” made were conservative and erred on the side of prudence.
The accompanying charts above show graphically the increase in top line growth for all businesses as well as the impact of impairments, capital expenditure and investment decisions made in 2010 and 2011.
We remain optimistic that barring further economic jolts in the global economy, profits should follow top line growth in future years.
MALAYSIA SMELTING CORPORATION BERHADMalaysia Smelting Corporation Berhad (MSC) reported a higher net profit for FY2011, a turnaround from FY2010. This was due to higher profits from both its mining and smelting operations in Malaysia, attributable to improved operating performance and higher average tin prices.
The secondary listing of MSC on the Singapore Exchange early last year has successfully raised its profile in the market and increased its access to a larger
09 10 11 09 10 11 09 10 11
34
Resources (S$Million)
50
40
30
20
10
0
-10
-20
-30
-40
-50
38
(41)
135
113
50
Property (S$Million)
160
140
120
100
80
60
40
20
0
(14)
(41)
(3)
Hospitality (S$Million)
0
-5
-10
-15
-20
-25
-30
-35
-40
-45
PROFIT BEFORE TAX
THE STRAITS TRADING COMPANY LIMITED ANNUAL REPORT 2011 07

CHAIRMAN’S STATEMENT CONTINUED
levels. This is expected to result in an increase in future earnings and thus, the overall valuation of Rahman Hydraulic Tin.
An application has already been submitted for extension of P. T. Koba’s Contract of Work (COW) agreement for another 10 years from 2013. Efforts are also ongoing to acquire tin exploration and mining concessions and development projects in Malaysia and Indonesia. The MSC Group is also evaluating several tin prospects in the Democratic Republic of Congo (DRC).
MSC is also continuing to pursue the divestment of the remaining two non-tin assets at acceptable prices.
Global economic uncertainties notwithstanding, and subject to renewal of P. T. Koba’s Contract of Work, the Board of MSC expects its operating performance for FY2012 to be profitable.
We will continue to support the Board and Management of MSC in pursuing their strategy to grow and expand into new territories and markets.
With its key capabilities, and strong competencies we are confident that MSC will continue to deepen and extend its leadership position in the tin industry in the foreseeable future.
Further details of the business of MSC can be found in the review on “Resources”.
STRAITS DEVELOPMENTSOur Property division continues to make good strides in the premium property sector, as we leverage on our strengths and expertise in the development of, and investment in premium lifestyle projects.
We achieved higher revenue on the back of healthy sales of premium residential developments as well as higher commercial property rental.
Looking ahead, we will continue to focus on the development of premium lifestyle projects catering to the affluent segment in the market. We will continue to explore opportunities to grow and expand our
portfolio, especially in the prime residential districts.We are pleased to add that our relatively conservative view of the Singapore residential market since 2010 has made us less vulnerable to the recent property cooling measures. Having focused our efforts on developing the real estate that we own such as our Good Class Bungalow (GCB) land, and restricting ourselves to investing in prime located properties, we think we are well positioned to ride out this current property cycle. At the same time, our large cash resources should enable us to make opportunistic acquisitions, should they arise.
RENDEZVOUS HOSPITALITY GROUP (RHG)Our Hospitality division recorded a significantly reduced loss in FY2011, compared with FY2010, coupled with an increase in revenue. The improved performance was due to higher room rates and average occupancy, lower corporate costs and fair value gains.
This is a very encouraging sign of the progress we have made, as our efforts to turn around the business have begun to bear fruit. However we remain mindful that there is still more hard work to come.
Our hospitality business also realised a number of other key milestones during the year. Our flagship property in Singapore, after an extensive refurbishment, was rebranded under the Rendezvous Grand banner.
An important element in our hospitality strategy is our asset optimisation programme, which aims to unlock value from existing assets and achieve better returns through ongoing cost and productivity improvements.
“Our Property division continues to make good strides in the premium property sector, as we leverage on our strengths and expertise in the development of, and investment in high-end lifestyle projects.”
TRANSFORMATION08

These refurbishment programmes are expected to lead to higher revenue and better profitability for our hotels due to their improved positioning in their respective markets.
Our Hospitality division has also embarked upon a rebranding programme under the “One Rendezvous” initiative, aimed at strengthening the brand equity and enhancing the value proposition of our hotels. This new brand structure, in which the existing Marque hotels will be rebranded as Rendezvous, should lead to greater awareness among our target market segments and result in better coherence when engaging with our core customers.
With good progress made in transforming our Hospitality division, we are exploring additional ways to add value to the Rendezvous brand and our hotel network. This may involve strategic partnerships, potential acquisitions of assets in key Asia Pacific cities and other such value generating initiatives.
WBL CORPORATION LIMITEDDuring 2011, our interest in WBL Corporation Limited decreased slightly to 17.3% from 17.8% the year before, due to the conversion of outstanding convertible bonds that led to an increase in the total outstanding share capital of WBL. All four of WBL’s core divisions comprising Technology, Automotive, Property and Engineering and Distribution performed profitably for the financial year ended 30 September 2011. WBL paid out a total dividend of 10 cents per share in 2011.
DIVIDENDSWe are pleased to inform shareholders that we will be increasing our interim dividend payout to four cents per share for FY2011 in view of the better performance of the Group in FY2011 compared to FY2010. This is consistent with our goal of working towards a fair and sustainable dividend policy, as our businesses are transformed and value is unlocked.
2012 AND BEYONDAt the time of writing, 2012 appears to be a year of uncertainty for the global economy. Although progress has been made in Europe in dealing with the crisis, and there are signs of improvement in the US economy, the US and Europe are still both dealing with unprecedented debt burdens. Austerity programs are also being implemented in Europe. Climate change has affected countries such as Japan, Australia and Thailand, contributing to business disruptions and in some instances, personal tragedies. The political situation in the Middle East remains volatile, contributing to higher oil prices and in countries where GDP growth has been high, many of their governments are now working to slow growth down so as to avoid a huge wealth divide. We see this in China and Singapore as evidenced by greater government economic intervention and higher taxes. For these reasons, we remain cautious about the prospects for the year before us.
“We are pleased to inform shareholders that we will be increasing our interim dividend payout to four cents per share for 2011, in view of the better performance of the Group in FY2011 compared to FY2010.”
THE STRAITS TRADING COMPANY LIMITED ANNUAL REPORT 2011 09

However Straits Trading is in very good shape to meet the challenges ahead. We have a sound portfolio of good quality assets and projects, a lean organisation as well as businesses that are adequately funded and backed by a strong balance sheet and a clear strategy for delivering value.
Some of the initiatives for 2012 include reviewing plans for our land-bank in Butterworth, developing our 3 remaining undeveloped GCB plots, as well as making additional value-accretive investments in our Hospitality division.
2012 also marks a significant milestone in the history of our company, being our 125th year of existence. With our pedigree and long history, we are quietly confident of definitively transforming our company to seize the opportunities ahead and reinforce our position as a leading corporate stalwart.
NEW ADDITIONS TO THE EXECUTIVE TEAMWe are pleased to welcome Mr Mark Greaves who joined Straits Trading in September 2011, as Adviser to the Chairman’s Office. This appointment complements the formal establishment of the Chairman’s Office within Straits Trading as a strategic planning and corporate development platform for the Group as a whole. Mr Greaves’ role is to assist the Chairman’s Office with major corporate and strategic issues.
We would a lso l ike to welcome on board Mrs Diana Ee-Tan as Adviser to our Hospitality division. Mrs Ee-Tan, a veteran in the hospitality industry will be advising our overseas hospitality businesses in matters of strategic importance.
“2012 also marks a significant milestone in the history of our company, being our 125th year of existence.
I wish to extend my heartfelt thanks to my fellow Directors, our valued shareholders, advisers, business associates, clients, customers and financiers for their steadfast support. I would also like to express our sincere appreciation to the management and staff for their contribution, dedication and commitment to the continued progress and prosperity of The Straits Trading Group.
CHEW GEK KHIMExecutive Chairman
28 March 2012
10 TRANSFORMATION

STRAITSTRADING
100% 100%54.8% 17.3%
* As at 28 March 2012
RESOURCES
Malaysia Smelting Corporation Berhad is the largest global custom tin smelter and, including its subsidiary’s production, the world’s second largest global supplier of refined tin. The quality Straits tin brand is in demand amongst top electronics manufacturers.
INVESTMENTS
WBL Corporation Limited is one of the earliest Singapore-based developers of residential properties in China and global no. 3 in flexible printed circuit manufacturing. Key customers include Apple and RIM.
HOSPITALITY
Rendezvous Hospitality Group is the Hospitality division of Straits Trading that focuses on mid-scale to upscale hotels in Asia Pacific targetting the business market.
Market capitalisation: $1.08 bn*
PROPERTY
Straits Trading, through Straits Developments Private Limited, is one of the largest listed owners of good quality bungalows in Singapore.
11THE STRAITS TRADING COMPANY LIMITED ANNUAL REPORT 2011

1. MS CHEW GEK KHIMExecutive ChairmanLLB (Hons)
Non-Independent and Executive DirectorLast re-elected: 2010
Ms Chew Gek Khim is a lawyer by training. She has been Chairman since 24 April 2008, first as Non-Executive and Non-Independent Chairman and then as Executive Chairman since 1 November 2009. As Executive Chairman, Ms Chew works closely with the senior management to oversee the implementation of policies and decisions, including compliance with corporate governance codes.
Ms Chew is also Executive Chairman of the Tecity Group, which she joined in 1987. She also sits on the board of CapitaRetail China Trust, an SGX-ST listed trust of the CapitaLand Group.
Ms Chew is also Deputy Chairman of the Tan Chin Tuan Foundation in Singapore and Chairman of the Tan Sri Tan Foundation in Malaysia. She chairs the National Environment Agency Board of Singapore, and sits on the Singapore Totalisator Board and the Securities Industry Council of Singapore. Ms Chew graduated from the National University of Singapore in 1984.
2. TAN SRI DATO’ DR LIN SEE-YANPSM, DPMP, DSAP, JMN, JSM, AMN, BA (Hons),MPA, MA, PhD, C Stat, C Sci
Independent and Non-Executive DirectorLast re-appointed: 2011
Tan Sri Dato’ Dr Lin See-Yan, a British Chartered Scientist and Harvard educated economist, has been a Director since 1994 and presently sits on the boards of Great Eastern Holdings Ltd Group and Silverlake Axis Limited in Singapore. He continues to serve the public interest, including as Member, Malaysia Prime Minister’s Economic Council Working Group, as well as a member of a number of Key National Committees on Higher Education; and Economic Adviser, Associated Chinese Chambers of Commerce and Industry of Malaysia. Prior to 1998, he was Chairman
bOARD OF DIRECTORS
1.2. 3. 4.
12 TRANSFORMATION

and Chief Executive Officer of the Pacific Bank Group and for 14 years previously, Deputy Governor of Bank Negara Malaysia, having been a central banker for 34 years. Tan Sri Lin also served as director of Khazanah Nasional Berhad (1994 to 2000) and was Chairman of its Executive Board (1999 to 2000).
Tan Sri Lin is also Chairman Emeritus, Harvard Graduate School of Arts & Sciences Alumni Council at Harvard University, in addition to being President, Harvard Club of Malaysia.
3. MR RAZMAN ARIFFINB Sc (Eng), ARSM, MIME(M)
Independent and Non-Executive DirectorLast re-elected: 2011
Mr Razman bin Ariffin was appointed to our Board in December 2006. Mr Ariffin’s rich involvement in the mining, metallurgical and energy industries spans over 30 years, starting as production and planning engineer with Osborne & Chappel Sdn Bhd, then as petroleum engineer with Sarawak Shell Berhad. He was then attached to the Malaysia Mining Corporation Berhad Group (now known as MMC Corporation Berhad Group) serving in various capacities over the years. In 1985, Mr Ariffin joined Malaysia Smelting Corporation Berhad (MSC) as general manager and was its Chief
Executive Officer when he left in 1994. Currently an independent strategic and corporate consultant, Mr Ariffin also sits on the board of MSC and is Chairman of P. T. Koba in Indonesia. He was the former Managing Director of Trenergy (M) Berhad (now known as M3nergy Berhad) and Crest Petroleum Bhd (now known as SapuraCrest Petroleum Berhad), both companies listed on Bursa Malaysia.
Mr Ariffin graduated from the Imperial College of Science and Technology at the University of London, England with first class honours in mining engineering in 1972.
5.7.6. 8 .
13THE STRAITS TRADING COMPANY LIMITED ANNUAL REPORT 2011

bOARD OF DIRECTORS CONTINUED
4. MRS ELIZAbETH SAMBA (Hons) Economics
Independent and Non-Executive DirectorLast re-appointed: 2011
Mrs Elizabeth Sam brings with her more than 40 years of experience in the financial sector, having held senior positions in the Ministry of Finance, the Monetary Authority of Singapore, Mercantile House Holdings PLC (a company listed on the London Stock Exchange) and Oversea-Chinese Banking Corporation Limited. Currently a director of Boardroom Limited, SC Global Developments Ltd, The Banyan Tree Holdings Ltd, AV Jennings Ltd and Kasikorn Bank, Mrs Sam was also the Chairman of the Singapore International Monetary Exchange, from 1987 to 1990 and from 1990 to 1993 and the Investment Management Association of Singapore, from 1997 to 1999. She was a member of the Trade Development Board from 1989 to 1994.
In 1996, Mrs Sam was awarded the Public Service Star (BBM), Republic of Singapore, for her contributions to financial centre developments.
Mrs Sam graduated from the University of Singapore with a BA (Hons) Economics.
5. MS CHEW GEK HIANGB Acc (Hons), CPA
Non-Independent and Non-Executive DirectorLast re-elected: 2011
Ms Chew Gek Hiang, an accountant by training, has been with the Tecity Group, our parent company, since 1991. As Executive Director and Head of Finance, she is actively involved in the investment
activities of the Tecity Group and is responsible for its securities trading portfolio. She also oversees the human resource and administrative functions in the Tecity Group. Currently serving on the advisory panel of the GST Review Board, Ms Chew is also a Council Member of the Tan Chin Tuan Foundation in Singapore and the Tan Sri Tan Foundation in Malaysia. She is also President of Noah’s Ark CARES (Companion Animal Rescue and Education Society), a non-profit animal welfare society which champions responsible pet ownership and active sterilisation and micro-chipping of stray dogs and cats in Singapore and Johor.
Ms Chew graduated from the National University of Singapore in 1986. She joined Ernst & Young (London) in 1987 to pursue chartered accountancy, and was admitted to the Institute of Chartered Accountants in England and Wales in October 1990.
6. MR DAVID GOH KAY YONGBA (Hons), SM (MIT), CFA
Non-Independent and Non-Executive DirectorLast re-elected: 2009
Mr David Goh Kay Yong is the Chief Investment Officer and Chief Strategist of the Tecity Group, our parent company. Mr Goh started his investment career as an Investment Analyst with Great Eastern Life in 1986, and taught at Nanyang Technological University (NTU), Singapore in the Bachelor of Business Financial Analyst programme in 1991. After joining Tecity Group in 1997, he remained from 1997 to 2003, as Adjunct Associate Professor of Finance at NTU. Presently the non-executive chairman
of Yeoman Capital Management Pte Ltd (an exempt fund manager), Mr Goh also serves as director of Pastamatrix International Pte Ltd, Stewardship Equity Pte Ltd, and NPE Print Communications Pte Ltd.
Mr Goh holds a Bachelor of Arts (Hons) degree in Economics from York Univers i ty, Canada; a Master of Science in Management (System Dynamics, Finance and Strategy) from Massachusetts Institute of Technology’s Sloan School of Management, and is a CFA Charter holder.
14 TRANSFORMATION
7. MR YAP CHEE KEONGB Acc, FCPA
Lead Independent DirectorLast re-elected: 2010
Mr Yap Chee Keong was appointed as the Lead Independent Director of The Straits Trading Company Limited with effect from 1 November 2009.
Mr Yap is an independent non-executive director of CapitaMalls Asia Limited and Hup Soon Global Corporation Limited and is the chairman of their audit committees. He is the chairman of CityNet Infrastructure Management Pte Ltd and is also an independent non-executive director of Citibank Singapore Limited, Tiger Airways Holdings Ltd and UTAC Holdings Ltd. In addition, he serves as a board member of the Accounting and Corporate Regulatory Authority and as a member of the Public Accountants Oversight Committee. Mr Yap is also a non-executive director of SPI (Australia) Assets Pty Ltd.
Mr Yap was previously Chief Financial Officer of the Singapore Power Group (“SP”) where he was also responsible for corporate planning and strategic investments as well as oversight of the overseas investments of SP which included its Australian investments. Prior to SP, Mr Yap worked as the Chief Financial Officer and in other senior management roles in several multinational and listed companies. Mr Yap has 25 years of experience in senior management, strategic planning, mergers and acquisitions, corporate finance and treasury, financial management and risk management functions in diverse industries.
Mr Yap holds a Bachelor of Accountancy from the National University of Singapore and is a Fellow of the Institute of Certified Public Accountants of Singapore and CPA Australia.
8. MR THAM KUI SENGBA (Hons), Engineering Science
Independent and Non-Executive DirectorLast re-elected: 2010
Mr Tham Kui Seng is a director of Global Logistics Properties Limited, Raffles Medical Group Ltd, Sembcorp Industries Ltd, Capitaland China Holdings Pte Ltd and SPI (Australia) Assets Pty Ltd. He also serves on the Board of the Housing and Development Board (HDB). Mr Tham was the former Chief Corporate Officer of CapitaLand Limited overseeing the corporate services functions of the real estate group, a position he held from 2002 until 31 December 2008. He also served as the Chief Executive Officer of CapitaLand Residential Limited and before that, the Chief Operating Officer of Pidemco Land Limited.
Mr Tham graduated from the University of Oxford with a Bachelor of Arts in Engineering Science.
15THE STRAITS TRADING COMPANY LIMITED ANNUAL REPORT 2011
KEY PERSONNEL
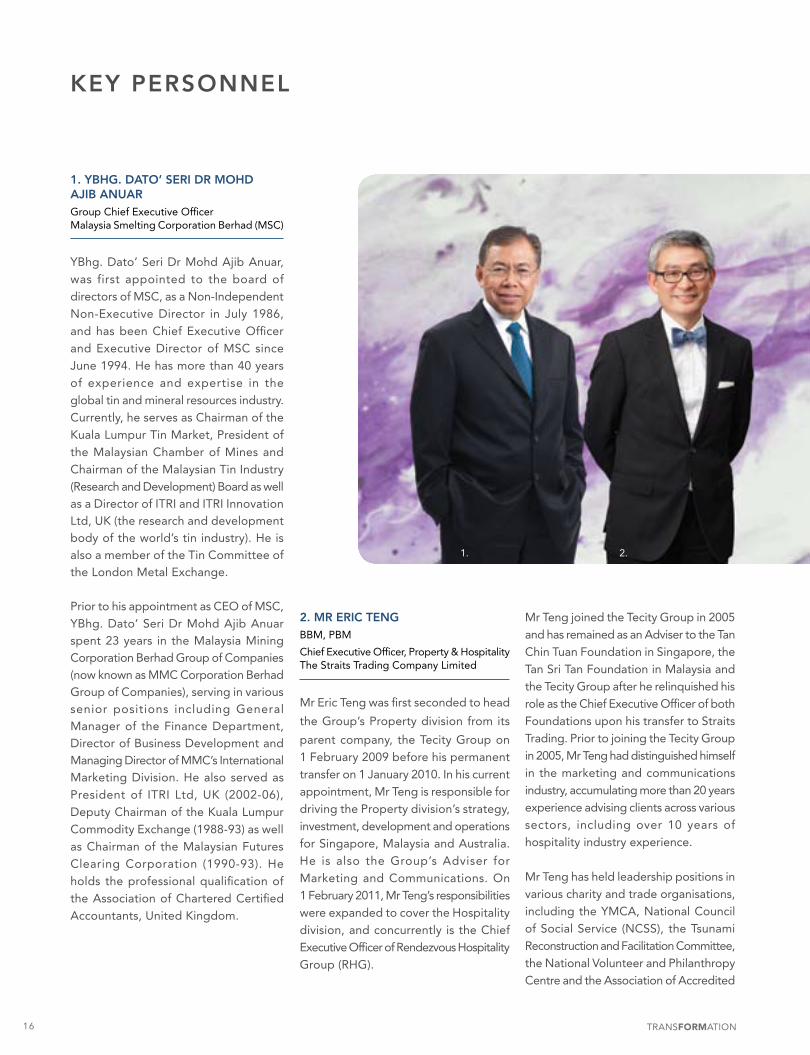
1. YbHG. DATO’ SERI DR MOHD AJIb ANUAR Group Chief Executive Officer Malaysia Smelting Corporation Berhad (MSC)
YBhg. Dato’ Seri Dr Mohd Ajib Anuar, was first appointed to the board of directors of MSC, as a Non-Independent Non-Executive Director in July 1986, and has been Chief Executive Officer and Executive Director of MSC since June 1994. He has more than 40 years of experience and expertise in the global tin and mineral resources industry. Currently, he serves as Chairman of the Kuala Lumpur Tin Market, President of the Malaysian Chamber of Mines and Chairman of the Malaysian Tin Industry (Research and Development) Board as well as a Director of ITRI and ITRI Innovation Ltd, UK (the research and development body of the world’s tin industry). He is also a member of the Tin Committee of the London Metal Exchange.
Prior to his appointment as CEO of MSC, YBhg. Dato’ Seri Dr Mohd Ajib Anuar spent 23 years in the Malaysia Mining Corporation Berhad Group of Companies (now known as MMC Corporation Berhad Group of Companies), serving in various senior positions including General Manager of the Finance Department, Director of Business Development and Managing Director of MMC’s International Marketing Division. He also served as President of ITRI Ltd, UK (2002-06), Deputy Chairman of the Kuala Lumpur Commodity Exchange (1988-93) as well as Chairman of the Malaysian Futures Clearing Corporation (1990-93). He holds the professional qualification of the Association of Chartered Certified Accountants, United Kingdom.
1. 2.
2. MR ERIC TENGBBM, PBM
Chief Executive Officer, Property & Hospitality The Straits Trading Company Limited
Mr Eric Teng was first seconded to head
the Group’s Property division from its
parent company, the Tecity Group on 1 February 2009 before his permanent transfer on 1 January 2010. In his current appointment, Mr Teng is responsible for driving the Property division’s strategy, investment, development and operations for Singapore, Malaysia and Australia. He is also the Group’s Adviser for Marketing and Communications. On 1 February 2011, Mr Teng’s responsibilities were expanded to cover the Hospitality division, and concurrently is the Chief Executive Officer of Rendezvous Hospitality Group (RHG).
Mr Teng joined the Tecity Group in 2005 and has remained as an Adviser to the Tan Chin Tuan Foundation in Singapore, the Tan Sri Tan Foundation in Malaysia and the Tecity Group after he relinquished his role as the Chief Executive Officer of both Foundations upon his transfer to Straits Trading. Prior to joining the Tecity Group in 2005, Mr Teng had distinguished himself in the marketing and communications industry, accumulating more than 20 years experience advising clients across various sectors, including over 10 years of hospitality industry experience.
Mr Teng has held leadership positions in various charity and trade organisations, including the YMCA, National Council of Social Service (NCSS), the Tsunami Reconstruction and Facilitation Committee, the National Volunteer and Philanthropy Centre and the Association of Accredited
16 TRANSFORMATION

Advertising Agents Singapore. For hisvoluntary contributions, Mr Teng was awarded by the Singapore government the Public Service Medal (PBM) in 2001 and the Public Service Star (BBM) in 2011.
Mr Teng holds professional qualifications in marketing and an MBA from NUS Business School.
3. MRS MAUREEN LEONGGroup Chief Financial OfficerThe Straits Trading Company Limited
Mrs Maureen Leong joined our Company as its Group Chief Financial Officer (CFO) in September 2009. As Group CFO, Mrs Leong has overall responsibility for the Group’s financial functions, including treasury, tax, insurance, risk management and capital management of Straits Trading and its group of companies.
Mrs Leong was appointed to the Board of MSC, a subsidiary of Straits Trading, listed on both the Main Boards of Bursa Malaysia and SGX-ST, as a Non-Independent and Non-Executive Director in December 2009.
Mrs Leong has more than 30 years of experience in corporate planning and finance, project financing, mergers and acquisitions, treasury, tax, financial management and risk management functions in various industries. She started her career with DBS Bank Ltd before moving on to Deloitte & Touche. Prior to joining Straits Trading, Mrs Leong was with Sembcorp Industries Ltd, where her last appointment was Executive Vice President of Group Mergers and Acquisitions, Group Performance Management and Corporate Planning of the Sembcorp Group of companies.
3. 4.
She served as Director, Group Finance of Sembcorp Marine Ltd between 2007 and 2008, having previously served as Group CFO of Sembcorp Logistics Ltd from 2004 to 2006, and as Group CFO of Sembcorp Utilities Pte Ltd between 2001 and 2004. Both Sembcorp Industries Ltd and Sembcorp Marine Ltd are listed on the main board of SGX-ST.
Mrs Leong holds a First Class Honours degree in Accountancy from the University of Singapore and is a Fellow of both the Institute of Certified Public Accountants of Singapore and CPA Australia.
4. MR ELDON WANDeputy Group Chief Financial Officer, The Straits Trading Company Limited
Mr Eldon Wan was appointed Deputy Group Chief Financial Officer (CFO) of The Straits Trading Company Limited on 18 April 2011. As Deputy Group CFO, Mr Wan assists the Group Chief Financial Officer in overseeing the financial and accounting functions of the Group and taking care of the financial aspects of ad-hoc projects. Mr Wan joined the Tecity Group as an accountant in 1998 and was promoted to Group Finance Manager. He was seconded to The Straits Trading Company Limited as Group Financial Controller on 7 April 2009 before his appointment as Deputy Group CFO on 18 April 2011. Prior to joining the Tecity Group, Mr Wan was an auditor with Ernst & Young.
Mr Wan has more than 15 years of experience in finance and accounting, including fund raising, investments, project financing and tax planning. He graduated from the Nanyang Technological University of Singapore with a Bachelor of Accountancy degree in 1995 and is a member of the Institute of Certified Public Accountants of Singapore.
17THE STRAITS TRADING COMPANY LIMITED ANNUAL REPORT 2011

18 TRANSFORMATION

I NFORMWe recognise that knowledge is power, and to this end maintain a close watch on market developments that allow us to make informed decisions and seize the right opportunities to grow our business.
19THE STRAITS TRADING COMPANY LIMITED ANNUAL REPORT 2011

GROUP FINANCIAL HIGHLIGHTS
2011 2010 2009 2008 2007$’000 $’000 $’000 $’000 $’000
Total revenue 1,510,663 1,358,721 951,896 1,245,865 1,067,312
Earnings before interest and tax 97,489 47,753 212,628 87,283 544,337
Profit before tax 79,246 23,872 187,368 73,915 536,805Profit attributable to owners of the Company 45,621 28,169 159,282 57,608 484,957Shareholders’ funds 1,162,424 1,146,413 1,116,640 1,196,781 1,831,487
Per Share
Earnings per share (cents) 14.0 8.6 48.9 17.7 148.8
Gross dividend per share (cents) 4.0 2.0 2.0 (a) 2.0 (b) 7.5
Net asset value per share ($) 3.57 3.52 3.43 3.67 5.62
Financial Ratios
Return on equity (%) 4.0 2.5 13.8 3.8 31.1
Net gearing (%) 33.5 42.4 40.7 21.4 –
Note:(a) This does not take into account the special dividend of $1.00 per share paid in 2 installments on 6 March
2009 (80 cents) and 30 April 2009 (20 cents), following the approval by the Company’s shareholders at an extraordinary general meeting (“EGM”) held on 19 December 2008, and the expiry of the 21-day statutory period on 12 January 2009.
(b) This does not take into account the special dividend of $1.50 per share paid on 31 July 2008, following the approval by the Company’s shareholders at an EGM held on 13 June 2008, and the expiry of the 21-day statutory period on 7 July 2008.
20 TRANSFORMATION

2011 2010 2009 2008 2007$’000 $’000 $’000 $’000 $’000
bALANCE SHEETAssets
Non-current assets
Property, plant and equipment 389,802 340,923 313,033 310,166 206,252
Investment properties 932,907 853,505 776,877 813,813 821,132
Goodwill 21,863 22,425 35,052 22,211 24,089
Other intangible assets 39,128 34,119 30,359 28,264 12,336
Investments in associates and joint ventures 76,439 67,143 118,410 76,280 11,833
Deferred tax assets 8,487 10,722 10,584 14,242 13,114
Other non-current receivables 2,695 2,315 1,085 – –
Investment securities 135,500 213,683 235,299 106,576 434,065
Other non-current assets 1,226 18,025 49,335 19,489 4,922
Total non-current assets 1,608,047 1,562,860 1,570,034 1,391,041 1,527,743
Current assetsCurrent assets 656,776 439,362 380,034 537,706 723,572
Assets/Disposal group classified as held for sale – 10,680 – 2,078 –
Total current assets 656,776 450,042 380,034 539,784 723,572
Total assets 2,264,823 2,012,902 1,950,068 1,930,825 2,251,315
Equity and liabilities
Equity
Share capital 265,928 265,928 265,928 265,928 265,928
Retained earnings 783,370 746,405 724,754 891,369 1,329,125
Other reserves 113,126 135,253 125,958 39,484 236,434
Reserve of disposal group classified as held for sale – (1,173) – – –
Equity attributable to owners of the Company 1,162,424 1,146,413 1,116,640 1,196,781 1,831,487
Non-controlling interests 97,723 47,190 73,390 52,349 62,669
Total equity 1,260,147 1,193,603 1,190,030 1,249,130 1,894,156
Non-current liabilities
Provisions 14,102 13,165 6,478 6,572 5,244
Deferred tax liabilities 76,957 75,868 69,056 54,746 38,554
Borrowings 520,190 296,124 307,609 247,565 3,922
Derivative financial instruments 354 576 2,928 4,934 -
Other non-current liabilities 2,631 7,532 13,682 26,915 40,165
Total non-current liabilities 614,234 393,265 399,753 340,732 87,885
Current liabilities
Current liabilities 390,442 421,293 360,285 340,963 269,274Liabilities directly associated with disposal group classified as held for sale – 4,741 – – –
Total current liabilities 390,442 426,034 360,285 340,963 269,274
Total liabilities 1,004,676 819,299 760,038 681,695 357,159
Total equity and liabilities 2,264,823 2,012,902 1,950,068 1,930,825 2,251,315
21THE STRAITS TRADING COMPANY LIMITED ANNUAL REPORT 2011

T he Straits Trading Company Limited is committed to being a socially responsible organisation. To us, it is important to give
back to the community and contribute to positive and sustainable change. With the goal of fostering positive relationships within the communities in which we operate, Straits Trading engages in a myriad of activities to address various needs in the local community as well as to encourage employees to play an active role.
2011 marks a continuation of our efforts to pursue this objective by extending a helping hand to the needy and the underprivileged.
CHILDREN’S CANCER FOUNDATION (CCF)On 6 May 2011, volunteers from Straits Trading and Tecity arrived at KK Women and Children’s Hospital (KKH) for our first CSR activity of the year with our adopted charity – Children’s Cancer Foundation (CCF). With Mother’s Day just round the corner, the focus for the event was on mothers whose children were undergoing treatment at KKH.
Dinner was prepared for and gifts were presented to participating mothers while balloon sculptures were given to the children accompanying them at the event. Over a period of 2 hours, the skilful hands of 2 masseuse trained by the Singapore Association of the Visually Handicapped (SAVH) kneaded away the tiredness of the care-giving mothers in the playroom at KKH Children’s Cancer Centre.
The occasion also afforded the participating mothers an opportunity to share their experiences over dinner, their challenges as well as their hopes, in seeing their children undergoing treatment.
Response to the event was good and our volunteers were heartened at the participants’ comments that the quality and commitment behind their efforts had made a significant difference to their experience.
This was truly a memorable event for our volunteers who sponsored the food, coordinated the orders, prepared the gifts and undertook the arrangements to make the occasion a meaningful one.
A similar event was organised on 17 June 2011, in conjunction with Father’s Day. The focus this time was on relieving fathers whose children were undergoing treatment at KKH. The parents were deeply appreciative of the efforts of our volunteers in providing the dinner, massage and gifts for the celebrations.
We understand from CCF that our organisation was the first to host such celebrations for caregivers. We feel privileged to participate in such events that form part of CCF’s holistic approach to helping families manage their lives as they bring up children diagnosed with cancer.
Volunteers from Straits Trading and Tecity pitched in to appreciate the parents of CCF children on Mother’s Day and Father’s Day.
CORPORATE SOCIAL RESPONSIbILITY
22 TRANSFORMATION

SOCIETY FOR THE PHYSICALLY DISABLED (SPD)On 11 June 2011, some of our volunteers from the Property division accompanied approximately 20 beneficiaries from the Society for the Physically Disabled (SPD) to watch Kung Fu Panda 2 at Shaw Cineplex at the newly-opened Nex Shopping Centre.
The event took place at one of the premiere theatres, exclusively booked for the occasion. This afforded our beneficiaries the opportunity to watch the movie in indulgence and style. Popcorn and soft drinks were also served, and it was laughter all around, as everyone sat entertained by the impressive animation and light-hearted humour in the movie. It was also a truly satisfying and memorable experience for our volunteers, who assisted the physically-challenged beneficiaries from the time they disembarked from their vehicles, to the cinema, and back.
SINGAPORE CHILDREN’S SOCIETY, SINGAPORE CANCER SOCIETY and RED CROSS SOCIETYRendezvous Grand Hotel Singapore was the official venue for the “No Place like Home” exhibition which featured works by Dr Wee Hong Ling, a prominent Singaporean ceramic artist living in New York. Held from 30 July to 14 August 2011, Dr Wee’s first solo exhibition in Singapore was themed after the concept of “Home”, as it coincided with National Day. In keeping with the theme, her works were displayed within an exhibition space tastefully done up to look like an abode.
The official opening was held on 29 July 2011 where more than 100 business associates and friends of the arts were invited. Guests at the cocktail party had the opportunity to appreciate contemporary ceramics at the exhibition. Three of Dr Wee’s pottery pieces were also auctioned off in aid of the Singapore Children’s Society, the Singapore Cancer Society and the Red Cross Society.
PROJECT WE CAREWe also participated in “Project We Care”, the People’s Association’s (PA) corporate volunteerism scheme, in hosting a garden party at the Istana for needy Singaporeans. The event, hosted by President Tony Tan and Mrs Mary Tan, was attended by 1500 low-income families living in rental blocks in various parts of Singapore. As the adults enjoyed chicken skewers and laksa, the children played with balloons and watched jugglers and stilt-walkers. Our volunteers from Straits Trading accompanied the residents throughout the event, befriending and taking care of them and ensuring they enjoyed the occasion. This maiden initiative with the PA was truly an eye-opener and afforded a heartening and memorable experience for everyone involved.
Volunteers from RHG, with Dr Wee Hong Lin (centre in green dress), at the “No Place Like Home” exhibition.
23THE STRAITS TRADING COMPANY LIMITED ANNUAL REPORT 2011

24 TRANSFORMATION

P E RFORMPropelled by our heritage and legacy, we remain primed to scale new challenges and nurture our investments to deliver greater value to our customers and stakeholders.
25THE STRAITS TRADING COMPANY LIMITED ANNUAL REPORT 2011

bUSINESS REVIEW
RESOuRCES
A mid extreme volatility and growing uncertainty in the global commodities and financial markets, MSC Group
achieved a 13% growth in its revenue to a record high of RM3.1 billion. Profits before exceptional losses rose 53% to RM116.4 million for the year ended 31 December 2011 compared to RM76.0 million in 2010. The group remained one of the top tin smelters in the world despite increasing competition.
MSC Group’s financial position improved during the year. Net cash flow generated from operating activities improved from RM56.2 million to RM208.8 million. The strong cash flows enabled MSC Group to reduce its bank borrowings by RM137.6 million and consequently improved its gearing level to 1.2 from 2.3. The Board of MSC Group has proposed a final dividend of 18 sen per share which would return RM13.5 million to shareholders. Together with an interim dividend of 12 sen per share paid in September 2011 the total dividend paid and proposed for the financial year 2011 would amount to RM22.5 million.
TIN MINING AND SMELTING OPERATIONSThe operating and financial results among MSC Group’s business units were, however, mixed. The international tin smelting business and the tin mining operations in Malaysia achieved a commendable performance with better production, sales and profits on the back of improved operating efficiencies and higher tin prices. However, MSC Group’s operations in Indonesia were adversely affected by lower sales and production in the fourth quarter of 2011 as a result of the unexpected development over the shipment of tin metals when the Indonesian Tin Association imposed an export moratorium on tin shipments from Bangka Island, effective 1st October 2011. Furthermore, lower tin prices and higher unit cost of production, compounded by the low volume
of production in the fourth quarter, had resulted in significant operating losses to P. T. Koba. Although P. T. Koba has submitted an application to renew its Contract of Work (COW) for a further extension of 10 years to 2023, on grounds of prudence, P. T. Koba decided to make an additional provision for mine closure and reclamation/rehabilitation costs and other impairments. These had further increased P. T. Koba’s losses.
During the year, significant resources were mobilised throughout the supply chain to achieve sustainability and growth in the volume of tin concentrates and tin bearing materials for smelting at MSC Group’s smelting plant in Butterworth. MSC Group’s initiatives included pursuing constructive engagements globally with all stakeholders in the supply chain, especially in dealing with conflict mineral issues to ensure transparency and accountability in its international mineral sourcing. Upgrading of smelting and refining facilities were also undertaken to improve efficiency and increase production capacity. An additional production unit was also successfully installed at the Group’s tin mine in Perak, Malaysia. The results of all these efforts enabled MSC Group to increase its overall metal production in 2011 by 2.7% to 46,599 metric tonnes, thus maintaining its position as the second largest supplier of tin metal globally.
Rahman Hydraulic Tin currently undertakes its operations over five mining leases in the state of Perak
Reverse circulation drilling at Rahman Hydraulic
26 TRANSFORMATION

MSC Group continues to pursue opportunities to expand its tin reserves in Malaysia and Indonesia and has identified several prospective tin mineralised areas for exploration and development. Discussions are on-going with a view towards progressing with possible acquisitions. MSC Group is also evaluating several tin prospects in the Democratic Republic of Congo (DRC). DRC has been a significant source of tin concentrates for MSC Group’s international tin smelting business.
DIVESTMENT OF NON-TIN ASSETSSeveral divestments were made during the year in respect of MSC Group’s non-tin assets. MSC Group will continue to pursue the divestment of the remainng two non-tin assets at acceptable prices. At the end of 2011 MSC Group’s remaining non-tin investments included a 30% interest in the unlisted KM Resources Inc which owns a profitable polymetallic mine (producing copper, gold, zinc and silver in concentrates) in the Philippines and a 15.42% interest in a Canadian-listed nickel development company, Asian Mineral Resources Limited.
Although the coming year will continue to be challenging due to weaker demand for commodities arising from prevailing global economic uncertainties such as the eurozone sovereign debt concerns, the long-term outlook of the tin industry remains positive. Given MSC Group’s continued efforts to improve operating efficiencies and increase rationalisation efforts at its Indonesian operations, subject to renewal of P. T. Koba’s COW in Indonesia, MSC Group is well-positioned to deliver profitable growth and sustained value for its shareholders.
MSC continues to pursue opportunities to expand its tin resources in Malaysia and Indonesia and has identified several prospective tin mineralised areas for exploration and developments.
Tin Dredge at P. T. Koba
Drilling for offshore tin deposit on a barge in Indonesia
covering an area of 601 hectares. MSC Group recently announced that the State of Perak has approved the renewal of these leases for a longer period up to 2030. The extension of the current mining leases to 2030 will enable Rahman Hydraulic Tin to undertake the necessary additional investments to optimise its long-term production levels. This is expected to result in an increase in future earnings and thus, the overall valuation of Rahman Hydraulic Tin.
27THE STRAITS TRADING COMPANY LIMITED ANNUAL REPORT 2011

bUSINESS REVIEW CONTINUED
PROPERTY
2011 saw another year of steady performance from the Property division, including Straits Media, as revenue rose 56% year-on-year
to $82.1 million compared with $52.8 million in 2010. The increase in revenue was attributable to healthy sales of premium lifestyle residential developments and higher commercial property rental. Consequently, the Property division’s contribution to the Group’s revenue increased from 4% in FY2010 to 5% in FY2011.
SINGAPORE
The division continued its focus on premium lifestyle developments in FY2011 when it obtained Temporary Occupation Permits (TOPs) for the following projects:
1) Two new Good Class Bungalows (GCBs) along Cable Road.
2) The Holland Collection – a 26-unit lifestyle condominium project along Holland Road (of which we own 14 units for investment).
3) Five Chancery – a collection of 12 luxury strata bungalows along Chancery Lane.
On the back of a healthy recovery in Grade A commercial office demand, the flagship Straits Trading Building secured 100% occupancy in FY2011 with an increase in average rentals. Overall occupancy at China Square Central in FY2011 was 94%. Our Master Lease agreement for China Square Central expired in March 2012.
The Company has continued with its policy of divesting completed non-core residential properties. With the completion of the Circle Line, there is good demand from local and expatriate homebuyers and investors keen on premium properties located beside the Singapore Botanic Gardens.
Going forward, the Property division will pursue opportunistic acquisitions that are accretive and contribute profitably to the Group. The geographical focus for residential developments are currently in the prime and popular districts.
In the commercial and retail sector, the focus will be on investing in medium-sized projects within the city; as well as in the prime retail precincts of Singapore.
Five Chancery
The Holland Collection
28 TRANSFORMATION

MALAYSIAThe Group’s joint venture with the Taiko Group (Taiko-Straits Developments Sdn Bhd) to develop 47 luxurious freehold bungalows in Ipoh, The Thompson – Flora Tropika Residences, is progressing well, with phase 2 (The Thompson Collection 2) of the development being launched in February 2012.
The division is also undertaking feasibility studies on its existing land parcels in Malaysia as key to unlocking their value. Talks are ongoing with potential strategic and commercial partners to explore opportunities for development based on project plans approved by the regulatory bodies of Malaysia.
The increase in revenue was attributable to healthy sales of premium lifestyle residential developments and higher commercial property rental.
STRAITS MEDIARevenue at Straits Media Pte Ltd, the company’s out-of-home advertising media subsidiary, recorded lower revenue in 2011. Despite the challenging operating environment, Straits Media continued to be profitable as a result of prudent cost control measures. ln February 2011, Straits Media acquired a new site at the underpass at The Sail @ Marina Bay.
The Thomson Flora Tropika Residences – Infinity Pool by Night
The Manor, signature unit of The Thompson Collection 2
29THE STRAITS TRADING COMPANY LIMITED ANNUAL REPORT 2011

bUSINESS REVIEW CONTINUED
T he hospitality business continues to be challenging in an increasingly competitive market environment. Efforts initiated in
2010 to streamline the operations of Rendezvous Hospitality Group (RHG) continued during the year where ongoing reviews and continuing improvement of operations were undertaken to improve the performance of RHG.
The Hospitality division recorded a significantly reduced loss of $8.5 million for FY2011, compared with a loss of $44.2 million for FY2010. It achieved a net profit of $0.9 million for 4Q2011, a turnaround from a net loss of $20.4 million for 4Q2010. Revenue rose 8% year-on-year to $157.8 million for FY2011. This was mainly due to higher room rates and average occupancy, improved operating performance, lower corporate costs and fair value gains.
As of 2011, the Group owns, leases and/or manages 13 hotels strategically located across the Asia Pacific region currently operating under the “Rendezvous” and “The Marque” brands.
REBRANDING OUR HOSPITALITY NETWORKIn line with RHG’s strategy of growing its brand assets into effective, efficient and sustainable platforms, RHG announced in October 2011 that Rendezvous Hotels and Marque Hotels will be amalgamated into one Rendezvous brand catering to three segments – Rendezvous Grand Hotel, Rendezvous Hotel and Rendezvous Studio Hotel targeted at discerning business and leisure travelers.
In line with this re-branding exercise, RHG will incur capital expenditure for the refurbishment and upgrade of selected properties within the group. The resulting investment will enable the hotels to improve occupancy and average room rates. Delivering an improved
HOSPITALITY
customer experience, coupled with higher room rates and higher occupancy should lead to increased profitability at the various hotels.
VALUE-ENHANCING REFURBISHMENT PROGRAMMES
During the year, RHG also embarked on several refurbishment projects to strengthen its existing hospitality portfolio with value accretive enhancement works and implementation of operational improvements including upgrading the IT infrastructure within the group to increase efficiency.
Rendezvous Grand Singapore – Lobby
Rendezvous Grand Singapore
30 TRANSFORMATION

Refurbishment works for the Rendezvous Grand Hotel in Singapore, the Group’s flagship hospitality property were completed in December 2011. This asset enhancement initiative has enhanced the hotel’s attractiveness in drawing higher yielding customers and consequently, increasing its earnings and profitability. Similar refurbishment programmes have commenced on hotels in Auckland and in Perth’s Central Business District. Refurbishment works are also planned for Rendezvous hotels in Melbourne and in Perth, Scarborough. The Group’s hotel in Christchurch, which was affected by the earthquake on 22 February 2011, is currently closed pending regulatory inspection and is expected to reopen in the first half of 2012.
FUTURE PLANSThe Hospitality division will seek a larger footprint by expanding its chain of mid-scale to upscale hotels into key cities in the Asia Pacific, to cater to the expected growth in travel and tourism in the region. Through this initiative, it will also be able to reap greater economies of scale and enhance the competitiveness of the division. RHG continues to explore and evaluate various strategic avenues for expansion such as acquiring new hotel management contracts, joint ventures and partnerships with third parties as well as franchising and marketing alliances. This also includes possible partnerships with other hotel operators as well as selective and opportunistic acquisitions of hotels that match our investment criteria.
In line with this re-branding exercise, RHG will incur capital expenditure for the refurbishment and upgrade of selected properties within the group. The resulting investment will enable the hotels to improve occupancy and average room rates.
RENDEZVOUS GRAND HOTELS Rendezvous Grand Hotel Adelaide • Rendezvous Grand Hotel Auckland • Rendezvous Grand Hotel Melbourne • Rendezvous Grand Hotel Perth Scarborough • Rendezvous Grand Hotel Singapore
RENDEZVOUS HOTELS Rendezvous Hotel Br isbane Anzac Square • Rendezvous Hotel Chr istchurch • Rendezvous Reef Resort Port Douglas • Rendezvous Hotel Shanghai Merry • Rendezvous Hotel Sydney the Rocks
RENDEZVOUS STUDIO HOTELS Rendezvous Studio Hotel Brisbane on George* • Rendezvous Studio Hotel Perth Central* • Rendezvous Studio Hotel Sydney Central** Former Marque Hotels
Rendezvous Grand Adelaide
ONE RENDEZVOUS • THREE TIERS
31THE STRAITS TRADING COMPANY LIMITED ANNUAL REPORT 2011

CORPORATE INFORMATION
BOARD OF DIRECTORS
Ms Chew Gek KhimExecutive ChairmanLLB (Hons)
Tan Sri Dato’ Dr Lin See-YanPSM, DPMP, DSAP, JMN, JSM, AMN, BA (Hons), MPA, MA, PhD, C Stat, CSci
Mr Razman AriffinB Sc (Eng), ARSM, MIME(M)
Mrs Elizabeth SamBA (Hons) Economics
Ms Chew Gek HiangB Acc (Hons), CPA
Mr David Goh Kay YongBA (Hons), SM (MIT), CFA
Mr Yap Chee Keong B Acc, FCPA
Mr Tham Kui Seng BA (Hons), Engineering Science
SECRETARIESMrs Maureen Leong B Acc (Hons), FCPA
Ms Sng Kiat HuangLLB (Hons)
KEY PERSONNEL
Ybhg. Dato’ Seri Dr Mohd Ajib AnuarGroup Chief Executive OfficerMalaysia Smelting Corporation Berhad
Mr Eric TengChief Executive Officer (Property & Hospitality) &Adviser (Marketing and Communications)The Straits Trading Company Limited
Mrs Maureen LeongGroup Chief Financial OfficerThe Straits Trading Company Limited
Mr Eldon WanDeputy Group Chief Financial OfficerThe Straits Trading Company Limited
REGISTERED OFFICE9 Battery Road #28-01Straits Trading BuildingSingapore 049910
CORPORATE OFFICES9 Battery Road #28-01Straits Trading BuildingSingapore 049910Tel : (65) 6422 4288Fax : (65) 6534 7202E-mail : [email protected] : www.stc.com.sg
Ground FloorStraits Trading Building2 Lebuh Pasar Besar50050 Kuala LumpurTel : (603) 2698 7126Fax : (603) 2693 7542E-mail : [email protected]
SHARE REGISTRARSTricor barbinder Share Registration Services(A division of Tricor Singapore Pte. Ltd.)80 Robinson Road #02-02Singapore 068898
AUDITORSErnst & Young LLPOne Raffles QuayNorth Tower, Level 18Singapore 048583
Partner-in-charge: Mrs Lim Siew Koon(Appointed with effect from financial year
ended 31 December 2010)
PRINCIPAL BANKERSDBS Bank Ltd
The Hongkong and Shanghai Banking Corporation Limited
Oversea-Chinese Banking Corporation Limited
Standard Chartered Bank
United Overseas Bank Limited
THE STRAITS TRADING COMPANY LIMITED AND ITS SUbSIDIARIES
32 TRANSFORMATION

33THE STRAITS TRADING COMPANY LIMITED ANNUAL REPORT 2011
REPORT ONCORPORATE GOVERNANCE
The Straits Trading Company Limited (the “Company”) is committed to high standards of corporate governance. This report describes the Company’s corporate governance policies and practices during the fi nancial year ended 31 December 2011 (“FY2011”) with specifi c reference to the Code of Corporate Governance 2005 (the “Code”).
BOARD’S CONDUCT OF ITS AFFAIRS (Principle 1)
The Board, comprising a majority of independent Directors, provides policy direction and entrepreneurial leadership, approves the development and implementation of corporate strategies, and ensures that the necessary fi nancial and human resources are in place for the Company to meet its objectives.
The Board also sets the Company’s values and standards, and ensures that its obligations to all stakeholders are met and understood. While the Board remains responsible for providing oversight in the preparation and presentation of the fi nancial statements, it has delegated to the Management the task of ensuring that the fi nancial statements are drawn up and presented in compliance with the relevant provisions of the Singapore Companies Act, Cap. 50 and the Singapore Financial Reporting Standards.
With the appointment of the CEOs for each of the business divisions, the Board has appointed the Chairman as Executive Chairman to oversee the Management, and the Lead Independent Director to ensure continued good governance. Supported by four Board Committees, namely the Audit Committee, Remuneration Committee, Nominating Committee and Finance Committee, the Board also approves the Group’s appointment of Board members, key business initiatives, major investments and funding decisions, and interested person transactions.
The Board met nine times in FY2011. Meetings by means of a conference telephone or similar communication equipment are permitted in the Company’s Articles of Association. The Directors’ attendance at the Board and various committee meetings during FY2011 are as follows:
Name of Director BoardFinance
CommitteeRemuneration
CommitteeNominating Committee
Audit Committee
A B A B A B A B A BMs Chew Gek Khim 9 9 2 2 1 1Tan Sri Dato’ Dr Lin See-Yan 8 9 1 1 1 1 5 5Mr Razman Ariffi n 9 9 1 1Mrs Elizabeth Sam 7 9 1 1Ms Chew Gek Hiang 9 9 1 1 5 5Mr David Goh Kay Yong 9 9 2 2Mr Yap Chee Keong 9 9 2 2 5 5Mr Tham Kui Seng 9 9 2 2
Legend:A: Number of meetings attended in FY2011.B: Number of meetings held in FY2011.
33THE STRAITS TRADING COMPANY LIMITED ANNUAL REPORT 2011

34 TRANSFORMATION
BOARD COMPOSITION AND GUIDANCE (Principle 2)
The Board comprises eight Directors, seven of whom are non-executive. The Nominating Committee considers Tan Sri Dato’ Dr Lin See-Yan, Mr Razman Ariffi n, Mrs Elizabeth Sam, Mr Yap Chee Keong and Mr Tham Kui Seng to be independent. The Directors provided objective and independent judgement to the decision making of the Board. The non-executive Directors of the Company participated constructively and reviewed the Group’s operations, budgets and strategies. They also assessed the effectiveness of the Board’s processes and activities in meeting set objectives and corporate governance standards.
The Board as a group has the core competencies, such as accounting or fi nance, business or general management, legal and industry knowledge, and strategic planning experience. Key information on the Directors are set out in pages 12 to 15.
EXECUTIVE CHAIRMAN
The Board is led by Ms Chew Gek Khim as the Executive Chairman. Ms Chew assumed the Chair on 24 April 2008 and was appointed Executive Chairman on 1 November 2009.
As Chairman of the Board, Ms Chew’s duties include leading the Board, setting the Board agenda and ensuring that all Directors receive suffi cient relevant information (both fi nancial and non-fi nancial) to enable them to participate and contribute effectively in Board discussions and decisions. She aims to promote constructive relations between the Board members, and between the Board and the Management, and ensures effective communication with shareholders. Ms Chew also advocates high standards of corporate governance.
As the Executive Chairman, Ms Chew takes on executive oversight of the Management of the business divisions and is assisted by senior key personnel within the Company. The Management is responsible for the daily management of the businesses and implementation of the Board’s policies and decisions as well as ensuring compliance with the corporate governance policies of the Company as these relate to the respective business divisions. The Management reports to the Board and is managed through the strategies adopted and monitored through the key performance indicators set for them.
LEAD INDEPENDENT DIRECTOR (Principle 3)
In line with the recommendations set out in the Code, Mr Yap Chee Keong, currently an independent and non-executive Director as well as the Audit Committee Chairman, was appointed the Lead Independent Director of the Company on 1 November 2009.
As the Lead Independent Director, Mr Yap’s role includes being available to shareholders to address any of their concerns and acting as the principal liaison between the independent Directors and the Executive Chairman on critical issues.
BOARD MEMBERSHIP (Principle 4)
The Company has adopted a formal and transparent process for the appointment of new Directors through the Nominating Committee which reviews the background of all appointees and makes recommendations accordingly to the Board for approval.
The Nominating Committee, chaired by Mrs Elizabeth Sam, comprises three Directors, the majority of whom are independent, including the Chairman. The other members of the Nominating Committee are Ms Chew Gek Khim and Tan Sri Dato’ Dr Lin See-Yan.
REPORT ONCORPORATE GOVERNANCE

35THE STRAITS TRADING COMPANY LIMITED ANNUAL REPORT 2011
In accordance with Guideline 4.1 of the Code, the Chairman of the Nominating Committee is not directly associated with any substantial shareholder of the Company. The functions of the Nominating Committee include the evaluation of the Board’s effectiveness, each Director’s contributions and independence, as well as making recommendations on the appointment and re-nomination of Directors for the Board and Board Committees. The role and functions of the Nominating Committee are set out in its Terms of Reference.
BOARD PERFORMANCE (Principle 5)
The Company has in place a process to assess the Board’s effectiveness as a whole. The evaluation is carried out annually with each Director making his assessment by providing feedback to the Nominating Committee through a Board assessment questionnaire.
ACCESS TO INFORMATION (Principle 6)
Information is important to the Board’s understanding of the Group’s businesses and essential to preparing the Board members for effective meetings. Where required, the Management supplements the meeting papers with presentations on active operations and strategic issues to provide Directors with a better understanding of the Group’s operations. Senior management were also invited to attend the meetings to answer enquiries from the Directors.
The Directors have separate and independent access to the services of the company secretaries, who are responsible for ensuring that Board procedures are followed and applicable rules and regulations are complied with. The company secretaries also assist the Chairman by ensuring good information fl ows within the Board and its committees, and between senior management and the non-executive Directors. The company secretaries attended all board meetings and their appointments or removals are subject to the Board’s approval.
In the furtherance of their duties and if the Management’s explanations are not satisfactory, the Directors may seek independent professional advice at the Company’s expense.
PROCEDURES FOR DEVELOPING REMUNERATION POLICIES (Principle 7)
The Board has a Remuneration Committee comprising three non-executive Directors, the majority of whom are independent. Mr Razman Ariffi n chairs the Remuneration Committee and Tan Sri Dato’ Dr Lin See-Yan and Ms Chew Gek Hiang are the other two members.
The functions of the Remuneration Committee include the recommendation of a framework of remuneration for the Board and senior executives of the rank of senior vice president and above, and the recommendation of specifi c remuneration package for the Executive Chairman, for the Board’s approval. The role and functions of the Remuneration Committee are set out in the Terms of Reference of the Remuneration Committee.
REPORT ONCORPORATE GOVERNANCE

36 TRANSFORMATION
LEVEL AND MIX OF REMUNERATION (Principle 8)
The Company adopts a performance-based approach to compensation where employees’ remuneration is linked to individual and corporate performances. The Remuneration Committee sees the importance of a market competitive remuneration strategy to attract, retain and motivate employees to high performance that creates value for the shareholders. Remuneration is determined according to the following general components: salary, contractual bonus and incentive bonus.
During the year under review, the Remuneration Committee met, discussed and approved the compensation for the senior executives of the Group. Presently, the Company does not have any share option scheme.
Taking into account the performance of the Group and the responsibilities and performance of the Directors, directors’ fees (for the Board and the various Board Committees) were set in accordance with a remuneration framework comprising responsibility fees and attendance fees. The Executive Chairman does not receive directors’ fees. Non-executive Directors are paid directors’ fees, subject to approval at the Annual General Meeting. The non-executive Directors have no service contracts. No individual Director fi xes his own remuneration.
DISCLOSURE ON REMUNERATION (Principle 9)
Summary compensation table for the Directors of the Company in all capacities for the year ended 31 December 2011:
Name of Director Salary
Bonus / Share Based Pay-
mentBenefi ts in
kindDirectors’
fees TotalS$750,000 – S$1,000,000Ms Chew Gek Khim 100% – – – 100%
Below S$250,000Tan Sri Dato’ Dr Lin See-Yan – – – 100% 100%Mr Razman Ariffi n – – – 100% 100%Mrs Elizabeth Sam – – – 100% 100%Ms Chew Gek Hiang – – – 100% 100%Mr David Goh Kay Yong – – – 100% 100%Mr Yap Chee Keong – – – 100% 100%Mr Tham Kui Seng – – – 100% 100%
There are no employees of the Group who are immediate family members of a Director earning more than S$150,000 a year.
The bands of remuneration of the top fi ve key executives (who are not also Directors) for FY2011 were as follows:
Remuneration Bands Number of ExecutivesS$500,000 to S$749,999 3S$250,000 to S$499,999 1Below S$250,000 1
REPORT ONCORPORATE GOVERNANCE

37THE STRAITS TRADING COMPANY LIMITED ANNUAL REPORT 2011
REPORT ONCORPORATE GOVERNANCE
ACCOUNTABILITY (Principle 10)
In presenting the annual fi nancial statements and quarterly announcements to shareholders, it is the aim of the Board to provide shareholders with detailed analysis, explanations and assessment of the Company’s and the Group’s fi nancial position and prospects.
The Management currently provides the Board with balanced and understandable accounts of the Company’s performance, fi nancial position and business prospects on a regular basis.
AUDIT COMMITTEE (Principle 11)
The Audit Committee comprises three non-executive Directors and is chaired by Mr Yap Chee Keong. The other two members of the Audit Committee are Tan Sri Dato’ Dr Lin See-Yan and Ms Chew Gek Hiang.
All members of the Audit Committee are fi nancially literate and have accounting or related fi nancial management expertise or experience.
The role of the Audit Committee is documented in a Charter (Terms of Reference) approved by the Board. The Charter, amended by the Board in 2005 to facilitate the Company’s compliance with the Code, defi nes the purpose, authority and responsibilities of the Audit Committee. The Audit Committee is authorised to investigate any matters specifi ed in the Charter.
In performing its functions, the Audit Committee reviews the overall scope of both internal and external audits and the assistance given by the Company’s offi cers to the auditors. It meets with the Company’s internal and external auditors to discuss the results of their respective examinations and their evaluation of the Company’s system of internal accounting and fi nancial controls on a quarterly basis.
The Audit Committee reviews interested person transactions to ensure that they are carried out on normal commercial terms and are not prejudicial to the interests of the Company and its minority shareholders. The Audit Committee also reviews the consolidated fi nancial statements and the auditors’ report, as well as related announcements to shareholders and The Singapore Exchange Securities Trading Limited before submission to the Board.
The AC has reviewed and is satisfi ed that the independence and objectivity of the external auditors have not been compromised by the provision of non-audit services. Accordingly, it has recommended to the Board the nomination of the external auditors, Messrs Ernst & Young LLP, for re-appointment at the forthcoming Annual General Meeting to be held on 27 April 2012. In 2011, the AC met with the external auditors and internal auditors without the presence of the Management twice.
In appointing the audit fi rms for the Group, the Audit Committee is satisfi ed that the Company has complied with the Listing Rules 712 and 715.

38 TRANSFORMATION
FINANCE COMMITTEE
The Finance Committee comprises the following Directors:
Ms Chew Gek Khim (Chairman)Mr David Goh Kay YongMr Yap Chee KeongMr Tham Kui Seng
Established on 23 February 2010, the Finance Committee’s responsibilities include reviewing and recommending to the Board for approval the annual business plans and budgets for business divisions and entities within the Group. It also reviews and approves certain transactions of the Group within its delegated authority limits, such as fi nancing plans and borrowings, acquisitions and disposals and capital expenditure.
INTERNAL CONTROLS AND RISK MANAGEMENT (Principle 12)
The Board recognises its role in ensuring that the Management maintains a sound system of internal controls to safeguard shareholders’ investments and the Group’s assets. The Group has adopted a group-wide risk assessment process, which identifi es the key risks facing each major business division, the potential impact and likelihood of those risks occurring, the control effectiveness and action plans being taken to mitigate those risks.
The Board appreciates that risk management is an on-going process in which the senior management and the operational managers continuously participate to evaluate and monitor the signifi cant risks. The internal audit department regularly reviews all signifi cant control policies and procedures and highlights all signifi cant matters to the senior management and the Audit Committee. The Audit Committee has reviewed the Group’s risk assessment process and is satisfi ed that there are adequate internal controls in place to manage the signifi cant risks identifi ed.
The Group’s subsidiary, Malaysia Smelting Corporation Berhad, has established a risk management structure, which depicts the lines of reporting and responsibility at its Board, Audit Committee and Management levels.
During FY2011, the Audit Committee reviewed the effectiveness of the Group’s material internal controls, including fi nancial, operational and compliance controls, and risk management. The processes used by the Audit Committee to review the effectiveness of the system of internal control and risk management included discussions with the Management, external and internal auditors on the risks identifi ed and the review of signifi cant issues arising from internal and external audits.
The Directors understand that they have responsibility for the Group’s system of internal controls that covers all aspects of the business. In recognition of this responsibility, the Directors set policies and seek regular assurance that the system of internal controls is operating effectively. However, the Directors are also aware that such a system can only provide reasonable, but not absolute, assurance that the Company will not be adversely affected by any event that could be reasonably foreseen as it strives to achieve its business objectives. However, the Board also notes that no system of internal controls and risk management can provide a comprehensive assurance against human error, poor judgement in decision making, losses, fraud or other irregularities.
The Directors are of the opinion that, based on the results of the internal and external audits, the system of internal controls is operating satisfactorily. The Directors are also satisfi ed that problems are identifi ed on a timely basis and there is in place
REPORT ONCORPORATE GOVERNANCE

39THE STRAITS TRADING COMPANY LIMITED ANNUAL REPORT 2011
REPORT ONCORPORATE GOVERNANCE
a process for follow-up actions to be taken promptly to minimise unnecessary lapses. Nothing has come to the attention of the Directors to indicate that any material breakdown in the controls has occurred during the year under review.
The Directors and the Audit Committee, having reviewed the Group’s system of internal controls, including fi nancial, operational and compliance risks, are of the opinion that, in the absence of any evidence to the contrary, the system of internal controls in place is adequate in meeting the current scope of the Group’s business operations.
WHISTLEBLOWER POLICY
The Company has a whistle-blowing procedure in place for staff to raise matters of impropriety in confi dence. The policy aims to foster a workplace conducive to open communication regarding the Company’s business practices and to protect employees from unlawful retaliation and discrimination for the proper disclosing or reporting of illegal or unethical conduct in good faith.
Complaints may be made to the designated offi cers by telephone, email or under confi dential mail. All cases reported will be investigated objectively and thoroughly and appropriate action will be taken where warranted. A summary of the reports received, investigation results and subsequent actions taken will be reported to the Audit Committee on a quarterly basis. Under certain circumstances, the Audit Committee will be informed, as soon as practicable, of a reported case.
INTERNAL AUDIT (Principle 13)
The Company has an internal audit department that is independent of the activities it audits. The internal auditors report directly to the Chairman of the Audit Committee on audit matters and to the Executive Chairman on administrative matters.
In discharging its functions, the Audit Committee is provided with adequate resources, has full access to and co-operation of the Management and the internal auditors, and has full discretion to invite any Director or executive offi cer to attend its meetings. All major fi ndings and recommendations are brought to the attention of the Board of Directors.
The Audit Committee reviews and approves the annual internal audit plans and ensures that the internal audit functions are adequately resourced with competence, and has appropriate standing within the Group to carry out its duties effectively.
COMMUNICATION WITH SHAREHOLDERS (Principle 14)
The Company takes a serious view of maintaining full and adequate disclosure, in a timely manner, of material events and matters concerning its businesses through SGXNET, public announcements, press releases, circulars to shareholders and Annual Reports.
In addition, shareholders and the public can access information pertaining to the Company’s businesses, media releases and other corporate information via its website. The Company’s Corporate Affairs and Communications department also facilitates effective and unbiased communications with shareholders, analysts, fund managers and the media.

40 TRANSFORMATION
REPORT ONCORPORATE GOVERNANCE
GREATER SHAREHOLDER PARTICIPATION (Principle 15)
The Company endeavours to provide as much and as prompt information as is possible to its shareholders, taking into account the legal and regulatory framework governing the release of material and price-sensitive information. The Company releases all price-sensitive information through SGXNET.
At the annual general meeting, shareholders are encouraged to ask questions both about the resolutions being proposed and about the Group’s operations in general. The Articles of Association of the Company permit a member of the Company to appoint not more than two proxies to attend and vote instead of the member. As there is still a major concern on the security of information transmitted over the Internet, the Board has decided that it is not appropriate, for the time being, to amend its Articles of Association to allow for in absentia voting methods.
The Company ensures separate resolutions are proposed at general meetings on each distinct issue. The external auditors, the chairpersons of the various Board Committees and where necessary, the legal advisers are present to assist the Directors in addressing any relevant queries by shareholders.
DEALINGS IN SECURITIES
The Group has issued internal guidelines on dealings in the securities of the Company to the Directors and employees of the Company and its subsidiaries, advising them, among others, not to deal in the securities of the Company on short-term considerations. On a quarterly basis, the Directors and employees are advised of the prohibitions in dealings in the securities of the Company during the period commencing two weeks before the announcement of the Group’s quarterly fi nancial statements, and one month before the Group’s full year fi nancial statements, and ending on the respective announcement dates, and while they are in possession of material price-sensitive information which is generally not available.

41THE STRAITS TRADING COMPANY LIMITED ANNUAL REPORT 2011
FINANCIAL REPORT
2011
C O N T E N T S
42. Directors’ Report
45. Statement by Directors
46. Independent Auditors’ Report
48. Consolidated Income Statement
49. Consolidated Statement
of Comprehensive Income
50. Balance Sheets
52. Consolidated Statement
of Changes in Equity
54. Consolidated Cash Flow Statement
56. Notes to the Financial Statements
171. Additional Information Required
under the SGX Listing Manual
172. Shareholder Information
174. Notice of Annual General Meeting
Proxy Form

42 TRANSFORMATION
DIRECTORS’ REPORT
The Directors have pleasure in submitting their report together with the audited fi nancial statements of The Straits Trading Company Limited (the Company) and consolidated fi nancial statements of the Group for the year ended 31 December 2011.
Directorate
The Directors in offi ce at the date of this report are:
Ms Chew Gek Khim (Executive Chairman)Tan Sri Dato’ Dr Lin See-YanMr Razman Ariffi nMrs Elizabeth SamMs Chew Gek HiangMr David Goh Kay YongMr Yap Chee KeongMr Tham Kui Seng
Mr David Goh Kay Yong and Mr Yap Chee Keong retire pursuant to Article 99 of the Articles of Association and being eligible, offer themselves for re-election.
Tan Sri Dato’ Dr Lin See-Yan and Mrs Elizabeth Sam both retire pursuant to Section 153(2) of the Companies Act, Cap. 50. A resolution will be proposed for their re-appointment as Directors under Section 153(6) of the said Act to hold offi ce until the next Annual General Meeting of the Company.
Arrangements To Enable Directors To Acquire Shares And Debentures
Neither at the end of nor at any time during the fi nancial year was the Company a party to any arrangement whose objects are, or one of whose objects is, to enable the Directors of the Company to acquire benefi ts by means of the acquisition of shares or debentures of the Company or any other body corporate.
Directors’ Interest In Shares And Debentures
According to the register kept under Section 164 of the Companies Act, Cap. 50, the Directors who held offi ce at the end of the fi nancial year had an interest in the shares of the Company and its related corporation as stated below:
Company
(Issued ordinary shares)Shareholdings in thenames of Directors
Shareholdings in which Directors are deemed to have an interest
1.1.2011 31.12.2011 1.1.2011 31.12.2011
Ms Chew Gek Khim 41,200 41,200 – –Ms Chew Gek Hiang 23,000 23,000 – –

43THE STRAITS TRADING COMPANY LIMITED ANNUAL REPORT 2011
DIRECTORS’ REPORT
Directors’ Interest In Shares And Debentures (cont’d)
Subsidiary
Malaysia Smelting Corporation Berhad
(ordinary shares of RM1 each)Shareholdings in the names of Directors
Shareholdings in which Directors are deemed to have an interest
1.1.2011 31.12.2011 1.1.2011 31.12.2011
Mr Razman Ariffi n 67,000 67,000 – –Ms Chew Gek Khim – 400,000 – –
There was no change in any of the above-mentioned interests between the end of the fi nancial year and 21 January 2012.
Except as disclosed above, no Director who held offi ce at the end of the fi nancial year had an interest in any shares or debentures of the Company, or of related corporations, either at the beginning of the fi nancial year or at the end of the fi nancial year.
Directors’ Contractual Benefi ts
Except as disclosed in the fi nancial statements, since the end of the previous fi nancial year, no Director has received or become entitled to receive benefi ts by reason of a contract made by the Company or a related corporation with the Director, or with a fi rm of which the Director is a member, or with a company in which the Director has a substantial fi nancial interest.
Options
During the fi nancial year, no option to take up unissued shares of the Company or any corporation in the Group was granted.
No shares have been issued during the fi nancial year by virtue of the exercise of an option to take up unissued shares of the Company or any corporation in the Group.
At the end of the fi nancial year, there were no unissued shares of the Company or any corporation in the Group under option.
Audit Committee
The Audit Committee performs the functions specifi ed in Section 201B(5) of the Companies Act, Cap. 50. The Audit Committee reviews the overall scope of both internal and external audits and the assistance given by the Company’s offi cers to the auditors. It meets with the Company’s internal and external auditors to discuss the results of their respective examinations and the internal auditors’ evaluation of the Company’s system of internal accounting and fi nancial controls. The Audit Committee reviews interested person transactions to ensure that they are carried out on normal commercial terms and are not prejudicial to the interests of the Company and its minority shareholders. The Audit Committee also reviews the consolidated fi nancial statements and the auditors’ report, as well as announcements to shareholders and the SGX before submission to the Board. The Audit Committee met with the external and internal auditors, without the presence of Management, twice during the year. The Audit Committee annually reviews the independence of the external auditors and recommends to the Board, the external auditors to be appointed. Further details on the Audit Committee are disclosed in the Report on Corporate Governance.

44 TRANSFORMATION
Auditors
Ernst & Young LLP have expressed their willingness to accept re-appointment as auditors.
On behalf of the Board
Chew Gek Khim Yap Chee KeongDir ector Director
Singapore28 March 2012
DIRECTORS’ REPORT

45THE STRAITS TRADING COMPANY LIMITED ANNUAL REPORT 2011
STATEMENT BY DIRECTORS
We, Chew Gek Khim and Yap Chee Keong, being two of the Directors of The Straits Trading Company Limited, do hereby state that, in the opinion of the Directors:
(i) the accompanying balance sheets, consolidated income statements, consolidated statement of comprehensive income, consolidated statement of changes in equity and consolidated cash fl ow statement together with notes thereto are drawn up so as to give a true and fair view of the state of affairs of the Group and of the Company as at 31 December 2011 and the results of the business, changes in equity and cash fl ows of the Group, for the year ended on that date; and
(ii) at the date of this statement, there are reasonable grounds to believe that the Company will be able to pay its debts as and when they fall due.
On behalf of the Board
Chew Gek Khim Yap Chee KeongDir ector Director
Singapore28 March 2012

46 TRANSFORMATION
INDEPENDENT AUDITORS’ REPORTFor the Financial Year Ended 31 December 2011To The Members of The Straits Trading Company Limited
REPORT ON THE CONSOLIDATED FINANCIAL STATEMENTS
We have audited the accompanying consolidated fi nancial statements of The Straits Trading Company Limited (the Company) and its subsidiaries (collectively, the Group) set out on pages 48 to 170, which comprise the balance sheets of the Group and the Company as at 31 December 2011, the consolidated income statement, the consolidated statement of comprehensive income, the consolidated statement of changes in equity and consolidated cash fl ow statement of the Group for the year then ended, and a summary of signifi cant accounting policies and other explanatory information.
Management’s responsibility for the consolidated fi nancial statements
Management is responsible for the preparation of consolidated fi nancial statements that give a true and fair view in accordance with the provisions of the Singapore Companies Act (the Act) and Singapore Financial Reporting Standards, and for devising and maintaining a system of internal accounting controls suffi cient to provide a reasonable assurance that assets are safeguarded against loss from unauthorised use or disposition; and transactions are properly authorised and that they are recorded as necessary to permit the preparation of true and fair profi t and loss accounts and balance sheets and to maintain accountability of assets.
Auditors’ responsibility
Our responsibility is to express an opinion on these consolidated fi nancial statements based on our audit. We conducted our audit in accordance with Singapore Standards on Auditing. Those standards require that we comply with ethical requirements and plan and perform the audit to obtain reasonable assurance about whether the consolidated fi nancial statements are free from material misstatement.
An audit involves performing procedures to obtain audit evidence about the amounts and disclosures in the consolidated fi nancial statements. The procedures selected depend on the auditor’s judgement, including the assessment of the risks of material misstatement of the consolidated fi nancial statements, whether due to fraud or error. In making those risk assessments, the auditor considers internal control relevant to the entity’s preparation of the consolidated fi nancial statements that give a true and fair view in order to design audit procedures that are appropriate in the circumstances, but not for the purpose of expressing an opinion on the effectiveness of the entity’s internal control. An audit also includes evaluating the appropriateness of accounting policies used and the reasonableness of accounting estimates made by management, as well as evaluating the overall presentation of the consolidated fi nancial statements.
We believe that the audit evidence we have obtained is suffi cient and appropriate to provide a basis for our audit opinion.

47THE STRAITS TRADING COMPANY LIMITED ANNUAL REPORT 2011
Opinion
In our opinion, the consolidated fi nancial statements of the Group and the balance sheet of the Company are properly drawn up in accordance with the provisions of the Act and Singapore Financial Reporting Standards so as to give a true and fair view of the state of affairs of the Group and of the Company as at 31 December 2011 and the results, changes in equity and cash fl ows of the Group for the year ended on that date.
REPORT ON OTHER LEGAL AND REGULATORY REQUIREMENTS
In our opinion, the accounting and other records required by the Act to be kept by the Company and by those subsidiaries incorporated in Singapore of which we are the auditors have been properly kept in accordance with the provisions of the Act.
ERNST & YOUNG LLPPublic Accountants andCertifi ed Public Accountants
Singapore28 March 2012
INDEPENDENT AUDITORS’ REPORTFor the Financial Year Ended 31 December 2011To The Members of The Straits Trading Company Limited

48 TRANSFORMATION
Note 2011 2010 $’000 $’000
RevenueTin mining and smelting revenue 1,270,719 1,159,286Hotel revenue 157,840 146,675Property revenue 3 82,104 52,760Total revenue 1,510,663 1,358,721
Other items of incomeDividend income 4(a) 4,611 5,082Interest income 4(b) 6,100 3,581Fair value changes in investment properties 14 56,146 101,925Other income 5 10,212 13,263
1,587,732 1,482,572
Other items of expenseEmployee benefi ts expense 6 (101,387) (100,158)Depreciation expense 13 (21,309) (22,649)Amortisation expense 15 (12,377) (5,583)Impairment losses 7 (21,964) (91,080)Costs of tin mining and smelting (1,153,821) (1,053,649)Finance costs 8 (18,243) (23,881)Other expenses 9 (189,836) (163,478)
Total expenses (1,518,937) (1,460,478)
Share of results of equity-accounted associates and joint ventures 10,451 1,778
Profi t before tax 10 79,246 23,872Income tax expense 11 (23,853) (17,155)
Profi t after tax 55,393 6,717
Profi t/(Loss) attributable to:Owners of the Company 45,621 28,169Non-controlling interests 9,772 (21,452)
55,393 6,717
Earnings per share (cents per share) 12
Basic 14.0 8.6Diluted 14.0 8.6
CONSOLIDATED INCOME STATEMENTFor the Financial Year Ended 31 December 2011
The accompanying accounting policies and explanatory notes form an integral part of the fi nancial statements.

49THE STRAITS TRADING COMPANY LIMITED ANNUAL REPORT 2011
2011 2010
$’000 $’000
Profi t after tax 55,393 6,717
Other comprehensive income/(expenses):
Net fair value changes in available-for-sale investment securities (71,022) (35,601)
Net fair value changes in cash fl ow hedges (326) 6,027
Net revaluation surplus on property, plant and equipment 48,544 33,247
Currency translation reserve (287) (103)Other comprehensive (expenses)/income after tax for the year (23,091) 3,570
Total comprehensive income for the year 32,302 10,287
Attributable to:
Owners of the Company 22,232 36,198
Non-controlling interests 10,070 (25,911)
Total comprehensive income for the year 32,302 10,287
CONSOLIDATED STATEMENTOF COMPREHENSIVE INCOMEFor the Financial Year Ended 31 December 2011
The accompanying accounting policies and explanatory notes form an integral part of the fi nancial statements.

50 TRANSFORMATION
Group CompanyNote 2011 2010 2011 2010
ASSETS $’000 $’000 $’000 $’000
Non-current assetsProperty, plant and equipment 13 389,802 340,923 368 361Investment properties 14 932,907 853,505 118,658 112,734Goodwill 15 21,863 22,425 – –Other intangible assets 15 39,128 34,119 – –Investments in subsidiaries 16 – – 212,390 213,390Investments in associates and joint ventures 17 76,439 67,143 3,585 3,585Deferred tax assets 18 8,487 10,722 – –Other non-current receivables 19 2,695 2,315 – 106,465Investment securities 20 135,500 213,683 48,422 75,226Other non-current assets 22 1,226 18,025 – –Total non-current assets 1,608,047 1,562,860 383,423 511,761
Current assetsAssets of disposal group classifi ed as held for sale 23 – 10,680 – 564Development properties for sale 24 29,613 38,895 – –Inventories 25 121,162 171,215 – –Income tax receivables 26 4,513 11,107 19 11Prepayments and accrued income 6,043 7,414 217 3Trade and other receivables 19 182,109 138,630 166,172 149,286Marketable securities 20 13 17 – –Derivative fi nancial instruments 21 – 487 – –Cash and cash equivalents 27 313,323 71,597 173,441 1,103Total current assets 656,776 450,042 339,849 150,967
Total assets 2,264,823 2,012,902 723,272 662,728
EQUITY AND LIABILITIES
EquityShare capital 28 265,928 265,928 265,928 265,928Retained earnings 29 783,370 746,405 172,528 108,890Other reserves 29 113,126 135,253 (14,505) 13,248Reserve of disposal group classifi ed as held for sale 23 – (1,173) – –Equity attributable to owners of the Company 1,162,424 1,146,413 423,951 388,066Non-controlling interests 97,723 47,190 – –Total equity 1,260,147 1,193,603 423,951 388,066
Non-current liabilitiesProvisions 30 14,102 13,165 – –Deferred tax liabilities 18 76,957 75,868 2,142 2,077Other non-current payables 33 – – – 143,213Borrowings 31 520,190 296,124 223,907 22,109Derivative fi nancial instruments 21 354 576 – –Other non-current liabilities 32 2,631 7,532 – –Total non-current liabilities 614,234 393,265 226,049 167,399
BALANCE SHEETSAs at 31 December 2011
The accompanying accounting policies and explanatory notes form an integral part of the fi nancial statements.

51THE STRAITS TRADING COMPANY LIMITED ANNUAL REPORT 2011
Group CompanyNote 2011 2010 2011 2010
$’000 $’000 $’000 $’000
Current liabilitiesLiabilities directly associated with disposal group
classifi ed as held for sale 23 – 4,741 – –Provisions 30 8,450 2,986 – –Income tax payable 26,164 26,837 787 900Trade and other payables 33 140,907 109,787 72,485 106,363Borrowings 31 214,750 281,683 – –Derivative fi nancial instruments 21 171 – – –Total current liabilities 390,442 426,034 73,272 107,263
Total liabilities 1,004,676 819,299 299,321 274,662
Total equity and liabilities 2,264,823 2,012,902 723,272 662,728
BALANCE SHEETSAs at 31 December 2011
The accompanying accounting policies and explanatory notes form an integral part of the fi nancial statements.

52 TRANSFORMATION
Reserve
Equity of disposal
attributable group
to owners Share classifi ed Non-
Total of the Share Retained AFS Hedging Revaluation option Capital Translation as held controlling
equity Company capital earnings reserve reserve reserve reserve reserve reserve for sale interests
$’000 $’000 $’000 $’000 $’000 $’000 $’000 $’000 $’000 $’000 $’000 $’000
Opening balance at 1 January 2011 1,193,603 1,146,413 265,928 746,405 40,471 210 97,248 84 93 (2,853) (1,173) 47,190
Total comprehensive income/ (expenses) for the year 32,302 22,232 – 45,621 (71,022) (178) 48,544 – – (730) (3) 10,070
Contributions by and distributions to owners
Dividends on ordinary shares (note 34) (6,518) (6,518) – (6,518) – – – – – – – –
Dividends to non-controlling shareholders of a subsidiary (2,083) – – – – – – – – – – (2,083)
Unclaimed dividends written back 1,712 1,712 – 1,712 – – – – – – – –
Total contributions by and distributions to owners (6,889) (4,806) – (4,806) – – – – – – – (2,083)
Changes in ownership interests in subsidiaries
Changes in ownership interests in subsidiaries that do not result in a loss of control (note 16) 41,855 (2,343) – (3,934) – (57) (1,476) – (93) 2,969 248 44,198
Disposal of disposal group classifi ed as held for sale (724) 928 – 84 – – – (84) – – 928 (1,652)
Total changes in ownership interests in subsidiaries 41,131 (1,415) – (3,850) – (57) (1,476) (84) (93) 2,969 1,176 42,546
Total transactions with owners in their capacity as owners 34,242 (6,221) – (8,656) – (57) (1,476) (84) (93) 2,969 1,176 40,463
Closing balance at 31 December 2011 1,260,147 1,162,424 265,928 783,370 (30,551) (25) 144,316 – – (614) – 97,723
CONSOLIDATED STATEMENTOF CHANGES IN EQUITYFor the Financial Year Ended 31 December 2011
The accompanying accounting policies and explanatory notes form an integral part of the fi nancial statements.
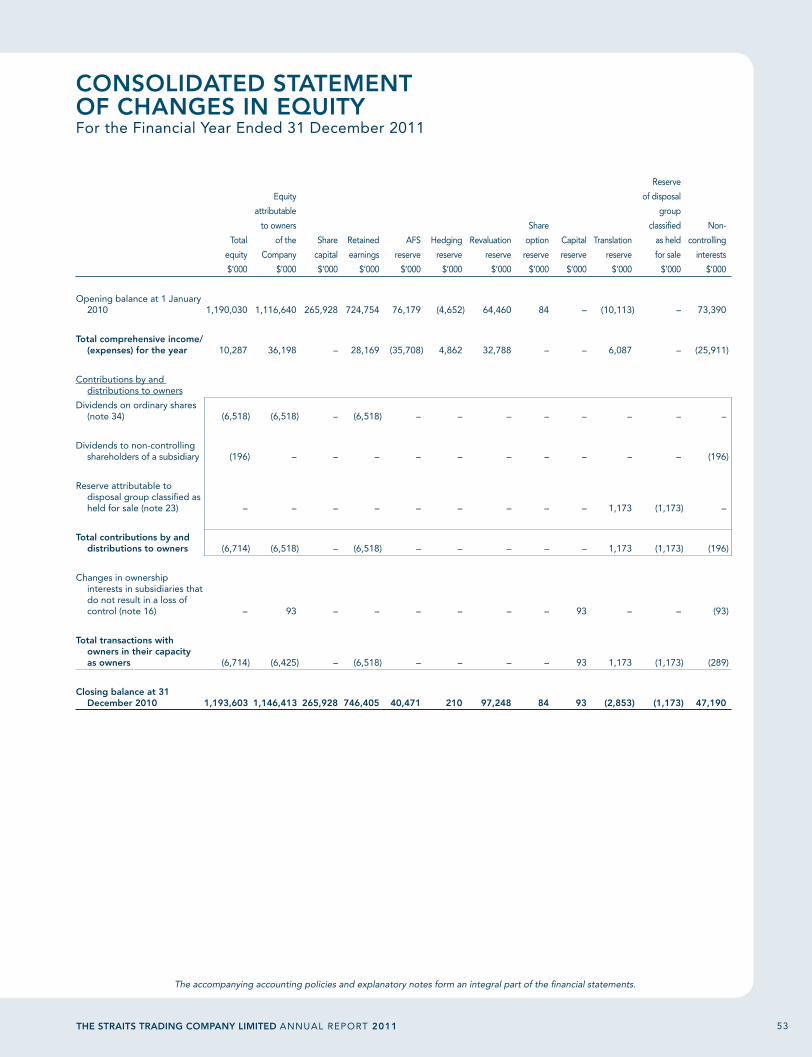
53THE STRAITS TRADING COMPANY LIMITED ANNUAL REPORT 2011
Reserve
Equity of disposal
attributable group
to owners Share classifi ed Non-
Total of the Share Retained AFS Hedging Revaluation option Capital Translation as held controlling
equity Company capital earnings reserve reserve reserve reserve reserve reserve for sale interests
$’000 $’000 $’000 $’000 $’000 $’000 $’000 $’000 $’000 $’000 $’000 $’000
Opening balance at 1 January 2010 1,190,030 1,116,640 265,928 724,754 76,179 (4,652) 64,460 84 – (10,113) – 73,390
Total comprehensive income/ (expenses) for the year 10,287 36,198 – 28,169 (35,708) 4,862 32,788 – – 6,087 – (25,911)
Contributions by and distributions to owners
Dividends on ordinary shares (note 34) (6,518) (6,518) – (6,518) – – – – – – – –
Dividends to non-controlling shareholders of a subsidiary (196) – – – – – – – – – – (196)
Reserve attributable to disposal group classifi ed as held for sale (note 23) – – – – – – – – – 1,173 (1,173) –
Total contributions by and distributions to owners (6,714) (6,518) – (6,518) – – – – – 1,173 (1,173) (196)
Changes in ownership interests in subsidiaries that do not result in a loss of control (note 16) – 93 – – – – – – 93 – – (93)
Total transactions with owners in their capacity as owners (6,714) (6,425) – (6,518) – – – – 93 1,173 (1,173) (289)
Closing balance at 31 December 2010 1,193,603 1,146,413 265,928 746,405 40,471 210 97,248 84 93 (2,853) (1,173) 47,190
CONSOLIDATED STATEMENTOF CHANGES IN EQUITYFor the Financial Year Ended 31 December 2011
The accompanying accounting policies and explanatory notes form an integral part of the fi nancial statements.

54 TRANSFORMATION
Note 2011 2010$’000 $’000
Cash fl ows from operating activitiesProfi t before tax 79,246 23,872Adjustments
Depreciation of property, plant and equipment 13 21,309 22,649Amortisation of intangible assets 15 12,377 5,583Amortisation of deferred income 5 (3,625) (3,625)Dividend income 4(a) (4,611) (5,082)Interest income 4(b) (6,100) (3,581)Finance costs 8 18,243 23,881Currency realignment (6,014) (2,954)Fair value changes in investment properties and fi nancial assets (56,146) (103,256)Net gain on disposal of investments, property, plant and equipment and
investment properties (857) (2,385)Impairment of investments, goodwill, mining assets, property, plant and
equipment 7 21,964 91,080Write off/(Write back)/Provisions for development/rehabilitation/exploration
costs and other assets 1,023 (2,845)(Write back)/Provision for onerous contracts 30 (1,404) 5,927Provision for employee benefi ts and receivables 13,470 5,275Share of results of equity-accounted associates and joint ventures (10,451) (1,778)
Operating cash fl ows before changes in working capital 78,424 52,761Decrease/(Increase) in development properties for sale 9,574 (1,626)Decrease/(Increase) in inventories 56,808 (10,615)Increase in trade and other receivables (29,777) (26,425)Increase in trade and other payables 23,565 9,519Cash fl ows from operations 138,594 23,614Income taxes paid, net of refund (15,855) (11,233)Payment of fi nance costs (18,495) (25,150)Interest received 5,250 3,493Dividend income 4,648 5,623Net cash fl ows from/(used in) operating activities 114,142 (3,653)
CONSOLIDATED CASH FLOW STATEMENTFor the Financial Year Ended 31 December 2011
The accompanying accounting policies and explanatory notes form an integral part of the fi nancial statements.

55THE STRAITS TRADING COMPANY LIMITED ANNUAL REPORT 2011
Note 2011 2010$’000 $’000
Cash fl ows from investing activitiesProceeds from disposal of property, plant and equipment and investment
properties 20,832 48,920Cost incurred on property, plant and equipment (31,275) (18,979)Cost incurred on investment properties (57,647) (3,073)Increase in deferred mine development and exploration expenditure and other
intangible assets (17,543) (15,737)Net cash infl ow on disposal of disposal group classifi ed as held for sale 23 4,535 –Net cash outfl ow on acquisition of a subsidiary 16 – (1,470)Proceeds from disposal of shares in an associate – 7,254Payment for insurance scheme (4,608) (4,480)Additional shares in associates (1,948) (2,847)Net cash fl ows (used in)/from investing activities (87,654) 9,588
Cash fl ows from fi nancing activitiesDividends paid to shareholders 34 (6,518) (6,518)Dividends paid to non-controlling shareholders of a subsidiary (2,083) (196)(Repayment)/Drawdown of short-term borrowings (67,092) 62,982Drawdown of long-term borrowings 59,616 244,121Repayment of long-term borrowings (52,393) (290,301)Proceeds from issuance of fi xed rate notes 225,000 –Release of security deposits for bank guarantees 16,909 –Net proceeds from issuance of shares by subsidiary to non-controlling
shareholders 41,855 –Net cash fl ows from fi nancing activities 215,294 10,088
Net increase in cash and cash equivalents 241,782 16,023Effect of exchange rate changes on cash and cash equivalents (276) (400)Cash and cash equivalents, beginning balance 71,817 56,194Cash and cash equivalents, ending balance 27 313,323 71,817
CONSOLIDATED CASH FLOW STATEMENTFor the Financial Year Ended 31 December 2011
The accompanying accounting policies and explanatory notes form an integral part of the fi nancial statements.

56 TRANSFORMATION
1 CORPORATE INFORMATION
The fi nancial statements of The Straits Trading Company Limited (the Company) for the year ended 31 December 2011 were authorised for issue in accordance with a resolution of the Directors on 28 March 2012.
The Straits Trading Company Limited is a limited liability company incorporated and domiciled in Singapore. The registered offi ce of the Company is located at 9 Battery Road #28-01, Straits Trading Building, Singapore 049910. The Company is listed on the Singapore Exchange Securities Trading Limited.
The immediate and ultimate holding company is The Cairns Private Limited, a company incorporated in Singapore.
The principal activity of the Company is that of an investment holding company. The subsidiaries, associates and joint ventures of the Group are primarily engaged in tin mining and smelting, investments in other metals and mineral resources, hotel investment and management as well as property investment and operations. There has been no signifi cant change in the nature of these activities during the fi nancial year.
The consolidated fi nancial statements relate to the Company and its subsidiaries (referred to as the Group) and the Group’s interests in associates and joint ventures.
2 SUMMARY OF SIGNIFICANT ACCOUNTING POLICIES
2.1 BASIS OF PREPARATION
The consolidated fi nancial statements of the Group and the balance sheet of the Company have been prepared in accordance with Singapore Financial Reporting Standards (FRS).
The fi nancial statements have been prepared on a historical cost basis except as disclosed in the accounting policies below.
The fi nancial statements are presented in Singapore dollars (SGD or $) and all values are rounded to the nearest thousand ($’000) except when otherwise indicated.
2.2 CHANGES IN FINANCIAL REPORTING STANDARDS AND ACCOUNTING POLICIES
The accounting policies adopted are consistent with those of the previous fi nancial year except in the current fi nancial year, the Group has adopted all the new and revised standards and interpretations of FRS (INT FRS) that are effective for annual periods beginning on or after 1 January 2011.
NOTES TO THE FINANCIAL STATEMENTSFor the Financial Year Ended 31 December 2011

57THE STRAITS TRADING COMPANY LIMITED ANNUAL REPORT 2011
2 SUMMARY OF SIGNIFICANT ACCOUNTING POLICIES (cont’d)
2.2 CHANGES IN FINANCIAL REPORTING STANDARDS AND ACCOUNTING POLICIES (cont’d)
Certain new FRS and INT FRS have been published that are mandatory for accounting periods beginning on or after 1 January 2011:
Effective for annualperiods beginning
on or after
Amendment to FRS 32 Financial Instruments: Presentation – Classifi cation of Rights Issues 1 February 2010INT FRS 119 Extinguishing Financial Liabilities with Equity Instruments 1 July 2010Revised FRS 24 Related Party Disclosures 1 January 2011Amendments to INT FRS 114 Prepayments of a Minimum Funding Requirement 1 January 2011INT FRS 115 Agreements for the Construction of Real Estate * 1 January 2011
Improvements to FRSs issued in 2010:– Amendments to FRS 103 Business Combinations 1 July 2010– Amendments to FRS 107 Financial Instruments: Disclosures 1 January 2011– Amendments to FRS 1 Presentation of Financial Statements 1 January 2011– Transition requirements for amendments arising as a result of FRS 27 Consolidated and
Separate Financial Statements 1 July 2010– Amendments to FRS 34 Interim Financial Reporting 1 January 2011– Amendments to INT FRS 113 Customer Loyalty Programmes 1 January 2011
* The Group has early adopted INT FRS 115 Agreements for the Construction of Real Estate in fi nancial year 2010.
The adoption of these standards and interpretations did not have any effect on the fi nancial performance or position of the Group and the Company except as disclosed below:
Revised FRS 24 Related Party Disclosures
From 1 January 2011, the Group has applied the revised FRS 24 Related Party Disclosures to identify parties that are related to the Group and to determine the disclosures to be made on transactions and outstanding balances, including commitments, between the Group and its related parties. The revised FRS 24 improved the defi nition of a related party in order to eliminate inconsistencies and ensure symmetrical identifi cation of relationships between two parties.
The adoption of the revised FRS 24 affects only the disclosures made in the fi nancial statements. There is no impact on the fi nancial performance and position of the Group for the current and previous fi nancial years.

58 TRANSFORMATION
NOTES TO THE FINANCIAL STATEMENTSFor the Financial Year Ended 31 December 2011
2 SUMMARY OF SIGNIFICANT ACCOUNTING POLICIES (cont’d)
2.3 FUTURE CHANGES IN FINANCIAL REPORTING STANDARDS
The Group has not adopted the following standards and interpretations that have been issued but not yet effective:
Effective for annualperiods beginning
on or after
Amendments to FRS 107 Disclosures – Transfers of Financial Assets 1 July 2011Amendments to FRS 12 Deferred Tax: Recovery of Underlying Assets 1 January 2012Amendments to FRS 1 – Presentation of Items of Other Comprehensive Income 1 July 2012Revised FRS 19 Employee Benefi ts 1 January 2013Revised FRS 27 Separate Financial Statements 1 January 2013Revised FRS 28 Investments in Associates and Joint Ventures 1 January 2013FRS 110 Consolidated Financial Statements 1 January 2013FRS 111 Joint Arrangements 1 January 2013FRS 112 Disclosure of Interests in Other Entities 1 January 2013FRS 113 Fair Value Measurements 1 January 2013
The nature of the impending changes is described below:
Amendments to FRS 107 Disclosures – Transfers of Financial Assets
The Amendments to FRS 107 introduce disclosure requirements for all transferred assets, existing at the reporting date, irrespective of when the related transfer transaction occurred. These additional disclosure requirements are to enable users of fi nancial statements to evaluate the risk exposures relating to transfer transactions of fi nancial assets (for example, securitisations), including understanding the possible effects of any risks that may remain with the entity that transferred the assets. The amendments also require additional disclosures if a disproportionate amount of transfer transactions are undertaken around the end of a reporting period. The Group is currently assessing the impact of the disclosure requirements. As this is a disclosure standard, it will have no impact on the fi nancial position and fi nancial performance of the Group.

59THE STRAITS TRADING COMPANY LIMITED ANNUAL REPORT 2011
NOTES TO THE FINANCIAL STATEMENTSFor the Financial Year Ended 31 December 2011
2 SUMMARY OF SIGNIFICANT ACCOUNTING POLICIES (cont’d)
2.3 FUTURE CHANGES IN FINANCIAL REPORTING STANDARDS (cont’d)
Amendments to FRS 12 Deferred Tax: Recovery of Underlying Assets
The Amendments to FRS 12 Deferred Tax: Recovery of Underlying Assets is effective for annual periods beginning on or after 1 January 2012.
The Amendments to FRS 12 apply to the measurement of deferred tax liabilities and assets arising from investment properties measured using the fair value model under FRS 40 Investment Property, including investment property acquired in a business combination and subsequently measured using the fair value model. For the purposes of measuring deferred tax, the Amendments introduce a rebuttable presumption that the carrying amount of an investment property measured at fair value will be recovered entirely through sale. The presumption can be rebutted if the investment property is depreciable and is held within a business model whose objective is to consume substantially all of the economic benefi ts over time, rather than through sale.
The Group provides for deferred tax liabilities for its investment properties on the basis that the carrying amount of the investment properties will be recovered through use except freehold land. Upon adoption of the Amendments to FRS 12, there is a presumption that the carrying amount of an investment property measured at fair value will be recovered entirely through sale. The Group expects the adoption of Amendments to FRS 12 to result in a decrease in deferred tax liabilities of the Group and a corresponding increase in retained earnings upon initial application of the amendments.
Amendments to FRS 1 Presentation of Items of Other Comprehensive Income
The Amendments to FRS 1 Presentation of Items of Other Comprehensive Income (“OCI”) is effective for fi nancial periods beginning on or after 1 July 2012.
The Amendments to FRS 1 changes the grouping of items presented in OCI. Items that could be reclassifi ed to profi t or loss at a future point in time would be presented separately from items which will never be reclassifi ed. As the Amendments only affect the presentations of items that are already recognised in OCI, the Group does not expect any impact on its fi nancial position or performance upon adoption of this standard.
Revised FRS 19 Employee Benefi ts
The revised FRS 19 Employee Benefi ts is effective for fi nancial periods beginning on or after 1 January 2013.
The revised FRS 19 removes the corridor mechanism for defi ned benefi ts plans and no longer allows actuarial gains and losses to be recognised in profi t or loss. The distinction between short-term and long-term employee benefi ts is based on expected timing of settlement rather than employee entitlement. The revised FRS 19 is to be applied retrospectively. The Group is in the process of reviewing the implications of this standard.
FRS 110 Consolidated Financial Statements and Revised FRS 27 Separate Financial Statements
FRS 110 and the revised FRS 27 are effective for fi nancial periods beginning on or after 1 January 2013.
FRS 110 establishes a single control model that applies to all entities (including special purpose entities). The changes introduced by FRS 110 will require management to exercise signifi cant judgement to determine which entities are controlled, and therefore are required to be consolidated by the Group, compared with the requirements that were

60 TRANSFORMATION
NOTES TO THE FINANCIAL STATEMENTSFor the Financial Year Ended 31 December 2011
2 SUMMARY OF SIGNIFICANT ACCOUNTING POLICIES (cont’d)
2.3 FUTURE CHANGES IN FINANCIAL REPORTING STANDARDS (cont’d)
FRS 110 Consolidated Financial Statements and Revised FRS 27 Separate Financial Statements (cont’d)
in FRS 27. Therefore, FRS 110 may change which entities are consolidated within a group. The revised FRS 27 was amended to address accounting for subsidiaries, jointly controlled entities and associations in separate fi nancial statements. The Group is in the process of reviewing the implications of these standards.
FRS 111 Joint Arrangements and Revised FRS 28 Investments in Associates and Joint Ventures
FRS 111 and the revised FRS 28 are effective for fi nancial periods beginning on or after 1 January 2013.
FRS 111 classifi es joint arrangements either as joint operations or joint ventures. Joint operation is a joint arrangement whereby the parties that have joint control of the arrangement have rights to the assets and obligations for the liabilities relating to the arrangement whereas joint venture is a joint arrangement where the parties that have joint control of the arrangement have rights to the net assets of the arrangement. FRS 111 requires the determination of joint arrangement’s classifi cation to be based on the parties’ rights and obligations under the arrangement, with the existence of a separate legal vehicle no longer being the key factor. FRS 111 disallows proportionate consolidation and requires joint ventures to be accounted for using the equity method. The revised FRS 28 was amended to describe the application of equity method to investments in joint ventures in addition to associates. The Group is currently assessing the impact on transition to FRS 111.
FRS 112 Disclosure of Interests in Other Entities
FRS 112 is effective for fi nancial periods beginning on or after 1 January 2013.
FRS 112 is a new and comprehensive standard on disclosure requirements for all forms of interests in other entities, including joint arrangements, associates, special purpose vehicles and other off balance sheet vehicles. FRS 112 requires an entity to disclose information that helps users of its fi nancial statements to evaluate the nature and risks associated with its interests in other entities and the effects of those interests on its fi nancial statements. The Group is currently assessing the impact of the disclosure requirements. As this is a disclosure standard, it will have no impact on the fi nancial position and fi nancial performance of the Group when implemented in 2013.
FRS 113 Fair Value Measurements
FRS 113 is effective for fi nancial periods beginning on or after 1 January 2013.
FRS 113 provides a single source of guidance for all fair value measurements. FRS 113 does not change when an entity is required to use fair value, but rather provides guidance on how to measure fair value under FRS when fair value is required or permitted by FRS. The Group is in the process of reviewing the implications of this standard.
2.4 SIGNIFICANT ACCOUNTING ESTIMATES AND JUDGEMENTS
The preparation of fi nancial statements in conformity with FRS requires management to make judgements, estimates and assumptions that affect the application of the Group’s accounting policies and reported amounts of assets, liabilities, income and expenses, and disclosures made. The estimates and associated assumptions are assessed on an on-going basis and are based on historical experience and various other factors that are believed to be reasonable under the circumstances, the results of which form the basis for making the judgements about carrying amounts of assets and liabilities that are not readily apparent from other sources.

61THE STRAITS TRADING COMPANY LIMITED ANNUAL REPORT 2011
NOTES TO THE FINANCIAL STATEMENTSFor the Financial Year Ended 31 December 2011
2 SUMMARY OF SIGNIFICANT ACCOUNTING POLICIES (cont’d)
2.4 SIGNIFICANT ACCOUNTING ESTIMATES AND JUDGEMENTS (cont’d)
Judgements made by management in the application of FRS that have a signifi cant effect on the fi nancial statements and in arriving at estimates with a signifi cant risk of material adjustment in the following year are discussed in note 41.
2.5 BASIS OF CONSOLIDATION AND BUSINESS COMBINATION A) Basis of consolidation
Basis of consolidation from 1 January 2010
The consolidated fi nancial statements comprise the fi nancial statements of the Company and its subsidiaries as at the end of the reporting period. The fi nancial statements of the subsidiaries used in the preparation of the consolidated fi nancial statements are prepared for the same reporting date as the Company. Consistent accounting policies are applied to like transactions and events in similar circumstances.
All intra-group balances, income and expenses and unrealised gains and losses resulting from intra-group transactions and dividends are eliminated in full.
Subsidiaries are consolidated from the date of acquisition, being the date on which the Group obtains control, and continue to be consolidated until the date that such control ceases.
Losses within a subsidiary are attributed to the non-controlling interest even if that results in a defi cit balance.
A change in the ownership interest of a subsidiary, without a loss of control, is accounted for as an equity transaction. If the Group loses control over a subsidiary, it:
– De-recognises the assets (including goodwill) and liabilities of the subsidiary at their carrying amounts at the date when control is lost;
– De-recognises the carrying amount of any non-controlling interest;– De-recognises the cumulative translation differences recorded in equity;– Recognises the fair value of the consideration received;– Recognises the fair value of any investment retained;– Recognises any surplus or defi cit in profi t or loss;– Re-classifi es the Group’s share of components previously recognised in other comprehensive income
to profi t or loss or retained earnings, as appropriate.
Basis of consolidation prior to 1 January 2010
Certain of the above-mentioned requirements were applied on a prospective basis. The following differences, however, are carried forward in certain instances from previous basis of consolidation:
– Acquisition of non-controlling interests, prior to 1 January 2010, was accounted for using the parent entity extension method, whereby, the difference between the consideration and the book value of the share of the net assets acquired was recognised in goodwill.

62 TRANSFORMATION
NOTES TO THE FINANCIAL STATEMENTSFor the Financial Year Ended 31 December 2011
2 SUMMARY OF SIGNIFICANT ACCOUNTING POLICIES (cont’d)
2.5 BASIS OF CONSOLIDATION AND BUSINESS COMBINATION (cont’d)
A) Basis of consolidation (cont’d)
Basis of consolidation prior to 1 January 2010 (cont’d)
– Losses incurred by the Group were attributed to the non-controlling interest until the balance was reduced to nil. Any further losses were attributed to the Group, unless the non-controlling interest had a binding obligation to cover these. Losses prior to 1 January 2010 were not reallocated between the non-controlling interest and the owners of the Company.
– Upon loss of control, the Group accounted for the investment retained at its proportionate share of net asset value at the date control was lost. The carrying value of such investment as at 1 January 2010 has not been restated.
B) Business combinations
Business combinations from 1 January 2010
Business combinations are accounted for by applying the acquisition method. Identifi able assets acquired and liabilities assumed in a business combination are measured initially at their fair values at the date of acquisition. Acquisition-related costs are recognised as expenses in the periods in which the costs are incurred and the services are received.
When the Group acquires a business, it assesses the fi nancial assets and liabilities assumed for appropriate classifi cation and designation in accordance with the contractual terms, economic circumstances and pertinent conditions as at the acquisition date. This includes the separation of embedded derivatives in host contracts by the acquiree.
Any contingent consideration to be transferred by the acquirer will be recognised at fair value at the acquisition date. Subsequent changes to the fair value of the contingent consideration which is deemed to be an asset or liability, will be recognised in accordance with FRS 39 either in profi t or loss or other comprehensive income. If the contingent consideration is classifi ed as equity, it is not re-measured until it is fi nally settled within equity.
In business combinations achieved in stages, previously held equity interests in the acquiree are re-measured to fair value at the acquisition date and any corresponding gain or loss is recognised in profi t or loss.
The Group elects for each individual business combination, whether the non-controlling interest in the acquiree (if any) is recognised on the acquisition date at fair value, or at the non-controlling interest’s proportionate share of the acquiree’s identifi able net assets.
Any excess of the sum of the fair value of the consideration transferred in the business combination, the amount of the non-controlling interest in the acquiree (if any), and the fair value of the Group’s previously held equity interest in the acquiree (if any), over the net fair value of the acquiree’s identifi able assets and liabilities is recorded as goodwill. The accounting policy for goodwill is set out in note 2.14 (a). In instances where the latter amounts exceed the former, the excess is recognised as gain on bargain purchase in profi t or loss on the acquisition date.

63THE STRAITS TRADING COMPANY LIMITED ANNUAL REPORT 2011
NOTES TO THE FINANCIAL STATEMENTSFor the Financial Year Ended 31 December 2011
2 SUMMARY OF SIGNIFICANT ACCOUNTING POLICIES (cont’d)
2.5 BASIS OF CONSOLIDATION AND BUSINESS COMBINATION (cont’d)
B) Business combinations (cont’d)
Business combinations prior to 1 January 2010
In comparison to the above mentioned requirements, the following differences applied:
Business combinations are accounted for by applying the purchase method. Transaction costs directly attributable to the acquisition formed part of the acquisition costs. The non-controlling interest (formerly known as minority interest) was measured at the proportionate share of the acquiree’s identifi able net assets.
Business combinations achieved in stages were accounted for as separate steps. Adjustments to those fair values relating to previously held interests are treated as a revaluation and recognised in equity. Any additional acquired share of interest did not affect previously recognised goodwill.
Where the Group acquired a business, embedded derivatives separated from the host contract by the acquiree were not reassessed on acquisition unless the business combination results in a change in the terms of the contract that signifi cantly modifi es the cash fl ows that otherwise would have been required under the contract.
Contingent consideration was recognised if, and only if, the Group had a present obligation, the economic outfl ow was more likely than not and a reliable estimate was determinable. Subsequent measurements to the contingent consideration were recognised as part of goodwill.
2.6 TRANSACTIONS WITH NON-CONTROLLING INTERESTS
Transactions with non-controlling interests from 1 January 2010
Non-controlling interests represent the equity in subsidiaries not attributable, directly or indirectly, to owners of the Company, and are presented separately in the consolidated statement of comprehensive income and within equity in the consolidated balance sheet, separately from the equity attributable to owners of the Company.
Changes in the ownership interest in a subsidiary that do not result in a loss of control are accounted for as equity transactions. In such circumstances, the carrying amounts of the controlling and non-controlling interests are adjusted to refl ect the changes in their relative interests in the subsidiary. Any difference between the amount by which the non-controlling interest is adjusted and the fair value of the consideration paid or received is recognised directly in equity and attributed to owners of the Company.
Transactions with non-controlling interests prior to 1 January 2010
In comparison to the above mentioned requirements, the following differences applied:
The Group applied the policy of treating transactions with non-controlling interests as transactions with parties external to the Group. Disposals to non-controlling interests which resulted in gains or losses for the Group are recorded in profi t or loss.
The difference between any consideration paid to non-controlling interests for purchase of an additional equity interest in a subsidiary and the incremental share of the carrying value of the net assets of the subsidiary is recognised as goodwill.

64 TRANSFORMATION
NOTES TO THE FINANCIAL STATEMENTSFor the Financial Year Ended 31 December 2011
2 SUMMARY OF SIGNIFICANT ACCOUNTING POLICIES (cont’d)
2.7 FOREIGN CURRENCIES
The Group’s consolidated fi nancial statements are presented in Singapore Dollars, which is also the Company’s functional currency. Each entity in the Group determines its own functional currency and items included in the fi nancial statements of each entity are measured using that functional currency.
(a) TRANSACTIONS AND BALANCES
Transactions in foreign currencies are measured in the respective functional currencies of the Company and its subsidiaries and are recorded on initial recognition in the functional currencies at exchange rates approximating those ruling at the transaction dates. Monetary assets and liabilities denominated in foreign currencies are translated at the rate of exchange ruling at the end of the reporting period. Non-monetary items that are measured in terms of historical cost in a foreign currency are translated using the exchange rates as at the dates of the initial transactions. Non-monetary items measured at fair value in a foreign currency are translated using the exchange rates at the date when the fair value was determined.
Exchange differences arising on the settlement of monetary items or on translating monetary items at the end of the reporting period are recognised in the profi t or loss except for exchange differences arising on monetary items that form part of the Group’s net investment in foreign operations, which are recognised initially in other comprehensive income and accumulated under foreign currency translation reserve in equity. The foreign currency translation reserve is reclassifi ed from equity to profi t or loss of the Group on disposal of the foreign operation.
(b) CONSOLIDATED FINANCIAL STATEMENTS
For consolidation purpose, the assets and liabilities of foreign operations are translated into SGD at the rate of exchange ruling at the end of the reporting period and their profi t or loss are translated at the exchange rates prevailing at the date of the transactions. The exchange differences arising on the translation are recognised in other comprehensive income. On disposal of a foreign operation, the component of other comprehensive income relating to that particular foreign operation is recognised in profi t or loss.
In the case of a partial disposal without loss of control of a subsidiary that includes a foreign operation, the proportionate share of the cumulative amount of the exchange differences are re-attributed to non-controlling interest and are not recognised in profi t or loss. For partial disposals of associates or jointly controlled entities that are foreign operations, the proportionate share of the accumulated exchange differences is reclassifi ed to profi t or loss.
2.8 SUBSIDIARIES
Subsidiaries are entities controlled by the Company. Control exists when the Company has the power, directly or indirectly, to govern the fi nancial and operating policies of an entity so as to obtain benefi ts from its activities. The Group generally has such power when it, directly or indirectly, holds more than 50% of the issued share capital, or controls more than half of the voting power, or controls the composition of the board of directors.
In the Company’s separate fi nancial statements, investments in subsidiaries are stated at costs less accumulated impairment losses. At the end of each reporting period, the Company assesses whether there is any indication of impairment. If any such indication exists, the recoverable amount is estimated and allowance for impairment is made.

65THE STRAITS TRADING COMPANY LIMITED ANNUAL REPORT 2011
NOTES TO THE FINANCIAL STATEMENTSFor the Financial Year Ended 31 December 2011
2 SUMMARY OF SIGNIFICANT ACCOUNTING POLICIES (cont’d)
2.9 ASSOCIATES
An associate is an entity, not being a subsidiary or a joint venture, in which the Group has signifi cant infl uence. An associate is equity accounted for from the date the Group obtains signifi cant infl uence until the date the Group ceases to have signifi cant infl uence over the associate.
The Group’s investments in associates are accounted for using the equity method. Under the equity method, the investment in associates is carried in the balance sheet at cost plus post-acquisition changes in the Group’s share of net assets of the associates. Goodwill relating to associate is included in the carrying amount of the investment and is neither amortised nor tested individually for impairment. Any excess of the Group’s share of the net fair value of the associate’s identifi able assets, liabilities and contingent liabilities over the cost of the investment is included as income in the determination of the Group’s share of results of the associate in the period in which the investment is acquired.
The profi t or loss refl ects the share of the results of operations of the associates. Where there has been a change recognised in other comprehensive income by the associates, the Group recognises its share of such changes in other comprehensive income. Unrealised gains and losses resulting from transactions between the Group and the associate are eliminated to the extent of the interest in the associate.
The Group’s share of the profi t or loss of its associates is shown on the face of profi t or loss after tax and non-controlling interests in the subsidiaries of associates.
When the Group’s share of losses in an associate equals or exceeds its interest in the associate, the Group does not recognise further losses, unless it has incurred obligations or made payments on behalf of the associate.
After application of the equity method, the Group determines whether it is necessary to recognise an additional impairment loss on the Group’s investment in its associates. The Group determines at the end of each reporting period whether there is any objective evidence that the investment in the associate is impaired. If this is the case, the Group calculates the amount of impairment as the difference between the recoverable amount of the associate and its carrying value and recognises the amount in profi t or loss. The most recent available audited fi nancial statements of the associates are used by the Group in applying the equity method. Where the dates of the audited fi nancial statements used are not co-terminous with those of the Group, the share of results is arrived at from the last audited fi nancial statements available and un-audited management fi nancial statements to the end of the accounting period. Consistent accounting policies are applied for like transactions and events in similar circumstances.
Upon loss of signifi cant infl uence over the associate, the Group measures and recognises any retained investment at its fair value. Any difference between the carrying amount of the associate upon loss of signifi cant infl uence and the fair value of the aggregate of the retained investment and proceeds from disposal is recognised in profi t or loss.
In the Company’s separate fi nancial statements, investments in associates are accounted for at cost less accumulated impairment losses.

66 TRANSFORMATION
NOTES TO THE FINANCIAL STATEMENTSFor the Financial Year Ended 31 December 2011
2 SUMMARY OF SIGNIFICANT ACCOUNTING POLICIES (cont’d)
2.10 JOINT VENTURES
A joint venture is a contractual arrangement whereby two or more parties undertake an economic activity that is subject to joint control, where the strategic fi nancial and operating decisions relating to the activity require the unanimous consent of the parties sharing control.
The Group’s investments in joint ventures are accounted for using the equity method of accounting as described in note 2.9.
Upon loss of joint control, the Group measures and recognises any retained investment at its fair value. Any difference between the carrying amount of the former joint venture upon loss of joint control and the aggregate of the fair value of the retained investment and proceeds from disposal is recognised in profi t or loss.
In the Company’s separate fi nancial statements, investments in joint ventures are accounted for at cost less accumulated impairment losses.
2.11 PROPERTY, PLANT AND EQUIPMENT
All items of property, plant and equipment are initially recorded at cost. Such cost includes the cost of replacing part of the property, plant and equipment and borrowing costs that are directly attributable to the acquisition, construction or production of a qualifying property, plant and equipment. The accounting policy for borrowing costs is set out in note 2.24. The cost of an item of property, plant and equipment is recognised as an asset if, and only if, it is probable that future economic benefi ts associated with the item will fl ow to the Group and the cost of the item can be measured reliably.
Subsequent to recognition, plant and equipment and furniture and fi xtures are measured at cost less accumulated depreciation and any accumulated impairment losses. When signifi cant parts of property, plant and equipment are required to be replaced in intervals, the Group recognises such parts as individual assets with specifi c useful lives and depreciation, respectively. Likewise, when a major inspection is performed, its cost is recognised in the carrying amount of the plant and equipment as a replacement if the recognition criteria are satisfi ed. All other repair and maintenance costs are recognised in profi t or loss as incurred.
Land and buildings are measured at fair value less accumulated depreciation and impairment losses recognised after the date of the revaluation. Valuations are performed with suffi cient regularity to ensure that the carrying amount does not differ materially from the fair value of the land and buildings at the end of the reporting period.
Any revaluation surplus is recognised in other comprehensive income and accumulated in equity under the asset revaluation reserve, except to the extent that it reverses a revaluation decrease of the same asset previously recognised in profi t or loss, in which case the increase is recognised in profi t or loss. A revaluation defi cit is recognised in profi t or loss, except to the extent that it offsets an existing surplus on the same asset carried in the asset revaluation reserve.
Any accumulated depreciation as at the revaluation date is eliminated against the gross carrying amount of the asset and the net amount is restated to the revalued amount of the asset. The revaluation surplus included in the asset revaluation reserve in respect of an asset is transferred directly to retained earnings on retirement or disposal of the asset.
An item of property, plant and equipment is derecognised upon disposal or when no future economic benefi ts are expected from its use or disposal. Any gain or loss on derecognition of the asset is included in the profi t or loss in the year the asset is derecognised.

67THE STRAITS TRADING COMPANY LIMITED ANNUAL REPORT 2011
NOTES TO THE FINANCIAL STATEMENTSFor the Financial Year Ended 31 December 2011
2 SUMMARY OF SIGNIFICANT ACCOUNTING POLICIES (cont’d)
2.12 DEPRECIATION AND RESIDUAL VALUES
In the tin mining subsidiary, plant and equipment used in mining are depreciated using the unit-of-production method based on economically recoverable ore reserves and resources over the estimated useful lives of the assets. Changes in estimated economically recoverable ore reserves and resources and useful lives of plant and equipment are accounted for on a prospective basis from the beginning of the year in which the change arises. Earthmoving vehicles are depreciated based on hour-worked basis over the estimated useful life of each asset.
Depreciation for the remaining assets of the Group is provided on the straight-line method to write off the cost or valuation of relevant assets to their residual values, if any, over their estimated useful lives or life of the mine where appropriate, whichever is shorter. No depreciation is provided on freehold or equivalent land. The estimated useful lives for these remaining assets are as follows:
Leasehold land – remaining lease term of up to 81 yearsBuildings – 8 to 40 years or the unexpired lease period or life of the mine, whichever is
shorterPlant, equipment and vehicles – 3 to 40 yearsFurniture – 3 to 10 yearsMine restoration – Life of mine
The residual value, useful life and depreciation method are reviewed at the end of each reporting period to ensure that the amount, method and period of depreciation are consistent with previous estimates and the expected pattern of consumption of the future economic benefi ts embodied in the items of property, plant and equipment.
Capital work-in-progress included in property, plant and equipment are not depreciated as these assets are not available for use.
The carrying values of property, plant and equipment are reviewed for impairment when events or changes in circumstances indicate that the carrying value may not be recoverable.
2.13 INVESTMENT PROPERTIES
Investment properties are properties that are either owned by the Group or leased under a fi nance lease in order to earn rentals or for capital appreciation, or both, rather than for use in the production or supply of goods or services, or for administrative purposes, or in the ordinary course of business. Investment properties comprise completed investment properties and properties that are being constructed or developed for future use as investment properties. Properties held under operating leases are classifi ed as investment properties when the defi nition of investment properties is met and they are accounted for as fi nance leases.
Investment properties are initially measured at cost, including transaction costs. The carrying amount includes the cost of replacing part of an existing investment property at the time that cost is incurred if the recognition criteria are met. Subsequent to initial recognition, investment properties are stated at fair value which refl ects market conditions at the end of the reporting period. Gains or losses arising from changes in the fair values of investment properties are included in profi t or loss in the year in which they arise.

68 TRANSFORMATION
NOTES TO THE FINANCIAL STATEMENTSFor the Financial Year Ended 31 December 2011
2 SUMMARY OF SIGNIFICANT ACCOUNTING POLICIES (cont’d)
2.13 INVESTMENT PROPERTIES (cont’d)
Investment properties are derecognised when either they have been disposed of or when the investment property is permanently withdrawn from use and no future economic benefi t is expected from its disposal. Any gain or loss on the retirement or disposal of an investment property is recognised in profi t or loss in the year of retirement or disposal.
Transfers are made to or from investment property only when there is change in use. For a transfer from investment property to owner-occupied property, the deemed cost for subsequent accounting is the fair value at the date of change in use. For a transfer from owner-occupied property to investment property, the property is accounted for in accordance with the accounting policy for property, plant and equipment set out in note 2.11 up to the date of change in use.
For properties that are being redeveloped for continued future use as investment property, they are stated at fair values and the associated redevelopment expenditures are stated at cost until redevelopment is completed.
In note 14 to the fi nancial statements, land held under 999 years’ leasehold is regarded as equivalent to freehold.
2.14 INTANGIBLE ASSETS
(a) GOODWILL
Goodwill is initially measured at cost. Following initial recognition, goodwill is measured at cost less any accumulated impairment losses. Goodwill is tested for impairment as described in note 2.22. Where goodwill forms part of a cash-generating unit and part of the operation within that cash-generating unit is disposed of, the goodwill associated with the operation disposed of is included in the carrying amount of the operation when determining the gain or loss on disposal of the operation. Goodwill disposed of in this circumstance is measured based on the relative fair values of the operations disposed of and the portion of the cash-generating unit retained. Goodwill and fair value adjustments arising on the acquisition of foreign operations on or after 1 January 2005 are treated as assets and liabilities of the foreign operations and are recorded in the functional currency of the foreign operations and translated in accordance with the accounting policy set out in note 2.7.
(b) MINING RIGHTS/MINING ASSETS
Mining rights/mining assets acquired in a business combination are stated at their fair values as at the date of acquisition. Following initial recognition, mining rights/mining assets are carried at cost less accumulated amortisation and impairment losses, if any. Mining rights/mining assets are amortised based on the unit-of-production method so as to write off the mining rights/mining assets in proportion to the depletion of the estimated economically recoverable ore reserves and resources. The amortisation period and the amortisation method are reviewed at least at each fi nancial year end.

69THE STRAITS TRADING COMPANY LIMITED ANNUAL REPORT 2011
NOTES TO THE FINANCIAL STATEMENTSFor the Financial Year Ended 31 December 2011
2 SUMMARY OF SIGNIFICANT ACCOUNTING POLICIES (cont’d)
2.14 INTANGIBLE ASSETS (cont’d)
(c) MANAGEMENT RIGHTS
Payments made to acquire management rights of hotels and properties of similar nature are capitalised and amortised on a straight-line basis over their fi nite useful lives. The amortisation period and amortisation method are reviewed at least at each fi nancial year end.
(d) DEFERRED MINE EXPLORATION AND EVALUATION EXPENDITURE
Deferred mine exploration and evaluation expenditure is stated at cost less accumulated amortisation and impairment losses, if any.
Mine exploration and evaluation expenditure incurred in an area of interest is accumulated in respect of each identifi able area of interest. These costs are only carried forward to the extent that they are expected to be recouped through the successful development of the areas or activities of the areas which have not reached a stage that permit reasonable assessment of the existence of economically recoverable ore reserves and resources.
Accumulated costs in relation to an abandoned area are written off in full to profi t or loss in the year in which the decision to abandon the area is made.
When production commences, the accumulated cost for the relevant area of interest is amortised based on the unit-of-production method so as to write off the expenditure in proportion to the depletion of the estimated economically recoverable ore reserves and resources.
A review is carried out annually on the carrying amount of deferred exploration and evaluation expenditure to determine whether there is any indication of impairment. Any impairment loss is recognised as an expense in profi t or loss.
(e) DEFERRED MINE DEVELOPMENT EXPENDITURE Deferred mine development expenditure is stated at cost less accumulated amortisation and impairment
losses, if any.
Mine development expenditure incurred in connection with development activities in respect of each area of interest, which includes all activities conducted in the preparation of economically recoverable ore reserves and resources until commercial production is accumulated in respect of each identifi able area of interest. These costs are only deferred to the extent that they are expected to be recouped through the successful development of the area. Mine development expenditure which is considered to provide minimal benefi t to future periods is recognised as an expense in profi t or loss.
When production in an area of interest commences, the accumulated cost for the relevant area of interest is amortised based on the unit-of-production method so as to write off the expenditure in proportion to the depletion of the estimated economically recoverable ore reserves and resources.
A review is carried out annually on the carrying amount of deferred development expenditure to determine whether there is any indication of impairment. Any impairment loss is recognised as an expense in profi t or loss.

70 TRANSFORMATION
NOTES TO THE FINANCIAL STATEMENTSFor the Financial Year Ended 31 December 2011
2 SUMMARY OF SIGNIFICANT ACCOUNTING POLICIES (cont’d)
2.14 INTANGIBLE ASSETS (cont’d)
(f) MINE ENVIRONMENTAL EXPENDITURE
Restoration, rehabilitation and environmental expenditure incurred during the production phase of operations is recognised in profi t or loss as part of the cost of production of the mine property concerned.
Signifi cant restoration, rehabilitation and environmental expenditure to be incurred subsequent to the cessation of production of each mine property is provided based on the present value of the estimated expenditure to be incurred.
(g) CLUB MEMBERSHIP
Club memberships were acquired separately and are amortised on a straight-line basis over their fi nite useful lives. The amortisation period and amortisation method are reviewed at each fi nancial year end.
2.15 INVESTMENTS IN DEBT AND EQUITY SECURITIES
When investment securities are recognised initially, they are measured at fair value, plus, in the case of investment securities not at fair value through profi t or loss, directly attributable transaction costs.
After initial recognition, investment securities classifi ed as held-for-trading are measured at fair value with the gain or loss arising from the changes in fair value recognised in profi t or loss. Investment securities are classifi ed as held-for-trading if they are acquired principally for the purpose of selling in the near term.
Where the Group has the positive intent and ability to hold debt securities to maturity, they are subsequently measured at amortised cost. Amortised cost is computed as the amount initially recognised minus principal repayments, plus or minus the cumulative amortisation using the effective interest method of any difference between the initially recognised amount and the maturity amount and minus any reduction for impairment or uncollectibility. For investment securities carried at amortised cost, gains or losses are recognised in profi t or loss when the investment securities are derecognised or impaired, and through the amortisation process.
Other investment securities held by the Group, only if they are non-derivatives, are classifi ed as available-for-sale (AFS). After initial recognition, AFS are subsequently measured at fair value with the gain or loss arising from the changes in fair value recognised in other comprehensive income, except for impairment losses and foreign exchange gains and losses on AFS that are monetary items recognised in profi t or loss. When these AFS are derecognised, the cumulative gain or loss previously recognised in other comprehensive income is reclassifi ed from equity to profi t or loss as a reclassifi cation adjustment.
All regular way purchases and sales of investment securities are recognised or derecognised on trade date.
The fair value of investment securities that are actively traded in organised fi nancial markets is determined by reference to quoted market bid prices at the close of business at the end of the reporting period. For investment securities where there is no active market, fair value is estimated using a valuation technique based on certain assumptions that are not supported by observable market prices or rates. Management believes the estimated fair values resulting from the valuation technique which are recorded in the balance sheet are reasonable and the most appropriate at the end of the reporting period. These investment securities shall, however, be measured at cost less impairment losses if their fair values cannot be reliably estimated.

71THE STRAITS TRADING COMPANY LIMITED ANNUAL REPORT 2011
NOTES TO THE FINANCIAL STATEMENTSFor the Financial Year Ended 31 December 2011
2 SUMMARY OF SIGNIFICANT ACCOUNTING POLICIES (cont’d)
2.16 BASE INVENTORY
Base inventory is the base recirculating inventory in the smelting process. The value represents the lower of estimated recoverable amounts and cost of 381 tonnes of metallic tin content.
2.17 NON-CURRENT ASSETS AND DISPOSAL GROUP CLASSIFIED AS HELD FOR SALE Non-current assets and disposal group classifi ed as held for sale are measured at the lower of their carrying amount
and fair value less costs to sell. Non-current assets and disposal group are classifi ed as held for sale if their carrying amounts will be recovered principally through a sale transaction rather than through continuing use. This condition is regarded as met only when the sale is highly probable and the asset or disposal group is available for immediate sale in its present condition. Management must be committed to the sale, which should be expected to qualify for recognition as a completed sale within one year from the date of classifi cation.
Upon classifi cation as held for sale, non-current assets are not depreciated or amortised and equity accounting for investment in associate shall discontinue.
2.18 DEVELOPMENT PROPERTIES FOR SALE
Development properties are properties acquired or being constructed for sale in the ordinary course of business, rather than to be held for the Group’s own use, rental or capital appreciation.
Development properties are measured at the lower of cost plus, where appropriate, a portion of attributable profi t, and estimated net realisable value, net of progress billings.
The costs of development properties include:– Freehold and leasehold rights for land;– Amount paid to contractors for construction; and – Borrowing costs, planning and design costs, costs of site preparation, professional fees for legal services,
property transfer taxes, construction overheads and other related costs.
Non-refundable commissions paid to sales or marketing agents on the sale of real estate units are expensed when paid.
Net realisable value is the estimated selling price in the ordinary course of business, based on market prices at the end of the reporting period and discounted for the time value of money if material, less the estimated costs of completion and the estimated costs necessary to make the sale.
The costs of development properties recognised in profi t or loss on disposal are determined with reference to the specifi c costs incurred on the property sold and an allocation of any non-specifi c costs based on the relative size of the property sold.

72 TRANSFORMATION
NOTES TO THE FINANCIAL STATEMENTSFor the Financial Year Ended 31 December 2011
2 SUMMARY OF SIGNIFICANT ACCOUNTING POLICIES (cont’d)
2.19 INVENTORIES
Inventories are stated at the lower of cost and net realisable value.
Cost of trading inventory of refi ned tin metal is determined on a fi rst-in fi rst-out basis. Cost of inventories of tin-in-concentrates and tin-in-process which have matching sales contract for refi ned tin metal from tin smelting operations, are stated at the value of such contract less allowance for conversion. This value is consistent with cost, as it is the practice of tin smelting operations of the subsidiary to buy tin-in-concentrates and sell refi ned tin metal on a back to back price basis.
Absorption costing is used in the mining operations to assign costs to tin inventories using the weighted average cost method which includes both variable and fi xed overhead cost components. The cost of purchased tin-in-concentrates prior to processing comprises cost of purchase.
Cost of other inventories comprising stores, spares, fuels and saleable by-products is determined on the weighted average cost method. Production cost is not allocated to by-products as it is not material.
Where necessary, allowance is provided for damaged, obsolete and slow moving items to adjust the carrying value of inventories to the lower of cost and net realisable value.
Net realisable value is the estimated selling price in the ordinary course of business less the estimated costs of completion and the estimated costs necessary to make the sale.
2.20 TRADE AND OTHER RECEIVABLES
Trade and other receivables, including amounts due from subsidiaries, associates, related companies and loans to related companies are classifi ed and accounted for as loans and receivables. When loans and receivables are recognised initially, they are measured at fair value. Subsequent to initial recognition, loans and receivables are measured at amortised cost using the effective interest method, less impairment. Gains and losses are recognised in profi t or loss when the loans and receivables are derecognised or impaired, and through the amortisation process.
Trade and other receivables are recognised and carried at original invoice amounts less allowances for any uncollectible amounts. Allowance is made when there is objective evidence that the Group will not be able to collect the debts. Bad debts are written off when identifi ed.
Receivables from related parties are carried at cost, less an allowance for any uncollectible amount.
The carrying amount of trade receivables impaired by credit losses is reduced through the use of an allowance account unless on the date the impairment loss is recognised, the Group ascertains the amount to be uncollectible whereby it would be reduced directly. In subsequent periods when a trade receivable is ascertained to be uncollectible, it is written off against the allowance account.
Signifi cant fi nancial diffi culties of the debtor, probability that the debtor will enter bankruptcy, and default or signifi cant delay in payments are objective evidence that the trade receivable is impaired.

73THE STRAITS TRADING COMPANY LIMITED ANNUAL REPORT 2011
NOTES TO THE FINANCIAL STATEMENTSFor the Financial Year Ended 31 December 2011
2 SUMMARY OF SIGNIFICANT ACCOUNTING POLICIES (cont’d)
2.21 CASH AND CASH EQUIVALENTS
Cash and cash equivalents comprise cash at bank and on hand, and short-term deposits that are readily convertible to cash and which are not subject to a signifi cant risk of changes in value. These also include bank overdrafts that form an integral part of the Group’s cash management.
Cash and short-term deposits carried in the balance sheets are classifi ed and accounted for as loans and receivables as described in note 2.20.
2.22 IMPAIRMENT OF ASSETS
(a) NON-FINANCIAL ASSETS
An assessment is made at each reporting date to determine whether there is an indication that an asset may be impaired. If any such indication exists, or when annual impairment testing for an asset is required, the estimated recoverable amount of that asset is determined.
Where the carrying amount of an asset or cash-generating unit exceeds its recoverable amount, the asset is considered impaired and is written down to its recoverable amount. Impairment losses of continuing operations are recognised in the profi t or loss except for assets that are previously revalued where the revaluation was taken to other comprehensive income. In this case, the impairment is also recognised in other comprehensive income up to the amount of any previous revaluation.
Calculation of recoverable amount An asset’s recoverable amount is the higher of an asset’s or cash-generating unit’s fair value less costs to
sell and its value in use and is determined on an individual asset basis. If the asset does not generate cash infl ows that are largely independent of those from other assets or groups of assets, the recoverable amount is determined for the cash-generating unit to which the asset belongs to. In assessing value in use, the estimated future cash fl ows expected to be generated by the asset are discounted to their present value using a pre-tax discount rate that refl ects current market assessments of the time value of money and the risks specifi c to the asset. In determining fair value less costs to sell, recent market transactions are taken into account, if available. If no such transactions can be identifi ed, an appropriate valuation model is used. These calculations are corroborated by valuation multiples, quoted share prices for publicly traded subsidiaries or other available fair value indicators.
Reversal of impairment For assets excluding goodwill, an assessment is made at each reporting date as to whether there is any
indication that previously recognised impairment losses may no longer exist or may have decreased. If such indication exists, the Group estimates the asset’s or cash-generating unit’s recoverable amount. A previously recognised impairment loss is reversed only if there has been a change in the estimates used to determine the asset’s recoverable amount since the last impairment loss was recognised. If that is the case, the carrying amount of the asset is increased to its recoverable amount. That increase cannot exceed the carrying amount that would have been determined, net of depreciation, had no impairment loss been recognised previously. Such reversal is recognised in profi t or loss unless the asset is measured at revalued amount, in which case the reversal is treated as a revaluation increase.

74 TRANSFORMATION
NOTES TO THE FINANCIAL STATEMENTSFor the Financial Year Ended 31 December 2011
2 SUMMARY OF SIGNIFICANT ACCOUNTING POLICIES (cont’d)
2.22 IMPAIRMENT OF ASSETS (cont’d)
(a) NON-FINANCIAL ASSETS (cont’d)
Goodwill For the purpose of impairment testing of goodwill, goodwill acquired in a business combination is, from the
acquisition date, allocated to each of the Group’s cash-generating units that are expected to benefi t from synergies of the combination, irrespective of whether other assets or liabilities of the acquiree are assigned to those units.
The cash generating unit to which goodwill has been allocated is tested for impairment annually and whenever there is an indication that the cash-generating unit may be impaired. Impairment is determined for goodwill by assessing the recoverable amount of each cash-generating unit (or group of cash-generating units) to which the goodwill relates. Where the recoverable amount of the cash-generating unit is less than the carrying amount, an impairment loss is recognised in profi t or loss. Impairment losses recognised for goodwill are not reversed in subsequent periods.
(b) FINANCIAL ASSETS The Group assesses at the end of each reporting period whether there is any objective evidence that a fi nancial
asset or group of fi nancial assets is impaired.
i) Financial assets carried at amortised cost
For fi nancial assets carried at amortised cost, the Group fi rst assesses whether objective evidence of impairment exists individually for fi nancial assets that are individually signifi cant, or collectively for fi nancial assets that are not individually signifi cant. If the Group determines that no objective evidence of impairment exists for an individually assessed fi nancial asset, whether signifi cant or not, it includes the asset in a group of fi nancial assets with similar credit risk characteristics and collectively assesses them for impairment. Assets that are individually assessed for impairment and for which an impairment loss is, or continues to be recognised are not included in a collective assessment of impairment.
If there is objective evidence that an impairment loss on fi nancial assets carried at amortised cost has incurred, the amount of the loss is measured as the difference between the asset’s carrying amount and the present value of estimated future cash fl ows discounted at the fi nancial asset’s original effective interest rate. If a loan has a variable interest rate, the discount rate for measuring any impairment loss is the current effective interest rate. The carrying amount of the asset is reduced through the use of an allowance account. The impairment loss is recognised in the profi t or loss.
When the assets become uncollectible, the carrying amount of impaired fi nancial asset is reduced directly or if an amount was charged to the allowance account, the amounts charged to the allowance account are written off against the carrying value of the fi nancial asset.
To determine whether there is objective evidence that an impairment loss on fi nancial assets has incurred, the Group considers factors such as the probability of insolvency or signifi cant fi nancial diffi culties of the debtor and default or signifi cant delay in payments.

75THE STRAITS TRADING COMPANY LIMITED ANNUAL REPORT 2011
NOTES TO THE FINANCIAL STATEMENTSFor the Financial Year Ended 31 December 2011
2 SUMMARY OF SIGNIFICANT ACCOUNTING POLICIES (cont’d)
2.22 IMPAIRMENT OF ASSETS (cont’d)
(b) FINANCIAL ASSETS (cont’d)
i) Financial assets carried at amortised cost (cont’d)
Reversal of impairment If in a subsequent period, the amount of the impairment loss decreases and the decrease can be related
objectively to an event occurring after the impairment was recognised, the previously recognised impairment loss is reversed to the extent that the carrying value of the asset does not exceed its amortised cost at the reversal date. The amount of reversal is recognised in profi t or loss.
ii) Financial assets carried at cost
If there is objective evidence (such as signifi cant adverse changes in the business environment where the issuer operates, probability of insolvency or signifi cant fi nancial diffi culties of the issuer) that an impairment loss on fi nancial assets carried at costs has been incurred, the amount of the loss is measured as the difference between the asset’s carrying amount and the present value of estimated future cash fl ows discounted at the current market rate of return for a similar fi nancial asset.
Reversal of impairment Such impairment losses are not reversed in subsequent periods.
iii) Available-for-sale fi nancial assets
In the case of equity investments classifi ed as available-for-sale, objective evidence of impairment include (i) signifi cant fi nancial diffi culty of the issuer or obligor, (ii) information about signifi cant changes with an adverse effect that have taken place in the technological, market, economic or legal environment in which the issuer operates, and indicates that the cost of the investment in equity instrument may not be recovered; and (iii) a signifi cant or prolonged decline in the fair value of the investment below its costs. ‘Signifi cant’ is to be evaluated against the original cost of the investment and ‘prolonged’ against the period in which the fair value has been below its original cost.
If an available-for-sale fi nancial asset is impaired, an amount comprising the difference between its
acquisition cost (net of any principal repayment and amortisation) and its current fair value, less any impairment loss previously recognised in profi t or loss is transferred from other comprehensive income and recognised in profi t or loss.
In the case of debt instruments classifi ed as available-for-sale, impairment is assessed based on the same
criteria as fi nancial assets carried at amortised cost. However, the amount recorded for impairment is the cumulative loss measured as the difference between the amortised cost and the current fair value, less any impairment loss on that investment previously recognised in profi t or loss. Future interest income continues to be accrued based on the reduced carrying amount of the asset, using the rate of interest used to discount the future cash fl ows for the purpose of measuring the impairment loss. The interest income is recorded as part of fi nance income.

76 TRANSFORMATION
NOTES TO THE FINANCIAL STATEMENTSFor the Financial Year Ended 31 December 2011
2 SUMMARY OF SIGNIFICANT ACCOUNTING POLICIES (cont’d)
2.22 IMPAIRMENT OF ASSETS (cont’d)
(b) FINANCIAL ASSETS (cont’d)
iii) Available-for-sale fi nancial assets (cont’d)
Reversal of impairmentReversals of impairment losses in respect of equity instruments are not recognised in profi t or loss; increase in their fair value after impairment are recognised directly in other comprehensive income.
For debt instrument, if, in a subsequent year, the fair value of a debt instrument increases and the increases can be objectively related to an event occurring after the impairment loss was recognised in profi t or loss, the impairment loss is reversed in profi t or loss.
2.23 INTEREST-BEARING LOANS AND BORROWINGS
All loans and borrowings are initially recognised at the fair value of the consideration received less directly attributable transaction costs.
After initial recognition, interest-bearing loans and borrowings are subsequently measured at amortised cost using the effective interest method.
Gains and losses are recognised in profi t or loss when the liabilities are derecognised, and through the amortisation process.
2.24 BORROWING COSTS
Borrowing costs are capitalised as part of the cost of a qualifying asset if they are directly attributable to the acquisition, construction or production of that asset. Capitalisation of borrowing costs commences when the activities to prepare the asset for its intended use or sale are in progress and the expenditures and borrowing costs are being incurred. Borrowing costs are capitalised until the assets are substantially completed for their intended use or sale. All other borrowing costs are expensed in the period they occur. Borrowing costs consist of interest and other costs that an entity incurs in connection with the borrowing of funds.
2.25 TRADE AND OTHER PAYABLES
Trade and other payables are recognised initially at fair value plus directly attributable transaction costs.
After initial recognition, trade and other payables are subsequently measured at amortised cost using the effective interest rate method. Gains and losses are recognised in profi t or loss when the liabilities are derecognised, and through the amortisation process.

77THE STRAITS TRADING COMPANY LIMITED ANNUAL REPORT 2011
NOTES TO THE FINANCIAL STATEMENTSFor the Financial Year Ended 31 December 2011
2 SUMMARY OF SIGNIFICANT ACCOUNTING POLICIES (cont’d)
2.26 PROVISIONS
Provisions are recognised when the Group has a present obligation (legal or constructive) as a result of a past event, it is probable that an outfl ow of economic resources will be required to settle the obligation and the amount of obligation can be estimated reliably.
Provisions are reviewed at the end of each reporting period and adjusted to refl ect the current best estimate. If it is no longer probable that an outfl ow of economic resources will be required to settle the obligation, the provision is reversed.
If the effect of the time value of money is material, provisions are discounted using a current pre-tax rate that refl ects, where appropriate, the risks specifi c to the liability. When discounting is used, the increase in the provision due to the passage of time is recognised as fi nance costs.
2.27 SHARE-BASED PAYMENT TRANSACTIONS
(a) PHANTOM SHARE PLAN
Under the Phantom Share Plan (PSP), Group Executives who have attained the age of twenty-one (21) years and who hold the rank of manager and above or such rank as may be designated from time to time, shall be eligible to participate in the Plan. Grantees are granted a notional number of Shares (Phantom Shares) calculated by dividing the Non-Cash Bonus with the Value of a Share which is measured initially at fair value at the Grant Date pursuant to the Plan taking into account the terms and conditions upon which the Phantom Shares were granted. No Shares will be allotted and issued and Grantees of the plan are not entitled to, and have no voting rights or interest in the Shares of the Company.
A Grantee shall be entitled to redeem, and shall redeem, one-third (and not less) of each Grant of Phantom Shares on the First Redemption Date, Second Redemption Date and Final Redemption Date of the Grant Date relating to that Grant. If the Phantom Shares which a Grantee is entitled to redeem on a Redemption Date is not redeemed, such Phantom Shares which are not redeemed shall be carried forward and added to the number of Phantom Shares redeemable on the next Redemption Date. Until the liability is settled, it is remeasured at each reporting date and fair value is expensed over the period till vesting with recognition of a corresponding liability. Any Phantom Shares relating to a Grant which are not redeemed on the Final Redemption Date shall be forfeited and the Grantee shall have no claim whatsoever against the Group in respect of the Phantom Shares so forfeited.
Upon redemption, the Group shall pay to the Grantee an amount in cash equal to the Value of the Share on the relevant Redemption Date which is based on the volume-weighted average price of a Share of its share listed on the Singapore Exchange Securities Trading Limited (SGX-ST) over the fi ve (5) immediately preceding Trading Days on the Redemption Date, provided always that the Group shall not pay, in respect of each redemption more than three times the Value of a Share or less than 80 per cent of the Value of the Share on the Grant Date of that Phantom Share which is the subject of redemption. Details are disclosed in note 6.

78 TRANSFORMATION
NOTES TO THE FINANCIAL STATEMENTSFor the Financial Year Ended 31 December 2011
2 SUMMARY OF SIGNIFICANT ACCOUNTING POLICIES (cont’d)
2.27 SHARE-BASED PAYMENT TRANSACTIONS (cont’d)
(b) A SUBSIDIARY IN AUSTRALIA HAS PROVIDED SHARE-BASED COMPENSATION BENEFITS TO ITS DIRECTORS AND COMPANY SECRETARY
When the subsidiary issues share options for the provision of services received, an expense is recognised in profi t or loss for the cost of the options, with a corresponding increase recognised in equity in the share option reserve, over the vesting period of the options. Where the options issued vest immediately upon grant (and hence there is no vesting period), the expense and corresponding increase in equity are recognised immediately.
Cost is measured with reference to the fair value of the options issued at the date of grant. In valuing options, no account is taken of any performance conditions, other than conditions linked to the price of the share of the subsidiary (market conditions), if applicable. At the end of each reporting period, the subsidiary revises its estimate of the number of options that are expected to become vested. The expense recognised each period takes into account the most recent estimate.
Upon the exercise of options, the balance of the share option reserve relating to those options is transferred to share capital.
The market value of shares issued to certain directors as a component of remuneration for no cash consideration is recognised as an expense, with a corresponding increase in equity when these directors become entitled to the shares.
2.28 EMPLOYEE BENEFITS
(a) DEFINED CONTRIBUTION PLAN
The Group participates in the national pension schemes as defi ned by the laws of the countries in which it has operations. In particular, the Singapore companies in the Group make contributions to the Central Provident Fund Scheme in Singapore, a defi ned contribution pension scheme. Contributions to defi ned contribution pension schemes are recognised as an expense in the period in which the related service is performed.
(b) EMPLOYEE LEAVE ENTITLEMENT
Employee entitlements to annual leave are recognised as a liability when they accrue to employees. The estimated liability for leave is recognised for services rendered by employees up to the end of the reporting period.
(c) SEVERANCE BENEFITS
The subsidiaries in Indonesia operate a partly funded, Severance Benefi ts Scheme (“the Scheme”) for their eligible employees. The subsidiaries’ obligation under the Scheme, calculated using the Projected Unit Credit Method, is determined based on actuarial computations by independent actuaries, through which the amount of benefi ts that employees have earned in return for their service in the current and prior years is estimated. That benefi t is discounted in order to determine its present value.

79THE STRAITS TRADING COMPANY LIMITED ANNUAL REPORT 2011
NOTES TO THE FINANCIAL STATEMENTSFor the Financial Year Ended 31 December 2011
2 SUMMARY OF SIGNIFICANT ACCOUNTING POLICIES (cont’d)
2.28 EMPLOYEE BENEFITS (cont’d)
(c) SEVERANCE BENEFITS (cont’d)
Actuarial gains and losses are recognised as income or expense over the expected average remaining working lives of eligible employees when the cumulative unrecognised actuarial gains or losses for the Scheme exceed 10% of the present value of the defi ned benefi t obligation. Past service costs are recognised immediately to the extent that the benefi ts are already vested, and otherwise are amortised on a straight-line basis over the average period until the amended benefi ts become vested.
The amount recognised in the balance sheet represents the present value of the defi ned benefi t obligations adjusted for unrecognised actuarial gains and losses and unrecognised past service cost. Any asset resulting from this calculation is limited to the net total of any unrecognised actuarial losses and past service cost.
(d) TERMINATION BENEFITS
Termination benefi ts are payable when employment is terminated before the normal retirement date or whenever an employee accepts voluntary redundancy in exchange for these benefi ts. Termination benefi ts is recognised when it is demonstrably committed to either terminate the employment of current employees according to a detailed plan without possibility of withdrawal; or providing termination benefi ts as a result of an offer made to encourage voluntary redundancy. In the case of an offer made to encourage voluntary redundancy, the measurement of termination benefi ts is based on the number of employees expected to accept the offer. Benefi ts falling due more than 12 months after reporting date are discounted to present value.
2.29 LEASES
The determination of whether an arrangement is, or contains a lease is based on the substance of the arrangement at inception date: whether fulfi llment of the arrangement is dependent on the use of a specifi c asset or assets or the arrangement conveys a right to use the asset. For arrangements entered into prior to 1 January 2005, the date of inception is deemed to be 1 January 2005 in accordance with the transitional requirements of INT FRS 104.
(a) WHERE THE GROUP IS THE LESSEE
Leases where the lessor effectively retains substantially all the risks and benefi ts of ownership of the leased item are classifi ed as operating leases. Operating lease payments (net of any incentives received from the lessor) are recognised as an expense in profi t or loss on a straight-line basis over the lease term. Contingent rents are recognised as an expense in profi t or loss in the fi nancial year in which they are incurred.
Profi t or loss on sale and leaseback transactions which constitute operating leases are recognised immediately in profi t or loss when such sale and leaseback transactions are established at fair value. If the sale price is below fair value, any profi t or loss shall be recognised immediately except that, if the loss is compensated for by future lease payments at below market price, it shall be deferred and amortised in proportion to the lease payments over the period for which the asset is expected to be used. If the sale price is above fair value, the excess over fair value shall be deferred and amortised over the period for which the asset is expected to be used.

80 TRANSFORMATION
NOTES TO THE FINANCIAL STATEMENTSFor the Financial Year Ended 31 December 2011
2 SUMMARY OF SIGNIFICANT ACCOUNTING POLICIES (cont’d)
2.29 LEASES (cont’d)
(b) WHERE THE GROUP IS THE LESSOR
Assets leased out under operating leases are included in property, plant and equipment, investment properties and completed development properties for sale.
Rental income from operating leases (net of any incentives given to lessees) is recognised in profi t or loss on a straight-line basis over the lease term.
Initial direct costs incurred by the Group in negotiating and arranging an operating lease are added to the carrying amount of the leased asset and recognised as an expense in profi t or loss over the lease term on the same basis as the lease income.
Contingent rents are recognised as income in profi t or loss in the fi nancial year in which they are earned.
(c) WHERE THE GROUP IS THE LESSOR FOR SUB-LEASE AGREEMENT
Rental income from operating leases (net of any incentives given to lessees) is recognised in profi t or loss on a straight-line-basis over the lease term.
Contingent rents are recognised as income in profi t or loss in the fi nancial year in which they are earned.
2.30 INCOME RECOGNITION
Revenue is recognised to the extent that it is probable that the economic benefi ts will fl ow to the Group and the revenue can be reliably measured, regardless of when the payment is made. Revenue is measured at the fair value of consideration received or receivable, taking into account contractually defi ned terms of payment and excluding discounts, rebates, and taxes or duty.
Interest income is recognised as interest accrues (using the effective interest method) unless collectibility is in doubt.
Revenue from sale and delivery of refi ned tin metal and by-products is recognised upon transfer of signifi cant risks and rewards of ownership to the buyer. Revenue is not recognised to the extent where there are signifi cant uncertainties regarding recovery of the consideration due, associated costs or the possible return of goods.
Revenue from tin warrant and other service charges are recognised upon performance of services.
Room income as well as management fee are recognised on an accrual basis.
Food and beverage income is recognised upon sale.
Rental income is accounted for on a straight-line basis over the lease terms. The aggregate costs of incentives provided to lessees are recognised as a reduction of rental income over the lease term on a straight-line basis.
Profi ts from sale of completed properties and marketable securities are recognised upon conclusion of the contract for sale.
Dividend income from investments is recognised when the Group’s right to receive payment is established.

81THE STRAITS TRADING COMPANY LIMITED ANNUAL REPORT 2011
NOTES TO THE FINANCIAL STATEMENTSFor the Financial Year Ended 31 December 2011
2 SUMMARY OF SIGNIFICANT ACCOUNTING POLICIES (cont’d)
2.30 INCOME RECOGNITION (cont’d)
Revenue from sale of properties in the course of developmentWhere property is under development and agreement has been reached to sell such property when construction is complete, the Directors consider whether the contract comprises:
– A contract to construct a property; or– A contract for sale of a completed property.
(a) Where a contract is judged to be for construction of a property, revenue is recognised using the percentage of completion method as construction progresses.
(b) Where the contract is judged to be for the sale of completed property, revenue is recognised when the signifi cant risks and rewards of ownership of the real estate have been transferred to the buyer (i.e. revenue is recognised using the completed contract method).
i) If, however, the legal terms of the contract are such that the construction represents the continuous transfer of work in progress to the purchaser, the percentage of completion method of revenue recognition is applied and revenue is recognised as work progresses.
ii) In Singapore context, INT FRS 115 includes an accompanying note on application of INT FRS 115 in Singapore which requires the percentage of completion method of revenue recognition to be applied to sale of private residential properties in Singapore prior to completion of the properties that are regulated under the Singapore Housing Developers (Control and Licensing) Act (Chapter 130) and uses the standard form of sale and purchase agreements (“SPAs”) prescribed in the Housing Developers Rules. The accompanying note to INT FRS 115 does not address the accounting treatment for other SPAs, including SPAs with a Deferred Payment Scheme feature in Singapore.
In the above situations (i) and (ii), the percentage of work completed is measured based on the costs incurred up until the end of the reporting period as a proportion of total costs expected to be incurred.
2.31 TAXES
(a) CURRENT INCOME TAX
Current income tax assets and liabilities for the current and prior periods are measured at the amount expected to be recovered from or paid to the taxation authorities. The tax rates and tax laws used to compute the amount are those that are enacted or substantively enacted by the end of the reporting period, in the countries where the Group operates and generates taxable income.
Current income taxes are recognised in profi t or loss except to the extent that the tax relates to items recognised outside profi t or loss, either in other comprehensive income or directly in equity. Management periodically evaluates positions taken in the tax returns with respect to situations in which applicable tax regulations are subject to interpretation and establishes provisions where appropriate.

82 TRANSFORMATION
NOTES TO THE FINANCIAL STATEMENTSFor the Financial Year Ended 31 December 2011
2 SUMMARY OF SIGNIFICANT ACCOUNTING POLICIES (cont’d)
2.31 TAXES (cont’d)
(b) DEFERRED TAX
Deferred tax is provided using the liability method on temporary differences at the end of the reporting period between the tax bases of assets and liabilities and their carrying amounts for fi nancial reporting purposes.
Deferred tax liabilities are recognised for all temporary differences, except:
• Where the deferred tax liability arises from the initial recognition of goodwill or of an asset or liability in a transaction that is not a business combination and, at the time of the transaction, affects neither the accounting profi t nor taxable profi t or loss; and
• In respect of taxable temporary differences associated with investments in subsidiaries, associates and interests in joint ventures, where the timing of the reversal of the temporary differences can be controlled and it is probable that the temporary differences will not reverse in the foreseeable future.
Deferred tax assets are recognised for all deductible temporary differences, carry forward of unused tax credits and unused tax losses, to the extent that it is probable that taxable profi t will be available against which the deductible temporary differences and the carry forward of unused tax credits and unused tax losses can be utilised except:
• Where the deferred tax asset relating to the deductible temporary difference arises from the initial recognition of an asset or liability in a transaction that is not a business combination and, at the time of the transaction, affects neither the accounting profi t nor taxable profi t or loss; and
• In respect of deductible temporary differences associated with investments in subsidiaries, associates and interests in joint ventures, deferred tax assets are recognised only to the extent that it is probable that the temporary differences will reverse in the foreseeable future and taxable profi t will be available against which the temporary differences can be utilised.
The carrying amount of deferred tax assets is reviewed at the end of each reporting period and reduced to the extent that it is no longer probable that suffi cient taxable profi t will be available to allow all or part of the deferred tax asset to be utilised. Unrecognised deferred tax assets are reassessed at the end of each reporting period and are recognised to the extent that it has become probable that future taxable profi t will allow the deferred tax asset to be recovered.
Deferred tax assets and liabilities are measured at the tax rates that are expected to apply in the year when the asset is realised or the liability is settled, based on tax rates (and tax laws) that have been enacted or substantively enacted at the end of the reporting period.
Deferred tax relating to items recognised outside profi t or loss is recognised outside profi t or loss. Deferred tax items are recognised in correlation to the underlying transaction either in other comprehensive income or directly in equity and deferred tax arising from a business combination is adjusted against goodwill on acquisition.

83THE STRAITS TRADING COMPANY LIMITED ANNUAL REPORT 2011
NOTES TO THE FINANCIAL STATEMENTSFor the Financial Year Ended 31 December 2011
2 SUMMARY OF SIGNIFICANT ACCOUNTING POLICIES (cont’d)
2.31 TAXES (cont’d)
(b) DEFERRED TAX (cont’d)
Deferred tax assets and deferred tax liabilities are offset, if a legally enforceable right exists to set off current income tax assets against current income tax liabilities and the deferred taxes relate to the same taxable entity and the same taxation authority.
Tax benefi ts acquired as part of a business combination, but not satisfying the criteria for separate recognition at that date, would be recognised subsequently if new information about facts and circumstances changed. The adjustment would either be treated as a reduction to goodwill (as long as it does not exceed goodwill) if it is incurred during the measurement period or in profi t or loss.
(c) GOODS AND SERVICES TAX
Revenues, expenses and assets are recognised net of the amount of goods and services tax except:
• Where the goods and services tax incurred on a purchase of assets or services is not recoverable from the taxation authority, in which case the goods and services tax is recognised as part of the cost of acquisition of the asset or as part of the expense item as applicable; and
• Receivables and payables that are stated with the amount of goods and services tax included.
The net amount of goods and services tax recoverable from, or payable to, the taxation authority is included as part of receivables or payables in the balance sheet.
2.32 DERIVATIVE FINANCIAL INSTRUMENTS AND HEDGING
The Group uses derivative fi nancial instruments such as forward currency contracts, forward tin sales contracts and interest rate swap agreements to hedge its risks associated with foreign currency, tin price and interest rate fl uctuations. It is not the Group’s policy to trade in derivative fi nancial instruments. Details of the Group’s fi nancial risk management objectives and policies are set out separately in note 39 to the fi nancial statements.
These derivative fi nancial instruments are initially recognised at fair value on the date on which the derivative contract is entered into and are subsequently remeasured at fair value. Such derivative fi nancial instruments are carried as assets when the fair value is positive and as liabilities when the fair value is negative. Any gain or loss arising from the changes in fair value on derivative fi nancial instruments that do not qualify for hedge accounting is taken directly to profi t or loss.
The fair value of forward currency and forward tin sales contracts are calculated by reference to current forward exchange rates and forward tin price respectively for contracts with similar maturity profi les. The fair value of interest rate swap agreements is determined by reference to market values for similar instruments.

84 TRANSFORMATION
NOTES TO THE FINANCIAL STATEMENTSFor the Financial Year Ended 31 December 2011
2 SUMMARY OF SIGNIFICANT ACCOUNTING POLICIES (cont’d)
2.32 DERIVATIVE FINANCIAL INSTRUMENTS AND HEDGING (cont’d)
At the inception of a hedge relationship, the Group formally designates and documents the hedge relationship to which the Group wishes to apply hedge accounting and the risk management objective and strategy for undertaking the hedge. The documentation includes identifi cation of the hedging instrument, the hedged item or transaction, the nature of the risk being hedged and how the entity will assess the effectiveness of changes in the hedging instrument’s fair value in offsetting the exposure to changes in the hedged item’s fair value or cash fl ows attributable to the hedged risk. Such hedges are expected to be highly effective in achieving offsetting changes in fair value or cash fl ows and are assessed on an ongoing basis to determine that they actually have been highly effective throughout the fi nancial reporting periods for which they were designated.
Hedges which qualify for hedge accounting are accounted for as follows:
(a) FAIR VALUE HEDGES
Fair value hedges are hedges of the Group’s exposure to changes in fair value of a recognised asset or liability or an unrecognised fi rm commitment, or an identifi ed portion of such an asset, liability or fi rm commitment, that is attributable to a particular risk and could affect profi t or loss. For fair value hedges, the carrying amount of the hedged item is adjusted for gains and losses attributable to the risk being hedged, the derivative is remeasured at fair value and gains and losses from both are taken to profi t or loss.
The Group discontinues fair value hedge accounting if the hedging instrument expires or is sold, terminated or exercised, the hedge no longer qualifi es for hedge accounting or the Group revokes the designation.
(b) CASH FLOW HEDGES
Cash fl ow hedges are hedges of the Group’s exposure to variability in cash fl ows that is attributable to a particular risk associated with a recognised asset or liability or a highly probable forecast transaction and could affect profi t or loss. The portion of the gain or loss on the hedging instrument that is determined to be an effective hedge is recognised directly in other comprehensive income, while the ineffective portion is recognised in profi t or loss.
Amounts recognised in other comprehensive income are transferred to profi t or loss when the hedged transaction affects profi t or loss, such as when hedged fi nancial income or fi nancial expense is recognised or when a forecast sale or purchase occurs. When the hedged item is the cost of a non-fi nancial asset or liability, the amounts recognised in other comprehensive income are transferred to the initial carrying amount of the non-fi nancial asset or liability.
If the forecast transaction is no longer expected to occur, the cumulative gain or loss previously recognised in
equity are transferred to profi t or loss. If the hedging instrument expires or is sold, terminated or exercised, or if it’s designation as a hedge is revoked, any cumulative gain or loss previously recognised in other comprehensive income shall remain in equity until the forecast transaction affects profi t or loss.

85THE STRAITS TRADING COMPANY LIMITED ANNUAL REPORT 2011
NOTES TO THE FINANCIAL STATEMENTSFor the Financial Year Ended 31 December 2011
2 SUMMARY OF SIGNIFICANT ACCOUNTING POLICIES (cont’d)
2.32 DERIVATIVE FINANCIAL INSTRUMENTS AND HEDGING (cont’d)
(c) HEDGES OF A NET INVESTMENT
Hedges of a net investment in a foreign operation, including a hedge of a monetary item that is accounted for as part of the net investment, are accounted for in a way similar to cash fl ow hedges. On disposal of the foreign operation, the cumulative gain or loss previously recognised in other comprehensive income is transferred to profi t or loss.
2.33 FINANCIAL GUARANTEES
A fi nancial guarantee contract is a contract that requires the issuer to make specifi ed payments to reimburse the holder for a loss it incurs because a specifi ed debtor fails to make payment when due in accordance with the terms of a debt instrument.
Financial guarantees are initially recognised at fair value, adjusted for transaction costs that are directly attributable to the issuance of the guarantee. Subsequent to initial measurement, fi nancial guarantees are stated at the higher of the initial fair value less cumulative amortisation and the amount that would be recognised if they were accounted for as contingent liabilities. The amortisation of the fi nancial guarantee contracts to the profi t or loss is based on the period of the guarantee.
2.34 DERECOGNITION OF FINANCIAL ASSETS AND LIABILITIES
(a) FINANCIAL ASSETS
A fi nancial asset (or, where applicable a part of a fi nancial asset or part of a group of similar fi nancial assets) is derecognised where:
(i) The contractual right to receive cash fl ows from the assets has expired; (ii) The Group retains the contractual rights to receive cash fl ows from the asset, but has assumed an
obligation to pay them in full without material delay to a third party under a ‘pass-through’ arrangement; or
(iii) The Group has transferred its rights to receive cash fl ows from the asset and either has transferred substantially all the risks and rewards of the asset, or has neither transferred nor retained substantially all the risks and rewards of the asset, but has transferred control of the asset.
Where the Group has transferred its rights to receive cash fl ows from an asset and has neither transferred nor retained substantially all the risks and rewards of the asset nor transferred control of the asset, the asset is recognised to the extent of the Group’s continuing involvement in the asset. Continuing involvement that takes the form of a guarantee over the transferred asset is measured at the lower of the original carrying amount of the asset and the maximum amount of consideration that the Group could be required to repay. Where continuing involvement takes the form of a written and/or purchased option on the transferred asset, the extent of the Group’s continuing involvement is the amount of the transferred asset that the Group may repurchase, except that in the case of a written put option on an asset measured at fair value, the extent of the Group’s continuing involvement is limited to the lower of the fair value of the transferred asset and the option exercise price.

86 TRANSFORMATION
NOTES TO THE FINANCIAL STATEMENTSFor the Financial Year Ended 31 December 2011
2 SUMMARY OF SIGNIFICANT ACCOUNTING POLICIES (cont’d)
2.34 DERECOGNITION OF FINANCIAL ASSETS AND LIABILITIES (cont’d)
(a) FINANCIAL ASSETS (cont’d)
On derecognition of a fi nancial asset in its entirety, the difference between the carrying amount and the sum of the consideration received and any cumulative gain or loss that has been recognised in other comprehensive income is recognised in profi t or loss.
(b) FINANCIAL LIABILITIES
A fi nancial liability is derecognised when the obligation under the liabilities is discharged or cancelled or expires.
When an existing fi nancial liability is replaced by another from the same lender on substantially different terms,
or the terms of an existing liability are substantially modifi ed, such an exchange or modifi cation is treated as a derecognition of the original liability and the recognition of a new liability, and the difference in the respective carrying amounts is recognised in profi t or loss.
2.35 GOVERNMENT GRANTS
Government grants are recognised at their fair value where there is reasonable assurance that the grant will be received and all attaching conditions will be complied with. Where the grant relates to an asset, the fair value is recognised as deferred capital grant on the balance sheet and is amortised to profi t or loss over the expected useful life of the relevant asset by equal annual instalments.
Government grant shall be recognised in profi t or loss on a systematic basis over the periods in which the entity recognises as expenses the related costs for which the grants are intended to compensate. Grants related to income may be presented as a credit in profi t or loss, either separately or under a general heading such as “Other income”. Alternatively, they are deducted in reporting the related expenses.
2.36 CONTINGENCIES
A contingent liability is:
(a) a possible obligation that arises from past events and whose existence will be confi rmed only by the occurrence or non-occurrence of one or more uncertain future events not wholly within the control of the Group; or
(b) a present obligation that arises from past events but is not recognised because:
(i) It is not probable that an outfl ow of resources embodying economic benefi ts will be required to settle the obligation; or
(ii) The amount of the obligation cannot be measured with suffi cient reliability.
A contingent asset is a possible asset that arises from past events and whose existence will be confi rmed only by the occurrence or non-occurrence of one or more uncertain future events not wholly within the control of the Group.
Contingent liabilities and assets are not recognised on the balance sheet of the Group, except for contingent liabilities assumed in a business combination that are present obligations and for which the fair values can be reliably determined.

87THE STRAITS TRADING COMPANY LIMITED ANNUAL REPORT 2011
NOTES TO THE FINANCIAL STATEMENTSFor the Financial Year Ended 31 December 2011
2 SUMMARY OF SIGNIFICANT ACCOUNTING POLICIES (cont’d)
2.37 RELATED PARTIES
A related party is defi ned as follows:
(a) A person or a close member of that person’s family is related to the Group and Company if that person:
(i) Has control or joint control over the Company;
(ii) Has signifi cant infl uence over the Company; or
(iii) Is a member of the key management personnel of the Group or Company or of a parent of the Company.
(b) An entity is related to the Group and the Company if any of the following conditions applies:
(i) The entity and the Company are members of the same group (which means that each parent, subsidiary and fellow subsidiary is related to the others);
(ii) One entity is an associate or joint venture of the other entity (or an associate or joint venture of a member of a group of which the other entity is a member);
(iii) Both entities are joint ventures of the same third party;
(iv) One entity is a joint venture of a third entity and the other entity is an associate of the third entity;
(v) The entity is a post-employment benefi t plan for the benefi t of employees of either the Company or an entity related to the Company;
(vi) The entity is controlled or jointly controlled by a person identifi ed in (a); or
(vii) A person identifi ed in (a) (i) has signifi cant infl uence over the entity or is a member of the key management personnel of the entity (or of a parent of the entity).
2.38 SEGMENT REPORTING
For management purposes, the Group is organised into operating segments based on their products and services which are independently managed by the respective segment chief executives responsible for the performance of the respective segments under their charge. The segment chief executives report directly to the chief operating decision maker of the Company who regularly reviews the segment results in order to allocate resources to the segments and to assess the segment performance. Additional disclosures on each of these segments are shown in note 44, including the factors used to identify the reportable segments and the measurement basis of segment information.

88 TRANSFORMATION
NOTES TO THE FINANCIAL STATEMENTSFor the Financial Year Ended 31 December 2011
3 PROPERTY REVENUE
Group2011 2010
$’000 $’000
Rental and related income 48,283 48,294Sale of development properties 33,821 4,466
82,104 52,760
4 DIVIDEND AND INTEREST INCOME
(a) Dividend Income
Group2011 2010$’000 $’000
Dividend income from:– Available-for-sale investment securities 4,611 5,081– Held-for-trading marketable securities – 1
4,611 5,082
(b) Interest Income
Group2011 2010$’000 $’000
Interest income from:– Deposits 2,609 1,247– Receivables 2,735 2,288– Others 756 46
6,100 3,581

89THE STRAITS TRADING COMPANY LIMITED ANNUAL REPORT 2011
NOTES TO THE FINANCIAL STATEMENTSFor the Financial Year Ended 31 December 2011
5 OTHER INCOME
Group2011 2010
$’000 $’000
Amortisation of deferred income 3,625 3,625Share of joint-operation loss – (1,139)Other operating income 3,965 3,779Net gain on disposal of investment properties 1,218 963Net gain on disposal/liquidation of subsidiaries and associates – 1,426Write back of unutilised upgrading contribution – 3,278Write back of provision for onerous contracts 1,404 –Fair value changes in fi nancial assets:– Held-for-trading marketable securities (4) 1– Derivatives 210 (239)– Ineffective portion of derivatives designated as hedging instruments
in cash fl ow hedge (206) 1,56910,212 13,263
6 EMPLOYEE BENEFITS EXPENSE
Group2011 2010
$’000 $’000
Wages, salaries and other allowances 94,228 93,794Grant from jobs credit scheme - (127)Severance benefi t (note 33) 3,975 3,598Defi ned contribution plans 3,350 3,176Share-based payments (51) (239)
101,502 100,202Less: Employee benefi ts expense capitalised in: – Investment properties undergoing development (note 14(d)) (67) (36) – Development properties for sale (note 24) (48) (8)
101,387 100,158

90 TRANSFORMATION
NOTES TO THE FINANCIAL STATEMENTSFor the Financial Year Ended 31 December 2011
6 EMPLOYEE BENEFITS EXPENSE (cont’d)
Phantom Share Plan (“PSP”)
Under the PSP, the share-based payments are calculated by dividing the Non-Cash Bonus with the Value of a Share which is measured initially at fair value at the Grant Date and remeasured at each reporting date, taking into account the terms and conditions upon which the Phantom Shares were granted. Phantom Shares can only be settled in cash. No Shares will be allotted and issued and participants of the plan are not entitled to, and have no voting rights or interest in the Shares of the Company. The contractual life of the Phantom Shares is 3 years.
If the Phantom Shares which a Grantee is entitled to redeem on a Redemption Date are not redeemed, such Phantom Shares which are not redeemed shall be carried forward and added to the number of Phantom Shares redeemable on the next Redemption Date. Any Phantom Shares relating to a Grant which are not redeemed on the Final Redemption Date shall be forfeited and the Grantee shall have no claim whatsoever against the Group in respect of the Phantom Shares so forfeited.
The number of Phantom Shares granted is as follows:
Grant DateBalance at
1.1.2011
No. ofPhantom Shares
RedeemedNo. of Phantom Shares Lapsed
Balance at31.12.2011
RedemptionPrice/Fair Value
FinalRedemption
Date
15.7.2008 12,505 (8,337) (4,168) – $3.81 15.7.2011
Share-based payments adjustment recognised in profi t or loss comprises an adjustment of $51,000 (2010: $239,000) under the PSP. The carrying amount of liability recognised in the Group’s balance sheet relating to such Phantom Shares at 31 December 2011 is nil (2010: $146,000).
7 IMPAIRMENT LOSSES
Group2011 2010
$’000 $’000
Impairment of investment in associates 5,284 41,146Impairment of mining assets – 23,884Impairment of plant and equipment (note 13(c)) 2,587 11,179Impairment of goodwill (note 15(a)) – 13,188Revaluation defi cit of properties 7,291 1,279Impairment of investment securities 6,802 404
21,964 91,080

91THE STRAITS TRADING COMPANY LIMITED ANNUAL REPORT 2011
NOTES TO THE FINANCIAL STATEMENTSFor the Financial Year Ended 31 December 2011
8 FINANCE COSTS
Group2011 2010
$’000 $’000
Interest on bank loans 16,668 15,486Interest on debt securities 1,378 –Interest cost from interest rate swap – 2,178Interest rate swap close-out costs – 3,198Fees incurred for credit facilities/debt securities 879 3,299Discount adjustment on provision (note 30) 53 52
18,978 24,213 Less: Interest expense capitalised in: – Investment properties undergoing development (note 14(e)) (410) – – Development properties for sale (note 24) (325) (332)
18,243 23,881
9 OTHER EXPENSES
Group2011 2010
$’000 $’000
Costs of development properties sold 26,055 3,634Upkeep and maintenance expenses of properties 20,730 17,172Accommodation, food and beverage expenses 29,041 26,390Operating lease expenses 49,306 49,359Property related taxes 7,065 7,125Marketing and distribution expenses 14,028 14,885Administrative expenses 21,807 28,988Provision for onerous contracts – 5,927Deferred exploration and evaluation expenditure written off (note 15(b)(ii)) – 1,140Impairment of doubtful receivables 6,376 1,546Bad debts written off 3,119 20Net loss on disposal of disposal group classifi ed as held for sale (note 23) 80 –Exchange losses/(gains) 1,912 (2,676)Other expenses 10,317 9,968
189,836 163,478

92 TRANSFORMATION
NOTES TO THE FINANCIAL STATEMENTSFor the Financial Year Ended 31 December 2011
10 PROFIT BEFORE TAX
Profi t before tax is stated after charging the following:
Group2011 2010
$’000 $’000
Audit fees: – Auditors of the Company 506 543– Other auditors 805 772Non-audit fees: – Auditors of the Company 686 257– Other auditors 425 701
2,422 2,273Loss on disposal of property, plant and equipment 281 4Property, plant and equipment written off 318 195
11 INCOME TAX EXPENSE
(a) Major components of income tax expense
The major components of income tax expense for the years ended 31 December 2011 and 2010 are:
Group2011 2010
$’000 $’000
(i) Consolidated income statement:
Current income tax– Current income taxation 27,065 18,354– Transfer to deferred tax (5,320) –– Under/(Over) provision in respect of prior years 332 (1,003)– Benefi ts from previously unrecognised tax losses (208) –
21,869 17,351
Deferred tax– Originating and reversal of temporary differences (5,633) 1,394– Transfer from current income tax 5,320 –– Under/(Over) provision in respect of prior years 2,297 (1,590)
(note 18) 1,984 (196)
Income tax expense recognised in profi t or loss 23,853 17,155

93THE STRAITS TRADING COMPANY LIMITED ANNUAL REPORT 2011
NOTES TO THE FINANCIAL STATEMENTSFor the Financial Year Ended 31 December 2011
11 INCOME TAX EXPENSE (cont’d)
(a) Major components of income tax expense (cont’d)
Group2011 2010
$’000 $’000
(ii) Statement of comprehensive income:
Deferred tax related to other comprehensive income
– Net change in revaluation surplus of property, plant and equipment 1,705 7,084– Net change in hedging reserve for derivatives designated as
hedging instruments in cash fl ow hedges (109) 1,270 1,596 8,354
(b) Relationship between tax expense and accounting profi t
The reconciliation between tax expense and the product of accounting profi t multiplied by the applicable statutory tax rate for the years ended 31 December 2011 and 2010 are as follows:
Group2011 2010
$’000 $’000
Profi t before tax 79,246 23,872Less: Share of results of equity-accounted associates and joint ventures * (10,451) (1,778)
68,795 22,094
Tax at statutory rate of 17% (2010: 17%) 11,695 3,756Effect of different tax rates in other countries 1,356 (6,889)Under/(Over) provision in respect of prior years 332 (1,003)Under/(Over) provision of deferred tax in respect of prior years 2,297 (1,590)Expenses/Losses not claimable 15,349 31,112Income not subject to tax (8,071) (14,958)Effect of partial tax exemption (184) (148)Deferred tax asset not recognised 1,021 6,575Utilisation of previously unrecognised tax losses (208) –Others 266 300
23,853 17,155
* These are presented net of tax in profi t or loss.

94 TRANSFORMATION
NOTES TO THE FINANCIAL STATEMENTSFor the Financial Year Ended 31 December 2011
11 INCOME TAX EXPENSE (cont’d)
(b) Relationship between tax expense and accounting profi t (cont’d)
Taxation for other jurisdictions is calculated at the rates prevailing in the respective jurisdictions. During the current fi nancial year, the income tax rate applicable to foreign subsidiaries are as follows:
2011 2010
Malaysia 25% 25%
Indonesia 25% and 30% 25% and 30%
Australia 30% 30%
During the fi nancial year, a subsidiary in Indonesia received various assessments for taxes and penalties for fi scal year 2008 from the tax offi ce indicating an underpayment of corporate income tax (“CIT”) of US$1,499,709 (instead of an overpayment of US$3,235,579 as reported in its 2008 annual income tax return) and an underpayment of withholding taxes and value added tax of US$1,625,983.
The subsidiary fi led an objection to the tax offi ce on 2 February 2012 and recognised an amount of US$1,052,632 as an additional tax expense (offset against the CIT overpayment of US$3,235,579 recorded in its 2008 annual income tax return) during the fi nancial year.
12 EARNINGS PER SHARE (cents)
The calculations of basic and diluted earnings per share are based on the profi t attributable to owners of the Company of $45,621,000 (2010: $28,169,000) and on 325,897,000 ordinary shares in issue.
There are no potential dilutive shares of the Company.

95THE STRAITS TRADING COMPANY LIMITED ANNUAL REPORT 2011
NOTES TO THE FINANCIAL STATEMENTSFor the Financial Year Ended 31 December 2011
13 PROPERTY, PLANT AND EQUIPMENT
PlantEquipment Capital
Freehold Leasehold Vehicles Work-In- MineLand Land Buildings Furniture Progress Restoration Total
$’000 $’000 $’000 $’000 $’000 $’000 $’000GROUP At valuationAt cost or valuationAt 1 January 2011 52,188 90,491 150,047 232,960 5,195 985 531,866Additions 1 58 202 16,399 14,435 – 31,095Disposals (82) – – (3,745) (1,027) – (4,854)Transfer – – 112 5,445 (5,557) – –Revaluation (defi cit)/surplus,
net (12,793) 65,098 (9,347) – – – 42,958Elimination of accumulated
depreciation on revaluation – (1,130) (6,435) – – – (7,565)Exchange adjustment (52) (4) 110 (95) (160) (24) (225)At 31 December 2011 39,262 154,513 134,689 250,964 12,886 961 593,275
Accumulated depreciation and impairment
At 1 January 2011 – – – 189,604 808 531 190,943Depreciation charge for the
year – 1,128 6,391 13,738 – 52 21,309Impairment charge (c) – – – 162 2,425 – 2,587Disposals – – – (3,383) (584) – (3,967)Elimination of accumulated
depreciation on revaluation – (1,130) (6,435) – – – (7,565)Exchange adjustment – 2 44 122 12 (14) 166At 31 December 2011 – – – 200,243 2,661 569 203,473
Net Carrying Amount
At 31 December 2011 39,262 154,513 134,689 50,721 10,225 392 389,802

96 TRANSFORMATION
NOTES TO THE FINANCIAL STATEMENTSFor the Financial Year Ended 31 December 2011
13 PROPERTY, PLANT AND EQUIPMENT (cont’d)
PlantEquipment Capital
Freehold Leasehold Vehicles Work-In- MineLand Land Buildings Furniture Progress Restoration Total
$’000 $’000 $’000 $’000 $’000 $’000 $’000GROUP At valuationAt cost or valuationAt 1 January 2010 57,814 59,738 138,074 225,304 1,931 770 483,631Additions – – 275 13,754 4,793 197 19,019Disposals – – – (2,862) – – (2,862)Transfer – – – 797 (797) – –Revaluation (defi cit)/surplus, net (8,101) 31,513 15,640 – – – 39,052Elimination of accumulated
depreciation on revaluation – (736) (6,103) – – – (6,839)Attributable to disposal group
classifi ed as held for sale (note 23) (21) – – (18) – – (39)
Exchange adjustment 2,496 (24) 2,161 (4,015) (732) 18 (96)At 31 December 2010 52,188 90,491 150,047 232,960 5,195 985 531,866
Accumulated depreciation and impairment
At 1 January 2010 – – – 169,971 435 192 170,598Depreciation charge for the year – 743 6,010 15,558 – 338 22,649Impairment charge (c) – – – 10,324 855 – 11,179Disposals – – – (2,573) – – (2,573)Elimination of accumulated
depreciation on revaluation – (736) (6,103) – – – (6,839)Attributable to disposal group
classifi ed as held for sale (note 23) – – – (15) – – (15)
Exchange adjustment – (7) 93 (3,661) (482) 1 (4,056)At 31 December 2010 – – – 189,604 808 531 190,943
Net Carrying Amount
At 31 December 2010 52,188 90,491 150,047 43,356 4,387 454 340,923

97THE STRAITS TRADING COMPANY LIMITED ANNUAL REPORT 2011
NOTES TO THE FINANCIAL STATEMENTSFor the Financial Year Ended 31 December 2011
13 PROPERTY, PLANT AND EQUIPMENT (cont’d)
PlantEquipment
Freehold VehiclesLand Building Furniture Total
$’000 $’000 $’000 $’000
At valuationCOMPANYAt cost or valuationAt 1 January 2011 – 176 367 543Additions 1 – 25 26Revaluation surplus 28 9 – 37Elimination of accumulated depreciation on revaluation – (13) – (13)Exchange adjustment – (5) (9) (14)At 31 December 2011 29 167 383 579
Accumulated depreciationAt 1 January 2011 – – 182 182Depreciation charge for the year – 13 33 46Elimination of accumulated depreciation on revaluation – (13) – (13)Exchange adjustment – – (4) (4)At 31 December 2011 – – 211 211
Net Carrying Amount
At 31 December 2011 29 167 172 368
COMPANYAt cost or valuationAt 1 January 2010 – 160 355 515Additions – – 5 5Revaluation surplus – 24 – 24Elimination of accumulated depreciation on revaluation – (12) – (12)Exchange adjustment – 4 7 11At 31 December 2010 – 176 367 543
Accumulated depreciationAt 1 January 2010 – – 145 145Depreciation charge for the year – 12 33 45Elimination of accumulated depreciation on revaluation – (12) – (12)Exchange adjustment – – 4 4At 31 December 2010 – – 182 182
Net Carrying Amount
At 31 December 2010 – 176 185 361

98 TRANSFORMATION
NOTES TO THE FINANCIAL STATEMENTSFor the Financial Year Ended 31 December 2011
13 PROPERTY, PLANT AND EQUIPMENT (cont’d)
(a) Land and buildings are stated at fair value, which has been determined based on valuations at or approximate the end of the reporting period. The properties are at valuations performed by accredited independent valuers with recent experience in the location and category of the properties being valued. The valuations are based on the following methods considering the nature of the property and/or the lack of comparable data:
(i) The comparison/comparable sales method that considers the sales of similar properties that have been transacted in the open market with adjustments made for differences in factors that affect value.
(ii) The depreciated replacement cost method that is based on an estimate of the current market value of the land, plus the current gross replacement of improvements, less allowances for physical deterioration, obsolescence and optimisation.
(iii) The discounted cash fl ow method that projects occupancy, average room rate and indicative cash fl ow, based on knowledge and understanding of the market and experience of the operating performance of properties of similar type and standard.
(iv) The profi t/capitalisation/investment method that capitalises the estimated net annual income of the properties at a suitable rate of return. Capital adjustments if any such as capital expenditure and asset enhancement, etc are then made to derive the capital value of the properties.
(b) If the land and buildings stated at valuation were included in the fi nancial statements using the cost model, the net carrying amounts would be:
Group Company2011 2010 2011 2010$’000 $’000 $’000 $’000
Freehold land at 31 December– Cost 32,502 32,554 1 –– Accumulated impairment (12,703) (183) – –– Net carrying amount 19,799 32,371 1 –
Leasehold land at 31 December– Cost 54,668 54,622 – –– Accumulated depreciation and impairment (5,456) (4,831) – –– Net carrying amount 49,212 49,791 – –
Buildings at 31 December– Cost 132,484 132,295 11 11– Accumulated depreciation and impairment (52,545) (51,181) (10) (10) – Net carrying amount 79,939 81,114 1 1
(c) During the fi nancial year, an impairment charge of $2,587,000 (2010: $10,324,000) was made representing the write-down of the plant and equipment in the hospitality operations to its recoverable amount. The recoverable amount of these assets was based on its value in use and pre-tax discount rate used of 20% per annum, as appropriate (note 7).
In 2010, the impairment charge of $855,000 was related to the write down of plant and equipment in the resource operations after comparing the market value for a similar secondhand dredge (note 7).

99THE STRAITS TRADING COMPANY LIMITED ANNUAL REPORT 2011
NOTES TO THE FINANCIAL STATEMENTSFor the Financial Year Ended 31 December 2011
13 PROPERTY, PLANT AND EQUIPMENT (cont’d)
(d) Details of properties included in Property, plant and equipment as at 31 December 2011 are as follows:
Description of Properties Tenure
UnexpiredLease Term
(year) Existing Use Professional Valuers Valuation Method
SingaporeRendezvous Grand Hotel
with 298 rooms at No. 9 Bras Basah Road
Leasehold 81 Hotel Knight Frank Pte Ltd
Profi t, Discounted cash fl ow and
Comparable sales method
AustraliaRendezvous Hotel, Perth with
333 rooms at No. 148 The Esplanade, Scarborough, WA 6019
Freehold Hotel Jones Lang LaSalle Hotels (NSW) Pty
Limited
Discounted cash fl ow method
Rendezvous Studio Hotel, Perth Central with 103 rooms at 24 Mount Street, Perth, WA 6000
Freehold Hotel Jones Lang Lasalle Hotels (NSW) Pty
Limited
Discounted cash fl ow method
No. 255 Ann Street, Anzac Square, Brisbane, QLD 4000:
(i) Restaurant at Lot 1 Freehold Retail Colliers International
Consultancy and Valuation Pty
Limited
Capitalisation and Comparison
method
(ii) Manager unit at Lot 7 Freehold Residential Colliers International
Consultancy and Valuation Pty
Limited
Comparison method
Restaurant at Cable Beach Sanctuary Resort, 177/11 Oryx Road, Cable Beach, WA 6726
Freehold Retail # #
Central facilities at Lot 145 and 146 Port Douglas Road, QLD 4877
Freehold Retail and offi ce
Colliers International
Consultancy and Valuation Pty
Limited
Investment method

100 TRANSFORMATION
NOTES TO THE FINANCIAL STATEMENTSFor the Financial Year Ended 31 December 2011
13 PROPERTY, PLANT AND EQUIPMENT (cont’d)
(d) Details of properties included in Property, plant and equipment as at 31 December 2011 are as follows (cont’d):
Description of Properties Tenure
UnexpiredLease Term
(year) Existing Use Professional Valuers Valuation Method
MalaysiaWavertree Bungalow at
Jalan Lady Maxwell, 49000 Bukit Fraser, Pahang
Leasehold 12 Holiday bungalow
C H Williams Talhar & Wong Sdn Bhd
Comparison method
Lot 448, Mukim of Sabai, District of Bentong, Pahang Darul Makmur
Freehold Agricultural Jones Lang Wootton
Comparison method
No. 27 Jalan Pantai, 12000 Butterworth:
(i) Offi ces and factory buildings at Lot 142 – 187 and 362
Freehold Offi ce and factory
Knight Frank (Ooi & Zaharin Sdn Bhd)*
Depreciated replacement cost
method
(ii) Carpark shed at Lot 268 Leasehold 17 Carpark shed
Knight Frank (Ooi & Zaharin Sdn Bhd)*
Depreciated replacement cost
method
(iii) Seabed leases with main wharf at PT 686
Leasehold 58 Main wharf Knight Frank (Ooi & Zaharin Sdn Bhd)*
Depreciated replacement cost
method
Offi ces at unit No. B-15-6, B-15-7, B-15-11, Megan Avenue II, 12 Jalan Yap Kwan Seng, 50450 Kuala Lumpur
Freehold Offi ce Knight Frank (Ooi & Zaharin Sdn Bhd)*
Comparison method
80 units of fl ats at Taman Desa Palma, Alma, 14000 Bukit Mertajam
Freehold Residential Knight Frank (Ooi & Zaharin Sdn Bhd)*
Comparison method
Mukim Belukar Semang and Mukim Pengkalan Hulu, Daerah Hulu Perak:
(i) Land and buildings at Lot 344 and 348
Freehold Dam and residential
Knight Frank (Ooi & Zaharin Sdn Bhd)*
Depreciated replacement cost
method
(ii) Land at Lot 1886 Freehold Agricultural Knight Frank (Ooi & Zaharin Sdn Bhd)*
Depreciated replacement cost
method
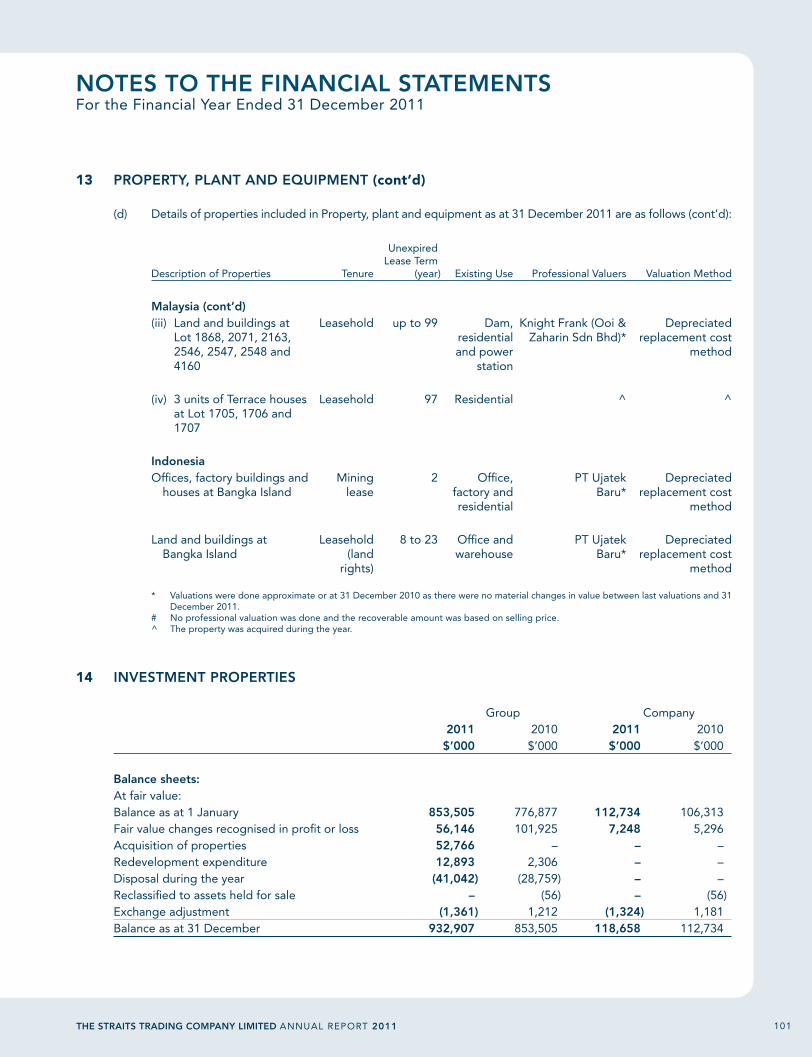
101THE STRAITS TRADING COMPANY LIMITED ANNUAL REPORT 2011
NOTES TO THE FINANCIAL STATEMENTSFor the Financial Year Ended 31 December 2011
13 PROPERTY, PLANT AND EQUIPMENT (cont’d)
(d) Details of properties included in Property, plant and equipment as at 31 December 2011 are as follows (cont’d):
Description of Properties Tenure
UnexpiredLease Term
(year) Existing Use Professional Valuers Valuation Method
Malaysia (cont’d)(iii) Land and buildings at
Lot 1868, 2071, 2163, 2546, 2547, 2548 and 4160
Leasehold up to 99 Dam, residential and power
station
Knight Frank (Ooi & Zaharin Sdn Bhd)*
Depreciated replacement cost
method
(iv) 3 units of Terrace houses at Lot 1705, 1706 and 1707
Leasehold 97 Residential ^ ^
IndonesiaOffi ces, factory buildings and
houses at Bangka IslandMining
lease2 Offi ce,
factory and residential
PT Ujatek Baru*
Depreciated replacement cost
method
Land and buildings at Bangka Island
Leasehold (land
rights)
8 to 23 Offi ce and warehouse
PT Ujatek Baru*
Depreciated replacement cost
method
* Valuations were done approximate or at 31 December 2010 as there were no material changes in value between last valuations and 31 December 2011.
# No professional valuation was done and the recoverable amount was based on selling price. ^ The property was acquired during the year.
14 INVESTMENT PROPERTIES
Group Company2011 2010 2011 2010
$’000 $’000 $’000 $’000
Balance sheets:At fair value:Balance as at 1 January 853,505 776,877 112,734 106,313Fair value changes recognised in profi t or loss 56,146 101,925 7,248 5,296Acquisition of properties 52,766 – – –Redevelopment expenditure 12,893 2,306 – –Disposal during the year (41,042) (28,759) – –Reclassifi ed to assets held for sale – (56) – (56)Exchange adjustment (1,361) 1,212 (1,324) 1,181Balance as at 31 December 932,907 853,505 118,658 112,734

102 TRANSFORMATION
NOTES TO THE FINANCIAL STATEMENTSFor the Financial Year Ended 31 December 2011
14 INVESTMENT PROPERTIES (cont’d)
Group2011 2010
$’000 $’000
Income statement:Rental income from investment properties:– Minimum lease payments 20,709 20,643– Contingent rent based on tenant’s turnover 26 –
20,735 20,643
Direct operating expenses (including repairs and maintenance) arising from:– Rental generating properties (5,771) (6,018)– Non-rental generating properties (451) (183)
(6,222) (6,201)
(a) Except as disclosed in note 14(c), the Group has no restrictions on the realisability of its investment properties and no contractual obligations to purchase, construct or develop investment property or for repairs, maintenance or enhancements.
(b) Investment properties are stated at fair value. Valuation of investment properties has been determined based on valuations at the end of the reporting period. Valuations are performed by accredited independent valuers with recent experience in the location and category of the properties being valued. The valuations are based on the following methods:
(i) The comparison method that considers the sales of similar properties that have been transacted in the
open market with adjustments made for differences in factors that affect value.
(ii) The investment method that capitalises the net rent of the properties at a suitable rate of return. The net rent is the balance sum after deducting service charge, property tax and a reasonable percentage for vacancy from the gross rent. The value of the property is arrived at by capitalising this net rent at a suitable rate of return.
(c) The land and building at No. 9 Battery Road, Singapore amounting to $381,000,000 (2010: $362,000,000) is mortgaged to secure bank loans. In addition, the 14 residential units at The Holland Collection, Singapore amounting to $56,460,000 is mortgaged to secure a new bank loan granted during the fi nancial year (note 31).
(d) During the fi nancial year, employee benefi ts expense capitalised in investment properties while undergoing redevelopment amounted to $67,000 (2010: $36,000) (note 6).
(e) During the fi nancial year, interest cost of $370,000 (2010: Nil) was capitalised for the acquisition of 14 residential units at The Holland Collection, Singapore. In addition, interest cost of $40,000 (2010: Nil) was capitalised for the redevelopment of Rendezvous Gallery at No. 9 Bras Basah Road, Singapore.

103THE STRAITS TRADING COMPANY LIMITED ANNUAL REPORT 2011
NOTES TO THE FINANCIAL STATEMENTSFor the Financial Year Ended 31 December 2011
14 INVESTMENT PROPERTIES (cont’d)
(f) Details of investment properties as at 31 December 2011 are as follows:
Description of Properties Tenure
UnexpiredLease Term
(year)
Site Area
sq.m.
Net Floor Area
sq.m.Existing
UseProfessional
ValuersValuationMethod
SingaporeStraits Trading
Building, a 28-storey commercial building at No. 9 Battery Road
999 years Leasehold
813 to 850 1,340 14,762 Offi ce Knight Frank Pte Ltd
Comparison and
Investment method
Rendezvous Gallery, a 3-storey commercial building at No. 9 Bras Basah Road
Leasehold 81 610 2,295 Retail Knight Frank Pte Ltd
Investment method
27 residential units at Gallop Green condominium
Freehold – 9,539 (strata)
Residential Knight Frank Pte Ltd
Comparison method
6A/6B/8/8A/10/12 at Cable Road
Freehold 8,984 5,084 (gross)
Residential Knight Frank Pte Ltd
Comparison method
3 plots of land for residential development at Nathan Road
Freehold 4,548 – Residential Knight Frank Pte Ltd
Comparison method
14 residential units at The Holland Collection
Freehold – 2,974 (strata)
Residential Knight Frank Pte Ltd
Comparison method
MalaysiaStraits Trading
Building, a 7-storey commercial building at No. 2 Lebuh Pasar Besar, Kuala Lumpur
999 years Leasehold /Freehold
871 to 873 2,224 9,909 Offi ce YCW Property Consultant
Comparison method
A parcel of residential land Lot No. 11260, Mukim of Hulu Kinta, District of Kinta, Perak
999 years Leasehold
883 11,255 – Residential C H Williams Talhar & Wong
Sdn Bhd
Comparison method

104 TRANSFORMATION
NOTES TO THE FINANCIAL STATEMENTSFor the Financial Year Ended 31 December 2011
1 4 INVESTMENT PROPERTIES (cont’d)
(f) Details of investment properties as at 31 December 2011 are as follows (cont’d):
Description of Properties Tenure
Unexpired Lease Term
(year)
Site Area
sq.m.
Net Floor Area
sq.m.Existing
UseProfessional
ValuersValuation
Method
Malaysia (cont’d)A parcel of residential
land, Lot No. 34612 Jalan Gopeng, Ipoh, Perak
999 years Leasehold
882 12,892 – Residential C H Williams Talhar & Wong
Sdn Bhd
Comparison method
Commercial land with a few shophouses, Lot Nos. 1105 to 1110, 2122 and 2123 Town of Seremban, District of Seremban, Negeri Sembilan
Freehold 3,826 478 Retail C H Williams Talhar & Wong
Sdn Bhd
Comparison method
Lot Nos. 197 and 199, Section 4 Town of Butterworth, Pulau Pinang
Freehold 7,949 – Retail C H Williams Talhar & Wong
Sdn Bhd
Comparison method
Lot Nos. 2569 and 2626, Section 4 Town of Butterworth, Pulau Pinang
Freehold 6,535 – Carpark C H Williams Talhar & Wong
Sdn Bhd
Comparison method
Lot Nos. 2499, 189, 190 and 270, Section 4 Town of Butterworth, Pulau Pinang; accommodating 6 residential units, a single-storey bungalow with 2 annex buildings, a single-storey club house and 1½ storey squash court and vacant plots
Freehold with two
minor Leasehold
plots
15 and 19 37,200 3,241 Residential/ Retail/
Carpark
C H Williams Talhar & Wong
Sdn Bhd
Comparison method

105THE STRAITS TRADING COMPANY LIMITED ANNUAL REPORT 2011
NOTES TO THE FINANCIAL STATEMENTSFor the Financial Year Ended 31 December 2011
1 4 INVESTMENT PROPERTIES (cont’d)
(f) Details of investment properties as at 31 December 2011 are as follows (cont’d):
Description of Properties Tenure
Unexpired Lease Term
(year)
Site Area
sq.m.
Net Floor Area
sq.m.Existing
UseProfessional
ValuersValuation
Method
Malaysia (cont’d)Lot Nos. 195, 2502
and 2570, Section 4 Town of Butterworth, Pulau Pinang; accommodating a 3-storey club house with a guard house, three single-storey bungalows with/without annex building and vacant plots
Freehold 55,928 3,513 Offi ce/ Residential/ Club house/
Storage yard/ Car
showroom
C H Williams Talhar & Wong
Sdn Bhd
Comparison method
8 units of 3-storey shophouses, No. 4819 to 4826 Jalan Pantai, Taman Selat, Butterworth, Pulau Pinang
Freehold 1,322 2,883 Commercial C H Williams Talhar & Wong
Sdn Bhd
Comparison method
15 GOODWILL/OTHER INTANGIBLE ASSETS
(a) Goodwill arising on consolidation
Group2011 2010
$’000 $’000
At costAt 1 January 38,821 38,260Amount written off (11,032) –Exchange adjustment (562) 561At 31 December 27,227 38,821
Accumulated impairment chargeAt 1 January 16,396 3,208Impairment charge (note 7) – 13,188Amount written off (11,032) –At 31 December 5,364 16,396
Net Carrying Amount 21,863 22,425

106 TRANSFORMATION
NOTES TO THE FINANCIAL STATEMENTSFor the Financial Year Ended 31 December 2011
15 GOODWILL/OTHER INTANGIBLE ASSETS (cont’d)
(a) Goodwill arising on consolidation (cont’d)
The carrying amount of goodwill is allocated to Resources segment.
Resources
(i) During the fi nancial year 2011, the Group disposed of the tin and base metals exploration listed subsidiary in Australia and its coal resource subsidiary. Consequently, the accumulated impairment charge of goodwill arising from these subsidiaries of $11,032,000 was written off against the cost of goodwill.
(ii) The recoverable amount of the resource subsidiary in Malaysia is determined based on value in use using 5-year cash fl ow projections based on fi nancial forecasts. Management has considered and determined the factors applied in these fi nancial budgets, which included tin prices, exchange rates and fuel costs. The key assumptions made refl ect past experience. The pre-tax discount rate applied to the cash fl ow projections at 9.31% was based on the estimated weighted average cost of capital. There is no impairment in the carrying amount of goodwill arising from this review.
(b) Other intangible assets
Group2011 2010
$’000 $’000
(i) Mining rights 414 480 Management rights 141 287 Corporate club membership 222 91
777 858
(ii) Deferred exploration and evaluation expenditure 6,211 5,209 Deferred mine development expenditure 32,140 28,052
38,351 33,26139,128 34,119

107THE STRAITS TRADING COMPANY LIMITED ANNUAL REPORT 2011
NOTES TO THE FINANCIAL STATEMENTSFor the Financial Year Ended 31 December 2011
15 GOODWILL/OTHER INTANGIBLE ASSETS (cont’d)
(b) (i) Mining Rights, Management Rights and Corporate Club Membership
CorporateMining Management club
rights rights membership Total$’000 $’000 $’000 $’000
GROUP
At Cost
At 1 January 2011 6,073 2,041 134 8,248
Addition – – 146 146
Exchange adjustment (23) 10 (6) (19)
At 31 December 2011 6,050 2,051 274 8,375
Accumulated amortisation
At 1 January 2011 5,593 1,754 43 7,390
Amortisation to profi t or loss 54 146 10 210
Exchange adjustment (11) 10 (1) (2)
At 31 December 2011 5,636 1,910 52 7,598
Net Carrying Amount 414 141 222 777
At Cost
At 1 January 2010 6,052 1,951 131 8,134
Exchange adjustment 21 90 3 114
At 31 December 2010 6,073 2,041 134 8,248
Accumulated amortisation
At 1 January 2010 5,468 1,537 33 7,038
Amortisation to profi t or loss 121 140 9 270
Exchange adjustment 4 77 1 82
At 31 December 2010 5,593 1,754 43 7,390
Net Carrying Amount 480 287 91 858

108 TRANSFORMATION
NOTES TO THE FINANCIAL STATEMENTSFor the Financial Year Ended 31 December 2011
15 GOODWILL/OTHER INTANGIBLE ASSETS (cont’d)
(b) (ii) Deferred Exploration and Evaluation Expenditure and Deferred Mine Development Expenditure
Deferred exploration Deferred mine
and evaluation developmentexpenditure expenditure Total
$’000 $’000 $’000
GROUPAt 1 January 2011 5,209 28,052 33,261Additions 1,262 16,519 17,781Amortisation to profi t or loss (229) (11,938) (12,167)Exchange adjustment (31) (493) (524)At 31 December 2011 6,211 32,140 38,351
At 1 January 2010 9,396 19,867 29,263Additions 1,493 14,244 15,737Written off to profi t or loss (note 9) (1,140) – (1,140)Amortisation to profi t or loss (343) (4,970) (5,313)Attributable to disposal group classifi ed as held for sale (note 23) (3,929) – (3,929)Exchange adjustment (268) (1,089) (1,357)At 31 December 2010 5,209 28,052 33,261
Note 15(b)(ii) represents mine exploration and evaluation as well as development expenditures incurred for several areas of interest. The costs are carried forward to the extent that they are expected to be recouped through the successful development of the areas or activities of the areas which have not reached a stage that permit reasonable assessment of the existence of economically recoverable ore reserves and resources.
The remaining amortisation periods are as follows:
Group
Number of years
2011 2010
Mining rights 8 9
Management rights 1 to 6 2 to 7
Corporate club membership 9 to 72 10
Deferred exploration and evaluation expenditure 2 to 8 3 to 9
Deferred mine development expenditure 1 to 4 1 to 3

109THE STRAITS TRADING COMPANY LIMITED ANNUAL REPORT 2011
NOTES TO THE FINANCIAL STATEMENTSFor the Financial Year Ended 31 December 2011
16 INVESTMENTS IN SUBSIDIARIES
Company2011 2010
$’000 $’000
Quoted shares, at cost 25,402 25,402Unquoted shares, at cost 125,638 126,638Redeemable preference shares, at cost 112,000 112,000
263,040 264,040Impairment losses (50,650) (50,650)
212,390 213,390
Details of subsidiaries are included in note 45.
Change of Ownership Interests in Subsidiaries
The secondary listing of Malaysia Smelting Corporation Berhad (“MSC”) on the Main Board of the Singapore Exchange Securities Trading Limited (“SGX-ST”) was completed on 27 January 2011, by issuance of additional 25 million shares at issue price of S$1.75 per share. This resulted in an enlarged issued and paid-up share capital of 100 million shares. Consequent to the secondary listing, the Group’s shareholding in MSC has reduced from 73.1% to 54.8%. Accordingly, non-controlling interests was increased by $44.2 million and there was no impact on the Group profi t or loss.
In 2010, the Company transferred its 100% shareholding in Straits Resource Management Private Limited (“SRM”), to its listed subsidiary, Malaysia Smelting Corporation Berhad (“MSC”) in which the Group had a 73.1% interest. The Group’s effective interest in SRM was reduced from 100% to 73.1% upon the share transfer on 11 August 2010.
Capital reduction by a subsidiary In 2010, a subsidiary, Straits Media Private Limited cancelled 9,000,000 shares at the price of $1.00 per share pursuant to a capital reduction exercise under Section 78B of the Singapore Companies Act.
Investment in redeemable preference shares of subsidiaries
In 2010, the investment in redeemable preference shares of subsidiaries of $112,000,000, which was previously recorded as amounts due from subsidiaries, was capitalised as cost of investment. This amount represented redeemable preference shares issued by Malayan Securities Private Limited, Sword Investments Private Limited and Straits Trading Amalgamated Resources Private Limited. The redeemable preference shares carry no rights to dividends. Upon the winding up of the companies, the holders of the redeemable preference shares have the right to repayment of the capital in priority to the holders of the ordinary shares of the companies and to participate equally with the holders of the ordinary shares in the surplus assets of the companies. The issuers have the right at any time and from time to time to redeem in its absolute discretion the whole or some of the redeemable preference shares.
Re-designation of investment in subsidiary to disposal group classifi ed as held for sale
At 31 December 2010, the investment in AOM was re-designated to disposal group classifi ed as held for sale (note 23).

110 TRANSFORMATION
NOTES TO THE FINANCIAL STATEMENTSFor the Financial Year Ended 31 December 2011
16 INVESTMENTS IN SUBSIDIARIES (cont’d)
Impairment of investment in subsidiary
In 2010, after reviewing the performance of Rendezvous Hotels International Private Limited, management assessed that it was not likely that the cost of investment of $4,880,000 would be recoverable. Accordingly, an impairment loss of $4,880,000 was recognised as a charge to profi t or loss.
Analysis of Acquisition of Subsidiary:
Acquisition in 2010
Acquisition of Subsidiary
On 8 April 2010, the Group’s subsidiary company, Straits Developments Private Limited acquired the entire issued share capital of Tertius Development Pte Ltd (“Tertius”), a company incorporated in Singapore.
Cash fl ow effect on the acquisition of Tertius
$’000
Development properties for sale 35,627Other receivables 6Cash and cash equivalents 18Borrowings (19,639)Payables (14,524)
1,488
Total consideration for 100% equity interest acquired (1,488)Less: Cash and cash equivalents of subsidiary acquired 18Net cash outfl ow on acquisition (1,470)
17. INVESTMENTS IN ASSOCIATES AND JOINT VENTURES
Group Company2011 2010 2011 2010$’000 $’000 $’000 $’000
Investment in associates 16,290 20,467 3,585 3,585Investment in joint ventures 60,149 46,676 – –
76,439 67,143 3,585 3,585

111THE STRAITS TRADING COMPANY LIMITED ANNUAL REPORT 2011
NOTES TO THE FINANCIAL STATEMENTSFor the Financial Year Ended 31 December 2011
17 INVESTMENTS IN ASSOCIATES AND JOINT VENTURES (cont’d)
17.1 Investment in Associates
Group Company2011 2010 2011 2010
$’000 $’000 $’000 $’000
Quoted shares, at cost 52,618 50,670 – –Share of post-acquisition reserves (5,336) (4,539) – –Exchange adjustment (306) 270 – –
46,976 46,401 – –Impairment loss (43,701) (39,235) – –
3,275 7,166 – –
Unquoted shares, at cost 14,592 14,592 3,585 3,585Share of post-acquisition reserves 3,430 2,920 – –Exchange adjustment (444) (466) – –
17,578 17,046 3,585 3,585Impairment loss (4,563) (3,745) – –
13,015 13,301 3,585 3,585
16,290 20,467 3,585 3,585
Market value of quoted shares 3,275 7,499 – –
(a) Details of associates are included in note 45.
(b) On 7 January 2011, a subsidiary company, Sword Investments Private Limited (“SIPL”) exercised all its warrants to purchase 10 million shares at C$0.15 per share for an additional 10,000,000 new common shares in Asian Mineral Resources Limited (“AMR”). As a result, the Group’s shareholding in AMR increased from 24.2% to 25.4%.
(c) Impairment assessment
(i) AMR
An additional impairment loss of $4,466,000 was recognised in the fi nancial year ended 31 December 2011 (2010: $24,705,000). This was based on fair value less cost to sell, which was the market bid price of C$0.05 (2010: C$0.14) per share, traded on Toronto Stock Exchange. The carrying amount of this investment was $3,275,000 (2010: $7,166,000).
(ii) Guilin Hinwei Tin Co Ltd
An additional impairment loss of $818,000 (2010: $3,745,000) was recognised based on fair value less cost to sell, which was determined by the estimated net realisable value of the net assets in this investment. The carrying amount of this investment was $1,012,000 (2010: $1,850,000) as at 31 December 2011.

112 TRANSFORMATION
NOTES TO THE FINANCIAL STATEMENTSFor the Financial Year Ended 31 December 2011
17 INVESTMENTS IN ASSOCIATES AND JOINT VENTURES (cont’d)
17.1 Investment in Associates (cont’d)
(d) The summarised fi nancial information of the associates, not adjusted for the proportion of ownership interest held by the Group, is as follows:
Group2011 2010
$’000 $’000
Assets and liabilitiesTotal assets 349,147 313,882
Total liabilities (21,255) (19,977)
Net assets 327,892 293,905
ResultsRevenue 44,197 54,051
Net loss for the year (1,571) (3,052)
17.2 Investment in Joint Ventures
Group2011 2010
$’000 $’000
Unquoted share, at cost 18,204 18,204Share of post-acquisition reserves 43,089 32,387Exchange adjustment (1,144) (3,915)
60,149 46,676
(a) Details of joint ventures are included in note 45.

113THE STRAITS TRADING COMPANY LIMITED ANNUAL REPORT 2011
NOTES TO THE FINANCIAL STATEMENTSFor the Financial Year Ended 31 December 2011
17 INVESTMENTS IN ASSOCIATES AND JOINT VENTURES (cont’d)
17.2 Investment in Joint Ventures (cont’d)
(b) The aggregate amounts of each of the non-current assets, current assets, non-current liabilities, current liabilities, income and expenses related to the joint venture, adjusted for the proportion of ownership interest held by the Group, are as follows:
Group2011 2010
$’000 $’000
Assets and liabilitiesNon-current assets 42,809 50,010Current assets 39,094 18,537Total assets 81,903 68,547
Non-current liabilities (5,962) (10,012)Current liabilities (15,792) (11,859)Total liabilities (21,754) (21,871)
Net assets 60,149 46,676
ResultsRevenue 54,454 35,696
Expenses (43,614) (30,096)

114 TRANSFORMATION
NOTES TO THE FINANCIAL STATEMENTSFor the Financial Year Ended 31 December 2011
18 DEFERRED TAX ASSETS AND LIABILITIES
Group CompanyConsolidated balance sheet
Consolidated income statement Balance sheet
2011 2010 2011 2010 2011 2010$’000 $’000 $’000 $’000 $’000 $’000
Deferred tax assets:Unutilised tax losses – 200 201 1,382 – –Provisions 12,314 8,104 (3,850) (918) – –Difference in depreciation (2,123) 2,174 4,195 (1,476) – –Fair value changes on foreign currency forward
contracts and interest rate swap contracts 131 22 2 394 – –Revaluation of property, plant and equipment (2,510) (788) 1,770 (741) – –Others 675 1,010 284 21 – –
8,487 10,722 – –Deferred tax liabilities:Difference in depreciation 5,438 2,668 2,514 (3,058) 842 798Unremitted foreign income and profi ts 1,500 9,160 (7,516) 633 9 87Fair value adjustments arising from acquisitions of
subsidiaries – – – (5,972) – –Fair value changes of investment properties 44,205 37,115 7,118 7,466 1,217 1,143Revaluation of property, plant and equipment 25,584 24,225 – – 58 49Others 230 2,700 (2,734) 2,073 16 –
76,957 75,868 2,142 2,077Deferred tax expense/(credit) 1,984 (196)
In 2010, deferred tax assets were recognised for tax losses of certain subsidiaries on the basis that taxable profi ts will be generated to utilise these tax losses. Management has determined the future taxable profi ts based on cash fl ow projections in the foreseeable future.
As at 31 December 2011, certain subsidiaries have unutilised tax losses amounting to $64,200,000 (2010: $58,523,000) available for set off against future taxable income, subject to the provisions of the Income Tax Act and agreement by the relevant authorities, for which deferred tax assets have not been recognised. Included in these unutilised tax losses, $21,801,000 (2010: $20,254,000) arose in Indonesia with expiry period of between 1 to 5 years.
At the end of the reporting period, no deferred tax liability (2010: Nil) has been recognised for taxes that would be payable on the undistributed earnings of a foreign subsidiary of MSC Group. MSC Group has determined that the undistributed earnings of this foreign subsidiary will not be distributed in the foreseeable future. Such temporary differences for which no deferred tax liability has been recognised amounted to $50,047,000 (2010: $57,370,000). The deferred tax liability is estimated to be $7,507,000 (2010: $8,606,000).

115THE STRAITS TRADING COMPANY LIMITED ANNUAL REPORT 2011
NOTES TO THE FINANCIAL STATEMENTSFor the Financial Year Ended 31 December 2011
19 TRADE AND OTHER RECEIVABLES
Group Company2011 2010 2011 2010
$’000 $’000 $’000 $’000
Current:Trade receivables 110,209 74,204 53 20Amount due from an associate 742 337 – –Impairment of doubtful receivables (4,158) (3,093) – –
106,793 71,448 53 20Other receivablesBalance receivable from sale of properties 29,532 7,628 – –Deposits 1,539 1,901 47 78Non-trade receivables * 48,690 57,075 4 46Amounts due from subsidiaries – – 229,206 212,136Amounts due from associates 1,390 1,426 1,390 1,426Amount due from joint venture 5 5 – –
81,156 68,035 230,647 213,686Impairment of doubtful receivables (5,840) (853) (64,528) (64,420)
75,316 67,182 166,119 149,266Trade and other receivables (current) 182,109 138,630 166,172 149,286
Non-Current:Non-trade receivables * 846 1,222 – –Loans to subsidiaries – – – 106,465Amount due from joint venture 1,849 1,093 – –
2,695 2,315 – 106,465
Total trade and other receivables (current and non-current) 184,804 140,945 166,172 255,751
Add: Cash and cash equivalents (note 27) 313,323 71,597 173,441 1,103 Non-current security deposit (note 22) – 16,767 – –
Total loans and receivables 498,127 229,309 339,613 256,854 * Included in the Group’s non-trade receivables are:
(i) $12,348,000 (2010: $13,493,000) relating to value added tax receivable from the Indonesia tax authority.
(ii) $12,148,000 (2010: $16,496,000) being prepayment pending fi nalisation of accounts from mine contractor.
(iii) $2,566,000 (2010: $2,807,000) being advances paid before delivery of tin.
(iv) $1,222,000 (2010: $1,590,000) relating to an unsecured loan carried at amortised cost and repayable within 4 years.
(v) $6,329,000 (2010: $3,625,000) being receivables on toll smelting income.

116 TRANSFORMATION
NOTES TO THE FINANCIAL STATEMENTSFor the Financial Year Ended 31 December 2011
19 TRADE AND OTHER RECEIVABLES (cont’d)
Trade receivables
Trade receivables are non-interest bearing and are generally on cash payment to 90-day terms. They are recognised at their original invoice amounts which represent their fair values on initial recognition.
At the end of the reporting period, trade receivables arising from export sales amounting to $6,009,000 (2010: $6,438,000) are arranged to be settled via letters of credits issued by reputable banks in countries where customers are based.
Included in the Group’s trade receivables is an amount receivable from key management personnel of the Company of $985,000 (2010: $1,641,000). This relates to the remaining balance of sale consideration to be billed for a property sold in 2010. The billed amount at 31 December 2010 was unsecured, non-interest bearing and repayable on demand in cash.
Amounts due from subsidiaries
The amounts due from subsidiaries are non-trade related, unsecured and repayable on demand in cash. No interest is charged except for amounts receivable of $93,340,000 (2010: $67,257,000) which bear interest ranging from 1.5% to 4.3% (2010: 1.4% to 2.5%) per annum.
Loans to subsidiaries
Loans to subsidiaries are non-trade related, unsecured, bear interest based on prevailing market rates ranging from 4.8% to 5.0% (2010: 4.2% to 4.9%) per annum. The loans have been settled in 2011. The carrying amount of the loans receivable approximates its fair value as the implicit interest rates are based on prevailing market rates.
Amounts due from associates
The amount due from an associate under trade receivables is unsecured, non-interest bearing and subject to the Group’s normal credit terms which range from cash to 90 days.
The amounts due from associates under other receivables are non-trade related, unsecured, non-interest bearing and repayable on demand. These amounts are repayable in cash.

117THE STRAITS TRADING COMPANY LIMITED ANNUAL REPORT 2011
NOTES TO THE FINANCIAL STATEMENTSFor the Financial Year Ended 31 December 2011
19 TRADE AND OTHER RECEIVABLES (cont’d)
Amount due from joint venture
The amount due from joint venture under other receivables comprises short term advances for working capital. They are non-trade related, unsecured and repayable on demand. No interest is charged except for the non-current amount of $1,849,000 (2010: $1,093,000) due from KM Resources Inc., which bears interest at 4.0% (2010: 4.0%) per annum. It is expected to be repaid within 3 years and to be settled in cash.
Trade and other receivables denominated in foreign currencies other than the functional currencies of the respective Group entities are as follows:
Group Company2011 2010 2011 2010
$’000 $’000 $’000 $’000
Indonesian Rupiah 13,721 13,819 – –
United States Dollar 89,034 58,422 – –
Australian Dollar – – – 106,465
The age analysis of trade and other receivables is as follows:
Group2011 2010$’000 $’000
GrossImpairment
losses Net GrossImpairment
losses Net
• Not past due 156,686 – 156,686 112,594 – 112,594
• Past due:
Less than 30 days 6,651 – 6,651 7,022 – 7,02230 to 60 days 2,549 (87) 2,462 12,962 – 12,962
61 to 90 days 746 (181) 565 2,467 (34) 2,433
91 to 120 days 446 – 446 500 (34) 466More than 120 days 27,724 (9,730) 17,994 9,346 (3,878) 5,468
38,116 (9,998) 28,118 32,297 (3,946) 28,351Total 194,802 (9,998) 184,804 144,891 (3,946) 140,945

118 TRANSFORMATION
NOTES TO THE FINANCIAL STATEMENTSFor the Financial Year Ended 31 December 2011
19 TRADE AND OTHER RECEIVABLES (cont’d)
The age analysis of trade and other receivables is as follows (cont’d):
Company2011 2010$’000 $’000
GrossImpairment
losses Net GrossImpairment
losses Net
• Not past due 230,671 (64,528) 166,143 320,107 (64,420) 255,687
• Past due:
Less than 30 days 16 – 16 18 – 18
30 to 60 days 6 – 6 26 – 26
61 to 90 days 4 – 4 18 – 18
91 to 120 days – – – – – –
More than 120 days 3 – 3 2 – 2
29 – 29 64 – 64
Total 230,700 (64,528) 166,172 320,171 (64,420) 255,751
Trade receivables that are individually determined to be impaired at the end of the reporting period relate to debtors that are in signifi cant fi nancial diffi culties and have defaulted on payments. Included in the net carrying amount of trade receivables is an amount of $2,583,000 (2010: $3,428,000), which is secured by a charge on the share of tribute of a tin mining concession.
Trade and other receivables that are impaired at the reporting date and the movement of allowance accounts used to record the impairment are as follows:
Group Company2011 2010 2011 2010$’000 $’000 $’000 $’000
Trade and other receivables – nominal amounts 12,582 9,029 81,571 81,361Less: Allowance for impairment (9,998) (3,946) (64,528) (64,420)
2,584 5,083 17,043 16,941
Movements in the allowance accounts:
Group Company2011 2010 2011 2010
$’000 $’000 $’000 $’000
At 1 January (3,946) (2,709) (64,420) (2,905)Impairment for the year (6,797) (1,704) (108) (61,520)Amounts written off 320 323 – –Reversal of impairment 421 158 – 5Exchange adjustment 4 (14) – –At 31 December (9,998) (3,946) (64,528) (64,420)

119THE STRAITS TRADING COMPANY LIMITED ANNUAL REPORT 2011
NOTES TO THE FINANCIAL STATEMENTSFor the Financial Year Ended 31 December 2011
20 INVESTMENT SECURITIES / MARKETABLE SECURITIES
Group Company2011 2010 2011 2010
$’000 $’000 $’000 $’000
Investment Securities:Available–for–sale shares– quoted, at fair value 128,258 199,292 48,422 75,222– unquoted, at fair value 7,242 14,387 – –– unquoted, at cost – 4 – 4
135,500 213,683 48,422 75,226
Information on the Group’s investment/marketable securities by country can be found in note 39(e).
Quoted shares, at fair value
The quoted shares at fair value comprise investment in Republic Gold Limited, a company incorporated in Australia. During the fi nancial year, the Group recognised an impairment loss of $12,000 (2010: $404,000) for this investment as there was signifi cant or prolonged decline in the fair value of this investment below its costs.
Unquoted shares, at fair value
The unquoted shares at fair value comprise Malaysia Smelting Corporation Berhad ’s 18.54% interest in TMR Ltd (“TMR”), a Bermuda incorporated company. TMR has 99% shareholding in PT Tenaga Anugerah (“PT TA”), which holds tin mining rights in Indonesia. TMR together with its subsidiary, PT TA, are principally involved in integrated tin business in Indonesia.
The fair value of investment in TMR at 31 December 2011 was determined based on an external valuation. The valuation assumes the economically recoverable tin reserves of 15,537 tonnes in the concession areas, with the tin prices of US$25,000 per tonne during the forecasted production period from 2012 to 2018. The discount rate used in the valuation is 17%.
During the fi nancial year, the Group recognised an impairment loss of $6,786,000 (2010: Nil) as there was “signifi cant” or “prolonged” decline in the fair value of this investment.
Unquoted shares, at cost
The unquoted shares at cost comprise an investment in Escoy Holidngs Bhd, a company which was delisted in Malaysia since 2007. For the purpose of the impairment assessment, the recoverable amount of this investment has been determined based on the estimated realisable value of the net assets in this investment. Consequently, an impairment loss of $4,000 (2010: Nil) has been recognised during the fi nancial year ended 31 December 2011.
Group2011 2010
$’000 $’000
Marketable Securities:Held-for-trading, at fair value:Other quoted investments 13 17
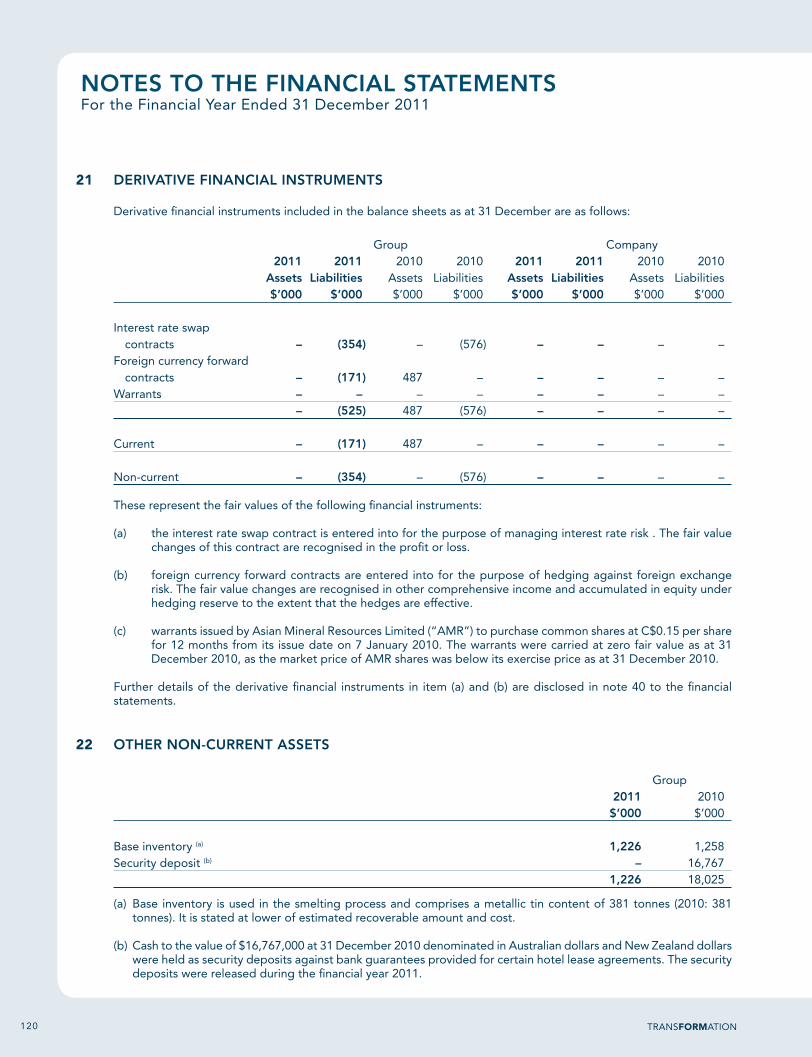
120 TRANSFORMATION
NOTES TO THE FINANCIAL STATEMENTSFor the Financial Year Ended 31 December 2011
21 DERIVATIVE FINANCIAL INSTRUMENTS
Derivative fi nancial instruments included in the balance sheets as at 31 December are as follows:
Group Company2011 2011 2010 2010 2011 2011 2010 2010
Assets Liabilities Assets Liabilities Assets Liabilities Assets Liabilities$’000 $’000 $’000 $’000 $’000 $’000 $’000 $’000
Interest rate swap contracts – (354) – (576) – – – –
Foreign currency forward contracts – (171) 487 – – – – –
Warrants – – – – – – – –– (525) 487 (576) – – – –
Current – (171) 487 – – – – –
Non-current – (354) – (576) – – – –
These represent the fair values of the following fi nancial instruments:
(a) the interest rate swap contract is entered into for the purpose of managing interest rate risk . The fair value changes of this contract are recognised in the profi t or loss.
(b) foreign currency forward contracts are entered into for the purpose of hedging against foreign exchange risk. The fair value changes are recognised in other comprehensive income and accumulated in equity under hedging reserve to the extent that the hedges are effective.
(c) warrants issued by Asian Mineral Resources Limited (“AMR”) to purchase common shares at C$0.15 per share for 12 months from its issue date on 7 January 2010. The warrants were carried at zero fair value as at 31 December 2010, as the market price of AMR shares was below its exercise price as at 31 December 2010.
Further details of the derivative fi nancial instruments in item (a) and (b) are disclosed in note 40 to the fi nancial statements.
22 OTHER NON-CURRENT ASSETS
Group 2011 2010
$’000 $’000
Base inventory (a) 1,226 1,258Security deposit (b) – 16,767
1,226 18,025
(a) Base inventory is used in the smelting process and comprises a metallic tin content of 381 tonnes (2010: 381 tonnes). It is stated at lower of estimated recoverable amount and cost.
(b) Cash to the value of $16,767,000 at 31 December 2010 denominated in Australian dollars and New Zealand dollars were held as security deposits against bank guarantees provided for certain hotel lease agreements. The security deposits were released during the fi nancial year 2011.
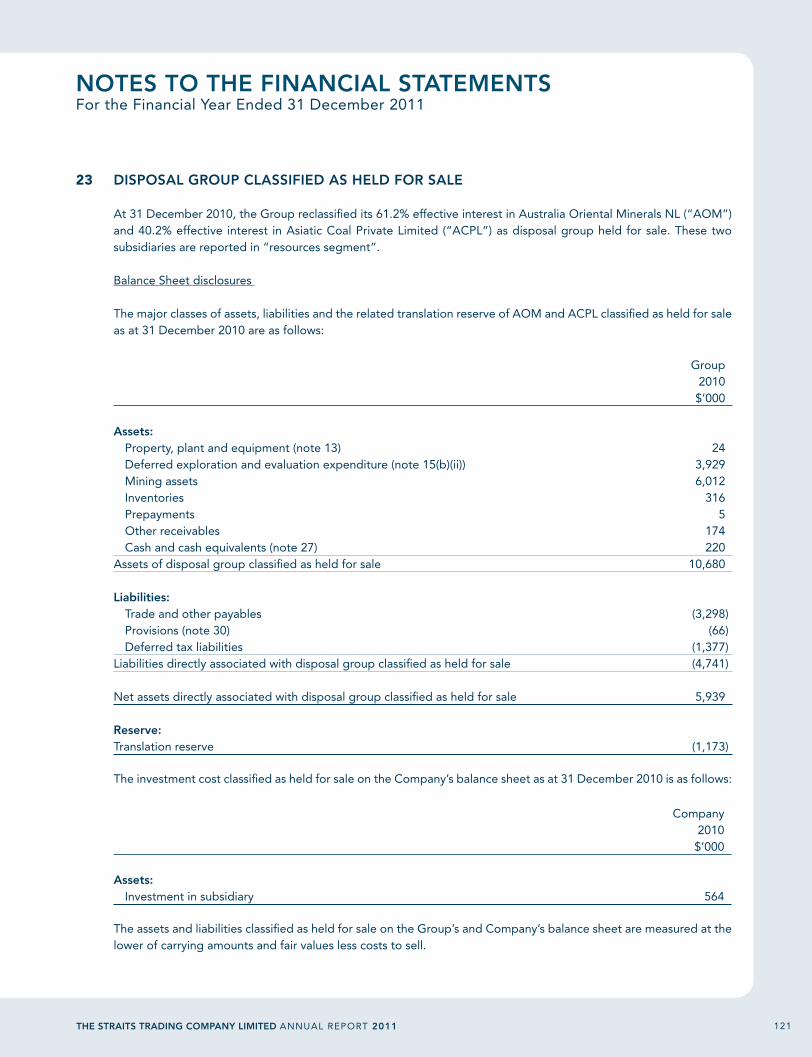
121THE STRAITS TRADING COMPANY LIMITED ANNUAL REPORT 2011
NOTES TO THE FINANCIAL STATEMENTSFor the Financial Year Ended 31 December 2011
23 DISPOSAL GROUP CLASSIFIED AS HELD FOR SALE
At 31 December 2010, the Group reclassifi ed its 61.2% effective interest in Australia Oriental Minerals NL (“AOM”) and 40.2% effective interest in Asiatic Coal Private Limited (“ACPL”) as disposal group held for sale. These two subsidiaries are reported in “resources segment”.
Balance Sheet disclosures
The major classes of assets, liabilities and the related translation reserve of AOM and ACPL classifi ed as held for sale as at 31 December 2010 are as follows:
Group 2010
$’000
Assets: Property, plant and equipment (note 13) 24 Deferred exploration and evaluation expenditure (note 15(b)(ii)) 3,929 Mining assets 6,012 Inventories 316 Prepayments 5 Other receivables 174 Cash and cash equivalents (note 27) 220Assets of disposal group classifi ed as held for sale 10,680
Liabilities: Trade and other payables (3,298) Provisions (note 30) (66) Deferred tax liabilities (1,377)Liabilities directly associated with disposal group classifi ed as held for sale (4,741)
Net assets directly associated with disposal group classifi ed as held for sale 5,939
Reserve:Translation reserve (1,173)
The investment cost classifi ed as held for sale on the Company’s balance sheet as at 31 December 2010 is as follows:
Company2010
$’000
Assets: Investment in subsidiary 564
The assets and liabilities classifi ed as held for sale on the Group’s and Company’s balance sheet are measured at the lower of carrying amounts and fair values less costs to sell.
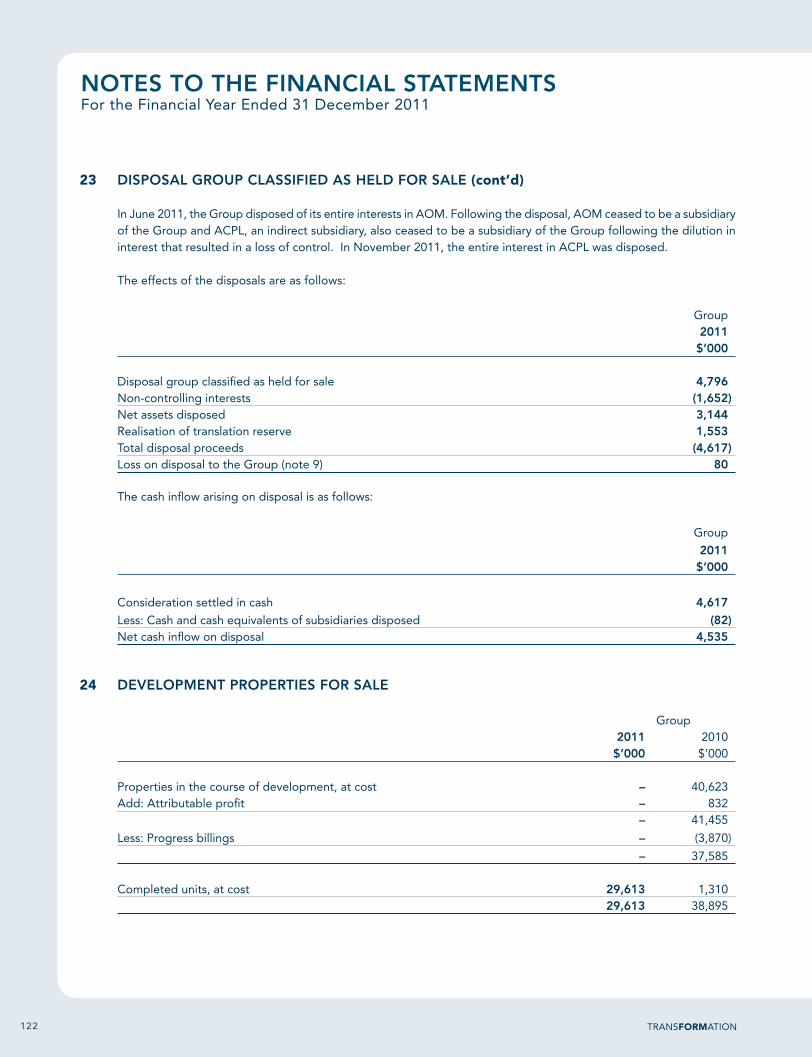
122 TRANSFORMATION
NOTES TO THE FINANCIAL STATEMENTSFor the Financial Year Ended 31 December 2011
23 DISPOSAL GROUP CLASSIFIED AS HELD FOR SALE (cont’d)
In June 2011, the Group disposed of its entire interests in AOM. Following the disposal, AOM ceased to be a subsidiary of the Group and ACPL, an indirect subsidiary, also ceased to be a subsidiary of the Group following the dilution in interest that resulted in a loss of control. In November 2011, the entire interest in ACPL was disposed.
The effects of the disposals are as follows:
Group 2011 $’000
Disposal group classifi ed as held for sale 4,796Non-controlling interests (1,652)Net assets disposed 3,144Realisation of translation reserve 1,553Total disposal proceeds (4,617)Loss on disposal to the Group (note 9) 80
The cash infl ow arising on disposal is as follows:
Group
2011 $’000
Consideration settled in cash 4,617Less: Cash and cash equivalents of subsidiaries disposed (82)Net cash infl ow on disposal 4,535
24 DEVELOPMENT PROPERTIES FOR SALE
Group2011 2010
$’000 $’000
Properties in the course of development, at cost – 40,623Add: Attributable profi t – 832
– 41,455
Less: Progress billings – (3,870)
– 37,585
Completed units, at cost 29,613 1,31029,613 38,895

123THE STRAITS TRADING COMPANY LIMITED ANNUAL REPORT 2011
NOTES TO THE FINANCIAL STATEMENTSFor the Financial Year Ended 31 December 2011
24 DEVELOPMENT PROPERTIES FOR SALE (cont’d)
During the fi nancial year, the following amounts were capitalised as cost of development properties for sale:
Group2011 2010$’000 $’000
Employee benefi ts expense (note 6) 48 8Interest on bank loans (note 8) 325 332
In 2010, the freehold land and strata bungalows development at Five Chancery, Singapore, amounting to $37,585,000, was pledged as security for a bank loan bearing interest ranging from 1.7% to 4.0% per annum. The loan was fully repaid and the mortgage was discharged during the fi nancial year (note 31).
The Group uses the percentage of completion method to recognise revenue on its residential development projects in Singapore. In 2010, revenue arising from pre-completion properties sold amounted to $4,466,000.
Temporary Occupation Permit for the strata bungalows development at Five Chancery, Singapore was issued in November 2011.
Details of the properties as at 31 December 2011 are as follows:
Description of properties
Group’sEffective
Interest inProperty
Floor Areasq.m.
Stage ofcompletion
6 (2010: 12) units strata bungalows development at Five Chancery, Singapore 100% 2,938 (strata) Completed
1 (2010: 1) residential unit at Gallop Gables Condominium, Singapore 100% 202 (strata) Completed
4 (2010: 4) units of 3-storey shop houses and 5 (2010: 5) units of 4-storey shop houses at Jalan Selat, Taman Selat, Butterworth 100% 4,016 (net) Completed

124 TRANSFORMATION
NOTES TO THE FINANCIAL STATEMENTSFor the Financial Year Ended 31 December 2011
25 INVENTORIES
Group2011 2010
$’000 $’000
At lower of cost or net realisable value:Inventories of:- Tin-in-concentrates 13,780 26,544- Tin-in-process 43,732 103,097- Refi ned tin metal 52,362 28,074Other inventories (stores, spares, fuels, coal and by-products) 9,829 11,779Food and beverage inventories 1,459 1,721
121,162 171,215
Cost of inventories sold during the year amounted to $1,167,075,000 (2010: $1,066,818,000).
The reversal of write-down of inventories recognised as a reduction of expense amounted to $5,641,000 (2010: $3,308,000). The reversal was for a write-down no longer required as the particular inventory for which the provision was made had been processed and sold. This is included in the costs of tin mining and smelting in profi t or loss.
26 INCOME TAX RECEIVABLES
Group Company2011 2010 2011 2010
$’000 $’000 $’000 $’000
Income tax receivables 4,513 11,107 19 11
27 CASH AND CASH EQUIVALENTS
Group Company2011 2010 2011 2010
$’000 $’000 $’000 $’000
Cash at bank and in hand 49,999 49,906 1,633 516Short-term deposits 255,750 21,551 171,808 587Amounts held under the “Project Account Rules-
1997 Ed” 7,574 140 – –313,323 71,597 173,441 1,103
Cash at bank earns interest at fl oating rates based on daily bank deposit rates. Short-term deposits are placed for varying periods depending on the immediate cash requirements of the Group, and earn interest at the respective short-term deposit rates. The weighted average effective interest rates as at 31 December 2011 for the Group and the Company were 1.1% (2010: 2.0%) per annum and 0.4% (2010: 2.3%) per annum respectively.

125THE STRAITS TRADING COMPANY LIMITED ANNUAL REPORT 2011
NOTES TO THE FINANCIAL STATEMENTSFor the Financial Year Ended 31 December 2011
27 CASH AND CASH EQUIVALENTS (cont’d)
Included in cash at bank and deposits of the Group, is an amount of $1,688,000 (2010: $1,991,000) relating to Advertising and Promotion (A&P) Reserve Sum maintained with a fi nancial institution by a subsidiary for A&P expenses and minor refurbishment works to the retail component on No. 18, 20, 22 Cross Street, Singapore, in accordance with the master lease agreement executed on 30 March 2006 and the variation of lease executed on 8 March 2010 by this subsidiary. Also refer to note 33.
Included in cash at bank and deposits of the Group is a project account amounting to $7,574,000 (2010: $140,000) maintained with a fi nancial institution for a housing development project undertaken by a subsidiary company. The operation of the project account is governed by the Housing Developers (Project Account) Rules (1997 Ed.).
Cash and cash equivalents denominated in foreign currencies other than the functional currencies of the respective Group entities are as follows:
Group Company2011 2010 2011 2010
$’000 $’000 $’000 $’000
Malaysian Ringgit 13 13 – –
Indonesian Rupiah 1,312 1,134 – –
Australian Dollar 113 50 27 27
United States Dollar 26,648 27,999 – –
For the purpose of the consolidated cash fl ow statement, cash and cash equivalents comprise the following at the end of the reporting period:
Group2011 2010
$’000 $’000
Cash and cash equivalents of the Group 313,323 71,597
Disposal group classifi ed as held for sale (note 23) – 220
313,323 71,817
28 SHARE CAPITAL
Group and Company2011 2010
Number ofshares
Share capital
Number ofshares
Share capital
’000 $’000 ’000 $’000
Ordinary shares issued and fully paid:
At 1 January and 31 December 325,897 265,928 325,897 265,928
The holders of ordinary shares are entitled to receive dividends as and when declared by the Company. All ordinary shares carry one vote per share without restriction. The ordinary shares have no par value.

126 TRANSFORMATION
NOTES TO THE FINANCIAL STATEMENTSFor the Financial Year Ended 31 December 2011
29 RESERVES
Group Company2011 2010 2011 2010$’000 $’000 $’000 $’000
Retained earnings (a) 783,370 746,405 172,528 108,890
AFS reserve (b) (30,551) 40,471 (10,716) 16,084Hedging reserve (c) (25) 210 – –Revaluation reserve (d) 144,316 97,248 175 147Share option reserve (e) – 84 – –Capital reserve (f) – 93 – –Translation reserve (g) (614) (2,853) (3,964) (2,983)Other reserves 113,126 135,253 (14,505) 13,248
(a) Retained Earnings
Group Company2011 2010 2011 2010$’000 $’000 $’000 $’000
At 1 January 746,405 724,754 108,890 105,015
Net changes in the reserve 36,965 21,651 63,638 3,875
At 31 December 783,370 746,405 172,528 108,890
Net changes in the reserve:
– Profi t for the year 45,621 28,169 68,444 10,393– Dividends on ordinary shares (note 34) (6,518) (6,518) (6,518) (6,518)– Unclaimed dividends written back 1,712 – 1,712 –– Changes in ownership interests in
subsidiaries that do not result in a loss of control (3,934) – – –
– Transferred from share option reserve upon disposal of a subsidiary (note 29(e)) 84 – – –
36,965 21,651 63,638 3,875

127THE STRAITS TRADING COMPANY LIMITED ANNUAL REPORT 2011
NOTES TO THE FINANCIAL STATEMENTSFor the Financial Year Ended 31 December 2011
29 RESERVES (cont’d)
(b) AFS Reserve
AFS reserve records the cumulative fair value changes of available-for-sale fi nancial assets until they are derecognised or impaired. The movements in the AFS reserve are as follows:
Group Company2011 2010 2011 2010
$’000 $’000 $’000 $’000
At 1 January 40,471 76,179 16,084 29,642Net changes in the reserve (71,022) (35,708) (26,800) (13,558) At 31 December (30,551) 40,471 (10,716) 16,084
Net changes in the reserve:– Net fair value changes during the year (71,022) (35,993) (26,800) (13,558) – Recognised in profi t or loss: – on impairment of investment securities – 285 – –
(71,022) (35,708) (26,800) (13,558)
(c) Hedging Reserve
Hedging reserve records the portion of the fair value changes on derivative fi nancial instruments designated as hedging instruments in cash fl ow hedges that is determined to be an effective hedge. The movements in the hedging reserve are as follows:
Group Company2011 2010 2011 2010
$’000 $’000 $’000 $’000
At 1 January 210 (4,652) – (2,573)Net changes in the reserve (235) 4,862 – 2,573At 31 December (25) 210 – –
Net changes in the reserve:– Net fair value changes during the year (263) 202 – (2,803)– Recognised in profi t or loss: – Loss on interest rate swap recognised in
‘Finance Costs’ – 2,178 – 2,178 – Interest rate swap close-out costs – 3,198 – 3,198 – Ineffective cash fl ow hedge 85 (716) – – – Changes in ownership interests in
subsidiaries that do not result in a loss of control (57) – – –
(235) 4,862 – 2,573

128 TRANSFORMATION
NOTES TO THE FINANCIAL STATEMENTSFor the Financial Year Ended 31 December 2011
29 RESERVES (cont’d)
(d) Revaluation Reserve
The revaluation reserve is used to record increases in the fair value of land and buildings and decreases to the extent that such decrease relates to an increase on the same asset previously recognised in equity. The movements in the revaluation reserve are as follows:
Group Company2011 2010 2011 2010$’000 $’000 $’000 $’000
At 1 January 97,248 64,460 147 129Net changes in the reserve 47,068 32,788 28 18At 31 December 144,316 97,248 175 147
Net changes in the reserve:– Surplus on revaluation of land and buildings 48,544 32,788 28 18– Changes in ownership interests in
subsidiaries that do not result in a loss of control (1,476) – – –
47,068 32,788 28 18
(e) Share Option Reserve
Share option reserve of a subsidiary represents the equity-settled share options granted to its directors and company secretary as a component of remuneration. The reserve is made up of the cumulative value of equity-settled share options granted for services received. The subsidiary was disposed of during the fi nancial year 2011 and the balance in share option reserve was transferred to retained earnings.
Group2011 2010
$’000 $’000
At 1 January 84 84Transferred to retained earnings upon disposal of a subsidiary (note 29(a)) (84) –At 31 December – 84
(f) Capital Reserve
The capital reserves arose as a result of changes in the ownership interests of subsidiaries that do not result in a loss of control and were accounted for as equity transactions. The capital reserves were transferred to retained earnings during the fi nancial year 2011.

129THE STRAITS TRADING COMPANY LIMITED ANNUAL REPORT 2011
NOTES TO THE FINANCIAL STATEMENTSFor the Financial Year Ended 31 December 2011
29 RESERVES (cont’d)
(g) Translation Reserve
The exchange translation reserve is used to record exchange differences arising from the translation of the fi nancial statements of foreign operations whose functional currencies are different from that of the Group’s and Company’s presentation currency. It is also used to record the effect of exchange differences arising from monetary items which form part of the Group’s net investments in foreign operations. The movements in the translation reserve are as follows:
Group Company2011 2010 2011 2010
$’000 $’000 $’000 $’000
At 1 January (2,853) (10,113) (2,983) (3,876) Net effect of exchange adjustments 2,239 7,260 (981) 893 At 31 December (614) (2,853) (3,964) (2,983)
Net effect of exchange adjustments:– Translation of foreign operations (1,613) 9,494 (981) 893 – Net investments in foreign operations 883 (3,533) – –– Transfer to profi t or loss on liquidation
of subsidiaries – 126 – –– Transfer to reserve of disposal group
classifi ed as held for sale – 1,173 – –– Changes in ownership interests in
subsidiaries that do not result in a loss of control 2,969 – – –
2,239 7,260 (981) 893

130 TRANSFORMATION
NOTES TO THE FINANCIAL STATEMENTSFor the Financial Year Ended 31 December 2011
30 PROVISIONS
Mine Provisionrehabilitation for onerous
provision contracts Total$’000 $’000 $’000
GROUPAt 1 January 2011 10,224 5,927 16,151Provision made during the year 7,444 – 7,444Reversal during the year – (1,404) (1,404)Discount adjustment on provision (note 8) 53 – 53Exchange adjustment 267 41 308At 31 December 2011 17,988 4,564 22,552
Non-current 12,010 2,092 14,102Current 5,978 2,472 8,450
17,988 4,564 22,552
At 1 January 2010 8,435 – 8,435Provision made during the year 2,406 5,927 8,333Discount adjustment on provision (note 8) 52 – 52Attributable to disposal group classifi ed as held
for sale (note 23) (66) – (66)Exchange adjustment (603) – (603)At 31 December 2010 10,224 5,927 16,151
Non-current 8,373 4,792 13,165Current 1,851 1,135 2,986
10,224 5,927 16,151
The provision for mine rehabilitation is in respect of mine rehabilitation expenditure to be incurred subsequent to the cessation of production of each mine property. It is provided based on the present value of the estimated expenditure to be incurred.
Provision for onerous contracts relates to onerous leases of certain hotels where the unavoidable cost of meeting the obligations exceed the economic benefi t expected to be derived over the remaining contractual terms. The balance will be released over the life of contracts until 2016 and 2020 respectively. During the fi nancial year, provision for onerous contracts of $1,404,000 has been reversed.

131THE STRAITS TRADING COMPANY LIMITED ANNUAL REPORT 2011
NOTES TO THE FINANCIAL STATEMENTSFor the Financial Year Ended 31 December 2011
31 BORROWINGS
Group Company2011 2010 2011 2010
$’000 $’000 $’000 $’000
Non-current Secured:Term loan A 215,098 214,741 – –Term loan B 21,465 – – –
236,563 214,741 – –
Unsecured:Revolving credit facilities 1 (a) 9,726 16,195 – –Revolving credit facilities 3 (c) – 22,109 – 22,109Revolving credit facilities 4 (d) 6,604 – – –Term Loan 2 (f) – 1,826 – –Term Loan 3 (g) 5,836 16,519 – –Term Loan 4 (h) 24,116 24,734 – –Term Loan 5 (i) 13,438 – – –Fixed rate notes (k) 223,907 – 223,907 –
283,627 81,383 223,907 22,109Non-current 520,190 296,124 223,907 22,109
CurrentSecured:Term loan C – 22,339 – –
Unsecured:Short-term trade fi nancing (j) 30,214 16,903 – –Bankers’ acceptances (j) 153,855 213,005 – –Revolving credit facilities 1 (a) 6,484 5,182 – –Revolving credit facilities 2 (b) 11,671 11,660 – –Term loan 1 (e) – 1,258 – –Term loan 2 (f) 1,828 2,591 – –Term loan 3 (g) 10,698 8,745 – –
214,750 259,344 – –Current 214,750 281,683 – –
Total borrowings 734,940 577,807 223,907 22,109

132 TRANSFORMATION
NOTES TO THE FINANCIAL STATEMENTSFor the Financial Year Ended 31 December 2011
31 BORROWINGS (cont’d) Secured
The secured term loan A is part of a 4-year secured loan facility due in September 2014. The facility is mainly secured by mortgages over the land and building at No. 9 Battery Road, Singapore and legal assignment of all rights, titles and interests under contracts in respect of the mortgaged properties.
The secured term loan B is secured by mortgages over the 14 residential units at The Holland Collection, Singapore and legal assignment of all rights, titles and interests under contracts in respect of the mortgaged properties. The loan is due in April 2015.
The secured term loan C is secured by, inter alia, legal mortgages over the land and strata bungalows erected on Five Chancery, Singapore. The loan must be repaid 6 months after issuance of Temporary Occupation Permit or 25 December 2011, whichever is earlier. The loan was fully repaid in 2011.
Unsecured
(a) The unsecured revolving credit facilities 1 which is denominated in US Dollar was restructured to long-term facility and is repayable by 10 semi-annual principal repayments commencing on 30 September 2009.
(b) The unsecured revolving credit facilities 2 is utilised for working capital requirements.
(c) The unsecured revolving credit facilities 3 is part of a 4-year fl oating facility due in November 2014.
(d) The unsecured revolving credit facilities 4 is part of a 5-year fl oating facility due in April 2016. The loan has been fully repaid in 2012.
(e) The unsecured term loan 1 is denominated in Malaysian Ringgit and is repayable by 8 semi-annual principal repayments of RM1.5 million each commencing on 1 May 2008. The loan has been fully repaid during the fi nancial year.
(f) The unsecured term loan 2 is denominated in US Dollar and is repayable by 16-quarterly principal repayments commencing on 11 May 2009.
(g) The unsecured term loan 3 is denominated in US Dollar and is repayable by 20-quarterly principal repayments commencing on 20 September 2008.
(h) The unsecured term loan 4 is a 3-year term loan facility due in April 2013 and is denominated in Malaysian Ringgit. The term loan is guaranteed by the Company (note 38 (c)).
(i) The unsecured term loan 5 is a 4-year term loan facility due in April 2015.
(j) Short-term trade fi nancing is denominated in US Dollar. Bankers’ acceptances are denominated in Malaysian Ringgit. All these facilities were utilised for working capital requirements involving purchases and sales of tin concentrates and tin metal.

133THE STRAITS TRADING COMPANY LIMITED ANNUAL REPORT 2011
NOTES TO THE FINANCIAL STATEMENTSFor the Financial Year Ended 31 December 2011
31 BORROWINGS (cont’d) Unsecured (cont’d)
(k) On 13 October 2011, the Company established a $500,000,000 Multicurrency Debt Issuance Programme under which the Company may, subject to compliance with all relevant laws, regulations and directives, from time to time issue notes in series in Singapore dollars and/or any other currencies, in various amounts and tenures, and which may bear fi xed, fl oating, variable or hybrid rates of interest, as may be agreed between the Company and the relevant dealer(s). The notes will be issued pursuant to exemptions invoked under Section 274 and 275 of the Securities and Futures Act, Chapter 289 of Singapore.
On 9 November 2011, $225,000,000 of unsecured 5-year fi xed rate notes (“the notes”) were issued. The notes will mature on 9 November 2016 and bear a fi xed interest of 4.3% per annum payable semi-annually in arrear.
The interest rates of the term loans are repriced at intervals of 1 month to 3 months (2010: 1 month to 3 months).
The range of interest rates incurred during the year for the borrowings are as follows:
Group Company2011 2010 2011 2010
% per annum % per annum % per annum % per annum
SecuredTerm loan A * 1.3 to 2.6 1.5 to 2.6 – –Term loan B # 1.0 to 2.6 – – –Term loan C 1.5 to 1.9 1.7 to 4.0 – –
UnsecuredTerm loan 1 4.7 to 5.1 4.4 to 4.8 – –Term loan 2 1.9 to 2.7 1.9 to 2.5 – –Term loan 3 3.8 3.8 to 4.3 – –Term loan 4 ¢ 4.5 to 5.6 4.1 to 4.6 – –Term loan 5 ^ 1.0 to 2.6 – – –Short-term trade fi nancing 1.0 to 2.2 1.1 to 1.8 – –Bankers’ acceptances 3.3 to 4.1 2.3 to 4.2 – –Revolving credit facilities 1 1.9 to 2.7 1.9 to 2.4 – –Revolving credit facilities 2 3.7 3.6 to 4.0 – –Revolving credit facilities 3 1.5 to 1.7 1.6 to 1.7 1.5 to 1.7 1.6 to 1.7Revolving credit facilities 4 1.3 to 1.6 – – –Fixed rate notes 4.3 – 4.3 –
As at 31 December, the fi xed rate loans are at interest rates of: * 2.6% and 2.1% per annum. (2010: 2.6%)
# 2.6% and 2.0% per annum.
¢ Part of the loan was fi xed at 5.6% per annum.
^ 2.6% and 2.0% per annum.

134 TRANSFORMATION
NOTES TO THE FINANCIAL STATEMENTSFor the Financial Year Ended 31 December 2011
32 OTHER NON-CURRENT LIABILITIES
Group2011 2010
$’000 $’000
Retention sums payable 684 416Deferred income on sale of No. 18, 20 and 22 Cross Street # – 4,531Unrealised profi t on sale of properties to associates 1,318 2,050Severance benefi t obligations (note 33(a)) 38 39Other liabilities 591 496
2,631 7,532
# During the fi nancial year, the Group amortised $3,625,000 (2010: $3,625,000) from deferred income to profi t or loss. The remaining unamortised deferred income was reclassifi ed to other payables under current liabilities.
33 TRADE AND OTHER PAYABLES
Group Company2011 2010 2011 2010
$’000 $’000 $’000 $’000
Current:Trade payables 45,123 38,885 2,270 388Advance receipts and billings 1,012 1,209 19 14
46,135 40,094 2,289 402Other payablesAmounts due to subsidiaries – – 65,987 100,780Accrual for development cost 9,593 2,311 – –Accrual for other charges 16,468 12,980 1,289 655Other deposits 8,759 8,370 357 302Severance benefi t obligations 202 702 – –Amounts due to joint ventures 11,979 57 – –Others # 47,771 45,273 2,563 4,224
94,772 69,693 70,196 105,961Trade and other payables (current) 140,907 109,787 72,485 106,363
Non-Current:Loan from a subsidiary – – – 143,213
Total trade and other payables (current and non-current) 140,907 109,787 72,485 249,576
Less: Advance receipts and billings (1,012) (1,209) (19) (14) Severance benefi t obligations (202) (702) – –
139,693 107,876 72,466 249,562Add: Other non-current liabilities (note 32) 1,275 912 – – Loans and borrowings (note 31) 734,940 577,807 223,907 22,109Total fi nancial liabilities carried at amortised cost 875,908 686,595 296,373 271,671

135THE STRAITS TRADING COMPANY LIMITED ANNUAL REPORT 2011
NOTES TO THE FINANCIAL STATEMENTSFor the Financial Year Ended 31 December 2011
33 TRADE AND OTHER PAYABLES (cont’d)
Trade payables
The Group’s normal trade credit ranges from cash payment to 90-day terms.
Other payables
# Included:
(i) $1,688,000 (2010: $1,991,000) relating to Advertising and Promotion (A&P) Reserve sum (note 27) of a subsidiary for A&P expenses and minor refurbishment works to the retail component on No. 18, 20, 22 Cross Street, Singapore.
(ii) $13,363,000 (2010: $8,019,000) relating to amount withheld pending fi nalisation of accounts from mine contractor.
(iii) $14,641,000 (2010: $13,708,000) mainly value added tax payable to the Indonesia tax authority.
(iv) $906,000 (2010: Nil) relating to deferred income on sale of No. 18, 20 and 22 Cross Street was reclassifi ed from other non-current liabilities to other payables under current liabilities during fi nancial year 2011.
Amounts due to subsidiaries
The amounts payable to subsidiaries are non-trade related, unsecured, non-interest bearing and repayable on demand in cash.
Loan from a subsidiary
Loan from a subsidiary is non-trade related, unsecured and bears interest based on prevailing market rate ranging from 4.8% to 5.0% (2010: 4.7%) per annum. The loan was settled in 2011.
Amounts due to joint ventures The amounts payable to joint ventures are non-trade related, non-interest bearing and repayable on demand in cash.
Trade and other payables denominated in foreign currencies other than the functional currencies of the respective Group entities are as follows:
Group Company2011 2010 2011 2010
$’000 $’000 $’000 $’000
Singapore Dollar 1,008 1,904 – –Malaysian Ringgit 957 1,010 61 –United States Dollar 24,410 13,346 558 –Australian Dollar 111 198 12 143,213Indonesian Rupiah 4,554 5,334 – –Euro – 599 – –

136 TRANSFORMATION
NOTES TO THE FINANCIAL STATEMENTSFor the Financial Year Ended 31 December 2011
33 TRADE AND OTHER PAYABLES (cont’d)
Severance benefi t obligations
The subsidiaries in Indonesia operate a partly funded, Severance Benefi ts Scheme (“the Scheme”) for their eligible employees. Under the Scheme, eligible permanent employees confi rmed in service are entitled to severance benefi ts due to reduction or termination of operations, termination due to ill-health or death and on attainment of the normal retirement age of 55 or early retirement age of 50 due to ill-health. The obligations under the Scheme are determined based on actuarial valuation.
The following table summarises the components of the Scheme in the fi nancial statements:
(a) The amounts recognised in the balance sheet are determined as follows:
Group2011 2010
$’000 $’000
Present value of unfunded defi ned benefi t obligations 19,268 16,618Fair value of plan asset (15,389) (11,209)Unrecognised actuarial losses (3,493) (4,300)Unrecognised past service costs (146) (368)Net liability 240 741
Analysed as:Current 202 702
Non-currentLater than 5 years 38 39 (note 32) 38 39
240 741
(b) The amounts recognised in profi t or loss are as follows:
Group2011 2010
$’000 $’000
Current service cost 3,149 2,324Interest cost 1,040 1,272Net actuarial losses 208 230Past service costs 876 733Expected return on plan asset (1,298) (961)Total, included in employee benefi ts expense (note 6) 3,975 3,598

137THE STRAITS TRADING COMPANY LIMITED ANNUAL REPORT 2011
NOTES TO THE FINANCIAL STATEMENTSFor the Financial Year Ended 31 December 2011
33 TRADE AND OTHER PAYABLES (cont’d)
Severance benefi t obligations (cont’d)
(c) Movements in the net liability in the current year are as follows:
Group2011 2010
$’000 $’000
At 1 January 741 3,167Amounts recognised in profi t or loss (note 6) 3,975 3,598Paid during the year (34) (1,459)Plan asset (4,608) (4,480)Exchange adjustment 166 (85)At 31 December 240 741
(d) Principal actuarial assumptions used are as follows:
2011 2010% per annum % per annum
Discount rate 4.75 – 6.80 6.50 – 8.00Expected rate of return on assets 9.5 9.5Expected rate of salary increases 7.0 – 10.0 10.0
Plan asset
This is in respect of an insurance scheme for a severance pay product based on an agreement between a subsidiary in Indonesia and an insurance company in Indonesia.
The subsidiary will pay the funding for the future benefi t payments to the insurer, and the insurer will accumulate the subsidiary’s funding in a managed pooled fund. The calculation for the benefi ts refers to the Collective Labour Agreement and in certain circumstances to Indonesian Labour Law.

138 TRANSFORMATION
NOTES TO THE FINANCIAL STATEMENTSFor the Financial Year Ended 31 December 2011
34 DIVIDENDS
Group and Company2011 2010$’000 $’000
Declared and paid during the year:
Dividends on ordinary shares:
• 2010 Interim dividend paid in 2011: 2 cents per share tax exempt (one-tier tax) 6,518 6,518 [2009 Interim dividend paid in 2010: 2 cents per share tax exempt (one-tier tax)]
Declared but not recognised as a liability as at 31 December:
Dividends on ordinary shares:
• Interim dividend for 2011: 4 cents per share tax exempt (one-tier tax) 13,036 6,518 [Interim dividend for 2010: 2 cents per share tax exempt (one-tier tax)]
There is no taxation consequence arising from the dividends declared on the Company.
35 CAPITAL COMMITMENTS
Capital commitments not provided for in the fi nancial statements are analysed as follows:
Group2011 2010
$’000 $’000
Property, plant and equipment 8,919 968Investment property – 6,943Development properties for sale – 20,216Investment in an associate 4,306 4,090
13,225 32,217

139THE STRAITS TRADING COMPANY LIMITED ANNUAL REPORT 2011
NOTES TO THE FINANCIAL STATEMENTSFor the Financial Year Ended 31 December 2011
36 LEASE COMMITMENTS
Operating Lease Commitments
(a) For Lessor
The Group and Company have entered into property lease agreements on their property, plant and equipment, investment properties and completed development properties for sale. These non-cancellable leases have remaining non-cancellable lease terms of up to 4 years. Contingent lease receipts are subject to the revenue exceeding a level stated in the respective agreements. Certain property lease agreements have renewal options of up to 5 years for each option term, up to 2 terms, and restrict any assignment and subletting of the lease properties.
Contingent lease receipts recognised in profi t or loss at Group level amounted to $26,000 (2010: Nil).
Future minimum lease receivable under non-cancellable operating leases are as follows:
Group Company2011 2010 2011 2010
$’000 $’000 $’000 $’000
Not later than 1 year 20,330 19,607 1,673 1,414Later than 1 year but not later than 5 years 29,053 37,225 1,185 1,426Later than 5 years – 91 – –
49,383 56,923 2,858 2,840
(b) For Lessee
The Group has entered into operating lease agreements for properties and offi ce equipment. These non-cancellable operating leases have remaining non-cancellable lease terms of up to 8 years. Contingent rents are payable subject to the related revenue exceeding a level stated in the respective agreements. Certain property lease agreements have renewal options of up to 5 years for each option term, up to 4 terms. The lessee shall not assign, mortgage or charge the lease property without prior consent of the landlord. There is no restriction imposed by lease arrangements, such as those concerning dividends and additional debt.
Operating lease payments recognised in profi t or loss are as follows:
Group2011 2010
$’000 $’000
Minimum lease payments 42,637 42,879Contingent lease payments 6,669 6,480
49,306 49,359

140 TRANSFORMATION
NOTES TO THE FINANCIAL STATEMENTSFor the Financial Year Ended 31 December 2011
36 LEASE COMMITMENTS (cont’d)
(b) For Lessee (cont’d)
Future minimum lease payable under non-cancellable operating leases are as follows:
Group2011 2010
$’000 $’000
Not later than 1 year 30,298 46,236Later than 1 year but not later than 5 years 95,383 108,815Later than 5 years 15,055 36,086
140,736 191,137
For Sub-Lease Commitments as Lessor
The Group has entered into property lease agreements on the property at No. 18, 20 and 22 Cross Street. These non-cancellable operating leases have remaining non-cancellable lease terms of less than 1 year. Contingent lease receipts are subject to the revenue exceeding a level stated in the respective agreements.
Contingent lease receipts recognised in profi t or loss amounted to $84,000 (2010: $71,000).
Future minimum lease receivable under non-cancellable operating leases are as follows:
Group2011 2010$’000 $’000
Not later than 1 year 5,430 19,933Later than 1 year but not later than 5 years – 12,246
5,430 32,179

141THE STRAITS TRADING COMPANY LIMITED ANNUAL REPORT 2011
NOTES TO THE FINANCIAL STATEMENTSFor the Financial Year Ended 31 December 2011
37 RELATED PARTY DISCLOSURES
(a) Sale and Purchase of Goods and Services
In addition to related party information disclosed elsewhere in the fi nancial statements, signifi cant transactions with related parties on terms agreed between the parties are as follows:
Group2011 2010
$’000 $’000
Associates/joint ventures Sales of goods 21,629 22,813Interest income 722 46Rendering of services 47 –
Key management personnel of the CompanySale of property – 6,565Receiving of services 34* –
Other related partiesReceiving of services – 152Offi ce leases 791 701
* The amount payable is outstanding as at 31 December 2011 and is included in note 33.
Please refer to notes 19 and 33 for information on amount due from/to subsidiaries, associates and joint
ventures.
(b) Key Management Personnel Compensation
The key management personnel compensation are as follows:
Group2011 2010
$’000 $’000
Directors’ fees 645 615Short-term employee benefi ts 2,809 2,849Defi ned contribution plans 123 114
3,577 3,578Comprise amounts paid to:– Directors of the Company 1,497 1,608– Other key management personnel 2,080 1,970
3,577 3,578

142 TRANSFORMATION
NOTES TO THE FINANCIAL STATEMENTSFor the Financial Year Ended 31 December 2011
38 CONTINGENT LIABILITIES AND COMMITMENTS
Company2011 2010
$’000 $’000
(a) Financial support given to those subsidiaries having defi ciencies in shareholders’ funds 139,948 140,592
(b) At 31 December 2011, material outstanding litigations against Malaysia Smelting Corporation Berhad (“MSC”) are as follows:
(i) Since the takeover of Rahman Hydraulic Tin Sdn. Bhd. (“RHT”) on 22 November 2004, the following
legal suit is pending against RHT:
Two former directors of RHT had made a claim for compensation amounting to approximately $981,000 pursuant to service agreements entered on 31 March 2000 between them and RHT. One of the former directors has commenced proceedings in the Industrial Court for wrongful dismissal as the managing director of RHT, seeking reinstatement. The claims were dismissed by the Industrial Court. The appeal of the director for a judicial review was also dismissed by the court. The director further appealed to the Court of Appeal on 29 June 2009. The matter has been fi xed for case management on 8 May 2012. It is the vendor’s intention to dispute the claims of these former directors based on its solicitors’ advice that the service agreements are void and therefore are of no effect. A notice of motion to strike out the director’s appeal has been fi led on 6 March 2012.
In accordance with the Sale of Shares Agreement dated 1 October 2004 between the vendor of RHT and MSC (the Purchaser), the vendor shall do the necessary to defend and settle all legal suits against RHT in relation to matters that occurred prior to completion date, being 22 November 2004 or shall cause these legal suits to be transferred from RHT to the vendor.
(ii) In May 2008, the Minister of Energy and Mineral Resources, Indonesia issued a new regulation regarding mine reclamation and closure as detailed in the Minister Regulation No. 18 year 2008, which requires a company to provide a mine closure guarantee in the form of a time deposit placed in a state owned bank in Indonesia. The subsidiary in Indonesia does not believe that a deposit is required under the terms of its Contract of Work but it is working with the Indonesian Mining Association to review these requirements with the Indonesian government and discuss other options for the mine closure guarantee.
(iii) On 9 February 2011, the Penang High Court delivered a decision that MSC has to pay $50,000 , interest at the rate of 4% per annum from the date of claim to the date of judgement and further interest at 8% per annum after date of judgement to date of payment. This is in respect of a statement of claim received by MSC on 7 February 2006 from a party for $523,000 with interest at 8% per annum from the date of summons to the date of settlement plus costs for an alleged cost overrun for the implementation of an Enterprise Resource Planning System. The party fi led an appeal to the Court of Appeal against the judgement of Penang High Court allowing only part of its claim. No hearing date has been fi xed for the appeal.

143THE STRAITS TRADING COMPANY LIMITED ANNUAL REPORT 2011
NOTES TO THE FINANCIAL STATEMENTSFor the Financial Year Ended 31 December 2011
38 CONTINGENT LIABILITIES AND COMMITMENTS (cont’d)
(c) Guarantees
Group
(i) A bank guarantee for $409,000 (2010: $419,000) issued by Malaysia Smelting Corporation Berhad (“MSC”) to Kuala Lumpur Tin Market.
(ii) A guarantee for $2,733,000 (2010: $2,733,000) issued by a subsidiary to Controller of Residential Property.
(iii) A bank guarantee for $6,000,000 (2010: $6,000,000) issued by a subsidiary to British and Malayan Trustees Limited.
(iv) Joint undertaking by the Company and its subsidiary, Rendezvous Hotels International Private Limited (“RHI”) for indemnity in respect of bank guarantee facilities utilised by subsidiaries under RHI Group amounting to $16,875,000 (2010: $16,767,000).
(v) A bank guarantee for $270,000 issued by a subsidiary, Hotel Rendezvous Private Limited to Tuas Power Supply Pte Ltd. In 2010, a bank guarantee for $280,000 issued by the Company to Tuas Power Supply Pte Ltd, for electricity supply to this subsidiary.
Company
In addition to the undertaking/guarantee issued by the Company in item (iv) and (v) above, the Company has also provided a corporate guarantee to a bank for a $24,116,000 (2010: $24,734,000) loan (note 31) taken by a subsidiary.
39 FINANCIAL RISK MANAGEMENT
The Group’s activities expose it to a variety of fi nancial risks. Apart from those risks generated from operations such as extending credits and cash fl ow management, other risks include the effects of changes in debt and equity market prices, foreign currency exchange rates, interest rates and commodity prices.
The Group’s management monitors its fi nancial position closely with an objective to minimise potential adverse effects on the fi nancial performance of the Group. The Group uses derivative fi nancial instruments, where appropriate, for its risk management activities but does not hold or issue derivative fi nancial instruments for trading purposes.
There has been no change to the Group’s exposure to these risks or the manner in which it manages the risks.

144 TRANSFORMATION
NOTES TO THE FINANCIAL STATEMENTSFor the Financial Year Ended 31 December 2011
39 FINANCIAL RISK MANAGEMENT (cont’d)
The policies for managing these risks are summarised below.
(a) Foreign exchange risk
The Group operates mainly in Asia Pacifi c and has exposure to foreign exchange risk as a result of sales or purchase transactions that are denominated in a currency other than the functional currencies of the respective Group entities. These foreign exchange risk exposures are mainly in Malaysian Ringgit, Australian Dollar, United States Dollar and Indonesian Rupiah. The Group uses foreign currency forward contracts to manage these exposures which are relatively certain in their timing and extent. The Group also uses term loans in foreign currency to hedge its exposure to foreign exchange risk on investments in foreign operations where appropriate.
Sensitivity analysis for foreign currency risk
The following table demonstrates the sensitivity of the Group’s profi t after tax and equity to a reasonably possible change in the exchange rates of the United States Dollar, Malaysian Ringgit, Australian Dollar, Singapore Dollar and Indonesian Rupiah, against the functional currencies of the respective Group entities, with all other variables held constant.
Group2011 2010
Profi t after Profi t after tax Equity tax Equity
$’000 $’000 $’000 $’000
United States Dollar strengthened 5% (2010: 5%) (718) (2,326) 368 (1,070)weakened 5% (2010: 5%) 644 2,293 230 1,071
Malaysian Ringgit strengthened 5% (2010: 5%) (34) – (36) –weakened 5% (2010: 5%) 34 – 36 –
Australian Dollar strengthened 5% (2010: 5%) 1 1,915 (5) (3,920)weakened 5% (2010: 5%) (1) (1,915) 5 3,920
Singapore Dollar strengthened 5% (2010: 5%) (35) (837) (67) (837)weakened 5% (2010: 5%) 35 837 67 837
Indonesian Rupiah strengthened 5% (2010: 5%) 362 – 332 –weakened 5% (2010: 5%) (362) – (332) –
At the end of the reporting period, approximately:
(i) 56% (2010: 51%) of the Group’s trade and other receivables as well as 23% (2010: 20%) of the Group’s trade and other payables are denominated in foreign currencies other than the functional currencies of the respective Group entities, mainly in United States Dollar and Indonesian Rupiah.
(ii) 9% (2010: 41%) of the Group’s cash and cash equivalents are denominated in foreign currencies other than the functional currencies of the respective Group entities, mainly in United States Dollar and Indonesian Rupiah.
(iii) 7% (2010: 7%) of the Group’s borrowings are denominated in foreign currencies other than the functional currencies of the respective Group entities, mainly in United States Dollar.

145THE STRAITS TRADING COMPANY LIMITED ANNUAL REPORT 2011
NOTES TO THE FINANCIAL STATEMENTSFor the Financial Year Ended 31 December 2011
39 FINANCIAL RISK MANAGEMENT (cont’d)
(b) Interest rate risk
Interest rate risk is the risk that the fair value or future cash fl ows of the Group’s and the Company’s fi nancial instruments will fl uctuate because of changes in market interest rates. The Group’s exposure to market risk for changes in interest rates relates primarily to its cash deposits and debt obligations.
The Group’s policy is to manage its interest cost using a combination of fi xed and fl oating rate debts and also derivative fi nancial instruments such as interest rate swaps and cross currency swaps to hedge interest rate risks.
Surplus funds are placed with reputable banks to generate interest income for the Group.
The table below demonstrates the sensitivity to a possible reasonable change in interest rates with all other variables held constant, of the Group’s profi t after tax through the impact on interest income from bank deposits and interest expense on fl oating rate borrowings:
GroupIncrease/decrease Effect on profi t
in basis point after tax$’000
31 December 2011– Singapore Dollar + 50 688
– 50 (688)
– Malaysian Ringgit + 25 (188)– 25 188
– Australian Dollar + 50 18– 50 (18)
– United States Dollar + 25 (89)– 25 89
– Renminbi + 50 4– 50 (4)

146 TRANSFORMATION
NOTES TO THE FINANCIAL STATEMENTSFor the Financial Year Ended 31 December 2011
39 FINANCIAL RISK MANAGEMENT (cont’d)
(b) Interest rate risk (cont’d)
GroupIncrease/decrease Effect on profi t
in basis point after tax$’000
31 December 2010– Singapore Dollar + 50 (618)
– 50 618
– Malaysian Ringgit + 25 (424)– 25 424
– Australian Dollar + 50 33– 50 (33)
– New Zealand Dollar + 50 29– 50 (29)
– United States Dollar + 25 (98)– 25 98
– Renminbi + 50 4– 50 (4)
At the end of the reporting period, for the increase/decrease in the various basis points on interest rates for the various currencies, the effects associated with such changes are on the Group’s profi t after tax as illustrated above.
(c) Credit risk
Credit risk is the risk of loss that may arise on outstanding fi nancial instruments should a counterparty default on its obligation. The Group has no signifi cant concentration of credit risk due to its diverse customer base. The credit risk arising from the Group’s normal commercial operations is controlled by individual operating units within strict credit control and guidelines. Policies are in place to ensure on-going credit evaluation and active account monitoring.
At the end of the reporting period, the Group’s and the Company’s maximum exposure to credit risk is represented by the carrying amount of each class of fi nancial assets recognised on the balance sheet.

147THE STRAITS TRADING COMPANY LIMITED ANNUAL REPORT 2011
NOTES TO THE FINANCIAL STATEMENTSFor the Financial Year Ended 31 December 2011
39 FINANCIAL RISK MANAGEMENT (cont’d)
(c) Credit risk (cont’d)
Financial assets that are neither past due nor impaired
Trade and other receivables that are neither past due nor impaired are creditworthy debtors with good payment record with the Group. Cash and cash equivalents, investment/marketable securities and derivatives that are neither past due nor impaired are placed with or entered into with reputable fi nancial institutions or companies.
Information regarding credit enhancements for trade and other receivables is disclosed in note 19.
Credit risk concentration profi le
The Group determines concentrations of credit risk by monitoring the country profi le of its trade and other receivables on an on-going basis. The credit risk concentration profi le of the Group’s trade and other receivables at the end of the reporting period is as follows:
Group Company2011 2010 2011 2010
$’000 % of total $’000 % of total $’000 % of total $’000 % of total
By country:Singapore 57,202 31 20,883 15 161,890 97 228,878 90Malaysia 7,536 4 9,498 7 4,282 3 2,712 1Indonesia 60,715 33 73,352 52 – – – –Australia 11,393 6 18,221 13 – – 24,161 9China, including
Hong Kong and Taiwan 9,909 5 4,603 3 – – – –
South Africa 21,231 12 7,173 5 – – – –England 4,117 2 67 – – – – –Europe 3,728 2 3,714 3 – – – –New Zealand 1,469 1 1,831 1 – – – –Canada 1,140 1 388 – – – – –Other countries 6,364 3 1,215 1 – – – –
184,804 100 140,945 100 166,172 100 255,751 100
At the end of the reporting period, approximately 23% of the Group’s trade and other receivables were due from 2 major customers who deal in tin, located in South Africa and Indonesia, and value added tax receivable from the Indonesia tax authority.
At 31 December 2010, approximately 26% of the Group’s trade and other receivables were due from 2 major customers who deal in tin, located in Indonesia, and value added tax receivable from the Indonesia tax authority.

148 TRANSFORMATION
NOTES TO THE FINANCIAL STATEMENTSFor the Financial Year Ended 31 December 2011
39 FINANCIAL RISK MANAGEMENT (cont’d) (d) Liquidity risk
Liquidity risk is the risk that the Group or the Company will encounter diffi culty in meeting their fi nancial obligations due to shortage of funds. The Group manages its asset and debt maturity profi le, operating cash fl ows and the availability of funding so as to ensure that all refi nancing, repayment and funding needs are met in a timely and cost-effective manner. Procedures have been established to monitor and control liquidity on a daily basis by adopting a cash fl ow management approach.
The Group assessed the concentration of risk with respect to refi nancing its debt and concluded it to be low. Access to sources of funding is suffi ciently available.
The following summarises the maturity profi le of the Group’s and Company’s fi nancial assets and liabilities used for managing liquidity risk at the end of the reporting period based on contractual undiscounted repayment obligations, including estimated interest payments:
2011$‘000
2010$‘000
1 yearor less
1 to 5years
Over 5 years Total
1 yearor less
1 to 5years
Over 5 years Total
GroupFinancial assets:Marketable securities 13 – – 13 17 – – 17Trade and other
receivables 182,109 2,695 – 184,804 138,630 2,315 – 140,945Cash and cash
equivalents 313,323 – – 313,323 71,597 – – 71,597Non-current security
deposit – – – – – 217 16,550 16,767Derivatives – – – – 487 – – 487Total undiscounted
fi nancial assets 495,445 2,695 – 498,140 210,731 2,532 16,550 229,813
Financial liabilities:Trade and other
payables 139,693 – – 139,693 107,876 – – 107,876Other non-current
liabilities – 1,275 – 1,275 – 811 101 912Loans and borrowings 239,707 564,647 – 804,354 290,255 314,317 – 604,572Derivatives 171 354 – 525 – 576 – 576Total undiscounted
fi nancial liabilities 379,571 566,276 – 945,847 398,131 315,704 101 713,936Total net undiscounted
fi nancial assets/(liabilities) 115,874 (563,581) – (447,707) (187,400) (313,172) 16,449 (484,123)

149THE STRAITS TRADING COMPANY LIMITED ANNUAL REPORT 2011
NOTES TO THE FINANCIAL STATEMENTSFor the Financial Year Ended 31 December 2011
39 FINANCIAL RISK MANAGEMENT (cont’d)
(d) Liquidity risk (cont’d)
2011$‘000
2010$‘000
1 yearor less
1 to 5years
Over 5years Total
1 yearor less
1 to 5years
Over 5 years Total
CompanyFinancial assets:Trade and other
receivables 166,172 – – 166,172 149,286 – 106,465 255,751Cash and cash
equivalents 173,441 – – 173,441 1,103 – – 1,103Total undiscounted
fi nancial assets 339,613 – – 339,613 150,389 – 106,465 256,854
Financial liabilities :Trade and other
payables 72,466 – – 72,466 106,349 – 143,213 249,562Loans and borrowings 9,675 262,375 – 272,050 582 24,079 – 24,661Total undiscounted
fi nancial liabilities 82,141 262,375 – 344,516 106,931 24,079 143,213 274,223Total net undiscounted
fi nancial assets/(liabilities) 257,472 (262,375) – (4,903) 43,458 (24,079) (36,748) (17,369)
Investment securities held for strategic purpose are excluded from the tables above.
The table below shows the contractual expiry by maturity of the Group and Company’s contingent liabilities and commitments. The maximum amount of the fi nancial guarantee contracts are allocated to the earliest period in which the guarantee could be called.
2011$‘000
2010$‘000
1 yearor less
1 to 5years
Over5 years Total
1 yearor less
1 to 5years
Over5 years Total
GroupFinancial guarantees 6,627 11,028 8,632 26,287 699 8,950 16,550 26,199
CompanyFinancial guarantees 218 32,141 8,632 40,991 280 24,951 16,550 41,781

150 TRANSFORMATION
NOTES TO THE FINANCIAL STATEMENTSFor the Financial Year Ended 31 December 2011
39 FINANCIAL RISK MANAGEMENT (cont’d)
(e) Equity price risk
Changes in the market value of investment securities can affect the net income and fi nancial position of the Group. The Group diversifi es its investments by business sector and by country. It manages the risk of unfavourable changes by prudent review of the investments before investing and continuous monitoring of their performance and risk profi les.
The investment securities are classifi ed as held-for-trading or available-for-sale (AFS).
At the end of the reporting period, 100 per cent (2010: 100 per cent) of the Group’s held-for-trading equity portfolio consist of shares of companies in Malaysia. If the Malaysia equity prices had been 5 per cent higher/lower with all other variables held constant, the Group’s profi t after tax would have been $1,000 (2010: $1,000) higher/lower, arising as a result of higher/lower fair value gains.
At the end of the reporting period, 100 per cent (2010: 100 per cent) of the Group’s AFS equity portfolio consist of shares of companies in Singapore. If the Singapore equity prices had been 5 per cent higher/lower with all other variables held constant, the Group’s AFS reserve in equity would have been $6,413,000 (2010: $9,965,000) higher/lower, arising as a result of higher/lower fair value gains.
(f) Commodity price risk
Commodity price risk is the risk of fi nancial loss resulting from movements in the price of the Group’s commodity inputs and outputs. The Group is exposed to commodity price risk arising from revenue derived from sales of tin as well as to the impact of crude oil prices on the cost of fuel consumed in the mining and processing of tin.
The tin price risk is managed through contractual arrangements with customers and derivative instruments such as forward sales contracts.
Fuel is purchased at the spot rate available at time of purchase, which exposes the Group to the impact of changes to world prices for crude oil. However, the Group continues to assess the potential fi nancial risk associated with rising crude oil prices and whether the risk requires the use of derivative instruments.
At the end of reporting period, there was no outstanding forward tin sales contract (2010: Nil).
(g) Capital Management
The Group’s objective is to provide a reasonable return to shareholders by investing and developing into businesses that commensurate with the level of risks. This also takes into account synergies with other operations and activities, the availability of management and other resources, and the fi t of the activities with the Group’s longer strategic objectives.

151THE STRAITS TRADING COMPANY LIMITED ANNUAL REPORT 2011
NOTES TO THE FINANCIAL STATEMENTSFor the Financial Year Ended 31 December 2011
39 FINANCIAL RISK MANAGEMENT (cont’d)
(g) Capital Management (cont’d)
The Group’s policy is to maintain a strong capital base so as to maintain investor, creditor and market confi dence and to sustain future development of the various core businesses. The Group allocates the amount of capital in proportion to risk, manages the capital structure and makes adjustments to it in the light of changes in economic conditions and the risk characteristic of the underlying assets. In order to maintain or adjust the capital structure, the Group may adjust the amount of dividends paid to shareholders, return capital to shareholders, issue new shares, sell assets or increase borrowings. The Group monitors the return of capital, which is defi ned as total shareholders’ equity (excluding non-controlling interests), gearing ratio, which is defi ned as borrowings net of cash over total equity and the level of dividends to shareholders. No changes were made in the objectives, policies or processes during the years ended 31 December 2011 and 31 December 2010.
The Group seeks to maintain a balance between the higher returns that might be possible with higher level of borrowings and the advantages and security afforded by a sound capital position.
Neither the Company nor any of its subsidiaries are subject to externally imposed capital requirement.
Group2011 2010
$’000 $’000
Share capital 265,928 265,928Retained earnings 783,370 746,405Other reserves 113,126 135,253Reserve of disposal group classifi ed as held for sale – (1,173)Equity attributable to owners of the Company 1,162,424 1,146,413Non-controlling interests 97,723 47,190Total equity 1,260,147 1,193,603
Borrowings net of cash 421,617 506,210
Gearing ratio 33.5% 42.4%

152 TRANSFORMATION
NOTES TO THE FINANCIAL STATEMENTSFor the Financial Year Ended 31 December 2011
40 DERIVATIVE FINANCIAL INSTRUMENTS AND HEDGING ACTIVITIES
The Group has the following derivative fi nancial instruments accounted as:
At 31 December 2011:
(i) Cash fl ow hedges
(a) Foreign currency forward contracts designated as hedges against expected future sales in United States Dollar (USD):
Average ExchangeSell USD Range of Maturity Period Rate(In million) RM/USD
47.1 From January 2012 to March 2012 3.1716
At 31 December 2011, net fair value loss of $435,000 with a deferred tax credit of $109,000 relating to the cash fl ow hedges of the expected future sales that were assessed to be highly effective was included in other comprehensive income. Certain forward contracts were assessed to be ineffective. Accordingly, the fair value loss of $206,000 with a deferred tax credit of $52,000 was recognised in the profi t or loss.
(ii) Interest rate swap contract
(a) The interest rate swap contract to manage interest rate risk arising from fl oating rate borrowings in United States Dollar (USD) is as follows:
Notional Amount Maturity Period Receive Floating Interest Rate Pay Fixed Interest Rate(US$ million)
12.5 March 2014 3 month London 2.47%Inter-bank Offer Rate
During the fi nancial year, a fair value gain of $210,000 with a deferred tax expense of $53,000 relating to the interest rate swap contract was recognised in the profi t or loss.

153THE STRAITS TRADING COMPANY LIMITED ANNUAL REPORT 2011
NOTES TO THE FINANCIAL STATEMENTSFor the Financial Year Ended 31 December 2011
40 DERIVATIVE FINANCIAL INSTRUMENTS AND HEDGING ACTIVITIES (cont’d)
At 31 December 2010:
(i) Cash fl ow hedges
(a) Foreign currency forward contracts designated as hedges against expected future sales in United States Dollar (USD) are as follows:
Average ExchangeSell USD Range of Maturity Period Rate(In million) RM/USD
22.0 From January 2011 to February 2011 3.1423
At 31 December 2010, net fair value gain of $681,000 with a deferred tax expense of $170,000 relating to the cash fl ow hedges of the expected future sales that were assessed to be highly effective was included in other comprehensive income. Certain forward contracts were assessed to be ineffective. Accordingly, the fair value gain of $91,000 with a deferred tax expense of $22,000 was recognised in the profi t or loss.
(b) The foreign currency forward contract designated as a hedge against expected future purchase in Singapore Dollar (SGD) is as follows:
Average ExchangeBuy SGD Maturity Period Rate(S$’000) RM/SGD
73.0 January 2011 2.388
The cash fl ow hedge on this forward contract was assessed to be ineffective. Accordingly, the fair value loss of $500 was recognised in the profi t or loss.

154 TRANSFORMATION
NOTES TO THE FINANCIAL STATEMENTSFor the Financial Year Ended 31 December 2011
40 DERIVATIVE FINANCIAL INSTRUMENTS AND HEDGING ACTIVITIES (cont’d)
(i) Cash fl ow hedges (cont’d)
(c) Interest rate swap contracts designated as hedges against interest rate risk arising from fl oating rate borrowings in Singapore Dollar (SGD) are as follows:
Notional Amount Maturity Period Receive Floating Interest Rate Pay Fixed Interest Rate(S$ million)
40.0 September 2011 3 month 2.87%Swap Offer Rate
40.0 September 2011 3 month 2.58%Swap Offer Rate
50.0 September 2011 3 month 1.85%Swap Offer Rate
30.0 September 2011 3 month 1.83%Swap Offer Rate
The cash fl ow hedges of the interest rate risk were assessed to be highly effective. The contracts were closed out during the fi nancial year. Fair value loss of $2,178,000 and settlement cost of $3,198,000 relating to the hedging instruments were transferred from hedging reserve to profi t or loss.
(ii) Interest rate swap contract
(a) The interest rate swap contract to manage interest rate risk arising from fl oating rate borrowings in United States Dollar (USD) is as follows:
Notional Amount Maturity Period Receive Floating Interest Rate Pay Fixed Interest Rate(US$ million)
16.5 March 2014 3 month London 2.47%Inter-bank Offer Rate
During the fi nancial year, a fair value loss of $239,000 with a deferred tax credit of $60,000 relating to the interest rate swap contract was recognised in the profi t or loss.

155THE STRAITS TRADING COMPANY LIMITED ANNUAL REPORT 2011
NOTES TO THE FINANCIAL STATEMENTSFor the Financial Year Ended 31 December 2011
41 SIGNIFICANT ACCOUNTING ESTIMATES AND JUDGEMENTS
(a) Estimation Uncertainty
The key assumptions concerning the future and other key sources of estimation uncertainty at the end of the reporting period, that have a signifi cant risk of causing a material adjustment to the carrying amounts of assets and liabilities within the next fi nancial year, are discussed below:
(i) Impairment of goodwill
The Group determines whether goodwill is impaired at least on an annual basis. The recoverable amount of the cash-generating unit is determined based on the higher of fair value less cost to sell and value in use. Management also reviews other economic factors and market conditions to assess whether the recoverable amount as determined using this method is sustainable. Changes in the market value of the cash-generating unit could affect the recoverable amount. The carrying amount of goodwill at 31 December 2011 was $21,863,000 (2010: $22,425,000). More details are given in note 15.
(ii) Depreciation of property, plant and equipment
Property, plant and equipment are depreciated using the appropriate basis as outlined in note 2.12 over the estimated useful lives of these assets. The carrying amount of the Group’s property, plant and equipment at 31 December 2011 was $389,802,000 (2010: $340,923,000). Changes in the estimated economically recoverable ore reserves and resources and expected level of usage and technological developments could impact the economic useful lives and the residual values of these assets, therefore, future depreciation charges could be revised.
(iii) Impairment and amortisation for deferred mine exploration and evaluation expenditure, deferred mine development expenditure and mining rights
These require estimates and assumptions on the quantity of economically recoverable ore reserves and resources, expected future costs and expenses to produce the metal or minerals, effective interest rates, expected future prices used in the impairment test for deferred mine development, mine exploration expenditures, mining rights and mining assets. The estimate of the quantity of economically recoverable ore reserves and resources are also used for the amortisation of deferred development and exploration expenditures, mining rights and mining assets. Actual outcomes could differ from these estimates and assumptions.
The carrying amounts are as follows:
Group 2011 2010
$’000 $’000
Deferred exploration and evaluation expenditure 6,211 5,209
Deferred mine development expenditure 32,140 28,052
Mining rights 414 480

156 TRANSFORMATION
NOTES TO THE FINANCIAL STATEMENTSFor the Financial Year Ended 31 December 2011
41 SIGNIFICANT ACCOUNTING ESTIMATES AND JUDGEMENTS (cont’d)
(a) Estimation Uncertainty (cont’d)
(iv) Fair value of properties
Properties are stated at fair value, which has been determined based on valuations as at 31 December 2011. The properties are at valuations performed by registered independent professionally qualifi ed valuers, based on the comparison/comparable sales method, depreciated replacement cost method, discounted cash fl ow method, profi t/capitalisation/investment method for existing use. The fair value of the Group’s investment properties at 31 December 2011 was $932,907,000 (2010: $853,505,000), and land and buildings was $328,464,000 (2010: $292,726,000). The basis and assumptions and methods used are outlined in notes 13 and 14.
(v) Impairment loss on investments in associates and joint ventures
MSC has associates and a joint venture which are principally involve in exploration and mining of various minerals and metals. The impairment assessments were based on projected value of the estimated quantity of economically recoverable reserves and resources. These require estimates and assumptions on the quantity of economically recoverable reserves and resources, expected future costs and expenses to produce the minerals and metals, effective interest rates, weighted average cost of capital, expected commencement date for commercial production and future prices used. Actual outcomes could differ from these estimates and assumptions. The carrying amount of the Group’s investments in associates and joint ventures at 31 December 2011 was $76,439,000 (2010: $67,143,000).
(vi) Inventories
Inventories are stated at the lower of cost and net realisable value. Signifi cant management judgement and in certain circumstances estimate on the physical stock quantity are required to determine their cost and net realisable value.
The write down of obsolete or slow moving inventories is based on assessment of its ageing. Inventories are written down when events or changes in circumstances indicate that the carrying amounts may not be recoverable. The management specifi cally analyses sales trend and current economic trends when making a judgement to evaluate the adequacy of the write down for obsolete or slow moving inventories. Where expectations differ from the original estimates, the differences will impact the carrying amount of inventories.
(vii) Provision for mine rehabilitation and restoration costs
Provision for mine rehabilitation and restoration costs are provided based on the present value of the estimated future expenditure to be incurred. Signifi cant management judgement and estimation is required in determining the discount rate and the expenditure to be incurred subsequent to the cessation of production of each mine property. Where expectations differ from the original estimates, the differences will impact the carrying amount of provision for mine rehabilitation and restoration costs.

157THE STRAITS TRADING COMPANY LIMITED ANNUAL REPORT 2011
NOTES TO THE FINANCIAL STATEMENTSFor the Financial Year Ended 31 December 2011
41 SIGNIFICANT ACCOUNTING ESTIMATES AND JUDGEMENTS (cont’d)
(a) Estimation Uncertainty (cont’d)
(viii) Economically recoverable ore reserves and resources
Economically recoverable ore reserves and resources are estimates of the amount of ore that can be economically and legally recoverable from the mining properties. The Group estimates its ore reserves and resources based on information compiled by appropriately qualifi ed persons relating to the geological data on the size, depth and shape of the ore body, and requires complex geological judgements to interpret the data. The estimation of recoverable reserves and resources is based upon factors such as estimates of foreign exchange rates, commodity prices, future capital requirements, and production costs along with geological assumptions and judgements made in estimating the size and grade of the ore body. Changes in the reserve or resource estimates may impact upon the carrying value of mining rights, mining assets, deferred mine development expenditure, deferred exploration and evaluation expenditure, mine properties, property, plant and equipment, goodwill, provision for rehabilitation, recognition of deferred tax assets and deferred tax liabilities, and depreciation and amortisation charges.
(b) Judgements
In the process of applying the Group’s accounting policies, management has made the following judgements, apart from those involving estimations, which has the most signifi cant effect on the amounts recognised in the fi nancial statements:
(i) Income taxes
The Group has exposure to income taxes in various jurisdictions. Signifi cant judgement is involved in determining the group-wide provision for income taxes. There are certain transactions and computations for which the ultimate tax determination is uncertain during the ordinary course of business. The Group recognises liabilities for expected tax issues based on estimates of whether additional taxes will be due. Where the fi nal tax outcome of these matters is different from the amounts that were initially recognised, such differences will impact the income tax and deferred tax provisions in the period in which such determination is made.
The carrying amounts are as follows:
Group2011 2010
$’000 $’000
Income tax receivables 4,513 11,107
Income tax payable 26,164 26,837
Deferred tax assets 8,487 10,722
Deferred tax liabilities 76,957 75,868

158 TRANSFORMATION
NOTES TO THE FINANCIAL STATEMENTSFor the Financial Year Ended 31 December 2011
41 SIGNIFICANT ACCOUNTING ESTIMATES AND JUDGEMENTS (cont’d)
(b) Judgements (cont’d)
(ii) Impairment of investment securities
The Group reviews its equity investments classifi ed as available-for-sale investments at each reporting date to assess whether they are impaired. The Group records impairment charges on available-for-sale equity investments when there has been a signifi cant or prolonged decline in the fair value below their cost.
The determination of what is “signifi cant” or “prolonged” requires judgement. In making this judgement, the Group evaluates, among other factors, historical share price movements and the duration and extent to which the fair value of an investment is less than its cost.
42 FAIR VALUE OF FINANCIAL INSTRUMENTS
A. Fair value of fi nancial instruments that are carried at fair value
The following table shows an analysis of fi nancial instruments carried at fair value by level of fair value hierarchy:
Group2011$’000
Quoted prices inactive markets for
identical instrumentsSignifi cant other
observable inputs
Signifi cantunobservable
inputs Total(Level 1) (Level 2) (Level 3)
Financial assets:Held for trading investments (note 20)– Equity instruments (quoted) 13 – – 13Available-for-sale fi nancial assets (note 20)– Equity instruments (quoted) 128,258 – – 128,258– Equity instruments (unquoted) – – 7,242 7,242At 31 December 2011 128,271 – 7,242 135,513
Financial liabilities:Derivatives (note 21)– Foreign currency forward contracts – 171 – 171– Interest rate swap contracts – 354 – 354At 31 December 2011 – 525 – 525

159THE STRAITS TRADING COMPANY LIMITED ANNUAL REPORT 2011
NOTES TO THE FINANCIAL STATEMENTSFor the Financial Year Ended 31 December 2011
42 FAIR VALUE OF FINANCIAL INSTRUMENTS (cont’d)
A. Fair value of fi nancial instruments that are carried at fair value (cont’d)
Group2010$’000
Quoted prices inactive markets for
identical instrumentsSignifi cant other
observable inputs
Signifi cantunobservable
inputs Total(Level 1) (Level 2) (Level 3)
Financial assets:Held for trading investments (note 20)– Equity instruments (quoted) 17 – – 17Available-for-sale fi nancial assets (note 20)– Equity instruments (quoted) 199,292 – – 199,292– Equity instruments (unquoted) – – 14,387 14,387Derivatives (note 21)– Foreign currency forward contracts – 487 – 487At 31 December 2010 199,309 487 14,387 214,183
Financial liabilities:Derivatives (note 21)– Interest rate swap contracts – 576 – 576At 31 December 2010 – 576 – 576
Fair value hierarchy
The Group classifi ed fair value measurement using a fair value hierarchy that refl ects the signifi cance of the inputs used in making the measurements. The fair value hierarchy has the following levels:
Level 1– Quoted prices (unadjusted) in active markets for identical assets or liabilities
Level 2 – Inputs other than quoted prices included within Level 1 that are observable for the asset or liability, either directly (i.e., as prices) or indirectly (i.e., derived from prices), and
Level 3 – Inputs for the asset or liability that are not based on observable market data (unobservable inputs)
There have been no transfers between Level 1 and Level 2 fair value measurements during the fi nancial years ended 2011 and 2010.

160 TRANSFORMATION
NOTES TO THE FINANCIAL STATEMENTSFor the Financial Year Ended 31 December 2011
42 FAIR VALUE OF FINANCIAL INSTRUMENTS (cont’d)
A. Fair value of fi nancial instruments that are carried at fair value (cont’d)
Determination of fair value
Quoted equity instruments (note 20): Fair value is determined by direct reference to their bid price quotations in an active market at the end of the reporting period.
Unquoted equity instruments (note 20): These investments are valued using valuation models which uses both observable and non-observable data. The non-observable inputs to the models include assumptions regarding the future fi nancial performance of the investee, its risk profi le, and economic assumptions regarding the industry and geographical jurisdiction in which the investee operates.
Derivatives (note 21): Foreign currency forward contracts and interest rate swap contracts are valued using a valuation technique with market observable inputs. These contracts are valued by fi nancial institutions.
Movements in level 3 fi nancial instruments measured at fair value
The following table presents the reconciliation for all fi nancial instruments measured at fair value based on signifi cant unobservable inputs (level 3).
Assets measured at fair value based on Level 3
Group
Available-for-sale fi nancial assetEquity instrument (unquoted)2011
$’0002010
$’000
At 1 January 2011 14,387 –Purchases – 14,387Impairment (6,786) –Exchange adjustment (359) –At 31 December 2011 7,242 14,387

161THE STRAITS TRADING COMPANY LIMITED ANNUAL REPORT 2011
NOTES TO THE FINANCIAL STATEMENTSFor the Financial Year Ended 31 December 2011
42 FAIR VALUE OF FINANCIAL INSTRUMENTS (cont’d)
A. Fair value of fi nancial instruments that are carried at fair value (cont’d)
Impact of changes to key assumptions on fair value of Level 3 fi nancial instruments
The following table shows the impact on fair value of Level 3 fi nancial instruments by using reasonably possible alternative assumptions:
Effect of reasonably possible alternative assumptionsCarryingamount
Effect of changein tin price
Effect of change in discount rate
Group +1% -1% +0.5% -0.5%$’000 $’000 $’000 $’000 $’000
Available-for-sale fi nancial asset- Equity instrument
(unquoted) 7,242 234 (230) (116) 123
For unquoted equity instruments, the fair value had been determined using a valuation technique based on assumptions of future tin price and discount rate. The valuation requires management to make estimates about expected future cash fl ows of the shares which are discounted at current market rates. The Group adjusted the future tin price and discount rate by 1% and 0.5% respectively from management’s estimates, which are considered by the Group to be within a range of reasonably possible alternatives.
B. Fair value of fi nancial instruments by classes that are not carried at fair value and whose carrying amounts are reasonable approximation of fair value
Current trade and other receivables and payables, Non-current other receivables and payables (notes 19 and 33), Current borrowings and Non-current borrowings at fl oating rate (note 31).
The carrying amounts of these fi nancial assets and liabilities are reasonable approximations of fair values, either due to their short-term nature or that they are fl oating rate instruments that are re-priced to market interest rates on or near the end of the reporting period.
Included in the other receivables is an unsecured loan which is amortised at fi xed rate cost. Its carrying amount is a reasonable approximation of its fair value at the end of the reporting period.

162 TRANSFORMATION
NOTES TO THE FINANCIAL STATEMENTSFor the Financial Year Ended 31 December 2011
42 FAIR VALUE OF FINANCIAL INSTRUMENTS (cont’d)
C. Fair value of fi nancial instruments by classes that are not carried at fair value and whose carrying amounts are not reasonable approximations of fair value
The fair value of fi nancial assets and liabilities by classes that are not carried at fair value and whose carrying amounts are not reasonable approximations of fair value are as follows:
Group Company2011 2010 2011 2010
Note $’000 $’000 $’000 $’000Carrying Fair Carrying Fair Carrying Fair Carrying Fair Amount Value Amount Value Amount Value Amount Value
Financial assets:Available-for-sale
investment securities 20 – – 4 * – – 4 *
Financial liabilities:Fixed rate term loans 31 262,059 269,766 107,432 112,285 – – – –Fixed rate notes 31 223,907 223,448 – – 223,907 223,448 – –
Available-for-sale investment securities carried at cost
* Fair value information had not been disclosed for these investment securities because fair value cannot be measured reliably and the amount was immaterial. These investment securities represented shares in a company that are not quoted on any market.
Fixed rate term loans
The fair value as disclosed in the table above is estimated based on the present value of future cash fl ows, discounted at the market rate of interest for similar types of lending or borrowings at the end of the reporting period.
Fixed rate notes
The fair value as disclosed in the table above is the bid price on the last trading day in the Singapore Exchange Securities Trading Limited (SGX-ST).

163THE STRAITS TRADING COMPANY LIMITED ANNUAL REPORT 2011
NOTES TO THE FINANCIAL STATEMENTSFor the Financial Year Ended 31 December 2011
43 EVENTS AFTER THE BALANCE SHEET DATE
(a) On 5 March 2012, the Board of Directors of Malaysia Smelting Corporation Berhad (“MSC”) announced that Asian Mineral Resources Limited (“AMR”), in which MSC currently holds 15.4% equity, has entered into a share subscription agreement with Pala Investments Holdings Limited (“Pala”) whereby Pala will, subject to the satisfaction of certain conditions precedent, subscribe for 71,666,667 new units via placement for a total consideration of C$4,300,000. Each new unit will consist of one common share of AMR and one-half of a common share purchase warrant (“Warrants”) with each whole Warrant carrying the right to subscribe one common share at an exercise price of C$0.10 for a period of fi ve years commencing on the closing date of the transaction. This placement will enable AMR to sustain its operations and seek further funding to complete the Ban Phuc Nickel/Copper Project in Vietnam.
Concurrently with the above, MSC has entered into a right of fi rst refusal agreement whereby MSC has granted Pala a right of fi rst refusal over MSC’s shareholding in AMR which is currently 31,297,661 shares. Pala and MSC have also entered into a voting and support agreement whereby MSC is unconditionally obligated to vote its shares in favour of the transactions provided for in the subscription agreement of Pala entered into with AMR in connection with the Pala subscription. Until the earlier of the date of closing or termination of the Pala subscription and 6 July 2012, MSC will not be able to dispose of any of its shares or engage in activities in furtherance of a transaction whereby a third party would acquire any shares of AMR.
Further, Pala has also entered into share purchase agreements with Sword Investments Private Limited, a subsidiary of the Company, and Mellford Pte. Ltd, an affi liate of the Tecity group and thereby affi liates of MSC, to purchase from them 49,481,600 issued common shares.
Upon completion of these transactions Pala will own 121,148,267 common shares representing 44.1% of AMR’s outstanding share capital and 50.3% on a fully diluted basis after Pala has exercised the Warrants in full. MSC’s shareholding in AMR would be diluted to 11.4% fi rst and then upon exercise of Warrants by Pala to 10.1%.
(b) On 9 March 2012, MSC announced that it has entered into a strategic alliance agreement (“SAA”) with Optima Synergy Resources Limited (“OSRL”) that would allow the latter to immediately subscribe up to 479,833,766 shares of US$0.01 each equivalent to 23% equity interest in Bemban Corporation Limited (“BCL”), the penultimate holding company of PT Koba Tin (“PT Koba”).
Among others, the objectives and purposes of the SAA are as follows:
(i) Facilitating greater local Indonesian participation in PT Koba by way of increased equity ownership and management through an Indonesian affi liate company of OSRL;
(ii) Securing the PT Koba Contract of Work (“CoW”) extension or new mining permits over the existing CoW area for 10 years up to 31 March 2023 through joint effort of OSRL and MSC;
(iii) Enabling BCL and operating companies to expand their businesses through performance improvement and value enhancement as well as through acquisition of additional mining permits for long term sustainable operations in Indonesia.
Upon renewal of PT Koba CoW, OSRL will be able to increase up to 50% equity interest in BCL through subscription of additional 1,126,566,234 shares of US$0.01 each subject to fulfi llment of certain conditions precedent stipulated in the SAA including MSC obtaining shareholders’ approval at an extraordinary general meeting (EGM) to be convened at a later date.

164 TRANSFORMATION
NOTES TO THE FINANCIAL STATEMENTSFor the Financial Year Ended 31 December 2011
43 EVENTS AFTER THE BALANCE SHEET DATE (cont’d)
(c) On 26 March 2012, MSC announced that in line with the prevailing provisions of the State’s Minerals Enactment (Perak) 2003 {Enakmen Mineral, (Perak) 2003}, (referred to as 2003 Enactment) its wholly-owned subsidiary, Rahman Hydraulic Tin Sdn. Bhd. (“RHT”) has agreed to pay royalty to the State Government of Perak (“State Government”) at a higher rate of 5% on sales of tin-in-concentrates from the current rate of 2.5% payable under the exisiting terms of the current mining leases over Lot No.6173 (ML004), Lot No.7430 (ML005), Lot No.6175 (ML006), Lot No.6147 (ML007) and Lot No.2206 (ML008) for a total area of approximately 600.996 hectares (collectively referred to as Current Mining Leases) in Wilayah Klian Intan, Mukim Pengkalan Hulu, Daerah Hulu Perak, State of Perak Darul Ridzuan which were originally issued under the old Enactment which has subsequently been replaced by the 2003 Enactment. With this agreement to pay a higher royalty effective from March 2012, the MSC Board is pleased that the State Government of Perak has approved the renewal of the Current Mining Leases for a longer period up to 28 September 2030 pursuant to the 2003 Enactment.
The extension of the Current Mining Leases to 2030 will enable RHT to undertake the necessary additional investments to optimise its long term production level. This is expected to result in an increase in future earnings and thus, the overall valuation of RHT. Apart from contributing an additional revenue to the State Government from higher royalty, the longer mine life is also expected to benefi t the community and all other stakeholders under the principles and objectives of sustainable development.
44 SEGMENT INFORMATION
For management purposes, the Group is organised into business units based on their products and services, and has four reportable operating segments as follows:
(a) The Resources’ principal activities are in the smelting of tin concentrates and tin bearing materials, the production of various grades of refi ned tin metal under the MSC brand name and the sale and delivery of refi ned tin metal and by-products, as well as investments in other metals and mineral resources.
(b) The Hospitality business includes hotel ownership and hotel management under the “Rendezvous” brand, with strong regional hotel presence in strategic cities. The Group offi cially launched its hospitality rebranding in October 2011 with 3 tiers, the Rendezvous Grand Hotels for premier accommodation, Rendezvous Hotels targeting upper-midscale travelers and Rendezvous Studios for the value-conscious travelers.
(c) The Property segment comprises property investment, sales and leasing, property development as well as media advertising. The Group will continue to divest non-core property assets.
(d) The segment for Others comprises strategic fi nancial investments and Group-level corporate services and treasury functions.
Management monitors the operating results of each business unit separately for the purpose of making decisions about resource allocation and performance assessment. Segment performance is evaluated based on net profi t, as explained in the table below.
Transactions between operating segments are based on terms agreed between the parties.

165THE STRAITS TRADING COMPANY LIMITED ANNUAL REPORT 2011
NOTES TO THE FINANCIAL STATEMENTSFor the Financial Year Ended 31 December 2011
44 SEGMENT INFORMATION (cont’d)
2011 Operating Segments
Resources Hospitality Property Others Elimination Consolidated$’000 $’000 $’000 $’000 $’000 $’000
RevenueExternal revenue 1,270,719 157,840 82,104 – – 1,510,663Inter-segment revenue – 294 95 – (389) –Total revenue 1,270,719 158,134 82,199 – (389) 1,510,663
Segment resultsOperating profi t/(loss) 47,568 (9,221) 14,326 183 – 52,856Fair value changes in investment
properties – 16,164 39,982 – – 56,146Impairment losses (12,082) (9,878) – (4) – (21,964)Finance costs (11,077) (158) (5,062) (1,946) – (18,243)Share of results of equity-accounted
associates and joint ventures 9,782 176 493 – – 10,451Profi t/(Loss) before tax 34,191 (2,917) 49,739 (1,767) – 79,246Income tax expense (13,997) (5,618) (3,667) (571) – (23,853)Profi t/(Loss) after tax 20,194 (8,535) 46,072 (2,338) – 55,393
Profi t/(Loss) attributable to:Owners of the Company 10,422 (8,535) 46,072 (2,338) – 45,621Non-controlling interests 9,772 – – – – 9,772
20,194 (8,535) 46,072 (2,338) – 55,393
Segment Assets 540,225 433,205 990,172 301,221 – 2,264,823Segment Liabilities 355,116 74,794 343,321 231,445 – 1,004,676
Other information:Dividend income – – – 4,611 – 4,611Interest income 5,306 674 55 65 – 6,100Depreciation 5,615 14,893 801 – – 21,309Amortisation 12,231 146 – – – 12,377Other material non-cash items:Impairment of plant and equipment – 2,587 – – – 2,587Impairment of investment in
associates 5,284 – – – – 5,284Impairment of available-for-sale
investment securities 6,798 – – 4 – 6,802Revaluation defi cit of properties – 7,291 – – – 7,291
Investments in associates and joint ventures 71,335 599 4,505 – – 76,439
Additions to non-current assets 23,004 32,781 58,896 – – 114,681

166 TRANSFORMATION
NOTES TO THE FINANCIAL STATEMENTSFor the Financial Year Ended 31 December 2011
44 SEGMENT INFORMATION (cont’d)
2010 Operating Segments
Resources Hospitality Property Others Elimination Consolidated$’000 $’000 $’000 $’000 $’000 $’000
RevenueExternal revenue 1,159,286 146,675 52,760 – – 1,358,721Inter-segment revenue – 274 463 – (737) –Total revenue 1,159,286 146,949 53,223 – (737) 1,358,721
Segment resultsOperating profi t/(loss) 42,513 (26,144) 15,536 3,225 – 35,130Fair value changes in investment
properties – 1,500 100,425 – – 101,925Impairment losses (74,534) (16,546) – – – (91,080)Finance costs (10,667) – (2,803) (10,411) – (23,881)Share of results of equity-accounted
associates and joint ventures 1,541 101 136 – – 1,778Profi t/(Loss) before tax (41,147) (41,089) 113,294 (7,186) – 23,872Income tax (expense)/credit (9,424) (3,107) (4,827) 203 – (17,155)Profi t/(Loss) after tax (50,571) (44,196) 108,467 (6,983) – 6,717
Profi t/(Loss) attributable to:Owners of the Company (29,119) (44,196) 108,467 (6,983) – 28,169Non-controlling interests (21,452) – – – – (21,452)
(50,571) (44,196) 108,467 (6,983) – 6,717
Segment Assets 534,557 364,150 914,407 199,788 – 2,012,902Segment Liabilities 409,671 62,426 317,636 29,566 – 819,299
Other information:Dividend income – – – 5,082 – 5,082Interest income 2,705 812 60 4 – 3,581Depreciation 7,221 14,861 567 – – 22,649Amortisation 5,443 140 – – – 5,583Other material non-cash items:Impairment of goodwill 8,134 5,054 – – – 13,188Impairment of plant and equipment 855 10,324 – – – 11,179Impairment of investment in
associates 41,146 – – – – 41,146Impairment of mining assets 23,884 – – – – 23,884Impairment of available-for-sale
investment securities 404 – – – – 404Revaluation defi cit of properties 111 1,168 – – – 1,279
Investments in associates and joint ventures 62,582 448 4,113 – – 67,143
Additions to non-current assets 26,675 6,247 4,140 – – 37,062

167THE STRAITS TRADING COMPANY LIMITED ANNUAL REPORT 2011
NOTES TO THE FINANCIAL STATEMENTSFor the Financial Year Ended 31 December 2011
44 SEGMENT INFORMATION (cont’d)
Geographical Information
Revenues attributable to geographic areas are based on the location for which the revenue is earned or the business is transacted. Geographical assets are based on the location or operation of the Group’s assets.
2011 Geographical Information
Singapore Malaysia Indonesia Australia Others Elimination Consolidated$’000 $’000 $’000 $’000 $’000 $’000 $’000
Segment revenue Revenue from external parties 101,832 1,269,605 2,974 112,559 23,693 – 1,510,663 Inter-segment revenue 1,369 – 202,369 – – (203,738) –Total revenue 103,201 1,269,605 205,343 112,559 23,693 (203,738) 1,510,663
Non-current assets 1,126,454 107,635 47,670 103,160 7 – 1,384,926
2010 Geographical Information
Singapore Malaysia Indonesia Australia Others Elimination Consolidated$’000 $’000 $’000 $’000 $’000 $’000 $’000
Segment revenue Revenue from external parties 76,556 1,156,103 5,022 100,318 20,722 – 1,358,721 Inter-segment revenue 625 23 175,418 – – (176,066) –Total revenue 77,181 1,156,126 180,440 100,318 20,722 (176,066) 1,358,721
Non-current assets 984,874 104,649 47,927 114,206 574 – 1,252,230 Non-current assets information presented above consist of property, plant and equipment, investment properties, goodwill, other intangible assets, and other non-current assets* as presented in the consolidated balance sheet.
* excluding security deposit.
Information about major customers
Revenue from one major customer amount to $197,087,000 (2010: $170,161,000), arising from sales by the Resources segment.

168 TRANSFORMATION
NOTES TO THE FINANCIAL STATEMENTSFor the Financial Year Ended 31 December 2011
45 SUBSIDIARIES, ASSOCIATES AND JOINT VENTURES
Effective Cost ofshareholding % investment
Country of 2011 2010 2011 2010Incorporation Business % % $’000 $’000
SubsidiariesHeld by the Company:Australia Oriental Minerals NL* ˆ ß ± Australia Tin and base
metals exploration– 5(a) – –
Malaysia Smelting Corporation Berhad*ˆ Malaysia Tin mining & smelting
28(b) 37(b) 25,402 25,402
Atbara Holdings Private Limited Singapore Property 100 100 1,000 1,000Baxterley Holdings Private Limited Singapore Investment 100 100 20,000 20,000Bushey Park Private Limited Singapore Investment 100 100 29,992 29,992Malayan Securities Private Limited Singapore Investment 100 100 83,500 83,500Malayan Tin Smelting Company Sendirian
Berhad* Malaysia Investment 100 100 702 702
Merevale Holdings Private Limited Singapore Investment 100 100 40,000 40,000Rendezvous Hotels International Private
LimitedSingapore Hotels & resorts
management100 100 4,880 4,880
STC International Private Limited Singapore Restaurant 100 100 – –STC Realty (Butterworth) Sendirian
Berhad*Malaysia Property 100 100 10,979 10,979
Straits Developments Private Limited Singapore Property 100 100 5,988 5,988Straits Equities Private LimitedØ Singapore Investment – 100 – 1,000Straits Media Private Limited Singapore Media Advertising 100 100 1,000 1,000Straits Trading Amalgamated Resources
Private LimitedSingapore Investment 100 100 20,597 20,597
Sword Investments Private Limited Singapore Investment 100 100 19,000 19,000Sword Private Limited Singapore Investment 100 100 – –Wavertree Holdings Private Limited ØØ Singapore Investment 100 100 – –Rendezvous Hospitality Group Private
Limited ØØ
Singapore Investment 100 100 – –
263,040 264,040Held through subsidiaries:Allegra Hotel Pty Ltd* Australia Hotel
management100 100
Hotel Rendezvous Private Limited Singapore Hotel owning & management
100 100
Marque Hotels International Pty Limited* Australia Hotel management
100 100
Rendezvous Hotels (Australia) Pty Ltd* Australia Hotels & resorts management
100 100
Rendezvous Hotels (NZ) Limited* New Zealand Hotel management
100 100
Rendezvous Hotels Management Pty Ltd* Australia Hotel management
100 100

169THE STRAITS TRADING COMPANY LIMITED ANNUAL REPORT 2011
NOTES TO THE FINANCIAL STATEMENTSFor the Financial Year Ended 31 December 2011
45 SUBSIDIARIES, ASSOCIATES AND JOINT VENTURES (cont’d)
Effective Cost ofshareholding % investment
Country of 2011 2010 2011 2010Incorporation Business % % $’000 $’000
SubsidiariesHeld through subsidiaries:Rendezvous India Hospitality Private
Limited**India Hotel
management100 100
Rendezvous Properties Private Limited Singapore Property 100 100Straits Tinfi elds Private Limited ØØ Singapore Tin Mining 100 100Straits Trading Private Limited ØØ Singapore Property 100 100Straits Trading Amalgamated Resources
Sendirian Berhad*Malaysia Investment 100 100
Straits Unit Trust* Australia Property Trust 100 100Sword Properties Pty Ltd* Australia Trustee Company 100 100Sword Unit Trust* Australia Property Trust 100 100Unicorn Square Limited Singapore Property 100 100Rendezvous Hotels Asia Private Limited Singapore Hotels & resorts
management100 100
Shanghai Rendezvous Hotels Management Co Ltd*
People’s Republic of
China
Hotels & resorts management
100 100
Malaysia Smelting Corporation (Warehousing) Sdn. Bhd.* ß
Malaysia Tin warehousing 55 73
MSC Properties Sdn. Bhd.* ß Malaysia Property holding and rental
55 73
Rahman Hydraulic Tin Sdn. Bhd.* ß Malaysia Tin mining 55 73Bemban Corporation Ltd.* ß British Virgin
IslandsInvestment holding
55 73
Kajuara Mining Corporation Pty. Ltd.* ß Australia Investment holding
55 73
PT Bangka Resources** ß Indonesia Dormant 55 73Straits Resource Management Private
Limitedß
Singapore Investment holding
55 73(c)
PT MSC Indonesia* ß Indonesia Tin exploration and mining
55 73
PT Koba Tin* ß Indonesia Tin mining and smelting
41 55
PT SRM Indonesia** ß Indonesia Providing tin exploration, management and consulting services
55 73(c)
Asiatic Coal Private Limited ß ± Singapore Investment holding
- 40(d)
PT Asiatic Coal Nusantara* ß ± Indonesia Coal mining - 40Tertius Development Pte Ltd Singapore Property 100 100

170 TRANSFORMATION
NOTES TO THE FINANCIAL STATEMENTSFor the Financial Year Ended 31 December 2011
45 SUBSIDIARIES, ASSOCIATES AND JOINT VENTURES (cont’d)
Effective Cost ofshareholding % investment
Country of 2011 2010 2011 2010Incorporation Business % % $’000 $’000
AssociatesHeld by the Company:Johan Kekal Sendirian Berhad** Malaysia Property
development45 45 1,123 1,123
Taiko-Straits Developments Sdn. Bhd.* Malaysia Property development
30 30 2,462 2,462
3,585 3,585Held through subsidiaries:Asian Mineral Resources Limited** ß New Zealand
(i)Exploration and development of mineral property interests (ii)
18(e) 19(e)
Guilin Hinwei Tin Co Ltd** ß China Smelting, refi ning and sales of tin and tin products
19 25
Redring Solder (M) Sdn. Bhd.* ß Malaysia Manufacture and sale of solder products
22 29
Joint VenturesHeld through subsidiaries:Coastal Coffees Pty Ltd** Australia Restaurant 50 50KM Resources, Inc.* ß Labuan,
Malaysia Investment holding
16 22
The subsidiaries and associates are audited by Ernst & Young LLP, Singapore unless stated otherwise.
* Audited by member fi rms of Ernst & Young Global in the respective countries.
** These subsidiaries, associates and joint ventures are audited by other fi rms of auditors.
ˆ Companies listed on the Stock Exchange Ltd in the respective countries where it was incorporated.
ß Subsidiaries/Associates of listed subsidiaries.
Ø This subsidiary was voluntarily liquidated in 2011.
ØØ Voluntary liquidation in progress.
± These subsidiaries were re-designated to disposal group classifi ed as held for sale in 2010, the sales were completed during fi nancial year 2011.
(i) Asian Mineral Resources Limited (“AMR”) was originally incorporated in New Zealand in year 1988 and was subsequently incorporated under the laws of the Province of British Columbia, Canada by a certifi cate of continuance as of December 2004.
(ii) AMR principal mineral property interest, held through a joint venture is in Ban Bhuc Project area located in Son La Province, in northwestern Vietnam.
(a) Direct interest held jointly with other subsidiaries is nil (2010: 82%)
(b) Combined interest held jointly with other subsidiaries and an associate is 55% (2010: 73%).
(c) The entire shareholding of the subsidiary group was transferred from the Company to Malaysia Smelting Corporation Berhad in August 2010. The Group’s effective ownership interest was reduced from 100% to 73%.
(d) In 2010, this was considered as a subsidiary because direct interest held by MSC and AOM was 30% each.
(e) This is considered as an associate although direct interest held by MSC is 15% (2010: 18%), MSC exercises signifi cant infl uence by virtue of its representative on the Board of this associate.

171THE STRAITS TRADING COMPANY LIMITED ANNUAL REPORT 2011
Disclosure Pursuant to Listing Rule 907
The Company does not have a general mandate from shareholders in relation to interested person transactions pursuant to Rule 920 of the SGX-ST Listing Manual. There were no interested person transactions of S$100,000 and above between the Company or its subsidiaries and any of its interested persons during the fi nancial year ended 31 December 2011.
Disclosure Pursuant to Listing Rule 1207(8)
No material contract involving the interests of any Director or controlling shareholder of the Company has been entered into by the Company or any of its subsidiaries since the end of the previous fi nancial year and no such contract subsisted at the end of the fi nancial year ended 31 December 2011.
ADDITIONAL INFORMATION REQUIRED UNDER THE SGX LISTING MANUAL

172 TRANSFORMATION
SHAREHOLDER INFORMATIONAs at 16 March 2012
VOTING RIGHTS
Shareholders’ voting rights are set out in Article 72 of the Company’s Articles of Association:
On a show of hands, every member present in person or by proxy shall have one vote and upon a poll, every member present in person or by proxy shall have one vote for every share which he holds.
ORDINARY SHARES AND SHAREHOLDERS AS AT 16 MARCH 2012
Size of Shareholdings No. of Shareholders % No. of Shares %
1 – 999 1,026 27.12 328,507 0.101,000 – 10,000 2,272 60.04 7,290,027 2.24
10,001 – 1,000,000 481 12.71 21,156,192 6.491,000,001 and above 5 0.13 297,122,274 91.17
Total 3,784 100.00 325,897,000 100.00
TWENTY LARGEST SHAREHOLDERS AS AT 16 MARCH 2012
No. Registered Shareholders No. of Shares %
1. THE CAIRNS PTE. LTD. 289,839,552 88.942. LOKE WAN YAT REALTY SENDIRIAN BERHAD 2,519,632 0.773. UOB KAY HIAN PTE LTD 2,115,352 0.654. BANK OF SINGAPORE NOMINEES PTE LTD 1,545,657 0.475. HSBC (SINGAPORE) NOMINEES PRIVATE LIMITED 1,102,081 0.346. UNITED OVERSEAS BANK NOMINEES PRIVATE LIMITED 696,797 0.217. MAYBAN NOMINEES (SINGAPORE) PRIVATE LIMITED 597,768 0.188. UOB NOMINEES (2006) PRIVATE LIMITED 591,608 0.189. LOKE YUEN KIN RUBY 424,841 0.1310. CHOO MEILEEN 414,432 0.1311. MARIAN HOLMES 410,000 0.1312. AU YONG AH NGOH 396,984 0.1213. TEO SOO CHUAN (PTE) LTD 345,300 0.1114. DBS NOMINEES PRIVATE LIMITED 314,904 0.1015. PAVILION FOUNDATION LIMITED 236,393 0.0716. PHILLIP SECURITIES PTE LTD 236,037 0.0717. ESTATE OF CHEAH SIEW HOON ROSIE, DECEASED 234,127 0.0718. CITIBANK NOMINEES SINGAPORE PRIVATE LIMITED 233,801 0.0719. SUNGEI PERTANG ESTATE SDN BERHAD 207,600 0.0620. CHEE SWEE CHENG & CO PTE LTD 196,956 0.06
Total: 302,659,822 92.86

173THE STRAITS TRADING COMPANY LIMITED ANNUAL REPORT 2011
SHAREHOLDER INFORMATIONAs at 16 March 2012
SUBSTANTIAL SHAREHOLDERS
No. of SharesDirect Interest Deemed Interest %
The Cairns Pte. Ltd. 289,839,552 – 88.94Raffl es Investments Limited – 289,839,552 * 88.94Aequitas Pte. Ltd. – 289,839,552 * 88.94Siong Lim Private Limited – 289,839,552 * 88.94Tecity Pte. Ltd. – 289,839,552 * 88.94Dr Tan Kheng Lian 4,860 289,839,552 * 88.94
* Deemed to have an interest in the shares held by The Cairns Pte. Ltd.
PERCENTAGE OF SHAREHOLDING HELD BY THE PUBLIC AS AT 16 MARCH 2012
Based on information available to the Company as at 16 March 2012, approximately 11.01% of the issued shares of the Company was held by the public and thus, Rule 723 of the Listing Manual of the Singapore Exchange Securities Trading Limited has been complied with.

174 TRANSFORMATION
NOTICE OF ANNUAL GENERAL MEETING
The Straits Trading Company Limited(A member of The Tecity Group)(Company No.: 188700008D)(Incorporated in Singapore)
NOTICE IS HEREBY GIVEN that the Annual General Meeting of members of The Straits Trading Company Limited (the “Company”) will be held at the Straits Ballroom, Level 2, Rendezvous Grand Hotel Singapore, 9 Bras Basah Road, Singapore 189559, on Friday, 27 April 2012 at 2:30 p.m. for the following business:
1. To receive and adopt the Financial Statements for the year ended 31 December 2011, the Directors’ Report and the Auditors’ Report thereon
2. To re-elect the following Directors retiring by rotation in accordance with Article 99 of the Company’s Articles of Association and who, being eligible, offer themselves for re-election:
(a) Mr Yap Chee Keong
(b) Mr David Goh Kay Yong
Note: Mr Yap Chee Keong, if re-elected, will continue as the Chairman of the Audit Committee and member of the Finance Committee and will be considered as an independent Director. Mr David Goh Kay Yong, if re-elected, will continue as a member of the Finance Committee and will be considered as a non-independent non-executive Director.
3. To re-appoint the following Directors pursuant to Section 153(6) of the Companies Act, Cap. 50, to hold offi ce from the date of this Annual General Meeting until the next Annual General Meeting of the Company:
(a) Tan Sri Dato’ Dr Lin See-Yan
(b) Mrs Elizabeth Sam
Note: Tan Sri Dato’ Dr Lin See-Yan, if re-appointed, will continue as a member of the Audit, Nominating and Remuneration Committees and will be considered as an independent Director. Mrs Elizabeth Sam, if re-appointed, will continue as the Chairman of the Nominating Committee and will be considered as an independent Director.
4. To approve the payment of Directors’ fees of S$645,000 for the year ended 31 December 2011 (2010: S$615,079)
5. To re-appoint Ernst & Young LLP as the Company’s Auditors and to authorise the Board to fi x their remuneration
6. As Special Business:
To consider and, if thought fi t, pass the following resolution as an Ordinary Resolution:
“That authority be and is hereby given to the Directors of the Company to:
(a) (i) issue shares in the capital of the Company (“shares”) whether by way of rights, bonus or otherwise; and/or

175THE STRAITS TRADING COMPANY LIMITED ANNUAL REPORT 2011
NOTICE OF ANNUAL GENERAL MEETING
(ii) make or grant offers, agreements or options (collectively, “Instruments”) that might or would require shares to be issued, including but not limited to the creation and issue of (as well as adjustments to) warrants, debentures or other instruments convertible into shares,
at any time and upon such terms and conditions and for such purposes and to such persons as the Directors may in their absolute discretion deem fi t; and
(b) (notwithstanding the authority conferred by this Resolution may have ceased to be in force) issue shares in pursuance of any Instrument made or granted by the Directors while this Resolution was in force,
provided that:
(i) the aggregate number of shares to be issued pursuant to this Resolution (including shares to be issued in pursuance of Instruments made or granted pursuant to this Resolution) does not exceed 50% of the issued shares in the capital of the Company (as calculated in accordance with sub-paragraph (ii) below), of which the aggregate number of shares to be issued other than on a pro-rata basis to shareholders of the Company (including shares to be issued in pursuance of Instruments made or granted pursuant to this Resolution) does not exceed 20% of the issued shares in the capital of the Company (as calculated in accordance with sub-paragraph (ii) below);
(ii) (subject to such manner of calculation as may be prescribed by the Singapore Exchange Securities Trading Limited) for the purpose of determining the aggregate number of shares that may be issued under sub-paragraph (i) above, the percentage of issued shares shall be based on the number of issued shares in the capital of the Company at the time of the passing of this Resolution, after adjusting for:
A. new shares arising from the conversion or exercise of any convertible securities or share options or vesting of share awards which are outstanding or subsisting at the time of the passing of this Resolution; and
B. any subsequent consolidation or subdivision of shares;
(iii) in exercising the authority conferred by this Resolution, the Company shall comply with the provisions of the Listing Manual of the Singapore Exchange Securities Trading Limited for the time being in force (unless such compliance has been waived by the Singapore Exchange Securities Trading Limited) and the Articles of Association for the time being of the Company; and
(iv) (unless revoked or varied by the Company in general meeting) the authority conferred by this Resolution shall continue in force until the conclusion of the next Annual General Meeting of the Company or the date by which the next Annual General Meeting of the Company is required by law to be held, whichever is the earlier.”
7. To transact any other ordinary business of the Company
By Order of the Board
Sng Kiat HuangSecretary
Singapore11 April 2012

176 TRANSFORMATION
Notes:
A member of the Company is entitled to appoint a proxy to attend the meeting and vote in his stead. A proxy need not be a member of the Company. Proxy forms must be deposited at the Company’s registered offi ce not less than 48 hours before the time for holding the meeting or any adjournment thereof.
Additional information relating to Notice of Annual General Meeting:
The Ordinary Resolution in item 6 above, if passed, will renew the authority for the Directors, effective until the next Annual General Meeting, to issue shares, make or grant instruments convertible into shares and to issue shares pursuant to such instruments, up to an amount not exceeding, in total, 50% of the issued shares in the capital of the Company, of which up to 20% may be issued other than on a pro-rata basis to shareholders. For determining the aggregate number of shares that may be issued, the percentage of issued shares in the capital will be calculated based on the number of issued shares in the capital of the Company at the time that this Resolution is passed, after adjusting for new shares arising from the conversion or exercise of any convertible securities or share options or vesting of share awards which are outstanding or subsisting at the time that this Resolution is passed, and any subsequent consolidation or subdivision of shares.
NOTICE OF ANNUAL GENERAL MEETING

This page is intentionally left blank

This page is intentionally left blank

PROXY FORM
THE STRAITS TRADING COMPANY LIMITED(A member of The Tecity Group)(Company Registration No.: 188700008D)Incorporated in Singapore
IMPORTANT:
1. For investors who have used their CPF monies to buy THE STRAITS TRADING COMPANY LIMITED shares, this Annual Report is sent solely FOR INFORMATION ONLY.
2. This Proxy Form is not valid for use by CPF investors and shall be ineffective for all intents and purposes if used or purported to be used by them.
I/We, (Name) of
(Address)being a member/members of THE STRAITS TRADING COMPANY LIMITED hereby appoint :
Name AddressNRIC/
Passport NumberProportion of
Shareholdings (%)
and/or (delete as appropriate)
Name AddressNRIC/
Passport NumberProportion of
Shareholdings (%)
or failing him/her/them, the Chairman of the Annual General Meeting, as my/our proxy/proxies to vote for me/us on my/our behalf, at the Annual General Meeting of the Company, to be held at the Straits Ballroom, Level 2, Rendezvous Grand Hotel Singapore, 9 Bras Basah Road, Singapore 189559, on Friday, 27 April 2012 at 2:30 p.m., and at any adjournment thereof. I/We direct my/our proxy/proxies to vote for or against the Resolutions to be proposed at the Meeting as indicated hereunder. If no specifi c direction as to voting is given, the proxy/proxies will vote or abstain from voting at his/their discretion, as he/they will on any other matter arising at the Meeting.
No. Resolutions For Against1. To receive and adopt Financial Statements, Directors’ Report and Auditors’ Report2. To re-elect Directors retiring under the Articles of Association:
(a) Mr Yap Chee Keong(b) Mr David Goh Kay Yong
3. To re-appoint Directors pursuant to Section 153(6) of Companies Act, Cap. 50:(a) Tan Sri Dato’ Dr Lin See-Yan(b) Mrs Elizabeth Sam
4. To approve payment of Directors’ fees5. To re-appoint Auditors and authorise the Directors to fi x their remuneration6. To authorise the Directors to issue shares pursuant to Section 161 of the Companies Act,
Cap. 507. Any other business
Dated this day of 2012
Total Numberof Shares
_______________________________________Signature(s) of Member(s)/Common SealImportant: Please read notes overleaf

NOTES
1. A member entitled to attend and vote at the Meeting is entitled to appoint one or two proxies to attend and vote in his stead. Such proxy need not be a member of the Company.
2. Where a member appoints two proxies, the appointments shall be invalid unless he specifi es the proportion of his holding (expressed as a percentage of the whole) to be represented by each proxy.
3. A member should insert the total number of shares held. If the member has shares entered against his name in the Depository Register (as defi ned in Section 130A of the Companies Act, Cap. 50 of Singapore), he should insert that number. If the member has shares registered in his name in the Register of Members of the Company, he should insert that number. If the member has shares entered against his name in the Depository Register and registered in his name in the Register of Members, he should insert the aggregate number. If no number is inserted, the instrument appointing a proxy or proxies will be deemed to relate to all the shares held by the member.
4. The instrument appointing a proxy or proxies must be deposited at the registered offi ce of the Company at 9 Battery Road, #28-01 Straits Trading Building, Singapore 049910 not less than 48 hours before the time set for holding the Meeting.
5. The instrument appointing a proxy or proxies must be under the hand of the appointor or of his attorney duly authorised in writing. Where the instrument appointing a proxy or proxies is executed by a corporation, it must be executed under its common seal or under the hand of an attorney duly authorised in writing.
6. Where an instrument appointing a proxy or proxies is signed on behalf of the appointor by an attorney, the letter or power of attorney or a duly certifi ed copy thereof must (failing previous registration with the Company) be lodged with the instrument of proxy, failing which the instrument may be treated as invalid.
GENERAL
The Company shall be entitled to reject the instrument appointing a proxy or proxies if it is incomplete, improperly completed, illegible or where the true intentions of the appointor are not ascertainable from the instructions of the appointor specifi ed in the instrument appointing a proxy or proxies. In addition, in the case of shares entered in the Depository Register, the Company may reject any instrument appointing a proxy or proxies if the member, being the appointor, is not shown to have shares entered against his name in the Depository Register as at 48 hours before the time appointed for holding the Meeting, as certifi ed by The Central Depository (Pte) Limited to the Company.
