strain localization and shear band propagation in ductile...
TRANSCRIPT
MATERIALSORIGINAL RESEARCH ARTICLE
published: 23 March 2015doi: 10.3389/fmats.2015.00022
Strain localization and shear band propagation in ductilematerialsNicola Bordignon, Andrea Piccolroaz, Francesco Dal Corso and Davide Bigoni*
Department of Civil, Environmental and Mechanical Engineering (DICAM), University of Trento, Trento, Italy
Edited by:Simone Taioli, Bruno KesslerFoundation, Italy
Reviewed by:Gianni F. Royer Carfagni, University ofParma, ItalyStefano Vidoli, Sapienza University ofRome, Italy
*Correspondence:Davide Bigoni , via Mesiano 77, TrentoI-38123, Italye-mail: [email protected]
A model of a shear band as a zero-thickness non-linear interface is proposed and testedusing finite element simulations. An imperfection approach is used in this model where ashear band that is assumed to lie in a ductile matrix material (obeying von Mises plasticitywith linear hardening), is present from the beginning of loading and is considered to bea zone in which yielding occurs before the rest of the matrix. This approach is contrastedwith a perturbative approach, developed for a J2-deformation theory material, in whichthe shear band is modeled to emerge at a certain stage of a uniform deformation. Bothapproaches concur in showing that the shear bands (differently from cracks) propagate rec-tilinearly under shear loading and that a strong stress concentration should be expectedto be present at the tip of the shear band, two key features in the understanding of failuremechanisms of ductile materials.
Keywords: slip lines, plasticity, failure, stress concentration, rectilinear growth
1. INTRODUCTIONWhen a ductile material is brought to an extreme strain statethrough a uniform loading process, the deformation may startto localize into thin and planar bands, often arranged in regularlattice patterns. This phenomenon is quite common and occursin many materials over a broad range of scales: from the kilomet-ric scale in the earth crust (Kirby, 1985), down to the nanoscalein metallic glass (Yang et al., 2005), see the examples, reported inFigure 1.
After localization, unloading typically1 occurs in the mater-ial outside the bands, while strain quickly evolves inside, pos-sibly leading to final fracture (as in the examples shown inFigure 2, where the crack lattice is the signature of the ini-tial shear band network2) or to a progressive accumulation ofdeformation bands (as, for instance, in the case of the drink-ing straws, or of the iron meteorite, or of the uPVC sampleshown in Figure 1, or in the well-known case of granular mate-rials, where fracture is usually absent and localization bands aremade up of material at a different relative density, Gajo et al.,2004).
It follows from the above discussion that as strain localizationrepresents a prelude to failure of ductile materials, its mechanicalunderstanding paves the way to the innovative use of materials inextreme mechanical conditions. For this reason, shear bands havebeen the focus of a thorough research effort. In particular, research
1For granular materials, there are cases in which unloading occurs inside the shearband, as shown by Gajo et al. (2004).2The proposed explanation for the crack patterns shown in Figure 2 relies on thefact that the fracture network has formed during the plastic evolution of a ductilehomogeneously deformed material. Other explanations may be related to bondingof an external layer to a rigid substrate (Peron et al., 2013), or to surface instability(Destrade and Merodio, 2011; Boulogne et al., 2015), or to instabilities occurringduring shear (Destrade et al., 2008; Ciarletta et al., 2013).
initiated with pioneering works by Hill (1962), Nadai (1950),Mandel (1962), Prager (1954), Rice (1977), Thomas (1961), anddeveloped – from theoretical point of view – into two princi-pal directions, namely, the dissection of the specific constitutivefeatures responsible for strain localization in different materials(for instance, as related to the microstructure, Danas and PonteCastaneda, 2012; Bacigalupo and Gambarotta, 2013; Tvergaard,2014) and the struggle for the overcoming of difficulties connectedwith numerical approaches [reviews have been given by Needle-man and Tvergaard (1983) and Petryk (1997)]. Although theseproblems are still not exhausted, surprisingly, the most importantquestions have only marginally been approached and are there-fore still awaiting explanation. These are as follows: (i) Why areshear bands a preferred mode of failure for ductile materials? (ii)Why do shear bands propagate rectilinearly under mode II, whilecracks do not? (iii) How does a shear band interact with a crack orwith a rigid inclusion? (iv) Does a stress concentration exist at ashear band tip? (v) How does a shear band behave under dynamicconditions?
The only systematic3 attempt to solve these problems seems tohave been a series of works by Bigoni and co-workers, based onthe perturbative approach to shear bands (Bigoni and Capuani,2002, 2005; Piccolroaz et al., 2006; Argani et al., 2013, 2014).In fact, problems (i), (ii), and (iv) were addressed in Bigoniand Dal Corso (2008) and Dal Corso and Bigoni (2010), prob-lem (iii) in Bigoni et al. (2008), Dal Corso et al. (2008), andDal Corso and Bigoni (2009), and (v) in Bigoni and Capuani(2005).
The purpose of the present article is to present a model of ashear band as a zero-thickness interface and to rigorously motivate
3Special problems of shear band propagation in geological materials have beenaddressed by Puzrin and Germanovich (2005) and Rice (1973).
www.frontiersin.org March 2015 | Volume 2 | Article 22 | 1

Bordignon et al. Strain localization in ductile materials
FIGURE 1 | Examples of strain localization.(Continued)
Frontiers in Materials | Mechanics of Materials March 2015 | Volume 2 | Article 22 | 2

Bordignon et al. Strain localization in ductile materials
FIGURE 1 | ContinuedFrom left to right, starting from the upper part: A merlon in the Finale Emiliacastle failed (during the Emilia earthquake on May 20, 2012) in compressionwith a typical “X-shaped” deformation band pattern (bricks are to beunderstood here as the microstructure of a composite material). Asedimentary rock with the signature of an “X-shaped” localization band(infiltrated with a different mineral after formation). A stone axe from a BritishIsland (Museum of Edinburgh) evidencing two parallel localization bands andanother at a different orientation. A runestone (Museum of Edinburgh) withseveral localized deformation bands, forming angles of approximately 45°
between each other. A polished and etched section of an iron meteoriteshowing several alternate bands of kamacite and taenite. Deformation bandsin a strip of unplasticized poly(vinyl chloride) (uPVC) pulled in tension andeventually evolving into a necking. An initially regular hexagonal disposition ofdrinking straws subject to uniform uniaxial strain has evolved into an“X-shaped” localization pattern. A fracture prevails on a regularly distributednetwork of cracks in a vault of the Amiens dome. “X-shaped” localizationbands in a kaolin sample subject to vertical compression and lateral confiningpressure. A thin, isolated localization band in a sedimentary layered rock(Silurian formation near Aberystwyth).
FIGURE 2 | Regular patterns of localized cracks as the signature of strain localization lattices. From left to right: Dried mud; Lava cracked duringsolidification (near Amboy crater); Bark of a maritime pine (Pinus pinaster ); Cracks in a detail of a painting by J. Provost (“Saint Jean-Baptiste,” Valenciennes,Musée des Beaux Arts).
this as the asymptotic behavior of a thin layer of material, whichis extremely compliant in shear (Section 2). Once the shear bandmodel has been developed, it is used (in Section 3) to demon-strate two of the above-listed open problems, namely (ii) thata shear band grows rectilinearly under mode II remote loadingin a material deformed near to failure and (iv) to estimate thestress concentration at the shear band tip. In particular, a pre-existing shear band is considered to lie in a matrix as a thinzone of material with properties identical to the matrix, butlower yield stress. This is an imperfection, which remains neu-tral until the yield is reached in the shear band4. The presentmodel is based on an imperfection approach and shares simi-larities to that pursued by Abeyaratne and Triantafyllidis (1981)and Hutchinson and Tvergaard (1981), so that it is essentiallydifferent from a perturbative approach, in which the perturba-tion is imposed at a certain stage of a uniform deformationprocess5.
4A different approach to investigate shear band evolution is based on the exploita-tion of phase-field models (Zheng and Li, 2009), which has been often used forbrittle fracture propagation (Miehe et al., 2010).5To highlight the differences and the analogies between the two approaches, theincremental strain field induced by the emergence of a shear band of finite length(modeled as a sliding surface) is determined for a J2-deformation theory materialand compared with finite element simulations in which the shear band is modeledas a zero-thickness layer of compliant material.
2. ASYMPTOTIC MODEL FOR A THIN LAYER OF HIGHLYCOMPLIANT MATERIAL EMBEDDED IN A SOLID
A shear band, inside a solid block of dimension H, is modeledas a thin layer of material (of semi-thickness h, with h/H� 1)
yielding at a uniaxial stress σ (s)Y , which is lower than that of the
surrounding matrix σ (m)Y , Figure 3. Except for the yield stress,the material inside and outside the layer is described by the sameelastoplastic model, namely, a von Mises plasticity with associatedflow rule and linear hardening, defined through the elastic con-stants, denoted by the Young modulus E and Poisson’s ratio v, andthe plastic modulus Ep, see Figure 3B.
At the initial yielding, the material inside the layer [character-ized by a low hardening modulus Eep= EEp/(E + Ep)] is muchmore compliant than the material outside (characterized by anelastic isotropic response E).
For h/H� 1, the transmission conditions across the layerimply the continuity of the tractions, t = [t 21, t 22]T, which canbe expressed in the asymptotic form
[[t21]] = O(h), [[t22]] = O(h), (1)
where [[·]] denotes the jump operator.The jump in displacements, [[u]]= [[[u1]], [[u2]]]T, across the
layer is related to the tractions at its boundaries through theasymptotic relations (Mishuris et al., 2013; Sonato et al., 2015)
www.frontiersin.org March 2015 | Volume 2 | Article 22 | 3

Bordignon et al. Strain localization in ductile materials
A B
FIGURE 3 | (A) A shear band inside a ductile material modeled as a thin layerof highly compliant material (Eep/E�1) embedded in a material blockcharacterized by a dimension H, such that h/H�1; both materials obey the
same von Mises plasticity model represented by the uniaxial stress behaviorreported in (B), but having a different yield stress (lower inside than outsidethe shear band).
t21([[u1]], [[u2]]) =Ep
√3[[u1]]
2+ 4[[u2]]
2+ 6hσ (s)Y
(3E + 2(1+ ν)Ep)√
3[[u1]]2+ 4[[u2]]
2
E[[u1]]
2h+ O(h), (2)
t22([[u1]], [[u2]]) =(E + 2(1− ν)Ep)
√3[[u1]]
2+ 4[[u2]]
2+ 8h(1− 2ν)σ (s)Y
(1− 2ν)(3E + 2(1+ ν)Ep)√
3[[u1]]2+ 4[[u2]]
2
E[[u2]]
2h+ O(h), (3)
involving the semi-thickness h of the shear band, which entersthe formulation as a constitutive parameter for the zero-thicknessinterface model and introduces a length scale. Note that, by neglect-ing the remainder O(h), equations (2) and (3) define non-linearrelationships between tractions and jump in displacements.
The time derivative of equations (2) and (3) yields the followingasymptotic relation between incremental quantities
t ∼
[1
hK−1 + K 0([[u1]], [[u2]])
][[u]], (4)
where the two stiffness matrices K−1 and K 0 are given by
K−1 =E
2(3E + 2(1+ ν)Ep)
Ep 0
0E + 2(1− ν)Ep
1− 2ν
, (5)
K 0 =12Eσ (s)Y
(3E + 2(1+ ν)Ep)(3[[u1]]2+ 4[[u2]]
2)3/2
×
[[[u2]]
2−[[u1]][[u2]]
−[[u1]][[u2]] [[u1]]2
], (6)
Assuming now a perfectly plastic behavior, Ep= 0, in the limith/H→ 0 the condition
[[u2]] = 0 (7)
is obtained, so that the incremental transmission conditionsequation (4) can be approximated to the leading order as
t ∼1
hK−1[[u]]. (8)
Therefore, when the material inside the layer is close to the per-fect plasticity condition, the incremental conditions assume thelimit value
t21 = 0, [[u2]] = 0, (9)
which, together with the incremental version of equation (1)2,namely,
[[t22]] = 0, (10)
correspond to the incremental boundary conditions proposed inBigoni and Dal Corso (2008) to define a pre-existing shear bandof null thickness.
The limit relations, equations (9) and (10), motivate the use ofthe imperfect interface approach (Bigoni et al., 1998; Antipov et al.,2001; Mishuris, 2001, 2004; Mishuris and Kuhn, 2001; Mishurisand Ochsner, 2005, 2007) for the modeling of shear band growthin a ductile material. A computational model, in which the shearbands are modeled as interfaces, is presented in the next section.
Frontiers in Materials | Mechanics of Materials March 2015 | Volume 2 | Article 22 | 4

Bordignon et al. Strain localization in ductile materials
3. NUMERICAL SIMULATIONSTwo-dimensional plane-strain finite element simulations are pre-sented to show the effectiveness of the above-described asymptoticmodel for a thin and highly compliant layer in modeling a shearband embedded in a ductile material. Specifically, we will show thatthe model predicts rectilinear propagation of a shear band undersimple shear boundary conditions and it allows the investigationof the stress concentration at the shear band tip.
The geometry and material properties of the model are shownin Figure 4, where a rectangular block of edges H and L≥H issubject to boundary conditions consistent with a simple sheardeformation, so that the lower edge of the square domain isclamped, the vertical displacements are constrained along thevertical edges and along the upper edge, where a constant hori-zontal displacement u1 is prescribed. The domain is made of aductile material and contains a thin (h/H� 1) and highly compli-ant (Eep/E� 1) layer of length H /2 and thickness 2h= 0.01 mm,which models a shear band. The material constitutive behavioris described by an elastoplastic model based on linear isotropicelasticity (E = 200000 MPa, v = 0.3) and von Mises plasticity withlinear hardening (the plastic modulus is denoted by Ep). The uni-
axial yield stress σ (m)Y for the matrix material is equal to 500 MPa,whereas the layer is characterized by a lower yield stress, namely,
σ(s)Y = 400 MPa.
The layer remains neutral until yielding, but, starting fromthat stress level, it becomes a material inhomogeneity, beingmore compliant (because its response is characterized by Eep)than the matrix (still in the elastic regime and thus char-acterized by E). The layer can be representative of a pre-existing shear band and can be treated with the zero-thicknessinterface model, equations (2) and (3). This zero-thicknessinterface was implemented in the ABAQUS finite element
FIGURE 4 | Geometry of the model, material properties, and boundaryconditions (which would correspond to a simple shear deformation inthe absence of the shear band). The horizontal displacement u1 isprescribed at the upper edge of the domain.
software6 through cohesive elements, equipped with the traction-separation laws, equations (2) and (3), by means of the usersubroutine UMAT. An interface, embedded into the cohesive ele-ments, is characterized by two dimensions: a geometrical and aconstitutive thickness. The latter, 2h, exactly corresponds to theconstitutive thickness involved in the model for the interface equa-tions (2) and (3), while the former, denoted by 2hg, is related to themesh dimension in a way that the results become independent ofthis parameter, in the sense that a mesh refinement yields resultsconverging to a well-defined solution.
We consider two situations. In the first, we assume that theplastic modulus is Ep= 150000 MPa (both inside and outside theshear band), so that the material is in a state far from a shear bandinstability (represented by loss of ellipticity of the tangent consti-tutive operator, occurring at Ep= 0) when at yield. In the second,we assume that the material is prone to a shear band instability,though still in the elliptic regime, so that Ep (both inside and out-side the shear band) is selected to be “sufficiently small”, namely,Ep= 300 MPa. The pre-existing shear band is therefore employedas an imperfection triggering shear strain localization when thematerial is still inside the region, but close to the boundary, ofellipticity.
3.1. DESCRIPTION OF THE NUMERICAL MODELWith reference to a square block (L=H = 10 mm) containing apre-existing shear band with constitutive thickness h= 0.005 mm,three different meshes were used, differing in the geometricalthickness of the interface representing the pre-existing shear band(see Figure 5 where the shear band is highlighted with a black line),namely, hg= {0.05; 0.005; 0.0005} mm corresponding to coarse,fine, and ultra-fine meshes.
The three meshes were generated automatically using the meshgenerator available in ABAQUS. In order to have increasing meshrefinement from the exterior (upper and lower parts) to the inte-rior (central part) of the domain, where the shear band is located,and to ensure the appropriate element shape and size accordingto the geometrical thickness 2hg, the domain was partitioned intorectangular subdomains with increasing mesh seeding from theexterior to the interior. Afterwards, the meshes were generated byemploying a free meshing technique with quadrilateral elementsand the advancing front algorithm.
The interface that models the shear band is discretized using4-node two-dimensional cohesive elements (COH2D4), whilethe matrix material is modeled using 4-node bilinear, reducedintegration with hourglass control (CPE4R).
It is important to note that the constitutive thickness usedfor traction-separation response is always equal to the actual sizeof the shear band h= 0.005 mm, whereas the geometric thick-ness hg, defining the height of the cohesive elements, is differ-ent for the three different meshes. Consequently, all the threemeshes used in the simulations correspond to the same problemin terms of both material properties and geometrical dimensions(although the geometric size of the interface is different), so that
6ABAQUS Standard Ver. 6.13 has been used, available on the AMD Opteron clusterStimulus at UniTN.
www.frontiersin.org March 2015 | Volume 2 | Article 22 | 5

Bordignon et al. Strain localization in ductile materials
FIGURE 5 |The three meshes used in the analysis to simulate ashear band (highlighted in black) in a square solid block(L = H = 10 mm). The shear band is represented in the three cases as aninterface with the same constitutive thickness h=0.005 mm, but with
decreasing geometric thickness hg; (A) coarse mesh (1918 nodes, 1874elements, hg = 0.05 mm); (B) fine mesh (32,079 nodes, 31,973elements, hg = 0.005 mm); (C) ultra-fine mesh (1,488,156 nodes,1,487,866 elements, hg =0.0005 mm).
A B C
FIGURE 6 | Contour plots of the shear stress σ 12 for the case of materialfar from shear band instability (Ep = 150000 MPa). The gray regioncorresponds to the material at yielding σ12 ≥ 500/
√3 = 288.68 MPa. Three
different stages of deformation are shown, corresponding to a prescribed
displacement at the upper edge of the square domain u1 =0.037418 mm(A), u1 =0.037518 mm (B), u1 =0.037522 mm (C). The displacements in thefigures are amplified by a deformation scale factor of 25 and the percentagesrefer to the final displacement.
the results have to be, and indeed will be shown to be, meshindependent7.
3.2. NUMERICAL RESULTSResults (obtained using the fine mesh, Figure 5B) in terms of theshear stress component σ 12 at different stages of a deformationprocess for the boundary value problem sketched in Figure 4 arereported in Figures 6 and 7.
In particular, Figure 6 refers to a matrix with high plastic mod-ulus, Ep= 150000 MPa, so that the material is far from the shearband formation threshold. The upper limit of the contour levelswas set to the value σ12 = 500/
√3 ' 288.68 MPa, corresponding
to the yielding stress of the matrix material. As a result, the grayzone in the figure represents the material at yielding, whereas thematerial outside the gray zone is still in the elastic regime. Threestages of deformation are shown, corresponding to: the initialyielding of the matrix material (left), the yielding zone occupying
7Note that, in the case of null hardening, mesh dependency may occur in the sim-ulation of shear banding nucleation and propagation (Needleman, 1988; Loret andPrevost, 1991, 1993). This numerical issue can be avoided by improving classicalinelastic models through the introduction of characteristic length-scales (Lapovoket al., 2009; Dal Corso and Willis, 2011).
approximately one-half of the space between the shear band tipand the right edge of the domain (center), and the yielding com-pletely linking the tip of the shear band to the boundary (right).Note that the shear band, playing the role of a material imper-fection, produces a stress concentration at its tip. However, theregion of high stress level rapidly grows and diffuses in the wholedomain. At the final stage, shown in Figure 6C, almost all thematrix material is close to yielding.
Figure 7 refers to a matrix with low plastic modulus,Ep= 300 MPa, so that the material is close (but still in the ellip-tic regime) to the shear band formation threshold (Ep= 0). Threestages of deformation are shown, from the condition of initialyielding of the matrix material near the shear band tip (left),to an intermediate condition (center), and finally to the com-plete yielding of a narrow zone connecting the shear band tipto the right boundary (right). In this case, where the mater-ial is prone to shear band localization, the zone of high stresslevel departs from the shear band tip and propagates towardthe right. This propagation occurs in a highly concentratednarrow layer, rectilinear, and parallel to the pre-existing shearband. At the final stage of deformation, shown in Figure 7C,the layer of localized shear has reached the boundary of theblock.
Frontiers in Materials | Mechanics of Materials March 2015 | Volume 2 | Article 22 | 6

Bordignon et al. Strain localization in ductile materials
A B C
FIGURE 7 | Contour plots of the shear stress σ 12 for the case ofmaterial close to shear band instability (Ep = 300 MPa). The grayregion corresponds to the material at yielding σ12 ≥ 500/
√3. Three
different stages of deformation are shown, corresponding to a
prescribed displacement at the upper edge of the square domainu1 =0.0340 mm (A), u1 =0.0351 mm (B), u1 =0.03623 mm (C). Thedisplacements in the figures are amplified by a deformation scale factorof 27.
A B C
FIGURE 8 | Contour plots of the shear deformation γ 12 for the case ofmaterial far from shear band instability (Ep = 150000 MPa). Three differentstages of deformation are shown, corresponding to a prescribed
displacement at the upper edge of the square domain u1 =0.037418 mm(A), u1 =0.037518 mm (B), u1 =0.037522 mm (C). The displacements in thefigures are amplified by a deformation scale factor of 25.
A B C
FIGURE 9 | Contour plots of the shear deformation γ 12 for the case ofmaterial close to shear band instability (Ep = 300 MPa). Three differentstages of deformation are shown, corresponding to a prescribed
displacement at the upper edge of the square domain u1 =0.0340 mm(A), u1 =0.0351 mm (B), u1 =0.03623 mm (C). The displacements in thefigures are amplified by a deformation scale factor of 27.
Results in terms of the shear strain component γ 12, for bothcases of material far from, and close to shear band instabil-ity are reported in Figures 8 and 9, respectively. In particular,Figure 8 shows contour plots of the shear deformation γ 12
for the case of a material far from the shear band instability
(Ep= 150000 MPa) at the same three stages of deformation asthose reported in Figure 6. Although the tip of the shear bandacts as a strain raiser, the contour plots show that the level ofshear deformation is high and remains diffused in the wholedomain.
www.frontiersin.org March 2015 | Volume 2 | Article 22 | 7
Bordignon et al. Strain localization in ductile materials
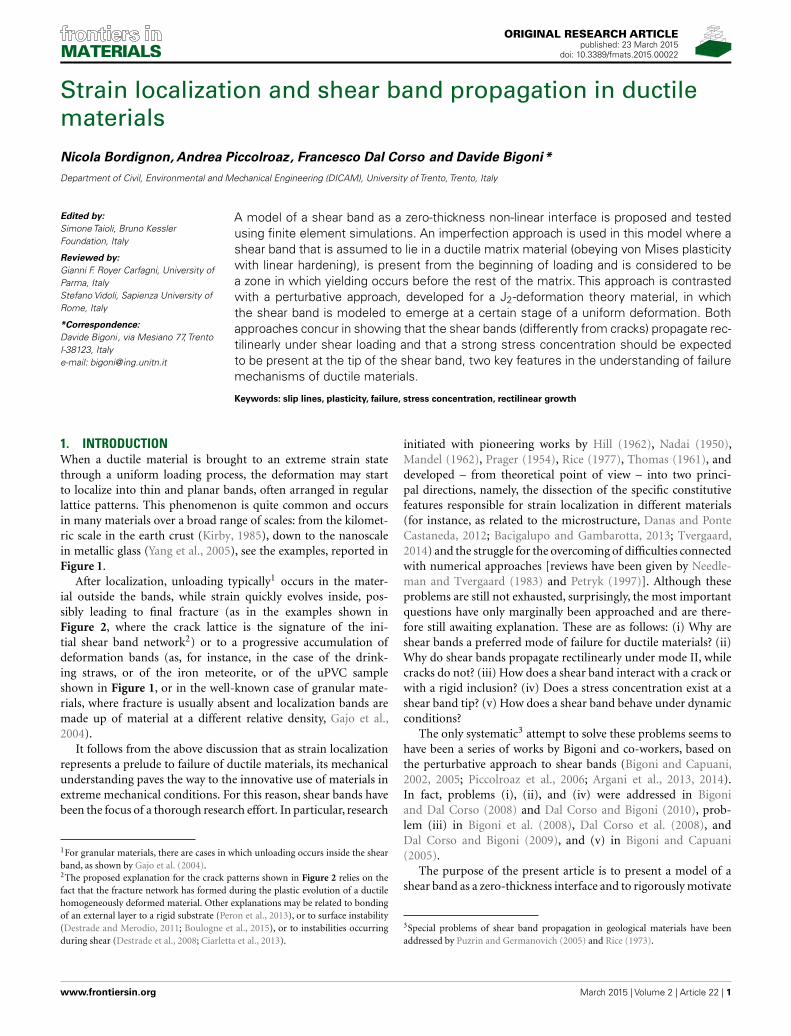
FIGURE 10 | Shear deformation γ 12 (A–C) and shear stress σ 12 (D–F) alongthe x -axis containing the pre-existing shear band for the case of amaterial close to a shear band instability Ep = 300 MPa. The black dottedline, in the bottom part of the figure, indicates the yield stress level, lower
inside the pre-existing shear band than that in the outer domain. Threedifferent stages of deformation are shown, corresponding to a prescribeddisplacement at the upper edge of the square domain u1 = 0.0340 mm (left),u1 = 0.0351 mm (center), u1 = 0.03623 mm (right).
Figure 9 shows contour plots of the shear deformation γ 12
for the case of a material close to the shear band instability(Ep= 300 MPa), at the same three stages of deformation as thosereported in Figure 7. It is noted that the shear deformation islocalized along a rectilinear path ahead of the shear band tip, con-firming results that will be reported later with the perturbationapproach (Section 4).
The shear deformation γ 12 and the shear stress σ 12 along thex-axis containing the pre-existing shear band for the case of amaterial close to strain localization, Ep= 300 MPa, are shown inFigure 10, upper and lower parts, respectively. Results are reportedfor the three meshes, coarse, fine and ultra-fine (Figure 5) and atthe same three stages of deformation as those shown in Figures 7and 9. The results appear to be mesh independent, meaning thatthe solution converges as the mesh is more and more refined.
The deformation process reported in Figures 7, 9, and 10 canbe described as follows. After an initial homogeneous elastic defor-mation (not shown in the figure), in which the shear band remainsneutral (since it shares the same elastic properties with the matrixmaterial), the stress level reaches σ12 = 400/
√3 ' 230.9 MPa,
corresponding to the yielding of the material inside the shear band.Starting from this point, the pre-existing shear band is activated,which is confirmed by a high shear deformation γ 12 and a stresslevel above the yield stress inside the layer, −5 mm< x< 0 (leftpart of Figure 10). The activated shear band induces a strain local-ization and a stress concentration at its tip, thus generating a zoneof material at yield, which propagates to the right (central part ofFigure 10) until collapse (right part of Figure 10).
In order to appreciate the strain and stress concentration at theshear band tip, a magnification of the results shown in Figure 10 inthe region−0.2 mm< x< 0.2 mm is presented in Figure 11. Due
to the strong localization produced by the shear band, only theultra-fine mesh is able to capture accurately the strain and stressraising (blue solid curve), whereas the coarse and fine meshessmooth over the strain and stress levels (red dotted and greendashed curves, respectively). The necessity of an ultra-fine mesh tocapture details of the stress/strain fields is well-known in compu-tational fracture mechanics, where special elements (quarter-pointor extended elements) have been introduced to avoid the use ofthese ultra-fine meshes at corner points.
For the purpose of a comparison with an independent and fullynumerical representation of the shear band, a finite element sim-ulation was also performed, using standard continuum elements(CPE4R) instead of cohesive elements (COH2D4) inside the layer.This simulation is important to assess the validity of the asymp-totic model of the layer presented in Section 2. In this simulation,reported in Figure 12, the layer representing the shear band is a“true” layer of a given and finite thickness, thus influencing theresults (while these are independent of the geometrical thickness2hg of the cohesive elements, when the constitutive thickness 2his the same). Therefore, only the fine mesh, shown in Figure 5B,was used, as it corresponds to the correct size of the shear band.The coarse mesh (Figure 5A) and the ultra-fine mesh (Figure 5C)would obviously produce different results, corresponding, respec-tively, to a thicker or thinner layer. Results pertaining to theasymptotic model, implemented into the traction-separation lawfor the cohesive elements COH2D4, are also reported in the figure(red solid curve) and are spot-on with the results obtained with afully numerical solution employing standard continuum elementsCPE4R (blue dashed curve).
A mesh of the same size as that previously called “fine” wasused to perform a simulation of a rectangular block (H = 10 mm,
Frontiers in Materials | Mechanics of Materials March 2015 | Volume 2 | Article 22 | 8

Bordignon et al. Strain localization in ductile materials
FIGURE 11 | Shear and stress concentration at the shear bandtip. Shear deformation γ 12 (A–C) and shear stress σ 12 (D–F) along thex -axis containing the pre-existing shear band for the case of amaterial close to a shear band instability Ep = 300 MPa.Three different
stages of deformation are shown, corresponding to a prescribeddisplacement at the upper edge of the square domainu1 =0.0340 mm (left), u1 =0.0351 mm (center), u1 =0.03623 mm(right).
FIGURE 12 | Results of simulations performed with differentidealizations for the shear band: zero-thickness model (discretizedwith cohesive elements, COH2D4) versus a true layer description(discretized with CPE4R elements). Shear deformation γ 12 (A–C) andshear stress σ 12 (D–F) along the horizontal line y =0 containing the
pre-existing shear band for the case of a material close to a shear bandinstability Ep =300 MPa. Three different stages of deformation are shown,corresponding to a prescribed displacement at the upper edge of thesquare domain u1 =0.0340 mm (left), u1 =0.0351 mm (center),u1 =0.03623 mm (right).
L= 4 H = 40 mm) made up of a material close to shear bandinstability (Ep= 300 MPa) and containing a shear band (of lengthH /2= 5 mm and constitutive thickness 2h= 0.01 mm). Resultsare presented in Figure 13. In parts (Figures 13A,B) (the latter is adetail of part Figure 13A) of this figure the overall response curve
is shown of the block in terms of average shear stress σ12 = T/L(T denotes the total shear reaction force at the upper edge of theblock) and average shear strain γ12 = u1/H . In part (Figure 13C)of the figure contour plots of the shear deformation γ 12 arereported at different stages of deformation. It is clear that the
www.frontiersin.org March 2015 | Volume 2 | Article 22 | 9

Bordignon et al. Strain localization in ductile materials
FIGURE 13 | Results for a rectangular domain (L = 40 mm, H = 10 mm) ofmaterial close to shear band instability (Ep = 300 MPa) and containing apre-existing shear band (of length H/2 = 5 mm and constitutive thickness2h = 0.01 mm). (A) Overall response curve of the block in terms of averageshear stress σ12 = T /L, where T is the total shear reaction force at the upperedge of the block, and average shear strain γ12 = u1/H . (B) Magnification of
the overall response curve σ12 − γ12 around the stress level corresponding tothe yielding of the shear band. (C) Contour plots of the shear deformation γ 12
at different stages of deformation, corresponding to the points along theoverall response curve shown in (B) of the figure. The deformation is highlyfocused along a rectilinear path emanating from the shear band tip. Thedisplacements in the figures are amplified by a deformation scale factor of 50.
FIGURE 14 | The incremental shear strain γ12 (divided bythe mean incremental shear strain ˙γ 12) along the x -axis atthe two stages of deformation, (A) u1 = 0.0340 mm and(B) u1 = 0.03623 mm, reported in Figure 10 and labeled there as
(Figures 10A,C). It is clear that a strong strain concentration developsat the tip of the shear band, which becomes similar to the square-rootsingularity that is found with the perturbative approach (Section 4 andFigure 16).
deformation is highly focused along a rectilinear path emanatingfrom the shear band tip, thus demonstrating the tendency of theshear band toward rectilinear propagation under shear loading.
Finally, the incremental shear strain (divided by the meanincremental shear strain) has been reported along the x-axis inFigure 14, at the two stages of deformation considered in Figure 10
Frontiers in Materials | Mechanics of Materials March 2015 | Volume 2 | Article 22 | 10
Bordignon et al. Strain localization in ductile materials
and referred there as (Figures 10A,C). These results, which havebeen obtained with the fine mesh, show that a strong incrementalstrain concentration develops at the shear band tip and becomesqualitatively similar to the square-root singularity found in theperturbative approach.
4. THE PERTURBATIVE VERSUS THE IMPERFECTIONAPPROACH
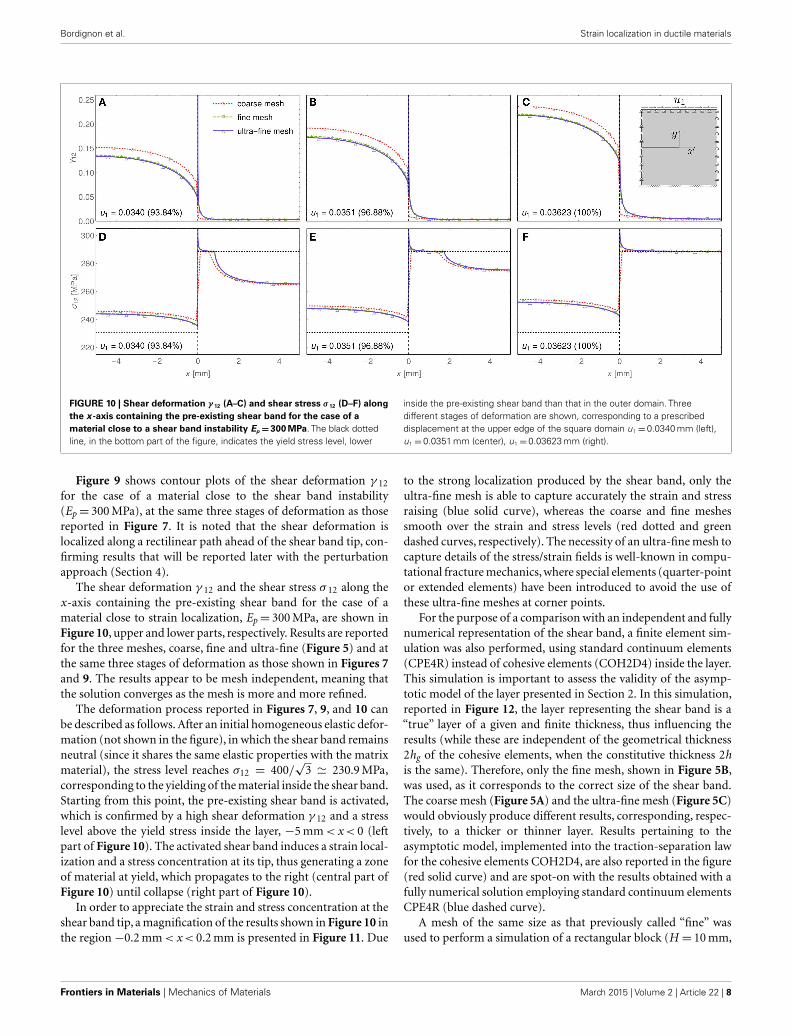
With the perturbative approach, a perturbing agent acts at a cer-tain stage of uniform strain of an infinite body, while the materialis subject to a uniform prestress. Here, the perturbing agent is apre-existing shear band, modeled as a planar slip surface, emergingat a certain stage of a deformation path (Bigoni and Dal Corso,2008), in contrast with the imperfection approach in which theimperfection is present from the beginning of the loading.
With reference to a x1− x2 coordinate system (inclined at 45°with respect to the principal prestress axes xI – xII), where theincremental stress tij and incremental strain εij are defined (i, j = 1,2), the incremental orthotropic response under plane-strain con-ditions (εi3 = 0) for incompressible materials (ε11 + ε22 = 0) canbe expressed through the following constitutive equations (Bigoni,2012)8.
t11 = 2µε11 + p, t22 = −2µε11 + p, t12 = µ∗γ12, (11)
where p is the incremental in-plane mean stress, while µ and µ∗describe the incremental shear stiffness, respectively, parallel andinclined at 45° with respect to prestress axes.
The assumption of a specific constitutive model leads to thedefinition of the incremental stiffness moduli µ and µ*. With ref-erence to the J2-deformation theory of plasticity (Bigoni and DalCorso, 2008), particularly suited to model the plastic branch ofthe constitutive response of ductile metals, the in-plane deviatoricstress can be written as
tI − tII = kεI |εI |(N−1). (12)
In equation (12), k represents a stiffness coefficient and N ∈ (0,1] is the strain hardening exponent, describing perfect plasticity(null hardening) in the limit N→ 0 and linear elasticity in thelimit N→ 1. For the J2-deformation theory, the relation betweenthe two incremental shear stiffness moduli can be obtained as
µ∗ = Nµ, (13)
so that a very compliant response under shear (µ∗�µ) isdescribed in the limit of perfect plasticity N→ 0.
The perturbative approach (Bigoni and Dal Corso, 2008) cannow be exploited to investigate the growth of a shear band withina solid. To this purpose, an incremental boundary value prob-lem is formulated for an infinite solid, containing a zero-thicknesspre-existing shear band of finite length 2l parallel to the x1 axis
8Note that the notation used here differs from that adopted in Bigoni and Dal Corso(2008), where the principal axes are denoted by x1 and x2 and the system inclinedat 45° is denoted by x1 and x2.
x1
xII
ll
x2
xI
FIGURE 15 | A perturbative approach to shear band growth: apre-existing shear band, modeled as a planar slip surface, acts at acertain stage of uniform deformation of an infinite body obeying theJ2-deformation theory of plasticity.
(see Figure 15) and loaded at infinity through a uniform sheardeformation γ∞12 .
The incremental boundary conditions introduced by the pres-ence of a pre-existing shear band can be described by the followingequations:
t21(x1, 0±) = 0, [[t22(x1, 0)]] = 0, [[u2(x1, 0)]] = 0, ∀|x1| < l .(14)
A stream function ψ(x1, x2) is now introduced, automati-cally satisfying the incompressibility condition and defining theincremental displacements uj as u1 = ψ,2, and u2 = −ψ,1. Theincremental boundary value problem is therefore solved as the sumof ψ°(x1, x2), solution of the incremental homogeneous problem,and ψp(x1, x2), solution of the incremental perturbed problem.
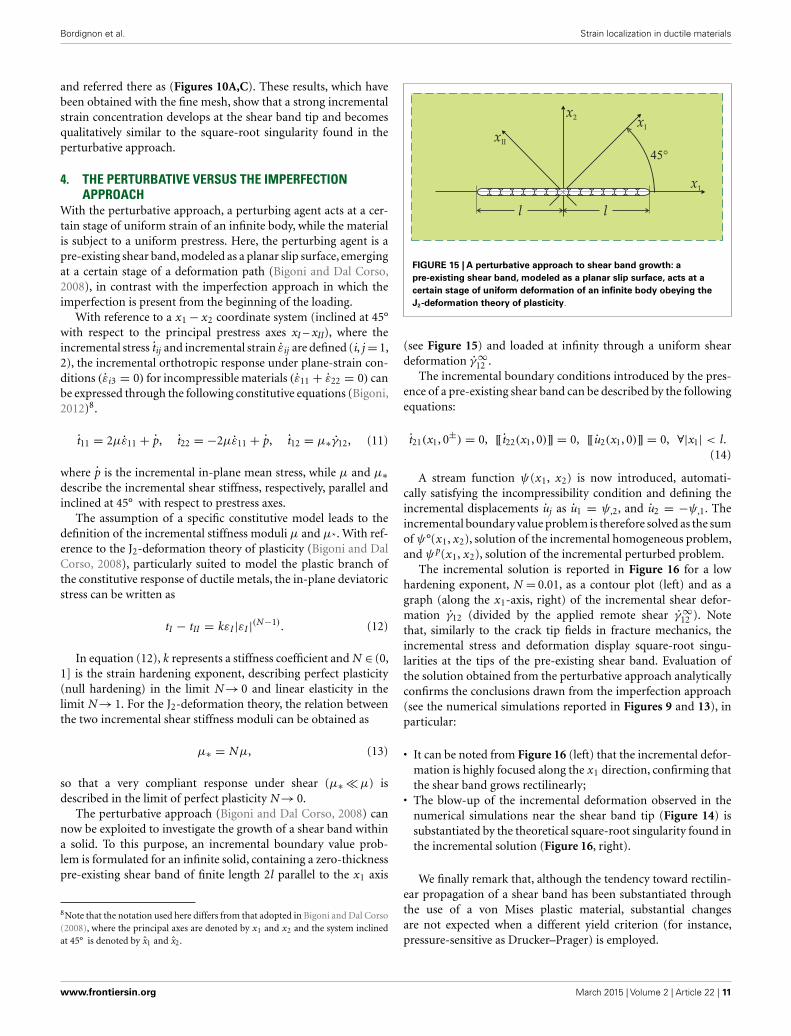
The incremental solution is reported in Figure 16 for a lowhardening exponent, N = 0.01, as a contour plot (left) and as agraph (along the x1-axis, right) of the incremental shear defor-mation γ12 (divided by the applied remote shear γ∞12 ). Notethat, similarly to the crack tip fields in fracture mechanics, theincremental stress and deformation display square-root singu-larities at the tips of the pre-existing shear band. Evaluation ofthe solution obtained from the perturbative approach analyticallyconfirms the conclusions drawn from the imperfection approach(see the numerical simulations reported in Figures 9 and 13), inparticular:
• It can be noted from Figure 16 (left) that the incremental defor-mation is highly focused along the x1 direction, confirming thatthe shear band grows rectilinearly;
• The blow-up of the incremental deformation observed in thenumerical simulations near the shear band tip (Figure 14) issubstantiated by the theoretical square-root singularity found inthe incremental solution (Figure 16, right).
We finally remark that, although the tendency toward rectilin-ear propagation of a shear band has been substantiated throughthe use of a von Mises plastic material, substantial changesare not expected when a different yield criterion (for instance,pressure-sensitive as Drucker–Prager) is employed.
www.frontiersin.org March 2015 | Volume 2 | Article 22 | 11

Bordignon et al. Strain localization in ductile materials
x /l1
x /l2
0
1
-10 1 2
12( ,0)x1
12
x /l10 1 432 5
1
2
3
4
5
12( , )x1 x2.
.
.
FIGURE 16 | Incremental shear strain near a shear band obtained through the perturbative approach: level sets (left) and behavior along the x 1-axis(right).
5. CONCLUSIONTwo models of shear band have been described, one in which theshear band is an imperfection embedded in a material and anotherin which the shear band is a perturbation, which emerges duringa homogeneous deformation of an infinite material. These twomodels explain how shear bands tend toward a rectilinear propa-gation under continuous shear loading, a feature not observed forfracture trajectories in brittle materials. This result can be stated indifferent words pointing out that, while crack propagation occursfollowing a maximum tensile stress criterion, a shear band growsaccording to a maximum Mises stress, a behavior representing abasic micromechanism of failure for ductile materials. The devel-oped models show also a strong stress concentration at the shearband tip, which strongly concur to shear band growth.
ACKNOWLEDGMENTSDB, NB, and FDC gratefully acknowledge financial support fromthe ERC Advanced Grant “Instabilities and non-local multi-scale modeling of materials” FP7-PEOPLE-IDEAS-ERC-2013-AdG (2014-2019). AP thanks financial support from the FP7-PEOPLE-2013-CIG grant PCIG13-GA-2013-618375-MeMic.
REFERENCESAbeyaratne, R., and Triantafyllidis, N. (1981). On the emergence of shear bands
in plane strain. Int. J. Solids Struct. 17, 1113–1134. doi:10.1016/0020-7683(81)90092-5
Antipov, Y. A., Avila-Pozos, O., Kolaczkowski, S. T., and Movchan, A. B. (2001).Mathematical model of delamination cracks on imperfect interfaces. Int. J. SolidsStruct. 38, 6665–6697. doi:10.1016/S0020-7683(01)00027-0
Argani, L., Bigoni, D., Capuani, D., and Movchan, N. V. (2014). Cones of local-ized shear strain in incompressible elasticity with prestress: Green’s func-tion and integral representations. Proc. Math. Phys. Eng. Sci. 470, 20140423.doi:10.1098/rspa.2014.0423
Argani, L., Bigoni, D., and Mishuris, G. (2013). Dislocations and inclusions in pre-stressed metals. Proc. R. Soc. A 469, 20120752. doi:10.1098/rspa.2012.0752
Bacigalupo, A., and Gambarotta, L. (2013). A multi-scale strain-localization analysisof a layered strip with debonding interfaces. Int. J. Solids Struct. 50, 2061–2077.doi:10.1016/j.ijsolstr.2013.03.006
Bigoni, D. (2012). Nonlinear Solid Mechanics Bifurcation Theory and Material Insta-bility. New York: Cambridge University Press.
Bigoni, D., and Capuani, D. (2002). Green’s function for incremental nonlinear elas-ticity: shear bands and boundary integral formulation. J. Mech. Phys. Solids 50,471–500. doi:10.1016/S0022-5096(01)00090-4
Bigoni, D., and Capuani, D. (2005). Time-harmonic Green’s function and boundaryintegral formulation for incremental nonlinear elasticity: dynamics of wave pat-terns and shear bands. J. Mech. Phys. Solids 53, 1163–1187. doi:10.1016/j.jmps.2004.11.007
Bigoni, D., and Dal Corso, F. (2008). The unrestrainable growth of a shear band in aprestressed material. Proc. R. Soc. A 464, 2365–2390. doi:10.1098/rspa.2008.0029
Bigoni, D., Dal Corso, F., and Gei, M. (2008). The stress concentration near a rigidline inclusion in a prestressed, elastic material. Part II. Implications on shear bandnucleation, growth and energy release rate. J. Mech. Phys. Solids 56, 839–857.doi:10.1016/j.jmps.2007.07.003
Bigoni, D., Serkov, S. K., Movchan, A. B., and Valentini, M. (1998). Asymptotic mod-els of dilute composites with imperfectly bonded inclusions. Int. J. Solids Struct.35, 3239–3258. doi:10.1016/S0020-7683(97)00366-1
Boulogne, F., Giorgiutti-Dauphine, F., and Pauchard, L. (2015). Surface patternsin drying films of silica colloidal dispersions. Soft Matter 11, 102. doi:10.1039/c4sm02106a
Ciarletta, P., Destrade, M., and Gower, A. L. (2013). Shear instability in skin tissue.Q. J. Mech. Appl. Math. 66, 273–288. doi:10.1097/TA.0b013e3182092e66
Dal Corso, F., and Bigoni, D. (2009). The interactions between shear bands andrigid lamellar inclusions in a ductile metal matrix. Proc. R. Soc. A 465, 143–163.doi:10.1098/rspa.2008.0242
Dal Corso, F., and Bigoni, D. (2010). Growth of slip surfaces and line inclu-sions along shear bands in a softening material. Int. J. Fract. 166, 225–237.doi:10.1007/s10704-010-9534-1
Dal Corso, F., Bigoni, D., and Gei, M. (2008). The stress concentration near a rigidline inclusion in a prestressed, elastic material. Part I. Full field solution andasymptotics. J. Mech. Phys. Solids 56, 815–838. doi:10.1016/j.jmps.2007.07.002
Dal Corso, F., and Willis, J. R. (2011). Stability of strain-gradient plastic materials.J. Mech. Phys. Solids 59, 1251–1267. doi:10.1016/j.jmps.2011.01.014
Danas, K., and Ponte Castaneda, P. (2012). Influence of the Lode parameter andthe stress triaxiality on the failure of elasto-plastic porous materials. Int. J. SolidsStruct. 49, 1325–1342. doi:10.1016/j.ijsolstr.2012.02.006
Destrade, M., Gilchrist, M., Prikazchikov, D., and Saccomandi, G. (2008). Surfaceinstability of sheared soft tissues. J. Biomech. Eng. 130, 061007. doi:10.1115/1.2979869
Destrade, M., and Merodio, J. (2011). Compression instabilities of tissueswith localized strain softening. Int. J. Appl. Mech. 3, 69–83. doi:10.1142/S1758825111000877
Gajo, A., Bigoni, D., and Muir Wood, D. (2004). Multiple shear band developmentand related instabilities in granular materials. J. Mech. Phys. Solids 52, 2683–2724.doi:10.1016/j.jmps.2004.05.010
Hill, R. (1962). Acceleration waves in solids. J. Mech. Phys. Solids 10, 1–16.doi:10.1016/0022-5096(62)90024-8
Frontiers in Materials | Mechanics of Materials March 2015 | Volume 2 | Article 22 | 12

Bordignon et al. Strain localization in ductile materials
Hutchinson, J. W., and Tvergaard, V. (1981). Shear band formation in plane strain.Int. J. Solids Struct. 17, 451–470. doi:10.1111/j.1365-2818.2009.03250.x
Kirby, S. H. (1985). Rock mechanics observations pertinent to the rheology of thecontinental lithosphere and the localization of strain along shear zones. Tectono-physics 119, 1–27. doi:10.1016/0040-1951(85)90030-7
Lapovok, R., Toth, L. S., Molinari, A., and Estrina, Y. (2009). Strain localisation pat-terns under equal-channel angular pressing. J. Mech. Phys. Solids 57, 122–136.doi:10.1016/j.jmps.2008.09.012
Loret, B., and Prevost, J. H. (1991). On the existence of solutions in layered elasto-(visco-)plastic solids with negative hardening. Eur. J. Mech. A Solids 10, 575–586.
Loret, B., and Prevost, J. H. (1993). On the occurrence of unloading in 1D elasto-(visco-)plastic structures with softening. Eur. J. Mech. Solids 12, 757–772.
Mandel, J. (1962). Ondes plastiques dans un milieu indéfini à trois dimensions. J.Mécanique 1, 3–30.
Miehe, C., Hofacker, M., and Welschinger, F. (2010). A phase field model for rate-independent crack propagation: robust algorithmic implementation based onoperator splits. Comput. Methods Appl. Mech. Eng. 199, 2765–2778. doi:10.1016/j.cma.2010.04.011
Mishuris, G. (2001). Interface crack and nonideal interface concept (Mode III). Int.J. Fract. 107, 279–296. doi:10.1023/A:1007664911208
Mishuris, G. (2004). Imperfect transmission conditions for a thin weakly compress-ible interface. 2D problems. Arch. Mech. 56, 103–115.
Mishuris, G., and Kuhn, G. (2001). Asymptotic behaviour of the elastic solutionnear the tip of a crack situated at a nonideal interface. Z. Angew. Math. Mech.81, 811–826. doi:10.1002/1521-4001(200112)81:12<811::AID-ZAMM811>3.0.CO;2-I
Mishuris, G., Miszuris, W., Ochsner, A., and Piccolroaz, A. (2013). “Transmissionconditions for thin elasto-plastic pressure-dependent interphases,” in Plasticity ofPressure-Sensitive Materials, eds H. Altenbach and A. Ochsner (Berlin: Springer-Verlag), 205–251.
Mishuris, G., and Ochsner, A. (2005). Transmission conditions for a soft elasto-plastic interphase between two elastic materials. Plane Strain State. Arch. Mech.57, 157–169.
Mishuris, G., and Ochsner, A. (2007). 2D modelling of a thin elasto-plastic inter-phase between two different materials: plane strain case. Compos. Struct. 80,361–372. doi:10.1016/j.compstruct.2006.05.017
Nadai, A. (1950). Theory of Flow and Fracture of Solids. New York, NY:McGraw-Hill.
Needleman, A. (1988). Material rate dependence and mesh sensitivity in localiza-tion problems. Comput. Methods Appl. Mech. Eng. 67, 69–75. doi:10.1016/0045-7825(88)90069-2
Needleman, A., and Tvergaard, V. (1983). “Finite element analysis of localization inplasticity”, in Finite Elements: Special Problems in Solid Mechanics, Vol. V, eds J.T. Oden and G. F. Carey (Englewood Cliffs: Prentice-Hall), 94–157.
Peron, H., Laloui, L., Hu, L. B., and Hueckel, T. (2013). Formation of dryingcrack patterns in soils: a deterministic approach. Acta Geotech. 8, 215–221.doi:10.1007/s11440-012-0184-5
Petryk, H. (1997). Plastic instability: criteria and computational approaches. Arch.Comput. Meth. Eng. 4, 111–151. doi:10.1007/BF03020127
Piccolroaz, A., Bigoni, D., and Willis, J. R. (2006). A dynamical interpretation offlutter instability in a continuous medium. J. Mech. Phys. Solids 54, 2391–2417.doi:10.1016/j.jmps.2006.05.005
Prager,W. (1954).“Discontinuous fields of plastic stress and flow,”in 2nd Nat. Congr.Appl. Mech (Ann Arbor, MI: ASME), 21–32.
Puzrin, A. M., and Germanovich, L. N. (2005). The growth of shear bands in thecatastrophic failure of soils. Proc. R. Soc. A 461, 1199–1228. doi:10.1098/rspa.2004.1378
Rice, J. R. (1973). “The initiation and growth of shear bands,” in Plasticity and SoilMechanics, ed. A. C. Palmer (Cambridge: Cambridge University EngineeringDepartment), 263.
Rice, J. R. (1977). “The localization of plastic deformation,” in Theoretical andApplied Mechanics, ed. W. T. Koiter (Amsterdam: North-Holland PublishingCo.), 207.
Sonato, M., Piccolroaz, A., Miszuris, W. and Mishuris, G. (2015). General transmis-sion conditions for thin elasto-plastic pressure-dependent interphase betweendissimilar materials. Int. J. Solids Struct. doi:10.1016/j.ijsolstr.2015.03.009
Thomas, T. Y. (1961). Plastic Flows and Fracture of Solids. New York, NY: AcademicPress.
Tvergaard, V. (2014). Bifurcation into a localized mode from non-uniform peri-odic deformations around a periodic pattern of voids. J. Mech. Phys. Solids 69,112–122. doi:10.1016/j.jmps.2014.05.002
Yang, B., Morrison, M. L., Liaw, P. K., Buchanan, R. A., Wang, G., Liu, C. T., et al.(2005). Dynamic evolution of nanoscale shear bands in a bulk-metallic glass.Appl. Phys. Lett. 86, 141904. doi:10.1063/1.1891302
Zheng, G. P., and Li, M. (2009). Mesoscopic theory of shear banding and crackpropagation in metallic glasses. Phys. Rev. B 80, 104201. doi:10.1103/PhysRevB.80.104201
Conflict of Interest Statement: The authors declare that the research was conductedin the absence of any commercial or financial relationships that could be construedas a potential conflict of interest.
Received: 23 January 2015; accepted: 01 March 2015; published online: 23 March 2015.Citation: Bordignon N, Piccolroaz A, Dal Corso F and Bigoni D (2015) Strain local-ization and shear band propagation in ductile materials. Front. Mater. 2:22. doi:10.3389/fmats.2015.00022This article was submitted to Mechanics of Materials, a section of the journal Frontiersin Materials.Copyright © 2015 Bordignon, Piccolroaz, Dal Corso and Bigoni. This is an open-accessarticle distributed under the terms of the Creative Commons Attribution License (CCBY). The use, distribution or reproduction in other forums is permitted, provided theoriginal author(s) or licensor are credited and that the original publication in thisjournal is cited, in accordance with accepted academic practice. No use, distribution orreproduction is permitted which does not comply with these terms.
www.frontiersin.org March 2015 | Volume 2 | Article 22 | 13