strain-induced crystallization of poly(ethylene 2,5
TRANSCRIPT
HAL Id: hal-02429039https://hal.archives-ouvertes.fr/hal-02429039
Submitted on 14 Jan 2020
HAL is a multi-disciplinary open accessarchive for the deposit and dissemination of sci-entific research documents, whether they are pub-lished or not. The documents may come fromteaching and research institutions in France orabroad, or from public or private research centers.
L’archive ouverte pluridisciplinaire HAL, estdestinée au dépôt et à la diffusion de documentsscientifiques de niveau recherche, publiés ou non,émanant des établissements d’enseignement et derecherche français ou étrangers, des laboratoirespublics ou privés.
Strain-induced crystallization of poly(ethylene2,5-furandicarboxylate). Mechanical and
crystallographic analysisEmilie Forestier, Christelle Combeaud, Nathanaël Guigo, Gabriel Monge,
Jean-Marc Haudin, Nicolas Sbirrazzuoli, Noëlle Billon
To cite this version:Emilie Forestier, Christelle Combeaud, Nathanaël Guigo, Gabriel Monge, Jean-Marc Haudin, et al..Strain-induced crystallization of poly(ethylene 2,5-furandicarboxylate). Mechanical and crystallo-graphic analysis. Polymer, Elsevier, 2020, 187, �10.1016/j.polymer.2019.122126�. �hal-02429039�

Polymer 187 (2020) 122126
Available online 23 December 20190032-3861/© 2019 Elsevier Ltd. All rights reserved.
Strain-induced crystallization of poly(ethylene 2,5-furandicarboxylate). Mechanical and crystallographic analysis
Emilie Forestier a,b,c, Christelle Combeaud a, Nathana€el Guigo b, Gabriel Monge a, Jean-Marc Haudin a, Nicolas Sbirrazzuoli b, No€elle Billon a,*
a MINES ParisTech, PSL Research University, CNRS, Centre de Mise en Forme des Mat�eriaux (CEMEF), UMR 7635, 06904, Sophia Antipolis Cedex, France b Universit�e Cote d’Azur, CNRS, Institut de Chimie de Nice (ICN), UMR 7272, 06108, Nice Cedex 2, France c Agence de l’Environnement et de la Maîtrise de l’Energie, 20, avenue du Gr�esill�e, BP 90406, 49004, Angers Cedex 01, France
A R T I C L E I N F O
Keywords: Poly(ethylene 2,5-furandicarboxylate) Mechanical behaviour Strain induced crystallization Bio-sourced polymer Crystal lattice
A B S T R A C T
Poly(ethylene 2,5-furandicarboxylate), referred to as PEF, was uni-axially stretched for temperatures above glass transition temperature. This bio-based polymer is considered as a serious competitor for the petroleum analogous poly(ethylene terephthalate), named PET. To replace PET in bottle forming, PEF has to be deformed to large strains which are only reachable when it is in its rubbery state. In the present work, the stretching conditions have been chosen by determining precisely the range of temperature and strain rate where PEF exhibits a rubbery-like state. This was feasible through the building of a master curve at a reference temperature. Local strain field measurements allow the description of PEF intrinsic mechanical behaviour. Above a draw ratio of around 6 to 8, the mechanical response presents an impressive strain hardening whereas a well-defined crys-talline phase with a high orientation is formed. Diffraction peaks were indexed and compared to previous papers. Only one crystalline phase was observed either under mechanical loading or during static crystallization. Me-chanical loading significantly speeds up crystallization.
1. Introduction
The so-called strain-induced-crystallization (SIC) of amorphous polymers was described by Katz in 1925 [1] and further characterized over the years [2,3] in the case of rubbers.
This ability to develop a specific semi-crystalline microstructure from amorphous state under mechanical loading above glass transition has been the basis of important applications such as film biaxial stretching, fiber spinning and stretch-blow moulding for bottles in the case of poly(ethylene terephthalate) (PET).
Nowadays, PET owns a leading place with respect to its remarkable thermal, mechanical and barrier properties as well as its dimensional stability and its transparency. Over the last decades, “strain induced crystallization” in PET has been widely documented in the literature [4–17] since the crystalline phase of PET has been described in 1954 [18]. This effort in research allowed optimizing industrial processes. However, in the current context, where the global trend is to decrease the petroleum dependence, bio-based polymers such as poly(ethylene 2, 5-furandicarboxylate) (PEF) could be an important competitor for PET.
Indeed, this polymer is sometimes considered as the PET furan-derived chemical analogue.
PEF results from condensation of ethylene glycol and furan di- carboxylic acid (FDCA) instead of terephthalic acid in the case of PET. The only difference between the two repeat units (Fig. 1) is the presence of a furan ring with an oxygen atom instead of the benzene one. The furan introduces a pentahedral cycle with 4 carbons smaller than the benzene ring.
Even if PET and PEF appear at a first glance chemically close to each other, they are significantly different. For example, PEF exhibits a higher rigidity and better barrier properties compared to PET, presumably because of differences in chain mobility [19–22]. This justifies specific efforts to be put on PEF to understand its stretch ability and its SIC. As PEF is a relatively new material, only few descriptions of its physical properties exist. Nevertheless, thermal crystallization and melting be-haviours were investigated in quiescent conditions [23–28].
Because of its relative novelty as well as its rarity, few studies deal with the mechanical behaviour and with SIC of PEF under uni-axial stretching [29–31] or under bi-axial stretching [32]. Considering the
* Corresponding author. E-mail address: [email protected] (N. Billon).
Contents lists available at ScienceDirect
Polymer
journal homepage: http://www.elsevier.com/locate/polymer
https://doi.org/10.1016/j.polymer.2019.122126 Received 7 October 2019; Received in revised form 16 December 2019; Accepted 22 December 2019
Polymer 187 (2020) 122126
2
“state of the art”, it appears that PEF should exhibit SIC as PET does, but a simple transposition of stretching conditions cannot be successful. Stretching temperature and strain rate must be adjusted to PEF to ac-count for specific glass transition temperature and chain dynamics. Based on the assumption that stretching of an amorphous polymer is efficient when the material is in its rubber-like state, Menager et al. [31] successively used an approach based on the time (or frequency)/-temperature superposition principle to select relevant stretching con-ditions for PEF (temperature and strain rate). It was then demonstrated that a range for draw ability of PEF could be defined in terms of equivalent strain rate at a reference temperature deduced from linear visco-elastic analysis, as for PET and other materials (for more infor-mation see Refs. [33–35]).
Upon stretching above its glass transition, and for appropriate tem-perature and strain rate conditions, PEF strain-induced crystallization has been proven [29–32]. Nevertheless, none of the previous studies allowed to unambiguously relate local mechanical loading to local microstructure, due to the use of engineering data. Finally, only few studies on the nature of strain-induced crystalline structure are available in the literature [36,37]. The very first PEF structure proposed by Kazaryan et al. [36] belonged to the triclinic system with the following unit cell parameters: a ¼ 4.56 Å, b ¼ 5.94 Å, c ¼ 10.75 Å, α ¼ 98.5�, β ¼118�, γ ¼ 112�. This structure has been recently revisited by Mao et al. [37]. In consequence, a monoclinic unit cell with two repeat units along c-axis instead of one (a ¼ 5.78 Å, b ¼ 6.78 Å, c ¼ 20.296 Å, α ¼ β ¼ 90�, γ ¼ 103.3�), could be more appropriate to optimize chain packing. In both cases c-axis, is parallel to chain skeleton.
Present study aims at contributing to analyze SIC in PEF. First, the induced crystalline phase is characterized and compared to that ob-tained in quiescent conditions to validate previous data. WAXS is used to that purpose and all diffraction peaks are indexed according to mono-clinic system proposed by Mao et al. [37].
To avoid any ambiguity and complete previous study [31], specific efforts are devoted to the control of both local loading path and local thermo-mechanical history. Doing this, draw ability and correlation between drawing conditions and final microstructure will be addressed. Drawing conditions are chosen thanks to time/temperature super-position principle in order to be representative for stretch blow moulding, which is one of the targeted processing for PEF. For this purpose, linear visco-elastic analysis is performed thanks to DMTA (Dynamical Mechanical and Thermal Analysis).
2. Material and methods
2.1. Material
Poly(ethylene 2,5-furandicarboxylate) was synthetized from the direct esterification and melt- and solid state polycondensation (SSP) of 2,5-furandicarboxylic acid FDCA produced by Avantium and mono-ethylene glycol. Extruded PEF sheets with a thickness of 700 μm have been provided. Samples were extracted in the extrusion direction and analyzed “dry as processed” without additional conditioning.
2.2. D.M.T.A measurement
DMTA experiments were conducted on a Mettler-Toledo DMA 1 in a tensile mode. The sample dimensions were 5 � 4 � 0.7 mm3. Before any test, the sample undergoes a preload of 1 N. For each measurement, the
sample is in the low deformation domain. Temperature and frequency scans were carried out in Auto-Tension mode and with a displacement amplitude of 5 μm (i.e., a strain amplitude of 0.1%). Temperature scans were performed between 25 �C and 210 �C at 1 �C/min, and with a frequency of 1 Hz, whereas frequency scans were conducted from 0.1 Hz to 100 Hz for constant temperatures between 85 �C and 135 �C with 5 �C step.
2.3. Uni-axial stretching set-up
Uni-axial tensile tests have been performed on a lab device designed for film stretching in controlled temperature conditions. It reproduces the industrial uni-axial and bi-axial stretching conditions. It is composed of four independent motor-driven arms, each of them coupled to a displacement sensor and a 500 N force transducer. For uni-axial stretching, only two arms are used. The arm displacement can be controlled thanks to arm velocity, position or force regulations. To keep the strain rate ἐ0 as constant as possible in the central zone of the samples and considering that the specimen length increases, the arms have been controlled in velocity, with an exponential evolution with time (Equation (1)).
vðtÞ ¼ έ0L0expðέ0tÞ and t ¼lnðλðtÞÞ
έ0¼
1έ0
ln�
LðtÞL0
�
(1)
where L0 and L(t) are the initial and current length of the specimen, λ(t) is the draw ratio.
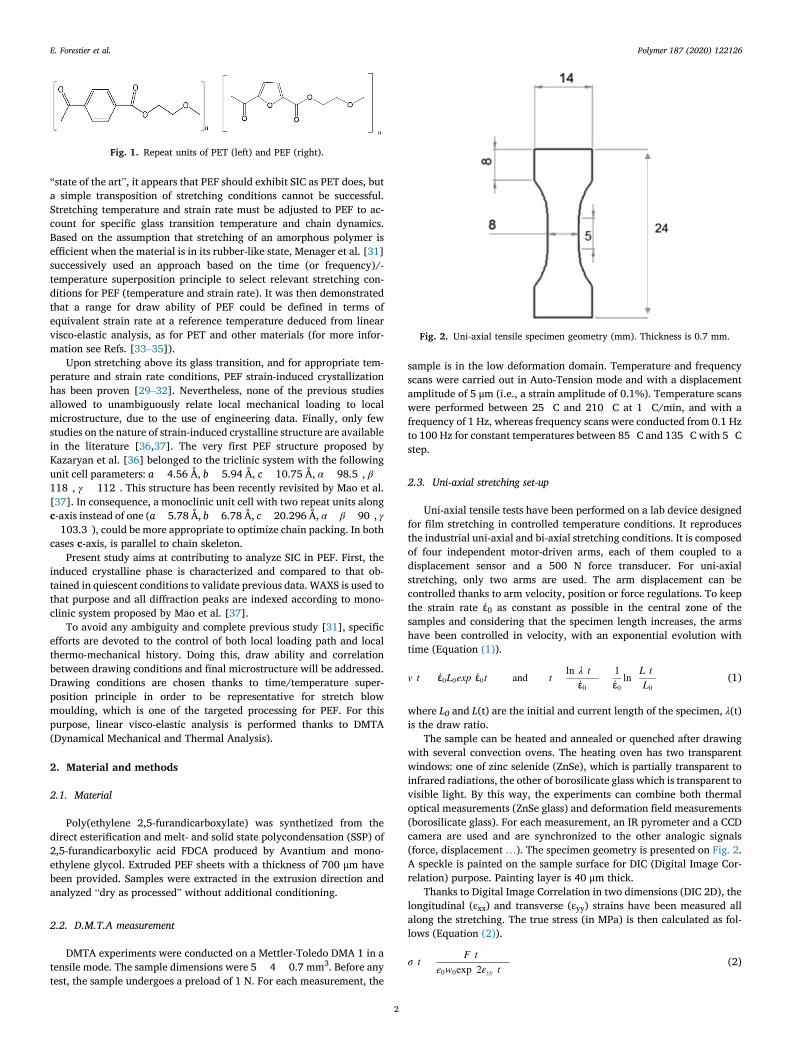
The sample can be heated and annealed or quenched after drawing with several convection ovens. The heating oven has two transparent windows: one of zinc selenide (ZnSe), which is partially transparent to infrared radiations, the other of borosilicate glass which is transparent to visible light. By this way, the experiments can combine both thermal optical measurements (ZnSe glass) and deformation field measurements (borosilicate glass). For each measurement, an IR pyrometer and a CCD camera are used and are synchronized to the other analogic signals (force, displacement …). The specimen geometry is presented on Fig. 2. A speckle is painted on the sample surface for DIC (Digital Image Cor-relation) purpose. Painting layer is 40 μm thick.
Thanks to Digital Image Correlation in two dimensions (DIC 2D), the longitudinal (εxx) and transverse (εyy) strains have been measured all along the stretching. The true stress (in MPa) is then calculated as fol-lows (Equation (2)).
σðtÞ ¼ FðtÞe0w0exp
�2εyyðtÞ
� (2)
Fig. 1. Repeat units of PET (left) and PEF (right).
Fig. 2. Uni-axial tensile specimen geometry (mm). Thickness is 0.7 mm.
E. Forestier et al.
Polymer 187 (2020) 122126
3
where F(t) is the force (N), e0 the initial thickness (mm), w0 the initial width (mm) and εyy (t) the evolution of the strain in the transversal direction.
2.4. X-ray techniques
To analyze the induced microstructure, wide-angle X-ray scattering (WAXS) experiments are conducted, after stretching and subsequent quenching by cold air. The sample process zone, where mechanical behaviour is also analyzed, is the zone where microstructural charac-terizations are performed. 2D Debye-Scherrer patterns using the flat- film camera technique under vacuum at ambient temperature are recorded as a first experiment to observe the possible crystalline orien-tation. Two sample-screen distances OE (Fig. 3) have been chosen to detect a larger range of crystal lattice planes (75 mm and 30 mm). Exposure time was 45 min.
1D scans I(2θ) were also carried out at room temperature, in trans-mission mode (from 5� or 10�–50�), using a diffractometer Philips X’Pert PRO supplied by Panalytical. As for Debye-Scherrer experiments, the CuKα radiation (λ ¼ 1.54 Å) was used. As experiments were performed in transmission, scan intensities where divided by the sample thickness. Azimuthal scans I(ϕ) for a constant θ were conducted on the same de-vice. Calibration is performed with a silicon standard. Three silicon diffractions peaks are taken as reference and then, the offsets are fixed.
2.5. Identification of Miller’s indices (hkl)
In this study, as all angular positions (2θ) of diffraction peaks are not yet known for PEF, a specific protocol was developed to extract the Miller indices (h k l) of diffracting planes from scattering patterns.
The distance between the diffracted spot and the centre of the film OR was measured. Then, the angular position of the spot (θ) can be determined as explained on Fig. 3. Nhkl represents the normal to dif-fracting plane.
In a second time, an azimuthal scan from 0 to 360� is performed for each angular position 2θ found to estimate the angular position ϕ associated to the maximal intensity of this angular position 2θ. By this way, all the diffracted spots have been referred in terms of 2θ and ϕ angles.
Once the crystalline positions have been localized and associated to a possible interreticular spacing through Bragg law, and assuming the monoclinic crystalline structure proposed by Mao et al. [37], diffraction spots can be associated to crystallographic planes using a commercial software called CaRIne®.
3. Results and discussions
3.1. Mechanical behaviour analysis
3.1.1. Uniaxial stretching protocol Drawing must be performed above glass transition temperature for
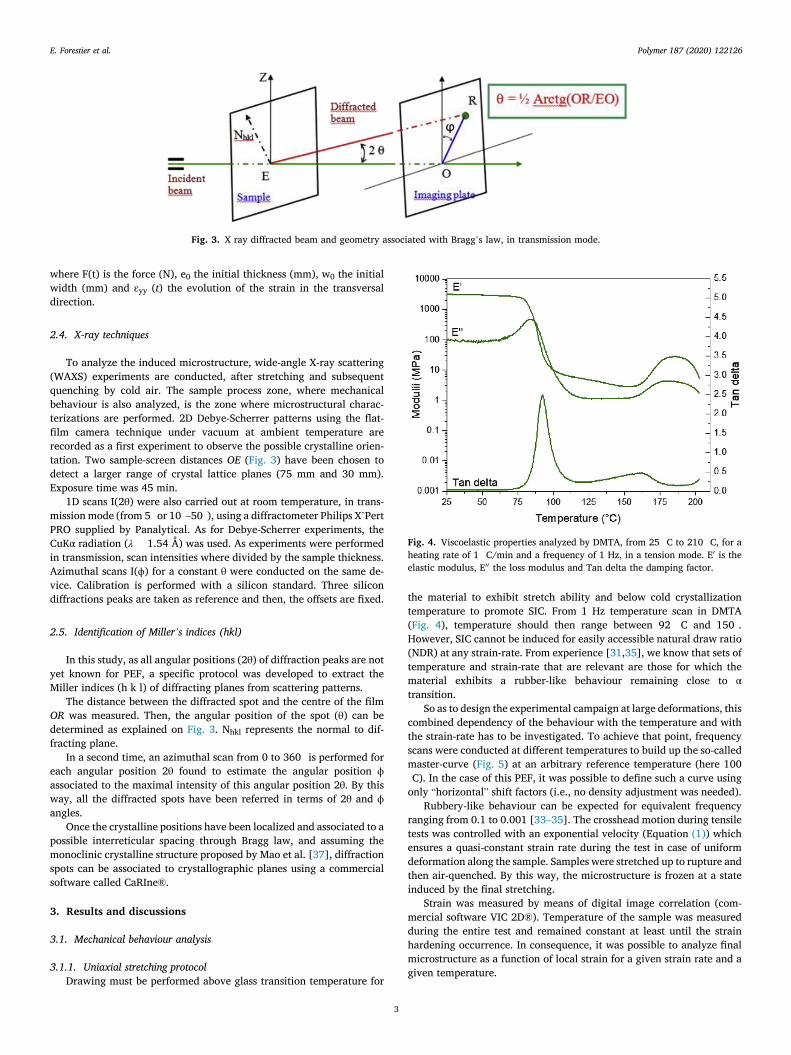
the material to exhibit stretch ability and below cold crystallization temperature to promote SIC. From 1 Hz temperature scan in DMTA (Fig. 4), temperature should then range between 92 �C and 150�. However, SIC cannot be induced for easily accessible natural draw ratio (NDR) at any strain-rate. From experience [31,35], we know that sets of temperature and strain-rate that are relevant are those for which the material exhibits a rubber-like behaviour remaining close to α transition.
So as to design the experimental campaign at large deformations, this combined dependency of the behaviour with the temperature and with the strain-rate has to be investigated. To achieve that point, frequency scans were conducted at different temperatures to build up the so-called master-curve (Fig. 5) at an arbitrary reference temperature (here 100 �C). In the case of this PEF, it was possible to define such a curve using only “horizontal” shift factors (i.e., no density adjustment was needed).
Rubbery-like behaviour can be expected for equivalent frequency ranging from 0.1 to 0.001 [33–35]. The crosshead motion during tensile tests was controlled with an exponential velocity (Equation (1)) which ensures a quasi-constant strain rate during the test in case of uniform deformation along the sample. Samples were stretched up to rupture and then air-quenched. By this way, the microstructure is frozen at a state induced by the final stretching.
Strain was measured by means of digital image correlation (com-mercial software VIC 2D®). Temperature of the sample was measured during the entire test and remained constant at least until the strain hardening occurrence. In consequence, it was possible to analyze final microstructure as a function of local strain for a given strain rate and a given temperature.
Fig. 3. X ray diffracted beam and geometry associated with Bragg’s law, in transmission mode.
Fig. 4. Viscoelastic properties analyzed by DMTA, from 25 �C to 210 �C, for a heating rate of 1 �C/min and a frequency of 1 Hz, in a tension mode. E0 is the elastic modulus, E00 the loss modulus and Tan delta the damping factor.
E. Forestier et al.

Polymer 187 (2020) 122126
4
In this paper, one example is chosen in the middle of this range, which is associated to an equivalent strain rate of 0.01 s� 1 and is representative for injection stretch blow moulding [38]. At this position on the master curve, the material is supposed to be in a certain state which is related to its “distance” from the α transition. By this way, no matter the couple of strain rate/temperature chosen for this equivalent strain rate, the mechanical response is supposed to be the same. Two couples of strain rate and temperature have been investigated to test the validity of this hypothesis and are represented on Fig. 6 (curves drawn in true stress vs. true strain). It can be seen on the graph that the two curves are well superimposed even though a difference of one decade is used for the strain rate. It validates the time (strain rate)/temperature super-position principle. According to this principle, the transposition of lab-oratory experiments, where only low velocities are reachable, to industrial experiments which deal with high velocity is easier.
Finally, a strain rate of 0.07 s� 1 at a temperature of 105 �C was chosen for the microstructural analysis.
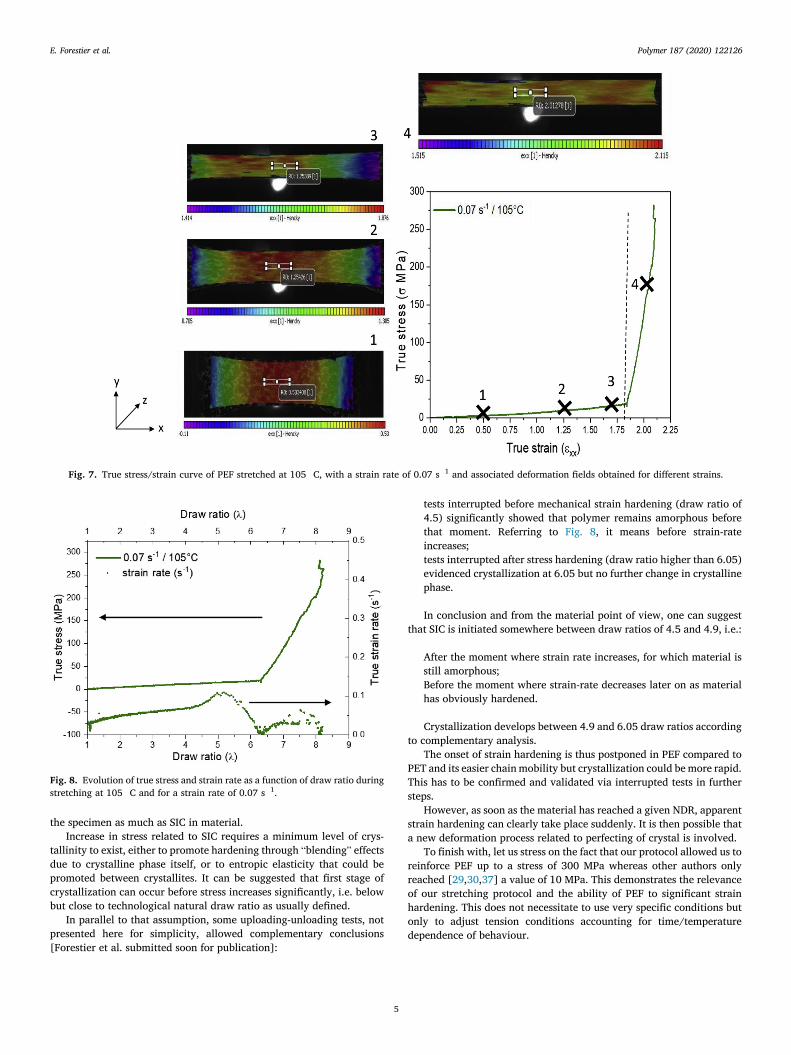
3.1.2. Mechanical results The true stress vs. strain curve of uniaxially stretched PEF is pre-
sented on Fig. 7 together with the associated strain fields, for different
strains. Fig. 8 shows the variation of stress and strain rate with draw ratio.
As it is depicted on the strain fields, the maximum of deformation is localized in the process zone during the entire test. Deformations involved are homogeneous and averaged in a rectangular zone in the centre of the specimen.
In this condition of strain rate and temperature, the material presents the expected hyper-elastic behaviour up to a natural draw ratio (NDR) of around 6 (the dashed line represents the strain hardening beginning). This result validates the way conditions were defined using DMTA master curve. The value of 6 is higher than classical NDR obtained for PET whose order of magnitude is 2–3 [4,5,35,39]. Above this NDR, PEF exhibits an impressive strain hardening which can be the witness of a strong chains microstructural organization thanks to the stretching process. In previously reported results on PEF [29–31,37], hardening was not so important. This difference can be attributed to the differences in stretching conditions, especially the fact that our protocol allowed to keep strain rate constant up to strain hardening instead of decreasing it and, the use of true stress and strain. These results confirm that PEF can strain harden to a large extent, which is associated to SIC (see following section). At that moment, central zone of the sample stop deforming as revealed by the evolution of local strain rate (Fig. 8).
The local evolution of strain-rate along tensile sample is not intrinsic to the material alone. It depends to a large extent on the geometry of the specimen and on the loading path. Thus, in the initial stages of our tensile tests on the amorphous material, the deformation is not perfectly uniform as in any such test. By this way, ἐ is almost constant during the beginning of the test (up to a draw ratio of almost 4). A localization area is formed. We measure mechanical characteristics in this zone on pur-pose. The rate of deformation increases naturally (from a draw ratio of 4) because of the decreasing of the section which induces an increase in stress, according classical scheme. However, when the material experi-ences SIC, this area will obviously be the first to crystallize. The asso-ciated structural hardening is opposed to the localization of the deformation. When the hardening is efficient enough, the deformation moves on both sides of the central zone in a zone of larger section but of weaker consistency. The local strain rate in the central zone decreases, sometimes to zero (stable necking).
Further on, the deformed zones apart from central zones will also harden and gradually the deformation reaches the shoulders of the specimen whose very large sections do not allow deformation. As the crosshead still moves up, the central zone deforms again and the measured local strain rates increases. This is related to increase in local strain rate above draw ratio of 6.3, which is controlled by the shape of
Fig. 5. PEF elastic and loss moduli master curves for a reference temperature of 100 �C.
Fig. 6. True stress/strain curves of uniaxially stretched PEF for two couples of strain rate/temperature.
E. Forestier et al.
Polymer 187 (2020) 122126
5
the specimen as much as SIC in material. Increase in stress related to SIC requires a minimum level of crys-
tallinity to exist, either to promote hardening through “blending” effects due to crystalline phase itself, or to entropic elasticity that could be promoted between crystallites. It can be suggested that first stage of crystallization can occur before stress increases significantly, i.e. below but close to technological natural draw ratio as usually defined.
In parallel to that assumption, some uploading-unloading tests, not presented here for simplicity, allowed complementary conclusions [Forestier et al. submitted soon for publication]:
� tests interrupted before mechanical strain hardening (draw ratio of 4.5) significantly showed that polymer remains amorphous before that moment. Referring to Fig. 8, it means before strain-rate increases; � tests interrupted after stress hardening (draw ratio higher than 6.05)
evidenced crystallization at 6.05 but no further change in crystalline phase.
In conclusion and from the material point of view, one can suggest that SIC is initiated somewhere between draw ratios of 4.5 and 4.9, i.e.:
� After the moment where strain rate increases, for which material is still amorphous; � Before the moment where strain-rate decreases later on as material
has obviously hardened.
Crystallization develops between 4.9 and 6.05 draw ratios according to complementary analysis.
The onset of strain hardening is thus postponed in PEF compared to PET and its easier chain mobility but crystallization could be more rapid. This has to be confirmed and validated via interrupted tests in further steps.
However, as soon as the material has reached a given NDR, apparent strain hardening can clearly take place suddenly. It is then possible that a new deformation process related to perfecting of crystal is involved.
To finish with, let us stress on the fact that our protocol allowed us to reinforce PEF up to a stress of 300 MPa whereas other authors only reached [29,30,37] a value of 10 MPa. This demonstrates the relevance of our stretching protocol and the ability of PEF to significant strain hardening. This does not necessitate to use very specific conditions but only to adjust tension conditions accounting for time/temperature dependence of behaviour.
Fig. 7. True stress/strain curve of PEF stretched at 105 �C, with a strain rate of 0.07 s� 1 and associated deformation fields obtained for different strains.
Fig. 8. Evolution of true stress and strain rate as a function of draw ratio during stretching at 105 �C and for a strain rate of 0.07 s� 1.
E. Forestier et al.
Polymer 187 (2020) 122126
6
3.2. Microstructural analysis
3.2.1. Strain-induced microstructure The microstructure induced by stretching has been analyzed thanks
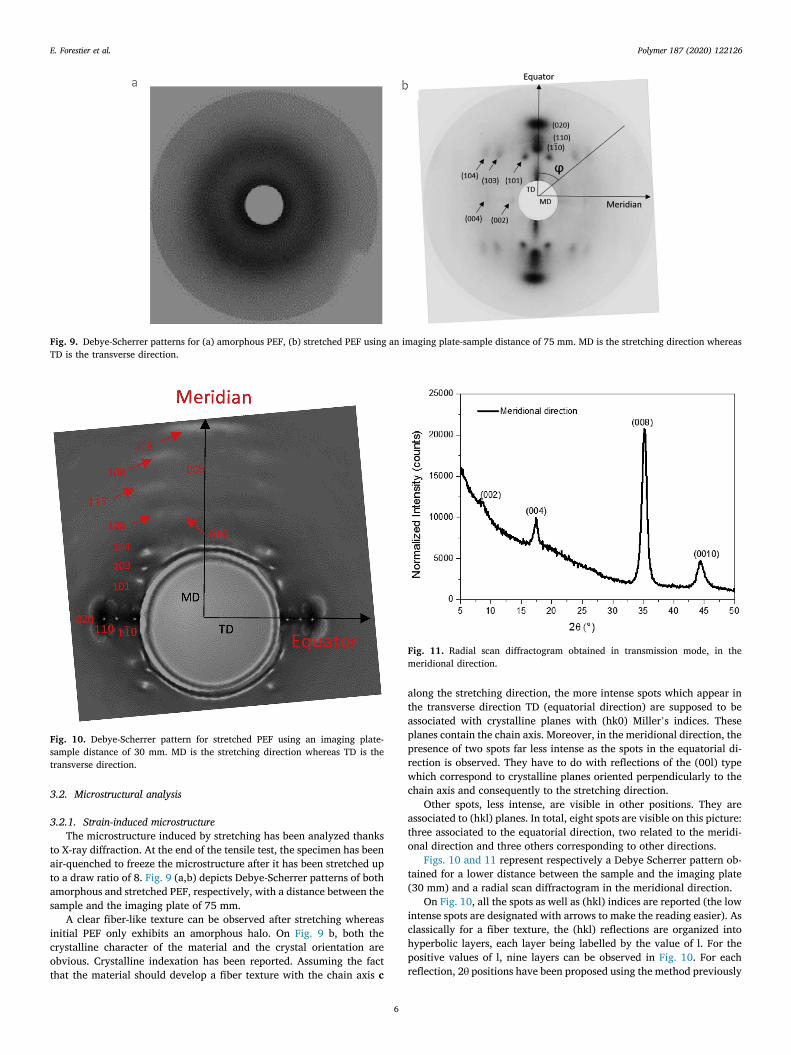
to X-ray diffraction. At the end of the tensile test, the specimen has been air-quenched to freeze the microstructure after it has been stretched up to a draw ratio of 8. Fig. 9 (a,b) depicts Debye-Scherrer patterns of both amorphous and stretched PEF, respectively, with a distance between the sample and the imaging plate of 75 mm.
A clear fiber-like texture can be observed after stretching whereas initial PEF only exhibits an amorphous halo. On Fig. 9 b, both the crystalline character of the material and the crystal orientation are obvious. Crystalline indexation has been reported. Assuming the fact that the material should develop a fiber texture with the chain axis c
along the stretching direction, the more intense spots which appear in the transverse direction TD (equatorial direction) are supposed to be associated with crystalline planes with (hk0) Miller’s indices. These planes contain the chain axis. Moreover, in the meridional direction, the presence of two spots far less intense as the spots in the equatorial di-rection is observed. They have to do with reflections of the (00l) type which correspond to crystalline planes oriented perpendicularly to the chain axis and consequently to the stretching direction.
Other spots, less intense, are visible in other positions. They are associated to (hkl) planes. In total, eight spots are visible on this picture: three associated to the equatorial direction, two related to the meridi-onal direction and three others corresponding to other directions.
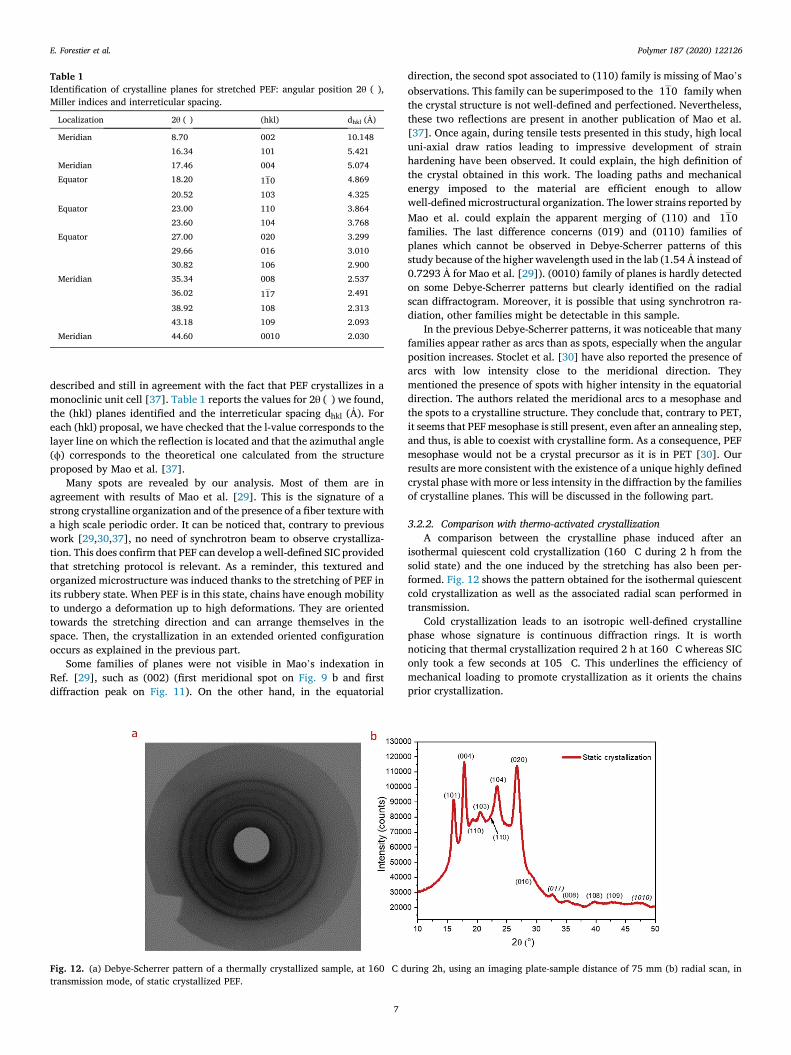
Figs. 10 and 11 represent respectively a Debye Scherrer pattern ob-tained for a lower distance between the sample and the imaging plate (30 mm) and a radial scan diffractogram in the meridional direction.
On Fig. 10, all the spots as well as (hkl) indices are reported (the low intense spots are designated with arrows to make the reading easier). As classically for a fiber texture, the (hkl) reflections are organized into hyperbolic layers, each layer being labelled by the value of l. For the positive values of l, nine layers can be observed in Fig. 10. For each reflection, 2θ positions have been proposed using the method previously
Fig. 9. Debye-Scherrer patterns for (a) amorphous PEF, (b) stretched PEF using an imaging plate-sample distance of 75 mm. MD is the stretching direction whereas TD is the transverse direction.
Fig. 10. Debye-Scherrer pattern for stretched PEF using an imaging plate- sample distance of 30 mm. MD is the stretching direction whereas TD is the transverse direction.
Fig. 11. Radial scan diffractogram obtained in transmission mode, in the meridional direction.
E. Forestier et al.
Polymer 187 (2020) 122126
7
described and still in agreement with the fact that PEF crystallizes in a monoclinic unit cell [37]. Table 1 reports the values for 2θ (�) we found, the (hkl) planes identified and the interreticular spacing dhkl (Ȧ). For each (hkl) proposal, we have checked that the l-value corresponds to the layer line on which the reflection is located and that the azimuthal angle (ϕ) corresponds to the theoretical one calculated from the structure proposed by Mao et al. [37].
Many spots are revealed by our analysis. Most of them are in agreement with results of Mao et al. [29]. This is the signature of a strong crystalline organization and of the presence of a fiber texture with a high scale periodic order. It can be noticed that, contrary to previous work [29,30,37], no need of synchrotron beam to observe crystalliza-tion. This does confirm that PEF can develop a well-defined SIC provided that stretching protocol is relevant. As a reminder, this textured and organized microstructure was induced thanks to the stretching of PEF in its rubbery state. When PEF is in this state, chains have enough mobility to undergo a deformation up to high deformations. They are oriented towards the stretching direction and can arrange themselves in the space. Then, the crystallization in an extended oriented configuration occurs as explained in the previous part.
Some families of planes were not visible in Mao’s indexation in Ref. [29], such as (002) (first meridional spot on Fig. 9 b and first diffraction peak on Fig. 11). On the other hand, in the equatorial
direction, the second spot associated to (110) family is missing of Mao’s observations. This family can be superimposed to the ð110Þ family when the crystal structure is not well-defined and perfectioned. Nevertheless, these two reflections are present in another publication of Mao et al. [37]. Once again, during tensile tests presented in this study, high local uni-axial draw ratios leading to impressive development of strain hardening have been observed. It could explain, the high definition of the crystal obtained in this work. The loading paths and mechanical energy imposed to the material are efficient enough to allow well-defined microstructural organization. The lower strains reported by Mao et al. could explain the apparent merging of (110) and ð110Þfamilies. The last difference concerns (019) and (0110) families of planes which cannot be observed in Debye-Scherrer patterns of this study because of the higher wavelength used in the lab (1.54 Ȧ instead of 0.7293 Ȧ for Mao et al. [29]). (0010) family of planes is hardly detected on some Debye-Scherrer patterns but clearly identified on the radial scan diffractogram. Moreover, it is possible that using synchrotron ra-diation, other families might be detectable in this sample.
In the previous Debye-Scherrer patterns, it was noticeable that many families appear rather as arcs than as spots, especially when the angular position increases. Stoclet et al. [30] have also reported the presence of arcs with low intensity close to the meridional direction. They mentioned the presence of spots with higher intensity in the equatorial direction. The authors related the meridional arcs to a mesophase and the spots to a crystalline structure. They conclude that, contrary to PET, it seems that PEF mesophase is still present, even after an annealing step, and thus, is able to coexist with crystalline form. As a consequence, PEF mesophase would not be a crystal precursor as it is in PET [30]. Our results are more consistent with the existence of a unique highly defined crystal phase with more or less intensity in the diffraction by the families of crystalline planes. This will be discussed in the following part.
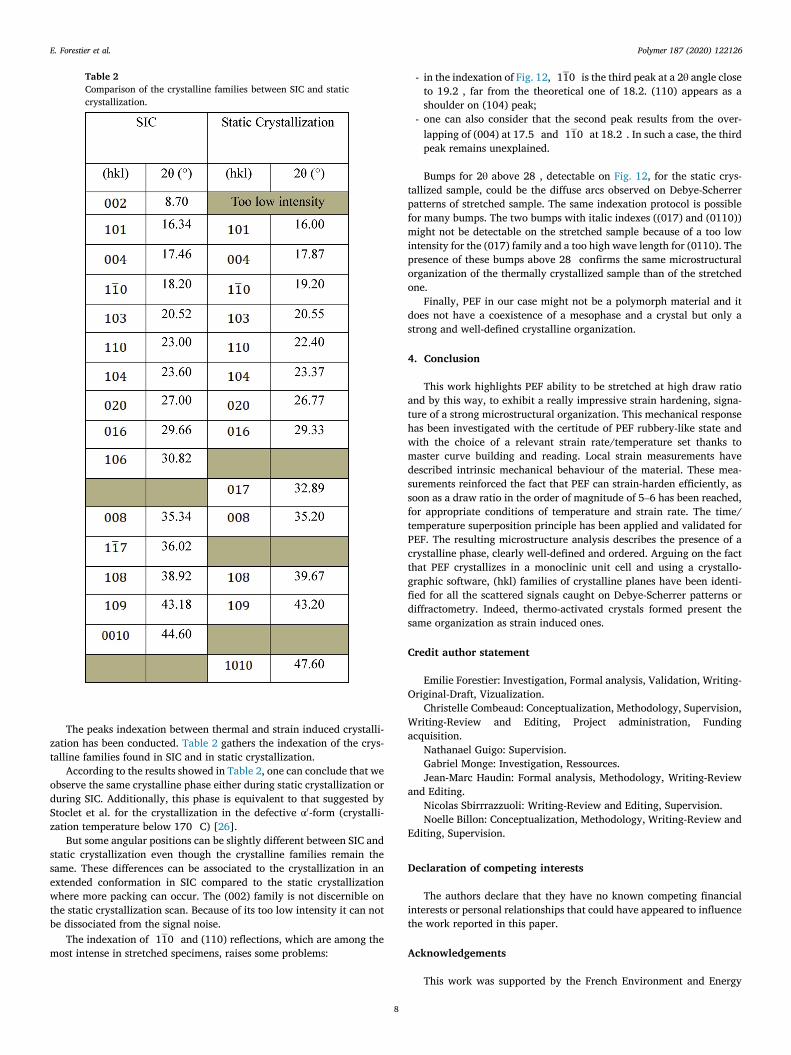
3.2.2. Comparison with thermo-activated crystallization A comparison between the crystalline phase induced after an
isothermal quiescent cold crystallization (160 �C during 2 h from the solid state) and the one induced by the stretching has also been per-formed. Fig. 12 shows the pattern obtained for the isothermal quiescent cold crystallization as well as the associated radial scan performed in transmission.
Cold crystallization leads to an isotropic well-defined crystalline phase whose signature is continuous diffraction rings. It is worth noticing that thermal crystallization required 2 h at 160 �C whereas SIC only took a few seconds at 105 �C. This underlines the efficiency of mechanical loading to promote crystallization as it orients the chains prior crystallization.
Table 1 Identification of crystalline planes for stretched PEF: angular position 2θ (�), Miller indices and interreticular spacing.
Localization 2θ (�) (hkl) dhkl (Ȧ)
Meridian 8.70 002 10.148 16.34 101 5.421
Meridian 17.46 004 5.074 Equator 18.20 110 4.869
20.52 103 4.325 Equator 23.00 110 3.864
23.60 104 3.768 Equator 27.00 020 3.299
29.66 016 3.010 30.82 106 2.900
Meridian 35.34 008 2.537 36.02 117 2.491
38.92 108 2.313 43.18 109 2.093
Meridian 44.60 0010 2.030
Fig. 12. (a) Debye-Scherrer pattern of a thermally crystallized sample, at 160 �C during 2h, using an imaging plate-sample distance of 75 mm (b) radial scan, in transmission mode, of static crystallized PEF.
E. Forestier et al.
Polymer 187 (2020) 122126
8
The peaks indexation between thermal and strain induced crystalli-zation has been conducted. Table 2 gathers the indexation of the crys-talline families found in SIC and in static crystallization.
According to the results showed in Table 2, one can conclude that we observe the same crystalline phase either during static crystallization or during SIC. Additionally, this phase is equivalent to that suggested by Stoclet et al. for the crystallization in the defective α0-form (crystalli-zation temperature below 170 �C) [26].
But some angular positions can be slightly different between SIC and static crystallization even though the crystalline families remain the same. These differences can be associated to the crystallization in an extended conformation in SIC compared to the static crystallization where more packing can occur. The (002) family is not discernible on the static crystallization scan. Because of its too low intensity it can not be dissociated from the signal noise.
The indexation of ð110Þ and (110) reflections, which are among the most intense in stretched specimens, raises some problems:
- in the indexation of Fig. 12, ð110Þ is the third peak at a 2θ angle close to 19.2�, far from the theoretical one of 18.2. (110) appears as a shoulder on (104) peak;
- one can also consider that the second peak results from the over-lapping of (004) at 17.5� and ð110Þ at 18.2�. In such a case, the third peak remains unexplained.
Bumps for 2θ above 28�, detectable on Fig. 12, for the static crys-tallized sample, could be the diffuse arcs observed on Debye-Scherrer patterns of stretched sample. The same indexation protocol is possible for many bumps. The two bumps with italic indexes ((017) and (0110)) might not be detectable on the stretched sample because of a too low intensity for the (017) family and a too high wave length for (0110). The presence of these bumps above 28� confirms the same microstructural organization of the thermally crystallized sample than of the stretched one.
Finally, PEF in our case might not be a polymorph material and it does not have a coexistence of a mesophase and a crystal but only a strong and well-defined crystalline organization.
4. Conclusion
This work highlights PEF ability to be stretched at high draw ratio and by this way, to exhibit a really impressive strain hardening, signa-ture of a strong microstructural organization. This mechanical response has been investigated with the certitude of PEF rubbery-like state and with the choice of a relevant strain rate/temperature set thanks to master curve building and reading. Local strain measurements have described intrinsic mechanical behaviour of the material. These mea-surements reinforced the fact that PEF can strain-harden efficiently, as soon as a draw ratio in the order of magnitude of 5–6 has been reached, for appropriate conditions of temperature and strain rate. The time/ temperature superposition principle has been applied and validated for PEF. The resulting microstructure analysis describes the presence of a crystalline phase, clearly well-defined and ordered. Arguing on the fact that PEF crystallizes in a monoclinic unit cell and using a crystallo-graphic software, (hkl) families of crystalline planes have been identi-fied for all the scattered signals caught on Debye-Scherrer patterns or diffractometry. Indeed, thermo-activated crystals formed present the same organization as strain induced ones.
Credit author statement
Emilie Forestier: Investigation, Formal analysis, Validation, Writing- Original-Draft, Vizualization.
Christelle Combeaud: Conceptualization, Methodology, Supervision, Writing-Review and Editing, Project administration, Funding acquisition.
Nathana€el Guigo: Supervision. Gabriel Monge: Investigation, Ressources. Jean-Marc Haudin: Formal analysis, Methodology, Writing-Review
and Editing. Nicolas Sbirrrazzuoli: Writing-Review and Editing, Supervision. No€elle Billon: Conceptualization, Methodology, Writing-Review and
Editing, Supervision.
Declaration of competing interests
The authors declare that they have no known competing financial interests or personal relationships that could have appeared to influence the work reported in this paper.
Acknowledgements
This work was supported by the French Environment and Energy
Table 2 Comparison of the crystalline families between SIC and static crystallization.
E. Forestier et al.
Polymer 187 (2020) 122126
9
Management Agency (ADEME) and Sidel as well as Avantium Renew-able Polymers. Authors also would like to thank Christophe Pradille from Mat Xper and Guillaume Corvec from CEMEF for their help in mechanical (Digital Image Correlation) and thermal measurements.
References
[1] J.R. Katz, Was sind die Ursachen der eigentümlichen Dehnbarkeit des Kautschuks? - ueber die Aenderung des R€ontgenspektrums des Kautschuks bei der Dehnung, Kolloid Z. 36 (1925) 300–307, https://doi.org/10.1007/BF01424884.
[2] C.W. Bunn, Molecular structure and rubber-like elasticity. I. The crystal structures of β-gutta-percha, rubber and polychloroprene, Rubber Chem. Technol. 15 (1942) 709–730, https://doi.org/10.5254/1.3543158.
[3] G. Rajkumar, J.M. Squire, S. Arnott, A new structure for crystalline natural rubber, Macromolecules 39 (2006) 7004–7014, https://doi.org/10.1021/ma0600310.
[4] G. LeBourvellec, L. Monnerie, J.P. Jarry, Amorphous orientation and induced crystallization in uniaxially stretched poly(ethylene terephthalate glycol), Polymer (Guildf). 27 (1986) 856–860, https://doi.org/10.1016/0032-3861(86)90294-6.
[5] G. Le Bourvellec, J. Beautemps, Stretching of PET films under constant load. II. Structural analysis, J. Appl. Polym. Sci. 39 (1990) 329–339, https://doi.org/ 10.1002/app.1990.070390210.
[6] D.J. Blundell, D.H. MacKerron, W. Fuller, A. Mahendrasingam, C. Martin, R. J. Oldman, R.J. Rule, C. Riekel, Characterization of strain-induced crystallization of poly(ethylene terephthalate) at fast draw rates using synchrotron radiation, Polymer (Guildf) 37 (1996) 3303–3311, https://doi.org/10.1016/0032-3861(96) 88476-X.
[7] A.C. Middleton, R.A. Duckett, I.M. Ward, A. Mahendrasingam, C. Martin, Real-time FTIR and WAXS studies of drawing behavior of poly(ethylene terephthalate) films, J. Appl. Polym. Sci. 79 (2001) 1825–1837, https://doi.org/10.1002/1097-4628 (20010307)79:10<1825::AID-APP110>3.0.CO;2-S.
[8] E. Gorlier, J.M. Haudin, N. Billon, Strain-induced crystallisation in bulk amorphous PET under uni-axial loading, Polymer (Guildf) 42 (2001) 9541–9549, https://doi. org/10.1016/S0032-3861(01)00497-9.
[9] D. Kawakami, B.S. Hsiao, S. Ran, C. Burger, B. Fu, I. Sics, B. Chu, T. Kikutani, Structural formation of amorphous poly(ethylene terephthalate) during uniaxial deformation above glass temperature, Polymer (Guildf) 45 (2004) 905–918, https://doi.org/10.1016/j.polymer.2003.11.027.
[10] D. Kawakami, B.S. Hsiao, C. Burger, S. Ran, C. Avila-Orta, I. Sics, T. Kikutani, K. I. Jacob, B. Chu, Deformation-induced phase transition and superstructure formation in poly(ethylene terephthalate), Macromolecules 38 (2005) 91–103, https://doi.org/10.1021/ma049333x.
[11] D. Kawakami, S. Ran, C. Burger, C. Avila-Orta, I. Sics, B. Chu, B.S. Hsiao, T. Kikutani, Superstructure evolution in poly(ethylene terephthalate) during uniaxial deformation above glass transition temperature, Macromolecules 39 (2006) 2909–2920, https://doi.org/10.1021/ma052589y.
[12] D. Kawakami, S. Ran, C. Burger, B. Fu, I. Sics, B. Chu, B.S. Hsiao, Mechanism of structural formation by uniaxial deformation in amorphous poly(ethylene terephthalate) above the glass temperature, Macromolecules 36 (2003) 9275–9280, https://doi.org/10.1021/ma034791b.
[13] D. Kawakami, C. Burger, S. Ran, C. Avila-Orta, I. Sics, B. Chu, S.M. Chiao, B. S. Hsiao, T. Kikutani, New insights into lamellar structure development and SAXSA/WAXD sequence appearance during uniaxial stretching of amorphous polyethylene terephthalate above glass transition temperature, Macromolecules 41 (2008) 2859–2867, https://doi.org/10.1021/ma702554t.
[14] D.R. Salem, Development of crystalline order during hot-drawing of poly(ethylene terephthalate) film: influence of strain rate, Polymer (Guildf) 33 (1992) 3182–3188, https://doi.org/10.1016/0032-3861(92)90232-L.
[15] A. Ajji, K.C. Cole, M.M. Dumoulin, J. Brisson, Amorphous orientation of poly (ethylene terephthalate) by X-ray diffraction in combination with Fourier transform infra-red spectroscopy, Polymer (Guildf). 36 (1995) 4023–4030, https:// doi.org/10.1016/0032-3861(95)90981-7.
[16] A. Mahendrasingam, C. Martin, A. Jaber, D. Hughes, W. Fuller, R. Rule, R. J. Oldman, D. MacKerron, D.J. Blundell, Time-resolved X-ray wide angle scattering studies of the effect of draw rate and temperature on the development of orientation and crystallinity in PET, Nucl. Instrum. Methods Phys. Res. B. 97 (1995) 238–241, https://doi.org/10.1016/0168-583X(94)00377-7.
[17] A. Ajji, J. Gu�evremont, K.C. Cole, M.M. Dumoulin, Orientation and structure of drawn poly(ethylene terephthalate), Polymer (Guildf). 37 (1996) 3707–3714, https://doi.org/10.1016/0032-3861(96)00175-9.
[18] R.D.B. Daubeny, The crystal structure of polyethylene terephthalate, Proc. R. Soc. Lond. Ser A Math. Phys. Sci. 226 (1954) 531–542, https://doi.org/10.1098/ rspa.1954.0273.
[19] S.K. Burgess, J.E. Leisen, B.E. Kraftschik, C.R. Mubarak, R.M. Kriegel, W.J. Koros, Chain mobility, thermal, and mechanical properties of poly(ethylene furanoate) compared to poly(ethylene terephthalate), Macromolecules 47 (2014) 1383–1391, https://doi.org/10.1021/ma5000199.
[20] S.K. Burgess, R.M. Kriegel, W.J. Koros, Carbon dioxide sorption and transport in amorphous poly(ethylene furanoate), Macromolecules 48 (2015) 2184–2193, https://doi.org/10.1021/acs.macromol.5b00333.
[21] S.K. Burgess, O. Karvan, J.R. Johnson, R.M. Kriegel, W.J. Koros, Oxygen sorption and transport in amorphous poly(ethylene furanoate), Polymer (Guildf). 55 (2014) 4748–4756, https://doi.org/10.1016/J.POLYMER.2014.07.041.
[22] S.K. Burgess, D.S. Mikkilineni, D.B. Yu, D.J. Kim, C.R. Mubarak, R.M. Kriegel, W. J. Koros, Water sorption in poly(ethylene furanoate) compared to poly(ethylene terephthalate). Part 2: kinetic sorption, Polymer (Guildf) 55 (2014) 6870–6882, https://doi.org/10.1016/J.POLYMER.2014.10.065.
[23] G.Z. Papageorgiou, V. Tsanaktsis, D.N. Bikiaris, Synthesis of poly(ethylene furandicarboxylate) polyester using monomers derived from renewable resources: thermal behavior comparison with PET and PEN, Phys. Chem. Chem. Phys. 16 (2014) 7946–7958, https://doi.org/10.1039/C4CP00518J.
[24] R.J.I. Knoop, W. Vogelzang, J. van Haveren, D.S. van Es, High molecular weight poly(ethylene-2,5-furanoate); critical aspects in synthesis and mechanical property determination, J. Polym. Sci. Part A Polym. Chem. 51 (2013) 4191–4199, https:// doi.org/10.1002/pola.26833.
[25] J.G. van Berkel, N. Guigo, J.J. Kolstad, L. Sipos, B. Wang, M.A. Dam, N. Sbirrazzuoli, Isothermal crystallization kinetics of poly (ethylene 2,5- furandicarboxylate), Macromol. Mater. Eng. 300 (2015) 466–474, https://doi.org/ 10.1002/mame.201400376.
[26] G. Stoclet, G. Gobius du Sart, B. Yeniad, S. de Vos, J.M. Lefebvre, Isothermal crystallization and structural characterization of poly(ethylene-2,5-furanoate), Polymer (Guildf) 72 (2015) 165–176, https://doi.org/10.1016/j. polymer.2015.07.014.
[27] A. Codou, N. Guigo, J. van Berkel, E. de Jong, N. Sbirrazzuoli, Non-isothermal crystallization kinetics of biobased poly(ethylene 2,5-furandicarboxylate) synthesized via the direct esterification process, Macromol. Chem. Phys. 215 (2014) 2065–2074, https://doi.org/10.1002/macp.201400316.
[28] A. Codou, M. Moncel, J.G. van Berkel, N. Guigo, N. Sbirrazzuoli, Glass transition dynamics and cooperativity length of poly(ethylene 2,5-furandicarboxylate) compared to poly(ethylene terephthalate), Phys. Chem. Chem. Phys. 18 (2016) 16647–16658, https://doi.org/10.1039/C6CP01227B.
[29] Y. Mao, D.G. Bucknall, R.M. Kriegel, Synchrotron X-ray scattering study on amorphous poly(ethylene furanoate) under uniaxial deformation, Polymer (Guildf) 139 (2018) 60–67, https://doi.org/10.1016/j.polymer.2018.01.062.
[30] G. Stoclet, J.M. Lefebvre, B. Yeniad, G. Gobius du Sart, S. de Vos, On the strain- induced structural evolution of Poly(ethylene-2,5-furanoate) upon uniaxial stretching: an in-situ SAXS-WAXS study, Polymer (Guildf) 134 (2018) 227–241, https://doi.org/10.1016/j.polymer.2017.11.071.
[31] C. Menager, N. Guigo, L. Martino, N. Sbirrazzuoli, H. Visser, S.A.E. Boyer, N. Billon, G. Monge, C. Combeaud, Strain induced crystallization in biobased Poly (ethylene 2,5-furandicarboxylate) (PEF); conditions for appearance and microstructure analysis, Polymer (Guildf) 158 (2018) 364–371, https://doi.org/ 10.1016/J.POLYMER.2018.10.054.
[32] J.G. van Berkel, N. Guigo, J.J. Kolstad, N. Sbirrazzuoli, Biaxial orientation of poly (ethylene 2,5-furandicarboxylate): an explorative study, Macromol. Mater. Eng. 303 (2018) 1700507, https://doi.org/10.1002/mame.201700507.
[33] C.E. Federico, J.L. Bouvard, C. Combeaud, N. Billon, Large strain/time dependent mechanical behaviour of PMMAs of different chain architectures. Application of time-temperature superposition principle, Polymer (Guildf) (2018), https://doi. org/10.1016/j.polymer.2018.02.021.
[34] V. Fabre, G. Quandalle, N. Billon, S. Cantournet, Time-Temperature-Water content equivalence on dynamic mechanical response of polyamide 6,6, Polymer (Guildf) (2018), https://doi.org/10.1016/j.polymer.2017.10.067.
[35] G. Quandalle, Study and Mechanical Modeling of the Strain-Induced- Crystallization of Polymers : Crosslinked Naturel Rubber and PET, PSL Research University, 2017. https://pastel.archives-ouvertes.fr/tel-01774634.
[36] L.G. Kazaryan, F.M. Medvedeva, X-Ray study of the structure of the polyester of furan-2, 5-dicarboxylic acid, Vysokomol. Soedin. Seriya B 10 (1968).
[37] Y. Mao, R.M. Kriegel, D.G. Bucknall, The crystal structure of poly(ethylene furanoate), Polymer (Guildf) 102 (2016) 308–314, https://doi.org/10.1016/j. polymer.2016.08.052.
[38] E. Gorlier, J.F. Agassant, J.M. Haudin, N. Billon, Experimental and theoretical study of uniaxial deformation of amorphous poly(ethylene terephthalate) above glass transition temperature, Plast. Rubber Compos. 30 (2001) 48–55, https://doi. org/10.1179/146580101101541435.
[39] N. Billon, M. Picard, E. Gorlier, Stretch blow moulding of PET; structure development and constitutive model, Int. J. Material Form. 7 (2014) 369–378, https://doi.org/10.1007/s12289-013-1131-1.
E. Forestier et al.